Exhibit 99.2
|
|
|
T A B L E O F C O N T E N T S |
|
| |
Introduction | |
| |
Shareholder Letter | |
| |
Quarterly Overview | |
| |
Ñ Third Quarter 2015 Highlights | |
| |
Ñ GAAP Earnings | |
| |
Ñ GAAP Book Value | |
| |
Ñ Analysis of GAAP Results by Business Segment | |
| |
Ñ Capital and Liquidity | |
| |
Financial Insights | |
| |
Ñ Balance Sheet | |
| |
Ñ Residential Loans | |
| |
Ñ Real Estate Securities | |
| |
Ñ Commercial Loans | |
| |
Ñ MSRs | |
| |
Ñ Corporate Long-term Debt | |
| |
Appendix | |
| |
Ñ Redwood’s Business Overview | |
| |
Ñ Dividend Policy | |
| |
Ñ Glossary | |
| |
Ñ Financial Tables | |
|
|
|
THE REDWOOD REVIEW I 3RD QUARTER 2015 |
1 |
|
|
|
C A U T I O N A R Y S T A T E M E N T |
This Redwood Review contains forward-looking statements within the meaning of the safe harbor provisions of the Private Securities Litigation Reform Act of 1995. Forward-looking statements involve numerous risks and uncertainties. Our actual results may differ from our expectations, estimates, and projections and, consequently, you should not rely on these forward-looking statements as predictions of future events. Forward-looking statements are not historical in nature and can be identified by words such as “anticipate,” “estimate,” “will,” “should,” “expect,” “believe,” “intend,” “seek,” “plan,” and similar expressions or their negative forms, or by references to strategy, plans, goals, or intentions. These forward-looking statements are subject to risks and uncertainties, including, among other things, those described in our most recent Annual Report on Form 10-K under the caption “Risk Factors.” Other risks, uncertainties, and factors that could cause actual results to differ materially from those projected are described below and may be described from time to time in reports we file with the Securities and Exchange Commission, including reports on Forms 10-K, 10-Q, and 8-K. We undertake no obligation to update or revise forward-looking statements, whether as a result of new information, future events, or otherwise.
Statements regarding the following subjects, among others, are forward-looking by their nature: (i) statements we make regarding Redwood’s business strategy and strategic focus, including statements relating to our confidence in our overall market position, strategy and long-term prospects, and our belief in the long-term efficiency of private label securitization as a form of mortgage financing; (ii) statements related to our residential mortgage banking activities, including statements regarding our residential loan acquisition volume expectations projected for 2015 and our long-term target margin range of 25 to 50 basis points; (iii) statements we make regarding our participation in risk-sharing arrangements with the GSEs, the creation of credit investments for our portfolio through such arrangements, and our belief that long-term GSE reform will favor an influx of private capital from counterparties such as Redwood; (iv) statements we make regarding the outlook for our commercial business, including statements regarding our commercial loan origination volume and margin expectations for the fourth quarter of 2015 and for the 2015 fiscal year, and industry-wide commercial loan origination volume expectations over the next two years; (v) statements regarding initiatives in our residential and commercial mortgage banking operations, including statements regarding achieving operational efficiencies and improving net conforming margins for 2016, the expansion of our jumbo whole loan distribution capabilities for 2016, improving commercial loan sale executions through dynamic pricing strategies; (vi) statements we make regarding our stock repurchase authorization and our approach in considering additional stock repurchases during the fourth quarter of 2015 and in 2016; (vii) statements relating to acquiring residential mortgage loans in the future that we have identified for purchase or plan to purchase, including the amount of such loans that we identified for purchase during the third quarter of 2015 and at September 30, 2015, and statements relating to expected fallout and the corresponding volume of residential mortgage loans expected to be available for purchase; (viii) statements relating to our estimate of our available capital (including that we estimate our available capital at September 30, 2015 to be approximately $86 million); (ix) statements we make regarding our dividend policy, including our intention to pay a regular dividend of $0.28 per share per quarter in 2015; and (x) statements regarding our expectations and estimates relating to the characterization for income tax purposes of our dividend distributions,
|
|
|
THE REDWOOD REVIEW I 3RD QUARTER 2015 |
2 |
|
|
|
C A U T I O N A R Y S T A T E M E N T |
our expectations and estimates relating to tax accounting, tax liabilities and tax savings, and GAAP tax provisions, our estimates of REIT taxable income and TRS taxable income, and our anticipation of additional credit losses for tax purposes in future periods (and, in particular, our statement that, for tax purposes, we expect an additional $27 million of tax credit losses on residential securities we currently own to be realized over an estimated three- to five-year period).
Important factors, among others, that may affect our actual results include: general economic trends, the performance of the housing, commercial real estate, mortgage, credit, and broader financial markets, and their effects on the prices of earning assets and the credit status of borrowers; federal and state legislative and regulatory developments, and the actions of governmental authorities, including those affecting the mortgage industry or our business (including, but not limited to, the Federal Housing Finance Agency’s notice of proposed rulemaking relating to FHLB membership requirements and the potential implications for our captive insurance subsidiary’s membership in the FHLB); developments related to the fixed income and mortgage finance markets and the Federal Reserve’s statements regarding its future open market activity and monetary policy; our exposure to credit risk and the timing of credit losses within our portfolio; the concentration of the credit risks we are exposed to, including due to the structure of assets we hold and the geographical concentration of real estate underlying assets we own; our exposure to adjustable-rate mortgage loans; the efficacy and expense of our efforts to manage or hedge credit risk, interest rate risk, and other financial and operational risks; changes in credit ratings on assets we own and changes in the rating agencies’ credit rating methodologies; changes in interest rates; changes in mortgage prepayment rates; the availability of assets for purchase at attractive prices and our ability to reinvest cash we hold; changes in the values of assets we own; changes in liquidity in the market for real estate securities and loans; our ability to finance the acquisition of real estate-related assets with short-term debt; the ability of counterparties to satisfy their obligations to us; our involvement in securitization transactions, the profitability of those transactions, and the risks we are exposed to in engaging in securitization transactions; exposure to claims and litigation, including litigation arising from our involvement in securitization transactions; whether we have sufficient liquid assets to meet short-term needs; our ability to successfully compete and retain or attract key personnel; our ability to adapt our business model and strategies to changing circumstances; changes in our investment, financing, and hedging strategies and new risks we may be exposed to if we expand our business activities; our exposure to a disruption or breach of the security of our technology infrastructure and systems; exposure to environmental liabilities; our failure to comply with applicable laws and regulations; our failure to maintain appropriate internal controls over financial reporting and disclosure controls and procedures; the impact on our reputation that could result from our actions or omissions or from those of others; changes in accounting principles and tax rules; our ability to maintain our status as a REIT for tax purposes; limitations imposed on our business due to our REIT status and our status as exempt from registration under the Investment Company Act of 1940; decisions about raising, managing, and distributing capital; and other factors not presently identified.
This Redwood Review may contain statistics and other data that in some cases have been obtained from or compiled from information made available by servicers and other third-party service providers.
|
|
|
THE REDWOOD REVIEW I 3RD QUARTER 2015 |
3 |
Note to Readers:
We file annual reports (on Form 10-K) and quarterly reports (on Form 10-Q) with the Securities and Exchange Commission. These filings and our earnings press releases provide information about Redwood and our financial results in accordance with generally accepted accounting principles (GAAP). We urge you to review these documents, which are available through our website, www.redwoodtrust.com.
This document, called The Redwood Review, is an additional format for providing information about Redwood through a discussion of our GAAP financial results, as well as other metrics, such as taxable income. Supplemental information is also provided in the Financial Tables in this Review to facilitate more detailed understanding and analysis of Redwood. We may also provide non-GAAP financial measures in this Review. When we use non-GAAP financial measures it is because we believe that these figures provide additional insight into Redwood’s business. In each case in which we discuss a non-GAAP financial measure you will find an explanation of how it has been calculated, why we think the figure is important, and a reconciliation between the GAAP and non-GAAP figures.
References herein to “Redwood,” the “company,” “we,” “us,” and “our” include Redwood Trust, Inc. and its consolidated subsidiaries. Note that because we round numbers in the tables to millions, except per share amounts, some numbers may not foot due to rounding. References to the “third quarter” refer to the quarter ended September 30, 2015, and references to the “second quarter” refer to the quarter ended June 30, 2015, unless otherwise specified.
We hope you find this Review helpful to your understanding of our business. We thank you for your input and suggestions, which have resulted in our changing the form and content of The Redwood Review over time.
|
| | | | | | | | | | | |
| | Selected Financial Highlights |
| |
| | Quarter:Year | | GAAP Income per Share | | REIT Taxable Income per Share (1) | | Annualized GAAP Return on Equity | | GAAP Book Value per Share | | Dividends per Share |
| | Q315 | | $0.22 | | $0.29 | | 6% | | $14.69 | | $0.28 |
| | Q215 | | $0.31 | | $0.21 | | 9% | | $14.96 | | $0.28 |
| | Q115 | | $0.16 | | $0.18 | | 5% | | $15.01 | | $0.28 |
| | Q414 | | $0.31 | | $0.20 | | 9% | | $15.05 | | $0.28 |
| | Q314 | | $0.50 | | $0.21 | | 14% | | $15.21 | | $0.28 |
| | Q214 | | $0.18 | | $0.17 | | 5% | | $15.03 | | $0.28 |
| | Q114 | | $0.14 | | $0.19 | | 4% | | $15.14 | | $0.28 |
| | Q413 | | $0.29 | | $0.20 | | 8% | | $15.10 | | $0.28 |
| | Q313 | | $0.25 | | $0.24 | | 7% | | $14.65 | | $0.28 |
(1) REIT taxable income per share for 2015 are estimates until we file tax returns.
|
|
|
THE REDWOOD REVIEW I 3RD QUARTER 2015 |
4 |
|
|
|
S H A R E H O L D E R L E T T E R |
Dear Fellow Shareholders:
Over the past several quarters, fixed income investors have become increasingly cautious and pessimistic in the face of many blockbuster macro concerns, ranging from interest rate uncertainty to anxiety over slowing global economic growth. The third quarter of 2015 saw no reprieve from these challenging conditions, and our residential and commercial businesses once again grappled with high interest rate volatility and widening credit spreads. We also continue to face intense price competition for conforming loans in our residential mortgage banking business, as well as for conduit loans in our commercial mortgage banking business.
In this letter, we will first comment at a high level on our recent quarterly financial results and operating highlights. We will then go through the recurring challenges facing our residential and commercial businesses and how those challenges impact our strategic and tactical plans. Lastly, we will discuss our share repurchase activity and offer some closing thoughts as fellow shareholders.
Quarterly Results and Operating Highlights
We earned $0.22 per share for the third quarter of 2015 compared to $0.31 per share in the second quarter of 2015. All things considered, we would categorize our quarterly performance as “mixed.” As always, we analyze our earnings and other important financial metrics in the Quarterly Overview section of this Redwood Review.
On the positive side, our quarterly earnings and cash flow from our investment portfolio remained strong. The underlying credit performance of our investments, especially those created through our residential and commercial loan conduits, remains stellar. Additionally, our FHLB-member subsidiary has allowed us to make significant progress in replacing lower yielding portfolio assets with higher yielding, longer duration jumbo loans sourced through our conduit and funded with FHLB advances. The strength and consistency of our investment portfolio performance has enabled us to maintain a stable dividend during times when our mortgage banking conduits have encountered periods of market dislocation.
Our residential and commercial platforms continue to serve as an important and direct source of new portfolio investments for us despite a difficult operating environment. Of the $121 million of capital we deployed into new investments during the third quarter of 2015, over half was into investments created through our residential and commercial conduits. Year to date, we have deployed $346 million of capital, over three quarters of which has been into investments we have created through these conduits.
|
|
|
THE REDWOOD REVIEW I 3RD QUARTER 2015 |
5 |
|
|
|
S H A R E H O L D E R L E T T E R |
During the third quarter, we also made good operating progress on several key initiatives that we believe will enhance our growth going forward. During the third quarter, we renewed our credit risk-sharing arrangement with Fannie Mae for an additional three months and extended our credit risk-sharing agreement with Freddie Mac through June 2016. Furthermore, we continue to work with both Agencies on alternative risk-sharing structures in our efforts to improve and expand on our existing initiatives, which enable us to create credit investments for our portfolio. Our MPF Direct channel also progressed as we added 28 new sellers during the quarter, bringing the total number of sellers in this channel to 58. Additionally, four FHLB district banks previously approved for the MPF Direct program began ramping up marketing efforts to their members in the third quarter.
In contrast to our investment portfolio returns, earnings from our residential and commercial mortgage banking businesses have underperformed relative to our expectations, making it unlikely that we will achieve the volume expectations we projected for 2015. There are several underlying themes for this circumstance.
In our residential business, our margins on our jumbo mortgage banking activity remain within our long-term target range of 25 to 50 basis points. It is notable that all our jumbo loan sales this quarter were bulk whole loan transactions, where pricing has been superior to comparable sales through securitization. Price competition for conforming loans remains challenging, especially as refinance activity has waned. Additionally, new entrants such as non-bank financial firms have aggressively bid up conforming MSRs, further pressuring pricing and margins. To improve our residential profitability, we have several jumbo and conforming initiatives underway that are discussed in more detail below.
In our commercial business, CMBS market conditions have also been far less than optimal. During the third quarter, triple-A credit spreads for CMBS widened by another 20 basis points to their highest level in two years. Spreads widened in response to a general nervousness and uncertainty in most fixed income markets, but also due to ongoing push-back by triple-A investors, B-piece buyers, and the rating agencies, in response to deteriorating credit standards for CMBS loans. Another issue we face is that industry-wide CMBS conduit issuance volume is lagging expectations set forth at the beginning of the year. Part of the reason is that some borrowers have delayed refinancing until the market settles down. Additionally, some banks and insurance companies have begun to more aggressively underwrite and finance loans for their own portfolios that would have otherwise been financed through CMBS. The fourth quarter has in past years been strong for commercial originations, but we would note that the overall condition of the CMBS market remains concerning. As a consequence, we expect to fall short of our commercial volume and margin expectations for 2015.
|
|
|
THE REDWOOD REVIEW I 3RD QUARTER 2015 |
6 |
|
|
|
S H A R E H O L D E R L E T T E R |
Thoughts on Our Business Strategy, Tactics and Outlook
Our business strategy for success - in an ultra-competitive investing world awash with liquidity and searching for yield - has been to build operating loan platforms capable of creating our own investments and fee-generating opportunities. Our platforms are scalable and were built with enough flexibility to add new loan products and points of distribution. Our goal has been to create an attractive, growing stream of earnings through a combination of “investment income” from our portfolio and “fee-income” from our conduits’ operating and loan distribution activities. We still believe this is the right strategy. We are, however, shifting some tactics.
The first shift we are employing is to rationalize the size and scope of our residential and commercial conduits relative to near-term market opportunities, while preserving all of the longer-term upside embedded in these platforms. Our focus will be on all of the things we can control - pricing strategies for our businesses, cost rationalization throughout all aspects of the company, and more efficient utilization of capital.
On the conforming side, this entails optimization of our seller network, with a tactical pricing shift towards more profitable sellers that may result in flat to lower volume in the near-term. Along with this shift, we are focused on achieving operational efficiencies at current volume levels, which are lower than we had originally planned when we expanded into conforming products in late 2013. Our initial analysis leads us to believe we can make significant improvements to net conforming margins for 2016, irrespective of current market conditions. We continue to believe that our conforming conduit positions us for attractive risk-sharing opportunities with the GSEs, and we are finally beginning to see these opportunities emerge on a consistent basis. We also continue to believe that long-term GSE reform will favor an influx of private capital into the conforming space from strong and established counterparties such as Redwood.
On the jumbo side, we have shifted our near-term focus toward a significant expansion of our whole loan distribution capabilities for 2016. In short, a strong portfolio bid for whole loans from banks currently results in a more favorable loan sale execution for us versus securitization. While this execution is not our preferred choice, as we are not able to create significant investments for our own portfolio as we can through securitization or by holding loans for investment at our FHLB-member subsidiary, it offers the best near-term profit potential and enables us to preserve the longer-term upside of our conduit as the securitization market normalizes over time.
|
|
|
THE REDWOOD REVIEW I 3RD QUARTER 2015 |
7 |
|
|
|
S H A R E H O L D E R L E T T E R |
To us, securitization remains the most efficient form of non-recourse sales execution in the long-term, as it allows us to tailor investments to the needs of different investors. To that end, we remain committed to enhancing our Sequoia brand with innovative new features, such as the addition of a transaction manager for securitizations backed by 30-year, fixed-rate collateral. We continue to believe that market liquidity for securitization will gradually improve over time and could get a boost if banks decide to reduce their portfolio demand for 15- and 30-year, fixed-rate jumbo loans and go back to their historical practice of selling those loans through securitization.
Turning to commercial, we are optimistic about the business going forward despite a difficult year in 2015. Tactically, our primary shift will be to improve our loan sale executions through more dynamic pricing strategies that allow us to be more competitive through each phase of the underwriting process. Additionally, we are working closely with CMBS transaction sponsors to ensure that our loan products carry optimal collateral and geographic characteristics to meet the demands of a more selective CMBS investor base. Our ability to offer accompanying mezzanine financing should benefit our execution, as we expect a higher percentage of senior loans to require mezzanine financing as long as credit remains in focus for CMBS investors. These tactical shifts, combined with the market’s belief that volumes will increase significantly over the next two years, should position our commercial business for a better 2016.
Share Repurchases
Repurchasing shares boils down to a decision on allocating capital in a manner that is in the best interest of our shareholders. Our approach is consistent with many long-term investors who believe a company should preserve investment capital to meet the near-term needs of the business and repurchase shares only when the market price is below intrinsic value. Based on this approach, during the third quarter we repurchased approximately 2.5 million shares of our common stock at an average price of $14.43 per share. We plan to follow the same approach in considering additional stock repurchases during the fourth quarter of 2015 and in 2016, as we have the willingness and capacity to make further investments in our own stock when it is attractive relative to other uses of capital.
|
|
|
THE REDWOOD REVIEW I 3RD QUARTER 2015 |
8 |
|
|
|
S H A R E H O L D E R L E T T E R |
Closing
As we approach the end of the year, we typically get a lot of inquiries and hear speculation surrounding our dividend policy for the upcoming year. Our Board has in recent years announced its intention with respect to the regular quarterly dividend for the upcoming calendar year towards the end of the fourth quarter of each year. The Board’s deliberations over dividend policy have generally considered numerous factors, including management’s projections for the company’s GAAP and REIT taxable earnings, and also projections of investment cash flows, capital, and liquidity. In addition, the consistency and sustainability of the dividend has always been an important consideration and priority.
Finally, with respect to the alignment of management with shareholders, we’ve always felt that our internal management structure and the Board’s design of our compensation program have resulted in a strong alignment of management and shareholder interests. Generally speaking, our compensation has been heavily weighted towards equity-based compensation and the cash compensation we receive, aside from base salaries, has been primarily based on return-on-equity to shareholders. Rest assured, we are highly motivated to generate higher returns for shareholders with the business strategy and tactical decisions we make, with the ultimate goal of increasing long-term shareholder value.
Thank you for your support.
|
| | |
| | |
Marty Hughes | | Brett D. Nicholas |
CEO | | President |
|
|
|
THE REDWOOD REVIEW I 3RD QUARTER 2015 |
9 |
|
|
|
Q U A R T E R L Y O V E R V I E W |
Third Quarter 2015 Highlights
| |
Ñ | We earned $0.22 per share for the third quarter of 2015, as compared to $0.31 per share for the second quarter of 2015. While our investment portfolio continued to exhibit strong fundamental performance, earnings declined in the third quarter due to hedging expenses for residential securities, some of which were offset through valuation gains recorded to our balance sheet, and lower pre-tax returns for our residential and commercial mortgage banking businesses. |
| |
Ñ | Our GAAP book value was $14.69 per share at September 30, 2015, as compared to $14.96 per share at June 30, 2015. The decline was largely due to an increase in unrealized losses on derivatives hedging our long-term debt, and a decrease in unrealized gains on securities. Additionally, our third quarter dividend of $0.28 per share exceeded our GAAP earnings for the third quarter. |
| |
Ñ | We deployed $87 million of capital in the third quarter toward new investments, including $44 million invested in loans held by our FHLB-member subsidiary, $23 million of investments in MSRs, and $13 million of investments in commercial mezzanine loans. Additionally, we deployed $35 million of capital to repurchase 2.5 million shares of Redwood common stock at an average price of $14.43 per share. |
| |
Ñ | We purchased $3.0 billion of residential loans during the third quarter of 2015, a 5% increase from the second quarter. At September 30, 2015, our pipeline of residential loans identified for purchase was $1.5 billion and included $1.1 billion of jumbo loans and $0.4 billion of conforming loans, unadjusted for fallout expectations. |
| |
Ñ | We sold $2.1 billion of residential loans during the third quarter, including $0.7 billion of jumbo loans to third parties, and $1.4 billion of conforming loans to the GSEs. These conforming loan sales included $915 million of loans that were sold under the risk-sharing arrangements previously established with both GSEs. |
| |
Ñ | Residential loans held by our FHLB-member subsidiary increased by 23% during the third quarter of 2015, from $1.2 billion at June 30, 2015, to $1.4 billion at September 30, 2015. |
| |
Ñ | We originated $168 million of senior commercial loans during the third quarter of 2015, bringing senior loan originations to $518 million through the first three quarters of 2015. |
| |
Ñ | Our combined residential and commercial investment portfolios increased by $127 million during the third quarter to $3.0 billion at September 30, 2015, and included $1.1 billion of residential securities, $1.4 billion of residential loans held-for-investment, $163 million of MSR investments, and $387 million of commercial loans held-for-investment. |
|
|
|
THE REDWOOD REVIEW I 3RD QUARTER 2015 |
10 |
|
|
|
Q U A R T E R L Y O V E R V I E W |
GAAP Earnings
The following table sets forth the components of Redwood’s GAAP net income for the third and second quarters of 2015.
|
| | | | | | | | |
|
Consolidated Statements of Income |
($ in millions, except per share data) |
| Three Months Ended | |
| 9/30/2015 | | 6/30/2015 | |
| | | | |
Interest income | $ | 63 |
| | $ | 63 |
| |
Interest expense | (24 | ) | | (23 | ) | |
Net interest income | 40 |
| | 40 |
| |
| | | | |
Provision for loan losses | — |
| | — |
| |
Non-interest income | | | | |
Mortgage banking and investment activities, net | (13 | ) | | 6 |
| |
MSR income (loss), net | 4 |
| | 1 |
| |
Other income | — |
| | 1 |
| |
Realized gains, net | 6 |
| | 6 |
| |
Total non-interest income, net | (3 | ) | | 14 |
| |
| | | | |
Operating expenses | (24 | ) | | (25 | ) | |
Benefit from (provision for) income taxes | 7 |
| | (2 | ) | |
| | | | |
Net income | $ | 19 |
| | $ | 27 |
| |
| | | | |
Net income per diluted common share | $ | 0.22 |
| | $ | 0.31 |
| |
| |
Ñ | Net interest income was $40 million for the third quarter of 2015, and reflected strong portfolio growth associated with $300 million of new residential loans held by our FHLB-member subsidiary. Overall, net interest income remained unchanged from the second quarter of 2015 as a result of $2 million of nonrecurring yield maintenance income received in the second quarter from the prepayment of three commercial mezzanine loans. |
|
|
|
THE REDWOOD REVIEW I 3RD QUARTER 2015 |
11 |
|
|
|
Q U A R T E R L Y O V E R V I E W |
| |
Ñ | Mortgage banking and investment activities, net, decreased to negative $13 million for the third quarter of 2015, as compared to positive $6 million for the second quarter of 2015. |
During the third quarter, we recorded $6 million of hedging expenses associated with derivatives used to hedge certain residential securities, where a portion of the offsetting gain in security values flows through the balance sheet. These hedging expenses represented a $13 million adverse change from our second quarter results, when we recorded $7 million of hedge gains on associated derivatives due to rising interest rates.
Income from mortgage banking activities declined $6 million from the second quarter of 2015. Of the decline, $4 million was related to lower residential mortgage banking income on similar loan volume, with the remaining $2 million related to lower commercial loan volume.
| |
Ñ | MSR income was $4 million for the third quarter of 2015, as compared to $1 million for the second quarter of 2015. Lower hedging expenses helped to improve our MSR investment returns to what we consider a more normalized run-rate during the third quarter. |
| |
Ñ | Operating expenses were $24 million for the third quarter of 2015, down slightly from the second quarter of 2015 and in line with our anticipated quarterly run-rate. |
| |
Ñ | We recorded a tax benefit of $7 million for the third quarter of 2015, as compared to a tax provision of $2 million for the second quarter of 2015. Our tax results under GAAP have been driven by operating activities at our taxable REIT subsidiaries. The third quarter tax benefit was due primarily to lower mortgage banking income and negative market valuation adjustments on derivatives used to hedge our investment portfolio. A reconciliation of GAAP and taxable income is set forth in Table 3 in the Financial Tables Appendix of this Review. |
| |
Ñ | Additional details on our earnings are included in the Analysis of GAAP Results by Business Segment section that follows. |
|
|
|
THE REDWOOD REVIEW I 3RD QUARTER 2015 |
12 |
|
|
|
Q U A R T E R L Y O V E R V I E W |
GAAP Book Value
Our GAAP book value at September 30, 2015, was $14.69 per share, as compared to $14.96 per share at June 30, 2015. The following table sets forth the changes in Redwood’s GAAP book value per share for the third and second quarters of 2015.
|
| | | | | | | | |
|
Changes in GAAP Book Value Per Share |
($ in per share) |
| Three Months Ended | |
| 9/30/2015 | | 6/30/2015 | |
| | | | |
Beginning book value | $ | 14.96 |
| | $ | 15.01 |
| |
Earnings | 0.22 |
| | 0.31 |
| |
Changes in unrealized gains on securities, net: | | | | |
Senior and subordinate securities | (0.13 | ) | | (0.06 | ) | |
Mezzanine securities used for hedging | 0.02 |
| | (0.06 | ) | |
Total change in unrealized gains on securities, net | (0.11 | ) | | (0.12 | ) | |
Dividends | (0.28 | ) | | (0.28 | ) | |
Share repurchases | 0.02 |
| | — |
| |
Equity award distributions | — |
| | (0.19 | ) | |
Changes in unrealized losses on derivatives hedging long-term debt | (0.15 | ) | | 0.18 |
| |
Other, net | 0.03 |
| | 0.05 |
| |
| | | | |
Ending book value | $ | 14.69 |
| | $ | 14.96 |
| |
| |
Ñ | In addition to our earnings being less than our dividend payment for the third quarter, the decline in book value was driven by unrealized losses on our long-term debt hedges, which are recorded through book value, but not through earnings. During the third quarter, the 30-year swap rate declined 42 basis points, resulting in a $0.15 per share decline in value from these hedges. We estimated that the fair value of the associated long-term debt decreased by $10 million, which would have increased book value by $0.13 per share. This offsetting amount was not reflected in book value, as the debt is recorded at its amortized cost basis under GAAP. |
| |
Ñ | Also negatively impacting book value was a $0.13 per share decline in unrealized gains on our legacy residential securities. As most of our legacy residential securities have appreciated in prior quarters from a mark-to-market standpoint, the net unrealized gains from these securities (i.e., the difference between the cost basis and the fair value of these securities) have declined as we recognize amortization income or realize gains from the sale of these securities. In total, we have sold $10 million of legacy residential securities during 2015. |
|
|
|
THE REDWOOD REVIEW I 3RD QUARTER 2015 |
13 |
|
|
|
Q U A R T E R L Y O V E R V I E W |
| |
Ñ | Included in our book value per share was $2 million, or $0.02 per share, of positive market valuation adjustments on mezzanine securities. This was more than offset by a net $0.04 per share of related expenses that flowed through our income statement, including $0.06 per share of hedging expenses, offset by $0.02 per share of realized gains from sales of mezzanine securities throughout the third quarter. |
Overall, our hedges were effective in offsetting the impact of changing interest rates on the value of our mezzanine securities. However, credit spreads also widened for these investments during the third quarter, resulting in lower price appreciation than would have otherwise occurred.
| |
Ñ | During the third quarter, we utilized our stock buyback authorization to repurchase approximately 2.5 million shares at an average price of $14.43 per share. These share repurchases increased book value by $0.02 per share. |
|
|
|
THE REDWOOD REVIEW I 3RD QUARTER 2015 |
14 |
|
|
|
Q U A R T E R L Y O V E R V I E W |
Analysis of GAAP Results by Business Segment
We report on our business using three distinct segments: Residential Mortgage Banking, Residential Investments, and Commercial Mortgage Banking and Investments. The Redwood's Business Overview section located in the Appendix of this Redwood Review includes full descriptions of these segments and how they fit into Redwood's business model. The following table presents the results from each of these segments reconciled to our GAAP net income for the third and second quarters of 2015.
|
| | | | | | | | |
|
Segment Results Summary (1) |
($ in millions) |
| Three Months Ended | |
| 9/30/2015 | | 6/30/2015 | |
| | | | |
Segment contribution from: | | | | |
Residential mortgage banking | $ | — |
| | $ | 1 |
| |
Residential investments | 30 |
| | 34 |
| |
Commercial mortgage banking and investments | 5 |
| | 9 |
| |
Corporate/Other | (16 | ) | | (17 | ) | |
| | | | |
Net income | $ | 19 |
| | $ | 27 |
| |
| |
(1) | See Table 2 of the Financial Tables section of the Appendix to this Redwood Review for a more comprehensive presentation of our segment results. |
|
|
|
THE REDWOOD REVIEW I 3RD QUARTER 2015 |
15 |
|
|
|
Q U A R T E R L Y O V E R V I E W |
Residential Mortgage Banking
The following table presents the results of our Residential Mortgage Banking segment for the third and second quarters of 2015.
|
| | | | | | | | |
|
Segment Results - Residential Mortgage Banking |
($ in millions) |
| Three Months Ended | |
| 9/30/2015 | | 6/30/2015 | |
| | | | |
Net interest income | $ | 8 |
| | $ | 7 |
| |
| | | | |
Non-interest income | | | | |
Mortgage banking activities, net | — |
| | 5 |
| |
Total non-interest income | — |
| | 5 |
| |
| | | | |
Direct operating expenses | (11 | ) | | (11 | ) | |
Tax benefit | 3 |
| | 1 |
| |
| | | | |
Segment contribution | $ | — |
| | $ | 1 |
| |
| |
Ñ | Our results from this segment declined from the second quarter of 2015, primarily due to lower loan sale margins. This decline was partially offset by a tax benefit of $3 million that resulted from lower pre-tax income during the third quarter. |
| |
Ñ | Loan purchase commitments (LPCs), adjusted for fallout expectations, were $2.7 billion for the third quarter, similar to the second quarter of 2015, and included $1.4 billion of jumbo loans and $1.3 billion of conforming loans. Through the first nine months of 2015, LPCs were $8.4 billion, and included $4.2 billion of jumbo loans and $4.2 billion of conforming loans. |
| |
Ñ | Although our jumbo loan sale margins, which we define as net interest income and income from mortgage banking activities divided by LPCs, declined modestly during the third quarter, at 47 basis points through the first nine months of 2015, they remain at the higher end of our long-term target range of 25-50 basis points. After direct operating expenses and taxes, segment contribution from jumbo loans was near break-even for the third quarter of 2015 and $5 million for the first nine months of 2015. |
| |
Ñ | Conforming loan sale margins were 24 basis points for the first nine months of 2015. After direct operating expenses and taxes, segment contribution from conforming loans was negative $1 million for the third quarter of 2015 and negative $5 million for the first nine months of 2015. The loss from conforming loans declined during the third quarter, and with the profitability initiatives we have underway (as discussed in the Shareholder Letter in this Redwood Review), we expect to see the results from conforming loans continue to improve going forward. |
|
|
|
THE REDWOOD REVIEW I 3RD QUARTER 2015 |
16 |
|
|
|
Q U A R T E R L Y O V E R V I E W |
| |
Ñ | Direct operating expenses in the third quarter were unchanged from the second quarter of 2015. These expenses primarily include costs associated with the purchase, underwriting and sale of residential loans. |
| |
Ñ | At September 30, 2015, we had 266 loan sellers, up from 212 at the end of the second quarter of 2015. This included the addition of 28 MPF Direct sellers from various FHLB districts. |
| |
Ñ | Our Residential Mortgage Banking operations created $71 million of investments for our investment portfolio during the third quarter of 2015, and $252 million year to date. |
|
|
|
THE REDWOOD REVIEW I 3RD QUARTER 2015 |
17 |
|
|
|
Q U A R T E R L Y O V E R V I E W |
Residential Investments
The following table presents the results of our Residential Investments segment for the third and second quarters of 2015.
|
| | | | | | | | |
|
Segment Results - Residential Investments |
($ in millions) |
| Three Months Ended | |
| 9/30/2015 | | 6/30/2015 | |
| | | | |
Net interest income | | | | |
Residential securities | $ | 21 |
| | $ | 22 |
| |
Residential loans | 11 |
| | 9 |
| |
Total net interest income | 31 |
| | 32 |
| |
| | | | |
Non-interest income | | | | |
Investment activities, net | (14 | ) | | (1 | ) | |
MSR income (loss), net | 4 |
| | 1 |
| |
Other income | — |
| | 1 |
| |
Realized gains, net | 6 |
| | 6 |
| |
Total non-interest income (loss) | (4 | ) | | 7 |
| |
| | | | |
Direct operating expenses | (1 | ) | | (1 | ) | |
Tax benefit (provision) | 4 |
| | (4 | ) | |
| | | | |
Segment contribution | $ | 30 |
| | $ | 34 |
| |
| |
Ñ | The contribution from this segment declined from the second quarter of 2015, primarily due to hedging expenses related to our mezzanine securities. Offsetting valuation gains on these mezzanine securities were recorded through our balance sheet and not the income statement. |
| |
Ñ | Net interest income was relatively unchanged from the second quarter of 2015, as net interest income from loans held by our FHLB-member subsidiary increased and was partially offset by a decline in net interest income from our securities portfolio, as sales of lower yielding securities and principal paydowns outpaced new security investments during the third quarter. |
|
|
|
THE REDWOOD REVIEW I 3RD QUARTER 2015 |
18 |
|
|
|
Q U A R T E R L Y O V E R V I E W |
The following table presents the components of MSR income (loss), net for the third and second quarters of 2015.
|
| | | | | | | | |
|
Components of MSR Income (Loss), net |
($ in millions) |
| Three Months Ended | |
| 9/30/2015 | | 6/30/2015 | |
| | | | |
Net fee income | $ | 9 |
| | $ | 7 |
| |
Changes in fair value of MSRs due to: | | | | |
Change in basis (1) | (5 | ) | | (3 | ) | |
Change in interest rates (2) | (24 | ) | | 19 |
| |
Associated derivatives | 24 |
| | (22 | ) | |
| | | | |
MSR income (loss), net | $ | 4 |
| | $ | 1 |
| |
| |
(1) | Primarily represents changes due to the receipt of expected cash flows during the quarter. |
| |
(2) | Primarily reflects changes in prepayment assumptions due to changes in benchmark interest rates. |
| |
Ñ | MSR income, net, increased from the second quarter due to fewer hedge rebalancing costs, resulting in MSR investment returns more consistent with our normalized expectations. |
The following table details our capital invested in Residential Investments for the third and second quarters of 2015.
|
| | | | | | | | |
|
Quarterly Residential Investment Activity |
($ in millions) |
| Three Months Ended | |
| 9/30/2015 | | 6/30/2015 | |
| | | | |
Sequoia RMBS | $ | — |
| | $ | 10 |
| |
Third-party RMBS | 11 |
| | 22 |
| |
Less: Short-term debt/Other liabilities | (8 | ) | | (11 | ) | |
Total RMBS, net | 3 |
| | 21 |
| |
| | | | |
Loans, net – FHLBC (1) | 44 |
| | 37 |
| |
GSE risk share investments | 5 |
| | — |
| |
MSR investments | 23 |
| | 32 |
| |
| | | | |
Capital invested | $ | 74 |
| | $ | 90 |
| |
| |
(1) | Includes loans transferred to our FHLB-member subsidiary and FHLBC stock acquired, less secured borrowings. |
|
|
|
THE REDWOOD REVIEW I 3RD QUARTER 2015 |
19 |
|
|
|
Q U A R T E R L Y O V E R V I E W |
| |
Ñ | During the third quarter, we invested $74 million of capital into new residential investments, including $3 million into securities, $23 million into MSR investments, $5 million into GSE risk sharing investments, and $44 million into residential loans held-for-investment by our FHLB-member subsidiary. |
| |
Ñ | During the third quarter, we sold $37 million of securities, including $6 million of Sequoia subordinate securities, $26 million of third-party subordinate securities, and $5 million of senior securities, for which we realized gains on sales of $6 million. After the repayment of the associated short-term debt, these security sales provided $13 million of capital for reinvestment. A portion of the proceeds from these security sales was used to fund our investments in residential loans, which we expect in aggregate to generate higher returns on capital than the securities we sold. |
| |
Ñ | As of September 30, 2015, we had $2.6 billion of investments in our Residential Investments segment, including $1.1 billion of securities, $1.4 billion of residential loans held-for-investment, and $163 million of MSR investments. The credit performance of our portfolio remains strong, with no credit losses incurred to date and minimal delinquencies. |
The following table presents the components of investment activities, net in our Residential Investments segment for the third and second quarters of 2015.
|
| | | | | | | | |
|
Components of Investment Activities, net |
($ in millions) |
| Three Months Ended | |
| 9/30/2015 | | 6/30/2015 | |
| | | | |
Market valuation changes on: | | | | |
Real estate securities | $ | (9 | ) | | $ | 7 |
| |
Residential loans held-for-investment | 9 |
| | (6 | ) | |
Other investments | (1 | ) | | — |
| |
Derivatives and hedging allocation | (13 | ) | | (2 | ) | |
| | | | |
Total investment activities, net | $ | (14 | ) | | $ | (1 | ) | |
|
|
|
THE REDWOOD REVIEW I 3RD QUARTER 2015 |
20 |
|
|
|
Q U A R T E R L Y O V E R V I E W |
Commercial Mortgage Banking and Investments
The following table presents the results of our Commercial Mortgage Banking and Investments segment for the third and second quarters of 2015.
|
| | | | | | | | |
|
Segment Results - Commercial Mortgage Banking and Investments |
($ in millions) |
| Three Months Ended | |
| 9/30/2015 | | 6/30/2015 | |
| | | | |
Net interest income | | | | |
Mezzanine loans | $ | 7 |
| | $ | 9 |
| |
Senior loans | 1 |
| | 1 |
| |
Total net interest income | 8 |
| | 9 |
| |
| | | | |
Provision for loan losses | — |
| | — |
| |
Non-interest income | | | | |
Mortgage banking activities, net | 1 |
| | 3 |
| |
Total non-interest income | 1 |
| | 3 |
| |
| | | | |
Operating expenses | (3 | ) | | (3 | ) | |
Tax provision | — |
| | — |
| |
| | | | |
Segment contribution | $ | 5 |
| | $ | 9 |
| |
| |
Ñ | We recorded normalized net interest income of $7 million on our mezzanine loan portfolio during the third quarter, after benefiting from $2 million of nonrecurring yield maintenance fees received in the second quarter of 2015. |
| |
Ñ | Total senior loan originations were $168 million for the third quarter and loan sale margins, which we define as net interest income and income from mortgage banking activities, net divided by loan originations, were 100 basis points. This compared with $258 million of senior loan originations for the second quarter of 2015 that generated loan sale margins of 120 basis points. |
| |
Ñ | During the third quarter we invested $13 million of capital in three mezzanine loans with a weighted average coupon of approximately 10%. |
| |
Ñ | At September 30, 2015, we had $387 million of commercial mezzanine and subordinate loans held-for-investment with a weighted average yield of approximately 10% and a weighted average maturity of over four years. The credit quality of our mezzanine loan portfolio remains strong and we do not currently anticipate any material credit issues on maturing loans. |
|
|
|
THE REDWOOD REVIEW I 3RD QUARTER 2015 |
21 |
|
|
|
Q U A R T E R L Y O V E R V I E W |
Capital and Liquidity
Our total capital was $1.8 billion at September 30, 2015, and included $1.2 billion of equity capital and $0.6 billion of the total $1.8 billion of long-term debt on our consolidated balance sheet. This portion of long-term debt included $140 million of trust-preferred securities due in 2037, $288 million of convertible debt due in 2018, and $205 million of exchangeable debt due in 2019.
At September 30, 2015, we held $235 million in cash, and our available capital (defined as the approximate amount of capital we had readily available for long-term investments) was approximately $85 million. This amount excludes cash flow we expect to receive in future quarters from investments and cash proceeds that we could generate from the sale of non-core investments such as our mezzanine securities.
In August 2015, our Board of Directors authorized the repurchase of up to $100 million of our common stock, replacing the Board’s previous share repurchase authorization. Our share repurchase authorization does not obligate us to acquire any specific number of shares. Under this authorization, shares may be repurchased in privately negotiated and/or open market transactions, including under plans complying with Rule 10b5-1 under the Securities Exchange Act of 1934, as amended. During the three months ended September 30, 2015, we repurchased approximately 2.5 million shares pursuant to this authorization. At September 30, 2015, approximately $65 million of this authorization remained available for the repurchase of shares of our common stock. Like other investments we may make, any repurchases of our common stock under this authorization would reduce our available capital described above.
Our FHLB-member subsidiary borrowed an additional $268 million of long-term debt from the FHLBC during the third quarter, which increased total long-term debt associated with FHLBC borrowings to $1.1 billion at September 30, 2015.
|
|
|
THE REDWOOD REVIEW I 3RD QUARTER 2015 |
22 |
|
|
|
Q U A R T E R L Y O V E R V I E W |
The following table presents components of our debt, categorized by the type of asset securing the debt, and additional information related to these borrowings at September 30, 2015.
|
| | | | | | | | | | | | | | | | | | | | | | |
|
Financing Summary |
($ in millions) |
| Secured Debt by Collateral Type | | | |
| Residential Loans Held-for Sale | Residential Loans Held-for-Investment (1) | Residential Securities | Commercial Loans Held-for-Sale | Commercial Loans Held-for-Investment | TruPS and Convertible Debt | Total | |
| | | | | | | | |
Collateral securing debt | $ | 1,300 |
| $ | 1,423 |
| $ | 587 |
| $ | 53 |
| $ | 132 |
| NA | NA | |
| | | | | | | | |
Short-term debt | $ | 1,161 |
| $ | 126 |
| $ | 475 |
| $ | 39 |
| $ | 72 |
| $ | — |
| $ | 1,873 |
| |
Long-term debt | — |
| 1,124 |
| — |
| — |
| — |
| 632 |
| 1,756 |
| |
Debt (2) | $ | 1,161 |
| $ | 1,250 |
| $ | 475 |
| $ | 39 |
| $ | 72 |
| $ | 632 |
| $ | 3,629 |
|
|
| | | | | | | | |
Financing Summary | | | | | | | | |
Cost of funds | 1.73 | % | 0.35 | % | 1.44 | % | 2.44 | % | 4.21 | % | 6.11 | % | | |
Total borrowing capacity (3) | $ | 1,550 |
| $ | 1,400 |
| NA | $ | 300 |
| $ | 150 |
| NA | | |
| | | | | | | | |
| |
(1) | Collateral securing debt includes $67 million of loans classified as held-for-sale at September 30, 2015. |
| |
(2) | Excludes ABS issued and commercial secured borrowings. See Table 4 in the Financial Tables section of the Appendix to this Redwood Review for additional information on our consolidated debt. |
| |
(3) | Represents our total uncommitted borrowing capacity. |
At September 30, 2015, we had four uncommitted warehouse facilities for residential loans held-for-sale, two uncommitted warehouse facilities for senior commercial loans held-for-sale, and one uncommitted warehouse facility for mezzanine and subordinate commercial loans held-for-investment. Our residential loans held-for-investment were financed with borrowings from the FHLBC through our FHLB-member subsidiary.
|
|
|
THE REDWOOD REVIEW I 3RD QUARTER 2015 |
23 |
|
|
|
F I N A N C I A L I N S I G H T S |
Balance Sheet
The following table presents our consolidated balance sheets at September 30, 2015 and June 30, 2015.
|
| | | | | | | | |
|
Consolidated Balance Sheets (1) |
($ in millions) |
| 9/30/2015 | | 6/30/2015 | |
| | | | |
Residential loans | $ | 4,037 |
| | $ | 3,286 |
| |
Real estate securities | 1,085 |
| | 1,158 |
| |
Commercial loans | 468 |
| | 551 |
| |
Mortgage servicing rights | 163 |
| | 168 |
| |
Cash and cash equivalents | 235 |
| | 226 |
| |
Total earning assets | 5,988 |
| | 5,390 |
| |
| | | | |
Other assets | 281 |
| | 206 |
| |
Total assets | $ | 6,269 |
| | $ | 5,596 |
| |
| | | | |
Short-term debt | | | | |
Mortgage loan warehouse debt (2) | 1,397 |
| | $ | 874 |
| |
Security repurchase facilities | 475 |
| | 493 |
| |
Other liabilities | 189 |
| | 123 |
| |
Asset-backed securities issued | 1,179 |
| | 1,262 |
| |
Long-term debt | 1,822 |
| | 1,579 |
| |
Total liabilities | 5,062 |
| | 4,331 |
| |
| | | | |
Stockholders’ equity | 1,207 |
| | 1,265 |
| |
| | | | |
Total liabilities and equity | $ | 6,269 |
| | $ | 5,596 |
| |
| |
(1) | Our consolidated balance sheets include assets of consolidated variable interest entities (“VIEs”) that can only be used to settle obligations of these VIEs and liabilities of consolidated VIEs for which creditors do not have recourse to the primary beneficiary (Redwood Trust, Inc.). At September 30, 2015 and June 30, 2015, assets of consolidated VIEs totaled $1,539 and $1,623, respectively, and liabilities of consolidated VIEs totaled $1,180 and $1,263, respectively. See Table 8 in the Financial Tables section of the Appendix to this Redwood Review for additional detail on consolidated VIEs. |
| |
(2) | Includes $126 million of short-term borrowings from the FHLBC by our FHLB-member subsidiary, secured by residential loans held-for-investment. |
|
|
|
THE REDWOOD REVIEW I 3RD QUARTER 2015 |
24 |
|
|
|
F I N A N C I A L I N S I G H T S |
Residential Loans
The following table presents residential loan activity during the third and second quarters of 2015.
|
| | | | | | | | | | | | | | | | | | | | |
|
Residential Loans |
($ in millions) |
| Conforming Held-for-Sale | | Jumbo Held-for- Sale | | Jumbo Held-for-Investment | | Consolidated Sequoia Entities | | Total | |
| | | | | | | | | | |
Fair value at March 31, 2015 | $ | 201 |
| | $ | 894 |
| | $ | 1,000 |
| | $ | 1,304 |
| | $ | 3,400 |
| |
Acquisitions | 1,440 |
| | 1,407 |
| | — |
| | — |
| | 2,847 |
| |
Sales | (1,396 | ) | | (1,420 | ) | | — |
| | — |
| | (2,816 | ) | |
Transfers between portfolios (1) | — |
| | (216 | ) | | 216 |
| | — |
| | — |
| |
Principal payments | — |
| | (14 | ) | | (53 | ) | | (69 | ) | | (136 | ) | |
Change in fair value, net | 4 |
| | (7 | ) | | (6 | ) | | 3 |
| | (6 | ) | |
Other, net | — |
| | — |
| | — |
| | (1 | ) | | (1 | ) | |
Fair value at June 30, 2015 | $ | 248 |
| | $ | 642 |
| | $ | 1,157 |
| | $ | 1,237 |
| | $ | 3,286 |
| |
Acquisitions | 1,422 |
| | 1,565 |
| | — |
| | — |
| | 2,987 |
| |
Sales | (1,438 | ) | | (695 | ) | | — |
| | — |
| | (2,133 | ) | |
Transfers between portfolios (1) | — |
| | (233 | ) | | 233 |
| | — |
| | — |
| |
Principal payments | (1 | ) | | (17 | ) | | (40 | ) | | (66 | ) | | (123 | ) | |
Change in fair value, net | 5 |
| | 6 |
| | 9 |
| | — |
| | 20 |
| |
Other, net | — |
| | — |
| | — |
| | (1 | ) | | (1 | ) | |
| | | | |
| | | | | |
Fair value at September 30, 2015 | $ | 236 |
| | $ | 1,268 |
| | $ | 1,360 |
| | $ | 1,170 |
| | $ | 4,037 |
| |
| |
(1) | Represents net transfers of loans to our Residential Investments segment from our Residential Mortgage Banking segment. |
Our $4.0 billion of residential loans are comprised of jumbo and conforming loans held-for-sale through our Residential Mortgage Banking segment, loans held-for-investment in our Residential Investments segment and loans at consolidated Sequoia entities.
Residential Loans Held-for-Sale
In the third quarter of 2015, sales of jumbo loans included $695 million of bulk sales, as compared to $712 million sold through two securitizations and $708 million of bulk sales in the second quarter of 2015.
At September 30, 2015, we had short-term residential mortgage warehouse debt outstanding of $1.2 billion, which was secured by $1.3 billion of residential mortgage loans held-for-sale.
|
|
|
THE REDWOOD REVIEW I 3RD QUARTER 2015 |
25 |
|
|
|
F I N A N C I A L I N S I G H T S |
Residential Loans Held-for-Investment
During the third quarter of 2015, we had net transfers of $233 million of loans from our Residential Mortgage Banking segment to our Residential Investments segment, where the loans are classified as held-for-investment. At September 30, 2015, nearly all of our held-for-investment jumbo loans were held by our FHLB-member subsidiary and were financed on a secured basis with the FHLBC.
At September 30, 2015, our $1.4 billion of held-for-investment loans included $1.3 billion of fixed-rate loans, and $36 million of hybrid loans, which combined had a weighted average original LTV of 64% and FICO score of 772. At September 30, 2015, one of these loans was 90-or-more days delinquent.
At September 30, 2015, our FHLB-member subsidiary had $1.3 billion of total borrowings outstanding under its FHLB borrowing agreement. The long-term portion of these borrowings had a weighted average interest rate of 0.35% and a weighted average maturity of nine years. Advances under this agreement are charged interest based on a specified margin over the FHLBC’s 13-week discount note rate, which resets every 13 weeks. At September 30, 2015, these advances were secured by residential mortgage loans with a fair value of $1.4 billion.
Consolidated Sequoia Investments
For financial reporting purposes, we are required under GAAP to consolidate the assets and liabilities of certain Sequoia securitization entities we sponsored prior to 2012. We measure both the financial assets and liabilities (ABS issued) of these Sequoia entities at fair value. At September 30, 2015, the fair value of our investments in these entities (represented by retained RMBS) totaled $69 million. See Table 8 in the Financial Tables section of the Appendix to this Redwood Review for additional detail on the assets and liabilities of consolidated Sequoia entities.
Our consolidated Sequoia entities generated $2 million of net interest income for both the third and second quarters of 2015.
|
|
|
THE REDWOOD REVIEW I 3RD QUARTER 2015 |
26 |
|
|
|
F I N A N C I A L I N S I G H T S |
Real Estate Securities
Our real estate securities are comprised of investments in residential mortgage backed securities. The following table presents the change in fair value of real estate securities during the third and second quarters of 2015.
|
| | | | | | | | |
|
Real Estate Securities |
($ in millions) |
| Three Months Ended | |
| 9/30/15 | | 6/30/2015 | |
| | | | |
Beginning fair value | $ | 1,158 |
| | $ | 1,285 |
| |
Acquisitions | | | | |
Sequoia securities (1) | — |
| | 43 |
| |
Third-party securities | 9 |
| | 31 |
| |
Sales | | | | |
Sequoia securities | (8 | ) | | (147 | ) | |
Third-party securities | (29 | ) | | (30 | ) | |
Gain on sales/calls, net | 6 |
| | 6 |
| |
Effect of principal payments | (30 | ) | | (33 | ) | |
Change in unrealized gains, net | (20 | ) | | 3 |
| |
| | | | |
Ending fair value | $ | 1,085 |
| | $ | 1,158 |
| |
| |
(1) | Sequoia securities represent interests we have retained in Sequoia securitizations we sponsored and that were not consolidated for GAAP purposes. |
We directly finance our holdings of residential securities through a combination of short-term debt secured by securities and our Residential Resecuritization. At September 30, 2015, we had short-term debt incurred through securities repurchase facilities of $475 million, which was secured by $587 million of real estate securities. During the third quarter of 2015, average short-term debt secured by securities was $492 million.
At September 30, 2015, we had $5 million outstanding of non-recourse, asset-backed debt issued at our Residential Resecuritization, at a stated interest rate of one-month LIBOR plus 200 basis points, or 2.2% (excluding deferred issuance costs), which provided financing for securities with a carrying value of $181 million. See Table 8 in the Financial Tables section of the Appendix to this Redwood Review for additional detail on our consolidated variable interest entities, including our Residential Resecuritization.
|
|
|
THE REDWOOD REVIEW I 3RD QUARTER 2015 |
27 |
|
|
|
F I N A N C I A L I N S I G H T S |
The following table presents the fair value of our residential real estate securities at September 30, 2015. We categorize our Sequoia and third-party securities by portfolio vintage (the year the securities were issued), priority of cash flow (senior, re-REMIC, and subordinate) and the underwriting characteristics of the underlying loans (prime and non-prime).
|
| | | | | | | | | | | | | | | | | | | | | | | |
|
Real Estate Securities - Vintage and Category |
September 30, 2015 |
($ in millions) |
| Sequoia Securities 2012-2015 | | Third-party Securities | | | | | |
| | 2012-2015 | | 2006-2008 | | <=2005 | | Total Securities | | % of Total Securities | |
| | | | | | | | | | | | |
Seniors | | | | | | | | | | | | |
Prime | $ | 51 |
| | $ | — |
| | $ | 53 |
| | $ | 198 |
| | $ | 303 |
| | 28 | % | |
Non-prime (1) | — |
| | — |
| | 4 |
| | 161 |
| | 165 |
| | 15 | % | |
Total seniors | 51 |
| | — |
| | 57 |
| | 359 |
| | 467 |
| | 43 | % | |
Re-REMIC | — |
| | — |
| | 109 |
| | 59 |
| | 168 |
| | 15 | % | |
Prime subordinates | | | | | | | | | | | | |
Mezzanine (2) | 199 |
| | 73 |
| | — |
| | — |
| | 272 |
| | 25 | % | |
Subordinate | 104 |
| | 37 |
| | 1 |
| | 36 |
| | 178 |
| | 17 | % | |
Prime subordinates | 303 |
| | 110 |
| | 1 |
| | 36 |
| | 450 |
| | 41 | % | |
| | | | | | | | | | | | |
Total real estate securities | $ | 354 |
| | $ | 110 |
| | $ | 167 |
| | $ | 454 |
| | $ | 1,085 |
| | 100 | % | |
| |
(1) | Non-prime residential senior securities consist of Alt-A senior securities. |
| |
(2) | Mezzanine includes securities initially rated AA, A, and BBB- and issued in 2012 or later. |
The following table presents information on our real estate securities at September 30, 2015.
|
| | | | | | | | | | | | | | | | | | | | | | | | |
| |
Real Estate Securities - Carrying Values | |
September 30, 2015 | |
($ in millions) | |
| Senior | | | | Subordinate | | | |
| Prime | | Non- prime | | Re-REMIC | | Mezzanine | | Subordinate | | Total | |
| | | | | | | | | | | | |
Available-for-sale securities | | | | | | | | | | | | |
Current face | $ | 258 |
| | $ | 174 |
| | $ | 192 |
| | $ | 237 |
| | $ | 254 |
| | $ | 1,115 |
| |
Credit reserve | (2 | ) | | (9 | ) | | (11 | ) | | — |
| | (33 | ) | | (55 | ) | |
Net unamortized discount | (27 | ) | | (26 | ) | | (74 | ) | | (22 | ) | | (112 | ) | | (262 | ) | |
Amortized cost | 228 |
| | 140 |
| | 107 |
| | 215 |
| | 109 |
| | 798 |
| |
Unrealized gains | 27 |
| | 19 |
| | 61 |
| | 19 |
| | 52 |
| | 178 |
| |
Unrealized losses | (3 | ) | | — |
| | — |
| | — |
| | (1 | ) | | (4 | ) | |
Carrying Value | 251 |
| | 158 |
| | 168 |
| | 233 |
| | 160 |
| | 970 |
| |
| | | | | | | | | | | | |
Trading securities | 51 |
| | 7 |
| | — |
| | 39 |
| | 18 |
| | 114 |
| |
| | | | | | | | | | | | |
Fair value of residential securities | $ | 303 |
| | $ | 165 |
| | $ | 168 |
| | $ | 272 |
| | $ | 178 |
| | $ | 1,085 |
| |
|
|
|
THE REDWOOD REVIEW I 3RD QUARTER 2015 |
28 |
|
|
|
F I N A N C I A L I N S I G H T S |
For GAAP, we account for the majority of our securities as available-for-sale (AFS) and the others as trading securities, and in both cases the securities are reported at their estimated fair value. Changes in fair values of our AFS securities are recorded on our balance sheet through stockholders' equity. Changes in fair values of trading securities are recorded through our income statement.
At September 30, 2015, real estate securities we owned (as a percentage of current market value) consisted of fixed-rate assets (53%), adjustable-rate assets (22%), and hybrid assets that reset within the next year (25%).
Additional information on the residential securities we own is set forth in Tables 6 and 7 in the Financial Tables section of the Appendix to this Redwood Review.
|
|
|
THE REDWOOD REVIEW I 3RD QUARTER 2015 |
29 |
|
|
|
F I N A N C I A L I N S I G H T S |
Commercial Loans
The following table presents commercial loan activity during the third and second quarters of 2015.
|
| | | | | | | | | | | | | | | | | | | | |
|
Commercial Loans |
($ in millions) |
| Held-for-Sale Senior | | Held-for-Investment | | | |
| | A-Notes (1) | | Unsecuritized Mezzanine | | Securitized Mezzanine | | Total | |
| | | | | | | | | | |
Carrying value March 31, 2015 | $ | 54 |
| | $ | 68 |
| | $ | 146 |
| | $ | 192 |
| | $ | 460 |
| |
Originations | 258 |
| | — |
| | 2 |
| | — |
| | 260 |
| |
Sales | (147 | ) | | — |
| | — |
| | — |
| | (147 | ) | |
Principal payments/amortization | — |
| | — |
| | (10 | ) | | (10 | ) | | (20 | ) | |
Change in fair value, net | 1 |
| | (3 | ) | | — |
| | — |
| | (2 | ) | |
Change in allowance for loan losses | — |
| | — |
| | — |
| | — |
| | — |
| |
| | | | | | | | | | |
Carrying value at June 30, 2015 | $ | 166 |
| | $ | 65 |
| | $ | 138 |
| | $ | 182 |
| | $ | 551 |
| |
| | | | | | | | | | |
Originations | 168 |
| | — |
| | 13 |
| | — |
| | 181 |
| |
Sales | (257 | ) | | — |
| | — |
| | — |
| | (257 | ) | |
Principal payments/amortization | — |
| | — |
| | (10 | ) | | (2 | ) | | (12 | ) | |
Change in fair value, net | 4 |
| | 1 |
| | — |
| | — |
| | 5 |
| |
Change in allowance for loan losses | — |
| | — |
| | — |
| | — |
| | — |
| |
| | | | | | | | | | |
Carrying value at September 30, 2015 | $ | 81 |
| | $ | 66 |
| | $ | 141 |
| | $ | 180 |
| | $ | 468 |
| |
| |
(1) | A-notes presented above were previously sold to third-parties, but did not meet the sale criteria under GAAP and remain on our balance sheet, carried at fair value. As such, we recorded the cash received for the transfer of the loans as secured borrowings, which are also carried at a fair value of $66 million as of September 30, 2015. Our investment in the B-note portions of these loans was $5 million at September 30, 2015 and is included in the Unsecuritized Mezzanine column presented above. |
Commercial Loans Held-for-Sale
During the third quarter of 2015, we originated and funded 11 senior commercial loans for $168 million, and sold 15 senior loans totaling $257 million. This compares to the second quarter of 2015 when we originated and funded 23 senior loans for $258 million, and sold 17 senior loans totaling $147 million. At September 30, 2015, we had seven senior commercial loans held-for-sale with a carrying value of $81 million.
At September 30, 2015, we had $39 million of short-term borrowings outstanding under two loan warehouse facilities that were secured by senior commercial loans with a carrying value of $53 million.
|
|
|
THE REDWOOD REVIEW I 3RD QUARTER 2015 |
30 |
|
|
|
F I N A N C I A L I N S I G H T S |
Commercial Loans Held-for-Investment
The following table provides information on our portfolio of commercial mezzanine and subordinate loans held-for-investment at September 30, 2015.
|
| | | | | | | | | | | | | |
|
Commercial Loans Held-for-Investment |
September 30, 2015 |
Property Type | Number of Loans | | Original Weighted Average DSCR (1) | | Original Weighted Average LTV (2) | |
Average Loan Size ($ in millions) | |
| | | | | | | | |
Multifamily | 25 |
| | 1.30 |
| | 79 | % | | $ | 4 |
| |
Hospitality | 11 |
| | 1.39 |
| | 66 | % | | 7 |
| |
Office | 12 |
| | 1.22 |
| | 77 | % | | 7 |
| |
Retail | 10 |
| | 1.18 |
| | 77 | % | | 6 |
| |
Self Storage | 3 |
| | 1.39 |
| | 75 | % | | 6 |
| |
Other | 4 |
| | 1.43 |
| | 76 | % | | 3 |
| |
| | | | | | | | |
Total portfolio | 65 |
| | 1.29 |
| | 75 | % | | $ | 5.13 |
| |
| |
(1) | The debt service coverage ratio (DSCR) is defined as the property’s annual net operating income divided by the annual principal and interest payments. The weighted average DSCRs in this table are based on the ratios at the time the loans were originated and are not based on subsequent time periods during which there may have been increases or decreases in each property’s operating income. |
| |
(2) | The loan-to-value (LTV) calculation is defined as the sum of the senior and all subordinate loan amounts divided by the value of the property at the time the loan was originated. |
During the third quarter of 2015, we originated three commercial mezzanine and subordinate loans for $13 million, as compared to one mezzanine loan for $2 million in the second quarter of 2015. At September 30, 2015, our unsecuritized and securitized portfolios of commercial mezzanine and subordinate loans held-for-investment had an outstanding principal balance of $329 million (excluding A/B-notes), unamortized discount of $4 million, an allowance for loan losses of $7 million, and a carrying value of $317 million.
At September 30, 2015, we had $72 million of short-term borrowings outstanding under commercial warehouse facilities, secured by $132 million of mezzanine and subordinate loans.
At September 30, 2015, we had $68 million outstanding of non-recourse, asset-backed debt issued at our Commercial Securitization, at a stated interest rate of 5.62% (excluding deferred issuance costs), which provided financing for commercial loans with a carrying value of $180 million. See Table 8 in the Financial Tables section of the Appendix to this Redwood Review for additional detail on our consolidated variable interest entities, including our Commercial Securitization.
|
|
|
THE REDWOOD REVIEW I 3RD QUARTER 2015 |
31 |
|
|
|
F I N A N C I A L I N S I G H T S |
On average, our commercial mezzanine loans held-for-investment have a maturity of more than four years and an unlevered yield of approximately 10% per annum before credit costs.
At September 30, 2015, we had one loan with a carrying value of $25 million on our watch list. The loan is current and we expect to receive all amounts due according to the contractual terms of the loan.
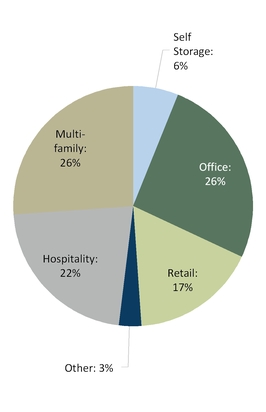
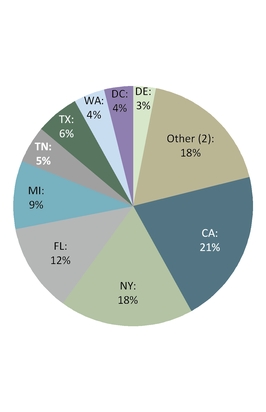
The following charts present the property types and geographic locations of the commercial real estate underlying our portfolio of commercial mezzanine and subordinate loans held-for-investment at September 30, 2015.
|
| | | | | | |
Property Type (1) | | Property Location (1) | |
|
|
(1) Percentages based on outstanding loan balances |
|
(2) Other includes NJ, AL, CO, MN, WV, AR, and RI each with less than 3%; and 11 other states each with less than 1% |
|
|
|
THE REDWOOD REVIEW I 3RD QUARTER 2015 |
32 |
|
|
|
F I N A N C I A L I N S I G H T S |
Mortgage Servicing Rights (MSRs)
The following table presents the change in fair value and associated loan principal of MSRs held during the third and second quarters of 2015.
|
| | | | | | | | | | | | | | | | |
|
MSRs |
($ in millions) |
| Three Months Ended | |
| 9/30/2015 | | 6/30/2015 | |
| Fair Value | | Associated Principal | | Fair
Value | | Associated
Principal | |
| | | | | | | | |
Beginning fair value | $ | 168 |
| | $ | 15,066 |
| | $ | 120 |
| | $ | 12,653 |
| |
Additions | 23 |
| | 2,134 |
| | 32 |
| | 2,998 |
| |
Sales | — |
| | — |
| | — |
| | — |
| |
Change in fair value due to: | | | | | | | | |
Changes in basis (1) | (5 | ) | | (465 | ) | | (3 | ) | | (585 | ) | |
Changes in interest rates (2) | (24 | ) | | — |
| | 19 |
| | — |
| |
| | | | | | | | |
Ending fair value | $ | 163 |
| | $ | 16,735 |
| | $ | 168 |
| | $ | 15,066 |
| |
| |
(1) | Primarily represents changes due to the receipt of expected cash flows during the quarter. |
| |
(2) | Primarily reflects changes in prepayment assumptions due to changes in benchmark interest rates. |
During the third quarter of 2015, we added $23 million of MSRs, including $15 million of MSRs retained through our residential mortgage banking operations and $7 million of purchased MSRs.
At September 30, 2015, we owned $54 million of jumbo MSRs and $109 million of conforming MSRs associated with residential loans that had aggregate principal balances of $5.9 billion and $10.8 billion, respectively.
The GAAP carrying value, which is the estimated fair value of our MSRs, was equal to 0.97% of the aggregate principal balance of the associated residential loans at September 30, 2015, as compared to 1.12% at June 30, 2015. At September 30, 2015, the 60-day-plus delinquency rate (by current principal balance) of loans associated with our MSR investments was 0.29%.
We earn fees from these MSRs, but outsource the actual servicing of the associated loans to third-party servicers.
|
|
|
THE REDWOOD REVIEW I 3RD QUARTER 2015 |
33 |
|
|
|
F I N A N C I A L I N S I G H T S |
Corporate Long-Term Debt
At September 30, 2015, RWT Holdings, Inc., a wholly-owned taxable REIT subsidiary of Redwood Trust, Inc., had $205 million of exchangeable senior notes outstanding at a stated interest rate of 5.625% (excluding deferred issuance costs) that are exchangeable for 46.1798 shares of Redwood Trust, Inc. common stock per $1,000 principal amount (equivalent to an exchange price of $21.65 per common share and subject to certain adjustments) on or before their maturity in November 2019.
In addition, at September 30, 2015, we had $288 million of convertible senior notes outstanding at a stated interest rate of 4.625% (excluding deferred issuance costs) that are convertible into 41.1320 shares of common stock per $1,000 principal amount (equivalent to a conversion price of $24.31 per common share and subject to certain adjustments) on or before their maturity in April 2018.
At September 30, 2015, we had $140 million of other long-term debt outstanding, due in 2037, with a stated interest rate of three-month LIBOR plus 225 basis points (excluding deferred issuance costs). In 2010, we effectively fixed the interest rate on this long-term debt at approximately 6.75% (excluding deferred issuance costs) through interest rate swaps.
|
|
|
THE REDWOOD REVIEW I 3RD QUARTER 2015 |
34 |
|
|
|
R E D W O O D' S B U S I N E S S O V E R V I E W |
Redwood’s Business
Redwood is focused on investing in mortgage- and other real estate-related assets and engaging in residential and commercial mortgage banking activities. We have established and maintain residential and commercial operating platforms that act as intermediaries between mortgage borrowers and investors, with the goal of creating our own steady sources of attractive investments and fee-generating opportunities. We believe these platforms take advantage of the strength of our balance sheet and the talents and extensive relationships of the professionals who make up our residential and commercial teams.
We are structured as a REIT for federal tax purposes. Our REIT holds most of our mortgage-related investments, due to the tax advantages afforded to REITs. Our mortgage-banking activities are conducted through taxable REIT subsidiaries that pay corporate income taxes. We operate and report on our businesses through three segments - Residential Mortgage Banking, Residential Investments, and Commercial Mortgage Banking and Investments. Each of these segments is further described below.
Residential Mortgage Banking
Our Residential Mortgage Banking segment primarily consists of operating a mortgage loan conduit that acquires residential loans from third-party originators for subsequent sale. We typically acquire prime, jumbo mortgages and the related mortgage servicing rights on a flow basis from our network of loan sellers and distribute those loans through our Sequoia private-label securitization program or to institutions that acquire pools of whole loans. We also acquire conforming loans (defined as loans eligible for sale to Fannie Mae and Freddie Mac) and the related servicing rights on a flow basis from our seller network. Conforming loans we acquire are generally sold to Fannie Mae or Freddie Mac. We occasionally supplement our flow purchases with bulk loan acquisitions.
This segment’s main source of revenue is income from mortgage banking activities, which includes valuation increases (or gains) on the sale or securitization of loans, and from hedges used to manage risks associated with these activities. Additionally, this segment may generate interest income on loans held pending securitization or sale. Funding expenses, direct operating expenses, and tax expenses associated with these activities are also included in this segment.
|
|
|
THE REDWOOD REVIEW I 3RD QUARTER 2015 |
36 |
|
|
|
R E D W O O D' S B U S I N E S S O V E R V I E W |
Residential Investments
Our Residential Investments segment includes a portfolio of investments in residential mortgage-backed securities (RMBS) retained from our Sequoia securitizations, as well as RMBS issued by third parties. In addition, this segment includes a subsidiary of Redwood Trust that is a member of the Federal Home Loan Bank of Chicago (FHLBC) and that utilizes attractive long-term financing from the FHLBC to make long-term investments directly in residential mortgage loans. Finally, this segment includes MSRs associated with residential loans we have sold or securitized, as well as MSRs purchased from third parties.
This segment’s main source of revenue is net interest income from portfolio securities and loans held-for-investment, as well as income from MSRs. Additionally, this segment may realize gains upon the sale of securities. Funding expenses, hedging expenses, direct operating expenses, and tax expenses associated with these activities are also included in this segment.
Commercial Mortgage Banking and Investments
Our Commercial Mortgage Banking and Investments segment consists primarily of a mortgage loan conduit that originates senior commercial loans for subsequent sale to third-party CMBS sponsors or other investors. In addition to senior loans, we offer complimentary forms of commercial real estate financing directly to borrowers that may include mezzanine loans, subordinate mortgage loans, and other financing solutions. We typically hold the mezzanine and other subordinate loans we originate in our commercial investment portfolio.
This segment’s main sources of revenue are mortgage banking income, which includes valuation increases (or gains) on the sale of senior commercial loans and associated hedges, and net interest income from mezzanine or subordinate loans held in our investment portfolio. Funding expenses, direct operating expenses, and tax expenses associated with these activities are also included in this segment.
|
|
|
THE REDWOOD REVIEW I 3RD QUARTER 2015 |
37 |
|
|
|
D I V I D E N D P O L I C Y |
Dividend Policy
Summary
As a REIT, Redwood is required to distribute to shareholders at least 90% of its REIT taxable income, excluding net capital gains. REIT taxable income is defined as taxable income earned at Redwood and its qualified REIT subsidiaries and certain pass-through entities. To the extent Redwood retains REIT taxable income, it is taxed at corporate tax rates. Redwood also earns taxable income at its taxable REIT subsidiaries (TRS), which it is not required to distribute.
Dividend Policy Overview
Our Board of Directors has maintained a policy of paying regular quarterly dividends, although we have not been required to distribute dividends in recent years in order to comply with the provisions of the Internal Revenue Code applicable to REITs. In November 2014, the Board of Directors announced its intention to pay a regular dividend of $0.28 per share per quarter in 2015. During the first, second and third quarters of 2015, the Board of Directors declared and paid regular quarterly dividends of $0.28 per share. In November 2015, the Board of Directors declared a regular dividend of $0.28 per share for the fourth quarter of 2015, which is payable on December 29, 2015 to shareholders of record on December 17, 2015.
Our Board’s practice has been to announce its intention with respect to the regular quarterly dividend for the upcoming calendar year towards the end of the fourth quarter of each year, following the review of our business and strategy at our Board’s annual year-end retreat. The consistency and sustainability of the dividend over time has always been an important consideration and priority. In recent years, the quarterly dividend rate has not been directly tied to GAAP or REIT taxable earnings for any particular quarter. In addition, in deliberating about dividends, the Board has generally considered numerous factors, including management’s projections for the company’s GAAP and REIT taxable earnings, and also projections of cash flows, capital, and liquidity. For example, in 2011, no change to the dividend rate was made, even though our earnings were lower than the quarterly dividend, as we invested in building our residential and commercial platforms.
|
|
|
THE REDWOOD REVIEW I 3RD QUARTER 2015 |
38 |
|
|
|
D I V I D E N D P O L I C Y |
Dividend Distribution Requirement
Our estimated REIT taxable income was $24 million, or $0.29 per share, for the third quarter of 2015 and $18 million, or $0.21 per share, for the second quarter of 2015. Under normal circumstances, our minimum REIT dividend requirement would be 90% of our annual REIT taxable income. However, we currently maintain a federal $70 million net operating loss carry forward (NOL) at the REIT that affords us the option of retaining REIT taxable income up to the NOL amount, tax free, rather than distributing it as dividends. Federal income tax rules require the dividends paid deduction to be applied to reduce taxable income before the applicability of NOLs is considered. We do not expect our estimated REIT taxable income to exceed our dividend distributions in 2015; therefore, our entire NOL will likely carry forward into 2016.
Income Tax Characterization of Dividend for Shareholders
Irrespective of our minimum distribution requirement, federal income tax rules require that the actual dividends we distribute in 2015 be taxed at the shareholder level based on our full-year 2015 taxable income plus net capital gains before application of any loss carry forwards. Based on this requirement, we expect much of the dividends we distribute in 2015 will be taxable as ordinary income to shareholders and a smaller portion to be a return of capital, which is generally non-taxable. None of Redwood’s 2015 dividend distributions are expected to be characterized as long-term capital gains for federal income tax purposes. Factors that significantly affect the taxation of our 2015 dividends to shareholders include but are not limited to: (i) capital gains on sales of securities and (ii) the timing of realized credit losses on legacy investments.
(i)For the nine months ended September 30, 2015, we realized net capital gains of $24 million at the REIT level for tax purposes. Net capital gains generated by the REIT for the entire year could increase the portion of our 2015 dividends that are characterized as ordinary income to our shareholders. However, if the REIT realized net capital losses for 2015, those losses would have no effect on the taxability of our 2015 dividends. None of our 2015 dividend distributions are expected to be characterized as long-term capital gains, based on applicable federal income tax rules.
(ii)Our estimated REIT taxable income for the nine months ended September 30, 2015 included $5 million of realized credit losses on legacy investments that were taken in previous periods for GAAP reporting purposes. We anticipate an additional $27 million of tax credit losses to be realized over an estimated three to five-year period based on the securities we currently own. This is a decrease from $34 million at December 31, 2014 and $59 million at December 31, 2013. Even though the impact of realized losses on our current period taxable income is declining, our GAAP earnings, which have provisioned for these losses in prior periods, will likely continue to exceed our REIT taxable income.
|
|
|
THE REDWOOD REVIEW I 3RD QUARTER 2015 |
39 |
A-NOTES
A-Notes are senior interests in commercial mortgage debt which are promissory notes secured by either a deed of trust or a mortgage. A-Notes are senior to any subordinate financing, such as B-Notes, and mezzanine financing. See B-Notes and Mezzanine Loan definitions.
ADJUSTABLE-RATE MORTGAGES (ARM)
Adjustable-rate mortgages (“ARMs”) are loans that have coupons that adjust at least once per year. We make a distinction between ARMs (loans with a rate adjustment at least annually) and hybrids (loans that have a fixed-rate period of 2-10 years and then become adjustable-rate).
AGENCY
Agency refers to government-sponsored enterprises (“GSEs”), including Federal National Mortgage Association (“Fannie Mae”), Federal Home Loan Mortgage Corporation (“Freddie Mac”), and Government National Mortgage Association (“Ginnie Mae”).
ALT-A SECURITIES and ALT-A LOANS
Alt-A securities are residential mortgage-backed securities backed by loans that have higher credit quality than subprime and lower credit quality than prime. Alt-A originally represented loans with alternative documentation, but the definition has shifted over time to include loans with additional risk characteristics and in some cases investor loans. In an Alt-A loan, the borrower’s income may not be verified, and in some cases, may not be disclosed on the loan application. Alt-A loans may also have expanded criteria that allow for higher debt-to-income ratios with higher accompanying loan-to-value ratios than would otherwise be permissible for prime loans.
AMORTIZED COST
Amortized cost is the initial acquisition cost of an available-for-sale (“AFS”) security, minus principal repayments or principal reductions through credit losses, plus or minus premium or discount amortization. At the point in time an AFS security is deemed other-than-temporarily impaired, the amortized cost is adjusted (by changing the amount of unamortized premium or discount) by the amount of other-than temporary impairment taken through the income statement.
ASSET-BACKED SECURITIES (ABS)
Asset-backed securities (“ABS”) are securities backed by financial assets that generate cash flows. Each ABS issued from a securitization entity has a unique priority with respect to receiving principal and interest cash flows and absorbing any credit losses from the assets owned by the entity.
|
|
|
THE REDWOOD REVIEW I 3RD QUARTER 2015 |
40 |
AVAILABLE-FOR-SALE (AFS)
An accounting method for debt and equity securities in which the securities are reported at their fair value. Positive changes in the fair value are accounted for as increases to stockholders’ equity and do not flow through the income statement. Negative changes in fair value may be recognized through the income statement or balance sheet.
B-NOTES
B-Notes are subordinate interests in commercial mortgage debt which are either (i) evidenced by a subordinated promissory note secured by the same mortgage that also secures the senior debt relating to the same property or (ii) junior participation interests in mortgage debt that are subordinate to senior participation interests in the same mortgage debt. B-Notes typically provide the holder with certain rights to approve modifications to related lending agreements and to trigger foreclosure under the mortgage following an event of default. B-Notes also typically provide the holder certain limited rights to cure a borrower default under senior debt secured by the same mortgage in order to keep the senior debt current and avoid foreclosure.
BOOK VALUE (GAAP)
Book value is the value of our common equity in accordance with GAAP.
COMMERCIAL MORTGAGE-BACKED SECURITIES (CMBS)
A type of mortgage-backed security that is secured by one or more loans on commercial properties.
CONFORMING LOAN
A conforming loan is a mortgage loan that conforms to the underwriting standards of Fannie Mae and Freddie Mac, including the maximum loan limit, which is currently $417,000 except in defined high-cost areas of the country, where the limit is higher. Changes to this maximum loan limit are announced annually by the Federal Housing Finance Agency (“FHFA”), which is the regulator and conservator of both Fannie Mae and Freddie Mac.
CONSTANT (or CONDITIONAL) PREPAYMENT RATE (CPR)
Constant (or conditional) prepayment rate (“CPR”) is an industry-standard measure of the speed at which mortgage loans prepay. It approximates the annual percentage rate at which a pool of loans is paying down due to unscheduled principal prepayments.
CREDIT SUPPORT
Credit support is the face amount of securities subordinate (or junior) to the applicable security that protects the security from credit losses and is generally expressed as a percentage of the securitization’s underlying pool balance.
|
|
|
THE REDWOOD REVIEW I 3RD QUARTER 2015 |
41 |
DEBT
Debt is an obligation of Redwood. See Long-term debt and Short-term debt.
FALLOUT
The percentage of loans that an originator plans or commits to sell to a buyer that ultimately do not close and are not delivered to the buyer.
FASB
Financial Accounting Standards Board.
FHFA
The FHFA refers to the Federal Housing Finance Authority.
FHLB and FHLBC
The FHLB refers to the Federal Home Loan Bank system. The FHLBC refers to the Federal Home Loan Bank of Chicago.
FORWARD SALE COMMITMENT
A contract pertaining to the future sale of a loan at a specified price and within a specified time period. Mortgage bankers often use forward sale commitments to hedge interest rate risk between the date they agree to buy and the date in which the loan is sold, which is often between 30 and 60 days. This commitment qualifies as a derivative in accordance with GAAP. Any change in the value of this forward sale commitment is recorded as a market valuation adjustment in mortgage banking activities.
GAAP
Generally Accepted Accounting Principles in the United States.
GOVERNMENT-SPONSORED ENTERPRISE (GSE)
A government-sponsored enterprise is a financial services corporation created by the United States Congress to enhance the flow of credit to targeted sectors of the economy. Among the GSEs chartered by Congress are Fannie Mae, Freddie Mac, Ginnie Mae, and the Federal Home Loan Banks. When we refer to GSEs, we are generally referring to Fannie Mae and Freddie Mac.
|
|
|
THE REDWOOD REVIEW I 3RD QUARTER 2015 |
42 |
INTEREST-ONLY SECURITIES (IOs)
Interest-only securities (“IOs”) are specialized securities created by securitization entities where the projected cash flows generated by the underlying assets exceed the cash flows projected to be paid to the securities that are issued with principal balances. Typically, IOs do not have a principal balance and they will not receive principal payments. Interest payments to IOs usually equal an interest rate formula multiplied by a “notional” principal balance. The notional principal balances for IOs are typically reduced over time as the actual principal balance of the underlying pool of assets pays down, thus reducing the cash flows to the IOs over time. Cash flows on IOs are typically reduced more quickly when asset prepayments increase.
INVESTMENT CAPACITY
The amount of capacity we estimate that we have to invest in new assets. Our estimate of our investment capacity takes into account, among other things, cash on hand, cash we estimate we could raise by prudently increasing short-term borrowings, and cash needed to cover short-term operations, working capital, and a liquidity cushion.
JUMBO LOAN
A jumbo loan is a residential mortgage loan that generally conforms to the underwriting standards of Fannie Mae and Freddie Mac except that the dollar amount of the loan exceeds the conforming loan limit set annually by the FHFA. See Conforming Loan Definition.
LEVERAGE RATIOS
Leverage ratios measure financial leverage and are used to assess a company’s ability to meet its financial obligations. Financial leverage ratios are often expressed as debt to equity and assets to equity. In the mortgage banking industry, financial leverage is most commonly calculated using debt to equity. At Redwood, the two financial leverage ratios used are consolidated GAAP debt to equity and recourse debt to equity. The former calculation includes the consolidated ABS issued from certain Sequoia securitization entities (generally those issued prior to 2012) even though those obligations are not financial obligations of Redwood but are obligations of each the consolidated securitization trusts and are payable only from the cash flow from the assets owned by each of those trusts. The latter calculation of recourse debt to equity excludes debt related to consolidated securitizations and only includes debt for which Redwood has an obligation to repay. Both ratios are calculated at the bottom of Table 4: Book Value and Financial Ratios in the Appendix section.
|
|
|
THE REDWOOD REVIEW I 3RD QUARTER 2015 |
43 |
LOAN PURCHASE COMMITMENT
A commitment to purchase a residential mortgage loan from a mortgage loan originator at a specified price and within a specified time period. A “best efforts” loan purchase commitment becomes effective once the originator has closed the loan with the borrower. A “mandatory” loan purchase commitment becomes effective once the commitment is entered into among the buyer and the originator, regardless if the originator has closed the loan. Mortgage buyers such as Redwood often issue 30 to 60 day loan purchase commitments to loan originators so they can in turn offer a similar commitments to their borrowers. To hedge interest rate risk during the commitment period, buyers will often enter in to a forward sale commitment or hedge the risk using derivatives. (See Forward Sale Commitment definition.) A loan purchase commitment for a conforming loan qualifies as a derivative in accordance with GAAP. Beginning January 1, 2015, our loan purchase commitment for a non-conforming loan qualifies as a derivative in accordance with GAAP. Any change in the value of a loan purchase commitment is recorded as a market valuation adjustment in mortgage banking activities.
LONG-TERM DEBT
Long-term debt is debt that is an obligation of Redwood that is not payable within a year and includes convertible debt, junior subordinated notes and trust preferred securities. We generally treat long-term debt as part of our capital base when it is not payable in the near future.
MARK-TO-MARKET (MTM) ACCOUNTING
Mark-to-market (“MTM”) accounting uses estimated fair values of assets, liabilities, and hedges. Many assets on our consolidated balance sheet are carried at their fair value rather than amortized cost. Taxable income is generally not affected by market valuation adjustments.
MARKET VALUATION ADJUSTMENTS (MVAs)
Market valuation adjustments (“MVAs”) are changes in market values for certain assets and liabilities that are reported through our GAAP income statement. They include all changes in market values for assets and liabilities accounted for at fair value, such as trading securities and derivatives. They also include the credit portion of other-than-temporary impairments on securities available-for-sale, as well as impairments of loans held-for-sale and REO properties.
MEZZANINE LOAN
A mezzanine loan is a loan secured by the membership interests, partnership interests, and/or stock in a single purpose entity formed to own a commercial property, for example. If the mezzanine borrower fails to make its payments or otherwise defaults under the mezzanine loan documents, the mezzanine lender may pursue its remedies, including taking control of the single purpose entity that owns the property.
|
|
|
THE REDWOOD REVIEW I 3RD QUARTER 2015 |
44 |
MEZZANINE SECURITIES
Mezzanine securities are a type of subordinate security and refer to the securities in a residential mortgage-backed securitization that are rated AA, A, and BBB. They rank junior to the AAA securities, and senior to the securities rated below BBB which typically include BB and B rated securities, and any non-rated securities.
MORTGAGE SERVICING RIGHT (MSR)
A mortgage servicing right (“MSR”) gives the holder the contractual right to service a mortgage loan. MSRs typically include the right to collect monthly mortgage principal and interest payments, as well as related tax and insurance payments, from borrowers, disburse funds to the mortgage debt holders and remit related insurance and tax payments, collect late payments, and process modifications and foreclosures. MSRs are created when mortgage loans are sold in a transaction in which the seller retains the right to service the loans. The holder of an MSR receives a monthly servicing fee (which generally ranges from 0.25% to 0.375% per annum of the outstanding principal balance of the related mortgage loan), which is deducted from the borrower’s monthly interest payments. For accounting purposes, MSRs are capitalized at the net present value of the servicing fee less the servicing cost. When Redwood holds MSRs relating to residential mortgage loans, it retains a sub-servicer to carry out actual servicing functions, as Redwood does not directly service residential mortgage loans.
MPF DIRECT
MPF Direct is the Federal Home Loan Bank of Chicago’s Mortgage Partnership Finance ("MPF") Direct program. Members of the FHLB system that are eligible to participate in the MPF Direct program ("MPF Direct sellers") sell high-balance loans to Redwood through this program, which we also refer to us as our MPF Direct channel.
NON-PRIME SECURITIES
Non-prime securities are Alt-A, option ARM, and subprime securities. See definitions of Alt-A, option ARM, and subprime securities.
NON-RECOURSE DEBT
Debt that is secured by collateral, typically real property, but for which the borrower is not personally liable. If the borrower defaults, the lender may seize the collateral, but cannot seek out the borrower for any further compensation, even if the collateral does not cover the full value of the defaulted amount.
|
|
|
THE REDWOOD REVIEW I 3RD QUARTER 2015 |
45 |
OPTION ARM LOAN
An option ARM loan is a residential mortgage loan that generally offers a borrower monthly payment options such as: 1) a minimum payment that results in negative amortization; 2) an interest-only payment; 3) a payment that would fully amortize the loan over an original 31-year amortization schedule; and, 4) a payment that would fully amortize the loan over a 15-year amortization schedule. To the extent the borrower has chosen an option that is not fully amortizing the loan (or negatively amortizing the loan), after a period – usually five years or once the negatively amortized loan balance reaches a certain level (generally 15% to 25% higher than the original balance) – the loan payments are recast. This recast provision resets the payment at a level that fully amortizes the loan over its remaining life and the new payment may be materially different than under the borrowers’ previous option.
PREFERRED EQUITY
A preferred equity investment is an investment in preferred equity of a special purpose entity that directly or indirectly owns a commercial property. An investor in preferred equity is typically entitled to a preferred return (relative to a holder of common equity of the same entity) and has the right, if the preferred return is not paid, to take control of the entity (and thereby control the underlying commercial property).
PRIME RESIDENTIAL REAL ESTATE LOANS
Prime loans are residential loans with higher quality credit characteristics, such as borrowers with higher FICO credit scores, lower loan-to-value ratios, lower debt-to-income ratios, greater levels of other assets, and more documentation.
PRIME SECURITIES
Prime securities are residential mortgage-backed securities backed by prime loans, generally with balances greater than conforming loan limits. Prime securities are typically backed by loans that have relatively high weighted average FICO scores (e.g., 700 or higher at origination), low weighted average LTVs (e.g., 75% or less at origination), limited concentrations of investor properties, and low percentages of loans with low FICO scores or high loan-to-value ratios.
|
|
|
THE REDWOOD REVIEW I 3RD QUARTER 2015 |
46 |
PRINCIPAL-ONLY SECURITIES (POs)
Principal-only securities (“POs”) are specialized securities created by securitization entities where the holder is only entitled to receive regular cash flows that are derived from incoming principal repayments on an underlying mortgage loan pool. This security is created by splitting a mortgage-backed security into its interest and principal payments. The principal payments create a string of cash flows which are sold at a discount to investors. These investors will receive the principal portions of the monthly mortgage payments from the underlying pool of loans. The yield on a PO strip depends on the prepayment speed of the underlying loan. The faster the principal is repaid, the higher the yield an investor will receive.
PROFITABILITY RATIOS
Many financial institution analysts use asset-based profitability ratios such as interest rate spread and interest rate margin when analyzing financial institutions. These are asset-based measures. Since we consolidate the assets and liabilities of certain securitization entities for GAAP purposes, our total GAAP assets and liabilities may vary over time, and may not be comparable to assets typically used in profitability calculations for other financial institutions. As a result, we believe equity-based profitability ratios may be more appropriate than asset-based measures for analyzing Redwood’s operations and results. We provide various profitability ratios in Table 4 in the Financial Tables in this Review.
REAL ESTATE INVESTMENT TRUST (REIT)
A real estate investment trust (“REIT”) is an entity that makes a tax election to be taxed as a REIT, invests in real estate assets, and meets other REIT qualifications, including the distribution as dividends of at least 90% of its REIT taxable income, excluding net capital gains. A REIT’s profits are not taxed at the corporate level to the extent that these profits are distributed as dividends to stockholders, providing an operating cost savings. On the other hand, the requirement to pay out as dividends most of the REIT’s taxable profits means it can be harder for a REIT to grow using only internally-generated funds (as opposed to raising new capital).
REAL ESTATE OWNED (REO)
Real estate owned (“REO”) refers to real property owned by the lender or loan owner that has been acquired through foreclosure.
REIT SUBSIDIARY
A REIT subsidiary is a subsidiary of a REIT that is taxed as a REIT, also referred to as a qualified REIT subsidiary.
|
|
|
THE REDWOOD REVIEW I 3RD QUARTER 2015 |
47 |
REIT TAXABLE INCOME
REIT taxable income is not a measure calculated in accordance with GAAP. REIT taxable income is income calculated for tax purposes at Redwood including only its qualified REIT subsidiaries (i.e., excluding its taxable subsidiaries, with certain adjustments). REIT taxable income is an important measure as it is the basis of our dividend distribution requirements. We must annually distribute at least 90% of REIT taxable income, excluding net capital gains, as dividends to shareholders. As a REIT, we are not subject to corporate income taxes on the REIT taxable income we distribute. We pay corporate income tax on the REIT taxable income we retain, if any (and we are permitted to retain up to 10% of total REIT taxable income, plus net capital gains).
REMIC
A real estate mortgage investment conduit (“REMIC”) is a special purpose vehicle used to pool real estate mortgages and issue mortgage-backed securities. REMICs are typically exempt from tax at the entity level. REMICs may invest only in qualified mortgages and permitted investments, including single family or multifamily mortgages, commercial mortgages, second mortgages, mortgage participations, and federal agency pass-through securities.
RE-REMIC SECURITY
A Re-REMIC is a re-securitization of asset-backed securities. The cash flows from and any credit losses absorbed by the underlying assets can be redirected to the resulting Re-REMIC securities in a variety of ways.
RESECURITIZATION
A resecuritization is a securitization of two or more mortgage-backed securities into a new mortgage-backed security.
RESIDENTIAL MORTGAGE-BACKED SECURITIES (RMBS)
A type of mortgage-backed security that is backed by a pool of mortgages on residential properties.
RETURN ON EQUITY (ROE)
ROE is the amount of profit we generate each year per dollar of equity capital and equals GAAP income divided by GAAP equity.
|
|
|
THE REDWOOD REVIEW I 3RD QUARTER 2015 |
48 |
SENIOR SECURITIES
Generally, senior securities have the least credit risk in a securitization transaction because they are generally the last securities to absorb credit losses. In addition, the senior securities have the highest claim on the principal and interest payments (after the fees to servicers and trustees are paid). To further reduce credit risk, most if not all, principal collected from the underlying asset pool is used to pay down the senior securities until certain performance tests are satisfied. If certain performance tests are satisfied, principal payments are shared between the senior securities and the subordinate securities, generally on a pro rata basis. At issuance, senior securities are generally triple A-rated.
SEQUOIA
Sequoia is the brand name for securitizations of residential real estate loans Redwood sponsors. Sequoia entities are independent securitization entities that acquire residential mortgage loans and create and issue asset-backed securities (“ABS”) backed by these loans. Most of the loans that Sequoia entities acquire are prime-quality loans. Most of the senior ABS created by Sequoia are sold to third-party investors. Redwood usually acquires most of the subordinated ABS and may also acquire the interest-only securities (“IOs”).
SHORT-TERM DEBT
Short-term debt is debt that is an obligation of Redwood and payable within a year. We may obtain this debt from a variety of Wall Street firms, banks, and other institutions. We may issue these or other forms of short term debt in the future. We may use short-term debt to finance the accumulation of assets prior to sale to a securitization entity and to finance investments in loans and securities.
SUBORDINATE DEBT INVESTMENTS
Subordinate Debt Investments mean Mezzanine Loans, Preferred Equity, and B-Notes.
SUBORDINATE SECURITIES (JUNIOR SECURITIES or NON-SENIOR SECURITIES)
Subordinate securities absorb the initial credit losses from a securitization structure, thus protecting the senior securities. Subordinate securities have a lower priority to receive principal and interest payments than the senior securities. Subordinate securities receive little, if any, principal payments until certain performance tests are satisfied. If certain performance tests are satisfied, principal payments are shared between the senior securities and the subordinate securities, generally on a pro rata basis. Subordinate securities generally receive interest payments even if they do not receive principal payments. At issuance, subordinate securities are generally rated double-A or below.
|
|
|
THE REDWOOD REVIEW I 3RD QUARTER 2015 |
49 |
SUBPRIME SECURITIES
Subprime securities are residential mortgage-backed securities backed by loans to borrowers who typically have lower credit scores and/or other credit deficiencies that prevent them from qualifying for prime or Alt-A mortgages and may have experienced credit problems in the past, such as late payments or bankruptcies. To compensate for the greater risks and higher costs to service the loans, subprime borrowers pay higher interest rates, points, and origination fees.
TAXABLE INCOME
Taxable income is not a measure calculated in accordance with GAAP. Taxable income is income for Redwood and all its subsidiaries as calculated for tax purposes. Taxable income calculations differ significantly from GAAP income calculations. A reconciliation of taxable income to GAAP income appears in Table 3 in the Financial Tables in this Review.
TAXABLE SUBSIDIARY
A taxable subsidiary is a subsidiary of a REIT that is not taxed as a REIT and thus pays taxes on its income. A taxable subsidiary is not limited to investing in real estate and it can choose to retain all of its after-tax profits.
TO BE ANNOUNCED (TBA)
A term used to describe a forward Agency mortgage-backed securities trade. Pass-through securities issued by Freddie Mac, Fannie Mae and Ginnie Mae trade in the TBA market. The term TBA is derived from the fact that the actual mortgage-backed security that will be delivered to fulfill a TBA trade is not designated at the time the trade is made. The securities are “to be announced” 48 hours prior to the established trade settlement date.
|
|
|
THE REDWOOD REVIEW I 3RD QUARTER 2015 |
50 |
|
|
|
THE REDWOOD REVIEW I 3RD QUARTER 2015 |
51 |
|
| | | | | | | | | | | | | | | | | | | | | | | | | | | | | | | | | | | | | | | | | | | | | | |
| Table 1: GAAP Earnings (in thousands, except per share data) | |
| | | | | | | | | | | | | | | | | | | | | | | | |
| | 2015 Q3 | | 2015
Q2 | | 2015
Q1 | | 2014
Q4 | | 2014
Q3 | | 2014
Q2 | | 2014
Q1 | | 2013
Q4 | | 2013
Q3 | | | Nine Months 2015 | | Nine Months 2014 | |
Interest income | $ | 54,191 |
| | $ | 53,857 |
| | $ | 53,713 |
| | $ | 56,029 |
| | $ | 53,324 |
| | $ | 48,347 |
| | $ | 45,145 |
| | $ | 48,331 |
| | $ | 50,139 |
| | | $ | 161,761 |
| | $ | 146,816 |
| |
Discount amortization on securities, net | 9,115 |
| | 9,324 |
| | 9,838 |
| | 10,061 |
| | 10,890 |
| | 10,586 |
| | 11,298 |
| | 10,311 |
| | 8,785 |
| | | 28,277 |
| | 32,774 |
| |
Discount (premium) amortization on loans, net | 178 |
| | 192 |
| | 195 |
| | (839 | ) | | (863 | ) | | (940 | ) | | (967 | ) | | (1,150 | ) | | (1,504 | ) | | | 565 |
| | (2,770 | ) | |
Total interest income | 63,484 |
| | 63,373 |
| | 63,746 |
| | 65,251 |
| | 63,351 |
| | 57,993 |
| | 55,476 |
| | 57,492 |
| | 57,420 |
| | | 190,603 |
| | 176,820 |
| |
Interest expense on short-term debt | (7,627 | ) | | (6,527 | ) | | (7,224 | ) | | (8,581 | ) | | (8,441 | ) | | (5,142 | ) | | (3,827 | ) | | (3,715 | ) | | (5,227 | ) | | | (21,378 | ) | | (17,409 | ) | |
Interest expense on ABS issued from consolidated trusts | (5,190 | ) | | (5,645 | ) | | (6,202 | ) | | (6,765 | ) | | (7,838 | ) | | (8,183 | ) | | (8,441 | ) | | (8,903 | ) | | (9,604 | ) | | | (17,037 | ) | | (24,462 | ) | |
Interest expense on long-term debt | (11,058 | ) | | (10,836 | ) | | (10,535 | ) | | (8,557 | ) | | (7,071 | ) | | (7,826 | ) | | (6,792 | ) | | (6,910 | ) | | (6,894 | ) | | | (32,429 | ) | | (21,689 | ) | |
Total interest expense | (23,875 | ) | | (23,008 | ) | | (23,961 | ) | | (23,903 | ) | | (23,350 | ) | | (21,151 | ) | | (19,060 | ) | | (19,528 | ) | | (21,725 | ) | | | (70,844 | ) | | (63,560 | ) | |
Net interest income | 39,609 |
| | 40,365 |
| | 39,785 |
| | 41,348 |
| | 40,001 |
| | 36,842 |
| | 36,416 |
| | 37,964 |
| | 35,695 |
| | | 119,759 |
| | 113,260 |
| |
(Provision for) reversal of provision for loan losses – Residential | — |
| | — |
| | — |
| | (1,562 | ) | | 708 |
| | 604 |
| | (627 | ) | | (3,374 | ) | | (883 | ) | | | — |
| | 685 |
| |
(Provision for) reversal of provision for loan losses – Commercial | 60 |
| | 261 |
| | (206 | ) | | (27 | ) | | 888 |
| | (289 | ) | | (655 | ) | | (869 | ) | | (844 | ) | | | 115 |
| | (56 | ) | |
Net interest income after provision | 39,669 |
| | 40,626 |
| | 39,579 |
| | 39,759 |
| | 41,597 |
| | 37,157 |
| | 35,132 |
| | 33,721 |
| | 33,968 |
| | | 119,874 |
| | 113,889 |
| |
Non-interest income | | | | | | | | | | | | | | | | | | | | | | | |
Mortgage banking and investment activities, net | | | | | | | | | | | | | | | | | | | | | | | |
Residential mortgage banking | 331 |
| | 4,833 |
| | 2,217 |
| | 9,850 |
| | 11,430 |
| | 1,342 |
| | (1,067 | ) | | 10,114 |
| | (12,236 | ) | | | 7,381 |
| | 11,704 |
| |
Commercial mortgage banking | 1,002 |
| | 2,613 |
| | (292 | ) | | 1,140 |
| | 6,486 |
| | 4,981 |
| | 833 |
| | 6,818 |
| | 3,538 |
| | | 3,323 |
| | 12,300 |
| |
Investments | (14,169 | ) | | (1,787 | ) | | (1,147 | ) | | 3,817 |
| | (3,750 | ) | | (4,134 | ) | | (6,136 | ) | | 390 |
| | 462 |
| | | (17,103 | ) | | (14,020 | ) | |
Mortgage servicing rights income (loss), net | | | | | | | | | | | | | | | | | | | | | | | |
MSR servicing fee income | 8,715 |
| | 7,292 |
| | 8,487 |
| | 6,281 |
| | 4,153 |
| | 3,776 |
| | 3,318 |
| | 3,261 |
| | 2,653 |
| | | 24,494 |
| | 11,247 |
| |
MSR market valuation adjustments | (28,717 | ) | | 15,352 |
| | (19,411 | ) | | (15,192 | ) | | 1,668 |
| | (5,553 | ) | | (2,712 | ) | | 2,367 |
| | 460 |
| | | (32,776 | ) | | (6,597 | ) | |
MSR derivatives valuation adjustments (1) | 23,551 |
| | (21,814 | ) | | — |
| | — |
| | — |
| | — |
| | — |
| | — |
| | — |
| | | 1,737 |
| | — |
| |
Realized gains, net | 5,548 |
| | 6,316 |
| | 4,306 |
| | 4,790 |
| | 8,532 |
| | 1,063 |
| | 1,092 |
| | 1,968 |
| | 10,469 |
| | | 16,170 |
| | 10,687 |
| |
Other income | 327 |
| | 1,299 |
| | 809 |
| | 181 |
| | 1,600 |
| | — |
| | — |
| | — |
| | — |
| | | 2,435 |
| | 1,600 |
| |
Total non-interest income (loss), net | (3,412 | ) | | 14,104 |
| | (5,031 | ) | | 10,867 |
| | 30,119 |
| | 1,475 |
| | (4,671 | ) | | 24,918 |
| | 5,346 |
| | | 5,661 |
| | 26,921 |
| |
Fixed compensation expense | (8,642 | ) | | (9,286 | ) | | (9,155 | ) | | (7,948 | ) | | (7,445 | ) | | (6,872 | ) | | (6,792 | ) | | (5,750 | ) | | (5,808 | ) | | | (27,083 | ) | | (21,109 | ) | |
Variable compensation expense | (3,567 | ) | | (3,578 | ) | | (3,991 | ) | | (6,462 | ) | | (2,418 | ) | | (3,021 | ) | | (2,731 | ) | | (3,908 | ) | | (5,621 | ) | | | (11,136 | ) | | (8,170 | ) | |
Equity compensation expense | (2,835 | ) | | (3,539 | ) | | (2,738 | ) | | (2,335 | ) | | (2,261 | ) | | (2,824 | ) | | (2,330 | ) | | (2,196 | ) | | (1,997 | ) | | | (9,112 | ) | | (7,415 | ) | |
Severance expense | — |
| | — |
| | — |
| | (5 | ) | | (4 | ) | | (222 | ) | | — |
| | — |
| | (445 | ) | | | — |
| | (226 | ) | |
Other operating expense | (9,453 | ) | | (8,815 | ) | | (9,179 | ) | | (9,712 | ) | | (9,278 | ) | | (9,343 | ) | | (8,119 | ) | | (7,816 | ) | | (8,449 | ) | | | (27,447 | ) | | (26,740 | ) | |
Total operating expenses | (24,497 | ) | | (25,218 | ) | | (25,063 | ) | | (26,462 | ) | | (21,406 | ) | | (22,282 | ) | | (19,971 | ) | | (19,670 | ) | | (22,320 | ) | | | (74,778 | ) | | (63,660 | ) | |
Other expense | — |
| | — |
| | — |
| | — |
| | — |
| | — |
| | — |
| | (12,000 | ) | | — |
| | | — |
| | — |
| |
Benefit from (provision for) income taxes | 7,404 |
| | (2,448 | ) | | 5,316 |
| | 2,959 |
| | (5,213 | ) | | (333 | ) | | 1,843 |
| | (1,835 | ) | | 4,935 |
| | | 10,272 |
| | (3,703 | ) | |
Net income | $ | 19,164 |
| | $ | 27,064 |
| | $ | 14,801 |
| | $ | 27,123 |
| | $ | 45,097 |
| | $ | 16,017 |
| | $ | 12,333 |
| | $ | 25,134 |
| | $ | 21,929 |
| | | $ | 61,029 |
| | $ | 73,447 |
| |
Diluted average shares | 85,075 |
| | 94,950 | | 85,622 | | 85,384 | | 96,956 | | 85,033 | | 84,941 | | 84,395 | | 84,422 | | | 85,339 |
| | 85,031 | |
Net income per share | $ | 0.22 |
| | $ | 0.31 |
| | $ | 0.16 |
| | $ | 0.31 |
| | $ | 0.50 |
| | $ | 0.18 |
| | $ | 0.14 |
| | $ | 0.29 |
| | $ | 0.25 |
| | | $ | 0.69 |
| | $ | 0.84 |
| |
(1) During the second quarter of 2015, we began to include market valuation changes of derivatives associated with our MSRs in MSR income (loss), net. Prior to the second quarter of 2015, valuation adjustments of MSR hedges
were presented in mortgage banking and investment activities, net.
|
| | |
THE REDWOOD REVIEW I 3RD QUARTER 2015 | | Table 1: GAAP Earnings 52 |
|
| | | | | | | | | | | | | | | | | | | | | | | | | | | | | | | | | | | | | | | | | | | |
| Table 2: Segment Results (in thousands) |
| | | | | | | | | | | | | | | | | | | | | | | |
| | | Three Months Ended September 30, 2015 | | | Three Months Ended June 30, 2015 | |
| | | Residential Mortgage Banking | | Residential Investments | | Commercial Mortgage Banking and Investments | | Corporate/ Other | | Total | | | Residential Mortgage Banking | | Residential Investments | | Commercial Mortgage Banking and Investments | | Corporate/ Other | | Total | |
Interest income | | $ | 12,115 |
| | $ | 34,074 |
| | $ | 11,191 |
| | $ | 6,104 |
| | $ | 63,484 |
| | | $ | 9,976 |
| | $ | 34,249 |
| | $ | 12,679 |
| | $ | 6,469 |
| | $ | 63,373 |
| |
Interest expense | | (4,313 | ) | | (2,660 | ) | | (3,502 | ) | | (13,400 | ) | | (23,875 | ) | | | (3,298 | ) | | (2,660 | ) | | (3,497 | ) | | (13,553 | ) | | (23,008 | ) | |
Net interest income (loss) | | 7,802 |
| | 31,414 |
| | 7,689 |
| | (7,296 | ) | | 39,609 |
| | | 6,678 |
| | 31,589 |
| | 9,182 |
| | (7,084 | ) | | 40,365 |
| |
| | | | | | | | | | | | | | | | | | | | | | | |
Reversal of provision for loan losses | | — |
| | — |
| | 60 |
| | — |
| | 60 |
| | | — |
| | — |
| | 261 |
| | — |
| | 261 |
| |
Net interest income (loss) after provision | | 7,802 |
| | 31,414 |
| | 7,749 |
| | (7,296 | ) | | 39,669 |
| | | 6,678 |
| | 31,589 |
| | 9,443 |
| | (7,084 | ) | | 40,626 |
| |
Non-interest income | | | | | | | | | | | | | | | | | | | | | | |
Mortgage banking and investment activities, net | | 331 |
| | (13,622 | ) | | 1,002 |
| | (547 | ) | | (12,836 | ) | | | 4,833 |
| | (1,104 | ) | | 2,614 |
| | (684 | ) | | 5,659 |
| |
MSR income (loss), net | | — |
| | 3,549 |
| | — |
| | — |
| | 3,549 |
| | | — |
| | 830 |
| | — |
| | — |
| | 830 |
| |
Other income | | — |
| | 327 |
| | — |
| | — |
| | 327 |
| | | — |
| | 1,299 |
| | — |
| | — |
| | 1,299 |
| |
Realized gains, net | | — |
| | 5,548 |
| | — |
| | — |
| | 5,548 |
| | | — |
| | 6,316 |
| | — |
| | — |
| | 6,316 |
| |
Total non-interest income (loss) | | 331 |
| | (4,198 | ) | | 1,002 |
| | (547 | ) | | (3,412 | ) | | | 4,833 |
| | 7,341 |
| | 2,614 |
| | (684 | ) | | 14,104 |
| |
| | | | | | | | | | | | | | | | | | | | | | | |
Operating expenses | | (11,278 | ) | | (1,311 | ) | | (3,136 | ) | | (8,772 | ) | | (24,497 | ) | | | (11,033 | ) | | (1,171 | ) | | (3,020 | ) | | (9,994 | ) | | (25,218 | ) | |
Benefit from (provision for) income taxes | | 2,690 |
| | 4,082 |
| | (389 | ) | | 1,021 |
| | 7,404 |
| | | 865 |
| | (3,768 | ) | | (143 | ) | | 598 |
| | (2,448 | ) | |
Segment contribution | | $ | (455 | ) | | $ | 29,987 |
| | $ | 5,226 |
| | $ | (15,594 | ) | | | | | $ | 1,343 |
| | $ | 33,991 |
| | $ | 8,894 |
| | $ | (17,164 | ) | | | |
Net income | | | | | | | | | | $ | 19,164 |
| | | | | | | | | | | $ | 27,064 |
| |
| | | | | | | | | | | | | | | | | | | | | | | |
Additional information: | | | | | | | | | | | | | | | | | | | | | | |
Residential loans | | $ | 1,506,151 |
| | $ | 1,360,277 |
| | $ | — |
| | $ | 1,170,246 |
| | $ | 4,036,674 |
| | | $ | 892,081 |
| | $ | 1,157,285 |
| | $ | — |
| | $ | 1,237,114 |
| | $ | 3,286,480 |
| |
Commercial loans | | — |
| | — |
| | 468,157 |
| | — |
| | 468,157 |
| | | — |
| | — |
| | 551,331 |
| | — |
| | 551,331 |
| |
Real estate securities | | — |
| | 1,085,224 |
| | — |
| | — |
| | 1,085,224 |
| | | — |
| | 1,157,599 |
| | — |
| | — |
| | 1,157,599 |
| |
Mortgage servicing rights | | — |
| | 162,726 |
| | — |
| | — |
| | 162,726 |
| | | — |
| | 168,462 |
| | — |
| | — |
| | 168,462 |
| |
Total Assets | | 1,563,306 |
| | 2,723,955 |
| | 475,924 |
| | 1,505,841 |
| | 6,269,026 |
| | | 938,720 |
| | 2,559,481 |
| | 560,956 |
| | 1,536,727 |
| | 5,595,884 |
| |
| | | | | | | | | | | | | | | | | | | | | | | |
|
| | |
THE REDWOOD REVIEW I 3RD QUARTER 2015 | | Table 2: Segment Results 53 |
|
| | | | | | | | | | | | | | | | | | | | | | | | | | | | | | | | | | | | | |
| Table 3: Taxable and GAAP Income (1) Differences and Dividends (in thousands, except for per share data) | |
| | | | | | | | | | | | | | | | | | | |
| | Estimated Nine Months 2015 (2) | | Actual Twelve Months 2014 (2) | | Actual Twelve Months 2013 (2) | |
| | Taxable Income | | GAAP Income | | Differences | | Taxable Income | | GAAP Income | | Differences | | Taxable Income | | GAAP Income | | Differences | |
Taxable and GAAP Income Differences | | | | | | | | | | | | | | | | | | |
Interest income | $ | 164,699 |
| | $ | 190,603 |
| | $ | (25,904 | ) | | $ | 206,214 |
| | $ | 242,070 |
| | $ | (35,856 | ) | | $ | 209,317 |
| | $ | 226,156 |
| | $ | (16,839 | ) | |
Interest expense | (58,324 | ) | | (70,844 | ) | | 12,520 |
| | (67,208 | ) | | (87,463 | ) | | 20,255 |
| | (55,099 | ) | | (80,971 | ) | | 25,872 |
| |
Net interest income | 106,375 |
| | 119,759 |
| | (13,384 | ) | | 139,006 |
| | 154,607 |
| | (15,601 | ) | | 154,218 |
| | 145,185 |
| | 9,033 |
| |
Reversal of provision (provision for) loan losses | — |
| | 115 |
| | (115 | ) | | — |
| | (961 | ) | | 961 |
| | — |
| | (4,737 | ) | | 4,737 |
| |
Realized credit losses | (4,947 | ) | | — |
| | (4,947 | ) | | (6,734 | ) | | — |
| | (6,734 | ) | | (12,911 | ) | | — |
| | (12,911 | ) | |
Mortgage banking and investment activities, net | (32,111 | ) | | (6,399 | ) | | (25,712 | ) | | 3,498 |
| | 24,792 |
| | (21,294 | ) | | 19,526 |
| | 96,785 |
| | (77,259 | ) | |
MSR income (loss), net | 36,706 |
| | (6,545 | ) | | 43,251 |
| | 15,763 |
| | (4,261 | ) | | 20,024 |
| | 8,218 |
| | 20,309 |
| | (12,091 | ) | |
Operating expenses | (81,066 | ) | | (74,778 | ) | | (6,288 | ) | | (97,435 | ) | | (90,123 | ) | | (7,312 | ) | | (79,361 | ) | | (86,607 | ) | | 7,246 |
| |
Other income (expense), net | 1,625 |
| | 2,435 |
| | (810 | ) | | (8,219 | ) | | 1,781 |
| | (10,000 | ) | | — |
| | (12,000 | ) | | 12,000 |
| |
Realized gains, net | — |
| | 16,170 |
| | (16,170 | ) | | — |
| | 15,478 |
| | (15,478 | ) | | — |
| | 25,259 |
| | (25,259 | ) | |
(Provision for) benefit from income taxes | (11 | ) | | 10,272 |
| | (10,283 | ) | | (132 | ) | | (744 | ) | | 612 |
| | (283 | ) | | (10,948 | ) | | 10,665 |
| |
Income | $ | 26,571 |
| | $ | 61,029 |
| | $ | (34,458 | ) | | $ | 45,747 |
| | $ | 100,569 |
| | $ | (54,822 | ) | | $ | 89,407 |
| | $ | 173,246 |
| | $ | (83,839 | ) | |
| | | | | | | | | | | | | | | | | | |
REIT taxable income | $ | 56,440 |
| | | | | | $ | 63,989 |
| | | | | | $ | 72,429 |
| | | | | |
Taxable (loss) income at taxable subsidiaries | (29,869 | ) | | | | | | (18,242 | ) | | | | | | 16,978 |
| | | | | |
Taxable income | $ | 26,571 |
| | | | | | $ | 45,747 |
| | | | | | $ | 89,407 |
| | | | | |
| | | | | | | | | | | | | | | | | | |
Shares used for taxable EPS calculation | 82,125 |
| | | | | | 83,443 |
| | | | | | 82,505 |
| | | | | |
REIT taxable income per share (3) | $ | 0.68 |
| | | | | | $ | 0.77 |
| | | | | | $ | 0.88 |
| | | | | |
Taxable income (loss) per share at taxable subsidiaries | $ | (0.35 | ) | | | | | | $ | (0.22 | ) | | | | | | $ | 0.21 |
| | | | | |
Taxable income per share (3) | $ | 0.33 |
| | | | | | $ | 0.55 |
| | | | | | $ | 1.09 |
| | | | | |
| | | | | | | | | | | | | | | | | | |
Dividends | | | | | | | | | | | | | | | | | | |
Dividends declared | $ | 70,322 |
| | | | | | $ | 92,935 |
| | | | | | $ | 92,005 |
| | | | | |
Dividends per share (4) | $ | 0.84 |
| | | | | | $ | 1.12 |
| | | | | | $ | 1.12 |
| | | | | |
| |
(1) | Taxable income for 2015 is an estimate until we file our tax returns for this year. To the extent we expect to pay tax at the corporate level (generally as a result of activity at our taxable REIT subsidiaries), we are required to record a tax provision for GAAP reporting purposes. Any tax provision (or benefit) is not intended to reflect the actual amount we expect to pay (or receive as an income tax refund) as it is expected to be utilized in future periods, as GAAP income is earned at our TRS. We do not expect to generate excess inclusion income in 2015, but in the event we do, it is our intention to retain it at our TRS and not pass it through to our shareholders. |
| |
(2) | Reconciliation of GAAP income to taxable income (loss) for prior quarters is provided in the respective Redwood Reviews for those quarters. |
| |
(3) | REIT taxable income per share and taxable income (loss) per share are based on the number of shares outstanding at the end of each quarter. The annual REIT taxable income per share and taxable income (loss) per share are the sum of the four quarterly per share estimates. |
| |
(4) | Dividends in 2014 were characterized as 90% ordinary income (or $84 million), and 10% return of capital (or $9 million). Dividends in 2013 were characterized as 89% ordinary income (or $82 million), and 11% return of capital (or $10 million). The portion of Redwood's dividends characterized as a return of capital is not taxable to a shareholder and reduces a shareholder's basis for shares held at each quarterly distribution date, but not to below $0. |
|
| | |
THE REDWOOD REVIEW I 3RD QUARTER 2015 | | Table 3: Taxable and GAAP Income Differences and Dividends 54 |
|
| | | | | | | | | | | | | | | | | | | | | | | | | | | | | | | | | | | | | | | | | | | | | |
| Table 4: Financial Ratios and Book Value ($ in thousands, except per share data) | |
| | | | | | | | | | | | | | | | | | | | | | | |
| | 2015 Q3 | | 2015
Q2 | | 2015
Q1 | | 2014
Q4 | | 2014
Q3 | | 2014
Q2 | | 2014
Q1 | | 2013
Q4 | | 2013
Q3 | | Nine Months 2015 | | Nine Months 2014 | |
Financial performance ratios | | | | | | | | | | | | | | | | | | | | | | |
Net interest income | $ | 39,609 |
| | $ | 40,365 |
| | $ | 39,785 |
| | $ | 41,348 |
| | $ | 40,001 |
| | $ | 36,842 |
| | $ | 36,416 |
| | $ | 37,964 |
| | $ | 35,695 |
| | $ | 119,759 |
| | $ | 113,260 |
| |
Operating expenses | $ | (24,497 | ) | | $ | (25,218 | ) | | $ | (25,063 | ) | | $ | (26,462 | ) | | $ | (21,408 | ) | | $ | (22,282 | ) | | $ | (19,971 | ) | | $ | (19,670 | ) | | $ | (22,320 | ) | | $ | (74,778 | ) | | $ | (63,660 | ) | |
GAAP net income | $ | 19,164 |
| | $ | 27,064 |
| | $ | 14,801 |
| | $ | 27,123 |
| | $ | 45,096 |
| | $ | 16,017 |
| | $ | 12,333 |
| | $ | 25,134 |
| | $ | 21,929 |
| | $ | 61,029 |
| | $ | 73,447 |
| |
| | | | | | | | | | | | | | | | | | | | | | |
Average total assets | $ | 5,977,645 |
| | $ | 5,730,268 |
| | $ | 5,866,851 |
| | $ | 5,848,856 |
| | $ | 5,631,421 |
| | $ | 5,140,932 |
| | $ | 4,791,512 |
| | $ | 4,681,988 |
| | $ | 5,010,779 |
| | $ | 5,858,662 |
| | $ | 5,191,031 |
| |
Average total equity | $ | 1,244,327 |
| | $ | 1,265,647 |
| | $ | 1,262,883 |
| | $ | 1,259,581 |
| | $ | 1,254,352 |
| | $ | 1,245,346 |
| | $ | 1,243,006 |
| | $ | 1,217,273 |
| | $ | 1,217,418 |
| | $ | 1,257,552 |
| | $ | 1,247,610 |
| |
| | | | | | | | | | | | | | | | | | | | | | |
Operating expenses / average total assets | 1.64 | % | | 1.76 | % | | 1.71 | % | | 1.81 | % | | 1.52 | % | | 1.73 | % | | 1.67 | % | | 1.68 | % | | 1.78 | % | | 1.70 | % | | 1.64 | % | |
Operating expenses / average total equity | 7.87 | % | | 7.97 | % | | 7.94 | % | | 8.40 | % | | 6.83 | % | | 7.16 | % | | 6.43 | % | | 6.46 | % | | 7.33 | % | | 7.93 | % | | 6.80 | % | |
| | | | | | | | | | | | | | | | | | | | | | |
GAAP net income / average total assets | 1.28 | % | | 1.89 | % | | 1.01 | % | | 1.85 | % | | 3.20 | % | | 1.25 | % | | 1.03 | % | | 2.15 | % | | 1.75 | % | | 1.39 | % | | 1.89 | % | |
GAAP net income / average equity (GAAP ROE) | 6.16 | % | | 8.55 | % | | 4.69 | % | | 8.61 | % | | 14.38 | % | | 5.14 | % | | 3.97 | % | | 8.26 | % | | 7.21 | % | | 6.47 | % | | 7.85 | % | |
| | | | | | | | | | | | | | | | | | | | | | | |
Leverage ratios and book value per share | | | | | | | | | | | | | | | | | | | | | | |
Short-term debt | $ | 1,872,793 |
| | $ | 1,367,062 |
| | $ | 1,502,164 |
| | $ | 1,793,825 |
| | $ | 1,887,688 |
| | $ | 1,718,430 |
| | $ | 1,288,761 |
| | $ | 862,763 |
| | $ | 838,299 |
| | | | | |
Long-term debt – Commercial secured borrowing | 65,578 |
| | 65,232 |
| | 68,077 |
| | 66,707 |
| | 66,146 |
| | 66,692 |
| | 34,774 |
| | — |
| | — |
| | | | | |
Long-term debt – Other | 1,756,299 |
| | 1,514,122 |
| | 1,482,792 |
| | 1,127,860 |
| | 630,756 |
| | 479,916 |
| | 478,458 |
| | 476,467 |
| | 471,605 |
| | | | | |
Total debt at Redwood | $ | 3,694,670 |
| | $ | 2,946,416 |
| | $ | 3,053,033 |
| | $ | 2,988,392 |
| | $ | 2,584,590 |
| | $ | 2,265,038 |
| | $ | 1,801,993 |
| | $ | 1,339,230 |
| | $ | 1,309,904 |
| | | | | |
| | | | | | | | | | | | | | | | | | | | | | |
ABS issued at consolidated entities | | | | | | | | | | | | | | | | | | | | | | |
Residential Resecuritization ABS issued | 5,261 |
| | 18,872 |
| | 34,280 |
| | 45,044 |
| | 56,508 |
| | 69,709 |
| | 82,179 |
| | 94,934 |
| | 112,179 |
| | | | | |
Commercial Securitization ABS issued | 67,946 |
| | 69,914 |
| | 79,676 |
| | 83,313 |
| | 114,943 |
| | 144,700 |
| | 147,574 |
| | 153,693 |
| | 158,799 |
| | | | | |
Legacy Sequoia entities ABS issued | 1,105,588 |
| | 1,173,336 |
| | 1,239,065 |
| | 1,416,762 |
| | 1,484,751 |
| | 1,553,669 |
| | 1,624,591 |
| | 1,694,335 |
| | 1,790,687 |
| | | | | |
Total ABS issued | 1,178,795 |
| | 1,262,122 |
| | 1,353,021 |
| | 1,545,119 |
| | 1,656,202 |
| | 1,768,078 |
| | 1,854,344 |
| | 1,942,962 |
| | 2,061,665 |
| | | | | |
Consolidated GAAP Debt | $ | 4,873,465 |
| | $ | 4,208,538 |
| | $ | 4,406,054 |
| | $ | 4,533,511 |
| | $ | 4,240,792 |
| | $ | 4,033,116 |
| | $ | 3,656,337 |
| | $ | 3,282,192 |
| | $ | 3,371,569 |
| | | | | |
Stockholders' equity | $ | 1,206,575 |
| | $ | 1,264,785 |
| | $ | 1,257,210 |
| | $ | 1,256,142 |
| | $ | 1,266,678 |
| | $ | 1,248,904 |
| | $ | 1,250,887 |
| | $ | 1,245,783 |
| | $ | 1,207,170 |
| | | | | |
Debt at Redwood to stockholders' equity (1) | 3.1x |
| | 2.3x |
| | 2.4x |
| | 2.3x |
| | 2.0x |
| | 1.8x |
| | 1.4x |
| | 1.1x |
| | 1.1x |
| | | | | |
Consolidated GAAP debt to stockholders' equity | 4.0x |
| | 3.3x |
| | 3.5x |
| | 3.6x |
| | 3.4x |
| | 3.2x |
| | 2.9x |
| | 2.6x |
| | 2.8x |
| | | | | |
Shares outstanding at period end (in thousands) | 82,125 |
| | 84,552 |
| | 83,749 |
| | 83,443 |
| | 83,284 |
| | 83,080 |
| | 82,620 |
| | 82,505 |
| | 82,389 |
| | | | | |
Book value per share | $ | 14.69 |
| | $ | 14.96 |
| | $ | 15.01 |
| | $ | 15.05 |
| | $ | 15.21 |
| | $ | 15.03 |
| | $ | 15.14 |
| | $ | 15.10 |
| | $ | 14.65 |
| | | | | |
| | | | | | | | | | | | | | | | | | | | | | | |
(1) Excludes obligations of consolidated securitization entities, including legacy Sequoia securitizations completed prior to 2012, the residential resecuritization completed in 2011, and the commercial securitization completed in 2012. Also excludes commercial secured borrowings associated with commercial A-notes that were sold, but treated as secured borrowings under GAAP.
|
| | |
THE REDWOOD REVIEW I 3RD QUARTER 2015 | | Table 4: Financial Ratios and Book Value 55 |
|
| | | | | | | | | | | | | | | | | | | | | | | | | | | | | | | | | | | | | | | | | | | | | |
| Table 5: Average Balance Sheet ($ in thousands) | |
| | | | | | | | | | | | | | | | | | | | | | | |
| | 2015
Q3 | | 2015
Q2 | | 2015
Q1 | | 2014
Q4 | | 2014
Q3 | | 2014
Q2 | | 2014
Q1 | | 2013
Q4 | | 2013
Q3 | | Nine Months
2015 | | Nine Months
2014 | |
Real estate loans | | | | | | | | | | | | | | | | | | | | | | |
Residential loans, held-for-sale | $ | 1,295,017 |
| | $ | 1,080,448 |
| | $ | 1,292,153 |
| | $ | 1,433,059 |
| | $ | 1,268,231 |
| | $ | 739,934 |
| | $ | 518,054 |
| | $ | 554,467 |
| | $ | 860,923 |
| | $ | 1,222,550 |
| | $ | 844,820 |
| |
Residential loans, held-for-investment at Sequoias (1) | 1,191,702 |
| | 1,259,923 |
| | 1,362,612 |
| | 1,496,685 |
| | 1,570,425 |
| | 1,642,410 |
| | 1,711,438 |
| | 1,793,535 |
| | 1,910,814 |
| | 1,270,787 |
| | 1,640,908 |
| |
Residential loans, held-for-investment at Redwood | 1,167,534 |
| | 1,017,835 |
| | 667,543 |
| | 370,886 |
| | 100,409 |
| | — |
| | — |
| | — |
| | — |
| | 952,802 |
| | 33,837 |
| |
Commercial loans, held-for-sale | 134,658 |
| | 107,025 |
| | 137,977 |
| | 214,110 |
| | 170,156 |
| | 75,449 |
| | 68,169 |
| | 73,204 |
| | 67,999 |
| | 126,541 |
| | 104,965 |
| |
Commercial loans, held-for-investment, at fair value | 69,712 |
| | 72,524 |
| | 71,224 |
| | 70,663 |
| | 71,205 |
| | 69,565 |
| | 20,626 |
| | — |
| | — |
| | 71,148 |
| | 53,984 |
| |
Commercial loans, held-for-investment, at amortized cost | 322,989 |
| | 328,193 |
| | 336,258 |
| | 322,723 |
| | 349,288 |
| | 343,815 |
| | 343,705 |
| | 346,333 |
| | 347,633 |
| | 329,098 |
| | 345,623 |
| |
| | | | | | | | | | | | | | | | | | | | | | |
Senior residential securities | | | | | | | | | | | | | | | | | | | | | | |
Prime | 298,428 |
| | 331,394 |
| | 352,583 |
| | 388,577 |
| | 611,211 |
| | 835,987 |
| | 725,551 |
| | 586,675 |
| | 440,616 |
| | 327,270 |
| | 723,831 |
| |
Non-prime | 149,589 |
| | 156,383 |
| | 161,163 |
| | 164,940 |
| | 169,741 |
| | 171,033 |
| | 174,811 |
| | 178,994 |
| | 187,724 |
| | 155,669 |
| | 171,843 |
| |
Total senior residential securities | 448,017 |
| | 487,777 |
| | 513,746 |
| | 553,517 |
| | 780,952 |
| | 1,007,020 |
| | 900,362 |
| | 765,669 |
| | 628,340 |
| | 482,939 |
| | 895,674 |
| |
| | | | | | | | | | | | | | | | | | | | | | |
Residential Re-REMIC securities | 105,572 |
| | 103,384 |
| | 101,238 |
| | 106,433 |
| | 114,433 |
| | 115,746 |
| | 109,753 |
| | 102,836 |
| | 101,808 |
| | 103,414 |
| | 113,328 |
| |
| | | | | | | | | | | | | | | | | | | | | | |
Subordinate residential securities | 400,429 |
| | 429,827 |
| | 554,460 |
| | 521,647 |
| | 532,881 |
| | 530,273 |
| | 509,906 |
| | 492,708 |
| | 441,521 |
| | 461,008 |
| | 524,438 |
| |
| | | | | | | | | | | | | | | | | | | | | | |
Mortgage servicing rights | 168,208 |
| | 144,472 |
| | 128,001 |
| | 134,438 |
| | 81,968 |
| | 65,705 |
| | 62,943 |
| | 60,822 |
| | 55,622 |
| | 147,041 |
| | 70,275 |
| |
Total real estate assets | 5,303,838 |
| | 5,031,408 |
| | 5,165,212 |
| | 5,224,161 |
| | 5,039,948 |
| | 4,589,917 |
| | 4,244,956 |
| | 4,189,574 |
| | 4,414,660 |
| | 5,167,328 |
| | 4,627,852 |
| |
Cash and cash equivalents | 204,746 |
| | 222,362 |
| | 232,575 |
| | 182,372 |
| | 151,447 |
| | 131,557 |
| | 159,089 |
| | 167,453 |
| | 274,657 |
| | 219,792 |
| | 147,336 |
| |
Earning assets | 5,508,584 |
| | 5,253,770 |
| | 5,397,787 |
| | 5,406,533 |
| | 5,191,395 |
| | 4,721,474 |
| | 4,404,045 |
| | 4,357,027 |
| | 4,689,317 |
| | 5,387,120 |
| | 4,775,188 |
| |
Balance sheet mark-to-market adjustments | 132,059 |
| | 139,864 |
| | 138,547 |
| | 151,304 |
| | 162,695 |
| | 162,081 |
| | 153,975 |
| | 125,953 |
| | 119,498 |
| | 136,800 |
| | 159,616 |
| |
Earning assets – reported value | 5,640,643 |
| | 5,393,634 |
| | 5,536,334 |
| | 5,557,837 |
| | 5,354,090 |
| | 4,883,555 |
| | 4,558,020 |
| | 4,482,980 |
| | 4,808,815 |
| | 5,523,920 |
| | 4,934,804 |
| |
Other assets | 337,002 |
| | 336,634 |
| | 330,517 |
| | 291,019 |
| | 277,331 |
| | 257,377 |
| | 233,492 |
| | 199,008 |
| | 201,964 |
| | 334,742 |
| | 256,227 |
| |
Total assets | $ | 5,977,645 |
| | $ | 5,730,268 |
| | $ | 5,866,851 |
| | $ | 5,848,856 |
| | $ | 5,631,421 |
| | $ | 5,140,932 |
| | $ | 4,791,512 |
| | $ | 4,681,988 |
| | $ | 5,010,779 |
| | $ | 5,858,662 |
| | $ | 5,191,031 |
| |
| | | | | | | | | | | | | | | | | | | | | | | |
Short-term debt | $ | 1,693,263 |
| | $ | 1,380,965 |
| | $ | 1,590,179 |
| | $ | 1,868,906 |
| | $ | 1,873,704 |
| | $ | 1,329,568 |
| | $ | 1,006,349 |
| | $ | 893,481 |
| | $ | 1,150,917 |
| | $ | 1,555,180 |
| | $ | 1,406,384 |
| |
Residential Resecuritization ABS issued | 9,688 |
| | 24,269 |
| | 37,313 |
| | 48,687 |
| | 60,932 |
| | 73,617 |
| | 85,236 |
| | 99,940 |
| | 118,338 |
| | 23,655 |
| | 73,173 |
| |
Commercial Securitization ABS issued | 67,100 |
| | 75,283 |
| | 80,637 |
| | 85,089 |
| | 123,012 |
| | 142,400 |
| | 144,936 |
| | 150,716 |
| | 155,661 |
| | 74,291 |
| | 136,702 |
| |
Consolidated Sequoia ABS issued | 1,128,333 |
| | 1,195,749 |
| | 1,295,852 |
| | 1,437,258 |
| | 1,507,998 |
| | 1,577,888 |
| | 1,644,626 |
| | 1,722,583 |
| | 1,835,401 |
| | 1,206,031 |
| | 1,576,337 |
| |
Other liabilities | 238,303 |
| | 229,994 |
| | 354,375 |
| | 266,368 |
| | 243,917 |
| | 240,977 |
| | 186,997 |
| | 131,277 |
| | 82,748 |
| | 273,799 |
| | 224,172 |
| |
Other long-term debt | 1,596,631 |
| | 1,558,361 |
| | 1,245,612 |
| | 882,967 |
| | 567,506 |
| | 531,136 |
| | 480,362 |
| | 466,718 |
| | 450,296 |
| | 1,468,154 |
| | 526,653 |
| |
Total liabilities | 4,733,318 |
| | 4,464,621 |
| | 4,603,968 |
| | 4,589,275 |
| | 4,377,069 |
| | 3,895,586 |
| | 3,548,506 |
| | 3,464,715 |
| | 3,793,361 |
| | 4,601,110 |
| | 3,943,421 |
| |
| | | | | | | | | | | | | | | | | | | | | | |
Total equity | 1,244,327 |
| | 1,265,647 |
| | 1,262,883 |
| | 1,259,581 |
| | 1,254,352 |
| | 1,245,346 |
| | 1,243,006 |
| | 1,217,273 |
| | 1,217,418 |
| | 1,257,552 |
| | 1,247,610 |
| |
Total liabilities and equity | $ | 5,977,645 |
| | $ | 5,730,268 |
| | $ | 5,866,851 |
| | $ | 5,848,856 |
| | $ | 5,631,421 |
| | $ | 5,140,932 |
| | $ | 4,791,512 |
| | $ | 4,681,988 |
| | $ | 5,010,779 |
| | $ | 5,858,662 |
| | $ | 5,191,031 |
| |
| |
(1) | Residential loans held-for-investment at Sequoia is comprised of loans held in consolidated Sequoia entities. |
|
| | |
THE REDWOOD REVIEW I 3RD QUARTER 2015 | | Table 5: Average Balance Sheet 56 |
|
| | | | | | | | | | | | | | | | | | | | | | | | | | | | | | | | | | | | | | | | | | | | | | | | | | | | |
| Table 6: Balance & Yields by Portfolio (1) ($ in thousands) | |
| | | | | | | | | | | | | | | | | | | | | | | | | | | | |
| | 2015 Q3 | | 2015
Q2 | | 2015
Q1 | | 2014
Q4 | | 2014
Q3 | | 2014
Q2 | | | | | 2015
Q3 | | 2015
Q2 | | 2015
Q1 | | 2014
Q4 | | 2014
Q3 | | 2014
Q2 | |
Securities – Prime Senior | | | | | | | | | | | | | Securities – Subordinate | | | | | | | | | | | |
Principal balance | $ | 279,793 |
| | $ | 305,660 |
| | $ | 305,502 |
| | $ | 317,626 |
| | $ | 366,122 |
| | $ | 772,127 |
| | | Principal balance | | $ | 560,529 |
| | $ | 596,127 |
| | $ | 693,179 |
| | $ | 763,501 |
| | $ | 705,661 |
| | $ | 733,192 |
| |
Unamortized discount | (27,497 | ) | | (30,713 | ) | | (32,612 | ) | | (34,833 | ) | | (41,242 | ) | | (36,853 | ) | | | Unamortized discount | | (147,867 | ) | | (153,368 | ) | | (155,943 | ) | | (162,249 | ) | | (154,391 | ) | | (151,097 | ) | |
Credit reserve | (2,377 | ) | | (2,650 | ) | | (2,830 | ) | | (3,660 | ) | | (4,082 | ) | | (5,476 | ) | | | Credit reserve | | (32,865 | ) | | (36,804 | ) | | (39,060 | ) | | (41,561 | ) | | (43,346 | ) | | (50,315 | ) | |
Unrealized gains, net | 23,600 |
| | 29,090 |
| | 31,301 |
| | 34,682 |
| | 41,307 |
| | 44,329 |
| | | Unrealized gains, net | | 70,406 |
| | 67,858 |
| | 71,536 |
| | 61,589 |
| | 57,249 |
| | 48,755 |
| |
Interest-only securities | 29,062 |
| | 40,000 |
| | 62,320 |
| | 87,800 |
| | 97,321 |
| | 96,894 |
| | | Interest-only securities | | 247 |
| | 234 |
| | 283 |
| | 293 |
| | 289 |
| | 279 |
| |
Fair value | $ | 302,581 |
| | $ | 341,387 |
| | $ | 363,681 |
| | $ | 401,615 |
| | $ | 459,426 |
| | $ | 871,021 |
| | | Fair value | | $ | 450,450 |
| | $ | 474,047 |
| | $ | 569,995 |
| | $ | 621,573 |
| | $ | 565,462 |
| | $ | 580,814 |
| |
| | | | | | | | | | | | | | | | | | | | | | | | | | | |
Average amortized cost | $ | 298,428 |
| | $ | 331,394 |
| | $ | 352,583 |
| | $ | 388,577 |
| | $ | 611,211 |
| | $ | 835,987 |
| | | Mezzanine (3) | | | | | | | | | | | | | |
Interest income | $ | 6,722 |
| | $ | 8,252 |
| | $ | 9,506 |
| | $ | 10,434 |
| | $ | 13,229 |
| | $ | 15,080 |
| | | Average amortized cost | | $ | 271,554 |
| | $ | 290,927 |
| | $ | 421,731 |
| | $ | 408,600 |
| | $ | 421,111 |
| | $ | 415,418 |
| |
Annualized yield (2) | 9.01 | % | | 9.96 | % | | 10.78 | % | | 10.74 | % | | 8.66 | % | | 7.22 | % | | | Interest income | | $ | 3,561 |
| | $ | 3,895 |
| | $ | 5,392 |
| | $ | 5,092 |
| | $ | 5,308 |
| | $ | 5,325 |
| |
| | | | | | | | | | | | | | Annualized yield | | 5.25 | % | | 5.36 | % | | 5.11 | % | | 4.98 | % | | 5.04 | % | | 5.13 | % | |
Securities – Non-Prime Senior | | | | | | | | | | | | | | | | | | | | | | | | |
Principal balance | $ | 174,285 |
| | $ | 182,719 |
| | $ | 190,790 |
| | $ | 196,258 |
| | $ | 202,811 |
| | $ | 209,967 |
| | | Subordinate (3) | | | | | | | | | | | | | |
Unamortized discount | (25,505 | ) | | (27,533 | ) | | (29,791 | ) | | (31,491 | ) | | (33,675 | ) | | (36,387 | ) | | | Average amortized cost | | $ | 128,875 |
| | $ | 138,900 |
| | $ | 132,730 |
| | $ | 113,047 |
| | $ | 111,770 |
| | $ | 114,855 |
| |
Credit reserve | (8,964 | ) | | (9,175 | ) | | (9,027 | ) | | (9,644 | ) | | (9,894 | ) | | (9,697 | ) | | | Interest income | | $ | 4,087 |
| | $ | 4,225 |
| | $ | 4,237 |
| | $ | 4,413 |
| | $ | 4,135 |
| | $ | 4,131 |
| |
Unrealized gains, net | 18,224 |
| | 20,365 |
| | 22,902 |
| | 24,621 |
| | 26,980 |
| | 28,373 |
| | | Annualized yield | | 12.69 | % | | 12.17 | % | | 12.77 | % | | 15.61 | % | | 14.80 | % | | 14.39 | % | |
Interest-only securities | 6,514 |
| | 6,705 |
| | 7,454 |
| | 7,951 |
| | 7,758 |
| | 8,380 |
| | | | | | | | | | | | | | | | |
Fair value | $ | 164,554 |
| | $ | 173,081 |
| | $ | 182,328 |
| | $ | 187,695 |
| | $ | 193,980 |
| | $ | 200,636 |
| | | Residential Loans, held-for-investment (excludes legacy Sequoia) | | | | | | | |
| | | | | | | | | | | | | | | | | | | | | | | | | | | |
Average amortized cost | $ | 149,589 |
| | $ | 156,383 |
| | $ | 161,163 |
| | $ | 164,940 |
| | $ | 169,741 |
| | $ | 171,033 |
| | | Principal balance | | $ | 1,325,626 |
| | $ | 1,131,844 |
| | $ | 971,541 |
| | $ | 566,371 |
| | $ | 233,142 |
| | $ | — |
| |
Interest income | $ | 3,824 |
| | $ | 3,946 |
| | $ | 4,210 |
| | $ | 4,370 |
| | $ | 4,507 |
| | $ | 4,404 |
| | | Unrealized gains, net | | 34,651 |
| | 25,441 |
| | 28,903 |
| | 15,296 |
| | 5,509 |
| | — |
| |
Annualized yield | 10.23 | % | | 10.09 | % | | 10.45 | % | | 10.60 | % | | 10.62 | % | | 10.30 | % | | | Fair value | | $ | 1,360,277 |
| | $ | 1,157,285 |
| | $ | 1,000,444 |
| | $ | 581,667 |
| | $ | 238,651 |
| | $ | — |
| |
| | | | | | | | | | | | | | | | | | | | | | | | | | | |
Securities – Re-REMIC | | | | | | | | | | | | | Average amortized cost | | $ | 1,167,534 |
| | $ | 1,017,835 |
| | $ | 667,543 |
| | $ | 370,886 |
| | $ | 100,409 |
| | $ | — |
| |
Principal balance | $ | 192,215 |
| | $ | 193,221 |
| | $ | 194,296 |
| | $ | 195,098 |
| | $ | 206,212 |
| | $ | 223,389 |
| | | Interest income | | $ | 11,258 |
| | $ | 9,370 |
| | $ | 6,522 |
| | $ | 3,427 |
| | $ | 1,057 |
| | $ | — |
| |
Unamortized discount | (74,377 | ) | | (75,658 | ) | | (79,401 | ) | | (79,611 | ) | | (80,986 | ) | | (89,089 | ) | | | Annualized yield | | 3.86 | % | | 3.68 | % | | 3.91 | % | | 3.70 | % | | 4.21 | % | | N/A |
| |
Credit reserve | (11,135 | ) | | (13,071 | ) | | (12,667 | ) | | (15,202 | ) | | (16,553 | ) | | (17,788 | ) | | | | | | | | | | | | | | | | |
Unrealized gains, net | 60,936 |
| | 64,592 |
| | 67,011 |
| | 68,062 |
| | 67,444 |
| | 76,084 |
| | | Commercial Loans, held-for-investment at amortized cost | | | | | | |
Fair value | $ | 167,639 |
| | $ | 169,084 |
| | $ | 169,239 |
| | $ | 168,347 |
| | $ | 176,117 |
| | $ | 192,596 |
| | | Principal balance | | $ | 333,442 |
| | $ | 332,122 |
| | $ | 350,188 |
| | $ | 346,305 |
| | $ | 336,825 |
| | $ | 361,870 |
| |
| | | | | | | | | | | | | | Unamortized discount | | (4,278 | ) | | (4,476 | ) | | (4,668 | ) | | (4,863 | ) | | (2,253 | ) | | (2,327 | ) | |
Average amortized cost | $ | 105,572 |
| | $ | 103,384 |
| | $ | 101,238 |
| | $ | 106,433 |
| | $ | 114,433 |
| | $ | 115,746 |
| | | Credit reserve | | (7,341 | ) | | (7,401 | ) | | (7,662 | ) | | (7,456 | ) | | (7,429 | ) | | (8,317 | ) | |
Interest income | $ | 4,555 |
| | $ | 4,524 |
| | $ | 4,428 |
| | $ | 4,122 |
| | $ | 4,278 |
| | $ | 4,231 |
| | | Carrying value | | $ | 321,823 |
| | $ | 320,245 |
| | $ | 337,858 |
| | $ | 333,986 |
| | $ | 327,143 |
| | $ | 351,226 |
| |
Annualized yield | 17.26 | % | | 17.50 | % | | 17.50 | % | | 15.49 | % | | 14.95 | % | | 14.62 | % | | | | | | | | | | | | | | | | |
| | | | | | | | | | | | | | Average amortized cost | | $ | 322,989 |
| | $ | 328,193 |
| | $ | 336,258 |
| | $ | 322,723 |
| | $ | 349,288 |
| | $ | 343,815 |
| |
| | | | | | | | | | | | | | Interest income | | $ | 8,760 |
| | $ | 10,551 |
| | $ | 8,855 |
| | $ | 10,071 |
| | $ | 9,663 |
| | $ | 9,360 |
| |
| | | | | | | | | | | | | | Annualized yield | | 10.85 | % | | 12.86 | % | | 10.53 | % | | 12.48 | % | | 11.07 | % | | 10.89 | % | |
| |
(1) | Annualized yields for AFS securities portfolios are based on average amortized cost. |
| |
(2) | Yields for prime senior securities, includes investments in Sequoia IO securities, for which yields are calculated using fair value, as these are trading securities. |
| |
(3) | Mezzanine and subordinate together comprise our subordinate portfolio of securities. We have shown them separately to present their different yield profiles. |
|
| | |
THE REDWOOD REVIEW I 3RD QUARTER 2015 | | Table 6: Balances & Yields by Portfolio 57 |
|
| | | | | | | | | | | | | | | | | | | | | | | | | | | | | | | | | | | | | | | | | | | | | | | | | | | | | |
| Table 7: Securities and Loan Portfolio Activity ($ in thousands) | |
| | | | | | | | | | | | | | | | | | | | | | | | | | | | |
| 2015 Q3 | | 2015
Q2 | | 2015
Q1 | | | 2014
Q4 | | 2014
Q3 | | 2014
Q2 | | | | | 2015 Q3 | | 2015
Q2 | | 2015
Q1 | | 2014
Q4 | | 2014
Q3 | | 2014
Q2 | |
Securities – Prime Senior | | | | | | | | | | | | | | | Residential Loans, held-for-sale | | | | | | | | | | | | | |
Beginning fair value | $ | 341,387 |
| | $ | 363,681 |
| | $ | 401,615 |
| | | $ | 459,426 |
| | $ | 871,021 |
| | $ | 806,014 |
| | | Beginning carrying value | | $ | 892,081 |
| | $ | 1,094,885 |
| | $ | 1,342,520 |
| | $ | 1,502,429 |
| | $ | 1,107,877 |
| | $ | 774,936 |
| |
Acquisitions | — |
| | 34,686 |
| | 6,972 |
| | | 5,918 |
| | 3,522 |
| | 111,520 |
| | | Acquisitions | | 2,987,187 |
| | 2,847,135 |
| | 2,477,644 |
| | 2,755,689 |
| | 3,387,875 |
| | 1,790,909 |
| |
Sales | (3,623 | ) | | (44,157 | ) | | (15,091 | ) | | | (33,752 | ) | | (380,112 | ) | | (321 | ) | | | Sales | | (2,132,895 | ) | | (2,816,143 | ) | | (2,265,449 | ) | | (2,567,113 | ) | | (2,757,955 | ) | | (1,466,955 | ) | |
Effect of principal payments | (17,508 | ) | | (20,988 | ) | | (14,650 | ) | | | (16,922 | ) | | (34,879 | ) | | (41,144 | ) | | | Principal repayments | | (17,802 | ) | | (14,794 | ) | | (14,098 | ) | | (10,407 | ) | | (7,687 | ) | | (5,006 | ) | |
Change in fair value, net | (17,675 | ) | | 8,165 |
| | (15,165 | ) | | | (13,055 | ) | | (126 | ) | | (5,048 | ) | | | Transfers to held-for-investment | | (233,429 | ) | | (215,826 | ) | | (447,791 | ) | | (354,794 | ) | | (241,282 | ) | | — |
| |
Ending fair value | $ | 302,581 |
| | $ | 341,387 |
| | $ | 363,681 |
| | | $ | 401,615 |
| | $ | 459,426 |
| | $ | 871,021 |
| | | Changes in fair value, net | | 11,009 |
| | (3,176 | ) | | 2,058 |
| | 16,716 |
| | 13,601 |
| | 13,993 |
| |
| | | | | | | | | | | | | | | Ending fair value | | $ | 1,506,151 |
| | $ | 892,081 |
| | $ | 1,094,884 |
| | $ | 1,342,520 |
| | $ | 1,502,429 |
| | $ | 1,107,877 |
| |
| | | | | | | | | | | | | | | | | | | | | | | | | | | | |
Securities – Non-Prime Senior | | | | | | | | | | | | | | | Residential Loans, held-for-investment (excluding consolidated Sequoia Entities) | | | | | | | |
Beginning fair value | $ | 173,081 |
| | $ | 182,328 |
| | 187,695 |
| | | 193,980 |
| | $ | 200,636 |
| | $ | 201,726 |
| | | Beginning carrying value | | $ | 1,157,285 |
| | $ | 1,000,444 |
| | $ | 581,667 |
| | $ | 238,651 |
| | $ | — |
| | $ | — |
| |
Acquisitions | — |
| | — |
| | — |
| | | — |
| | (31 | ) | | 3,613 |
| | | Acquisitions | | — |
| | — |
| | — |
| | — |
| | 453 |
| | — |
| |
Sales | — |
| | — |
| | — |
| | | — |
| | — |
| | — |
| | | Principal repayments | | (39,514 | ) | | (53,104 | ) | | (30,902 | ) | | (12,060 | ) | | (2,092 | ) | | — |
| |
Effect of principal payments | (7,510 | ) | | (7,300 | ) | | (4,992 | ) | | | (6,066 | ) | | (6,495 | ) | | (5,593 | ) | | | Transfers from held-for-investment | | 233,429 |
| | 215,830 |
| | 447,791 |
| | 354,794 |
| | 241,282 |
| | — |
| |
Change in fair value, net | (1,017 | ) | | (1,947 | ) | | (375 | ) | | | (219 | ) | | (130 | ) | | 890 |
| | | Changes in fair value, net | | 9,077 |
| | (5,885 | ) | | 1,978 |
| | 282 |
| | (992 | ) | | — |
| |
Ending fair value | $ | 164,554 |
| | $ | 173,081 |
| | $ | 182,328 |
| | | $ | 187,695 |
| | $ | 193,980 |
| | $ | 200,636 |
| | | Ending fair value | | $ | 1,360,277 |
| | $ | 1,157,285 |
| | $ | 1,000,444 |
| | $ | 581,667 |
| | $ | 238,651 |
| | $ | — |
| |
| | | | | | | | | | | | | | | | | | | | | | | | | | | | |
Securities – Re-REMIC | | | | | | | | | | | | | | | Residential Loans, held-for-investment at Consolidated Sequoia Entities | | | | | | | | | |
Beginning fair value | $ | 169,084 |
| | $ | 169,239 |
| | $ | 168,347 |
| | | $ | 176,117 |
| | $ | 192,596 |
| | $ | 192,208 |
| | | Beginning carrying value | | $ | 1,237,114 |
| | $ | 1,304,426 |
| | $ | 1,474,386 |
| | $ | 1,546,507 |
| | $ | 1,616,504 |
| | $ | 1,689,994 |
| |
Acquisitions | — |
| | — |
| | — |
| | | — |
| | — |
| | — |
| | | Principal repayments | | (65,556 | ) | | (68,547 | ) | | (67,250 | ) | | (69,325 | ) | | (67,025 | ) | | (71,903 | ) | |
Sales | — |
| | — |
| | — |
| | | (10,060 | ) | | (9,458 | ) | | — |
| | | Charge-Offs | | — |
| | — |
| | — |
| | 2,133 |
| | 1,354 |
| | 994 |
| |
Effect of principal payments | (123 | ) | | (182 | ) | | (126 | ) | | | (66 | ) | | — |
| | — |
| | | Transfers to REO | | (893 | ) | | (1,241 | ) | | (1,916 | ) | | (2,338 | ) | | (3,988 | ) | | (2,094 | ) | |
Change in fair value, net | (1,322 | ) | | 27 |
| | 1,018 |
| | | 2,356 |
| | (7,021 | ) | | 388 |
| | | Loan loss (provision) reversal | | — |
| | — |
| | — |
| | (1,562 | ) | | 708 |
| | 605 |
| |
Ending fair value | $ | 167,639 |
| | $ | 169,084 |
| | $ | 169,239 |
| | | $ | 168,347 |
| | $ | 176,117 |
| | $ | 192,596 |
| | | Discount amortization, net | | — |
| | — |
| | — |
| | (1,029 | ) | | (1,046 | ) | | (1,092 | ) | |
| | | | | | | | | | | | | | | Adoption of ASU 2014-13 | | — |
| | — |
| | (103,649 | ) | | — |
| | — |
| | — |
| |
Securities – Subordinate (1) | | | | | | | | | | | | | | | Changes in fair value, net | | (419 | ) | | 2,476 |
| | 2,855 |
| | — |
| | — |
| | — |
| |
Beginning fair value | $ | 474,047 |
| | $ | 569,995 |
| | $ | 621,573 |
| | | $ | 565,462 |
| | $ | 580,814 |
| | $ | 543,060 |
| | | Ending fair value | | $ | 1,170,246 |
| | $ | 1,237,114 |
| | $ | 1,304,426 |
| | $ | 1,474,386 |
| | $ | 1,546,507 |
| | $ | 1,616,504 |
| |
Acquisitions | 9,423 |
| | 39,193 |
| | 25,943 |
| | | 54,722 |
| | 39,330 |
| | 26,361 |
| | | | | | | | | | | | | | | | |
Sales | (29,462 | ) | | (127,353 | ) | | (85,017 | ) | | | — |
| | (58,273 | ) | | — |
| | | Commercial Loans, held-for-sale | | | | | | | | | | |
Effect of principal payments | (4,715 | ) | | (4,176 | ) | | (5,179 | ) | | | (4,568 | ) | | (5,082 | ) | | (4,596 | ) | | | Beginning carrying value | | $ | 165,853 |
| | $ | 54,407 |
| | $ | 166,234 |
| | $ | 104,709 |
| | $ | 50,848 |
| | $ | 77,155 |
| |
Change in fair value, net | 1,157 |
| | (3,612 | ) | | 12,675 |
| | | 5,957 |
| | 8,673 |
| | 15,989 |
| | | Originations | | 167,510 |
| | 257,671 |
| | 92,713 |
| | 325,970 |
| | 340,200 |
| | 148,915 |
| |
Ending fair value | $ | 450,450 |
| | $ | 474,047 |
| | $ | 569,995 |
| | | $ | 621,573 |
| | $ | 565,462 |
| | $ | 580,814 |
| | | Sales | | (256,581 | ) | | (147,132 | ) | | (210,309 | ) | | (271,260 | ) | | (290,561 | ) | | (180,652 | ) | |
| | | | | | | | | | | | | | | Principal repayments | | — |
| | (80 | ) | | (88 | ) | | (329 | ) | | (83 | ) | | (83 | ) | |
Securities – Mezzanine (1) | | | | | | | | | | | | | | | Transfers to HFI | | — |
| | — |
| | — |
| | — |
| | — |
| | — |
| |
Beginning fair value | $ | 290,283 |
| | $ | 380,935 |
| | $ | 448,838 |
| | | $ | 411,784 |
| | $ | 425,202 |
| | $ | 395,196 |
| | | Changes in fair value, net | | 3,974 |
| | 987 |
| | 5,857 |
| | 7,144 |
| | 4,305 |
| | 5,513 |
| |
Acquisitions | 5,423 |
| | 22,744 |
| | 10,518 |
| | | 37,730 |
| | 33,985 |
| | 20,305 |
| | | Ending fair value | | $ | 80,756 |
| | $ | 165,853 |
| | $ | 54,407 |
| | $ | 166,234 |
| | $ | 104,709 |
| | $ | 50,848 |
| |
Sales | (24,980 | ) | | (105,590 | ) | | (85,017 | ) | | | — |
| | (50,961 | ) | | — |
| | | | | | | | | | | | | | | | |
Effect of principal payments | (1,946 | ) | | (2,010 | ) | | (2,585 | ) | | | (2,476 | ) | | (2,537 | ) | | (2,372 | ) | | | Commercial Loans, held-for-investment at amortized cost | | | | | | | | | |
Change in fair value, net | 3,428 |
| | (5,796 | ) | | 9,181 |
| | | 1,800 |
| | 6,095 |
| | 12,073 |
| | | Beginning carrying value | | $ | 320,245 |
| | $ | 337,858 |
| | $ | 333,986 |
| | $ | 327,143 |
| | $ | 351,226 |
| | $ | 349,274 |
| |
Ending fair value | $ | 272,208 |
| | $ | 290,283 |
| | $ | 380,935 |
| | | $ | 448,838 |
| | $ | 411,784 |
| | $ | 425,202 |
| | | Originations | | 12,869 |
| | 1,750 |
| | 7,600 |
| | 21,870 |
| | 26,140 |
| | 5,993 |
| |
|
| | | | | | | | | | | | | | Principal repayments | | (11,529 | ) | | (19,816 | ) | | (3,717 | ) | | (15,190 | ) | | (51,295 | ) | | (3,904 | ) | |
| | | | | | | | | | | | | | | Provision for loan losses | | 60 |
| | 261 |
| | (206 | ) | | (27 | ) | | 888 |
| | (289 | ) | |
| | | | | | | | | | | | | | | Discount/fee amortization | | 178 |
| | 192 |
| | 195 |
| | 190 |
| | 184 |
| | 152 |
| |
| | | | | | | | | | | | | | | Ending carrying value (2) | | $ | 321,823 |
| | 320,245 |
| | $ | 337,858 |
| | $ | 333,986 |
| | $ | 327,143 |
| | $ | 351,226 |
| |
| | | | | | | | | | | | | | | | | | | | | | | | | | | | |
| | | | | | | | | | | | | | | Mortgage Servicing Rights | | | | | | | | | | |
| | | | | | | | | | | | | | | Beginning carrying value | | $ | 168,462 |
| | $ | 120,324 |
| | $ | 139,293 |
| | $ | 135,152 |
| | $ | 71,225 |
| | $ | 64,971 |
| |
| | | | | | | | | | | | | | | Additions | | 22,760 |
| | 32,463 |
| | 18,754 |
| | 19,279 |
| | 61,606 |
| | 11,807 |
| |
| | | | | | | | | | | | | | | Sales | | — |
| | — |
| | (18,206 | ) | | — |
| | — |
| | — |
| |
| | | | | | | | | | | | | | | Changes in fair value, net | | (28,496 | ) | | 15,675 |
| | (19,517 | ) | | (15,138 | ) | | 2,321 |
| | (5,553 | ) | |
| | | | | | | | | | | | | | | Ending fair value | | $ | 162,726 |
| | $ | 168,462 |
| | $ | 120,324 |
| | $ | 139,293 |
| | $ | 135,152 |
| | $ | 71,225 |
| |
| | | | | | | | | | | | | | | | | | | | | | | | | | | | | |
| |
(1) | Securities-mezzanine are a component of securities-subordinate. They are broken-out to provide additional detail on this portion of the subordinate securities portfolio. |
| |
(2) | The carrying value of our commercial loans, held-for-investment at amortized cost excludes commercial A-notes, which are carried at fair value. |
|
| | |
THE REDWOOD REVIEW I 3RD QUARTER 2015 | | Table 7: Securities and Loan Portfolio Activity 58
|
|
| | | | | | | | | | | | | | | | | | | | | | | | | | | | | | | | | | | | | | | | | | | | | | | | | |
| Table 8: Consolidating Balance Sheet ($ in thousands) | |
| | | | | | | | | | | | | | | | | | | | | | | | | |
| As of September 30, 2015 | | As of June 30, 2015 | |
| | | Consolidated VIEs (1) | | | | | | Consolidated VIEs (1) | | | |
| At Redwood (1) | | Commercial Securitization | | Residential Resecuritization(2) | | Consolidated Sequoia Entities | | Total | | Redwood Consolidated | | At
Redwood (1) | | Commercial
Securitization | | Residential
Resecuritization(2) | | Consolidated
Sequoia
Entities | | Total | | Redwood
Consolidated | |
Residential loans | $ | 2,866,428 |
| | $ | — |
| | $ | — |
| | $ | 1,170,246 |
| | $ | 1,170,246 |
| | $ | 4,036,674 |
| | $ | 2,049,366 |
| | $ | — |
| | $ | — |
| | $ | 1,237,114 |
| | $ | 1,237,114 |
| | $ | 3,286,480 |
| |
Commercial loans (3) | 287,763 |
| | 180,394 |
| | — |
| | — |
| | 180,394 |
| | 468,157 |
| | 369,147 |
| | 182,184 |
| | — |
| | — |
| | 182,184 |
| | 551,331 |
| |
Real estate securities | 903,971 |
| | — |
| | 181,253 |
| | — |
| | 181,253 |
| | 1,085,224 |
| | 962,321 |
| | — |
| | 195,278 |
| | — |
| | 195,278 |
| | 1,157,599 |
| |
Mortgage servicing rights | 162,726 |
| | — |
| | — |
| | — |
| | — |
| | 162,726 |
| | 168,462 |
| | — |
| | — |
| | — |
| | — |
| | 168,462 |
| |
Cash and cash equivalents | 235,362 |
| | — |
| | — |
| | — |
| | — |
| | 235,362 |
| | 226,426 |
| | — |
| | — |
| | — |
| | — |
| | 226,426 |
| |
Total earning assets | 4,456,250 |
| | 180,394 |
| | 181,253 |
| | 1,170,246 |
| | 1,531,893 |
| | 5,988,143 |
| | 3,775,722 |
| | 182,184 |
| | 195,278 |
| | 1,237,114 |
| | 1,614,576 |
| | 5,390,298 |
| |
Other assets (4) | 273,426 |
| | 1,495 |
| | 364 |
| | 5,598 |
| | 7,457 |
| | 280,883 |
| | 197,526 |
| | 1,506 |
| | 409 |
| | 6,145 |
| | 8,060 |
| | 205,586 |
| |
Total assets | $ | 4,729,676 |
| | $ | 181,889 |
| | $ | 181,617 |
| | $ | 1,175,844 |
| | $ | 1,539,350 |
| | $ | 6,269,026 |
| | $ | 3,973,248 |
| | $ | 183,690 |
| | $ | 195,687 |
| | $ | 1,243,259 |
| | $ | 1,622,636 |
| | $ | 5,595,884 |
| |
Short-term debt | $ | 1,872,793 |
| | $ | — |
| | $ | — |
| | $ | — |
| | $ | — |
| | $ | 1,872,793 |
| | $ | 1,367,062 |
| | $ | — |
| | $ | — |
| | $ | — |
| | $ | — |
| | $ | 1,367,062 |
| |
Other liabilities | 187,897 |
| | 318 |
| | 1 |
| | 770 |
| | 1,089 |
| | 188,986 |
| | 121,435 |
| | 328 |
| | 2 |
| | 797 |
| | 1,127 |
| | 122,562 |
| |
ABS issued | — |
| | 67,946 |
| | 5,261 |
| | 1,105,588 |
| | 1,178,795 |
| | 1,178,795 |
| | — |
| | 69,914 |
| | 18,872 |
| | 1,173,336 |
| | 1,262,122 |
| | 1,262,122 |
| |
Long-term debt (3) | 1,821,877 |
| | — |
| | — |
| | — |
| | — |
| | 1,821,877 |
| | 1,579,354 |
| | — |
| | — |
| | — |
| | — |
| | 1,579,354 |
| |
Total liabilities | 3,882,567 |
| | 68,264 |
| | 5,262 |
| | 1,106,358 |
| | 1,179,884 |
| | 5,062,451 |
| | 3,067,851 |
| | 70,242 |
| | 18,874 |
| | 1,174,133 |
| | 1,263,249 |
| | 4,331,100 |
| |
| | | | | | | | | | | | | | | | | | | | | | | | |
Equity | 847,109 |
| | 113,625 |
| | 176,355 |
| | 69,486 |
| | 359,466 |
| | 1,206,575 |
| | 905,397 |
| | 113,448 |
| | 176,813 |
| | 69,126 |
| | 359,387 |
| | 1,264,784 |
| |
Total liabilities and equity | $ | 4,729,676 |
| | $ | 181,889 |
| | $ | 181,617 |
| | $ | 1,175,844 |
| | $ | 1,539,350 |
| | $ | 6,269,026 |
| | $ | 3,973,248 |
| | $ | 183,690 |
| | $ | 195,687 |
| | $ | 1,243,259 |
| | $ | 1,622,636 |
| | $ | 5,595,884 |
| |
| |
(1) | The format of this consolidating balance sheet is provided to more clearly delineate between the assets belonging to certain securitization entities (Consolidated variable interest entities, or VIEs) that we are required to consolidate on our balance sheet in accordance with GAAP, but which are not legally ours, and the liabilities of these consolidated VIEs, which are payable only from the cash flows generated by their assets and are, therefore, nonrecourse to us, and the assets that are legally ours and the liabilities of ours for which there is recourse to us. |
| |
(2) | In accordance with GAAP, we account for the Residential Resecuritization as a financing even though these securities are owned by the resecuritization entity and are legally not ours. We own only the securities and interests that we acquired from the resecuritization entity, which amounted to $170 million at September 30, 2015. As a result, to adjust at September 30, 2015, for the legal and economic interests that resulted from the resecuritization, our total senior securities would be decreased by $181 million to $286 million, prime re-REMIC securities would be increased by $170 million to $338 million, and total real estate securities would be reduced by $11 million to $1.07 billion. |
| |
(3) | Commercial loans at Redwood and long-term debt at Redwood include $66 million of commercial A-notes and $66 million of commercial secured borrowings, respectively. Although these loans were sold, we are required under GAAP to retain the loans on our balance sheet and treat the proceeds as secured borrowings. |
| |
(4) | Other assets includes a total of $36 million of assets held by third party custodians and pledged as collateral to the GSEs in connection with credit risk sharing arrangements relating to conforming residential loans. These pledged assets can only be used to settle obligations to the GSEs under these risk sharing arrangements. |
|
| | |
THE REDWOOD REVIEW I 3RD QUARTER 2015 | | Table 8: Consolidating Balance Sheet 59 |
REDWOOD TRUST CORPORATE INFORMATION
|
| |
EXECUTIVE OFFICERS | DIRECTORS |
| |
Marty Hughes | Richard D. Baum |
Chief Executive Officer | Chairman of the Board |
| Former Chief Deputy Insurance |
Brett D. Nicholas | Commissioner for the State of California |
President | |
| Douglas B. Hansen |
Fred J. Matera | Vice-Chairman of the Board |
Chief Investment Officer | Private Investor |
| |
Christopher J. Abate | Mariann Byerwalter |
Chief Financial Officer | Chairman, SRI International |
| Chairman, JDN Corporate Advisory LLC |
Andrew P. Stone | |
General Counsel | Marty Hughes |
| Chief Executive Officer |
| |
CORPORATE HEADQUARTERS: | Greg H. Kubicek |
One Belvedere Place, Suite 300 | President, The Holt Group, Inc. |
Mill Valley, California 94941 | |
Telephone: (415) 389-7373 | Karen R. Pallotta |
| Owner, KRP Advisory Services, LLC |
CHICAGO OFFICE: | |
225 W. Washington Street, Suite 1440 | Jeffrey T. Pero |
Chicago, IL 60606 | Retired Partner, Latham & Watkins LLP |
| |
DENVER METRO AREA OFFICE: | Georganne C. Proctor |
8310 South Valley Highway, Suite 425 | Former Chief Financial Officer, TIAA-CREF |
Englewood, Colorado 80112 | |
| Charles J. Toeniskoetter |
NEW YORK OFFICE: | Chairman, Toeniskoetter Development, Inc. |
1114 Avenue of the Americas, Suite 2810 | Chairman & CEO, Toeniskoetter Construction, Inc. |
New York, New York 10036 | |
| |
| |
| |
STOCK LISTING | INVESTOR RELATIONS |
The Company's common stock is traded | Kristin Brown |
on the New York Stock Exchange under | |
the symbol RWT | Investor Relations Hotline: (866) 269-4976 |
| |
TRANSFER AGENT | |
Computershare Trust Company, N.A. | |
2 North LaSalle Street | |
Chicago, IL 60602 | |
| |
For more information about Redwood Trust, visit our website at www.redwoodtrust.com |