
T A B L E O F C O N T E N T S |
Introduction | |
Shareholder Letter | |
Quarterly Overview | |
Ñ Financial Highlights | |
Ñ GAAP Earnings | |
Ñ GAAP Book Value | |
Capital, Liquidity, and Investments | |
Ñ Summary of 2016 Financial Outlook | |
Ñ Capital and Liquidity | |
Ñ Analysis of Investments and Mortgage Banking Activities | |
Ñ Analysis of Operating Expenses | |
Financial Insights | |
Ñ GAAP Results by Business Segment | |
Ñ Balance Sheet | |
Ñ Residential Loans | |
Ñ Real Estate Securities | |
Ñ Commercial Loans | |
Ñ Mortgage Servicing Rights | |
Ñ Debt and Equity | |
Appendix | |
Ñ Redwood’s Business Overview | |
Ñ Dividend Policy | |
Ñ Glossary | |
Ñ Financial Tables | |
THE REDWOOD REVIEW I 4TH QUARTER 2015 |
1 |
C A U T I O N A R Y S T A T E M E N T |
THE REDWOOD REVIEW I 4TH QUARTER 2015 |
2 |
C A U T I O N A R Y S T A T E M E N T |
THE REDWOOD REVIEW I 4TH QUARTER 2015 |
3 |
C A U T I O N A R Y S T A T E M E N T |
THE REDWOOD REVIEW I 4TH QUARTER 2015 |
4 |
I N T R O D U C T I O N |
Selected Financial Highlights | |||||||||||
Quarter:Year | GAAP Income per Share | REIT Taxable Income per Share (1) | Annualized GAAP Return on Equity | GAAP Book Value per Share | Dividends per Share | ||||||
Q415 | $0.46 | $0.37 | 14% | $14.67 | $0.28 | ||||||
Q315 | $0.22 | $0.29 | 6% | $14.69 | $0.28 | ||||||
Q215 | $0.31 | $0.21 | 9% | $14.96 | $0.28 | ||||||
Q115 | $0.16 | $0.18 | 5% | $15.01 | $0.28 | ||||||
Q414 | $0.31 | $0.20 | 9% | $15.05 | $0.28 | ||||||
Q314 | $0.50 | $0.21 | 14% | $15.21 | $0.28 | ||||||
Q214 | $0.18 | $0.17 | 5% | $15.03 | $0.28 | ||||||
Q114 | $0.14 | $0.19 | 4% | $15.14 | $0.28 | ||||||
Q413 | $0.29 | $0.20 | 8% | $15.10 | $0.28 | ||||||
THE REDWOOD REVIEW I 4TH QUARTER 2015 |
5 |
S H A R E H O L D E R L E T T E R |
THE REDWOOD REVIEW I 4TH QUARTER 2015 |
6 |
S H A R E H O L D E R L E T T E R |
THE REDWOOD REVIEW I 4TH QUARTER 2015 |
7 |
S H A R E H O L D E R L E T T E R |
Ñ | As internal managers, we have demonstrated our alignment with shareholders through our intention to repurchase common stock at attractive levels. We fully utilized the $100 million stock repurchase authorization we received from Redwood’s Board of Directors in the third quarter of 2015. Subsequently, on February 24, 2016, our Board of Directors approved a new $100 million stock repurchase authorization. The pace and extent to which this authorization is used going forward will be based on the factors we outlined above. We can assure you that the relative attractiveness of buying back shares remains the yardstick against which competing investment opportunities and capital decisions will be measured. |
THE REDWOOD REVIEW I 4TH QUARTER 2015 |
8 |
S H A R E H O L D E R L E T T E R |
Ñ | We always keep a watchful eye on the borrowing levels under our securities repurchase (or “repo”) facilities, which are subject to margin calls to the extent securities prices fall. Our repo balance was $578 million as of February 19, 2016. In light of the dislocation noted above, we intend to reduce this financing to below $300 million in the next few months through the sale of securities and by using excess cash reserves. |
Ñ | We are also keenly aware of the maturity of our $493 million of outstanding convertible/exchangeable debt ($288 million is due in 2018, with the remainder due in late 2019). While we may be able to attractively refinance this debt as it matures, we are also preparing for repayment and could look to sales of unencumbered portfolio assets as one source of funds for that purpose as we approach these maturity dates. In addition, we may also have opportunities to repurchase a portion of this debt at attractive prices prior to maturity. |
Ñ | A final consideration pertaining to our capital deployment is to keep some capital or “dry powder” for attractive investment opportunities that may arise, and that we are beginning to see as a result of recent market dislocations. This is a strategy that proved successful for us in the post-crisis RMBS market. We also continue to evaluate our existing portfolio to ensure that our deployed capital is generating attractive risk-adjusted returns relative to other investment opportunities. |
THE REDWOOD REVIEW I 4TH QUARTER 2015 |
9 |
S H A R E H O L D E R L E T T E R |
 |  | |
Marty Hughes | Brett D. Nicholas | |
CEO | President | |
THE REDWOOD REVIEW I 4TH QUARTER 2015 |
10 |
Q U A R T E R L Y O V E R V I E W |
Ñ | Our GAAP earnings were $0.46 per share for the fourth quarter of 2015, as compared to $0.22 per share for the third quarter of 2015. Earnings increased from higher net interest income from investments, higher jumbo mortgage banking margins, and higher realized gains from sales of residential securities. |
Ñ | Our fourth quarter 2015 results contributed to full-year GAAP earnings of $1.18 per share, which more than covered the $1.12 per share of dividends we distributed to shareholders in 2015. |
Ñ | Our GAAP book value was $14.67 per share at December 31, 2015, as compared to $14.69 per share at September 30, 2015. Higher earnings and accretion from share repurchases were offset by our fourth quarter dividend distribution and a decrease in unrealized gains from securities that were sold during the fourth quarter of 2015. |
Ñ | We deployed $116 million of capital in the fourth quarter of 2015 toward new investments, including $51 million invested in loans held by our FHLB-member subsidiary, $34 million of investments in residential securities, $21 million of investments in MSRs, and $4 million of commercial investments. Additionally, we deployed $53 million of capital to repurchase 4.0 million shares of Redwood common stock at an average price of $13.35 per share. |
Ñ | We purchased $2.2 billion of residential loans during the fourth quarter of 2015, which contributed to total purchases of $10.5 billion for the full year of 2015. Fourth quarter sales of residential loans were $2.1 billion, which contributed to total sales of $9.3 billion for the full year of 2015. Total 2015 sales included $1.4 billion of loans securitized, $5.5 billion of loans sold to the GSEs, and $2.5 billion of jumbo loans sold to third parties. |
Ñ | At December 31, 2015, our pipeline of residential loans identified for purchase was $1.1 billion and included $1.0 billion of jumbo loans and $0.2 billion of conforming loans, unadjusted for fallout expectations. |
Ñ | Residential loans held for investment by our FHLB-member subsidiary increased by 32% during the fourth quarter of 2015, from $1.4 billion at September 30, 2015, to $1.8 billion at December 31, 2015. As of February 19, 2016, this subsidiary had increased its FHLB borrowings to $2 billion and we expect to increase loans held for investment by this subsidiary to $2.3 billion by the end of the first quarter of 2016. The weighted average maturity of these borrowings is approximately 9.5 years. |
Ñ | We sold $130 million of residential securities during the fourth quarter of 2015, which generated realized gains on sale of $20 million, or $0.20 per share, and $123 million of capital for reinvestment after the repayment of associated debt. |
Ñ | We originated $100 million of senior commercial loans during the fourth quarter of 2015, bringing senior loan originations to $618 million for the full year of 2015. |
THE REDWOOD REVIEW I 4TH QUARTER 2015 |
11 |
Q U A R T E R L Y O V E R V I E W |
Consolidated Statements of Income | ||||||||
($ in millions, except per share data) | ||||||||
Three Months Ended | ||||||||
12/31/2015 | 9/30/2015 | |||||||
Interest income | $ | 69 | $ | 63 | ||||
Interest expense | (25 | ) | (24 | ) | ||||
Net interest income | 44 | 40 | ||||||
Provision for loan losses | — | — | ||||||
Non-interest income | ||||||||
Mortgage banking and investment activities, net | (4 | ) | (13 | ) | ||||
MSR income, net | 3 | 4 | ||||||
Other income | 1 | — | ||||||
Realized gains, net | 20 | 6 | ||||||
Total non-interest income (loss), net | 20 | (3 | ) | |||||
Operating expenses | (23 | ) | (24 | ) | ||||
Benefit from income taxes | — | 7 | ||||||
Net income | $ | 41 | $ | 19 | ||||
Net income per diluted common share | $ | 0.46 | $ | 0.22 | ||||
Ñ | Net interest income was $44 million for the fourth quarter of 2015, an increase of $4 million from the third quarter of 2015. The improvement from the third quarter primarily reflects a $431 million increase of loans held for investment by our FHLB-member subsidiary, in addition to $2 million of yield maintenance received from the early payoff of two commercial mezzanine loans during the fourth quarter. |
Ñ | Mortgage banking and investment activities, net, was negative $4 million for the fourth quarter of 2015, as compared to negative $13 million for the third quarter of 2015. The improvement was primarily due to lower volatility in benchmark interest rates during the fourth quarter, which reduced hedging expenses associated with certain residential securities. Based upon the accounting elections we apply, positive valuation changes for the derivatives hedging these securities was reflected in our fourth quarter GAAP income, with the majority of the corresponding reduction in value of the hedged securities recorded through the balance sheet. |
THE REDWOOD REVIEW I 4TH QUARTER 2015 |
12 |
Q U A R T E R L Y O V E R V I E W |
Ñ | In the fourth quarter of 2015, income from mortgage banking activities declined $1 million from the third quarter of 2015. Residential mortgage banking income improved by $1 million during the fourth quarter due to higher margins on jumbo loan sales. Income from commercial mortgage banking declined $2 million due to a combination of lower origination volume and lower margins in the fourth quarter. |
Ñ | MSR income was $3 million for the fourth quarter of 2015, as compared to $4 million for the third quarter of 2015. Higher hedging expenses and spread widening on MSR investments during the fourth quarter reduced MSR investment returns below our normalized expectations. |
Ñ | Operating expenses were $23 million for the fourth quarter of 2015, as compared to $24 million for the third quarter of 2015. The decline was primarily due to a decrease in compensation expense, as we adjusted our full year accrual to reflect the impact from underperformance by our mortgage banking businesses. |
Ñ | We recorded a tax benefit of less than $1 million for the fourth quarter of 2015, as compared to a tax benefit of $7 million for the third quarter of 2015. Our tax results under GAAP have been driven by operating activities at our taxable REIT subsidiaries. The fourth quarter tax benefit was minimal, and reflects an improvement in overall earnings at our taxable subsidiaries for the fourth quarter. A reconciliation of GAAP and taxable income is set forth in Table 3 in the Financial Tables Appendix of this Review. |
Ñ | Additional details on our earnings are included in the Analysis of GAAP Results by Business Segment portion of the Financial Insights section that follows. |
THE REDWOOD REVIEW I 4TH QUARTER 2015 |
13 |
Q U A R T E R L Y O V E R V I E W |
Changes in GAAP Book Value Per Share | ||||||||
($ in per share) | ||||||||
Three Months Ended | ||||||||
12/31/2015 | 9/30/2015 | |||||||
Beginning book value | $ | 14.69 | $ | 14.96 | ||||
Earnings | 0.46 | 0.22 | ||||||
Changes in unrealized gains on securities, net: | ||||||||
Senior and subordinate securities | (0.26 | ) | (0.13 | ) | ||||
Mezzanine securities that are hedged | (0.04 | ) | 0.02 | |||||
Total change in unrealized gains on securities, net | (0.30 | ) | (0.11 | ) | ||||
Dividends | (0.28 | ) | (0.28 | ) | ||||
Share repurchases | 0.07 | 0.02 | ||||||
Changes in unrealized losses on derivatives hedging long-term debt | 0.05 | (0.15 | ) | |||||
Other, net | (0.02 | ) | 0.03 | |||||
Ending book value | $ | 14.67 | $ | 14.69 | ||||
Ñ | During the fourth quarter, our GAAP book value per share declined $0.02 to $14.67. Although earnings of $0.46 per share exceeded our fourth quarter dividend payment, $0.20 per share of these earnings were realized gains already recognized in our GAAP book value. In total, we sold $110 million of legacy residential securities during the fourth quarter of 2015, contributing to an overall reduction in unrealized gains of $0.34 per share. |
Ñ | During the fourth quarter, we utilized our stock buyback authorization to repurchase approximately 4.0 million shares of common stock at an average price of $13.35 per share. These share repurchases increased book value by $0.07 per share for the fourth quarter of 2015. |
Ñ | During the fourth quarter, an increase in the 30-year swap rate resulted in a $0.05 per share benefit to the changes in unrealized losses on derivatives used to hedge our long-term debt. The offsetting change in value of our long-term debt is not reflected in GAAP book value, as the debt is recorded at its amortized cost for financial reporting purposes. |
THE REDWOOD REVIEW I 4TH QUARTER 2015 |
14 |
C A P I T A L, L I Q U I D I T Y, A N D I N V E S T M E N T S |
Ñ | Net interest income from our investment portfolio was $155 million in 2015. We expect this amount to increase in 2016 as a result of increased capital deployment into residential loans held for investment and financed with FHLB debt by our FHLB-member subsidiary. |
Ñ | The contribution from our MSR portfolio was $6 million in 2015, which included a loss of $4 million recorded in MSR income (loss), net, $12 million of positive valuation adjustments on hedges recorded in mortgage banking and investment activities in the first quarter of 2015, and $2 million of operating expenses. This income was below our normalized expectations of $12 million to $16 million given the size of our MSR portfolio during 2015. We expect the 2016 contribution from MSRs to be more consistent with our normalized expectations. |
Ñ | Our residential mortgage banking segment generated $4 million of income in 2015. Based on the discontinuation of our conforming mortgage banking operations and the shift to predominately whole loan sale distribution for our jumbo loans, we expect to see growth in residential mortgage banking income in 2016. |
Ñ | We announced in our third quarter 2015 earnings call that we expected to free up $175 million of capital invested through our 2011 resecuritization of senior residential securities. In the fourth quarter of 2015, the resecuritization entity was extinguished and we began selling the underlying securities. For 2016, we expect to sell the remaining $67 million of securities from this resecuritization and generate gain on sale income that will supplement our ordinary course sale activity. |
Ñ | We expect our 2016 operating expenses to be lower than the $97 million of expenses for 2015, and reflect the benefit from the $30 million estimated reduction in run rate expenses from the recent restructuring of our mortgage banking operations. Full year 2016 operating expenses will include $6 to $7 million of non-recurring severance charges relating to the restructuring, and variable compensation commensurate with the earnings range provided above. |
Ñ | We do not anticipate a material tax provision or benefit for 2016. |
THE REDWOOD REVIEW I 4TH QUARTER 2015 |
15 |
C A P I T A L, L I Q U I D I T Y, A N D I N V E S T M E N T S |
THE REDWOOD REVIEW I 4TH QUARTER 2015 |
16 |
C A P I T A L, L I Q U I D I T Y, A N D I N V E S T M E N T S |
Capital Position by Maturity | |||||||||||||||||||||
December 31, 2015 | |||||||||||||||||||||
($ in millions) | |||||||||||||||||||||
Less than 1 Year | 1 to 3 Years | 3 to 5 Years | Greater than 9 Years | Total | |||||||||||||||||
Debt capital | |||||||||||||||||||||
Convertible debt | $ | — | $ | 288 | $ | — | $ | — | $ | 288 | |||||||||||
Exchangeable debt | — | — | 205 | — | 205 | ||||||||||||||||
TruPS debt | — | — | — | 140 | 140 | ||||||||||||||||
Total debt capital | — | 288 | 205 | 140 | 633 | ||||||||||||||||
Equity capital | 1,146 | ||||||||||||||||||||
Total capital | $ | — | $ | 288 | $ | 205 | $ | 140 | $ | 1,778 | |||||||||||
Ñ | Our total capital position was $1.8 billion at December 31, 2015, and included $1.1 billion of equity capital and $0.6 billion of long-term debt. |
Ñ | During 2015, we paid $95 million (or $1.12 per share) in dividends, and $38 million (or $0.45 per share) of interest expense on our convertible/exchangeable debt and trust-preferred securities. We currently anticipate paying similar amounts of interest and dividends on our capital for 2016. |
THE REDWOOD REVIEW I 4TH QUARTER 2015 |
17 |
C A P I T A L, L I Q U I D I T Y, A N D I N V E S T M E N T S |
Allocation of Capital and Return Profile | ||||||||||||||||||
By Investment Type | ||||||||||||||||||
December 31, 2015 | ||||||||||||||||||
($ in millions) | ||||||||||||||||||
GAAP Fair Value | Collateralized Debt | Allocated Capital | % of Total Capital | 2015 Return (1) | 2016 Target Return(1) | |||||||||||||
Investments | ||||||||||||||||||
Residential loans/FHLB stock | $ | 1,826 | $ | (1,481 | ) | $ | 345 | 19% | 16% | 12%-16% | ||||||||
Residential securities | 1,028 | (516 | ) | 512 | 29% | 10% | 10%-12% | |||||||||||
Commercial investments | 377 | (179 | ) | 198 | 11% | 11% | 10%-12% | |||||||||||
Mortgage servicing rights | 192 | — | 192 | 11% | 4% | 7%-9% | ||||||||||||
Other assets/(other liabilities) | 95 | (36 | ) | 59 | 3% | —% | —% | |||||||||||
Available capital | 172 | 10% | —% | N/A | ||||||||||||||
Total investments | $ | 3,518 | $ | (2,212 | ) | $ | 1,478 | 83% | 9% | 10%-12% | ||||||||
Mortgage banking | ||||||||||||||||||
Residential - Jumbo | $ | 150 | 8% | 7% | 10%-20% | |||||||||||||
Residential - Conforming | 50 | 3% | (22)% | N/A | ||||||||||||||
Commercial | 100 | 6% | (3)% | N/A | ||||||||||||||
Total mortgage banking | $ | 300 | 17% | (1)% | N/A | |||||||||||||
Total | $ | 1,778 | 100% | |||||||||||||||
(1) | Includes net interest income, change in market value and associated hedges that flow through GAAP earnings, direct operating expenses, and other income. It excludes realized and unrealized gains and losses on our securities portfolio, corporate operating expenses, and taxes. |
Ñ | Of our total capital of $1.8 billion at December 31, 2015, $1.5 billion (or 83%) was allocated to our investments with the remaining $0.3 billion (or 17%) allocated toward our mortgage-banking activities. |
Ñ | During the first quarter of 2016, we announced the discontinuation of residential conforming mortgage banking activities and commercial loan origination activities. After giving effect to these changes, we expect that approximately 95% of our total capital will be allocated to investments, with the remainder allocated to mortgage banking activities. |
Ñ | Included in our capital allocation is available capital, which represents a combination of capital available for investment and risk capital we held for liquidity management purposes. After taking into account the discontinuation of conforming mortgage banking activities, the discontinuation of commercial loan origination activities, and investments to date in the first quarter of 2016, we estimate that our capital available for investments to be in excess of $200 million at February 19, 2016, up from $172 million at December 31, 2015. |
THE REDWOOD REVIEW I 4TH QUARTER 2015 |
18 |
C A P I T A L, L I Q U I D I T Y, A N D I N V E S T M E N T S |
Analysis of Collateralized Debt | |||||||||||||||||
December 31, 2015 | |||||||||||||||||
($ in millions) | |||||||||||||||||
Type of debt | Less than 1 Year | 1 to 8 Years | Greater than 9 Years | Total | |||||||||||||
Investments | |||||||||||||||||
Securities repurchase debt | $ | 516 | $ | — | $ | — | $ | 516 | |||||||||
Commercial investments debt(1) | 179 | — | — | 179 | |||||||||||||
Other liabilities | 36 | — | — | 36 | |||||||||||||
FHLB debt(2) | 138 | — | 1,343 | 1,481 | |||||||||||||
Total investments | $ | 869 | $ | — | $ | 1,343 | $ | 2,212 | |||||||||
Residential mortgage banking | |||||||||||||||||
Residential loan warehouse debt | $ | 950 | $ | — | $ | — | $ | 950 | |||||||||
Sequoia repurchase debt | 178 | — | — | 178 | |||||||||||||
Other debt | 20 | — | — | 20 | |||||||||||||
Total mortgage banking | $ | 1,148 | $ | — | $ | — | $ | 1,148 | |||||||||
Total | $ | 2,017 | $ | — | $ | 1,343 | $ | 3,360 | |||||||||
(1) | Includes $116 million of non-recourse collateralized debt. |
(2) | During the first quarter of 2016, our FHLB-member subsidiary increased FHLB debt to $2 billion with a weighted average maturity of approximately 9.5 years. |
Ñ | Our debt-to-equity leverage ratio was 3.4x our reported book value at December 31, 2015. This ratio includes our $633 million of corporate debt capital and $3.3 billion of the $3.4 billion of total collateralized debt. We exclude $116 million of commercial collateralized debt from our leverage calculation, as it is non-recourse to Redwood. |
Ñ | At December 31, 2015, our leverage also included $1.1 billion of short-term debt associated with our residential mortgage banking operations, which consists of loan warehouse and securities repurchase facilities we use to finance our inventory of residential loans and Sequoia triple-A rated securities that we intend to sell to third parties in the near-term. As of February 19, 2016 the repurchase debt associated with the Sequoia triple-A rated securities had declined to $47 million, as a result of the sale of $146 million of these securities to third parties. |
Ñ | At December 31, 2015, our leverage also included $1.5 billion of FHLB debt with a weighted average maturity of 9 years. |
THE REDWOOD REVIEW I 4TH QUARTER 2015 |
19 |
C A P I T A L, L I Q U I D I T Y, A N D I N V E S T M E N T S |
Ñ | At December 31, 2015, our investments in residential loans included $1.8 billion of jumbo residential loans financed with FHLB debt by our FHLB-member subsidiary. In connection with these borrowings, our FHLB-member subsidiary is required to hold $34 million of FHLB stock. These investments generated GAAP yields (after applicable hedging costs) of 16% for 2015. There were no serious delinquencies on any loans financed with FHLB debt at December 31, 2015. |
Ñ | We expect our FHLB-member subsidiary to increase its investment in residential loans to $2.3 billion by the end of the first quarter of 2016, financed by $2.0 billion of FHLB debt. Currently, the weighted average maturity of this FHLB debt is approximately 9.5 years with a weighted average cost, at February 19, 2016, of 0.59% per annum. Residential loans held by our FHLB-member subsidiary are pledged as collateral for this FHLB debt. |
Ñ | Under the final rule published by the Federal Housing Finance Agency in January 2016, our captive insurance subsidiary will remain an FHLB member through the five-year transition period for captive insurers. Our FHLB member subsidiary’s existing $2.0 billion of advances, which mature beyond this transition period, are permitted to remain outstanding until their stated maturity. As residential loans pledged as collateral for these advances pay down, we are permitted to pledge additional loans or other eligible assets to collateralize these advances. |
Ñ | For 2016, we expect an increase in net interest income from residential loans held for investment, resulting from increased capital invested in a higher average balance of loans held by our FHLB-member subsidiary and financed with FHLB debt. For 2016, we are currently targeting GAAP yields of 12-16% on approximately $350 million of capital allocated to this portfolio. This target return includes hedging costs and related expenses. |
THE REDWOOD REVIEW I 4TH QUARTER 2015 |
20 |
C A P I T A L, L I Q U I D I T Y, A N D I N V E S T M E N T S |
Ñ | Our holdings of residential securities are financed with a combination of capital and collateralized debt in the form of repurchase (or “repo”) financing. The following tables present the fair value of our residential securities by segment that are financed and not financed with collateralized debt. |
Residential Securities | |||||||||||||||
December 31, 2015 | |||||||||||||||
($ in millions) | |||||||||||||||
Financed with Collateralized Debt | Not Financed with Collateralized Debt | Total | % Financed with Collateralized Debt | ||||||||||||
Residential investments | |||||||||||||||
Subordinate | $ | 4 | $ | 175 | $ | 179 | 2 | % | |||||||
Re-REMIC | 75 | 90 | 165 | 45 | % | ||||||||||
Mezzanine | 315 | 33 | 348 | 91 | % | ||||||||||
Legacy senior | 236 | 100 | 336 | 70 | % | ||||||||||
Total residential investments | 630 | 398 | 1,028 | 61 | % | ||||||||||
Residential mortgage banking | |||||||||||||||
Sequoia Triple-A Securities | 197 | — | 197 | 100 | % | ||||||||||
Total | $ | 827 | $ | 398 | $ | 1,225 | 68 | % | |||||||
Residential Securities Financed with Collateralized Debt | ||||||||||||||||||
December 31, 2015 | ||||||||||||||||||
($ in millions, except weighted average price) | ||||||||||||||||||
Residential Securities | Collateralized Debt | Allocated Capital | Weighted Average Price(1) | Financing Haircut(2) | ||||||||||||||
Residential investments | ||||||||||||||||||
Subordinate | $ | 4 | $ | (4 | ) | $ | — | 90 | 14 | % | ||||||||
Re-REMIC | 75 | (46 | ) | 29 | 88 | 38 | % | |||||||||||
Mezzanine | 315 | (263 | ) | 52 | 97 | 17 | % | |||||||||||
Legacy senior | 236 | (203 | ) | 33 | 94 | 14 | % | |||||||||||
Total residential investments | 630 | (516 | ) | 114 | 95 | 18 | % | |||||||||||
Residential mortgage banking | ||||||||||||||||||
Sequoia Triple-A securities | 197 | (178 | ) | 19 | 101 | 10 | % | |||||||||||
Total | $ | 827 | $ | (694 | ) | $ | 133 | 96 | 16 | % | ||||||||
(1) | GAAP fair value per $100 of principal. |
(2) | Allocated capital divided by GAAP fair value. |
THE REDWOOD REVIEW I 4TH QUARTER 2015 |
21 |
C A P I T A L, L I Q U I D I T Y, A N D I N V E S T M E N T S |
Ñ | At December 31, 2015, the securities we financed through repurchase facilities had no material credit issues. In addition to the allocated capital listed in the table above that directly supports our repurchase facilities (i.e., “the haircut”), we continue to hold a designated amount of supplemental risk capital available for potential margin calls or future obligations relating to these facilities. |
Ñ | As of December 31, 2015, the weighted average GAAP fair value of our financed securities was 96% of their aggregate principal balance. All financed securities received external market price indications as of December 31, 2015 and were, in aggregate, valued for GAAP financial reporting purposes within 1% of the external market price indications. Between December 31, 2015 and February 19, 2016, our financing terms remained consistent for these securities and our utilization of repurchase financing declined to $578 million. As discussed in the Shareholder Letter, we intend to further reduce this financing to below $300 million in the next few months through the sale of securities and by using available cash, rather than repurchase financing, to fund certain investments. |
Ñ | The majority of the $236 million of legacy senior securities and $75 million Re-REMIC securities noted in the table above are supported by seasoned residential loans originated prior to 2008. The credit performance of these investments continues to exceed our original investment expectations. |
Ñ | The $319 million of mezzanine and subordinate securities financed through repurchase facilities at December 31, 2015, carry investment grade credit ratings and are supported by residential loans originated between 2010 and 2015. The loans underlying these securities have experienced minimal delinquencies to date. |
Ñ | Included in our repurchase financing at December 31, 2015, was $178 million used to finance triple-A rated RMBS retained from our fourth quarter Sequoia securitization and that we hold in our residential mortgage banking segment. As of February 19, 2016 the repurchase financing associated with the Sequoia triple-A rated securities had declined to $47 million, as a result of the sale of $149 million of these securities to third parties. We expect to sell the remainder of these triple-A rated Sequoia securities over the near-term. |
THE REDWOOD REVIEW I 4TH QUARTER 2015 |
22 |
C A P I T A L, L I Q U I D I T Y, A N D I N V E S T M E N T S |
MSR Portfolio Composition | ||||||||||||
December 31, 2015 | ||||||||||||
($ in millions, except GAAP price and cost per loan to service) | ||||||||||||
Conforming | Jumbo | Total | ||||||||||
Principal(1) | $ | 12,560 | $ | 5,706 | $ | 18,266 | ||||||
Fair value of MSRs | $ | 134 | $ | 58 | $ | 192 | ||||||
Price(2) | $ | 1.07 | $ | 1.02 | $ | 1.05 | ||||||
Implied multiple(3) | 4.2X | 4.1X | 4.2X | |||||||||
GWAC(4) | 3.86 | % | 3.99 | % | 3.90 | % | ||||||
Key assumptions in determining fair value | ||||||||||||
Discount rate | 9 | % | 11 | % | 9 | % | ||||||
Cost per loan to service | $ | 82 | $ | 72 | $ | 79 | ||||||
Constant prepayment rate (CPR) of associated loans | 9 | % | 11 | % | 10 | % | ||||||
(1) | Represents principal balance of residential loans associated with MSRs in our portfolio. |
(2) | Fair value per $100 of principal. |
(3) | Price divided by annual base servicing fee of 25 basis points. |
(4) | Gross weighted average coupon of associated residential loans. |
THE REDWOOD REVIEW I 4TH QUARTER 2015 |
23 |
C A P I T A L, L I Q U I D I T Y, A N D I N V E S T M E N T S |
Components of MSR Income | ||||
Year Ended December 31, 2015 | ||||
($ in millions) | ||||
Net servicing fee income | $ | 34 | ||
Change in value from the realization expected cashflows | (19 | ) | ||
MSR provision for repurchases | (1 | ) | ||
MSR income before effect of assumption changes | 14 | |||
Net effect of changes in assumptions and interest rates | ||||
Changes in MSR assumptions (1) | (5 | ) | ||
Changes of associated derivatives (2) | (1 | ) | ||
Total net effect of changes in assumptions and interest rates | (6 | ) | ||
Mortgage servicing rights income, net | 8 | |||
Operating expenses | (2 | ) | ||
Contribution from MSRs | $ | 6 | ||
Average balance of MSRs in 2015 | $ | 155 | ||
MSR Return | 4 | % | ||
(1) | Primarily reflects changes in prepayment assumptions on our MSRs due to changes in market interest rates. |
(2) | Includes a $13 million loss associated with derivatives recorded in MSR income on our consolidated income statement and $12 million of income on a hedges allocated in the first quarter of 2015 that were recorded in residential mortgage banking and investment activities, net. |
Ñ | Interest rate volatility during the early part of 2015 increased derivative expenses and reduced earnings in 2015 from our investment in MSRs below our normalized expectations. For 2016, we expect this investment to generate a full year contribution of $12 to $16 million, net of operating expenses and to achieve 7-9% returns. |
Ñ | Over the past few quarters, our jumbo mortgage banking business has not created significant investments in MSRs due to most loans being sold in whole loan form without our retaining the servicing rights. In 2016, new investments in MSRs are expected to be created primarily through co-issue relationships with conforming originators who sell the associated residential loans directly to the GSEs. |
THE REDWOOD REVIEW I 4TH QUARTER 2015 |
24 |
C A P I T A L, L I Q U I D I T Y, A N D I N V E S T M E N T S |
Residential Mortgage Banking | ||||||||||||
2015 Pre-tax Return Summary | ||||||||||||
($ in millions) | ||||||||||||
Jumbo | Conforming | Total | ||||||||||
Allocated capital | $ | 150 | $ | 50 | $ | 200 | ||||||
Net interest income | 29 | 6 | 35 | |||||||||
Mortgage banking activities, net | 2 | 6 | 8 | |||||||||
Operating expenses | (20 | ) | (23 | ) | (43 | ) | ||||||
Pre-tax contribution | $ | 11 | $ | (11 | ) | $ | — | |||||
Return metrics | ||||||||||||
Return on capital | 7.4 | % | (21.7 | )% | 0.1 | % | ||||||
Loan sale margins (in basis points)(1) | 59 | 24 | 42 | |||||||||
Pre-tax net margin (in basis points) | 21 | (22 | ) | — | ||||||||
(1) | Defined as net interest income plus mortgage banking activities, net divided by loan purchase commitments. |
Residential Mortgage Banking | ||||||||||||
2015 Activity Summary | ||||||||||||
($ in millions) | ||||||||||||
Jumbo | Conforming | Total | ||||||||||
Loans purchased | $ | 5,140 | $ | 5,335 | $ | 10,475 | ||||||
Loan distributions | ||||||||||||
Sales | $ | 2,462 | $ | 5,454 | $ | 7,916 | ||||||
Securitizations | 1,400 | — | 1,400 | |||||||||
Loans held for investment by our FHLB-member subsidiary | 1,310 | — | 1,310 | |||||||||
Total distributions | $ | 5,172 | $ | 5,454 | $ | 10,626 | ||||||
Investments created | ||||||||||||
Sequoia securities/GSE riskshare arrangements | $ | 14 | $ | 11 | $ | 25 | ||||||
MSRs(1) | 9 | 56 | 65 | |||||||||
Net investment in loans held by FHLB-member subsidiary | 214 | — | 214 | |||||||||
Total investments created | $ | 237 | $ | 67 | $ | 304 | ||||||
(1) | Excludes $31 million of investments in conforming MSRs created through our co-issue relationships. |
THE REDWOOD REVIEW I 4TH QUARTER 2015 |
25 |
C A P I T A L, L I Q U I D I T Y, A N D I N V E S T M E N T S |
Ñ | During the first half of 2015, our jumbo mortgage banking operations were adversely affected by high interest rate volatility, and dislocation in the jumbo securitization market. In the second half of 2015, we repositioned our distribution of jumbo loans towards whole loan sales and retaining loans for investment financed with FHLB debt, which increased both margins and income relative to the first half of 2015. We expect to continue to distribute the majority of our jumbo loans through our whole loan sale network in 2016. |
Ñ | As a result of the discontinuation of our conforming loan mortgage banking activities, we have reduced our capital allocation to our residential mortgage banking business to $150 million in the first quarter of 2016 from $200 million at December 31, 2015. |
Ñ | At December 31, 2015, we had $950 million of warehouse debt outstanding to fund residential mortgages held-for-sale. In aggregate, we used our warehouse facilities to fund the acquisition and sale of over $10 billion of residential loans during 2015. Our warehouse capacity, at December 31, 2015, totaled $1.4 billion with five separate counterparties, which should continue to provide sufficient liquidity to fund our residential mortgage banking operations in 2016. |
Ñ | At December 31, 2015, we had commercial investments with a fair value of $377 million (including $63 million of secured borrowings associated with our A-notes) that were financed with $116 million of non-recourse debt and $61 million of short-term warehouse debt. In aggregate, this portfolio generated a return of 11% in 2015, and we currently anticipate similar returns for 2016. At December 31, 2015, the weighted average life of these loans was approximately five years. |
Ñ | In February 2016, we discontinued our commercial loan origination operations, freeing up $100 million of capital going forward. |
THE REDWOOD REVIEW I 4TH QUARTER 2015 |
26 |
C A P I T A L, L I Q U I D I T Y, A N D I N V E S T M E N T S |
2015 Operating Expenses | ||||
Year Ended December 31, 2015 | ||||
($ in millions) | ||||
Investment portfolio expenses | ||||
Residential investment expenses | $ | 4 | ||
Commercial investment expenses | 3 | |||
Total investment portfolio expenses | 7 | |||
Mortgage banking expenses | ||||
Residential Mortgage Banking Expenses - Jumbo | 20 | |||
Residential Mortgage Banking Expenses - Conforming | 23 | |||
Commercial Mortgage Banking Expenses | 8 | |||
Total mortgage banking expenses | 51 | |||
Corporate operating expenses | 39 | |||
Total operating expenses | $ | 97 | ||
Ñ | Full year operating expenses of $97 million for 2015 included $30 million of expenses associated with conforming and commercial mortgage banking. As a result of the changes we made to our operations in the first quarter of 2016, we expect these mortgage banking expenses will be eliminated from our expense structure going forward, excluding the impact of one-time charges of approximately $6 to $7 million related to restructuring. |
Ñ | Our investment portfolio expenses of $7 million support the management of 83% of our $1.8 billion of our total capital. We do not expect that the increased capital allocation to our investment portfolio in 2016 to 92% of total capital will materially increase these expenses for 2016. |
Ñ | Our corporate operating expenses of $39 million include all expenses related to executive oversight, public company costs and corporate overhead. Excluding any charges related to our first quarter of 2016 restructuring or any changes to variable compensation due to company performance, we do not anticipate these expenses to be materially different for 2016. |
THE REDWOOD REVIEW I 4TH QUARTER 2015 |
27 |
F I N A N C I A L I N S I G H T S |
Segment Results Summary (1) | ||||||||
($ in millions) | ||||||||
Three Months Ended | ||||||||
12/31/2015 | 9/30/2015 | |||||||
Segment contribution from: | ||||||||
Residential mortgage banking | $ | — | $ | — | ||||
Residential investments | 49 | 30 | ||||||
Commercial mortgage banking and investments | 8 | 5 | ||||||
Corporate/Other | (15 | ) | (16 | ) | ||||
Net income | $ | 41 | $ | 19 | ||||
(1) | See Table 2 of the Financial Tables section of the Appendix to this Redwood Review for a more comprehensive presentation of our segment results. |
Segment Results - Residential Mortgage Banking | ||||||||
($ in millions) | ||||||||
Three Months Ended | ||||||||
12/31/2015 | 9/30/2015 | |||||||
Net interest income | $ | 9 | $ | 8 | ||||
Non-interest income | ||||||||
Mortgage banking activities, net | 1 | — | ||||||
Total non-interest income | 1 | — | ||||||
Direct operating expenses | (10 | ) | (11 | ) | ||||
Tax benefit | 1 | 3 | ||||||
Segment contribution | $ | — | $ | — | ||||
THE REDWOOD REVIEW I 4TH QUARTER 2015 |
28 |
F I N A N C I A L I N S I G H T S |
Ñ | Our results for the fourth quarter from this segment increased slightly from the third quarter of 2015, primarily due to higher jumbo loan sale margins. This increase was partially offset by a lower tax benefit of $1 million that primarily resulted from higher pre-tax income during the fourth quarter. |
Ñ | Loan purchase commitments (LPCs), adjusted for fallout expectations, were $1.9 billion for the fourth quarter, compared with $2.7 billion in the third quarter of 2015, and included $1.1 billion of jumbo loans and $0.8 billion of conforming loans. For the full year of 2015, LPCs were $10.2 billion, and included $5.2 billion of jumbo loans and $5.0 billion of conforming loans. |
Ñ | We sold $2.1 billion of residential loans during the fourth quarter, including $0.5 billion of jumbo loans to third parties, and $1.2 billion of conforming loans to the GSEs. These conforming loan sales included $1.0 billion of loans that were sold under the risk-sharing arrangements previously established with both GSEs. We also completed one Sequoia securitization during the fourth quarter totaling $341 million (SEMT 2015-4). |
Ñ | Our jumbo loan sale margins, which we define as net interest income and income from mortgage banking activities divided by LPCs, improved during the fourth quarter, and were 59 basis points for the full year of 2015, above the higher end of our long-term target range of 25-50 basis points. After direct operating expenses and taxes, segment contribution from jumbo loans was $3 million for the fourth quarter of 2015 and $12 million for the full year of 2015. |
Ñ | Conforming loan sale margins were 24 basis points for the full year of 2015. After direct operating expenses and taxes, segment contribution from conforming loans was negative $2 million for the fourth quarter of 2015 and negative $7 million for the full year of 2015. As discussed in the Shareholder Letter, we have discontinued the acquisition and aggregation of conforming loans for resale to Fannie Mae and Freddie Mac, reducing the potential downside risk to earnings from this business. |
Ñ | Direct operating expenses in the fourth quarter decreased $1 million from the third quarter of 2015. These expenses primarily include costs associated with the purchase, underwriting and sale of residential loans. |
Ñ | At December 31, 2015, we had 330 loan sellers, up from 266 at the end of the third quarter of 2015. This included the addition of 48 MPF Direct sellers from various FHLB districts. Our loan sellers at December 31, 2015 included 21 sellers that exclusively sold us conforming loans. |
THE REDWOOD REVIEW I 4TH QUARTER 2015 |
29 |
F I N A N C I A L I N S I G H T S |
Ñ | Our residential mortgage banking operations created $82 million of investments for our investment portfolio during the fourth quarter of 2015, and $334 million for the full year 2015. Our full year investments included $67 million of investments created from our conforming loan conduit. Going forward, we anticipate sourcing similar investments from our MSR co-issue counterparties, as well as adding additional third party investments. |
Segment Results - Residential Investments | ||||||||
($ in millions) | ||||||||
Three Months Ended | ||||||||
12/31/2015 | 9/30/2015 | |||||||
Net interest income | ||||||||
Residential securities | $ | 20 | $ | 21 | ||||
Residential loans | 14 | 11 | ||||||
Total net interest income | 34 | 31 | ||||||
Non-interest income | ||||||||
Investment activities, net | (5 | ) | (14 | ) | ||||
MSR income, net | 3 | 4 | ||||||
Other income | 1 | — | ||||||
Realized gains, net | 20 | 6 | ||||||
Total non-interest income (loss), net | 18 | (4 | ) | |||||
Direct operating expenses | (1 | ) | (1 | ) | ||||
Tax benefit (provision) | (3 | ) | 4 | |||||
Segment contribution | $ | 49 | $ | 30 | ||||
Ñ | For the fourth quarter, the contribution from this segment increased from the third quarter of 2015, primarily due to growth in net interest income from our residential loans and higher realized gains on security sales. |
Ñ | Net interest income in the fourth quarter of 2015 increased from the third quarter of 2015, as net interest income from loans held by our FHLB-member subsidiary increased and was partially offset by a decline in net interest income from our securities portfolio, as sales of lower yielding securities and principal paydowns outpaced new security investments during the fourth quarter. |
THE REDWOOD REVIEW I 4TH QUARTER 2015 |
30 |
F I N A N C I A L I N S I G H T S |
Components of MSR Income, net | ||||||||
($ in millions) | ||||||||
Three Months Ended | ||||||||
12/31/2015 | 9/30/2015 | |||||||
Net fee income | $ | 9 | $ | 9 | ||||
Changes in fair value of MSRs due to: | ||||||||
Change in basis (1) | (5 | ) | (5 | ) | ||||
Change in interest rates (2) | 13 | (24 | ) | |||||
Associated derivatives | (14 | ) | 24 | |||||
MSR income, net | $ | 3 | $ | 4 | ||||
(1) | Primarily represents changes due to the receipt of expected cash flows during the quarter. |
(2) | Primarily reflects changes in prepayment assumptions due to changes in benchmark interest rates. |
Ñ | In the fourth quarter of 2015, MSR income, net decreased from the third quarter of 2015 due to slightly higher hedging costs. Overall MSR investment returns for the fourth quarter were below our normalized expectations. |
Quarterly Residential Investment Activity | ||||||||
($ in millions) | ||||||||
Three Months Ended | ||||||||
12/31/2015 | 9/30/2015 | |||||||
Sequoia RMBS | $ | 3 | $ | — | ||||
Third-party RMBS | 105 | 11 | ||||||
Less: Short-term debt/Other liabilities | (75 | ) | (8 | ) | ||||
Total RMBS, net | 34 | 3 | ||||||
Loans, net – FHLBC (1) | 51 | 44 | ||||||
MSR investments | 21 | 23 | ||||||
GSE risk sharing transactions | 6 | 5 | ||||||
Capital invested | $ | 112 | $ | 74 | ||||
(1) | Includes loans transferred to our FHLB-member subsidiary and FHLBC stock acquired, less secured borrowings. |
THE REDWOOD REVIEW I 4TH QUARTER 2015 |
31 |
F I N A N C I A L I N S I G H T S |
Ñ | During the fourth quarter, we invested $112 million of capital into new residential investments, including $34 million into securities, $21 million into MSR investments, $6 million into GSE risk sharing transactions, and $51 million into residential loans held-for-investment by our FHLB-member subsidiary. |
Ñ | During the fourth quarter, we sold $130 million of securities, including $107 million of senior securities, $19 million of Sequoia subordinate securities, $3 million of third-party subordinate securities, and $1 million of Re-REMIC securities, for which we realized gains on sales of $20 million. After the repayment of the associated short-term debt, these security sales provided $123 million of capital for reinvestment. A portion of the proceeds from these security sales was used to fund our investments in residential loans, which we expect in aggregate to generate higher returns on capital than the securities we sold. |
Ñ | As of December 31, 2015, we had $3.1 billion of investments in our Residential Investments segment, including $1.0 billion of securities, $1.8 billion of residential loans held-for-investment, and $192 million of MSR investments. |
Components of Investment Activities, net | ||||||||
($ in millions) | ||||||||
Three Months Ended | ||||||||
12/31/2015 | 9/30/2015 | |||||||
Market valuation changes on: | ||||||||
Real estate securities | $ | — | $ | (9 | ) | |||
Residential loans held-for-investment | (12 | ) | 9 | |||||
Other investments | — | (1 | ) | |||||
Derivatives and hedging allocation | 7 | (13 | ) | |||||
Total investment activities, net | $ | (5 | ) | $ | (14 | ) | ||
THE REDWOOD REVIEW I 4TH QUARTER 2015 |
32 |
F I N A N C I A L I N S I G H T S |
Segment Results - Commercial Mortgage Banking and Investments | ||||||||
($ in millions) | ||||||||
Three Months Ended | ||||||||
12/31/2015 | 9/30/2015 | |||||||
Net interest income | ||||||||
Mezzanine loans | $ | 9 | $ | 7 | ||||
Senior loans | — | 1 | ||||||
Total net interest income | 9 | 8 | ||||||
Provision for loan losses | — | — | ||||||
Non-interest income | ||||||||
Mortgage banking activities, net | (1 | ) | 1 | |||||
Total non-interest income | (1 | ) | 1 | |||||
Operating expenses | (2 | ) | (3 | ) | ||||
Tax provision | 1 | — | ||||||
Segment contribution | $ | 8 | $ | 5 | ||||
Ñ | For the fourth quarter of 2015, net interest income from mezzanine loans benefited from $2 million of non-recurring yield maintenance fees received from the payoff of two loans. |
Ñ | Total senior loan originations were $100 million for the fourth quarter of 2015, and loan sale margins, which we define as net interest income and income from mortgage banking activities, net, divided by loan originations, were negative 17 basis points. This compared with $168 million of senior loan originations for the third quarter of 2015 that generated loan sale margins of 100 basis points. |
Ñ | At December 31, 2015, we had $300 million of commercial mezzanine and subordinate loans held-for-investment (excluding A-notes) with a weighted average yield of approximately 10% and a weighted average maturity of approximately five years. The credit quality of our mezzanine loan portfolio remains strong and we do not currently anticipate any material credit issues on maturing loans. |
THE REDWOOD REVIEW I 4TH QUARTER 2015 |
33 |
F I N A N C I A L I N S I G H T S |
Consolidated Balance Sheets (1) | ||||||||
($ in millions) | ||||||||
12/31/2015 | 9/30/2015 | |||||||
Residential loans | $ | 3,929 | $ | 4,037 | ||||
Real estate securities | 1,233 | 1,085 | ||||||
Commercial loans | 403 | 468 | ||||||
Mortgage servicing rights | 192 | 163 | ||||||
Cash and cash equivalents | 220 | 235 | ||||||
Total earning assets | 5,977 | 5,988 | ||||||
Other assets | 254 | 281 | ||||||
Total assets | $ | 6,231 | $ | 6,269 | ||||
Short-term debt | ||||||||
Mortgage loan warehouse debt (2) | $ | 1,161 | $ | 1,397 | ||||
Security repurchase facilities | 694 | 475 | ||||||
Other liabilities | 142 | 189 | ||||||
Asset-backed securities issued | 1,050 | 1,179 | ||||||
Long-term debt | 2,038 | 1,822 | ||||||
Total liabilities | 5,085 | 5,062 | ||||||
Stockholders’ equity | 1,146 | 1,207 | ||||||
Total liabilities and equity | $ | 6,231 | $ | 6,269 | ||||
(1) | Our consolidated balance sheets include assets of consolidated variable interest entities (“VIEs”) that can only be used to settle obligations of these VIEs and liabilities of consolidated VIEs for which creditors do not have recourse to the primary beneficiary (Redwood Trust, Inc.). At December 31, 2015 and September 30, 2015, assets of consolidated VIEs totaled $1,196 and $1,539, respectively, and liabilities of consolidated VIEs totaled $1,051 and $1,180, respectively. See Table 8 in the Financial Tables section of the Appendix to this Redwood Review for additional detail on consolidated VIEs. |
(2) | Includes $138 of short-term borrowings from the FHLBC by our FHLB-member subsidiary, secured by residential loans held-for-investment. |
THE REDWOOD REVIEW I 4TH QUARTER 2015 |
34 |
F I N A N C I A L I N S I G H T S |
Residential Loans | ||||||||||||||||||||
($ in millions) | ||||||||||||||||||||
Conforming Held-for-Sale | Jumbo Held-for- Sale | Jumbo Held-for-Investment | Consolidated Sequoia Entities | Total | ||||||||||||||||
Fair value at June 30, 2015 | $ | 248 | $ | 642 | $ | 1,157 | $ | 1,237 | $ | 3,286 | ||||||||||
Acquisitions | 1,422 | 1,565 | — | — | 2,987 | |||||||||||||||
Sales | (1,438 | ) | (695 | ) | — | — | (2,133 | ) | ||||||||||||
Transfers between portfolios (1) | — | (233 | ) | 233 | — | — | ||||||||||||||
Principal payments | (1 | ) | (17 | ) | (40 | ) | (66 | ) | (123 | ) | ||||||||||
Change in fair value, net | 5 | 6 | 9 | — | 20 | |||||||||||||||
Other, net | — | — | — | (1 | ) | (1 | ) | |||||||||||||
Fair value at September 30, 2015 | $ | 236 | $ | 1,270 | $ | 1,360 | $ | 1,170 | $ | 4,037 | ||||||||||
Acquisitions | 1,108 | 1,055 | — | — | 2,164 | |||||||||||||||
Sales | (1,213 | ) | (889 | ) | — | — | (2,102 | ) | ||||||||||||
Transfers between portfolios (1) | — | (413 | ) | 504 | (92 | ) | — | |||||||||||||
Principal payments | (1 | ) | (32 | ) | (62 | ) | (58 | ) | (153 | ) | ||||||||||
Change in fair value, net | (1 | ) | (5 | ) | (12 | ) | 3 | (15 | ) | |||||||||||
Other, net | — | — | — | (2 | ) | (2 | ) | |||||||||||||
Fair value at December 31, 2015 | $ | 130 | $ | 986 | $ | 1,791 | $ | 1,022 | $ | 3,929 | ||||||||||
(1) | Represents net transfers of loans to our Residential Investments segment from our Residential Mortgage Banking segment. |
THE REDWOOD REVIEW I 4TH QUARTER 2015 |
35 |
F I N A N C I A L I N S I G H T S |
THE REDWOOD REVIEW I 4TH QUARTER 2015 |
36 |
F I N A N C I A L I N S I G H T S |
Real Estate Securities | ||||||||
($ in millions) | ||||||||
Three Months Ended | ||||||||
12/31/15 | 9/30/2015 | |||||||
Beginning fair value | $ | 1,085 | $ | 1,158 | ||||
Acquisitions | ||||||||
Sequoia securities (1) | 204 | — | ||||||
Third-party securities | 113 | 9 | ||||||
Sales | ||||||||
Sequoia securities | (21 | ) | (8 | ) | ||||
Third-party securities | (110 | ) | (29 | ) | ||||
Gain on sales/calls, net | 20 | 6 | ||||||
Effect of principal payments | (33 | ) | (30 | ) | ||||
Change in unrealized gains, net | (26 | ) | (20 | ) | ||||
Ending fair value | $ | 1,233 | $ | 1,085 | ||||
(1) | Sequoia securities represent interests we have retained in Sequoia securitizations we sponsored and that were not consolidated for GAAP purposes. |
THE REDWOOD REVIEW I 4TH QUARTER 2015 |
37 |
F I N A N C I A L I N S I G H T S |
Real Estate Securities - Vintage and Category | |||||||||||||||||||||||
December 31, 2015 | |||||||||||||||||||||||
($ in millions) | |||||||||||||||||||||||
Sequoia Securities 2012-2015 | Third-party Securities | ||||||||||||||||||||||
2012-2015 | 2006-2008 | <=2005 | Total Securities | % of Total Securities | |||||||||||||||||||
Senior | |||||||||||||||||||||||
Prime | $ | 249 | $ | — | $ | 36 | $ | 175 | $ | 460 | 37 | % | |||||||||||
Non-prime (1) | — | — | — | 74 | 74 | 6 | % | ||||||||||||||||
Total senior | 249 | — | 36 | 249 | 534 | 43 | % | ||||||||||||||||
Re-REMIC | — | — | 109 | 56 | 165 | 13 | % | ||||||||||||||||
Prime subordinate | |||||||||||||||||||||||
Mezzanine (2) | 186 | 170 | — | — | 356 | 29 | % | ||||||||||||||||
Subordinate | 97 | 49 | 1 | 32 | 179 | 15 | % | ||||||||||||||||
Prime subordinate | 283 | 219 | 1 | 32 | 535 | 44 | % | ||||||||||||||||
Total real estate securities | $ | 531 | $ | 219 | $ | 146 | $ | 337 | $ | 1,233 | 100 | % | |||||||||||
(1) | Non-prime residential senior securities consist of Alt-A senior securities. |
(2) | Mezzanine includes securities initially rated AA, A, and BBB- and issued in 2012 or later. |
THE REDWOOD REVIEW I 4TH QUARTER 2015 |
38 |
F I N A N C I A L I N S I G H T S |
Real Estate Securities - Carrying Values | ||||||||||||||||||||||||
December 31, 2015 | ||||||||||||||||||||||||
($ in millions) | ||||||||||||||||||||||||
Senior | Prime Subordinate | |||||||||||||||||||||||
Prime | Non- prime | Re-REMIC | Mezzanine | Subordinate | Total | |||||||||||||||||||
Available-for-sale securities | ||||||||||||||||||||||||
Current face | $ | 218 | $ | 76 | $ | 190 | $ | 225 | $ | 265 | $ | 973 | ||||||||||||
Credit reserve | (1 | ) | (5 | ) | (10 | ) | — | (32 | ) | (49 | ) | |||||||||||||
Net unamortized discount | (22 | ) | (8 | ) | (72 | ) | (20 | ) | (115 | ) | (237 | ) | ||||||||||||
Amortized cost | 194 | 62 | 108 | 205 | 118 | 687 | ||||||||||||||||||
Unrealized gains | 20 | 6 | 57 | 15 | 48 | 147 | ||||||||||||||||||
Unrealized losses | (3 | ) | — | — | — | (1 | ) | (5 | ) | |||||||||||||||
Carrying Value | 211 | 68 | 165 | 220 | 165 | 829 | ||||||||||||||||||
Trading securities | 249 | 6 | — | 136 | 14 | 404 | ||||||||||||||||||
Fair value of residential securities | $ | 460 | $ | 74 | $ | 165 | $ | 356 | $ | 179 | $ | 1,233 | ||||||||||||
THE REDWOOD REVIEW I 4TH QUARTER 2015 |
39 |
F I N A N C I A L I N S I G H T S |
Commercial Loans | ||||||||||||||||||||
($ in millions) | ||||||||||||||||||||
Held-for-Sale Senior | Held-for-Investment | |||||||||||||||||||
A-Notes (1) | Unsecuritized Mezzanine | Securitized Mezzanine | Total | |||||||||||||||||
Carrying value June 30, 2015 | $ | 166 | $ | 65 | $ | 138 | $ | 182 | $ | 551 | ||||||||||
Originations | 168 | — | 13 | — | 181 | |||||||||||||||
Sales | (257 | ) | — | — | — | (257 | ) | |||||||||||||
Principal payments/amortization | — | — | (10 | ) | (2 | ) | (12 | ) | ||||||||||||
Change in fair value, net | 4 | 1 | — | — | 5 | |||||||||||||||
Change in allowance for loan losses | — | — | — | — | — | |||||||||||||||
Carrying value at September 30, 2015 | $ | 81 | $ | 66 | $ | 141 | $ | 180 | $ | 468 | ||||||||||
Originations | 100 | — | — | — | 100 | |||||||||||||||
Sales | (141 | ) | — | — | — | (141 | ) | |||||||||||||
Principal payments/amortization | — | — | (7 | ) | (15 | ) | (22 | ) | ||||||||||||
Change in fair value, net | (1 | ) | (2 | ) | — | — | (3 | ) | ||||||||||||
Change in allowance for loan losses | — | — | — | — | — | |||||||||||||||
Carrying value at December 31, 2015 | $ | 39 | $ | 63 | $ | 135 | $ | 166 | $ | 403 | ||||||||||
(1) | A-notes presented above were previously sold to third-parties, but did not meet the sale criteria under GAAP and remain on our balance sheet, carried at fair value. As such, we recorded the cash received for the transfer of the loans as secured borrowings, which are also carried at a fair value of $63 million as of December 31, 2015. Our investment in the B-note portions of these loans was $5 million at December 31, 2015 and is included in the Unsecuritized Mezzanine column presented above. |
THE REDWOOD REVIEW I 4TH QUARTER 2015 |
40 |
F I N A N C I A L I N S I G H T S |
Commercial Loans Held-for-Investment | |||||||||||||
December 31, 2015 | |||||||||||||
Property Type | Number of Loans | Original Weighted Average DSCR (1) | Original Weighted Average LTV (2) | Average Loan Size ($ in millions) | |||||||||
Multifamily | 10 | 1.37 | 67 | % | $ | 6 | |||||||
Hospitality | 23 | 1.31 | 79 | % | 3 | ||||||||
Office | 12 | 1.22 | 77 | % | 7 | ||||||||
Retail | 11 | 1.18 | 77 | % | 5 | ||||||||
Self Storage | 3 | 1.39 | 75 | % | 6 | ||||||||
Other | 4 | 1.43 | 76 | % | 3 | ||||||||
Total portfolio | 63 | 1.28 | 75 | % | $ | 5 | |||||||
(1) | The debt service coverage ratio (DSCR) is defined as the property’s annual net operating income divided by the annual principal and interest payments. The weighted average DSCRs in this table are based on the ratios at the time the loans were originated and are not based on subsequent time periods during which there may have been increases or decreases in each property’s operating income. |
(2) | The loan-to-value (LTV) calculation is defined as the sum of the senior and all subordinate loan amounts divided by the value of the property at the time the loan was originated. |
THE REDWOOD REVIEW I 4TH QUARTER 2015 |
41 |
F I N A N C I A L I N S I G H T S |
Property Type (1) | Property Location (1) | |||||
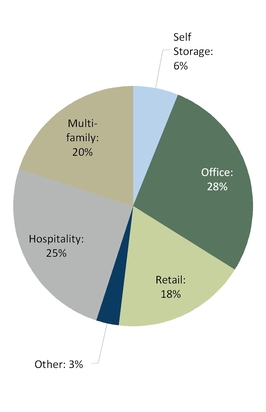
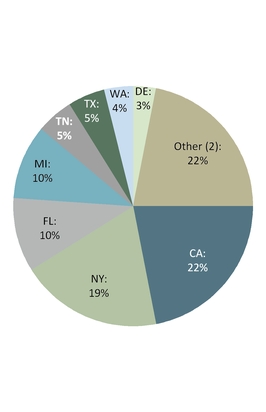
(1) Percentages based on outstanding loan balances. |
(2) Other includes AL, AR, CO, DC, MN, NJ, RI, and WV each with less than 3%; and 11 other states each with less than 1%. |
THE REDWOOD REVIEW I 4TH QUARTER 2015 |
42 |
F I N A N C I A L I N S I G H T S |
MSRs | ||||||||||||||||
($ in millions) | ||||||||||||||||
Three Months Ended | ||||||||||||||||
12/31/2015 | 9/30/2015 | |||||||||||||||
Fair Value | Associated Principal | Fair Value | Associated Principal | |||||||||||||
Beginning fair value | $ | 163 | $ | 16,735 | $ | 168 | $ | 15,066 | ||||||||
Additions | 21 | 2,079 | 23 | 2,134 | ||||||||||||
Sales | — | — | — | — | ||||||||||||
Change in fair value due to: | ||||||||||||||||
Changes in basis (1) | (5 | ) | (548 | ) | (5 | ) | (465 | ) | ||||||||
Changes in interest rates (2) | 13 | — | (24 | ) | — | |||||||||||
Ending fair value | $ | 192 | $ | 18,266 | $ | 163 | $ | 16,735 | ||||||||
(1) | Primarily represents changes due to the receipt of expected cash flows during the quarter. |
(2) | Primarily reflects changes in prepayment assumptions due to changes in benchmark interest rates. |
THE REDWOOD REVIEW I 4TH QUARTER 2015 |
43 |
F I N A N C I A L I N S I G H T S |
Financing Summary | ||||||||||||||||||||||
($ in millions) | ||||||||||||||||||||||
Secured Debt by Collateral Type | ||||||||||||||||||||||
Residential Loans Held-for Sale | Residential Loans Held-for-Investment | Residential Securities | Commercial Loans Held-for-Sale | Commercial Loans Held-for-Investment | TruPS and Convertible Debt | Total | ||||||||||||||||
Collateral securing debt | $ | 1,070 | $ | 1,675 | $ | 827 | $ | 18 | $ | 135 | N/A | N/A | ||||||||||
Short-term debt | $ | 950 | $ | 138 | $ | 694 | $ | 13 | $ | 60 | $ | — | $ | 1,855 | ||||||||
Long-term debt (1) | — | 1,343 | — | — | — | 632 | 1,975 | |||||||||||||||
Debt (2) | $ | 950 | $ | 1,481 | $ | 694 | $ | 13 | $ | 60 | $ | 632 | $ | 3,830 | ||||||||
Financing Summary | ||||||||||||||||||||||
Cost of funds | 1.90 | % | 0.46 | % | 1.47 | % | 2.61 | % | 4.46 | % | 6.12 | % | ||||||||||
Total borrowing capacity (3) | $ | 1,400 | $ | 2,000 | N/A | $ | 150 | $ | 150 | N/A | ||||||||||||
(1) | Excludes commercial secured borrowings. |
(2) | Excludes ABS issued and commercial secured borrowings. See Table 4 in the Financial Tables section of the Appendix to this Redwood Review for additional information on our consolidated debt. |
(3) | Represents our total uncommitted borrowing capacity. |
THE REDWOOD REVIEW I 4TH QUARTER 2015 |
44 |
F I N A N C I A L I N S I G H T S |
THE REDWOOD REVIEW I 4TH QUARTER 2015 |
45 |
F I N A N C I A L I N S I G H T S |
THE REDWOOD REVIEW I 4TH QUARTER 2015 |
46 |
THE REDWOOD REVIEW I 4TH QUARTER 2015 |
47 |

R E D W O O D' S B U S I N E S S O V E R V I E W |
THE REDWOOD REVIEW I 4TH QUARTER 2015 |
49 |
R E D W O O D' S B U S I N E S S O V E R V I E W |
THE REDWOOD REVIEW I 4TH QUARTER 2015 |
50 |
D I V I D E N D P O L I C Y |
THE REDWOOD REVIEW I 4TH QUARTER 2015 |
51 |
D I V I D E N D P O L I C Y |
THE REDWOOD REVIEW I 4TH QUARTER 2015 |
52 |
G L O S S A R Y |
THE REDWOOD REVIEW I 4TH QUARTER 2015 |
53 |
G L O S S A R Y |
THE REDWOOD REVIEW I 4TH QUARTER 2015 |
54 |
G L O S S A R Y |
THE REDWOOD REVIEW I 4TH QUARTER 2015 |
55 |
G L O S S A R Y |
THE REDWOOD REVIEW I 4TH QUARTER 2015 |
56 |
G L O S S A R Y |
THE REDWOOD REVIEW I 4TH QUARTER 2015 |
57 |
G L O S S A R Y |
THE REDWOOD REVIEW I 4TH QUARTER 2015 |
58 |
G L O S S A R Y |
THE REDWOOD REVIEW I 4TH QUARTER 2015 |
59 |
G L O S S A R Y |
THE REDWOOD REVIEW I 4TH QUARTER 2015 |
60 |
G L O S S A R Y |
THE REDWOOD REVIEW I 4TH QUARTER 2015 |
61 |
G L O S S A R Y |
THE REDWOOD REVIEW I 4TH QUARTER 2015 |
62 |
G L O S S A R Y |
THE REDWOOD REVIEW I 4TH QUARTER 2015 |
63 |
THE REDWOOD REVIEW I 4TH QUARTER 2015 |
64 |
G L O S S A R Y |

THE REDWOOD REVIEW I 4TH QUARTER 2015 |
65 |
 | Table 1: GAAP Earnings (in thousands, except per share data) | |||||||||||||||||||||||||||||||||||||||||||||
2015 Q4 | 2015 Q3 | 2015 Q2 | 2015 Q1 | 2014 Q4 | 2014 Q3 | 2014 Q2 | 2014 Q1 | 2013 Q4 | Twelve Months 2015 | Twelve Months 2014 | ||||||||||||||||||||||||||||||||||||
Interest income | $ | 60,074 | $ | 54,191 | $ | 53,857 | $ | 53,713 | $ | 56,029 | $ | 53,324 | $ | 48,347 | $ | 45,144 | $ | 48,331 | $ | 221,835 | $ | 202,844 | ||||||||||||||||||||||||
Discount amortization on securities, net | 8,573 | 9,115 | 9,324 | 9,838 | 10,061 | 10,890 | 10,586 | 11,298 | 10,311 | 36,850 | 42,835 | |||||||||||||||||||||||||||||||||||
Discount (premium) amortization on loans, net | 182 | 178 | 192 | 195 | (839 | ) | (863 | ) | (940 | ) | (967 | ) | (1,150 | ) | 747 | (3,609 | ) | |||||||||||||||||||||||||||||
Total interest income | 68,829 | 63,484 | 63,373 | 63,746 | 65,251 | 63,351 | 57,993 | 55,475 | 57,492 | 259,432 | 242,070 | |||||||||||||||||||||||||||||||||||
Interest expense on short-term debt | (9,194 | ) | (7,627 | ) | (6,527 | ) | (7,224 | ) | (8,581 | ) | (8,441 | ) | (5,141 | ) | (3,827 | ) | (3,715 | ) | (30,572 | ) | (25,990 | ) | ||||||||||||||||||||||||
Interest expense on ABS issued from consolidated trusts | (4,432 | ) | (5,190 | ) | (5,645 | ) | (6,202 | ) | (6,765 | ) | (7,838 | ) | (8,183 | ) | (8,441 | ) | (8,903 | ) | (21,469 | ) | (31,227 | ) | ||||||||||||||||||||||||
Interest expense on long-term debt | (11,413 | ) | (11,058 | ) | (10,836 | ) | (10,535 | ) | (8,557 | ) | (7,071 | ) | (7,826 | ) | (6,792 | ) | (6,910 | ) | (43,842 | ) | (30,246 | ) | ||||||||||||||||||||||||
Total interest expense | (25,039 | ) | (23,875 | ) | (23,008 | ) | (23,961 | ) | (23,903 | ) | (23,350 | ) | (21,150 | ) | (19,060 | ) | (19,528 | ) | (95,883 | ) | (87,463 | ) | ||||||||||||||||||||||||
Net interest income | 43,790 | 39,609 | 40,365 | 39,785 | 41,348 | 40,001 | 36,843 | 36,415 | 37,964 | 163,549 | 154,607 | |||||||||||||||||||||||||||||||||||
(Provision for) reversal of provision for loan losses – Residential | — | — | — | — | (1,562 | ) | 708 | 604 | (628 | ) | (3,374 | ) | — | (878 | ) | |||||||||||||||||||||||||||||||
(Provision for) reversal of provision for loan losses – Commercial | 240 | 60 | 261 | (206 | ) | (27 | ) | 888 | (289 | ) | (655 | ) | (869 | ) | 355 | (83 | ) | |||||||||||||||||||||||||||||
Net interest income after provision | 44,030 | 39,669 | 40,626 | 39,579 | 39,759 | 41,597 | 37,158 | 35,132 | 33,721 | 163,904 | 153,646 | |||||||||||||||||||||||||||||||||||
Non-interest income | ||||||||||||||||||||||||||||||||||||||||||||||
Mortgage banking and investment activities, net | ||||||||||||||||||||||||||||||||||||||||||||||
Residential mortgage banking | 885 | 331 | 4,833 | 2,217 | 9,850 | 11,430 | 1,341 | (1,068 | ) | 10,114 | 8,266 | 21,553 | ||||||||||||||||||||||||||||||||||
Commercial mortgage banking | (619 | ) | 1,002 | 2,613 | (292 | ) | 1,140 | 6,486 | 4,981 | 834 | 6,818 | 2,704 | 13,441 | |||||||||||||||||||||||||||||||||
Investments | (4,252 | ) | (14,169 | ) | (1,787 | ) | (1,147 | ) | 3,817 | (3,750 | ) | (4,134 | ) | (6,135 | ) | 390 | (21,355 | ) | (10,202 | ) | ||||||||||||||||||||||||||
Mortgage servicing rights income (loss), net | ||||||||||||||||||||||||||||||||||||||||||||||
MSR servicing fee income | 9,392 | 8,715 | 7,292 | 8,487 | 6,281 | 4,153 | 3,776 | 3,318 | 3,261 | 33,886 | 17,528 | |||||||||||||||||||||||||||||||||||
MSR market valuation adjustments | 7,676 | (28,717 | ) | 15,352 | (19,411 | ) | (15,192 | ) | 1,668 | (5,553 | ) | (2,712 | ) | 2,367 | (25,100 | ) | (21,789 | ) | ||||||||||||||||||||||||||||
MSR derivatives valuation adjustments (1) | (14,445 | ) | 23,551 | (21,814 | ) | — | — | — | — | — | — | (12,708 | ) | — | ||||||||||||||||||||||||||||||||
Realized gains, net | 20,199 | 5,548 | 6,316 | 4,306 | 4,790 | 8,532 | 1,063 | 1,093 | 1,968 | 36,369 | 15,478 | |||||||||||||||||||||||||||||||||||
Other income | 757 | 327 | 1,299 | 809 | 181 | 1,600 | — | — | — | 3,192 | 1,781 | |||||||||||||||||||||||||||||||||||
Total non-interest income (loss), net | 19,593 | (3,412 | ) | 14,104 | (5,031 | ) | 10,867 | 30,119 | 1,474 | (4,670 | ) | 24,918 | 25,254 | 37,790 | ||||||||||||||||||||||||||||||||
Fixed compensation expense | (8,009 | ) | (8,642 | ) | (9,286 | ) | (9,155 | ) | (7,948 | ) | (7,445 | ) | (6,872 | ) | (6,792 | ) | (5,750 | ) | (35,092 | ) | (29,057 | ) | ||||||||||||||||||||||||
Variable compensation expense | (1,470 | ) | (3,567 | ) | (3,578 | ) | (3,991 | ) | (6,462 | ) | (2,418 | ) | (3,021 | ) | (2,731 | ) | (3,908 | ) | (12,606 | ) | (14,632 | ) | ||||||||||||||||||||||||
Equity compensation expense | (2,809 | ) | (2,835 | ) | (3,539 | ) | (2,738 | ) | (2,335 | ) | (2,261 | ) | (2,824 | ) | (2,330 | ) | (2,196 | ) | (11,921 | ) | (9,750 | ) | ||||||||||||||||||||||||
Severance expense | — | — | — | — | (5 | ) | (4 | ) | (222 | ) | — | — | — | (231 | ) | |||||||||||||||||||||||||||||||
Other operating expense | (10,350 | ) | (9,453 | ) | (8,815 | ) | (9,179 | ) | (9,712 | ) | (9,278 | ) | (9,343 | ) | (8,120 | ) | (7,816 | ) | (37,797 | ) | (36,453 | ) | ||||||||||||||||||||||||
Total operating expenses | (22,638 | ) | (24,497 | ) | (25,218 | ) | (25,063 | ) | (26,462 | ) | (21,406 | ) | (22,282 | ) | (19,973 | ) | (19,670 | ) | (97,416 | ) | (90,123 | ) | ||||||||||||||||||||||||
Other expense | — | — | — | — | — | — | — | — | (12,000 | ) | — | — | ||||||||||||||||||||||||||||||||||
Benefit from (provision for) income taxes | 74 | 7,404 | (2,448 | ) | 5,316 | 2,959 | (5,213 | ) | (333 | ) | 1,843 | (1,835 | ) | 10,346 | (744 | ) | ||||||||||||||||||||||||||||||
Net income | $ | 41,059 | $ | 19,164 | $ | 27,064 | $ | 14,801 | $ | 27,123 | $ | 45,097 | $ | 16,017 | $ | 12,332 | $ | 25,134 | $ | 102,088 | $ | 100,569 | ||||||||||||||||||||||||
Diluted average shares | 103,377 | 85,075 | 94,950 | 85,622 | 85,384 | 96,956 | 85,033 | 84,941 | 84,395 | 84,518 | 85,099 | |||||||||||||||||||||||||||||||||||
Net income per share | $ | 0.46 | $ | 0.22 | $ | 0.31 | $ | 0.16 | $ | 0.31 | $ | 0.50 | $ | 0.18 | $ | 0.14 | $ | 0.29 | $ | 1.18 | $ | 1.15 | ||||||||||||||||||||||||
(1) | During the second quarter of 2015, we began to include market valuation adjustments of derivatives associated with our MSRs in MSR income (loss), net. Prior to the second quarter of 2015, valuation adjustments of MSR hedges were presented in mortgage banking and investment activities, net. |
THE REDWOOD REVIEW I 4TH QUARTER 2015 | Table 1: GAAP Earnings 66 | |
| Table 2: Segment Results ($ in thousands) | ||||||||||||||||||||||||||||||||||||||||||
Three Months Ended December 31, 2015 | Three Months Ended September 30, 2015 | ||||||||||||||||||||||||||||||||||||||||||
Residential Mortgage Banking | Residential Investments | Commercial Mortgage Banking and Investments | Corporate/ Other | Total | Residential Mortgage Banking | Residential Investments | Commercial Mortgage Banking and Investments | Corporate/ Other | Total | ||||||||||||||||||||||||||||||||||
Interest income | $ | 14,374 | $ | 37,060 | $ | 12,149 | $ | 5,246 | $ | 68,829 | $ | 12,115 | $ | 34,074 | $ | 11,191 | $ | 6,104 | $ | 63,484 | |||||||||||||||||||||||
Interest expense | (5,818 | ) | (3,067 | ) | (3,321 | ) | (12,833 | ) | (25,039 | ) | (4,313 | ) | (2,660 | ) | (3,502 | ) | (13,400 | ) | (23,875 | ) | |||||||||||||||||||||||
Net interest income (loss) | 8,556 | 33,993 | 8,828 | (7,587 | ) | 43,790 | 7,802 | 31,414 | 7,689 | (7,296 | ) | 39,609 | |||||||||||||||||||||||||||||||
Reversal of provision for loan losses | — | — | 240 | — | 240 | — | — | 60 | — | 60 | |||||||||||||||||||||||||||||||||
Net interest income (loss) after provision | 8,556 | 33,993 | 9,068 | (7,587 | ) | 44,030 | 7,802 | 31,414 | 7,749 | (7,296 | ) | 39,669 | |||||||||||||||||||||||||||||||
Non-interest income | |||||||||||||||||||||||||||||||||||||||||||
Mortgage banking and investment activities, net | 885 | (5,344 | ) | (620 | ) | 1,093 | (3,986 | ) | 331 | (13,622 | ) | 1,002 | (547 | ) | (12,836 | ) | |||||||||||||||||||||||||||
MSR income, net | — | 2,623 | — | — | 2,623 | — | 3,549 | — | — | 3,549 | |||||||||||||||||||||||||||||||||
Other income | — | 757 | — | — | 757 | — | 327 | — | — | 327 | |||||||||||||||||||||||||||||||||
Realized gains, net | — | 20,199 | — | — | 20,199 | — | 5,548 | — | — | 5,548 | |||||||||||||||||||||||||||||||||
Total non-interest income (loss) | 885 | 18,235 | (620 | ) | 1,093 | 19,593 | 331 | (4,198 | ) | 1,002 | (547 | ) | (3,412 | ) | |||||||||||||||||||||||||||||
Operating expenses | (9,968 | ) | (746 | ) | (1,694 | ) | (10,230 | ) | (22,638 | ) | (11,278 | ) | (1,311 | ) | (3,136 | ) | (8,772 | ) | (24,497 | ) | |||||||||||||||||||||||
Benefit from (provision for) income taxes | 608 | (2,977 | ) | 1,131 | 1,312 | 74 | 2,690 | 4,082 | (389 | ) | 1,021 | 7,404 | |||||||||||||||||||||||||||||||
Segment contribution | $ | 81 | $ | 48,505 | $ | 7,885 | $ | (15,412 | ) | $ | (455 | ) | $ | 29,987 | $ | 5,226 | $ | (15,594 | ) | ||||||||||||||||||||||||
Net income | $ | 41,059 | $ | 19,164 | |||||||||||||||||||||||||||||||||||||||
Additional information: | |||||||||||||||||||||||||||||||||||||||||||
Residential loans | $ | 1,115,738 | $ | 1,791,195 | $ | — | $ | 1,021,870 | $ | 3,928,803 | $ | 1,506,151 | $ | 1,360,277 | $ | — | $ | 1,170,246 | $ | 4,036,674 | |||||||||||||||||||||||
Commercial loans | — | — | 402,647 | — | 402,647 | — | — | 468,157 | — | 468,157 | |||||||||||||||||||||||||||||||||
Real estate securities | 197,007 | 1,028,171 | 8,078 | — | 1,233,256 | — | 1,085,224 | — | — | 1,085,224 | |||||||||||||||||||||||||||||||||
Mortgage servicing rights | — | 191,976 | — | — | 191,976 | — | 162,726 | — | — | 162,726 | |||||||||||||||||||||||||||||||||
Total Assets | 1,347,492 | 3,140,604 | 416,258 | 1,326,673 | 6,231,027 | 1,563,306 | 2,723,955 | 475,924 | 1,505,841 | 6,269,026 | |||||||||||||||||||||||||||||||||
THE REDWOOD REVIEW I 4TH QUARTER 2015 | Table 2: Segment Results 67 | |
| Table 3: Taxable and GAAP Income (1) Differences and Dividends ($ in thousands, except for per share data) | ||||||||||||||||||||||||||||||||||||
Estimated Twelve Months 2015 (2) | Actual Twelve Months 2014 (2) | Actual Twelve Months 2013 (2) | |||||||||||||||||||||||||||||||||||
Taxable Income | GAAP Income | Differences | Taxable Income | GAAP Income | Differences | Taxable Income | GAAP Income | Differences | |||||||||||||||||||||||||||||
Taxable and GAAP Income Differences | |||||||||||||||||||||||||||||||||||||
Interest income | $ | 227,825 | $ | 259,432 | $ | (31,607 | ) | $ | 206,214 | $ | 242,070 | $ | (35,856 | ) | $ | 209,317 | $ | 226,156 | $ | (16,839 | ) | ||||||||||||||||
Interest expense | (79,830 | ) | (95,883 | ) | 16,053 | (67,208 | ) | (87,463 | ) | 20,255 | (55,099 | ) | (80,971 | ) | 25,872 | ||||||||||||||||||||||
Net interest income | 147,995 | 163,549 | (15,554 | ) | 139,006 | 154,607 | (15,601 | ) | 154,218 | 145,185 | 9,033 | ||||||||||||||||||||||||||
Reversal of provision (provision for) loan losses | — | 355 | (355 | ) | — | (961 | ) | 961 | — | (4,737 | ) | 4,737 | |||||||||||||||||||||||||
Realized credit losses | (8,645 | ) | — | (8,645 | ) | (6,734 | ) | — | (6,734 | ) | (12,911 | ) | — | (12,911 | ) | ||||||||||||||||||||||
Mortgage banking and investment activities, net | (27,912 | ) | (10,385 | ) | (17,527 | ) | 3,498 | 24,792 | (21,294 | ) | 19,526 | 96,785 | (77,259 | ) | |||||||||||||||||||||||
MSR income (loss), net | 33,574 | (3,922 | ) | 37,496 | 15,763 | (4,261 | ) | 20,024 | 8,218 | 20,309 | (12,091 | ) | |||||||||||||||||||||||||
Operating expenses | (103,318 | ) | (97,416 | ) | (5,902 | ) | (97,435 | ) | (90,123 | ) | (7,312 | ) | (79,361 | ) | (86,607 | ) | 7,246 | ||||||||||||||||||||
Other income (expense), net | 2,174 | 3,192 | (1,018 | ) | (8,219 | ) | 1,781 | (10,000 | ) | — | (12,000 | ) | 12,000 | ||||||||||||||||||||||||
Realized gains, net | — | 36,369 | (36,369 | ) | — | 15,478 | (15,478 | ) | — | 25,259 | (25,259 | ) | |||||||||||||||||||||||||
(Provision for) benefit from income taxes | (122 | ) | 10,346 | (10,468 | ) | (132 | ) | (744 | ) | 612 | (283 | ) | (10,948 | ) | 10,665 | ||||||||||||||||||||||
Income | $ | 43,746 | $ | 102,088 | $ | (58,342 | ) | $ | 45,747 | $ | 100,569 | $ | (54,822 | ) | $ | 89,407 | $ | 173,246 | $ | (83,839 | ) | ||||||||||||||||
REIT taxable income | $ | 85,292 | $ | 63,989 | $ | 72,429 | |||||||||||||||||||||||||||||||
Taxable income (loss) at taxable subsidiaries | (41,546 | ) | (18,242 | ) | 16,978 | ||||||||||||||||||||||||||||||||
Taxable income | $ | 43,746 | $ | 45,747 | $ | 89,407 | |||||||||||||||||||||||||||||||
Shares used for taxable EPS calculation | 78,163 | 83,443 | 82,505 | ||||||||||||||||||||||||||||||||||
REIT taxable income per share (3) | $ | 1.05 | $ | 0.77 | $ | 0.88 | |||||||||||||||||||||||||||||||
Taxable income (loss) per share at taxable subsidiaries | $ | (0.50 | ) | $ | (0.22 | ) | $ | 0.21 | |||||||||||||||||||||||||||||
Taxable income per share (3) | $ | 0.55 | $ | 0.55 | $ | 1.09 | |||||||||||||||||||||||||||||||
Dividends | |||||||||||||||||||||||||||||||||||||
Dividends declared | $ | 92,493 | $ | 92,935 | $ | 92,005 | |||||||||||||||||||||||||||||||
Dividends per share (4) | $ | 1.12 | $ | 1.12 | $ | 1.12 | |||||||||||||||||||||||||||||||
(1) | Taxable income for 2015 is an estimate until we file our tax returns for this year. To the extent we expect to pay tax at the corporate level (generally as a result of activity at our taxable REIT subsidiaries), we are required to record a tax provision for GAAP reporting purposes. Any tax provision (or benefit) is not intended to reflect the actual amount we expect to pay (or receive as an income tax refund) as it is expected to be utilized in future periods, as GAAP income is earned at our TRS. It is our intention to retain any excess inclusion income generated in 2015 at our TRS and not pass it through to our shareholders. |
(2) | Reconciliation of GAAP income to taxable income (loss) for prior quarters is provided in the respective Redwood Reviews for those quarters. |
(3) | REIT taxable income per share and taxable income (loss) per share are based on the number of shares outstanding at the end of each quarter. The annual REIT taxable income per share and taxable income (loss) per share are the sum of the four quarterly per share estimates. |
(4) | Dividends in 2015 are expected to be characterized as 100% ordinary income (or $92 million). Dividends in 2014 were characterized as 90% ordinary income (or $84 million), and 10% return of capital (or $9 million). Dividends in 2013 were characterized as 89% ordinary income (or $82 million), and 11% return of capital (or $10 million). The portion of Redwood's dividends characterized as a return of capital is not taxable to a shareholder and reduces a shareholder's basis for shares held at each quarterly distribution date, but not to below $0. |
THE REDWOOD REVIEW I 4TH QUARTER 2015 | Table 3: Taxable and GAAP Income Differences and Dividends 68 | |
| Table 4: Financial Ratios and Book Value ($ in thousands, except per share data) | ||||||||||||||||||||||||||||||||||||||||||||
2015 Q4 | 2015 Q3 | 2015 Q2 | 2015 Q1 | 2014 Q4 | 2014 Q3 | 2014 Q2 | 2014 Q1 | 2013 Q4 | Twelve Months 2015 | Twelve Months 2014 | |||||||||||||||||||||||||||||||||||
Financial performance ratios | |||||||||||||||||||||||||||||||||||||||||||||
Net interest income | $ | 43,790 | $ | 39,609 | $ | 40,365 | $ | 39,785 | $ | 41,348 | $ | 40,001 | $ | 36,842 | $ | 36,416 | $ | 37,964 | $ | 163,549 | $ | 154,607 | |||||||||||||||||||||||
Operating expenses | $ | (22,638 | ) | $ | (24,497 | ) | $ | (25,218 | ) | $ | (25,063 | ) | $ | (26,462 | ) | $ | (21,408 | ) | $ | (22,282 | ) | $ | (19,971 | ) | $ | (19,670 | ) | $ | (97,416 | ) | $ | (90,123 | ) | ||||||||||||
GAAP net income | $ | 41,059 | $ | 19,164 | $ | 27,064 | $ | 14,801 | $ | 27,123 | $ | 45,096 | $ | 16,017 | $ | 12,333 | $ | 25,134 | $ | 102,088 | $ | 100,569 | |||||||||||||||||||||||
Average total assets | $ | 6,480,586 | $ | 5,977,645 | $ | 5,730,268 | $ | 5,866,851 | $ | 5,848,856 | $ | 5,631,421 | $ | 5,140,932 | $ | 4,791,512 | $ | 4,681,988 | $ | 6,015,420 | $ | 5,356,839 | |||||||||||||||||||||||
Average total equity | $ | 1,189,289 | $ | 1,244,327 | $ | 1,265,647 | $ | 1,262,883 | $ | 1,259,581 | $ | 1,254,352 | $ | 1,245,346 | $ | 1,243,006 | $ | 1,217,273 | $ | 1,240,345 | $ | 1,250,627 | |||||||||||||||||||||||
Operating expenses / average total assets | 1.40 | % | 1.64 | % | 1.76 | % | 1.71 | % | 1.81 | % | 1.52 | % | 1.73 | % | 1.67 | % | 1.68 | % | 1.62 | % | 1.68 | % | |||||||||||||||||||||||
Operating expenses / average total equity | 7.61 | % | 7.87 | % | 7.97 | % | 7.94 | % | 8.40 | % | 6.83 | % | 7.16 | % | 6.43 | % | 6.46 | % | 7.85 | % | 7.21 | % | |||||||||||||||||||||||
GAAP net income / average total assets | 2.53 | % | 1.28 | % | 1.89 | % | 1.01 | % | 1.85 | % | 3.20 | % | 1.25 | % | 1.03 | % | 2.15 | % | 1.70 | % | 1.88 | % | |||||||||||||||||||||||
GAAP net income / average equity (GAAP ROE) | 13.81 | % | 6.16 | % | 8.55 | % | 4.69 | % | 8.61 | % | 14.38 | % | 5.14 | % | 3.97 | % | 8.26 | % | 8.23 | % | 8.04 | % | |||||||||||||||||||||||
Leverage ratios and book value per share | |||||||||||||||||||||||||||||||||||||||||||||
Short-term debt | $ | 1,855,003 | $ | 1,872,793 | $ | 1,367,062 | $ | 1,502,164 | $ | 1,793,825 | $ | 1,887,688 | $ | 1,718,430 | $ | 1,288,761 | $ | 862,763 | |||||||||||||||||||||||||||
Long-term debt – Commercial secured borrowing | 63,152 | 65,578 | 65,232 | 68,077 | 66,707 | 66,146 | 66,692 | 34,774 | — | ||||||||||||||||||||||||||||||||||||
Long-term debt – Other | 1,975,023 | 1,756,299 | 1,514,122 | 1,482,792 | 1,127,860 | 630,756 | 479,916 | 478,458 | 476,467 | ||||||||||||||||||||||||||||||||||||
Total debt at Redwood | $ | 3,893,178 | $ | 3,694,670 | $ | 2,946,416 | $ | 3,053,033 | $ | 2,988,392 | $ | 2,584,590 | $ | 2,265,038 | $ | 1,801,993 | $ | 1,339,230 | |||||||||||||||||||||||||||
ABS issued at consolidated entities | |||||||||||||||||||||||||||||||||||||||||||||
Residential Resecuritization ABS issued | $ | — | $ | 5,261 | $ | 18,872 | $ | 34,280 | $ | 45,044 | $ | 56,508 | $ | 69,709 | $ | 82,179 | $ | 94,934 | |||||||||||||||||||||||||||
Commercial Securitization ABS issued | 53,137 | 67,946 | 69,914 | 79,676 | 83,313 | 114,943 | 144,700 | 147,574 | 153,693 | ||||||||||||||||||||||||||||||||||||
Legacy Sequoia entities ABS issued | 996,820 | 1,105,588 | 1,173,336 | 1,239,065 | 1,416,762 | 1,484,751 | 1,553,669 | 1,624,591 | 1,694,335 | ||||||||||||||||||||||||||||||||||||
Total ABS issued | $ | 1,049,957 | $ | 1,178,795 | $ | 1,262,122 | $ | 1,353,021 | $ | 1,545,119 | $ | 1,656,202 | $ | 1,768,078 | $ | 1,854,344 | $ | 1,942,962 | |||||||||||||||||||||||||||
Consolidated GAAP Debt | $ | 4,943,135 | $ | 4,873,465 | $ | 4,208,538 | $ | 4,406,054 | $ | 4,533,511 | $ | 4,240,792 | $ | 4,033,116 | $ | 3,656,337 | $ | 3,282,192 | |||||||||||||||||||||||||||
Stockholders' equity | $ | 1,146,265 | $ | 1,206,575 | $ | 1,264,785 | $ | 1,257,210 | $ | 1,256,142 | $ | 1,266,678 | $ | 1,248,904 | $ | 1,250,887 | $ | 1,245,783 | |||||||||||||||||||||||||||
Debt at Redwood to stockholders' equity (1) | 3.4x | 3.1x | 2.3x | 2.4x | 2.3x | 2.0x | 1.8x | 1.4x | 1.1x | ||||||||||||||||||||||||||||||||||||
Consolidated GAAP debt to stockholders' equity | 4.3x | 4.0x | 3.3x | 3.5x | 3.6x | 3.4x | 3.2x | 2.9x | 2.6x | ||||||||||||||||||||||||||||||||||||
Shares outstanding at period end (in thousands) | 78,163 | 82,125 | 84,552 | 83,749 | 83,443 | 83,284 | 83,080 | 82,620 | 82,505 | ||||||||||||||||||||||||||||||||||||
Book value per share | $ | 14.67 | $ | 14.69 | $ | 14.96 | $ | 15.01 | $ | 15.05 | $ | 15.21 | $ | 15.03 | $ | 15.14 | $ | 15.10 | |||||||||||||||||||||||||||
(1) | Excludes obligations of consolidated securitization entities, including legacy Sequoia securitizations completed prior to 2012, the residential resecuritization completed in 2011, and the commercial securitization completed in 2012. Also excludes commercial secured borrowings associated with commercial A-notes that were sold, but treated as secured borrowings under GAAP. |
THE REDWOOD REVIEW I 4TH QUARTER 2015 | Table 4: Financial Ratios and Book Value 69 | |
| Table 5: Average Balance Sheet ($ in thousands) | ||||||||||||||||||||||||||||||||||||||||||||
2015 Q4 | 2015 Q3 | 2015 Q2 | 2015 Q1 | 2014 Q4 | 2014 Q3 | 2014 Q2 | 2014 Q1 | 2013 Q4 | Twelve Months 2015 | Twelve Months 2014 | |||||||||||||||||||||||||||||||||||
Real estate loans | |||||||||||||||||||||||||||||||||||||||||||||
Residential loans, held-for-sale | $ | 1,488,896 | $ | 1,295,017 | $ | 1,080,448 | $ | 1,292,153 | $ | 1,433,059 | $ | 1,268,231 | $ | 739,934 | $ | 518,054 | $ | 554,467 | $ | 1,289,684 | $ | 993,089 | |||||||||||||||||||||||
Residential loans, held-for-investment at Sequoias (1) | 1,088,566 | 1,191,702 | 1,259,923 | 1,362,612 | 1,496,685 | 1,570,425 | 1,642,410 | 1,711,438 | 1,793,535 | 1,224,857 | 1,604,556 | ||||||||||||||||||||||||||||||||||
Residential loans, held-for-investment at Redwood | 1,566,959 | 1,167,534 | 1,017,835 | 667,543 | 370,886 | 100,409 | — | — | — | 1,107,603 | 118,792 | ||||||||||||||||||||||||||||||||||
Commercial loans, held-for-sale | 59,535 | 134,658 | 107,025 | 137,977 | 214,110 | 170,156 | 75,449 | 68,169 | 73,204 | 109,652 | 132,475 | ||||||||||||||||||||||||||||||||||
Commercial loans, held-for-investment, at fair value | 69,987 | 69,712 | 72,524 | 71,224 | 70,663 | 71,205 | 69,565 | 20,626 | — | 70,855 | 58,188 | ||||||||||||||||||||||||||||||||||
Commercial loans, held-for-investment, at amortized cost | 309,577 | 322,989 | 328,193 | 336,258 | 322,723 | 349,288 | 343,815 | 343,705 | 346,333 | 324,178 | 339,851 | ||||||||||||||||||||||||||||||||||
Senior residential securities | |||||||||||||||||||||||||||||||||||||||||||||
Prime | 370,769 | 298,428 | 331,394 | 352,583 | 388,577 | 611,211 | 835,987 | 725,551 | 586,675 | 338,235 | 639,329 | ||||||||||||||||||||||||||||||||||
Non-prime | 120,429 | 149,589 | 156,383 | 161,163 | 164,940 | 169,741 | 171,033 | 174,811 | 178,994 | 146,787 | 170,103 | ||||||||||||||||||||||||||||||||||
Total senior residential securities | 491,198 | 448,017 | 487,777 | 513,746 | 553,517 | 780,952 | 1,007,020 | 900,362 | 765,669 | 485,022 | 809,432 | ||||||||||||||||||||||||||||||||||
Residential Re-REMIC securities | 107,384 | 105,572 | 103,384 | 101,238 | 106,433 | 114,433 | 115,746 | 109,753 | 102,836 | 104,414 | 111,590 | ||||||||||||||||||||||||||||||||||
Subordinate residential securities | 409,017 | 400,429 | 429,827 | 554,460 | 521,647 | 532,881 | 530,273 | 509,906 | 492,708 | 447,903 | 523,734 | ||||||||||||||||||||||||||||||||||
Mortgage servicing rights | 177,554 | 168,208 | 144,472 | 128,001 | 134,438 | 81,968 | 65,705 | 62,943 | 60,822 | 154,732 | 86,447 | ||||||||||||||||||||||||||||||||||
Total real estate assets | 5,768,673 | 5,303,838 | 5,031,408 | 5,165,212 | 5,224,161 | 5,039,948 | 4,589,917 | 4,244,956 | 4,189,574 | 5,318,900 | 4,778,154 | ||||||||||||||||||||||||||||||||||
Cash and cash equivalents | 241,613 | 204,746 | 222,362 | 232,575 | 182,372 | 151,447 | 131,557 | 159,089 | 167,453 | 225,292 | 156,167 | ||||||||||||||||||||||||||||||||||
Earning assets | 6,010,286 | 5,508,584 | 5,253,770 | 5,397,787 | 5,406,533 | 5,191,395 | 4,721,474 | 4,404,045 | 4,357,027 | 5,544,192 | 4,934,321 | ||||||||||||||||||||||||||||||||||
Balance sheet mark-to-market adjustments | 109,261 | 132,059 | 139,864 | 138,547 | 151,304 | 162,695 | 162,081 | 153,975 | 125,953 | 129,858 | 157,521 | ||||||||||||||||||||||||||||||||||
Earning assets – reported value | 6,119,547 | 5,640,643 | 5,393,634 | 5,536,334 | 5,557,837 | 5,354,090 | 4,883,555 | 4,558,020 | 4,482,980 | 5,674,050 | 5,091,842 | ||||||||||||||||||||||||||||||||||
Other assets | 361,039 | 337,002 | 336,634 | 330,517 | 291,019 | 277,331 | 257,377 | 233,492 | 199,008 | 341,370 | 264,997 | ||||||||||||||||||||||||||||||||||
Total assets | $ | 6,480,586 | $ | 5,977,645 | $ | 5,730,268 | $ | 5,866,851 | $ | 5,848,856 | $ | 5,631,421 | $ | 5,140,932 | $ | 4,791,512 | $ | 4,681,988 | $ | 6,015,420 | $ | 5,356,839 | |||||||||||||||||||||||
Short-term debt | $ | 2,015,417 | $ | 1,693,263 | $ | 1,380,965 | $ | 1,590,179 | $ | 1,868,906 | $ | 1,873,704 | $ | 1,329,568 | $ | 1,006,349 | $ | 893,481 | $ | 1,671,184 | $ | 1,522,966 | |||||||||||||||||||||||
Residential Resecuritization ABS issued | 274 | 9,688 | 24,269 | 37,313 | 48,687 | 60,932 | 73,617 | 85,236 | 99,940 | 17,762 | 67,001 | ||||||||||||||||||||||||||||||||||
Commercial Securitization ABS issued | 58,141 | 67,100 | 75,283 | 80,637 | 85,089 | 123,012 | 142,400 | 144,936 | 150,716 | 70,220 | 123,693 | ||||||||||||||||||||||||||||||||||
Consolidated Sequoia ABS issued | 1,042,797 | 1,128,333 | 1,195,749 | 1,295,852 | 1,437,258 | 1,507,998 | 1,577,888 | 1,644,626 | 1,722,583 | 1,164,888 | 1,541,281 | ||||||||||||||||||||||||||||||||||
Other liabilities | 258,709 | 238,303 | 229,994 | 354,375 | 266,368 | 243,917 | 240,977 | 186,997 | 131,277 | 269,996 | 234,808 | ||||||||||||||||||||||||||||||||||
Other long-term debt | 1,915,959 | 1,596,631 | 1,558,361 | 1,245,612 | 882,967 | 567,506 | 531,136 | 480,362 | 466,718 | 1,581,025 | 616,463 | ||||||||||||||||||||||||||||||||||
Total liabilities | 5,291,297 | 4,733,318 | 4,464,621 | 4,603,968 | 4,589,275 | 4,377,069 | 3,895,586 | 3,548,506 | 3,464,715 | 4,775,075 | 4,106,212 | ||||||||||||||||||||||||||||||||||
Total equity | 1,189,289 | 1,244,327 | 1,265,647 | 1,262,883 | 1,259,581 | 1,254,352 | 1,245,346 | 1,243,006 | 1,217,273 | 1,240,345 | 1,250,627 | ||||||||||||||||||||||||||||||||||
Total liabilities and equity | $ | 6,480,586 | $ | 5,977,645 | $ | 5,730,268 | $ | 5,866,851 | $ | 5,848,856 | $ | 5,631,421 | $ | 5,140,932 | $ | 4,791,512 | $ | 4,681,988 | $ | 6,015,420 | $ | 5,356,839 | |||||||||||||||||||||||
(1) | Residential loans held-for-investment at Sequoias is comprised of loans held in consolidated Sequoia entities. |
THE REDWOOD REVIEW I 4TH QUARTER 2015 | Table 5: Average Balance Sheet 70 | |
| Table 6: Balance & Yields by Portfolio (1) ($ in thousands) | |||||||||||||||||||||||||||||||||||||||||||||||||||
2015 Q4 | 2015 Q3 | 2015 Q2 | 2015 Q1 | 2014 Q4 | 2014 Q3 | 2015 Q4 | 2015 Q3 | 2015 Q2 | 2015 Q1 | 2014 Q4 | 2014 Q3 | |||||||||||||||||||||||||||||||||||||||||
Securities – Prime Senior | Securities – Subordinate | |||||||||||||||||||||||||||||||||||||||||||||||||||
Principal balance | $ | 434,768 | $ | 279,793 | $ | 305,660 | $ | 305,502 | $ | 317,626 | $ | 366,122 | Principal balance | $ | 658,403 | $ | 560,529 | $ | 596,127 | $ | 693,179 | $ | 763,501 | $ | 705,661 | |||||||||||||||||||||||||||
Unamortized discount | (21,295 | ) | (27,497 | ) | (30,713 | ) | (32,612 | ) | (34,833 | ) | (41,242 | ) | Unamortized discount | (153,697 | ) | (147,867 | ) | (153,368 | ) | (155,943 | ) | (162,249 | ) | (154,391 | ) | |||||||||||||||||||||||||||
Credit reserve | (1,305 | ) | (2,377 | ) | (2,650 | ) | (2,830 | ) | (3,660 | ) | (4,082 | ) | Credit reserve | (32,131 | ) | (32,865 | ) | (36,804 | ) | (39,060 | ) | (41,561 | ) | (43,346 | ) | |||||||||||||||||||||||||||
Unrealized gains, net | 16,772 | 23,600 | 29,090 | 31,301 | 34,682 | 41,307 | Unrealized gains, net | 61,775 | 70,406 | 67,858 | 71,536 | 61,589 | 57,249 | |||||||||||||||||||||||||||||||||||||||
Interest-only securities | 30,623 | 29,062 | 40,000 | 62,320 | 87,800 | 97,321 | Interest-only securities | 240 | 247 | 234 | 283 | 293 | 289 | |||||||||||||||||||||||||||||||||||||||
Fair value | $ | 459,563 | $ | 302,581 | $ | 341,387 | $ | 363,681 | $ | 401,615 | $ | 459,426 | Fair value | $ | 534,590 | $ | 450,450 | $ | 474,047 | $ | 569,995 | $ | 621,573 | $ | 565,462 | |||||||||||||||||||||||||||
Average amortized cost | $ | 370,769 | $ | 298,428 | $ | 331,394 | $ | 352,583 | $ | 388,577 | $ | 611,211 | Mezzanine (3) | |||||||||||||||||||||||||||||||||||||||
Interest income | $ | 7,066 | $ | 6,722 | $ | 8,252 | $ | 9,506 | $ | 10,434 | $ | 13,229 | Average amortized cost | $ | 267,974 | $ | 271,554 | $ | 290,927 | $ | 421,731 | $ | 408,600 | $ | 421,111 | |||||||||||||||||||||||||||
Annualized yield (2) | 7.62 | % | 9.01 | % | 9.96 | % | 10.78 | % | 10.74 | % | 8.66 | % | Interest income | $ | 3,533 | $ | 3,561 | $ | 3,895 | $ | 5,392 | $ | 5,092 | $ | 5,308 | |||||||||||||||||||||||||||
Annualized yield | 5.27 | % | 5.25 | % | 5.36 | % | 5.11 | % | 4.98 | % | 5.04 | % | ||||||||||||||||||||||||||||||||||||||||
Securities – Non-Prime Senior | ||||||||||||||||||||||||||||||||||||||||||||||||||||
Principal balance | $ | 75,591 | $ | 174,285 | $ | 182,719 | $ | 190,790 | $ | 196,258 | $ | 202,811 | Subordinate (3) | |||||||||||||||||||||||||||||||||||||||
Unamortized discount | (8,395 | ) | (25,505 | ) | (27,533 | ) | (29,791 | ) | (31,491 | ) | (33,675 | ) | Average amortized cost | $ | 141,044 | $ | 128,875 | $ | 138,900 | $ | 132,730 | $ | 113,047 | $ | 111,770 | |||||||||||||||||||||||||||
Credit reserve | (5,101 | ) | (8,964 | ) | (9,175 | ) | (9,027 | ) | (9,644 | ) | (9,894 | ) | Interest income | $ | 3,930 | $ | 4,087 | $ | 4,225 | $ | 4,237 | $ | 4,413 | $ | 4,135 | |||||||||||||||||||||||||||
Unrealized gains, net | 6,162 | 18,224 | 20,365 | 22,902 | 24,621 | 26,980 | Annualized yield | 11.15 | % | 12.69 | % | 12.17 | % | 12.77 | % | 15.61 | % | 14.80 | % | |||||||||||||||||||||||||||||||||
Interest-only securities | 5,782 | 6,514 | 6,705 | 7,454 | 7,951 | 7,758 | ||||||||||||||||||||||||||||||||||||||||||||||
Fair value | $ | 74,039 | $ | 164,554 | $ | 173,081 | $ | 182,328 | $ | 187,695 | $ | 193,980 | Residential Loans, held-for-investment (excludes legacy Sequoia) | |||||||||||||||||||||||||||||||||||||||
Average amortized cost | $ | 120,429 | $ | 149,589 | $ | 156,383 | $ | 161,163 | $ | 164,940 | $ | 169,741 | Principal balance | $ | 1,758,990 | $ | 1,325,626 | $ | 1,131,844 | $ | 971,541 | $ | 566,371 | $ | 233,142 | |||||||||||||||||||||||||||
Interest income | $ | 3,215 | $ | 3,824 | $ | 3,946 | $ | 4,210 | $ | 4,370 | $ | 4,507 | Unrealized gains, net | 32,205 | 34,651 | 25,441 | 28,903 | 15,296 | 5,509 | |||||||||||||||||||||||||||||||||
Annualized yield | 10.68 | % | 10.23 | % | 10.09 | % | 10.45 | % | 10.60 | % | 10.62 | % | Fair value | $ | 1,791,195 | $ | 1,360,277 | $ | 1,157,285 | $ | 1,000,444 | $ | 581,667 | $ | 238,651 | |||||||||||||||||||||||||||
Securities – Re-REMIC | Average amortized cost | $ | 1,566,959 | $ | 1,167,534 | $ | 1,017,835 | $ | 667,543 | $ | 370,886 | $ | 100,409 | |||||||||||||||||||||||||||||||||||||||
Principal balance | $ | 189,782 | $ | 192,215 | $ | 193,221 | $ | 194,296 | $ | 195,098 | $ | 206,212 | Interest income | $ | 15,526 | $ | 11,258 | $ | 9,370 | $ | 6,522 | $ | 3,427 | $ | 1,057 | |||||||||||||||||||||||||||
Unamortized discount | (71,670 | ) | (74,377 | ) | (75,658 | ) | (79,401 | ) | (79,611 | ) | (80,986 | ) | Annualized yield | 3.96 | % | 3.86 | % | 3.68 | % | 3.91 | % | 3.70 | % | 4.21 | % | |||||||||||||||||||||||||||
Credit reserve | (10,332 | ) | (11,135 | ) | (13,071 | ) | (12,667 | ) | (15,202 | ) | (16,553 | ) | ||||||||||||||||||||||||||||||||||||||||
Unrealized gains, net | 57,284 | 60,936 | 64,592 | 67,011 | 68,062 | 67,444 | Commercial Loans, held-for-investment at amortized cost | |||||||||||||||||||||||||||||||||||||||||||||
Fair value | $ | 165,064 | $ | 167,639 | $ | 169,084 | $ | 169,239 | $ | 168,347 | $ | 176,117 | Principal balance | $ | 311,553 | $ | 333,442 | $ | 332,122 | $ | 350,188 | $ | 346,305 | $ | 336,825 | |||||||||||||||||||||||||||
Unamortized discount | (4,096 | ) | (4,278 | ) | (4,476 | ) | (4,668 | ) | (4,863 | ) | (2,253 | ) | ||||||||||||||||||||||||||||||||||||||||
Average amortized cost | $ | 107,384 | $ | 105,572 | $ | 103,384 | $ | 101,238 | $ | 106,433 | $ | 114,433 | Credit reserve | (7,102 | ) | (7,341 | ) | (7,401 | ) | (7,662 | ) | (7,456 | ) | (7,429 | ) | |||||||||||||||||||||||||||
Interest income | $ | 4,341 | $ | 4,555 | $ | 4,524 | $ | 4,428 | $ | 4,122 | $ | 4,278 | Carrying value | $ | 300,355 | $ | 321,823 | $ | 320,245 | $ | 337,858 | $ | 333,986 | $ | 327,143 | |||||||||||||||||||||||||||
Annualized yield | 16.17 | % | 17.26 | % | 17.50 | % | 17.50 | % | 15.49 | % | 14.95 | % | ||||||||||||||||||||||||||||||||||||||||
Average amortized cost | $ | 309,577 | $ | 322,989 | $ | 328,193 | $ | 336,258 | $ | 322,723 | $ | 349,288 | ||||||||||||||||||||||||||||||||||||||||
Interest income | $ | 10,508 | $ | 8,760 | $ | 10,551 | $ | 8,855 | $ | 10,071 | $ | 9,663 | ||||||||||||||||||||||||||||||||||||||||
Annualized yield | 13.58 | % | 10.85 | % | 12.86 | % | 10.53 | % | 12.48 | % | 11.07 | % | ||||||||||||||||||||||||||||||||||||||||
(1) | Annualized yields for AFS securities portfolios are based on average amortized cost. |
(2) | Yields for prime senior securities includes investments in Sequoia IO securities and Sequoia senior securities held in our Residential Mortgage Banking segment, for which yields are calculated using fair value, as these are trading securities. |
(3) | Mezzanine and subordinate together comprise our subordinate portfolio of securities. We have shown them separately to present their different yield profiles. |
THE REDWOOD REVIEW I 4TH QUARTER 2015 | Table 6: Balances & Yields by Portfolio 71 | |
| Table 7: Securities and Loan Portfolio Activity ($ in thousands) | ||||||||||||||||||||||||||||||||||||||||||||||||||||
2015 Q4 | 2015 Q3 | 2015 Q2 | 2015 Q1 | 2014 Q4 | 2014 Q3 | 2015 Q4 | 2015 Q3 | 2015 Q2 | 2015 Q1 | 2014 Q4 | 2014 Q3 | ||||||||||||||||||||||||||||||||||||||||||
Securities – Prime Senior | Residential Loans, held-for-sale | ||||||||||||||||||||||||||||||||||||||||||||||||||||
Beginning fair value | $ | 302,581 | $ | 341,387 | $ | 363,681 | $ | 401,615 | $ | 459,426 | $ | 871,021 | Beginning carrying value | $ | 1,506,151 | $ | 892,081 | $ | 1,094,885 | $ | 1,342,520 | $ | 1,502,429 | $ | 1,107,877 | ||||||||||||||||||||||||||||
Acquisitions | 203,406 | — | 34,686 | 6,972 | 5,918 | 3,522 | Acquisitions | 2,163,783 | 2,987,187 | 2,847,135 | 2,477,644 | 2,755,689 | 3,387,875 | ||||||||||||||||||||||||||||||||||||||||
Sales | (21,547 | ) | (3,623 | ) | (44,157 | ) | (15,091 | ) | (33,752 | ) | (380,112 | ) | Sales | (2,101,933 | ) | (2,132,895 | ) | (2,816,143 | ) | (2,265,449 | ) | (2,567,113 | ) | (2,757,955 | ) | ||||||||||||||||||||||||||||
Effect of principal payments | (20,508 | ) | (17,508 | ) | (20,988 | ) | (14,650 | ) | (16,922 | ) | (34,879 | ) | Principal repayments | (33,259 | ) | (17,802 | ) | (14,794 | ) | (14,097 | ) | (10,407 | ) | (7,687 | ) | ||||||||||||||||||||||||||||
Change in fair value, net | (4,369 | ) | (17,675 | ) | 8,165 | (15,165 | ) | (13,055 | ) | (126 | ) | Transfers between portfolios | (412,824 | ) | (233,429 | ) | (215,826 | ) | (447,791 | ) | (354,794 | ) | (241,282 | ) | |||||||||||||||||||||||||||||
Ending fair value | $ | 459,563 | $ | 302,581 | $ | 341,387 | $ | 363,681 | $ | 401,615 | $ | 459,426 | Changes in fair value, net | (6,180 | ) | 11,009 | (3,176 | ) | 2,058 | 16,716 | 13,601 | ||||||||||||||||||||||||||||||||
Ending fair value | $ | 1,115,738 | $ | 1,506,151 | $ | 892,081 | $ | 1,094,884 | $ | 1,342,520 | $ | 1,502,429 | |||||||||||||||||||||||||||||||||||||||||
Securities – Non-Prime Senior | Residential Loans, held-for-investment (excluding consolidated Sequoia Entities) | ||||||||||||||||||||||||||||||||||||||||||||||||||||
Beginning fair value | $ | 164,554 | $ | 173,081 | $ | 182,328 | 187,695 | 193,980 | $ | 200,636 | Beginning carrying value | $ | 1,360,277 | $ | 1,157,285 | $ | 1,000,444 | $ | 581,667 | $ | 238,651 | $ | — | ||||||||||||||||||||||||||||||
Acquisitions | 700 | — | — | — | — | (31 | ) | Acquisitions | — | — | — | — | — | 453 | |||||||||||||||||||||||||||||||||||||||
Sales | (71,870 | ) | — | — | — | — | — | Principal repayments | (62,020 | ) | (39,514 | ) | (53,104 | ) | (30,902 | ) | (12,060 | ) | (2,092 | ) | |||||||||||||||||||||||||||||||||
Effect of principal payments | (7,579 | ) | (7,510 | ) | (7,300 | ) | (4,992 | ) | (6,066 | ) | (6,495 | ) | Transfers between portfolios | 504,445 | 233,429 | 215,830 | 447,791 | 354,794 | 241,282 | ||||||||||||||||||||||||||||||||||
Change in fair value, net | (11,766 | ) | (1,017 | ) | (1,947 | ) | (375 | ) | (219 | ) | (130 | ) | Changes in fair value, net | (11,507 | ) | 9,077 | (5,885 | ) | 1,978 | 282 | (992 | ) | |||||||||||||||||||||||||||||||
Ending fair value | $ | 74,039 | $ | 164,554 | $ | 173,081 | $ | 182,328 | $ | 187,695 | $ | 193,980 | Ending fair value | $ | 1,791,195 | $ | 1,360,277 | $ | 1,157,285 | $ | 1,000,444 | $ | 581,667 | $ | 238,651 | ||||||||||||||||||||||||||||
Securities – Re-REMIC | Residential Loans, held-for-investment at Consolidated Sequoia Entities | ||||||||||||||||||||||||||||||||||||||||||||||||||||
Beginning fair value | $ | 167,639 | $ | 169,084 | $ | 169,239 | $ | 168,347 | $ | 176,117 | $ | 192,596 | Beginning carrying value | $ | 1,170,246 | $ | 1,237,114 | $ | 1,304,426 | $ | 1,474,386 | $ | 1,546,507 | $ | 1,616,504 | ||||||||||||||||||||||||||||
Acquisitions | — | — | — | — | — | — | Principal repayments | (57,523 | ) | (65,556 | ) | (68,547 | ) | (67,250 | ) | (69,325 | ) | (67,025 | ) | ||||||||||||||||||||||||||||||||||
Sales | (1,170 | ) | — | — | — | (10,060 | ) | (9,458 | ) | Charge-Offs | — | — | — | — | 2,133 | 1,354 | |||||||||||||||||||||||||||||||||||||
Effect of principal payments | (87 | ) | (123 | ) | (182 | ) | (126 | ) | (66 | ) | — | Transfers to REO | (1,742 | ) | (893 | ) | (1,241 | ) | (1,916 | ) | (2,338 | ) | (3,988 | ) | |||||||||||||||||||||||||||||
Change in fair value, net | (1,318 | ) | (1,322 | ) | 27 | 1,018 | 2,356 | (7,021 | ) | Loan loss (provision) reversal | — | — | — | — | (1,562 | ) | 708 | ||||||||||||||||||||||||||||||||||||
Ending fair value | $ | 165,064 | $ | 167,639 | $ | 169,084 | $ | 169,239 | $ | 168,347 | $ | 176,117 | Discount amortization, net | — | — | — | — | (1,029 | ) | (1,046 | ) | ||||||||||||||||||||||||||||||||
Adoption of ASU 2014-13 | — | — | — | (103,649 | ) | — | — | ||||||||||||||||||||||||||||||||||||||||||||||
Securities – Subordinate (1) | Transfers between portfolios | (91,621 | ) | — | — | — | — | — | |||||||||||||||||||||||||||||||||||||||||||||
Beginning fair value | $ | 450,450 | $ | 474,047 | $ | 569,995 | $ | 621,573 | $ | 565,462 | $ | 580,814 | Changes in fair value, net | 2,510 | (419 | ) | 2,476 | 2,855 | — | — | |||||||||||||||||||||||||||||||||
Acquisitions | 113,037 | 9,423 | 39,193 | 25,943 | 54,722 | 39,330 | Ending fair value | $ | 1,021,870 | $ | 1,170,246 | $ | 1,237,114 | $ | 1,304,426 | $ | 1,474,386 | $ | 1,546,507 | ||||||||||||||||||||||||||||||||||
Sales | (15,806 | ) | (29,462 | ) | (127,353 | ) | (85,017 | ) | — | (58,273 | ) | ||||||||||||||||||||||||||||||||||||||||||
Effect of principal payments | (5,016 | ) | (4,715 | ) | (4,176 | ) | (5,179 | ) | (4,568 | ) | (5,082 | ) | Commercial Loans, held-for-sale | ||||||||||||||||||||||||||||||||||||||||
Change in fair value, net | (8,075 | ) | 1,157 | (3,612 | ) | 12,675 | 5,957 | 8,673 | Beginning carrying value | $ | 80,756 | $ | 165,853 | $ | 54,407 | $ | 166,234 | $ | 104,709 | $ | 50,848 | ||||||||||||||||||||||||||||||||
Ending fair value | $ | 534,590 | $ | 450,450 | $ | 474,047 | $ | 569,995 | $ | 621,573 | $ | 565,462 | Originations | 99,625 | 167,510 | 257,671 | 92,713 | 325,970 | 340,200 | ||||||||||||||||||||||||||||||||||
Sales | (140,668 | ) | (256,581 | ) | (147,132 | ) | (210,309 | ) | (271,260 | ) | (290,561 | ) | |||||||||||||||||||||||||||||||||||||||||
Securities – Mezzanine (1) | Principal repayments | (19 | ) | — | (80 | ) | (88 | ) | (329 | ) | (83 | ) | |||||||||||||||||||||||||||||||||||||||||
Beginning fair value | $ | 276,208 | $ | 290,283 | $ | 380,935 | $ | 448,838 | $ | 411,784 | $ | 425,202 | Transfers between portfolios | — | — | — | — | — | — | ||||||||||||||||||||||||||||||||||
Acquisitions | 95,625 | 9,423 | 22,744 | 10,518 | 37,730 | 33,985 | Changes in fair value, net | (553 | ) | 3,974 | 987 | 5,857 | 7,144 | 4,305 | |||||||||||||||||||||||||||||||||||||||
Sales | (8,899 | ) | (24,980 | ) | (105,590 | ) | (85,017 | ) | — | (50,961 | ) | Ending fair value | $ | 39,141 | $ | 80,756 | $ | 165,853 | $ | 54,407 | $ | 166,234 | $ | 104,709 | |||||||||||||||||||||||||||||
Effect of principal payments | (2,750 | ) | (1,946 | ) | (2,010 | ) | (2,585 | ) | (2,476 | ) | (2,537 | ) | |||||||||||||||||||||||||||||||||||||||||
Change in fair value, net | (3,904 | ) | 3,428 | (5,796 | ) | 9,181 | 1,800 | 6,095 | Commercial Loans, held-for-investment at amortized cost | ||||||||||||||||||||||||||||||||||||||||||||
Ending fair value | $ | 356,280 | $ | 276,208 | $ | 290,283 | $ | 380,935 | $ | 448,838 | $ | 411,784 | Beginning carrying value | $ | 321,823 | $ | 320,245 | $ | 337,858 | $ | 333,986 | $ | 327,143 | $ | 351,226 | ||||||||||||||||||||||||||||
Originations | — | 12,869 | 1,750 | 7,600 | 21,870 | 26,140 | |||||||||||||||||||||||||||||||||||||||||||||||
Principal repayments | (21,890 | ) | (11,529 | ) | (19,816 | ) | (3,717 | ) | (15,190 | ) | (51,295 | ) | |||||||||||||||||||||||||||||||||||||||||
Provision for loan losses | 240 | 60 | 261 | (206 | ) | (27 | ) | 888 | |||||||||||||||||||||||||||||||||||||||||||||
Discount/fee amortization | 182 | 178 | 192 | 195 | 190 | 184 | |||||||||||||||||||||||||||||||||||||||||||||||
Ending carrying value (2) | $ | 300,355 | $ | 321,823 | $ | 320,245 | $ | 337,858 | $ | 333,986 | $ | 327,143 | |||||||||||||||||||||||||||||||||||||||||
Mortgage Servicing Rights | |||||||||||||||||||||||||||||||||||||||||||||||||||||
Beginning carrying value | $ | 162,726 | $ | 168,462 | $ | 120,324 | $ | 139,293 | $ | 135,152 | $ | 71,225 | |||||||||||||||||||||||||||||||||||||||||
Additions | 21,305 | 22,760 | 32,463 | 18,754 | 19,279 | 61,606 | |||||||||||||||||||||||||||||||||||||||||||||||
Sales | — | — | — | (18,206 | ) | — | — | ||||||||||||||||||||||||||||||||||||||||||||||
Changes in fair value, net | 7,945 | (28,496 | ) | 15,675 | (19,517 | ) | (15,138 | ) | 2,321 | ||||||||||||||||||||||||||||||||||||||||||||
Ending fair value | $ | 191,976 | $ | 162,726 | $ | 168,462 | $ | 120,324 | $ | 139,293 | $ | 135,152 | |||||||||||||||||||||||||||||||||||||||||
(1) | Securities-mezzanine are a component of securities-subordinate. They are broken-out to provide additional detail on this portion of the subordinate securities portfolio. |
(2) | The carrying value of our commercial loans, held-for-investment at amortized cost excludes commercial A-notes, which are carried at fair value. |
THE REDWOOD REVIEW I 4TH QUARTER 2015 | Table 7: Securities and Loan Portfolio Activity 72 | |
| Table 8: Consolidating Balance Sheet ($ in thousands) | ||||||||||||||||||||||||||||||||||||||||||||||||
December 31, 2015 | September 30, 2015 | ||||||||||||||||||||||||||||||||||||||||||||||||
Consolidated VIEs (1) | Consolidated VIEs (1) | ||||||||||||||||||||||||||||||||||||||||||||||||
At Redwood (1) | Commercial Securitization | Residential Resecuritization(2) | Consolidated Sequoia Entities | Total | Redwood Consolidated | At Redwood (1) | Commercial Securitization | Residential Resecuritization(2) | Consolidated Sequoia Entities | Total | Redwood Consolidated | ||||||||||||||||||||||||||||||||||||||
Residential loans | $ | 2,906,933 | $ | — | $ | — | $ | 1,021,870 | $ | 1,021,870 | $ | 3,928,803 | $ | 2,866,428 | $ | — | $ | — | $ | 1,170,246 | $ | 1,170,246 | $ | 4,036,674 | |||||||||||||||||||||||||
Commercial loans (3) | 236,631 | 166,016 | — | — | 166,016 | 402,647 | 287,763 | 180,394 | — | — | 180,394 | 468,157 | |||||||||||||||||||||||||||||||||||||
Real estate securities | 1,233,256 | — | — | — | — | 1,233,256 | 903,971 | — | 181,253 | — | 181,253 | 1,085,224 | |||||||||||||||||||||||||||||||||||||
Mortgage servicing rights | 191,976 | — | — | — | — | 191,976 | 162,726 | — | — | — | — | 162,726 | |||||||||||||||||||||||||||||||||||||
Cash and cash equivalents | 220,229 | — | — | — | — | 220,229 | 235,362 | — | — | — | — | 235,362 | |||||||||||||||||||||||||||||||||||||
Total earning assets | 4,789,025 | 166,016 | — | 1,021,870 | 1,187,886 | 5,976,911 | 4,456,250 | 180,394 | 181,253 | 1,170,246 | 1,531,893 | 5,988,143 | |||||||||||||||||||||||||||||||||||||
Other assets (4) | 246,428 | 1,434 | — | 6,254 | 7,688 | 254,116 | 273,426 | 1,495 | 364 | 5,598 | 7,457 | 280,883 | |||||||||||||||||||||||||||||||||||||
Total assets | $ | 5,035,453 | $ | 167,450 | $ | — | $ | 1,028,124 | $ | 1,195,574 | $ | 6,231,027 | $ | 4,729,676 | $ | 181,889 | $ | 181,617 | $ | 1,175,844 | $ | 1,539,350 | $ | 6,269,026 | |||||||||||||||||||||||||
Short-term debt | $ | 1,855,003 | $ | — | $ | — | $ | — | $ | — | $ | 1,855,003 | $ | 1,872,793 | $ | — | $ | — | $ | — | $ | — | $ | 1,872,793 | |||||||||||||||||||||||||
Other liabilities | 140,723 | 249 | — | 655 | 904 | 141,627 | 187,897 | 318 | 1 | 770 | 1,089 | 188,986 | |||||||||||||||||||||||||||||||||||||
ABS issued | — | 53,137 | — | 996,820 | 1,049,957 | 1,049,957 | — | 67,946 | 5,261 | 1,105,588 | 1,178,795 | 1,178,795 | |||||||||||||||||||||||||||||||||||||
Long-term debt (3) | 2,038,175 | — | — | — | — | 2,038,175 | 1,821,877 | — | — | — | — | 1,821,877 | |||||||||||||||||||||||||||||||||||||
Total liabilities | 4,033,901 | 53,386 | — | 997,475 | 1,050,861 | 5,084,762 | 3,882,567 | 68,264 | 5,262 | 1,106,358 | 1,179,884 | 5,062,451 | |||||||||||||||||||||||||||||||||||||
Equity | 1,001,552 | 114,064 | — | 30,649 | 144,713 | 1,146,265 | 847,109 | 113,625 | 176,355 | 69,486 | 359,466 | 1,206,575 | |||||||||||||||||||||||||||||||||||||
Total liabilities and equity | $ | 5,035,453 | $ | 167,450 | $ | — | $ | 1,028,124 | $ | 1,195,574 | $ | 6,231,027 | $ | 4,729,676 | $ | 181,889 | $ | 181,617 | $ | 1,175,844 | $ | 1,539,350 | $ | 6,269,026 | |||||||||||||||||||||||||
(1) | The format of this consolidating balance sheet is provided to more clearly delineate between the assets belonging to certain securitization entities (Consolidated variable interest entities, or VIEs) that we are required to consolidate on our balance sheet in accordance with GAAP, but which are not legally ours, and the liabilities of these consolidated VIEs, which are payable only from the cash flows generated by their assets and are, therefore, nonrecourse to us, and the assets that are legally ours and the liabilities of ours for which there is recourse to us. |
(2) | In accordance with GAAP, we consolidated the assets and liabilities of an entity formed in connection with our Residential Resecuritization from its creation in 2011 through the fourth quarter of 2015, when the debt of the entity was repaid, the assets of the entity were distributed to us and the entity was dissolved. |
(3) | Commercial loans at Redwood and long-term debt at Redwood include $63 million of commercial A-notes and $63 million of commercial secured borrowings, respectively. Although these loans were sold, we are required under GAAP to retain the loans on our balance sheet and treat the proceeds as secured borrowings. |
(4) | Other assets includes a total of $63 million of assets held by third party custodians and pledged as collateral to the GSEs in connection with credit risk sharing arrangements relating to conforming residential loans. These pledged assets can only be used to settle obligations to the GSEs under these risk sharing arrangements. |
THE REDWOOD REVIEW I 4TH QUARTER 2015 | Table 8: Consolidating Balance Sheet 73 | |
EXECUTIVE OFFICERS: | DIRECTORS: |
Marty Hughes | Richard D. Baum |
Chief Executive Officer | Chairman of the Board |
and Former Chief Deputy Insurance | |
Brett D. Nicholas | Commissioner for the State of California |
President | |
Douglas B. Hansen | |
Fred J. Matera | Vice-Chairman of the Board |
Executive Vice President-Commercial | and Private Investor |
Investments and Finance | |
Mariann Byerwalter | |
Christopher J. Abate | Chairman, SRI International |
Chief Financial Officer | Chairman, JDN Corporate Advisory LLC |
and Executive Vice President | |
Marty Hughes | |
Andrew P. Stone | Chief Executive Officer |
General Counsel, Executive Vice | |
President, and Secretary | Greg H. Kubicek |
President, The Holt Group, Inc. | |
CORPORATE HEADQUARTERS: | Karen R. Pallotta |
One Belvedere Place, Suite 300 | Owner, KRP Advisory Services, LLC |
Mill Valley, California 94941 | |
Telephone: (415) 389-7373 | Jeffrey T. Pero |
Retired Partner, Latham & Watkins LLP | |
CHICAGO OFFICE: | |
225 W. Washington Street, Suite 1440 | Georganne C. Proctor |
Chicago, IL 60606 | Former Chief Financial Officer, TIAA-CREF |
DENVER METRO AREA OFFICE: | Charles J. Toeniskoetter |
8310 South Valley Highway, Suite 425 | Chairman, Toeniskoetter Development, Inc. |
Englewood, Colorado 80112 | Chairman & CEO, Toeniskoetter Construction, Inc. |
NEW YORK OFFICE: | |
1114 Avenue of the Americas, Suite 2810 | |
New York, New York 10036 | |
STOCK LISTING | INVESTOR RELATIONS |
The Company's common stock is traded | Kristin Brown |
on the New York Stock Exchange under | |
the symbol RWT | Investor Relations Hotline: (866) 269-4976 |
Email: [email protected] | |
TRANSFER AGENT | |
Computershare Trust Company, N.A. | |
2 North LaSalle Street | |
Chicago, IL 60602 | |
Telephone: (888) 472-1955 | |
For more information about Redwood Trust, visit our website at www.redwoodtrust.com | |