
T A B L E O F C O N T E N T S |
Introduction | |
Shareholder Letter | |
Quarterly Overview | |
Ñ First Quarter Highlights | |
Ñ GAAP Net Income and Reconciliation to Non-GAAP Core Earnings | |
Ñ Analysis of Earnings | |
Ñ GAAP Book Value | |
Ñ Capital Allocation Summary | |
Ñ 2017 Financial Outlook | |
Financial Insights | |
Ñ GAAP Results by Business Segment | |
Analysis of Balance Sheet and Capital Allocations | |
Ñ Balance Sheet Analysis | |
Ñ Analysis of Capital Allocation | |
Appendix | |
Ñ Redwood’s Business Overview | |
Ñ Dividend Policy | |
Ñ Core Earnings Definition | |
Ñ Glossary | |
Ñ Financial Tables | |
THE REDWOOD REVIEW I 1ST QUARTER 2017 |
1 |
C A U T I O N A R Y S T A T E M E N T |
THE REDWOOD REVIEW I 1ST QUARTER 2017 |
2 |
C A U T I O N A R Y S T A T E M E N T |
THE REDWOOD REVIEW I 1ST QUARTER 2017 |
3 |
C A U T I O N A R Y S T A T E M E N T |
THE REDWOOD REVIEW I 1ST QUARTER 2017 |
4 |
I N T R O D U C T I O N |
Selected Financial Highlights | |||||||||||
Quarter:Year | GAAP Income per Share | REIT Taxable Income per Share (1) | Annualized GAAP Return on Equity | GAAP Book Value per Share | Dividends per Share | ||||||
Q117 | $0.43 | $0.22 | 13% | $15.13 | $0.28 | ||||||
Q416 | $0.31 | $0.34 | 9% | $14.96 | $0.28 | ||||||
Q316 | $0.58 | $0.34 | 19% | $14.74 | $0.28 | ||||||
Q216 | $0.48 | $0.36 | 15% | $14.20 | $0.28 | ||||||
Q116 | $0.15 | $0.23 | 4% | $14.17 | $0.28 | ||||||
Q415 | $0.46 | $0.37 | 14% | $14.67 | $0.28 | ||||||
Q315 | $0.22 | $0.29 | 6% | $14.69 | $0.28 | ||||||
Q215 | $0.31 | $0.21 | 9% | $14.96 | $0.28 | ||||||
Q115 | $0.16 | $0.18 | 5% | $15.01 | $0.28 | ||||||
(1) | REIT taxable income per share for 2016 and 2017 are estimates until we file our tax returns. |
THE REDWOOD REVIEW I 1ST QUARTER 2017 |
5 |
S H A R E H O L D E R L E T T E R |
THE REDWOOD REVIEW I 1ST QUARTER 2017 |
6 |
S H A R E H O L D E R L E T T E R |
THE REDWOOD REVIEW I 1ST QUARTER 2017 |
7 |
S H A R E H O L D E R L E T T E R |
THE REDWOOD REVIEW I 1ST QUARTER 2017 |
8 |
S H A R E H O L D E R L E T T E R |
 |  | |
Marty Hughes | Christopher J. Abate | |
Chief Executive Officer | President and Chief Financial Officer | |
THE REDWOOD REVIEW I 1ST QUARTER 2017 |
9 |
Q U A R T E R L Y O V E R V I E W |
Ñ | Our GAAP earnings were $0.43 per share for the first quarter of 2017, as compared with $0.31 per share for the fourth quarter of 2016. The increase was primarily due to positive fair value adjustments on our loans and securities due to spread tightening, and higher realized gains from the sale of securities. These increases were partially offset by a higher tax provision related to our mortgage banking activities. |
Ñ | Our non-GAAP core earnings were $0.36 per share for the first quarter of 2017, as compared with $0.33 per share for the fourth quarter of 2016. First quarter core earnings increased due to strong mortgage banking and investment portfolio results, partially offset by the loss of net interest income associated with the sale of commercial mezzanine loans in the fourth quarter. For details on GAAP and core earnings, please see the GAAP Net Income and Reconciliation to Non-GAAP Core Earnings section that follows on page 11. |
Ñ | Our GAAP book value was $15.13 per share at March 31, 2017, as compared with $14.96 per share at December 31, 2016. This increase was primarily driven by our quarterly earnings exceeding our dividend and higher fair values on our available-for-sale securities. |
Ñ | We deployed $158 million of capital in the first quarter of 2017 toward new investments, including $65 million in Sequoia and third-party RMBS, $44 million in Agency residential CRT securities, $39 million in Agency multifamily securities, and $10 million in MSRs. |
Ñ | We sold $27 million of securities and $12 million of MSRs from our investment portfolio during the first quarter of 2017, generating realized gains of $5 million and freeing up $31 million of capital for reinvestment after the repayment of associated debt. |
Ñ | We purchased $1.1 billion of residential jumbo loans during the first quarter of 2017. At March 31, 2017, our pipeline of jumbo residential loans identified for purchase was $1.0 billion. |
Ñ | Residential loan sales totaled $1.4 billion during the first quarter of 2017 and included $328 million of whole loan sales to third parties and $1.0 billion of loans that were securitized. |
Ñ | For an updated discussion of our key business drivers in 2017, please see the 2017 Financial Outlook section of this Redwood Review. |
THE REDWOOD REVIEW I 1ST QUARTER 2017 |
10 |
Q U A R T E R L Y O V E R V I E W |
GAAP Net Income and Reconciliation to Non-GAAP Core Earnings | ||||||||
($ in millions, except per share data) | ||||||||
Three Months Ended | ||||||||
3/31/2017 | 12/31/2016 | |||||||
Interest income | $ | 55 | $ | 56 | ||||
Interest expense | (21 | ) | (21 | ) | ||||
Net interest income | 34 | 36 | ||||||
Non-interest income | ||||||||
Mortgage banking activities, net | 18 | 14 | ||||||
MSR income, net | 2 | 2 | ||||||
Investment fair value changes, net | 2 | (10 | ) | |||||
Other income | 1 | 2 | ||||||
Realized gains, net | 6 | 2 | ||||||
Total non-interest income, net | 28 | 10 | ||||||
Operating expenses | (18 | ) | (18 | ) | ||||
Provision for income taxes | (6 | ) | (2 | ) | ||||
GAAP net income | $ | 37 | $ | 25 | ||||
Core earnings adjustments | ||||||||
Eliminate mark-to-market changes on long-term investments (1) | (10 | ) | 35 | |||||
Eliminate mark-to-market changes on derivatives associated with long-term investments (1) | 1 | (34 | ) | |||||
Income tax adjustments associated with core earnings adjustments (2) | 1 | 1 | ||||||
Non-GAAP core earnings | $ | 30 | $ | 27 | ||||
GAAP net income per diluted common share | $ | 0.43 | $ | 0.31 | ||||
Non-GAAP core earnings per diluted common share (3) | $ | 0.36 | $ | 0.33 | ||||
(1) | Adjustments eliminate the mark-to-market changes on the fair value of loans held-for-investment, trading securities, other investments, and associated derivatives that are primarily related to changes in benchmark interest rates and credit spreads. Details on the components of investment fair value changes, net, are included in the Financial Insights section of this Redwood Review. |
(2) | We apply estimated effective tax rates to core earnings adjustments occurring within Redwood's taxable REIT subsidiaries to estimate the hypothetical income tax expense or benefit associated with those adjustments. |
(3) | Consistent with the calculation of net income per diluted common share for GAAP purposes, non-GAAP core earnings per diluted common share is calculated following the "two-class" method. Additional information on the calculation of core earnings using the "two-class" method can be found in Table 2 in the Financial Tables section of the Appendix to this Redwood Review. |
THE REDWOOD REVIEW I 1ST QUARTER 2017 |
11 |
Q U A R T E R L Y O V E R V I E W |
Ñ | To calculate core earnings, one of the adjustments we make to GAAP earnings is to eliminate mark-to-market changes on the fair value of our long-term investments (and associated derivatives) that are primarily related to changes in benchmark interest rates and spreads. This adjustment reduced investment fair value changes, net, by $9 million to an expense of $7 million for the first quarter of 2017, as compared with an expense of $9 million for the fourth quarter of 2016. |
Ñ | Net interest income was $34 million for the first quarter, as compared with $36 million for the fourth quarter. Net interest income declined primarily due to the sale of commercial mezzanine loans in the fourth quarter, as well as a lower average balance of residential loans held-for-sale through the conduit. This decline was partially offset by higher net interest income from our residential investments as a result of capital deployment during the first quarter. |
Ñ | Mortgage banking activities, net, increased to $18 million for the first quarter, from $14 million for the fourth quarter, driven by higher loan purchase volume and gross margins that have remained above our long-term expectations of 75 to 100 basis points. |
Ñ | MSR income, net, was $2 million for both the first quarter of 2017 and the fourth quarter of 2016. MSR income, net, in the first quarter included mark-to-market adjustments consistent with pricing levels for the expected sale of the majority of our conforming MSRs in the second quarter. |
Ñ | We realized gains of $6 million during the first quarter, which was primarily related to the sale of $19 million of available-for-sale securities, as compared with realized gains of $2 million during the fourth quarter, which included $1 million of realized gains from the sale of $16 million of commercial mezzanine loans and $1 million from the sale of $11 million of available-for-sale securities. |
Ñ | Operating expenses were $18 million for both the first quarter of 2017 and the fourth quarter of 2016. |
Ñ | We recorded a tax provision of $6 million during the first quarter, as compared with $2 million for the fourth quarter, primarily due to a higher effective tax rate and higher mortgage banking income relative to the fourth quarter. A reconciliation of GAAP and taxable income is set forth in Table 4 in the Financial Tables section of the Appendix to this Redwood Review. |
Ñ | Additional details on our earnings are included in the GAAP Results by Business Segment portion of the Financial Insights section that follows. |
THE REDWOOD REVIEW I 1ST QUARTER 2017 |
12 |
Q U A R T E R L Y O V E R V I E W |
Changes in GAAP Book Value per Share | ||||||||
($ in per share) | ||||||||
Three Months Ended | ||||||||
3/31/2017 | 12/31/2016 | |||||||
Beginning book value per share | $ | 14.96 | $ | 14.74 | ||||
Earnings | 0.43 | 0.31 | ||||||
Changes in unrealized gains on securities, net from: | ||||||||
Realized gains recognized in earnings | (0.04 | ) | (0.01 | ) | ||||
Amortization income recognized in earnings | (0.05 | ) | (0.07 | ) | ||||
Mark-to-market adjustments, net | 0.11 | (0.02 | ) | |||||
Total change in unrealized gains on securities, net | 0.02 | (0.10 | ) | |||||
Dividends | (0.28 | ) | (0.28 | ) | ||||
Equity compensation, net | (0.03 | ) | (0.05 | ) | ||||
Changes in unrealized losses on derivatives hedging long-term debt | 0.02 | 0.34 | ||||||
Other, net | 0.01 | — | ||||||
Ending book value per share | $ | 15.13 | $ | 14.96 | ||||
Ñ | Our GAAP book value per share increased $0.17 per share to $15.13 per share during the first quarter of 2017. This increase was primarily driven by our quarterly earnings exceeding our dividend, and an increase in unrealized gains on our securities portfolio. |
Ñ | Unrealized gains on our available-for-sale securities increased $0.02 per share during the first quarter of 2017, primarily as a result of a positive $0.11 per share mark-to-market adjustment on our available-for-sale securities due to spread tightening during the quarter. This increase was partially offset by $0.05 per share of discount amortization income recognized in earnings from the appreciation in the amortized cost basis of our available-for-sale securities, and $0.04 per share of previously unrealized net gains that were realized as income from the sale of securities. |
Ñ | Higher benchmark interest rates during the first quarter of 2017 resulted in a $0.02 per share increase to book value due to a decrease in unrealized losses on the derivatives hedging a portion of our long-term debt. At March 31, 2017, the cumulative unrealized loss on these derivatives, which is included in GAAP book value per share, was $0.55 per share. |
THE REDWOOD REVIEW I 1ST QUARTER 2017 |
13 |
Q U A R T E R L Y O V E R V I E W |
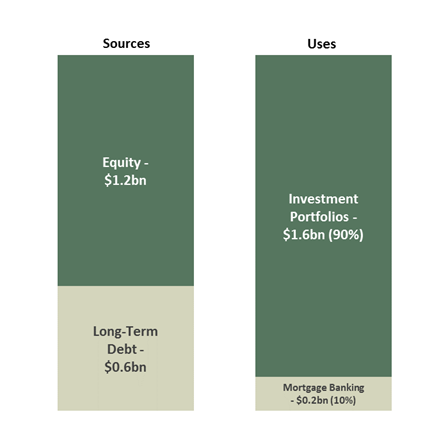
Ñ | Our total capital of $1.8 billion at March 31, 2017 included $1.2 billion of equity capital and $0.6 billion of the total $2.6 billion of long-term debt on our consolidated balance sheet. This portion of long-term debt includes $140 million of trust-preferred securities due in 2037, $288 million of convertible debt due in 2018, and $201 million of exchangeable debt due in 2019. This portion of long-term debt has a weighted average cost of 6.0% per annum. |
Ñ | Also included in our capital allocation is cash and liquidity capital, which represents a combination of capital available for investment and risk capital held for liquidity management purposes. At March 31, 2017, we estimate that our capital available for investments was approximately $160 million. |
Ñ | We also utilize various forms of short-term and long-term collateralized debt to finance certain investments and to warehouse our inventory of certain residential loans held-for-sale. We do not consider this collateralized debt as "capital" and, therefore, exclude it from our capital allocation analysis. |
Ñ | Further details on our capital allocation are included in the Analysis of Capital Allocation section that follows. |
THE REDWOOD REVIEW I 1ST QUARTER 2017 |
14 |
Q U A R T E R L Y O V E R V I E W |
Allocation of Capital and Return Profile | ||||||||||||||||||
By Investment Type | ||||||||||||||||||
March 31, 2017 | ||||||||||||||||||
($ in millions) | ||||||||||||||||||
Fair Value | Collateralized Debt | Allocated Capital | % of Total Capital | YTD 2017 Annualized Return (1) | 2017 Return Target (1) | |||||||||||||
Investment portfolio | ||||||||||||||||||
Residential loans/FHLB stock | $ | 2,393 | $ | (2,000 | ) | $ | 393 | 22% | 15% | 12%-16% | ||||||||
Residential securities | 1,027 | (308 | ) | 719 | 40% | 15% | 10%-12% | |||||||||||
Multifamily securities (2) | 139 | (15 | ) | 124 | 7% | 27% | 8%-10% | |||||||||||
Mortgage servicing rights | 111 | — | 111 | 6% | 4% | 7%-9% | ||||||||||||
Other assets/(other liabilities) | 101 | (41 | ) | 60 | 3% | —% | N/A | |||||||||||
Cash and liquidity capital | 210 | 12% | —% | N/A | ||||||||||||||
Total investments | $ | 3,771 | $ | (2,364 | ) | $ | 1,617 | 90% | 15% | 9%-11% | ||||||||
Residential mortgage banking | $ | 170 | 10% | 28% | 10%-20% | |||||||||||||
Total | $ | 1,787 | 100% | |||||||||||||||
(1) | Includes net interest income, change in fair value of the investments and their associated hedges that flow through GAAP earnings, realized gains, direct operating expenses, taxes, and other income. Excludes unrealized gains and losses on our AFS securities portfolio, and corporate operating expenses. Returns are calculated based on average capital allocated during the year. |
(2) | Multifamily securities include $19 million of investment grade CMBS. For 2017, our return target assumes additional leverage, although we may not add leverage until we have fully deployed our excess capital. |
Ñ | Our residential loans/FHLB stock investment generated an annualized return of 15% on average capital in the first quarter of 2017. These returns included $18 million of net interest income, and an expense of $6 million related to the change in valuation of these loans and associated derivatives. For the remainder of 2017, we expect to generate returns within our target range for this portfolio. |
Ñ | Our residential securities portfolio generated an annualized return of 15% on average capital in the first quarter of 2017. These returns included $17 million of net interest income, income of $4 million from the net positive change in valuation of these securities and associated derivatives, and $6 million of realized gains from securities sales. We expect to grow net interest income from our securities portfolio in 2017, as we redeploy a portion of our excess capital into this portfolio. Although we will continue to be opportunistic in terms of asset sales, we currently expect fewer portfolio sales and realized gains per quarter for the remainder of 2017 relative to the first quarter. |
THE REDWOOD REVIEW I 1ST QUARTER 2017 |
15 |
Q U A R T E R L Y O V E R V I E W |
Ñ | Our multifamily securities generated an annualized return of 27% on average capital in the first quarter of 2017. This included $1 million of net interest income and income of $6 million from the net positive change in valuation of these securities and associated derivatives. For the remainder of 2017, we expect to grow net interest income from this portfolio as we redeploy a portion of our excess capital towards this asset class. Additionally, we expect returns for the remainder of 2017 to be in line with our target range for this portfolio. |
Ñ | Our MSR portfolio generated an annualized return of 4% on average capital in the first quarter of 2017. We expect to sell most of our remaining conforming MSR portfolio in the second quarter of 2017 and redeploy the proceeds towards higher-yielding, REIT-eligible investments. |
Ñ | Our residential mortgage banking operations generated an annualized return of 28% on average capital in the first quarter of 2017. First quarter results benefited from continued tightening of spreads on securitization execution. For the remainder of 2017, we expect margins to be more in line with our long-term expectations of 75-100 basis points per loan. Additionally, we continue to expect to purchase $5 billion to $6 billion of loans for the full year 2017, with higher-yielding Redwood Choice loans increasing as a percentage of our overall purchase volume. |
Ñ | Operating expenses were $18 million for the first quarter of 2017, and included $7 million of direct operating expenses that were allocated to our Investment Portfolio and Residential Mortgage Banking segments (which are included in the returns described above) and $11 million of corporate operating expenses. For the remainder of 2017, we continue to expect our total operating expenses to be between $16 million and $18 million per quarter, including variable compensation commensurate with our earnings. |
Ñ | Our tax provision was $6 million in the first quarter of 2017 and was primarily due to higher mortgage banking income, which benefited from gross margins that were above our expectations. For the remainder of 2017, our tax provision will primarily be correlated to our mortgage banking results. |
THE REDWOOD REVIEW I 1ST QUARTER 2017 |
16 |
Q U A R T E R L Y O V E R V I E W |
THE REDWOOD REVIEW I 1ST QUARTER 2017 |
17 |
F I N A N C I A L I N S I G H T S |
Segment Results Summary (1) | ||||||||
($ in millions) | ||||||||
Three Months Ended | ||||||||
3/31/2017 | 12/31/2016 | |||||||
Segment contribution from: | ||||||||
Investment portfolio (2) | $ | 46 | $ | 32 | ||||
Residential mortgage banking | 12 | 12 | ||||||
Corporate/Other | (20 | ) | (19 | ) | ||||
Net income | $ | 37 | $ | 25 | ||||
(1) | See Table 3 in the Financial Tables section of the Appendix to this Redwood Review for a more comprehensive presentation of our segment results. |
THE REDWOOD REVIEW I 1ST QUARTER 2017 |
18 |
F I N A N C I A L I N S I G H T S |
Segment Results - Investment Portfolio | ||||||||
($ in millions) | ||||||||
Three Months Ended | ||||||||
3/31/2017 | 12/31/2016 | |||||||
Net interest income | ||||||||
Residential securities | $ | 17 | $ | 16 | ||||
Residential loans | 18 | 19 | ||||||
Multifamily and commercial investments | 1 | 3 | ||||||
Total net interest income | 37 | 38 | ||||||
Non-interest income | ||||||||
MSR income, net | 2 | 2 | ||||||
Investment fair value changes, net | 3 | (8 | ) | |||||
Other income | 1 | 2 | ||||||
Realized gains, net | 6 | 2 | ||||||
Total non-interest (loss) income, net | 12 | (2 | ) | |||||
Direct operating expenses | (2 | ) | (3 | ) | ||||
Provision for income taxes | (2 | ) | (1 | ) | ||||
Segment contribution | $ | 46 | $ | 32 | ||||
Ñ | The contribution from this segment increased from the fourth quarter of 2016, primarily due to positive valuation changes on our securities portfolio, which benefited from spread tightening during the first quarter. As a result of these mark-to-market increases, investment fair value changes, net, was positive $3 million for the first quarter of 2017, as compared with negative $8 million for the fourth quarter of 2016. |
.Ñ | Net interest income declined from the fourth quarter of 2016, primarily due to the sale of commercial mezzanine loans in the fourth quarter. However, net interest income from our residential investments increased as a result of capital deployment during the first quarter. |
THE REDWOOD REVIEW I 1ST QUARTER 2017 |
19 |
F I N A N C I A L I N S I G H T S |
Components of Investment Portfolio Fair Value Changes, Net by Investment Type | ||||||||
($ in millions) | ||||||||
Three Months Ended | ||||||||
3/31/2017 | 12/31/2016 | |||||||
Market valuation changes on: | ||||||||
Residential loans held-for-investment | ||||||||
Change in fair value from the reduction of principal (1) | $ | (2 | ) | $ | (6 | ) | ||
Change in fair value from changes in interest rates (2) | (1 | ) | (40 | ) | ||||
Total change in fair value of residential loans held-for-investment | (2 | ) | (45 | ) | ||||
Real estate securities | ||||||||
Change in fair value from the reduction of principal (1) | (2 | ) | (2 | ) | ||||
Change in fair value from changes in interest rates (2) | 13 | 7 | ||||||
Total change in fair value of real estate securities | 11 | 5 | ||||||
Risk management derivatives | ||||||||
Interest component of derivative expense | (4 | ) | (2 | ) | ||||
Change in fair value of derivatives from changes in interest rates (3) | (1 | ) | 34 | |||||
Total change in fair value of risk management derivatives | (5 | ) | 32 | |||||
Total investment portfolio fair value changes, net | $ | 3 | $ | (8 | ) | |||
(1) | Reflects the change in fair value due to principal changes, which is calculated as the change in principal on a given investment during the period, multiplied by the prior quarter ending price or acquisition price for that investment in percentage terms. |
(2) | Reflects changes in prepayment assumptions and credit spreads on our residential loans, trading securities and conforming risk-sharing investments primarily due to changes in benchmark interest rates. This item is excluded from management's definition of core earnings. |
(3) | Reflects the change in fair value of our risk management derivatives that are associated with changes in benchmark interest rates during the period. This item is excluded from management's definition of core earnings. |
THE REDWOOD REVIEW I 1ST QUARTER 2017 |
20 |
F I N A N C I A L I N S I G H T S |
Components of MSR Income, Net | ||||||||
($ in millions) | ||||||||
Three Months Ended | ||||||||
3/31/2017 | 12/31/2016 | |||||||
Net servicing fee income | $ | 6 | $ | 8 | ||||
Change in fair value of MSRs from the receipt of expected cashflows | (2 | ) | (4 | ) | ||||
MSR income before effect of changes in interest rates | 3 | 4 | ||||||
Net effect to valuations from changes in assumptions and interest rates | ||||||||
Change in fair value of MSRs from changes in MSR assumptions (1) | (1 | ) | 38 | |||||
Change in fair value of associated derivatives | (1 | ) | (40 | ) | ||||
Total net effect of changes in assumptions and interest rates | (1 | ) | (2 | ) | ||||
MSR income, net | $ | 2 | $ | 2 | ||||
(1) | Primarily reflects changes in prepayment assumptions on our MSRs due to changes in benchmark interest rates. |
THE REDWOOD REVIEW I 1ST QUARTER 2017 |
21 |
F I N A N C I A L I N S I G H T S |
Segment Contribution of Investment Portfolio by Type | ||||||||||||||||||||
For the Three Months Ended March 31, 2017 | ||||||||||||||||||||
($ in millions) | ||||||||||||||||||||
Residential Loans | Residential Securities | Multifamily Securities | MSRs | Total | ||||||||||||||||
Total net interest income | $ | 18 | $ | 17 | $ | 1 | $ | — | $ | 37 | ||||||||||
Non-interest income | ||||||||||||||||||||
MSR income, net | — | — | — | 2 | 2 | |||||||||||||||
Investment fair value changes, net | (6 | ) | 4 | 6 | — | 3 | ||||||||||||||
Other income | — | 1 | — | — | 1 | |||||||||||||||
Realized gains, net | — | 6 | — | — | 6 | |||||||||||||||
Total non-interest income, net | (6 | ) | 10 | 6 | 2 | 12 | ||||||||||||||
Direct operating expenses | — | (1 | ) | — | — | (2 | ) | |||||||||||||
Provision for income taxes | — | (1 | ) | — | — | (2 | ) | |||||||||||||
Segment contribution | $ | 12 | $ | 25 | $ | 7 | $ | 1 | $ | 46 | ||||||||||
Core Earnings adjustments (1) | ||||||||||||||||||||
Eliminate mark-to-market changes on long-term investments and associated derivatives | 2 | (6 | ) | (6 | ) | — | (10 | ) | ||||||||||||
Income taxes associated with core earnings adjustments | — | 1 | — | — | 1 | |||||||||||||||
Total core earnings adjustments | 2 | (5 | ) | (6 | ) | — | (9 | ) | ||||||||||||
Non-GAAP core segment contribution (1) | $ | 14 | $ | 21 | $ | 1 | $ | 1 | $ | 37 | ||||||||||
(1) | Consistent with management's definition of core earnings set forth on page 36, non-GAAP core segment contribution reflects GAAP segment contribution adjusted to reflect the portion of core earnings adjustments allocable to this segment. |
Ñ | At March 31, 2017, we had $3.8 billion of investments in our Investment Portfolio segment, including $2.4 billion of residential loans held-for-investment, $1.2 billion of residential and multifamily securities, $111 million of MSR investments, and $144 million of cash and other assets. |
THE REDWOOD REVIEW I 1ST QUARTER 2017 |
22 |
F I N A N C I A L I N S I G H T S |
Segment Results - Residential Mortgage Banking | ||||||||
($ in millions) | ||||||||
Three Months Ended | ||||||||
3/31/2017 | 12/31/2016 | |||||||
Net interest income | $ | 5 | $ | 6 | ||||
Non-interest income | ||||||||
Mortgage banking activities, net | 18 | 14 | ||||||
Total non-interest income | 18 | 14 | ||||||
Direct operating expenses | (6 | ) | (6 | ) | ||||
Provision for income taxes | (4 | ) | (2 | ) | ||||
Segment contribution | $ | 12 | $ | 12 | ||||
Ñ | The contribution from this segment in the first quarter of 2017 was consistent relative to the fourth quarter of 2016, as higher mortgage banking income was offset by a higher provision for taxes. |
Ñ | Loan purchase commitments (LPCs), adjusted for fallout expectations, were $1.1 billion for the first quarter of 2017, as compared with $1.0 billion for the fourth quarter of 2016. |
Ñ | Gross margins for our Residential Mortgage Banking segment, which we define as net interest income plus mortgage banking activities, net, divided by LPCs, benefited from continued improvements in securitization execution relative to the fourth quarter, and remained above our long-term expectations of 75 to 100 basis points. |
Ñ | Residential loan sales totaled $1.4 billion during the first quarter and included $328 million of whole loan sales to third parties and $1.0 billion of loans that were securitized. |
Ñ | At March 31, 2017, we had 422 loan sellers, which included 191 jumbo sellers and 231 MPF Direct sellers from various FHLB districts. |
THE REDWOOD REVIEW I 1ST QUARTER 2017 |
23 |
A N A L Y S I S O F B A L A N C E S H E E T A N D C A P I T A L A L L O C A T I O N S |
Consolidated Balance Sheets (1) | ||||||||
($ in millions) | ||||||||
3/31/2017 | 12/31/2016 | |||||||
Residential loans | $ | 3,472 | $ | 3,888 | ||||
Real estate securities | 1,166 | 1,018 | ||||||
Mortgage servicing rights | 111 | 119 | ||||||
Cash and cash equivalents | 222 | 213 | ||||||
Total earning assets | 4,971 | 5,238 | ||||||
Other assets | 243 | 245 | ||||||
Total assets | $ | 5,214 | $ | 5,483 | ||||
Short-term debt | ||||||||
Mortgage loan warehouse debt | $ | 241 | $ | 486 | ||||
Security repurchase facilities | 323 | 306 | ||||||
Other liabilities | 135 | 148 | ||||||
Asset-backed securities issued, net | 728 | 773 | ||||||
Long-term debt, net | 2,621 | 2,621 | ||||||
Total liabilities | 4,049 | 4,334 | ||||||
Stockholders’ equity | 1,166 | 1,149 | ||||||
Total liabilities and equity | $ | 5,214 | $ | 5,483 | ||||
(1) | Our consolidated balance sheets include assets of consolidated variable interest entities (“VIEs”) that can only be used to settle obligations of these VIEs and liabilities of consolidated VIEs for which creditors do not have recourse to the primary beneficiary (Redwood Trust, Inc.). At March 31, 2017 and December 31, 2016, assets of consolidated VIEs totaled $751 million and $798 million, respectively, and liabilities of consolidated VIEs totaled $729 million and $774 million, respectively. See Table 8 in the Financial Tables section of the Appendix to this Redwood Review for additional detail on consolidated VIEs. |
THE REDWOOD REVIEW I 1ST QUARTER 2017 |
24 |
A N A L Y S I S O F B A L A N C E S H E E T A N D C A P I T A L A L L O C A T I O N S |
Operating Segment Assets and Liabilities | |||||||||||||||||
March 31, 2017 | |||||||||||||||||
($ in millions) | |||||||||||||||||
Operating Segments | |||||||||||||||||
Investment Portfolio | Residential Mortgage Banking | Corporate/Other | Redwood Consolidated | ||||||||||||||
Residential loans | $ | 2,350 | $ | 377 | $ | 746 | $ | 3,472 | |||||||||
Residential securities | 1,027 | — | — | 1,027 | |||||||||||||
Multifamily securities | 139 | — | — | 139 | |||||||||||||
Mortgage servicing rights | 111 | — | — | 111 | |||||||||||||
Cash and cash equivalents | 12 | — | 210 | 222 | |||||||||||||
Total earning assets | 3,639 | 377 | 955 | 4,971 | |||||||||||||
Other assets | 132 | 34 | 77 | 243 | |||||||||||||
Total assets | $ | 3,771 | $ | 410 | $ | 1,033 | $ | 5,214 | |||||||||
Short-term debt | |||||||||||||||||
Mortgage loan warehouse debt | $ | — | $ | 241 | $ | — | $ | 241 | |||||||||
Security repurchase facilities | 323 | — | — | 323 | |||||||||||||
Other liabilities | 41 | 17 | 77 | 135 | |||||||||||||
ABS issued, net | — | — | 728 | 728 | |||||||||||||
Long-term debt, net | 2,000 | — | 621 | 2,621 | |||||||||||||
Total liabilities | $ | 2,364 | $ | 258 | $ | 1,427 | $ | 4,049 | |||||||||
THE REDWOOD REVIEW I 1ST QUARTER 2017 |
25 |
A N A L Y S I S O F B A L A N C E S H E E T A N D C A P I T A L A L L O C A T I O N S |
Ñ | At March 31, 2017, our investments in residential loans included $2.4 billion of jumbo residential loans financed with $2.0 billion of FHLB debt by our FHLB-member subsidiary. In connection with these borrowings, our FHLB-member subsidiary is required to hold $43 million of FHLB stock. At March 31, 2017, one of these loans was in delinquent status of greater than 90 days. |
Ñ | At March 31, 2017, the weighted average maturity of this FHLB debt was approximately eight years and it had a weighted average cost of 0.82% per annum. This interest cost resets every 13 weeks, and we seek to fix the interest cost of this FHLB debt over its weighted average maturity by using a combination of swaps, TBAs, and other derivative instruments. |
Ñ | Under a final rule published by the Federal Housing Finance Agency in January 2016, our FHLB-member subsidiary will remain an FHLB member through the five-year transition period for captive insurance companies. Our FHLB-member subsidiary's existing $2.0 billion of FHLB debt, which matures beyond this transition period, is permitted to remain outstanding until the stated maturity. As residential loans pledged as collateral for this debt pay down, we are permitted to pledge additional loans or other eligible assets to collateralize this debt; however, we do not expect to be able to increase our subsidiary's FHLB debt above the existing $2.0 billion. |
THE REDWOOD REVIEW I 1ST QUARTER 2017 |
26 |
A N A L Y S I S O F B A L A N C E S H E E T A N D C A P I T A L A L L O C A T I O N S |
Residential Securities - Vintage and Category | |||||||||||||||||||||||||||
March 31, 2017 | |||||||||||||||||||||||||||
($ in millions) | |||||||||||||||||||||||||||
RMBS 2.0 | Legacy RMBS | ||||||||||||||||||||||||||
Sequoia 2012-2017 | Third Party 2013-2017 | Agency CRT 2013-2017 | Third Party 2006-2008 | Third Party <=2005 | Total Securities | % of Total Securities | |||||||||||||||||||||
Senior | $ | 29 | $ | 6 | $ | — | $ | 86 | $ | 56 | $ | 176 | 17 | % | |||||||||||||
Re-REMIC | — | — | — | 16 | 57 | 74 | 7 | % | |||||||||||||||||||
Subordinate | |||||||||||||||||||||||||||
Mezzanine (1) | 147 | 222 | — | — | — | 369 | 36 | % | |||||||||||||||||||
Subordinate | 117 | 75 | 198 | — | 18 | 409 | 40 | % | |||||||||||||||||||
Subordinate | 263 | 297 | 198 | — | 18 | 777 | 76 | % | |||||||||||||||||||
Total real estate securities | $ | 292 | $ | 303 | $ | 198 | $ | 102 | $ | 132 | $ | 1,027 | 100 | % | |||||||||||||
(1) | Mezzanine includes securities initially rated AA through BBB- and issued in 2012 or later. |
THE REDWOOD REVIEW I 1ST QUARTER 2017 |
27 |
A N A L Y S I S O F B A L A N C E S H E E T A N D C A P I T A L A L L O C A T I O N S |
Real Estate Securities Financed with Repurchase Debt | |||||||||||||||||||
March 31, 2017 | |||||||||||||||||||
($ in millions, except weighted average price) | |||||||||||||||||||
Real Estate Securities | Repurchase Debt | Allocated Capital | Weighted Average Price (1) | Financing Haircut (2) | |||||||||||||||
Residential securities | |||||||||||||||||||
Senior | $ | 51 | $ | (43 | ) | $ | 8 | $ | 95 | 16 | % | ||||||||
Mezzanine | 316 | (265 | ) | 51 | $ | 97 | 16 | % | |||||||||||
Total residential securities | 367 | (308 | ) | 59 | |||||||||||||||
Multifamily securities | 19 | (15 | ) | 4 | $ | 89 | 21 | % | |||||||||||
Total | $ | 386 | $ | (323 | ) | $ | 63 | $ | 96 | 16 | % | ||||||||
(1) | GAAP fair value per $100 of principal. |
(2) | Allocated capital divided by GAAP fair value. |
Ñ | At March 31, 2017, the securities we financed through repurchase facilities had no material credit issues. In addition to the allocated capital listed in the table above that directly supports our repurchase facilities (i.e., “the haircut”), we continue to hold a designated amount of supplemental risk capital available for potential margin calls or future obligations relating to these facilities. |
Ñ | At March 31, 2017, we had securities repurchase facilities with seven different counterparties. The weighted average cost of funds for the financing at these facilities during the first quarter of 2017 was approximately 1.99% per annum. |
Ñ | At March 31, 2017, the weighted average GAAP fair value of our financed securities was 96% of their aggregate principal balance. All financed securities received external third-party market price indications as of March 31, 2017, and were, in aggregate, valued within 1% of these indications. |
THE REDWOOD REVIEW I 1ST QUARTER 2017 |
28 |
A N A L Y S I S O F B A L A N C E S H E E T A N D C A P I T A L A L L O C A T I O N S |
Ñ | Most of the $51 million of senior securities noted in the preceding table are supported by seasoned residential loans originated prior to 2008. The credit performance of these investments continues to exceed our original investment expectations. |
Ñ | The $316 million of mezzanine securities financed through repurchase facilities at March 31, 2017 carry investment grade credit ratings and are supported by residential loans originated between 2012 and 2017. The loans underlying these securities have experienced minimal delinquencies to date. |
Ñ | The $19 million of multifamily securities financed through repurchase facilities at March 31, 2017 carry investment grade credit ratings with 7%-8% of structural credit enhancement. |
Ñ | Additional information on the residential securities we own is set forth in Tables 6 and 7 in the Financial Tables section of the Appendix to this Redwood Review. |
THE REDWOOD REVIEW I 1ST QUARTER 2017 |
29 |
A N A L Y S I S O F B A L A N C E S H E E T A N D C A P I T A L A L L O C A T I O N S |
MSR Portfolio Composition | ||||||||||||
March 31, 2017 | ||||||||||||
($ in millions, except price and cost per loan to service) | ||||||||||||
Conforming | Jumbo | Total | ||||||||||
Principal (1) | $ | 3,800 | $ | 5,983 | $ | 9,783 | ||||||
Fair value of MSRs | $ | 44 | $ | 67 | $ | 111 | ||||||
Price (2) | $ | 1.17 | $ | 1.11 | $ | 1.13 | ||||||
Implied multiple (3) | 4.7X | 4.4X | 4.5X | |||||||||
GWAC (4) | 3.87 | % | 3.97 | % | 3.93 | % | ||||||
Key assumptions in determining fair value | ||||||||||||
Discount rate | 10 | % | 11 | % | 11 | % | ||||||
Annualized cost per loan to service | $ | 82 | $ | 82 | $ | 82 | ||||||
Constant prepayment rate (CPR) of associated loans | 7 | % | 10 | % | 9 | % | ||||||
(1) | Represents principal balance of residential loans associated with MSRs in our portfolio. |
(2) | Fair value per $100 of principal. |
(3) | Price divided by annual base servicing fee of 25 basis points. |
(4) | Gross weighted average coupon of associated residential loans. |
Ñ | The GAAP carrying value, which is the estimated fair value of our MSRs, was equal to 1.13% of the aggregate principal balance of the associated residential loans at both March 31, 2017 and December 31, 2016. |
Ñ | At March 31, 2017, the 60-day-plus delinquency rate (by current principal balance) of loans associated with our MSR investments was 0.21%. |
Ñ | We earn fees from these MSRs, but outsource the actual servicing of the associated loans to third-party servicers. |
Ñ | Subsequent to the end of the first quarter, we sold substantially all of our conforming MSR portfolio at pricing levels similar to where we marked these investments at March 31, 2017. |
THE REDWOOD REVIEW I 1ST QUARTER 2017 |
30 |
A N A L Y S I S O F B A L A N C E S H E E T A N D C A P I T A L A L L O C A T I O N S |
THE REDWOOD REVIEW I 1ST QUARTER 2017 |
31 |

R E D W O O D' S B U S I N E S S O V E R V I E W |
THE REDWOOD REVIEW I 1ST QUARTER 2017 |
33 |
D I V I D E N D P O L I C Y |
THE REDWOOD REVIEW I 1ST QUARTER 2017 |
34 |
D I V I D E N D P O L I C Y |
THE REDWOOD REVIEW I 1ST QUARTER 2017 |
35 |
C O R E E A R N I N G S D E F I N I T I O N |
THE REDWOOD REVIEW I 1ST QUARTER 2017 |
36 |
G L O S S A R Y |
THE REDWOOD REVIEW I 1ST QUARTER 2017 |
37 |
G L O S S A R Y |
THE REDWOOD REVIEW I 1ST QUARTER 2017 |
38 |
G L O S S A R Y |
THE REDWOOD REVIEW I 1ST QUARTER 2017 |
39 |
G L O S S A R Y |
THE REDWOOD REVIEW I 1ST QUARTER 2017 |
40 |
G L O S S A R Y |
THE REDWOOD REVIEW I 1ST QUARTER 2017 |
41 |
G L O S S A R Y |
THE REDWOOD REVIEW I 1ST QUARTER 2017 |
42 |
G L O S S A R Y |
THE REDWOOD REVIEW I 1ST QUARTER 2017 |
43 |
G L O S S A R Y |
THE REDWOOD REVIEW I 1ST QUARTER 2017 |
44 |
G L O S S A R Y |
THE REDWOOD REVIEW I 1ST QUARTER 2017 |
45 |
G L O S S A R Y |

THE REDWOOD REVIEW I 1ST QUARTER 2017 |
46 |
 | Table 1: GAAP Earnings (in thousands, except per share data) | |||||||||||||||||||||||||||||||||||||||||||||
2017 Q1 | 2016 Q4 | 2016 Q3 | 2016 Q2 | 2016 Q1 | 2015 Q4 | 2015 Q3 | 2015 Q2 | 2015 Q1 | Twelve Months 2016 | Twelve Months 2015 | ||||||||||||||||||||||||||||||||||||
Interest income | $ | 49,367 | $ | 50,612 | $ | 54,781 | $ | 60,307 | $ | 54,071 | $ | 60,074 | $ | 54,191 | $ | 53,857 | $ | 53,713 | $ | 219,771 | $ | 221,835 | ||||||||||||||||||||||||
Discount amortization on securities, net | 5,261 | 5,722 | 6,125 | 6,339 | 8,068 | 8,573 | 9,115 | 9,324 | 9,838 | 26,254 | 36,850 | |||||||||||||||||||||||||||||||||||
Discount (premium) amortization on loans, net | — | — | — | 141 | 189 | 182 | 178 | 192 | 195 | 330 | 747 | |||||||||||||||||||||||||||||||||||
Total interest income | 54,628 | 56,334 | 60,906 | 66,787 | 62,328 | 68,829 | 63,484 | 63,373 | 63,746 | 246,355 | 259,432 | |||||||||||||||||||||||||||||||||||
Interest expense on short-term debt | (4,453 | ) | (4,848 | ) | (5,405 | ) | (5,337 | ) | (6,697 | ) | (9,194 | ) | (7,627 | ) | (6,527 | ) | (7,224 | ) | (22,287 | ) | (30,572 | ) | ||||||||||||||||||||||||
Interest expense on ABS issued from consolidated trusts | (3,530 | ) | (3,278 | ) | (3,193 | ) | (3,982 | ) | (4,282 | ) | (4,432 | ) | (5,190 | ) | (5,645 | ) | (6,202 | ) | (14,735 | ) | (21,469 | ) | ||||||||||||||||||||||||
Interest expense on long-term debt | (13,048 | ) | (12,411 | ) | (12,999 | ) | (13,125 | ) | (12,971 | ) | (11,413 | ) | (11,058 | ) | (10,836 | ) | (10,535 | ) | (51,506 | ) | (43,842 | ) | ||||||||||||||||||||||||
Total interest expense | (21,031 | ) | (20,537 | ) | (21,597 | ) | (22,444 | ) | (23,950 | ) | (25,039 | ) | (23,875 | ) | (23,008 | ) | (23,961 | ) | (88,528 | ) | (95,883 | ) | ||||||||||||||||||||||||
Net interest income | 33,597 | 35,797 | 39,309 | 44,343 | 38,378 | 43,790 | 39,609 | 40,365 | 39,785 | 157,827 | 163,549 | |||||||||||||||||||||||||||||||||||
(Provision for) reversal of provision for loan losses – Commercial | — | — | 859 | 6,532 | (289 | ) | 240 | 60 | 261 | (206 | ) | 7,102 | 355 | |||||||||||||||||||||||||||||||||
Net interest income after provision | 33,597 | 35,797 | 40,168 | 50,875 | 38,089 | 44,030 | 39,669 | 40,626 | 39,579 | 164,929 | 163,904 | |||||||||||||||||||||||||||||||||||
Non-interest income | ||||||||||||||||||||||||||||||||||||||||||||||
Mortgage banking activities, net | ||||||||||||||||||||||||||||||||||||||||||||||
Residential mortgage banking | 17,604 | 13,979 | 9,766 | 7,728 | 9,280 | 885 | 331 | 4,833 | 2,219 | 40,753 | 8,268 | |||||||||||||||||||||||||||||||||||
Commercial mortgage banking | — | — | — | — | (2,062 | ) | (620 | ) | 1,002 | 2,614 | (292 | ) | (2,062 | ) | 2,704 | |||||||||||||||||||||||||||||||
Mortgage servicing rights income (loss), net | ||||||||||||||||||||||||||||||||||||||||||||||
MSR net servicing fee income | 5,527 | 7,629 | 8,726 | 8,870 | 9,646 | 9,392 | 8,715 | 7,292 | 8,486 | 34,871 | 33,885 | |||||||||||||||||||||||||||||||||||
MSR fair value changes | (3,065 | ) | 34,180 | 1,380 | (27,240 | ) | (44,422 | ) | 7,676 | (28,717 | ) | 15,352 | (19,410 | ) | (36,102 | ) | (25,099 | ) | ||||||||||||||||||||||||||||
MSR derivatives fair value changes (1) | (749 | ) | (40,290 | ) | (6,336 | ) | 21,153 | 41,057 | (14,445 | ) | 23,551 | (21,814 | ) | — | 15,584 | (12,708 | ) | |||||||||||||||||||||||||||||
Investment fair value changes, net | 1,551 | (9,888 | ) | 11,918 | (11,066 | ) | (19,538 | ) | (4,251 | ) | (14,169 | ) | (1,788 | ) | (1,149 | ) | (28,574 | ) | (21,357 | ) | ||||||||||||||||||||||||||
Realized gains, net | 5,703 | 1,972 | 6,615 | 9,884 | 9,538 | 20,199 | 5,548 | 6,316 | 4,306 | 28,009 | 36,369 | |||||||||||||||||||||||||||||||||||
Other income | 1,184 | 2,181 | 1,643 | 1,559 | 955 | 757 | 327 | 1,299 | 809 | 6,338 | 3,192 | |||||||||||||||||||||||||||||||||||
Total non-interest income (loss), net | 27,755 | 9,763 | 33,712 | 10,888 | 4,454 | 19,593 | (3,412 | ) | 14,104 | (5,031 | ) | 58,817 | 25,254 | |||||||||||||||||||||||||||||||||
Fixed compensation expense | (6,002 | ) | (5,310 | ) | (5,253 | ) | (5,875 | ) | (7,894 | ) | (8,009 | ) | (8,642 | ) | (9,286 | ) | (9,156 | ) | (24,332 | ) | (35,093 | ) | ||||||||||||||||||||||||
Variable compensation expense | (3,933 | ) | (4,757 | ) | (5,802 | ) | (4,262 | ) | (1,760 | ) | (1,470 | ) | (3,567 | ) | (3,578 | ) | (3,991 | ) | (16,581 | ) | (12,606 | ) | ||||||||||||||||||||||||
Equity compensation expense | (2,176 | ) | (1,976 | ) | (2,031 | ) | (2,754 | ) | (2,332 | ) | (2,809 | ) | (2,835 | ) | (3,539 | ) | (2,738 | ) | (9,093 | ) | (11,921 | ) | ||||||||||||||||||||||||
Restructuring charges | — | 144 | (4 | ) | 118 | (10,659 | ) | — | — | — | — | (10,401 | ) | — | ||||||||||||||||||||||||||||||||
Other operating expense | (6,115 | ) | (5,925 | ) | (7,265 | ) | (7,382 | ) | (7,807 | ) | (10,350 | ) | (9,453 | ) | (8,815 | ) | (9,178 | ) | (28,379 | ) | (37,796 | ) | ||||||||||||||||||||||||
Total operating expenses | (18,226 | ) | (17,824 | ) | (20,355 | ) | (20,155 | ) | (30,452 | ) | (22,638 | ) | (24,497 | ) | (25,218 | ) | (25,063 | ) | (88,786 | ) | (97,416 | ) | ||||||||||||||||||||||||
(Provision for) benefit from income taxes | (6,157 | ) | (2,381 | ) | (972 | ) | (327 | ) | (28 | ) | 74 | 7,404 | (2,448 | ) | 5,316 | (3,708 | ) | 10,346 | ||||||||||||||||||||||||||||
Net income | $ | 36,969 | $ | 25,355 | $ | 52,553 | $ | 41,281 | $ | 12,063 | $ | 41,059 | $ | 19,164 | $ | 27,064 | $ | 14,801 | $ | 131,252 | $ | 102,088 | ||||||||||||||||||||||||
Diluted average shares (2) | 97,946 | 85,838 | 97,832 | 97,762 | 77,138 | 103,377 | 85,075 | 94,950 | 85,622 | 97,909 | 84,518 | |||||||||||||||||||||||||||||||||||
Diluted earnings per common share | $ | 0.43 | $ | 0.31 | $ | 0.58 | $ | 0.48 | $ | 0.15 | $ | 0.46 | $ | 0.22 | $ | 0.31 | $ | 0.16 | $ | 1.54 | $ | 1.18 | ||||||||||||||||||||||||
(1) | During the second quarter of 2015, we began to specifically identify derivatives associated with our MSRs and include market valuation adjustments associated with these derivatives in MSR income (loss), net. Prior to the second quarter of 2015, valuation adjustments of MSR hedges were presented in Investment fair value changes, net. |
(2) | Diluted average shares includes shares from the assumed conversion of our convertible and/or exchangeable debt in certain periods, in accordance with GAAP diluted EPS provisions. See Table 2 that follows for details of this calculation for the current year and our respective Quarterly Reports on Form 10-Q and Annual Reports on Form 10-K for prior years. |
THE REDWOOD REVIEW I 1ST QUARTER 2017 | Table 1: GAAP Earnings 47 | |
| Table 2: GAAP and Non-GAAP Core Diluted Earnings (1) per Common Share (in thousands, except per share data) | ||||||||
2017 Q1 | 2016 Q4 | ||||||||
GAAP Diluted Earnings per Common Share: | |||||||||
Net income attributable to Redwood | $ | 36,969 | $ | 25,355 | |||||
Less: Dividends and undistributed earnings allocated to participating securities | (1,005 | ) | (769 | ) | |||||
Add back: Interest expense on convertible notes for the period, net of tax (2) | 5,870 | 2,130 | |||||||
Net income allocated to common shareholders | $ | 41,834 | $ | 26,716 | |||||
Basic weighted average common share outstanding | 76,738 | 76,509 | |||||||
Net effect of dilutive equity awards | 111 | 58 | |||||||
Net effect of assumed convertible notes conversion to common shares (2) | 21,097 | 9,271 | |||||||
Diluted weighted average common shares outstanding | 97,946 | 85,838 | |||||||
GAAP Diluted Earnings per Common Share | $ | 0.43 | $ | 0.31 | |||||
Non-GAAP Core Diluted Earnings per Common Share: | |||||||||
Non-GAAP core earnings | $ | 29,785 | $ | 26,926 | |||||
Less: Dividends and undistributed earnings allocated to participating securities | (863 | ) | (871 | ) | |||||
Add back: Interest expense on convertible notes for the period, net of tax (2) | 5,870 | 5,986 | |||||||
Non-GAAP core earnings allocated to common shareholders | $ | 34,792 | $ | 32,041 | |||||
Basic weighted average common share outstanding | 76,738 | 76,509 | |||||||
Net effect of dilutive equity awards | 111 | 58 | |||||||
Net effect of assumed convertible notes conversion to common shares (2) | 21,097 | 21,097 | |||||||
Diluted weighted average common shares outstanding | 97,946 | 97,664 | |||||||
Non-GAAP Core Diluted Earnings per Common Share | $ | 0.36 | $ | 0.33 | |||||
(1) | A reconciliation of GAAP net income to non-GAAP core earnings is included in the GAAP Net Income and Reconciliation to Non-GAAP Core Earnings section that starts on page 11 and a definition of core earnings is included in the Core Earnings Definition section of the Appendix. |
(2) | Certain convertible notes were determined to be dilutive in the periods presented and were included in the calculations of diluted EPS under the "if-converted" method. Under this method, the periodic interest expense (net of applicable taxes) for dilutive notes is added back to the numerator and the number of shares that the notes are entitled to (if converted, regardless of whether they are in or out of the money) are included in the denominator. |
THE REDWOOD REVIEW I 1ST QUARTER 2017 | Table 2: GAAP and Core Earnings per Diluted Common Share 48 | |
| Table 3: Segment Results ($ in thousands) | ||||||||||||||||||||||||||||||||||
Three Months Ended March 31, 2017 | Three Months Ended December 31, 2016 | ||||||||||||||||||||||||||||||||||
Investment Portfolio | Residential Mortgage Banking | Corporate/ Other | Total | Investment Portfolio | Residential Mortgage Banking | Corporate/ Other | Total | ||||||||||||||||||||||||||||
Interest income | $ | 42,250 | $ | 7,474 | $ | 4,904 | $ | 54,628 | $ | 42,215 | $ | 9,051 | $ | 5,068 | $ | 56,334 | |||||||||||||||||||
Interest expense | (5,264 | ) | (2,924 | ) | (12,843 | ) | (21,031 | ) | (4,318 | ) | (3,472 | ) | (12,747 | ) | (20,537 | ) | |||||||||||||||||||
Net interest income (expense) | 36,986 | 4,550 | (7,939 | ) | 33,597 | 37,897 | 5,579 | (7,679 | ) | 35,797 | |||||||||||||||||||||||||
Non-interest income | |||||||||||||||||||||||||||||||||||
Mortgage banking activities, net | — | 17,604 | — | 17,604 | — | 13,979 | — | 13,979 | |||||||||||||||||||||||||||
MSR income, net | 1,713 | — | — | 1,713 | 1,519 | — | — | 1,519 | |||||||||||||||||||||||||||
Investment fair value changes, net | 3,359 | — | (1,808 | ) | 1,551 | (7,862 | ) | — | (2,026 | ) | (9,888 | ) | |||||||||||||||||||||||
Other income | 1,184 | — | — | 1,184 | 2,181 | — | — | 2,181 | |||||||||||||||||||||||||||
Realized gains, net | 5,703 | — | — | 5,703 | 1,972 | — | — | 1,972 | |||||||||||||||||||||||||||
Total non-interest income (loss) | 11,959 | 17,604 | (1,808 | ) | 27,755 | (2,190 | ) | 13,979 | (2,026 | ) | 9,763 | ||||||||||||||||||||||||
Operating expenses | (1,593 | ) | (5,881 | ) | (10,752 | ) | (18,226 | ) | (2,732 | ) | (6,077 | ) | (9,015 | ) | (17,824 | ) | |||||||||||||||||||
Provision for income taxes | (1,737 | ) | (4,420 | ) | — | (6,157 | ) | (761 | ) | (1,620 | ) | — | (2,381 | ) | |||||||||||||||||||||
Segment contribution | $ | 45,615 | $ | 11,853 | $ | (20,499 | ) | $ | 32,214 | $ | 11,861 | $ | (18,720 | ) | |||||||||||||||||||||
Net income | $ | 36,969 | $ | 25,355 | |||||||||||||||||||||||||||||||
Segment assets and liabilities | March 31, 2017 | December 31, 2016 | |||||||||||||||||||||||||||||||||
Residential loans | $ | 2,350,013 | $ | 376,607 | $ | 745,621 | $ | 3,472,241 | $ | 2,261,016 | $ | 835,399 | $ | 791,636 | $ | 3,888,051 | |||||||||||||||||||
Real estate securities | 1,165,940 | — | — | 1,165,940 | 1,018,439 | — | — | 1,018,439 | |||||||||||||||||||||||||||
Mortgage servicing rights | 111,013 | — | — | 111,013 | 118,526 | — | — | 118,526 | |||||||||||||||||||||||||||
Cash and cash equivalents | 11,994 | — | 209,787 | 221,781 | 72,202 | — | 140,642 | 212,844 | |||||||||||||||||||||||||||
Other assets | 132,410 | 33,622 | 77,284 | 243,316 | 145,352 | 30,957 | 69,308 | 245,617 | |||||||||||||||||||||||||||
Total assets | $ | 3,771,370 | $ | 410,229 | $ | 1,032,692 | $ | 5,214,291 | $ | 3,615,535 | $ | 866,356 | $ | 1,001,586 | $ | 5,483,477 | |||||||||||||||||||
Short-term debt | |||||||||||||||||||||||||||||||||||
Mortgage loan warehouse debt | $ | — | $ | 240,961 | $ | — | $ | 240,961 | $ | — | $ | 485,544 | $ | — | $ | 485,544 | |||||||||||||||||||
Security repurchase facilities | 322,812 | — | — | 322,812 | 305,995 | — | — | 305,995 | |||||||||||||||||||||||||||
Other liabilities | 40,987 | 16,570 | 77,305 | 134,862 | 43,169 | 21,389 | 83,807 | 148,365 | |||||||||||||||||||||||||||
ABS issued, net | — | — | 728,391 | 728,391 | — | — | 773,462 | 773,462 | |||||||||||||||||||||||||||
Long-term debt, net | 1,999,999 | — | 621,495 | 2,621,494 | 1,999,999 | — | 620,684 | 2,620,683 | |||||||||||||||||||||||||||
Total liabilities | $ | 2,363,798 | $ | 257,531 | $ | 1,427,191 | $ | 4,048,520 | $ | 2,349,163 | $ | 506,933 | $ | 1,477,953 | $ | 4,334,049 | |||||||||||||||||||
THE REDWOOD REVIEW I 1ST QUARTER 2017 | Table 3: Segment Results 49 | |
| Table 4: Taxable and GAAP Income (1) Differences and Dividends ($ in thousands, except for per share data) | ||||||||||||||||||||||||||||||||||||
Estimated Three Months 2017 (2) | Estimated Twelve Months 2016 (2) | Actual Twelve Months 2015 (2) | |||||||||||||||||||||||||||||||||||
Taxable Income | GAAP Income | Differences | Taxable Income | GAAP Income | Differences | Taxable Income | GAAP Income | Differences | |||||||||||||||||||||||||||||
Taxable and GAAP Income Differences | |||||||||||||||||||||||||||||||||||||
Interest income | $ | 50,001 | $ | 54,628 | $ | (4,627 | ) | $ | 232,997 | $ | 246,355 | $ | (13,358 | ) | $ | 227,133 | $ | 259,432 | $ | (32,299 | ) | ||||||||||||||||
Interest expense | (17,654 | ) | (21,031 | ) | 3,377 | (76,396 | ) | (88,528 | ) | 12,132 | (79,830 | ) | (95,883 | ) | 16,053 | ||||||||||||||||||||||
Net interest income | 32,347 | 33,597 | (1,250 | ) | 156,601 | 157,827 | (1,226 | ) | 147,303 | 163,549 | (16,246 | ) | |||||||||||||||||||||||||
Reversal of provision (provision for) loan losses | — | 0 | 0 | — | 7,102 | (7,102 | ) | — | 355 | (355 | ) | ||||||||||||||||||||||||||
Realized credit losses | (996 | ) | — | (996 | ) | (7,989 | ) | — | (7,989 | ) | (8,645 | ) | — | (8,645 | ) | ||||||||||||||||||||||
Mortgage banking activities, net | 9,871 | 17,604 | (7,733 | ) | 26,459 | 38,691 | (12,232 | ) | (24,637 | ) | 10,972 | (35,609 | ) | ||||||||||||||||||||||||
MSR income (loss), net | 1,225 | 1,713 | (488 | ) | 86,638 | 14,353 | 72,285 | 33,669 | (3,922 | ) | 37,591 | ||||||||||||||||||||||||||
Investment fair value changes, net | (3,697 | ) | 1,551 | (5,248 | ) | (10,410 | ) | (28,574 | ) | 18,164 | (2,827 | ) | (21,357 | ) | 18,530 | ||||||||||||||||||||||
Operating expenses | (17,414 | ) | (18,226 | ) | 812 | (88,838 | ) | (88,786 | ) | (52 | ) | (103,236 | ) | (97,416 | ) | (5,820 | ) | ||||||||||||||||||||
Other income (expense), net | 597 | 1,184 | (587 | ) | 2,760 | 6,338 | (3,578 | ) | 2,174 | 3,192 | (1,018 | ) | |||||||||||||||||||||||||
Realized gains, net | — | 5,703 | (5,703 | ) | 284 | 28,009 | (27,725 | ) | — | 36,369 | (36,369 | ) | |||||||||||||||||||||||||
(Provision for) benefit from income taxes | (39 | ) | (6,157 | ) | 6,118 | (155 | ) | (3,708 | ) | 3,553 | (150 | ) | 10,346 | (10,496 | ) | ||||||||||||||||||||||
Income | $ | 21,894 | $ | 36,969 | $ | (15,075 | ) | $ | 165,350 | $ | 131,252 | $ | 34,098 | $ | 43,651 | $ | 102,088 | $ | (58,437 | ) | |||||||||||||||||
REIT taxable income | $ | 16,679 | $ | 97,278 | $ | 85,685 | |||||||||||||||||||||||||||||||
Taxable income (loss) at taxable subsidiaries | 5,215 | 68,072 | (42,034 | ) | |||||||||||||||||||||||||||||||||
Taxable income | $ | 21,894 | $ | 165,350 | $ | 43,651 | |||||||||||||||||||||||||||||||
Shares used for taxable EPS calculation | 77,039 | 76,835 | 78,163 | ||||||||||||||||||||||||||||||||||
REIT taxable income per share (3) | $ | 0.22 | $ | 1.27 | $ | 1.05 | |||||||||||||||||||||||||||||||
Taxable income (loss) per share at taxable subsidiaries | $ | 0.07 | $ | 0.88 | $ | (0.50 | ) | ||||||||||||||||||||||||||||||
Taxable income per share (3) | $ | 0.29 | $ | 2.15 | $ | 0.55 | |||||||||||||||||||||||||||||||
Dividends | |||||||||||||||||||||||||||||||||||||
Dividends declared | $ | 21,569 | $ | 86,240 | $ | 92,493 | |||||||||||||||||||||||||||||||
Dividends per share (4) | $ | 0.28 | $ | 1.12 | $ | 1.12 | |||||||||||||||||||||||||||||||
(1) | Taxable income for 2016 and 2017 are estimates until we file our tax returns for these years. To the extent we expect to pay tax at the corporate level (generally as a result of activity at our taxable REIT subsidiaries), we are required to record a tax provision for GAAP reporting purposes. Any tax provision (or benefit) is not intended to reflect the actual amount we expect to pay (or receive as an income tax refund) as it is expected to be utilized in future periods, as GAAP income is earned at our TRS. It is our intention to retain any excess inclusion income generated in 2017 at our TRS and not pass it through to our shareholders. |
(2) | Reconciliation of GAAP income to taxable income (loss) for prior quarters is provided in the respective Redwood Reviews for those quarters. |
(3) | REIT taxable income per share and taxable income (loss) per share are based on the number of shares outstanding at the end of each quarter. The annual REIT taxable income per share and taxable income (loss) per share are the sum of the four quarterly per share estimates. |
(4) | Dividends in 2016 are expected to be characterized as 100% ordinary income (or $86 million). Dividends in 2015 were characterized as 100% ordinary income (or $92 million). |
THE REDWOOD REVIEW I 1ST QUARTER 2017 | Table 4: Taxable and GAAP Income Differences and Dividends 50 | |
| Table 5: Financial Ratios and Book Value ($ in thousands, except per share data) | ||||||||||||||||||||||||||||||||||||||||||||
2017 Q1 | 2016 Q4 | 2016 Q3 | 2016 Q2 | 2016 Q1 | 2015 Q4 | 2015 Q3 | 2015 Q2 | 2015 Q1 | Twelve Months 2016 | Twelve Months 2015 | |||||||||||||||||||||||||||||||||||
Financial performance ratios | |||||||||||||||||||||||||||||||||||||||||||||
Net interest income | $ | 33,597 | $ | 35,797 | $ | 39,309 | $ | 44,343 | $ | 38,378 | $ | 43,790 | $ | 39,609 | $ | 40,365 | $ | 39,785 | $ | 157,827 | $ | 163,549 | |||||||||||||||||||||||
Operating expenses | $ | (18,226 | ) | $ | (17,824 | ) | $ | (20,355 | ) | $ | (20,155 | ) | $ | (30,452 | ) | $ | (22,638 | ) | $ | (24,497 | ) | $ | (25,218 | ) | $ | (25,063 | ) | $ | (88,786 | ) | $ | (97,416 | ) | ||||||||||||
GAAP net income | $ | 36,969 | $ | 25,355 | $ | 52,553 | $ | 41,281 | $ | 12,063 | $ | 41,059 | $ | 19,164 | $ | 27,064 | $ | 14,801 | $ | 131,252 | $ | 102,088 | |||||||||||||||||||||||
Average total assets | $ | 5,471,154 | $ | 5,613,048 | $ | 5,880,281 | $ | 5,954,162 | $ | 6,131,715 | $ | 6,480,586 | $ | 5,977,645 | $ | 5,730,268 | $ | 5,866,851 | $ | 5,893,998 | $ | 6,015,420 | |||||||||||||||||||||||
Average total equity | $ | 1,158,732 | $ | 1,137,948 | $ | 1,111,507 | $ | 1,089,289 | $ | 1,110,187 | $ | 1,189,289 | $ | 1,244,327 | $ | 1,265,647 | $ | 1,262,883 | $ | 1,112,313 | $ | 1,240,345 | |||||||||||||||||||||||
Operating expenses / average total assets | 1.33 | % | 1.27 | % | 1.38 | % | 1.35 | % | 1.99 | % | 1.40 | % | 1.64 | % | 1.76 | % | 1.71 | % | 1.51 | % | 1.62 | % | |||||||||||||||||||||||
Operating expenses / average total equity | 6.29 | % | 6.27 | % | 7.33 | % | 7.40 | % | 10.97 | % | 7.61 | % | 7.87 | % | 7.97 | % | 7.94 | % | 7.98 | % | 7.85 | % | |||||||||||||||||||||||
GAAP net income / average total assets | 2.70 | % | 1.81 | % | 3.57 | % | 2.77 | % | 0.79 | % | 2.53 | % | 1.28 | % | 1.89 | % | 1.01 | % | 2.23 | % | 1.70 | % | |||||||||||||||||||||||
GAAP net income / average equity (GAAP ROE) | 12.76 | % | 8.91 | % | 18.91 | % | 15.16 | % | 4.35 | % | 13.81 | % | 6.16 | % | 8.55 | % | 4.69 | % | 11.80 | % | 8.23 | % | |||||||||||||||||||||||
Leverage ratios and book value per share | |||||||||||||||||||||||||||||||||||||||||||||
Short-term debt | $ | 563,773 | $ | 791,539 | $ | 1,117,405 | $ | 1,059,045 | $ | 804,175 | $ | 1,855,003 | $ | 1,872,793 | $ | 1,367,062 | $ | 1,502,164 | |||||||||||||||||||||||||||
Long-term debt – Commercial secured borrowing | — | — | — | 65,240 | 65,181 | 63,152 | 65,578 | 65,232 | 68,077 | ||||||||||||||||||||||||||||||||||||
Long-term debt – Other (1) | 2,627,764 | 2,627,764 | 2,627,764 | 2,627,764 | 2,627,764 | 1,975,023 | 1,756,299 | 1,514,122 | 1,482,792 | ||||||||||||||||||||||||||||||||||||
Total debt at Redwood | $ | 3,191,537 | $ | 3,419,303 | $ | 3,745,169 | $ | 3,752,049 | $ | 3,497,120 | $ | 3,893,178 | $ | 3,694,670 | $ | 2,946,416 | $ | 3,053,033 | |||||||||||||||||||||||||||
ABS issued at consolidated entities | |||||||||||||||||||||||||||||||||||||||||||||
Residential Resecuritization ABS issued | $ | — | $ | — | $ | — | $ | — | $ | — | $ | — | $ | 5,261 | $ | 18,872 | $ | 34,280 | |||||||||||||||||||||||||||
Commercial Securitization ABS issued | — | — | — | — | 51,680 | 53,137 | 67,946 | 69,914 | 79,676 | ||||||||||||||||||||||||||||||||||||
Legacy Sequoia entities ABS issued | 728,391 | 773,462 | 819,868 | 859,628 | 907,023 | 996,820 | 1,105,588 | 1,173,336 | 1,239,065 | ||||||||||||||||||||||||||||||||||||
Total ABS issued (1) | $ | 728,391 | $ | 773,462 | $ | 819,868 | $ | 859,628 | $ | 958,703 | $ | 1,049,957 | $ | 1,178,795 | $ | 1,262,122 | $ | 1,353,021 | |||||||||||||||||||||||||||
Consolidated Debt | $ | 3,919,928 | $ | 4,192,765 | $ | 4,565,037 | $ | 4,611,677 | $ | 4,455,823 | $ | 4,943,135 | $ | 4,873,465 | $ | 4,208,538 | $ | 4,406,054 | |||||||||||||||||||||||||||
Stockholders' equity | $ | 1,165,771 | $ | 1,149,428 | $ | 1,130,130 | $ | 1,092,603 | $ | 1,085,750 | $ | 1,146,265 | $ | 1,206,575 | $ | 1,264,785 | $ | 1,257,210 | |||||||||||||||||||||||||||
Debt at Redwood to stockholders' equity (2) | 2.7x | 3.0x | 3.3x | 3.4x | 3.2x | 3.4x | 3.1x | 2.3x | 2.4x | ||||||||||||||||||||||||||||||||||||
Consolidated debt to stockholders' equity | 3.4x | 3.6x | 4.0x | 4.2x | 4.1x | 4.3x | 4.0x | 3.3x | 3.5x | ||||||||||||||||||||||||||||||||||||
Shares outstanding at period end (in thousands) | 77,039 | 76,835 | 76,682 | 76,935 | 76,627 | 78,163 | 82,125 | 84,552 | 83,749 | ||||||||||||||||||||||||||||||||||||
Book value per share | $ | 15.13 | $ | 14.96 | $ | 14.74 | $ | 14.20 | $ | 14.17 | $ | 14.67 | $ | 14.69 | $ | 14.96 | $ | 15.01 | |||||||||||||||||||||||||||
(1) | Long-term debt - other and ABS issued presented above do not include deferred securities issuance costs. |
(2) | Excludes ABS obligations of consolidated securitization entities, including legacy Sequoia securitizations completed prior to 2012, the residential resecuritization completed in 2011, and the commercial securitization completed in 2012. Also excludes commercial secured borrowings associated with commercial A-notes that were sold, but treated as secured borrowings under GAAP. |
THE REDWOOD REVIEW I 1ST QUARTER 2017 | Table 5: Financial Ratios and Book Value 51 | |
| Table 6: Balance & Yields by Portfolio (1) ($ in thousands) | |||||||||||||||||||||||||||||||||||||||||||||||||||
2017 Q1 | 2016 Q4 | 2016 Q3 | 2016 Q2 | 2016 Q1 | 2015 Q4 | 2017 Q1 | 2016 Q4 | 2016 Q3 | 2016 Q2 | 2016 Q1 | 2015 Q4 | |||||||||||||||||||||||||||||||||||||||||
Securities – Prime Senior | Securities – Subordinate | |||||||||||||||||||||||||||||||||||||||||||||||||||
Principal balance | $ | 138,574 | $ | 139,736 | $ | 68,288 | $ | 70,717 | $ | 120,577 | $ | 434,768 | Principal balance | $ | 1,053,558 | $ | 889,944 | $ | 792,571 | $ | 747,408 | $ | 716,426 | $ | 658,403 | |||||||||||||||||||||||||||
Unamortized discount | (37,368 | ) | (40,379 | ) | (6,116 | ) | (6,614 | ) | (13,491 | ) | (21,295 | ) | Unamortized discount | (166,065 | ) | (161,821 | ) | (150,915 | ) | (157,445 | ) | (154,759 | ) | (153,697 | ) | |||||||||||||||||||||||||||
Credit reserve | (4,338 | ) | (4,174 | ) | (1,483 | ) | (987 | ) | (1,108 | ) | (1,305 | ) | Credit reserve | (39,096 | ) | (35,802 | ) | (35,037 | ) | (33,982 | ) | (35,494 | ) | (32,131 | ) | |||||||||||||||||||||||||||
Unrealized gains, net | 34,712 | 33,660 | 2,780 | 2,080 | 5,545 | 16,772 | Unrealized gains, net | 67,507 | 66,792 | 73,002 | 65,397 | 62,327 | 61,775 | |||||||||||||||||||||||||||||||||||||||
IO securities | 34,594 | 32,230 | 19,098 | 17,709 | 22,177 | 30,623 | IO securities | 207 | 234 | 273 | 260 | 250 | 240 | |||||||||||||||||||||||||||||||||||||||
Fair value | $ | 166,174 | $ | 161,073 | $ | 82,567 | $ | 82,905 | $ | 133,700 | $ | 459,563 | Fair value | $ | 916,111 | $ | 759,347 | $ | 679,894 | $ | 621,638 | $ | 588,750 | $ | 534,590 | |||||||||||||||||||||||||||
Average amortized cost | $ | 125,432 | $ | 112,814 | $ | 79,905 | $ | 97,262 | $ | 266,151 | $ | 370,769 | Mezzanine (3) | |||||||||||||||||||||||||||||||||||||||
Interest income | $ | 4,967 | $ | 4,644 | $ | 2,543 | $ | 3,009 | $ | 5,660 | $ | 7,066 | Average amortized cost | $ | 448,442 | $ | 361,750 | $ | 361,729 | $ | 329,308 | $ | 354,239 | $ | 267,974 | |||||||||||||||||||||||||||
Annualized yield (2) | 15.84 | % | 16.47 | % | 12.73 | % | 12.37 | % | 8.51 | % | 7.62 | % | Interest income | $ | 5,208 | $ | 4,608 | $ | 4,392 | $ | 4,077 | $ | 4,231 | $ | 3,533 | |||||||||||||||||||||||||||
Annualized yield | 4.65 | % | 5.10 | % | 4.86 | % | 4.95 | % | 4.78 | % | 5.27 | % | ||||||||||||||||||||||||||||||||||||||||
Securities – Non-Prime Senior | ||||||||||||||||||||||||||||||||||||||||||||||||||||
Principal balance | $ | 6,102 | $ | 9,126 | $ | 9,372 | $ | 10,137 | $ | 31,781 | $ | 75,591 | Subordinate (3) | |||||||||||||||||||||||||||||||||||||||
Unamortized discount | (788 | ) | (1,498 | ) | (1,635 | ) | (1,813 | ) | (3,262 | ) | (8,395 | ) | Average amortized cost | $ | 334,041 | $ | 279,888 | $ | 222,036 | $ | 204,334 | $ | 134,461 | $ | 141,044 | |||||||||||||||||||||||||||
Credit reserve | (183 | ) | (640 | ) | (641 | ) | (622 | ) | (687 | ) | (5,101 | ) | Interest income | $ | 7,115 | $ | 6,336 | $ | 5,565 | $ | 5,320 | $ | 3,896 | $ | 3,930 | |||||||||||||||||||||||||||
Unrealized gains, net | 498 | 715 | 725 | 426 | 1,261 | 6,162 | Annualized yield | 8.52 | % | 9.06 | % | 10.03 | % | 10.41 | % | 11.59 | % | 11.15 | % | |||||||||||||||||||||||||||||||||
IO securities | 4,296 | 4,837 | 5,394 | 5,423 | 5,414 | 5,782 | ||||||||||||||||||||||||||||||||||||||||||||||
Fair value | $ | 9,925 | $ | 12,540 | $ | 13,215 | $ | 13,551 | $ | 34,507 | $ | 74,039 | Residential Loans, held-for-investment (excludes legacy Sequoia) | |||||||||||||||||||||||||||||||||||||||
Average amortized cost | $ | 10,809 | $ | 12,259 | $ | 12,643 | $ | 17,643 | $ | 59,715 | $ | 120,429 | Principal balance | $ | 2,322,896 | $ | 2,233,796 | $ | 2,211,759 | $ | 2,208,823 | $ | 2,275,298 | $ | 1,758,990 | |||||||||||||||||||||||||||
Interest income | $ | 587 | $ | 671 | $ | 705 | $ | 890 | $ | 1,940 | $ | 3,215 | Unrealized gains, net | 27,117 | 27,220 | 70,915 | 68,738 | 68,655 | 32,205 | |||||||||||||||||||||||||||||||||
Annualized yield (2) | 21.72 | % | 21.90 | % | 22.30 | % | 20.18 | % | 13.00 | % | 10.68 | % | Fair value | $ | 2,350,013 | $ | 2,261,016 | $ | 2,282,674 | $ | 2,277,561 | $ | 2,343,953 | $ | 1,791,195 | |||||||||||||||||||||||||||
Securities – Re-REMIC | Average amortized cost | $ | 2,250,377 | $ | 2,237,167 | $ | 2,260,895 | $ | 2,288,560 | $ | 1,986,635 | $ | 1,566,959 | |||||||||||||||||||||||||||||||||||||||
Principal balance | $ | 81,935 | $ | 95,608 | $ | 180,754 | $ | 188,404 | $ | 189,146 | $ | 189,782 | Interest income | $ | 22,038 | $ | 21,585 | $ | 21,923 | $ | 22,333 | $ | 19,306 | $ | 15,526 | |||||||||||||||||||||||||||
Unamortized discount | (16,507 | ) | (19,613 | ) | (59,146 | ) | (64,484 | ) | (66,586 | ) | (71,670 | ) | Annualized yield | 3.92 | % | 3.86 | % | 3.88 | % | 3.90 | % | 3.89 | % | 3.96 | % | |||||||||||||||||||||||||||
Credit reserve | (5,609 | ) | (6,857 | ) | (10,452 | ) | (9,352 | ) | (11,258 | ) | (10,332 | ) | ||||||||||||||||||||||||||||||||||||||||
Unrealized gains, net | 13,911 | 16,341 | 50,078 | 51,139 | 51,668 | 57,284 | Commercial Mezzanine Loans | |||||||||||||||||||||||||||||||||||||||||||||
Fair value | $ | 73,730 | $ | 85,479 | $ | 161,234 | $ | 165,707 | $ | 162,970 | $ | 165,064 | Principal balance | $ | 3,000 | $ | 3,000 | $ | 30,742 | $ | 264,448 | $ | 310,010 | $ | 311,553 | |||||||||||||||||||||||||||
Discount/Valuation Adj. | (300 | ) | (300 | ) | (342 | ) | (3,766 | ) | (3,908 | ) | (4,096 | ) | ||||||||||||||||||||||||||||||||||||||||
Average amortized cost | $ | 65,415 | $ | 79,142 | $ | 113,638 | $ | 112,930 | $ | 109,501 | $ | 107,384 | Credit reserve | — | — | — | (859 | ) | (7,390 | ) | (7,102 | ) | ||||||||||||||||||||||||||||||
Interest income | $ | 1,939 | $ | 2,500 | $ | 5,395 | $ | 5,121 | $ | 5,367 | $ | 4,341 | Carrying value | $ | 2,700 | $ | 2,700 | $ | 30,400 | $ | 259,823 | $ | 298,712 | $ | 300,355 | |||||||||||||||||||||||||||
Annualized yield | 11.86 | % | 12.64 | % | 18.99 | % | 18.14 | % | 19.61 | % | 16.17 | % | ||||||||||||||||||||||||||||||||||||||||
Average amortized cost | $ | 2,700 | $ | 18,738 | $ | 261,194 | $ | 263,547 | $ | 295,531 | $ | 309,577 | ||||||||||||||||||||||||||||||||||||||||
Interest income | $ | 82 | $ | 1,662 | $ | 6,453 | $ | 12,049 | $ | 7,833 | $ | 10,508 | ||||||||||||||||||||||||||||||||||||||||
Annualized yield | 12.15 | % | 35.48 | % | 9.88 | % | 18.29 | % | 10.60 | % | 13.58 | % | ||||||||||||||||||||||||||||||||||||||||
(1) | Annualized yields for securities are calculated using average amortized cost for AFS securities and average fair value for trading securities. |
(2) | Yields for prime and non-prime senior securities include investments in Sequoia IO securities, for which yields are calculated using fair value, as these are trading securities. |
(3) | Mezzanine and subordinate together comprise our subordinate portfolio of securities. We show them separately to present their different yield profiles. A significant portion of our subordinate securities are designated as trading securities and carried at fair value. See our respective Quarterly Reports on Form 10-Q and Annual Report on Form 10-K for further information. |
THE REDWOOD REVIEW I 1ST QUARTER 2017 | Table 6: Balances & Yields by Portfolio 52 | |
| Table 7: Securities and Loan Portfolio Activity ($ in thousands) | |||||||||||||||||||||||||||||||||||||||||||||||||||||
2017 Q1 | 2016 Q4 | 2016 Q3 | 2016 Q2 | 2016 Q1 | 2015 Q4 | 2017 Q1 | 2016 Q4 | 2016 Q3 | 2016 Q2 | 2016 Q1 | 2015 Q4 | |||||||||||||||||||||||||||||||||||||||||||
Securities – Prime Senior | Residential Loans, held-for-sale | |||||||||||||||||||||||||||||||||||||||||||||||||||||
Beginning fair value | $ | 161,073 | $ | 82,567 | $ | 82,905 | $ | 133,700 | $ | 459,563 | $ | 302,581 | Beginning carrying value | $ | 835,399 | $ | 1,188,514 | $ | 882,380 | $ | 441,076 | $ | 1,115,738 | $ | 1,506,151 | |||||||||||||||||||||||||||||
Acquisitions | 3,231 | 4,943 | — | — | — | 203,406 | Acquisitions | 1,108,304 | 1,132,561 | 1,252,135 | 1,342,079 | 1,218,649 | 2,163,783 | |||||||||||||||||||||||||||||||||||||||||
Sales | (3,319 | ) | (1,463 | ) | — | (38,913 | ) | (295,988 | ) | (21,547 | ) | Sales | (1,377,637 | ) | (1,268,943 | ) | (774,106 | ) | (830,974 | ) | (1,269,135 | ) | (2,101,933 | ) | ||||||||||||||||||||||||||||||
Effect of principal payments | (5,943 | ) | (5,175 | ) | (3,937 | ) | (3,918 | ) | (13,528 | ) | (20,508 | ) | Principal repayments | (12,995 | ) | (24,427 | ) | (20,574 | ) | (12,332 | ) | (23,589 | ) | (33,259 | ) | |||||||||||||||||||||||||||||
Transfers between portfolios (1) | 12,229 | 75,058 | 1,889 | — | — | — | Transfers between portfolios | (184,996 | ) | (186,116 | ) | (151,919 | ) | (63,328 | ) | (606,026 | ) | (412,824 | ) | |||||||||||||||||||||||||||||||||||
Change in fair value, net | (1,097 | ) | 5,143 | 1,710 | (7,964 | ) | (16,347 | ) | (4,369 | ) | Changes in fair value, net | 8,532 | (6,190 | ) | 598 | 5,859 | 5,439 | (6,180 | ) | |||||||||||||||||||||||||||||||||||
Ending fair value | $ | 166,174 | $ | 161,073 | $ | 82,567 | $ | 82,905 | $ | 133,700 | $ | 459,563 | Ending fair value | $ | 376,607 | $ | 835,399 | $ | 1,188,514 | $ | 882,380 | $ | 441,076 | $ | 1,115,738 | |||||||||||||||||||||||||||||
Securities – Non-Prime Senior | Residential Loans, held-for-investment (excluding consolidated Sequoia Entities) | |||||||||||||||||||||||||||||||||||||||||||||||||||||
Beginning fair value | $ | 12,540 | $ | 13,215 | $ | 13,551 | $ | 34,507 | $ | 74,039 | $ | 164,554 | Beginning carrying value | $ | 2,261,016 | $ | 2,282,674 | $ | 2,277,561 | $ | 2,343,953 | $ | 1,791,195 | $ | 1,360,277 | |||||||||||||||||||||||||||||
Acquisitions | — | — | — | — | — | 700 | Principal repayments | (93,666 | ) | (162,512 | ) | (146,151 | ) | (129,073 | ) | (76,731 | ) | (62,020 | ) | |||||||||||||||||||||||||||||||||||
Sales | (1,625 | ) | — | — | (18,396 | ) | (32,315 | ) | (71,870 | ) | Transfers between portfolios | 184,996 | 186,116 | 151,919 | 63,328 | 606,026 | 504,445 | |||||||||||||||||||||||||||||||||||||
Effect of principal payments | (304 | ) | (189 | ) | (615 | ) | (1,758 | ) | (2,483 | ) | (7,579 | ) | Changes in fair value, net | (2,333 | ) | (45,262 | ) | (655 | ) | (647 | ) | 23,463 | (11,507 | ) | ||||||||||||||||||||||||||||||
Change in fair value, net | (686 | ) | (486 | ) | 279 | (802 | ) | (4,734 | ) | (11,766 | ) | Ending fair value | $ | 2,350,013 | $ | 2,261,016 | $ | 2,282,674 | $ | 2,277,561 | $ | 2,343,953 | $ | 1,791,195 | ||||||||||||||||||||||||||||||
Ending fair value | $ | 9,925 | $ | 12,540 | $ | 13,215 | $ | 13,551 | $ | 34,507 | $ | 74,039 | ||||||||||||||||||||||||||||||||||||||||||
Residential Loans, held-for-investment at Consolidated Sequoia Entities | ||||||||||||||||||||||||||||||||||||||||||||||||||||||
Securities – Re-REMIC | Beginning carrying value | $ | 791,636 | $ | 839,976 | $ | 880,197 | $ | 930,027 | $ | 1,021,870 | $ | 1,170,246 | |||||||||||||||||||||||||||||||||||||||||
Beginning fair value | $ | 85,479 | $ | 161,234 | $ | 165,707 | $ | 162,970 | $ | 165,064 | $ | 167,639 | Principal repayments | (53,461 | ) | (49,659 | ) | (46,810 | ) | (53,596 | ) | (54,212 | ) | (57,523 | ) | |||||||||||||||||||||||||||||
Sales | — | — | — | — | — | (1,170 | ) | Transfers to REO | (968 | ) | (3,154 | ) | (2,612 | ) | (3,825 | ) | (1,975 | ) | (1,742 | ) | ||||||||||||||||||||||||||||||||||
Effect of principal payments | (866 | ) | (1,828 | ) | (4,917 | ) | (13 | ) | — | (87 | ) | Transfers between portfolios | — | — | — | — | — | (91,621 | ) | |||||||||||||||||||||||||||||||||||
Transfers between portfolios (1) | (12,229 | ) | (75,058 | ) | (1,889 | ) | — | — | — | Changes in fair value, net | 8,414 | 4,473 | 9,201 | 7,591 | (35,656 | ) | 2,510 | |||||||||||||||||||||||||||||||||||||
Change in fair value, net | 1,346 | 1,131 | 2,333 | 2,750 | (2,094 | ) | (1,318 | ) | Ending fair value | $ | 745,621 | $ | 791,636 | $ | 839,976 | $ | 880,197 | $ | 930,027 | $ | 1,021,870 | |||||||||||||||||||||||||||||||||
Ending fair value | $ | 73,730 | $ | 85,479 | $ | 161,234 | $ | 165,707 | $ | 162,970 | $ | 165,064 | ||||||||||||||||||||||||||||||||||||||||||
Commercial Loans, held-for-sale | ||||||||||||||||||||||||||||||||||||||||||||||||||||||
Securities – Subordinate (2) | Beginning carrying value | $ | 2,700 | $ | 30,400 | $ | 237,538 | $ | — | $ | 39,141 | $ | 80,756 | |||||||||||||||||||||||||||||||||||||||||
Beginning fair value | $ | 759,347 | $ | 679,894 | $ | 621,638 | $ | 588,750 | $ | 534,590 | $ | 450,450 | Originations | — | — | — | — | 37,625 | 99,625 | |||||||||||||||||||||||||||||||||||
Acquisitions | 167,498 | 106,415 | 75,676 | 77,016 | 63,345 | 113,037 | Sales | — | (15,965 | ) | (203,634 | ) | — | (77,183 | ) | (140,668 | ) | |||||||||||||||||||||||||||||||||||||
Sales | (16,816 | ) | (11,809 | ) | (25,610 | ) | (42,631 | ) | (8,485 | ) | (15,806 | ) | Principal repayments | — | (12,502 | ) | (3,204 | ) | — | (16 | ) | (19 | ) | |||||||||||||||||||||||||||||||
Effect of principal payments | (7,798 | ) | (8,182 | ) | (7,985 | ) | (11,323 | ) | (5,404 | ) | (5,016 | ) | Transfers between portfolios | — | — | — | 237,538 | — | — | |||||||||||||||||||||||||||||||||||
Change in fair value, net | 13,880 | (6,971 | ) | 16,175 | 9,826 | 4,704 | (8,075 | ) | Changes in fair value, net | — | 767 | (300 | ) | — | 433 | (553 | ) | |||||||||||||||||||||||||||||||||||||
Ending fair value | $ | 916,111 | $ | 759,347 | $ | 679,894 | $ | 621,638 | $ | 588,750 | $ | 534,590 | Ending fair value | $ | 2,700 | $ | 2,700 | $ | 30,400 | $ | 237,538 | $ | — | $ | 39,141 | |||||||||||||||||||||||||||||
Securities – Mezzanine (2) | Commercial Loans, held-for-investment at amortized cost | |||||||||||||||||||||||||||||||||||||||||||||||||||||
Beginning fair value | $ | 419,941 | $ | 375,606 | $ | 375,636 | $ | 370,105 | $ | 360,764 | $ | 276,208 | Beginning carrying value | $ | — | $ | — | $ | 22,285 | $ | 298,712 | $ | 300,355 | $ | 321,823 | |||||||||||||||||||||||||||||
Acquisitions | 97,915 | 66,398 | 28,757 | 43,432 | 12,649 | 100,122 | Originations | — | — | — | — | — | — | |||||||||||||||||||||||||||||||||||||||||
Sales | (12,685 | ) | (8,798 | ) | (25,610 | ) | (36,207 | ) | (4,000 | ) | (8,899 | ) | Principal repayments | — | — | (23,144 | ) | (45,562 | ) | (1,543 | ) | (21,890 | ) | |||||||||||||||||||||||||||||||
Effect of principal payments | (4,321 | ) | (5,404 | ) | (5,406 | ) | (5,165 | ) | (3,530 | ) | (2,749 | ) | Transfers between portfolios | — | — | — | (237,538 | ) | — | — | ||||||||||||||||||||||||||||||||||
Change in fair value, net | 6,750 | (7,861 | ) | 2,229 | 3,471 | 4,222 | (3,918 | ) | Provision for loan losses | — | — | 859 | 6,532 | (289 | ) | 240 | ||||||||||||||||||||||||||||||||||||||
Ending fair value | $ | 507,600 | $ | 419,941 | $ | 375,606 | $ | 375,636 | $ | 370,105 | $ | 360,764 | Discount/fee amortization | — | — | — | 141 | 189 | 182 | |||||||||||||||||||||||||||||||||||
Ending carrying value (3) | $ | — | $ | — | $ | — | $ | 22,285 | $ | 298,712 | $ | 300,355 | ||||||||||||||||||||||||||||||||||||||||||
Mortgage Servicing Rights | ||||||||||||||||||||||||||||||||||||||||||||||||||||||
Beginning carrying value | $ | 118,526 | $ | 106,009 | $ | 110,046 | $ | 126,620 | $ | 191,976 | $ | 162,726 | ||||||||||||||||||||||||||||||||||||||||||
Additions | 7,485 | 2,421 | 3,443 | 10,691 | 8,807 | 21,305 | ||||||||||||||||||||||||||||||||||||||||||||||||
Sales | (11,928 | ) | (24,021 | ) | (8,860 | ) | — | (29,559 | ) | — | ||||||||||||||||||||||||||||||||||||||||||||
Changes in fair value, net | (3,070 | ) | 34,117 | 1,380 | (27,265 | ) | (44,604 | ) | 7,945 | |||||||||||||||||||||||||||||||||||||||||||||
Ending fair value | $ | 111,013 | $ | 118,526 | $ | 106,009 | $ | 110,046 | $ | 126,620 | $ | 191,976 | ||||||||||||||||||||||||||||||||||||||||||
(1) | In 2016 and 2017, certain Re-REMIC securities we held were exchanged for the underlying senior securities. |
(2) | Securities-subordinate, as presented above, includes mezzanine securities. Mezzanine securities have also been presented separately to provide additional detail on this portion of the subordinate securities portfolio. |
(3) | The carrying value of our commercial loans, held-for-investment at amortized cost excludes commercial A-notes, which are carried at fair value. |
THE REDWOOD REVIEW I 1ST QUARTER 2017 | Table 7: Securities and Loan Portfolio Activity 53 | |
| Table 8: Consolidating Balance Sheet ($ in thousands) | ||||||||||||||||||||||||
March 31, 2017 | December 31, 2016 | ||||||||||||||||||||||||
At Redwood (1) | Consolidated Sequoia Entities (1) | Redwood Consolidated | At Redwood (1) | Consolidated Sequoia Entities (1) | Redwood Consolidated | ||||||||||||||||||||
Residential loans | $ | 2,726,620 | $ | 745,621 | $ | 3,472,241 | $ | 3,096,415 | $ | 791,636 | $ | 3,888,051 | |||||||||||||
Real estate securities | 1,165,940 | — | 1,165,940 | 1,018,439 | — | 1,018,439 | |||||||||||||||||||
Mortgage servicing rights | 111,013 | — | 111,013 | 118,526 | — | 118,526 | |||||||||||||||||||
Cash and cash equivalents | 221,781 | — | 221,781 | 212,844 | — | 212,844 | |||||||||||||||||||
Total earning assets | 4,225,354 | 745,621 | 4,970,975 | 4,446,224 | 791,636 | 5,237,860 | |||||||||||||||||||
Other assets (2) | 238,243 | 5,073 | 243,316 | 238,936 | 6,681 | 245,617 | |||||||||||||||||||
Total assets | $ | 4,463,597 | $ | 750,694 | $ | 5,214,291 | $ | 4,685,160 | $ | 798,317 | $ | 5,483,477 | |||||||||||||
Short-term debt | $ | 563,773 | $ | — | $ | 563,773 | $ | 791,539 | $ | — | $ | 791,539 | |||||||||||||
Other liabilities | 134,330 | 532 | 134,862 | 147,847 | 518 | 148,365 | |||||||||||||||||||
ABS issued, net | — | 728,391 | 728,391 | — | 773,462 | 773,462 | |||||||||||||||||||
Long-term debt, net | 2,621,494 | — | 2,621,494 | 2,620,683 | — | 2,620,683 | |||||||||||||||||||
Total liabilities | 3,319,597 | 728,923 | 4,048,520 | 3,560,069 | 773,980 | 4,334,049 | |||||||||||||||||||
Equity | 1,144,000 | 21,771 | 1,165,771 | 1,125,091 | 24,337 | 1,149,428 | |||||||||||||||||||
Total liabilities and equity | $ | 4,463,597 | $ | 750,694 | $ | 5,214,291 | $ | 4,685,160 | $ | 798,317 | $ | 5,483,477 | |||||||||||||
(1) | The format of this consolidating balance sheet is provided to more clearly delineate between the assets belonging to consolidated Sequoia securitization entities that we are required to consolidate on our balance sheet in accordance with GAAP, but which are not legally ours, and the liabilities of these consolidated entities, which are payable only from the cash flows generated by their assets and are, therefore, nonrecourse to us, and the assets that are legally ours and the liabilities of ours for which there is recourse to us. |
(2) | At March 31, 2017 and December 31, 2016, other assets at Redwood included a total of $43 million and $45 million of assets, respectively, held by third-party custodians and pledged as collateral to the GSEs in connection with credit risk-sharing arrangements relating to conforming residential loans. These pledged assets can only be used to settle obligations to the GSEs under these risk-sharing arrangements. |
THE REDWOOD REVIEW I 1ST QUARTER 2017 | Table 8: Consolidating Balance Sheet 54 | |