
T A B L E O F C O N T E N T S |
Introduction | |
Shareholder Letter | |
Quarterly Overview | |
Ñ Second Quarter Highlights | |
Ñ GAAP Net Income and Reconciliation to Non-GAAP Core Earnings | |
Ñ Analysis of Earnings | |
Ñ GAAP Book Value | |
Ñ Capital Allocation Summary | |
Ñ 2017 Financial Outlook | |
Ñ Legacy RMBS Litigation | |
Financial Insights | |
Ñ GAAP Results by Business Segment | |
Analysis of Balance Sheet and Capital Allocations | |
Ñ Balance Sheet Analysis | |
Ñ Analysis of Capital Allocation | |
Appendix | |
Ñ Redwood’s Business Overview | |
Ñ Dividend Policy | |
Ñ Core Earnings Definition | |
Ñ Glossary | |
Ñ Financial Tables | |
THE REDWOOD REVIEW I 2ND QUARTER 2017 |
1 |
C A U T I O N A R Y S T A T E M E N T |
THE REDWOOD REVIEW I 2ND QUARTER 2017 |
2 |
C A U T I O N A R Y S T A T E M E N T |
• | the pace at which we redeploy our available capital into new investments; |
• | interest rate volatility, changes in credit spreads, and changes in liquidity in the market for real estate securities and loans; |
• | changes in the demand from investors for residential mortgages and investments, and our ability to distribute residential mortgages through our whole-loan distribution channel; |
• | our ability to finance our investments in securities and our acquisition of residential mortgages with short-term debt; |
• | changes in the values of assets we own; |
• | general economic trends, the performance of the housing, real estate, mortgage, credit, and broader financial markets, and their effects on the prices of earning assets and the credit status of borrowers; |
• | federal and state legislative and regulatory developments, and the actions of governmental authorities, including the new U.S. presidential administration, and in particular those affecting the mortgage industry or our business (including, but not limited to, the Federal Housing Finance Agency’s rules relating to FHLB membership requirements and the implications for our captive insurance subsidiary’s membership in the FHLB); |
• | strategic business and capital deployment decisions we make; |
• | developments related to the fixed income and mortgage finance markets and the Federal Reserve’s statements regarding its future open market activity and monetary policy; |
• | our exposure to credit risk and the timing of credit losses within our portfolio; |
• | the concentration of the credit risks we are exposed to, including due to the structure of assets we hold and the geographical concentration of real estate underlying assets we own; |
• | our exposure to adjustable-rate mortgage loans; |
• | the efficacy and expense of our efforts to manage or hedge credit risk, interest rate risk, and other financial and operational risks; |
• | changes in credit ratings on assets we own and changes in the rating agencies’ credit rating methodologies; |
• | changes in interest rates; |
• | changes in mortgage prepayment rates; |
• | changes in liquidity in the market for real estate securities and loans; |
• | our ability to finance the acquisition of real estate-related assets with short-term debt; |
THE REDWOOD REVIEW I 2ND QUARTER 2017 |
3 |
C A U T I O N A R Y S T A T E M E N T |
• | the ability of counterparties to satisfy their obligations to us; |
• | our involvement in securitization transactions, the profitability of those transactions, and the risks we are exposed to in engaging in securitization transactions; |
• | exposure to claims and litigation, including litigation arising from our involvement in securitization transactions; |
• | ongoing litigation against various trustees of RMBS transactions; |
• | whether we have sufficient liquid assets to meet short-term needs; |
• | our ability to successfully compete and retain or attract key personnel; |
• | our ability to adapt our business model and strategies to changing circumstances; |
• | changes in our investment, financing, and hedging strategies and new risks we may be exposed to if we expand our business activities; |
• | our exposure to a disruption or breach of the security of our technology infrastructure and systems; |
• | exposure to environmental liabilities; |
• | our failure to comply with applicable laws and regulations; |
• | our failure to maintain appropriate internal controls over financial reporting and disclosure controls and procedures; |
• | the impact on our reputation that could result from our actions or omissions or from those of others; changes in accounting principles and tax rules; |
• | our ability to maintain our status as a REIT for tax purposes; |
• | limitations imposed on our business due to our REIT status and our status as exempt from registration under the Investment Company Act of 1940; |
• | decisions about raising, managing, and distributing capital; and |
• | other factors not presently identified. |
THE REDWOOD REVIEW I 2ND QUARTER 2017 |
4 |
I N T R O D U C T I O N |
Selected Financial Highlights | |||||||||||
Quarter:Year | GAAP Income per Share | REIT Taxable Income per Share (1) | Annualized GAAP Return on Equity | GAAP Book Value per Share | Dividends per Share | ||||||
Q217 | $0.43 | $0.25 | 12% | $15.29 | $0.28 | ||||||
Q117 | $0.43 | $0.22 | 13% | $15.13 | $0.28 | ||||||
Q416 | $0.31 | $0.34 | 9% | $14.96 | $0.28 | ||||||
Q316 | $0.58 | $0.34 | 19% | $14.74 | $0.28 | ||||||
Q216 | $0.48 | $0.36 | 15% | $14.20 | $0.28 | ||||||
Q116 | $0.15 | $0.23 | 4% | $14.17 | $0.28 | ||||||
Q415 | $0.46 | $0.37 | 14% | $14.67 | $0.28 | ||||||
Q315 | $0.22 | $0.29 | 6% | $14.69 | $0.28 | ||||||
Q215 | $0.31 | $0.21 | 9% | $14.96 | $0.28 | ||||||
(1) | REIT taxable income per share for 2016 and 2017 are estimates until we file our tax returns. |
THE REDWOOD REVIEW I 2ND QUARTER 2017 |
5 |
S H A R E H O L D E R L E T T E R |
THE REDWOOD REVIEW I 2ND QUARTER 2017 |
6 |
S H A R E H O L D E R L E T T E R |
THE REDWOOD REVIEW I 2ND QUARTER 2017 |
7 |
S H A R E H O L D E R L E T T E R |
THE REDWOOD REVIEW I 2ND QUARTER 2017 |
8 |
S H A R E H O L D E R L E T T E R |
 |  | |
Marty Hughes | Christopher J. Abate | |
Chief Executive Officer | President and Chief Financial Officer | |
THE REDWOOD REVIEW I 2ND QUARTER 2017 |
9 |
Q U A R T E R L Y O V E R V I E W |
Ñ | Our GAAP earnings were $0.43 per share for the second quarter of 2017, consistent with $0.43 per share for the first quarter of 2017. GAAP earnings during the second quarter benefited from higher net interest income due to capital deployment and positive fair value adjustments on securities in our investment portfolio due to continued spread tightening. |
Ñ | Our non-GAAP core earnings were $0.35 per share for the second quarter of 2017, as compared with $0.36 per share for the first quarter of 2017, reflecting fewer realized gains from the sale of securities and lower mortgage banking margins relative to the first quarter. For details on GAAP and core earnings, please see the GAAP Net Income and Reconciliation to Non-GAAP Core Earnings section that follows on page 11. |
Ñ | Our GAAP book value was $15.29 per share at June 30, 2017, as compared with $15.13 per share at March 31, 2017. This increase was primarily driven by our quarterly earnings exceeding our dividend. |
Ñ | We deployed $78 million of capital in the second quarter of 2017 toward new investments, including $36 million in Sequoia and third-party RMBS, $35 million in Agency residential CRT securities, and $7 million in Agency multifamily securities. Additionally, we repurchased $37 million of our convertible debt during the second quarter. |
Ñ | We sold $72 million of securities and $41 million of MSRs, representing substantially all of our remaining conforming MSRs, during the second quarter of 2017, freeing up $79 million of capital for reinvestment after the repayment of associated debt. |
Ñ | We purchased $1.2 billion of residential jumbo loans during the second quarter of 2017. At June 30, 2017, our pipeline of jumbo residential loans identified for purchase was $1.3 billion. |
Ñ | Residential loan sales totaled $0.7 billion during the second quarter of 2017 and included $0.3 billion of whole loan sales to third parties and $0.4 billion of loans that were securitized. |
Ñ | For an updated discussion of our key business drivers in 2017, please see the 2017 Financial Outlook section of this Redwood Review. |
THE REDWOOD REVIEW I 2ND QUARTER 2017 |
10 |
Q U A R T E R L Y O V E R V I E W |
GAAP Net Income and Reconciliation to Non-GAAP Core Earnings | ||||||||
($ in millions, except per share data) | ||||||||
Three Months Ended | ||||||||
6/30/2017 | 3/31/2017 | |||||||
Interest income | $ | 59 | $ | 55 | ||||
Interest expense | (24 | ) | (21 | ) | ||||
Net interest income | 35 | 34 | ||||||
Non-interest income | ||||||||
Mortgage banking activities, net | 12 | 18 | ||||||
MSR income, net | 3 | 2 | ||||||
Investment fair value changes, net | 8 | 2 | ||||||
Other income | 1 | 1 | ||||||
Realized gains, net | 1 | 6 | ||||||
Total non-interest income, net | 25 | 28 | ||||||
Operating expenses | (19 | ) | (18 | ) | ||||
Provision for income taxes | (5 | ) | (6 | ) | ||||
GAAP net income | $ | 36 | $ | 37 | ||||
Core earnings adjustments | ||||||||
Eliminate mark-to-market changes on long-term investments (1) | (28 | ) | (10 | ) | ||||
Eliminate mark-to-market changes on derivatives associated with long-term investments (1) | 14 | 1 | ||||||
Include cumulative gain (loss) on long-term investments sold, net (2) | 4 | — | ||||||
Income tax adjustments associated with core earnings adjustments (3) | 2 | 1 | ||||||
Non-GAAP core earnings | $ | 29 | $ | 30 | ||||
GAAP net income per diluted common share | $ | 0.43 | $ | 0.43 | ||||
Non-GAAP core earnings per diluted common share (4) | $ | 0.35 | $ | 0.36 | ||||
(1) | Adjustments eliminate the mark-to-market changes on the fair value of loans held-for-investment, trading securities, other investments, and associated derivatives that are primarily related to changes in benchmark interest rates and credit spreads. Details on the components of investment fair value changes, net, are included in the Financial Insights section of this Redwood Review. |
(2) | Adjustment includes the cumulative net gains or losses on long-term investments accounted for as trading securities under GAAP that were sold during the period presented, net of any gains or losses from derivatives associated with the investments sold. Cumulative gains and losses are calculated by multiplying the difference between the sales price and original purchase price by the face value of the securities sold. |
(3) | We apply estimated effective tax rates to core earnings adjustments occurring within Redwood's taxable REIT subsidiaries to estimate the hypothetical income tax expense or benefit associated with those adjustments. |
(4) | Consistent with the calculation of net income per diluted common share for GAAP purposes, non-GAAP core earnings per diluted common share is calculated following the "two-class" method. Additional information on the calculation of core earnings using the "two-class" method can be found in Table 2 in the Financial Tables section of the Appendix to this Redwood Review. |
THE REDWOOD REVIEW I 2ND QUARTER 2017 |
11 |
Q U A R T E R L Y O V E R V I E W |
Ñ | To calculate core earnings, the adjustments we make to GAAP earnings include eliminating mark-to-market changes on the fair value of our long-term investments (and associated derivatives) that are primarily related to changes in benchmark interest rates and spreads. These adjustments reduced investment fair value changes, net, by $14 million to an expense of $6 million for the second quarter of 2017, as compared with an expense of $7 million for the first quarter of 2017. Additionally, core earnings includes the cumulative net gains or losses on long-term investments sold. This adjustment increased realized gains, net by $4 million to gains of $5 million for the second quarter of 2017, as compared with gains of $6 million for the first quarter of 2017. |
Ñ | Net interest income increased to $35 million for the second quarter, as compared with $34 million for the first quarter of 2017, primarily as a result of capital deployment during the first half of 2017. |
Ñ | Mortgage banking activities, net, decreased to $12 million for the second quarter, from $18 million for the first quarter of 2017. Loan purchase volume increased from the first quarter, offset by gross margins which were lower relative to the first quarter but remained above our long-term expectations of 75 to 100 basis points. |
Ñ | MSR income, net, was $3 million for the second quarter, as compared with $2 million for the first quarter of 2017, and benefited from low interest rate volatility during the second quarter. |
Ñ | We realized gains of $1 million during the second quarter, which included $2 million of gains from the sale of $19 million of available-for-sale securities and a $1 million loss from the repurchase of $37 million of convertible debt, as compared with realized gains of $6 million during the first quarter of 2017, which was primarily related to the sale of $19 million of available-for-sale securities. |
Ñ | Operating expenses were $19 million for the second quarter, as compared with $18 million for the first quarter. Second quarter operating expenses were similar to the first quarter, and included variable compensation commensurate with our year-to-date results. |
Ñ | We recorded a tax provision of $5 million during the second quarter, as compared with $6 million for the first quarter of 2017. This decrease was primarily due to lower mortgage banking income relative to the first quarter. A reconciliation of GAAP and taxable income is set forth in Table 4 in the Financial Tables section of the Appendix to this Redwood Review. |
Ñ | Additional details on our earnings are included in the GAAP Results by Business Segment portion of the Financial Insights section that follows. |
THE REDWOOD REVIEW I 2ND QUARTER 2017 |
12 |
Q U A R T E R L Y O V E R V I E W |
Changes in GAAP Book Value per Share | ||||||||
($ in per share) | ||||||||
Three Months Ended | ||||||||
6/30/2017 | 3/31/2017 | |||||||
Beginning book value per share | $ | 15.13 | $ | 14.96 | ||||
Earnings | 0.43 | 0.43 | ||||||
Changes in unrealized gains on securities, net from: | ||||||||
Realized gains recognized in earnings | (0.02 | ) | (0.04 | ) | ||||
Amortization income recognized in earnings | (0.05 | ) | (0.05 | ) | ||||
Mark-to-market adjustments, net | 0.09 | 0.11 | ||||||
Total change in unrealized gains on securities, net | 0.02 | 0.02 | ||||||
Dividends | (0.28 | ) | (0.28 | ) | ||||
Equity compensation, net | — | (0.01 | ) | |||||
Changes in unrealized losses on derivatives hedging long-term debt | (0.03 | ) | 0.02 | |||||
Other, net | 0.02 | (0.01 | ) | |||||
Ending book value per share | $ | 15.29 | $ | 15.13 | ||||
Ñ | Our GAAP book value per share increased $0.16 per share to $15.29 per share during the second quarter of 2017. This increase was primarily driven by our quarterly earnings exceeding our dividend. |
Ñ | Unrealized gains on our available-for-sale securities increased $0.02 per share during the second quarter of 2017, primarily as a result of a positive $0.09 per share mark-to-market adjustment on our available-for-sale securities due to spread tightening during the quarter. This increase was partially offset by $0.05 per share of discount amortization income recognized in earnings from the appreciation in the amortized cost basis of our available-for-sale securities, and $0.02 per share of previously unrealized net gains that were realized as income from the sale of securities. |
Ñ | Lower benchmark interest rates during the second quarter of 2017 resulted in a $0.03 per share decrease to book value due to an increase in unrealized losses on the derivatives hedging a portion of our long-term debt. At June 30, 2017, the cumulative unrealized loss on these derivatives, which is included in GAAP book value per share, was $0.58 per share. |
THE REDWOOD REVIEW I 2ND QUARTER 2017 |
13 |
Q U A R T E R L Y O V E R V I E W |
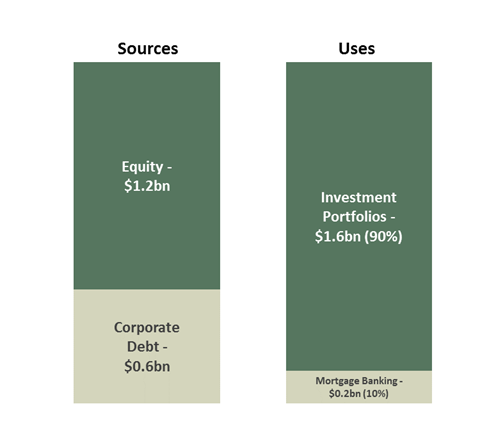
Ñ | Our total capital of $1.8 billion at June 30, 2017 included $1.2 billion of equity capital and $0.6 billion of the total debt on our consolidated balance sheet. This portion of debt includes $250 million of convertible debt due in 2018, $201 million of exchangeable debt due in 2019, and $140 million of trust-preferred securities due in 2037. This portion of debt has a weighted average cost of approximately 6.0% per annum. |
Ñ | Also included in our capital allocation is cash and liquidity capital, which represents a combination of capital available for investment and risk capital held for liquidity management purposes. At June 30, 2017, we estimate that our capital available for investments was approximately $180 million. During the second half of 2017, we expect to free up additional capital for redeployment through the continued optimization of our investment portfolio, selling existing investments as higher-yielding opportunities arise. |
Ñ | We also utilize various forms of short-term and long-term collateralized debt to finance certain investments and to warehouse our inventory of certain residential loans held-for-sale. We do not consider this collateralized debt as "capital" and, therefore, exclude it from our capital allocation analysis. |
Ñ | Further details on our capital allocation are included in the Analysis of Capital Allocation section that follows. |
THE REDWOOD REVIEW I 2ND QUARTER 2017 |
14 |
Q U A R T E R L Y O V E R V I E W |
Allocation of Capital and Return Profile | ||||||||||||||||||
By Investment Type | ||||||||||||||||||
June 30, 2017 | ||||||||||||||||||
($ in millions) | ||||||||||||||||||
Fair Value | Collateralized Debt | Allocated Capital | % of Total Capital | YTD 2017 Annualized Return (1) | 2017 Return Target (1) | |||||||||||||
Investment portfolio | ||||||||||||||||||
Residential loans/FHLB stock | $ | 2,404 | $ | (2,000 | ) | $ | 404 | 23% | 13% | 12%-16% | ||||||||
Residential securities | 1,048 | (349 | ) | 699 | 39% | 16% | 10%-12% | |||||||||||
Multifamily securities (2) | 170 | (121 | ) | 50 | 3% | 25% | 8%-10% | |||||||||||
Mortgage servicing rights | 64 | — | 64 | 4% | 5% | 7%-9% | ||||||||||||
Other assets/(other liabilities) | 124 | (59 | ) | 65 | 4% | —% | N/A | |||||||||||
Cash and liquidity capital | 315 | 17% | —% | N/A | ||||||||||||||
Total investments | $ | 3,810 | $ | (2,529 | ) | $ | 1,596 | 90% | 15% | 9%-11% | ||||||||
Residential mortgage banking | $ | 170 | 10% | 22% | 10%-20% | |||||||||||||
Total | $ | 1,766 | 100% | |||||||||||||||
(1) | Includes net interest income, change in fair value of the investments and their associated hedges that flow through GAAP earnings, realized gains, direct operating expenses, taxes, and other income. Excludes unrealized gains and losses on our AFS securities portfolio, and corporate operating expenses. Returns are calculated based on average capital allocated during the year. |
(2) | Multifamily securities include $20 million of investment grade CMBS. |
Ñ | Our residential loans/FHLB stock investment generated an annualized return of 13% on average capital in the first half of 2017. These returns included $37 million of net interest income, and an expense of $12 million related to the change in valuation of these loans and associated derivatives. We expect returns in the second half of 2017 to be within our 2017 return target range of 12%-16% for this portfolio. |
Ñ | Our residential securities portfolio generated an annualized return of 16% on average capital in the first half of 2017. These returns included $35 million of net interest income, income of $13 million from the net positive change in valuation of these securities and associated derivatives, and $8 million of realized gains from securities sales. We expect returns in the second half of 2017 to be within our 2017 return target of 10%-12%, as we expect the benefit from spread tightening in the first half of the year to diminish in the second half of 2017. |
THE REDWOOD REVIEW I 2ND QUARTER 2017 |
15 |
Q U A R T E R L Y O V E R V I E W |
Ñ | Our multifamily securities generated an annualized return of 25% on average capital in the first half of 2017. This included $3 million of net interest income and income of $12 million from the net positive change in valuation of these securities and associated derivatives. We expect returns in the second half of 2017 to be within our 2017 return target of 8%-10%, as we expect the benefit from spread tightening in the first half of the year to diminish in the second half of 2017. |
Ñ | Our MSR portfolio generated an annualized return of 5% on average capital in the first half of 2017. We sold substantially all of our remaining conforming MSRs in the second quarter of 2017 and plan to redeploy the proceeds towards higher-yielding, REIT-eligible investments. |
Ñ | Our residential mortgage banking operations generated an annualized return of 22% on average capital in the first half of 2017. Results in the first half of the year benefited from spread tightening on securitization execution. For the remainder of 2017, we expect margins to be more in line with our long-term expectations of 75-100 basis points per loan. Additionally, we continue to expect to purchase $5 billion to $6 billion of loans for the full-year 2017, with higher-yielding Redwood Choice loans comprising 15%-20% of our overall purchase volume. |
Ñ | Our tax provision was $11 million in the first half of 2017, and is included in the year-to-date returns noted above. Our tax provision is primarily driven by our mortgage banking and mortgage servicing activities, which are performed at our taxable REIT subsidiaries. Our estimated effective tax rate on mortgage banking income is between 25% and 30%. For the remainder of 2017, our tax provision will primarily be correlated to our mortgage banking results. |
THE REDWOOD REVIEW I 2ND QUARTER 2017 |
16 |
Q U A R T E R L Y O V E R V I E W |
THE REDWOOD REVIEW I 2ND QUARTER 2017 |
17 |
Q U A R T E R L Y O V E R V I E W |
THE REDWOOD REVIEW I 2ND QUARTER 2017 |
18 |
Q U A R T E R L Y O V E R V I E W |
• | Asset Quality: The credit quality of mortgage loans in new Sequoia RMBS transactions is strong, with full documentation underwriting, high FICO credit scores and low LTVs. By comparison, the 20 legacy RMBS transactions impacted by the trustee holdback include stated income and stated document mortgage loans, as well as subprime mortgage loans. |
• | Upfront Due Diligence and Disclosure of Results: Most loans in new Sequoia RMBS transactions have been the subject of due diligence by a third-party due diligence firm, whereas the process for issuing many legacy RMBS transactions did not include extensive third-party due diligence. In addition, in new Sequoia RMBS transactions, material results of the third-party due diligence are disclosed to investors. This level of due diligence and disclosure makes it unlikely that similar litigation would arise, or if it did, that litigation expenses, such as due diligence expenses of the type contemplated by the trustee, would be necessary. |
• | Clarity in Representation and Warranty Mechanisms: One of the key issues in the trustee litigation centers on when the trustee was obligated to investigate and/or pursue representation and warranties claims against mortgage loan originators for the benefit of RMBS investors. In contrast, new Sequoia RMBS transactions have established procedures to clearly delineate roles and responsibilities for reviewing mortgage loans for representation and warranty breaches, including: an independent firm to review all loans that become 120-days delinquent and mandatory arbitration with loan originators to resolve disputes over representation and warranties findings. |
THE REDWOOD REVIEW I 2ND QUARTER 2017 |
19 |
F I N A N C I A L I N S I G H T S |
Segment Results Summary (1) | ||||||||
($ in millions) | ||||||||
Three Months Ended | ||||||||
6/30/2017 | 3/31/2017 | |||||||
Segment contribution from: | ||||||||
Investment portfolio | $ | 50 | $ | 46 | ||||
Residential mortgage banking | 7 | 12 | ||||||
Corporate/Other | (21 | ) | (20 | ) | ||||
Net income | $ | 36 | $ | 37 | ||||
(1) | See Table 3 in the Financial Tables section of the Appendix to this Redwood Review for a more comprehensive presentation of our segment results. |
THE REDWOOD REVIEW I 2ND QUARTER 2017 |
20 |
F I N A N C I A L I N S I G H T S |
Segment Results - Investment Portfolio | ||||||||
($ in millions) | ||||||||
Three Months Ended | ||||||||
6/30/2017 | 3/31/2017 | |||||||
Net interest income | ||||||||
Residential securities | $ | 18 | $ | 17 | ||||
Residential loans | 18 | 18 | ||||||
Multifamily and commercial investments | 2 | 1 | ||||||
Total net interest income | 39 | 37 | ||||||
Non-interest income | ||||||||
MSR income, net | 3 | 2 | ||||||
Investment fair value changes, net | 9 | 3 | ||||||
Other income | 1 | 1 | ||||||
Realized gains, net | 2 | 6 | ||||||
Total non-interest income, net | 15 | 12 | ||||||
Direct operating expenses | (1 | ) | (2 | ) | ||||
Provision for income taxes | (2 | ) | (2 | ) | ||||
Segment contribution | $ | 50 | $ | 46 | ||||
Ñ | The contribution from this segment increased from the first quarter of 2017, primarily due to positive valuation changes on our securities portfolio, which benefited from further spread tightening during the second quarter. As a result of these mark-to-market increases, investment fair value changes, net, was positive $9 million for the second quarter of 2017, as compared with positive $3 million for the first quarter of 2017. |
Ñ | Net interest income increased from the first quarter of 2017, primarily due to capital deployment during the first half of 2017. |
THE REDWOOD REVIEW I 2ND QUARTER 2017 |
21 |
F I N A N C I A L I N S I G H T S |
Components of Investment Portfolio Fair Value Changes, Net by Investment Type | ||||||||
($ in millions) | ||||||||
Three Months Ended | ||||||||
6/30/2017 | 3/31/2017 | |||||||
Market valuation changes on: | ||||||||
Residential loans held-for-investment | ||||||||
Change in fair value from the reduction of principal (1) | $ | (1 | ) | $ | (2 | ) | ||
Change in fair value from changes in interest rates (2) | 9 | (1 | ) | |||||
Total change in fair value of residential loans held-for-investment | 8 | (2 | ) | |||||
Real estate securities | ||||||||
Change in fair value from the reduction of principal (1) | (1 | ) | (2 | ) | ||||
Change in fair value from changes in interest rates (2) | 20 | 13 | ||||||
Total change in fair value of real estate securities | 19 | 11 | ||||||
Risk management derivatives | ||||||||
Interest component of derivative expense | (4 | ) | (4 | ) | ||||
Change in fair value of derivatives from changes in interest rates (3) | (14 | ) | (1 | ) | ||||
Total change in fair value of risk management derivatives | (18 | ) | (5 | ) | ||||
Total investment portfolio fair value changes, net | $ | 9 | $ | 3 | ||||
(1) | Reflects the change in fair value due to principal changes, which is calculated as the change in principal on a given investment during the period, multiplied by the prior quarter ending price or acquisition price for that investment in percentage terms. |
(2) | Reflects changes in prepayment assumptions and credit spreads on our residential loans, trading securities and conforming risk-sharing investments primarily due to changes in benchmark interest rates. This item is excluded from management's definition of core earnings. |
(3) | Reflects the change in fair value of our risk management derivatives that are associated with changes in benchmark interest rates during the period. This item is excluded from management's definition of core earnings. |
THE REDWOOD REVIEW I 2ND QUARTER 2017 |
22 |
F I N A N C I A L I N S I G H T S |
Components of MSR Income, Net | ||||||||
($ in millions) | ||||||||
Three Months Ended | ||||||||
6/30/2017 | 3/31/2017 | |||||||
Net servicing fee income | $ | 6 | $ | 6 | ||||
Change in fair value of MSRs from the receipt of expected cashflows | (3 | ) | (2 | ) | ||||
MSR income before effect of changes in interest rates | 3 | 3 | ||||||
Net effect to valuations from changes in assumptions and interest rates | ||||||||
Change in fair value of MSRs from changes in MSR assumptions (1) | (3 | ) | (1 | ) | ||||
Change in fair value of associated derivatives | 3 | (1 | ) | |||||
Total net effect of changes in assumptions and interest rates | — | (1 | ) | |||||
MSR income, net | $ | 3 | $ | 2 | ||||
(1) | Primarily reflects changes in prepayment assumptions on our MSRs due to changes in benchmark interest rates. |
THE REDWOOD REVIEW I 2ND QUARTER 2017 |
23 |
F I N A N C I A L I N S I G H T S |
Segment Contribution of Investment Portfolio by Type | ||||||||||||||||||||
For the Three Months Ended June 30, 2017 | ||||||||||||||||||||
($ in millions) | ||||||||||||||||||||
Residential Loans | Residential Securities | Multifamily Securities | MSRs | Total | ||||||||||||||||
Total net interest income | $ | 18 | $ | 18 | $ | 2 | $ | — | $ | 39 | ||||||||||
Non-interest income | ||||||||||||||||||||
MSR income, net | — | — | — | 3 | 3 | |||||||||||||||
Investment fair value changes, net | (6 | ) | 9 | 6 | — | 9 | ||||||||||||||
Other income | — | 1 | — | — | 1 | |||||||||||||||
Realized gains, net | — | 2 | — | — | 2 | |||||||||||||||
Total non-interest income, net | (6 | ) | 12 | 6 | 3 | 15 | ||||||||||||||
Direct operating expenses | — | (1 | ) | — | — | (1 | ) | |||||||||||||
Provision for income taxes | — | (2 | ) | — | — | (2 | ) | |||||||||||||
Segment contribution | $ | 12 | $ | 28 | $ | 8 | $ | 2 | $ | 50 | ||||||||||
Core Earnings adjustments (1) | ||||||||||||||||||||
Eliminate mark-to-market changes on long-term investments and associated derivatives | 2 | (11 | ) | (6 | ) | — | (15 | ) | ||||||||||||
Include cumulative gain (loss) on long-term investments sold, net | — | 2 | 2 | — | 4 | |||||||||||||||
Income taxes associated with core earnings adjustments | — | 2 | — | — | 2 | |||||||||||||||
Total core earnings adjustments | 2 | (7 | ) | (4 | ) | — | (9 | ) | ||||||||||||
Non-GAAP core segment contribution (1) | $ | 14 | $ | 21 | $ | 4 | $ | 2 | $ | 41 | ||||||||||
(1) | Consistent with management's definition of core earnings set forth on page 36, non-GAAP core segment contribution reflects GAAP segment contribution adjusted to reflect the portion of core earnings adjustments allocable to this segment. |
Ñ | At June 30, 2017, we had $3.8 billion of investments in our Investment Portfolio segment, including $2.4 billion of residential loans held-for-investment, $1.2 billion of residential and multifamily securities, $64 million of MSR investments, and $167 million of cash and other assets. |
THE REDWOOD REVIEW I 2ND QUARTER 2017 |
24 |
F I N A N C I A L I N S I G H T S |
Segment Results - Residential Mortgage Banking | ||||||||
($ in millions) | ||||||||
Three Months Ended | ||||||||
6/30/2017 | 3/31/2017 | |||||||
Net interest income | $ | 4 | $ | 5 | ||||
Non-interest income | ||||||||
Mortgage banking activities, net | 12 | 18 | ||||||
Total non-interest income | 12 | 18 | ||||||
Direct operating expenses | (6 | ) | (6 | ) | ||||
Provision for income taxes | (3 | ) | (4 | ) | ||||
Segment contribution | $ | 7 | $ | 12 | ||||
Ñ | The contribution from our Residential Mortgage Banking segment declined from the first quarter of 2017, as higher purchase volume was offset by lower gross margins during the second quarter. |
Ñ | Gross margins for this segment, which we define as net interest income plus mortgage banking activities, net, divided by loan purchase commitments (LPCs), remained above our long-term expectations of 75 to 100 basis points during the second quarter, but were lower relative to the first quarter of 2017. This decrease reflected increased competition to acquire loans due to improved execution on securitization and whole loan sales during the second quarter. |
Ñ | LPCs, adjusted for fallout expectations, were $1.4 billion for the second quarter of 2017, as compared with $1.1 billion for the first quarter of 2017. |
Ñ | Residential loan sales totaled $0.7 billion during the second quarter and included $0.3 billion of whole loan sales to third parties and $0.4 billion of loans that were securitized. |
Ñ | At June 30, 2017, we had 415 loan sellers, which included 185 jumbo sellers and 230 MPF Direct sellers from various FHLB districts. |
THE REDWOOD REVIEW I 2ND QUARTER 2017 |
25 |
A N A L Y S I S O F B A L A N C E S H E E T A N D C A P I T A L A L L O C A T I O N S |
Consolidated Balance Sheets (1) | ||||||||
($ in millions) | ||||||||
6/30/2017 | 3/31/2017 | |||||||
Residential loans | $ | 3,905 | $ | 3,472 | ||||
Real estate securities | 1,219 | 1,166 | ||||||
Mortgage servicing rights | 64 | 111 | ||||||
Cash and cash equivalents | 217 | 222 | ||||||
Total earning assets | 5,405 | 4,971 | ||||||
Other assets | 250 | 243 | ||||||
Total assets | $ | 5,655 | $ | 5,214 | ||||
Short-term debt | ||||||||
Mortgage loan warehouse debt | $ | 575 | $ | 241 | ||||
Security repurchase facilities | 469 | 323 | ||||||
Convertible notes, net (2) | 250 | — | ||||||
Other liabilities | 152 | 135 | ||||||
Asset-backed securities issued | 693 | 728 | ||||||
Long-term debt, net | 2,336 | 2,621 | ||||||
Total liabilities | 4,476 | 4,049 | ||||||
Stockholders’ equity | 1,179 | 1,166 | ||||||
Total liabilities and equity | $ | 5,655 | $ | 5,214 | ||||
(1) | Our consolidated balance sheets include assets of consolidated variable interest entities (“VIEs”) that can only be used to settle obligations of these VIEs and liabilities of consolidated VIEs for which creditors do not have recourse to the primary beneficiary (Redwood Trust, Inc.). At June 30, 2017 and March 31, 2017, assets of consolidated VIEs totaled $713 million and $751 million, respectively, and liabilities of consolidated VIEs totaled $693 million and $729 million, respectively. See Table 7 in the Financial Tables section of the Appendix to this Redwood Review for additional detail on consolidated VIEs. |
(2) | During the second quarter of 2017, our convertible notes were reclassified from Long-term debt, net to Short-term debt as the maturity of the notes was less than one year as of April 2017. |
THE REDWOOD REVIEW I 2ND QUARTER 2017 |
26 |
A N A L Y S I S O F B A L A N C E S H E E T A N D C A P I T A L A L L O C A T I O N S |
Operating Segment Assets and Liabilities | |||||||||||||||||
June 30, 2017 | |||||||||||||||||
($ in millions) | |||||||||||||||||
Operating Segments | |||||||||||||||||
Investment Portfolio | Residential Mortgage Banking | Corporate/Other | Redwood Consolidated | ||||||||||||||
Residential loans | $ | 2,360 | $ | 837 | $ | 708 | $ | 3,905 | |||||||||
Residential securities | 1,048 | — | — | 1,048 | |||||||||||||
Multifamily securities | 170 | — | — | 170 | |||||||||||||
Mortgage servicing rights | 64 | — | — | 64 | |||||||||||||
Cash and cash equivalents | 37 | — | 180 | 217 | |||||||||||||
Total earning assets | 3,679 | 837 | 888 | 5,404 | |||||||||||||
Other assets | 130 | 22 | 98 | 251 | |||||||||||||
Total assets | $ | 3,810 | $ | 859 | $ | 986 | $ | 5,655 | |||||||||
Short-term debt | |||||||||||||||||
Mortgage loan warehouse debt | $ | — | $ | 575 | $ | — | $ | 575 | |||||||||
Security repurchase facilities | 469 | — | — | 469 | |||||||||||||
Convertible notes, net | — | — | 250 | 250 | |||||||||||||
Other liabilities | 59 | 13 | 80 | 152 | |||||||||||||
ABS issued, net | — | — | 693 | 693 | |||||||||||||
Long-term debt, net | 2,000 | — | 336 | 2,336 | |||||||||||||
Total liabilities | $ | 2,529 | $ | 588 | $ | 1,359 | $ | 4,476 | |||||||||
THE REDWOOD REVIEW I 2ND QUARTER 2017 |
27 |
A N A L Y S I S O F B A L A N C E S H E E T A N D C A P I T A L A L L O C A T I O N S |
Ñ | At June 30, 2017, our investments in residential loans included $2.4 billion of jumbo residential loans financed with $2.0 billion of FHLB debt by our FHLB-member subsidiary. In connection with these borrowings, our FHLB-member subsidiary is required to hold $43 million of FHLB stock. At June 30, 2017, none of these loans were in delinquent status of greater than 90 days. |
Ñ | At June 30, 2017, the weighted average maturity of this FHLB debt was approximately eight years and it had a weighted average cost of 1.1% per annum. This interest cost resets every 13 weeks, and we seek to fix the interest cost of this FHLB debt over its weighted average maturity by using a combination of swaps, TBAs, and other derivative instruments. |
Ñ | Under a final rule published by the Federal Housing Finance Agency in January 2016, our FHLB-member subsidiary will remain an FHLB member through the five-year transition period for captive insurance companies. Our FHLB-member subsidiary's existing $2.0 billion of FHLB debt, which matures beyond this transition period, is permitted to remain outstanding until the stated maturity. As residential loans pledged as collateral for this debt pay down, we are permitted to pledge additional loans or other eligible assets to collateralize this debt; however, we do not expect to be able to increase our subsidiary's FHLB debt above the existing $2.0 billion. |
THE REDWOOD REVIEW I 2ND QUARTER 2017 |
28 |
A N A L Y S I S O F B A L A N C E S H E E T A N D C A P I T A L A L L O C A T I O N S |
Residential Securities - Vintage and Category | |||||||||||||||||||||||
June 30, 2017 | |||||||||||||||||||||||
($ in millions) | |||||||||||||||||||||||
RMBS 2.0 | Legacy RMBS | ||||||||||||||||||||||
Sequoia 2012-2017 | Third Party 2013-2017 | Agency CRT 2013-2017 | Third Party <=2008 | Total Residential Securities | % of Total | ||||||||||||||||||
Senior | $ | 29 | $ | 16 | $ | — | $ | 132 | $ | 177 | 17 | % | |||||||||||
Re-REMIC | — | — | — | 73 | 73 | 7 | % | ||||||||||||||||
Subordinate | |||||||||||||||||||||||
Mezzanine (1) | 137 | 206 | — | — | 343 | 33 | % | ||||||||||||||||
Subordinate | 120 | 75 | 230 | 30 | 455 | 43 | % | ||||||||||||||||
Subordinate | 257 | 281 | 230 | 30 | 798 | 76 | % | ||||||||||||||||
Total real estate securities | $ | 286 | $ | 297 | $ | 230 | $ | 236 | $ | 1,048 | 100 | % | |||||||||||
(1) | Mezzanine includes securities initially rated AA through BBB- and issued in 2012 or later. |
THE REDWOOD REVIEW I 2ND QUARTER 2017 |
29 |
A N A L Y S I S O F B A L A N C E S H E E T A N D C A P I T A L A L L O C A T I O N S |
Real Estate Securities Financed with Repurchase Debt | |||||||||||||||||||
June 30, 2017 | |||||||||||||||||||
($ in millions, except weighted average price) | |||||||||||||||||||
Real Estate Securities | Repurchase Debt | Allocated Capital | Weighted Average Price (1) | Financing Haircut (2) | |||||||||||||||
Residential securities | |||||||||||||||||||
Senior | $ | 73 | $ | (64 | ) | $ | 9 | $ | 96 | 12 | % | ||||||||
Mezzanine | 339 | (284 | ) | 55 | $ | 97 | 16 | % | |||||||||||
Total residential securities | 412 | (349 | ) | 63 | |||||||||||||||
Multifamily securities | 151 | (121 | ) | 30 | $ | 95 | 20 | % | |||||||||||
Total | $ | 563 | $ | (469 | ) | $ | 93 | $ | 96 | 17 | % | ||||||||
(1) | GAAP fair value per $100 of principal. |
(2) | Allocated capital divided by GAAP fair value. |
Ñ | At June 30, 2017, the securities we financed through repurchase facilities had no material credit issues. In addition to the allocated capital listed in the table above that directly supports our repurchase facilities (i.e., “the haircut”), we continue to hold a designated amount of supplemental risk capital available for potential margin calls or future obligations relating to these facilities. |
Ñ | At June 30, 2017, we had securities repurchase facilities with eight different counterparties. The weighted average cost of funds for the financing at these facilities during the second quarter of 2017 was approximately 2.24% per annum. |
Ñ | At June 30, 2017, the weighted average GAAP fair value of our financed securities was 96% of their aggregate principal balance. All financed securities received external third-party market price indications as of June 30, 2017, and were, in aggregate, valued within 1% of these indications. |
THE REDWOOD REVIEW I 2ND QUARTER 2017 |
30 |
A N A L Y S I S O F B A L A N C E S H E E T A N D C A P I T A L A L L O C A T I O N S |
Ñ | Most of the $73 million of senior securities noted in the preceding table are supported by seasoned residential loans originated prior to 2008. The credit performance of these investments continues to exceed our original investment expectations. |
Ñ | The $339 million of mezzanine securities financed through repurchase facilities at June 30, 2017 carry investment grade credit ratings and are supported by residential loans originated between 2012 and 2017. The loans underlying these securities have experienced minimal delinquencies to date. |
Ñ | The majority of the $151 million of multifamily securities financed through repurchase facilities at June 30, 2017 carry investment grade credit ratings with 7%-8% of structural credit enhancement. |
Ñ | Additional information on the residential securities we own is set forth in Table 6 in the Financial Tables section of the Appendix to this Redwood Review. |
Ñ | At June 30, 2017, we had $64 million, or 4%, of our total capital invested in MSRs. This portfolio primarily includes jumbo MSRs retained from loans transferred to Sequoia securitizations we completed over the past several years. |
Ñ | We sold substantially all of our conforming MSR portfolio during the second quarter of 2017, and currently do not anticipate adding any additional conforming MSRs to our investment portfolio. |
Ñ | The GAAP carrying value, which is the estimated fair value of our MSRs, was equal to 1.08% of the aggregate principal balance of the associated residential loans at June 30, 2017, as compared with 1.13% at March 31, 2017. |
Ñ | At June 30, 2017, the 60-day-plus delinquency rate (by current principal balance) of loans associated with our MSR investments was 0.14%. |
Ñ | We earn fees from these MSRs, but outsource the actual servicing of the associated loans to third-party servicers. |
THE REDWOOD REVIEW I 2ND QUARTER 2017 |
31 |
A N A L Y S I S O F B A L A N C E S H E E T A N D C A P I T A L A L L O C A T I O N S |
THE REDWOOD REVIEW I 2ND QUARTER 2017 |
32 |

R E D W O O D' S B U S I N E S S O V E R V I E W |
THE REDWOOD REVIEW I 2ND QUARTER 2017 |
34 |
D I V I D E N D P O L I C Y |
THE REDWOOD REVIEW I 2ND QUARTER 2017 |
35 |
C O R E E A R N I N G S D E F I N I T I O N |
• | Under GAAP, available-for-sale securities are reported at their fair value with periodic changes in fair value recognized through the balance sheet in Shareholders’ equity. When an available-for-sale security is sold, the cumulative gain or loss since purchase is recognized through the income statement, in Realized gains, net, in the period the sale occurred. As a result, any such cumulative gains or losses are reflected in core earnings in the period the sale occurred. |
THE REDWOOD REVIEW I 2ND QUARTER 2017 |
36 |
C O R E E A R N I N G S D E F I N I T I O N |
• | Under GAAP, trading securities are reported at their fair value with periodic changes in fair value recognized through the income statement in Investment fair value changes, net. These periodic changes in fair value are excluded from core earnings. When a trading security is sold, only the gain or loss since the prior period-end is recognized through the income statement in the period the sale occurred. Beginning in the second quarter of 2017, core earnings includes an additional adjustment to include the cumulative net gains or losses (from purchase through the sale of the investment) for sold trading securities in the period they are sold. The result is to consistently present within core earnings the cumulative gains or losses from the sale of long-term investments, regardless of how they are accounted for under GAAP. |
THE REDWOOD REVIEW I 2ND QUARTER 2017 |
37 |
G L O S S A R Y |
THE REDWOOD REVIEW I 2ND QUARTER 2017 |
38 |
G L O S S A R Y |
THE REDWOOD REVIEW I 2ND QUARTER 2017 |
39 |
G L O S S A R Y |
THE REDWOOD REVIEW I 2ND QUARTER 2017 |
40 |
G L O S S A R Y |
THE REDWOOD REVIEW I 2ND QUARTER 2017 |
41 |
G L O S S A R Y |
THE REDWOOD REVIEW I 2ND QUARTER 2017 |
42 |
G L O S S A R Y |
THE REDWOOD REVIEW I 2ND QUARTER 2017 |
43 |
G L O S S A R Y |
THE REDWOOD REVIEW I 2ND QUARTER 2017 |
44 |
G L O S S A R Y |
THE REDWOOD REVIEW I 2ND QUARTER 2017 |
45 |
G L O S S A R Y |

THE REDWOOD REVIEW I 2ND QUARTER 2017 |
46 |
 | Table 1: GAAP Earnings (in thousands, except per share data) | |||||||||||||||||||||||||||||||||||||||||||||
2017 Q2 | 2017 Q1 | 2016 Q4 | 2016 Q3 | 2016 Q2 | 2016 Q1 | 2015 Q4 | 2015 Q3 | 2015 Q2 | Six Months 2017 | Six Months 2016 | ||||||||||||||||||||||||||||||||||||
Interest income | $ | 54,419 | $ | 49,367 | $ | 50,612 | $ | 54,781 | $ | 60,307 | $ | 54,071 | $ | 60,074 | $ | 54,191 | $ | 53,857 | $ | 103,786 | $ | 114,378 | ||||||||||||||||||||||||
Discount amortization on securities, net | 4,805 | 5,261 | 5,722 | 6,125 | 6,339 | 8,068 | 8,573 | 9,115 | 9,324 | 10,066 | 14,407 | |||||||||||||||||||||||||||||||||||
Discount (premium) amortization on loans, net | — | — | — | — | 141 | 189 | 182 | 178 | 192 | — | 330 | |||||||||||||||||||||||||||||||||||
Total interest income | 59,224 | 54,628 | 56,334 | 60,906 | 66,787 | 62,328 | 68,829 | 63,484 | 63,373 | 113,852 | 129,115 | |||||||||||||||||||||||||||||||||||
Interest expense on short-term debt | (9,350 | ) | (4,453 | ) | (4,848 | ) | (5,405 | ) | (5,337 | ) | (6,697 | ) | (9,194 | ) | (7,627 | ) | (6,527 | ) | (13,803 | ) | (12,034 | ) | ||||||||||||||||||||||||
Interest expense on ABS issued from consolidated trusts | (3,705 | ) | (3,530 | ) | (3,278 | ) | (3,193 | ) | (3,982 | ) | (4,282 | ) | (4,432 | ) | (5,190 | ) | (5,645 | ) | (7,235 | ) | (8,264 | ) | ||||||||||||||||||||||||
Interest expense on long-term debt | (11,179 | ) | (13,048 | ) | (12,411 | ) | (12,999 | ) | (13,125 | ) | (12,971 | ) | (11,413 | ) | (11,058 | ) | (10,836 | ) | (24,227 | ) | (26,096 | ) | ||||||||||||||||||||||||
Total interest expense | (24,234 | ) | (21,031 | ) | (20,537 | ) | (21,597 | ) | (22,444 | ) | (23,950 | ) | (25,039 | ) | (23,875 | ) | (23,008 | ) | (45,265 | ) | (46,394 | ) | ||||||||||||||||||||||||
Net interest income | 34,990 | 33,597 | 35,797 | 39,309 | 44,343 | 38,378 | 43,790 | 39,609 | 40,365 | 68,587 | 82,721 | |||||||||||||||||||||||||||||||||||
(Provision for) reversal of provision for loan losses – Commercial | — | — | — | 859 | 6,532 | (289 | ) | 240 | 60 | 261 | — | 6,243 | ||||||||||||||||||||||||||||||||||
Net interest income after provision | 34,990 | 33,597 | 35,797 | 40,168 | 50,875 | 38,089 | 44,030 | 39,669 | 40,626 | 68,587 | 88,964 | |||||||||||||||||||||||||||||||||||
Non-interest income | ||||||||||||||||||||||||||||||||||||||||||||||
Mortgage banking activities, net | ||||||||||||||||||||||||||||||||||||||||||||||
Residential mortgage banking | 12,046 | 17,604 | 13,979 | 9,766 | 7,728 | 9,280 | 885 | 331 | 4,833 | 29,650 | 17,008 | |||||||||||||||||||||||||||||||||||
Commercial mortgage banking | — | — | — | — | — | (2,062 | ) | (620 | ) | 1,002 | 2,614 | — | (2,062 | ) | ||||||||||||||||||||||||||||||||
Mortgage servicing rights income (loss), net | ||||||||||||||||||||||||||||||||||||||||||||||
MSR net servicing fee income | 5,852 | 5,527 | 7,629 | 8,726 | 8,870 | 9,646 | 9,392 | 8,715 | 7,292 | 11,379 | 18,516 | |||||||||||||||||||||||||||||||||||
MSR fair value changes | (6,114 | ) | (3,065 | ) | 34,180 | 1,380 | (27,240 | ) | (44,422 | ) | 7,676 | (28,717 | ) | 15,352 | (9,179 | ) | (71,662 | ) | ||||||||||||||||||||||||||||
MSR derivatives fair value changes | 3,040 | (749 | ) | (40,290 | ) | (6,336 | ) | 21,153 | 41,057 | (14,445 | ) | 23,551 | (21,814 | ) | 2,291 | 62,210 | ||||||||||||||||||||||||||||||
Investment fair value changes, net | 8,115 | 1,551 | (9,888 | ) | 11,918 | (11,066 | ) | (19,538 | ) | (4,251 | ) | (14,169 | ) | (1,788 | ) | 9,666 | (30,604 | ) | ||||||||||||||||||||||||||||
Realized gains, net | 1,372 | 5,703 | 1,972 | 6,615 | 9,884 | 9,538 | 20,199 | 5,548 | 6,316 | 7,075 | 19,422 | |||||||||||||||||||||||||||||||||||
Other income | 986 | 1,184 | 2,181 | 1,643 | 1,559 | 955 | 757 | 327 | 1,299 | 2,170 | 2,514 | |||||||||||||||||||||||||||||||||||
Total non-interest income (loss), net | 25,297 | 27,755 | 9,763 | 33,712 | 10,888 | 4,454 | 19,593 | (3,412 | ) | 14,104 | 53,052 | 15,342 | ||||||||||||||||||||||||||||||||||
Fixed compensation expense | (5,321 | ) | (6,002 | ) | (5,310 | ) | (5,253 | ) | (5,875 | ) | (7,894 | ) | (8,009 | ) | (8,642 | ) | (9,286 | ) | (11,323 | ) | (13,769 | ) | ||||||||||||||||||||||||
Variable compensation expense | (4,313 | ) | (3,933 | ) | (4,757 | ) | (5,802 | ) | (4,262 | ) | (1,760 | ) | (1,470 | ) | (3,567 | ) | (3,578 | ) | (8,246 | ) | (6,022 | ) | ||||||||||||||||||||||||
Equity compensation expense | (3,121 | ) | (2,176 | ) | (1,976 | ) | (2,031 | ) | (2,754 | ) | (2,332 | ) | (2,809 | ) | (2,835 | ) | (3,539 | ) | (5,297 | ) | (5,086 | ) | ||||||||||||||||||||||||
Restructuring charges | — | — | 144 | (4 | ) | 118 | (10,659 | ) | — | — | — | — | (10,541 | ) | ||||||||||||||||||||||||||||||||
Other operating expense | (5,886 | ) | (6,115 | ) | (5,925 | ) | (7,265 | ) | (7,382 | ) | (7,807 | ) | (10,350 | ) | (9,453 | ) | (8,815 | ) | (12,001 | ) | (15,189 | ) | ||||||||||||||||||||||||
Total operating expenses | (18,641 | ) | (18,226 | ) | (17,824 | ) | (20,355 | ) | (20,155 | ) | (30,452 | ) | (22,638 | ) | (24,497 | ) | (25,218 | ) | (36,867 | ) | (50,607 | ) | ||||||||||||||||||||||||
(Provision for) benefit from income taxes | (5,322 | ) | (6,157 | ) | (2,381 | ) | (972 | ) | (327 | ) | (28 | ) | 74 | 7,404 | (2,448 | ) | (11,479 | ) | (355 | ) | ||||||||||||||||||||||||||
Net income | $ | 36,324 | $ | 36,969 | $ | 25,355 | $ | 52,553 | $ | 41,281 | $ | 12,063 | $ | 41,059 | $ | 19,164 | $ | 27,064 | $ | 73,293 | $ | 53,344 | ||||||||||||||||||||||||
Diluted average shares (1) | 97,494 | 97,946 | 85,838 | 97,832 | 97,762 | 77,138 | 103,377 | 85,075 | 94,950 | 97,719 | 88,728 | |||||||||||||||||||||||||||||||||||
Diluted earnings per common share | $ | 0.43 | $ | 0.43 | $ | 0.31 | $ | 0.58 | $ | 0.48 | $ | 0.15 | $ | 0.46 | $ | 0.22 | $ | 0.31 | $ | 0.85 | $ | 0.67 | ||||||||||||||||||||||||
(1) | Diluted average shares includes shares from the assumed conversion of our convertible and/or exchangeable debt in certain periods, in accordance with GAAP diluted EPS provisions. See Table 2 that follows for details of this calculation for the current and prior quarters and our respective Quarterly Reports on Form 10-Q and Annual Reports on Form 10-K for prior periods. |
THE REDWOOD REVIEW I 2ND QUARTER 2017 | Table 1: GAAP Earnings 47 | |
| Table 2: GAAP and Non-GAAP Core Diluted Earnings (1) per Common Share (in thousands, except per share data) | ||||||||
2017 Q2 | 2017 Q1 | ||||||||
GAAP Diluted Earnings per Common Share: | |||||||||
Net income attributable to Redwood | $ | 36,324 | $ | 36,969 | |||||
Less: Dividends and undistributed earnings allocated to participating securities | (935 | ) | (1,005 | ) | |||||
Add back: Interest expense on convertible notes for the period, net of tax (2) | 6,205 | 5,870 | |||||||
Net income allocated to common shareholders | $ | 41,594 | $ | 41,834 | |||||
Basic weighted average common share outstanding | 76,820 | 76,738 | |||||||
Net effect of dilutive equity awards | 235 | 111 | |||||||
Net effect of assumed convertible notes conversion to common shares (2) | 20,439 | 21,097 | |||||||
Diluted weighted average common shares outstanding | 97,494 | 97,946 | |||||||
GAAP Diluted Earnings per Common Share | $ | 0.43 | $ | 0.43 | |||||
Non-GAAP Core Diluted Earnings per Common Share: | |||||||||
Non-GAAP core earnings | $ | 28,591 | $ | 29,785 | |||||
Less: Dividends and undistributed earnings allocated to participating securities | (711 | ) | (863 | ) | |||||
Add back: Interest expense on convertible notes for the period, net of tax (2) | 2,072 | 5,870 | |||||||
Non-GAAP core earnings allocated to common shareholders | $ | 29,952 | $ | 34,792 | |||||
Basic weighted average common share outstanding | 76,820 | 76,738 | |||||||
Net effect of dilutive equity awards | 235 | 111 | |||||||
Net effect of assumed convertible notes conversion to common shares (2) | 9,271 | 21,097 | |||||||
Diluted weighted average common shares outstanding | 86,326 | 97,946 | |||||||
Non-GAAP Core Diluted Earnings per Common Share | $ | 0.35 | $ | 0.36 | |||||
(1) | A reconciliation of GAAP net income to non-GAAP core earnings is included in the GAAP Net Income and Reconciliation to Non-GAAP Core Earnings section that starts on page 11 and a definition of core earnings is included in the Core Earnings Definition section of the Appendix. |
(2) | Certain convertible notes were determined to be dilutive in the periods presented and were included in the calculations of diluted EPS under the "if-converted" method. Under this method, the periodic interest expense (net of applicable taxes) for dilutive notes is added back to the numerator and the number of shares that the notes are entitled to (if converted, regardless of whether they are in or out of the money) are included in the denominator. |
THE REDWOOD REVIEW I 2ND QUARTER 2017 | Table 2: GAAP and Core Earnings per Diluted Common Share 48 | |
| Table 3: Segment Results ($ in thousands) | ||||||||||||||||||||||||||||||||||
Three Months Ended June 30, 2017 | Three Months Ended March 31, 2017 | ||||||||||||||||||||||||||||||||||
Investment Portfolio | Residential Mortgage Banking | Corporate/ Other | Total | Investment Portfolio | Residential Mortgage Banking | Corporate/ Other | Total | ||||||||||||||||||||||||||||
Interest income | $ | 45,833 | $ | 8,415 | $ | 4,976 | $ | 59,224 | $ | 42,250 | $ | 7,474 | $ | 4,904 | $ | 54,628 | |||||||||||||||||||
Interest expense | (7,231 | ) | (4,403 | ) | (12,600 | ) | (24,234 | ) | (5,264 | ) | (2,924 | ) | (12,843 | ) | (21,031 | ) | |||||||||||||||||||
Net interest income (expense) | 38,602 | 4,012 | (7,624 | ) | 34,990 | 36,986 | 4,550 | (7,939 | ) | 33,597 | |||||||||||||||||||||||||
Non-interest income | |||||||||||||||||||||||||||||||||||
Mortgage banking activities, net | — | 12,046 | — | 12,046 | — | 17,604 | — | 17,604 | |||||||||||||||||||||||||||
MSR income, net | 2,778 | — | — | 2,778 | 1,713 | — | — | 1,713 | |||||||||||||||||||||||||||
Investment fair value changes, net | 9,115 | — | (1,000 | ) | 8,115 | 3,359 | — | (1,808 | ) | 1,551 | |||||||||||||||||||||||||
Other income | 986 | — | — | 986 | 1,184 | — | — | 1,184 | |||||||||||||||||||||||||||
Realized gains, net | 2,124 | — | (752 | ) | 1,372 | 5,703 | — | — | 5,703 | ||||||||||||||||||||||||||
Total non-interest income (loss) | 15,003 | 12,046 | (1,752 | ) | 25,297 | 11,959 | 17,604 | (1,808 | ) | 27,755 | |||||||||||||||||||||||||
Operating expenses | (1,454 | ) | (6,021 | ) | (11,166 | ) | (18,641 | ) | (1,593 | ) | (5,881 | ) | (10,752 | ) | (18,226 | ) | |||||||||||||||||||
Provision for income taxes | (2,320 | ) | (3,002 | ) | — | (5,322 | ) | (1,737 | ) | (4,420 | ) | — | (6,157 | ) | |||||||||||||||||||||
Segment contribution | $ | 49,831 | $ | 7,035 | $ | (20,542 | ) | $ | 45,615 | $ | 11,853 | $ | (20,499 | ) | |||||||||||||||||||||
Net income | $ | 36,324 | $ | 36,969 | |||||||||||||||||||||||||||||||
Segment assets and liabilities | June 30, 2017 | March 31, 2017 | |||||||||||||||||||||||||||||||||
Residential loans | $ | 2,360,234 | $ | 837,371 | $ | 707,686 | $ | 3,905,291 | $ | 2,350,013 | $ | 376,607 | $ | 745,621 | $ | 3,472,241 | |||||||||||||||||||
Real estate securities | 1,218,503 | — | — | 1,218,503 | 1,165,940 | — | — | 1,165,940 | |||||||||||||||||||||||||||
Mortgage servicing rights | 63,770 | — | — | 63,770 | 111,013 | — | — | 111,013 | |||||||||||||||||||||||||||
Cash and cash equivalents | 36,983 | — | 180,235 | 217,218 | 11,994 | — | 209,787 | 221,781 | |||||||||||||||||||||||||||
Other assets | 130,128 | 22,335 | 98,237 | 250,700 | 132,410 | 33,622 | 77,284 | 243,316 | |||||||||||||||||||||||||||
Total assets | $ | 3,809,618 | $ | 859,706 | $ | 986,158 | $ | 5,655,482 | $ | 3,771,370 | $ | 410,229 | $ | 1,032,692 | $ | 5,214,291 | |||||||||||||||||||
Short-term debt | |||||||||||||||||||||||||||||||||||
Mortgage loan warehouse debt | $ | — | $ | 575,303 | $ | — | $ | 575,303 | $ | — | $ | 240,961 | $ | — | $ | 240,961 | |||||||||||||||||||
Security repurchase facilities | 469,491 | — | — | 469,491 | 322,812 | — | — | 322,812 | |||||||||||||||||||||||||||
Convertible notes, net | — | — | 250,013 | 250,013 | — | — | — | — | |||||||||||||||||||||||||||
Other liabilities | 59,108 | 13,011 | 80,180 | 152,299 | 40,987 | 16,570 | 77,305 | 134,862 | |||||||||||||||||||||||||||
ABS issued | — | — | 692,606 | 692,606 | — | — | 728,391 | 728,391 | |||||||||||||||||||||||||||
Long-term debt, net | 1,999,999 | — | 336,347 | 2,336,346 | 1,999,999 | — | 621,495 | 2,621,494 | |||||||||||||||||||||||||||
Total liabilities | $ | 2,528,598 | $ | 588,314 | $ | 1,359,146 | $ | 4,476,058 | $ | 2,363,798 | $ | 257,531 | $ | 1,427,191 | $ | 4,048,520 | |||||||||||||||||||
THE REDWOOD REVIEW I 2ND QUARTER 2017 | Table 3: Segment Results 49 | |
| Table 4: Taxable and GAAP Income (1) Differences and Dividends ($ in thousands, except for per share data) | ||||||||||||||||||||||||||||||||||||
Estimated Six Months 2017 (2) | Estimated Twelve Months 2016 (2) | Actual Twelve Months 2015 (2) | |||||||||||||||||||||||||||||||||||
Taxable Income | GAAP Income | Differences | Taxable Income | GAAP Income | Differences | Taxable Income | GAAP Income | Differences | |||||||||||||||||||||||||||||
Taxable and GAAP Income Differences | |||||||||||||||||||||||||||||||||||||
Interest income | $ | 103,108 | $ | 113,852 | $ | (10,744 | ) | $ | 232,997 | $ | 246,355 | $ | (13,358 | ) | $ | 227,133 | $ | 259,432 | $ | (32,299 | ) | ||||||||||||||||
Interest expense | (38,529 | ) | (45,265 | ) | 6,736 | (76,396 | ) | (88,528 | ) | 12,132 | (79,830 | ) | (95,883 | ) | 16,053 | ||||||||||||||||||||||
Net interest income | 64,579 | 68,587 | (4,008 | ) | 156,601 | 157,827 | (1,226 | ) | 147,303 | 163,549 | (16,246 | ) | |||||||||||||||||||||||||
Reversal of provision (provision for) loan losses | — | — | — | — | 7,102 | (7,102 | ) | — | 355 | (355 | ) | ||||||||||||||||||||||||||
Realized credit losses | (2,165 | ) | — | (2,165 | ) | (7,989 | ) | — | (7,989 | ) | (8,645 | ) | — | (8,645 | ) | ||||||||||||||||||||||
Mortgage banking activities, net | 20,725 | 29,650 | (8,925 | ) | 26,459 | 38,691 | (12,232 | ) | (24,637 | ) | 10,972 | (35,609 | ) | ||||||||||||||||||||||||
MSR income (loss), net | 2,917 | 4,491 | (1,574 | ) | 86,638 | 14,353 | 72,285 | 33,669 | (3,922 | ) | 37,591 | ||||||||||||||||||||||||||
Investment fair value changes, net | (5,441 | ) | 9,666 | (15,107 | ) | (10,410 | ) | (28,574 | ) | 18,164 | (2,827 | ) | (21,357 | ) | 18,530 | ||||||||||||||||||||||
Operating expenses | (36,131 | ) | (36,867 | ) | 736 | (88,838 | ) | (88,786 | ) | (52 | ) | (103,236 | ) | (97,416 | ) | (5,820 | ) | ||||||||||||||||||||
Other income (expense), net | 11,195 | 2,170 | 9,025 | 2,760 | 6,338 | (3,578 | ) | 2,174 | 3,192 | (1,018 | ) | ||||||||||||||||||||||||||
Realized gains, net | (735 | ) | 7,075 | (7,810 | ) | 284 | 28,009 | (27,725 | ) | — | 36,369 | (36,369 | ) | ||||||||||||||||||||||||
(Provision for) benefit from income taxes | (78 | ) | (11,479 | ) | 11,401 | (155 | ) | (3,708 | ) | 3,553 | (150 | ) | 10,346 | (10,496 | ) | ||||||||||||||||||||||
Income | $ | 54,866 | $ | 73,293 | $ | (18,427 | ) | $ | 165,350 | $ | 131,252 | $ | 34,098 | $ | 43,651 | $ | 102,088 | $ | (58,437 | ) | |||||||||||||||||
REIT taxable income | $ | 36,119 | $ | 97,278 | $ | 85,685 | |||||||||||||||||||||||||||||||
Taxable income (loss) at taxable subsidiaries | 18,747 | 68,072 | (42,034 | ) | |||||||||||||||||||||||||||||||||
Taxable income | $ | 54,866 | $ | 165,350 | $ | 43,651 | |||||||||||||||||||||||||||||||
Shares used for taxable EPS calculation | 77,117 | 76,835 | 78,163 | ||||||||||||||||||||||||||||||||||
REIT taxable income per share (3) | $ | 0.47 | $ | 1.27 | $ | 1.05 | |||||||||||||||||||||||||||||||
Taxable income (loss) per share at taxable subsidiaries | $ | 0.25 | $ | 0.88 | $ | (0.50 | ) | ||||||||||||||||||||||||||||||
Taxable income per share (3) | $ | 0.72 | $ | 2.15 | $ | 0.55 | |||||||||||||||||||||||||||||||
Dividends | |||||||||||||||||||||||||||||||||||||
Dividends declared | $ | 43,160 | $ | 86,240 | $ | 92,493 | |||||||||||||||||||||||||||||||
Dividends per share (4) | $ | 0.56 | $ | 1.12 | $ | 1.12 | |||||||||||||||||||||||||||||||
(1) | Taxable income for 2016 and 2017 are estimates until we file our tax returns for these years. To the extent we expect to pay tax at the corporate level (generally as a result of activity at our taxable REIT subsidiaries), we are required to record a tax provision for GAAP reporting purposes. Any tax provision (or benefit) is not necessarily the actual amount of tax currently due (or receivable as a refund) as a portion of our provision (or benefit) is deferred in nature. It is our intention to retain any excess inclusion income generated in 2017 at our TRS and not pass it through to our shareholders. |
(2) | Reconciliation of GAAP income to taxable income (loss) for prior quarters is provided in the respective Redwood Reviews for those quarters. |
(3) | REIT taxable income per share and taxable income (loss) per share are based on the number of shares outstanding at the end of each quarter. The year-to-date and annual REIT taxable income per share and taxable income (loss) per share are the sum of the quarterly per share estimates. |
(4) | Dividends in 2016 are expected to be characterized as 100% ordinary income (or $86 million). Dividends in 2015 were characterized as 100% ordinary income (or $92 million). |
THE REDWOOD REVIEW I 2ND QUARTER 2017 | Table 4: Taxable and GAAP Income Differences and Dividends 50 | |
| Table 5: Financial Ratios and Book Value ($ in thousands, except per share data) | ||||||||||||||||||||||||||||||||||||||||||||
2017 Q2 | 2017 Q1 | 2016 Q4 | 2016 Q3 | 2016 Q2 | 2016 Q1 | 2015 Q4 | 2015 Q3 | 2015 Q2 | Six Months 2017 | Six Months 2016 | |||||||||||||||||||||||||||||||||||
Financial performance ratios | |||||||||||||||||||||||||||||||||||||||||||||
Net interest income | $ | 34,990 | $ | 33,597 | $ | 35,797 | $ | 39,309 | $ | 44,343 | $ | 38,378 | $ | 43,790 | $ | 39,609 | $ | 40,365 | $ | 68,587 | $ | 82,721 | |||||||||||||||||||||||
Operating expenses | $ | (18,641 | ) | $ | (18,226 | ) | $ | (17,824 | ) | $ | (20,355 | ) | $ | (20,155 | ) | $ | (30,452 | ) | $ | (22,638 | ) | $ | (24,497 | ) | $ | (25,218 | ) | $ | (36,867 | ) | $ | (50,607 | ) | ||||||||||||
GAAP net income | $ | 36,324 | $ | 36,969 | $ | 25,355 | $ | 52,553 | $ | 41,281 | $ | 12,063 | $ | 41,059 | $ | 19,164 | $ | 27,064 | $ | 73,293 | $ | 53,344 | |||||||||||||||||||||||
Average total assets | $ | 5,685,460 | $ | 5,471,154 | $ | 5,613,048 | $ | 5,880,281 | $ | 5,954,162 | $ | 6,131,715 | $ | 6,480,586 | $ | 5,977,645 | $ | 5,730,268 | $ | 5,578,899 | $ | 6,042,951 | |||||||||||||||||||||||
Average total equity | $ | 1,167,438 | $ | 1,158,732 | $ | 1,137,948 | $ | 1,111,507 | $ | 1,089,289 | $ | 1,110,187 | $ | 1,189,289 | $ | 1,244,327 | $ | 1,265,647 | $ | 1,163,109 | $ | 1,099,761 | |||||||||||||||||||||||
Operating expenses / average total assets | 1.31 | % | 1.33 | % | 1.27 | % | 1.38 | % | 1.35 | % | 1.99 | % | 1.40 | % | 1.64 | % | 1.76 | % | 1.32 | % | 1.67 | % | |||||||||||||||||||||||
Operating expenses / average total equity | 6.39 | % | 6.29 | % | 6.27 | % | 7.33 | % | 7.40 | % | 10.97 | % | 7.61 | % | 7.87 | % | 7.97 | % | 6.34 | % | 9.20 | % | |||||||||||||||||||||||
GAAP net income / average total assets | 2.56 | % | 2.70 | % | 1.81 | % | 3.57 | % | 2.77 | % | 0.79 | % | 2.53 | % | 1.28 | % | 1.89 | % | 2.63 | % | 1.77 | % | |||||||||||||||||||||||
GAAP net income / average equity (GAAP ROE) | 12.45 | % | 12.76 | % | 8.91 | % | 18.91 | % | 15.16 | % | 4.35 | % | 13.81 | % | 6.16 | % | 8.55 | % | 12.60 | % | 9.70 | % | |||||||||||||||||||||||
Leverage ratios and book value per share | |||||||||||||||||||||||||||||||||||||||||||||
Short-term debt | $ | 1,294,807 | $ | 563,773 | $ | 791,539 | $ | 1,117,405 | $ | 1,059,045 | $ | 804,175 | $ | 1,855,003 | $ | 1,872,793 | $ | 1,367,062 | |||||||||||||||||||||||||||
Long-term debt – Commercial secured borrowing | — | — | — | — | 65,240 | 65,181 | 63,152 | 65,578 | 65,232 | ||||||||||||||||||||||||||||||||||||
Long-term debt – Other (1) | 2,340,264 | 2,627,764 | 2,627,764 | 2,627,764 | 2,627,764 | 2,627,764 | 1,975,023 | 1,756,299 | 1,514,122 | ||||||||||||||||||||||||||||||||||||
Total debt at Redwood | $ | 3,635,071 | $ | 3,191,537 | $ | 3,419,303 | $ | 3,745,169 | $ | 3,752,049 | $ | 3,497,120 | $ | 3,893,178 | $ | 3,694,670 | $ | 2,946,416 | |||||||||||||||||||||||||||
ABS issued at consolidated entities | |||||||||||||||||||||||||||||||||||||||||||||
Residential Resecuritization ABS issued | $ | — | $ | — | $ | — | $ | — | $ | — | $ | — | $ | — | $ | 5,261 | $ | 18,872 | |||||||||||||||||||||||||||
Commercial Securitization ABS issued | — | — | — | — | — | 51,680 | 53,137 | 67,946 | 69,914 | ||||||||||||||||||||||||||||||||||||
Legacy Sequoia entities ABS issued | 692,606 | 728,391 | 773,462 | 819,868 | 859,628 | 907,023 | 996,820 | 1,105,588 | 1,173,336 | ||||||||||||||||||||||||||||||||||||
Total ABS issued (1) | $ | 692,606 | $ | 728,391 | $ | 773,462 | $ | 819,868 | $ | 859,628 | $ | 958,703 | $ | 1,049,957 | $ | 1,178,795 | $ | 1,262,122 | |||||||||||||||||||||||||||
Consolidated Debt | $ | 4,327,677 | $ | 3,919,928 | $ | 4,192,765 | $ | 4,565,037 | $ | 4,611,677 | $ | 4,455,823 | $ | 4,943,135 | $ | 4,873,465 | $ | 4,208,538 | |||||||||||||||||||||||||||
Stockholders' equity | $ | 1,179,424 | $ | 1,165,771 | $ | 1,149,428 | $ | 1,130,130 | $ | 1,092,603 | $ | 1,085,750 | $ | 1,146,265 | $ | 1,206,575 | $ | 1,264,785 | |||||||||||||||||||||||||||
Debt at Redwood to stockholders' equity (2) | 3.1x | 2.7x | 3.0x | 3.3x | 3.4x | 3.2x | 3.4x | 3.1x | 2.3x | ||||||||||||||||||||||||||||||||||||
Consolidated debt to stockholders' equity | 3.7x | 3.4x | 3.6x | 4.0x | 4.2x | 4.1x | 4.3x | 4.0x | 3.3x | ||||||||||||||||||||||||||||||||||||
Shares outstanding at period end (in thousands) | 77,117 | 77,039 | 76,835 | 76,682 | 76,935 | 76,627 | 78,163 | 82,125 | 84,552 | ||||||||||||||||||||||||||||||||||||
Book value per share | $ | 15.29 | $ | 15.13 | $ | 14.96 | $ | 14.74 | $ | 14.20 | $ | 14.17 | $ | 14.67 | $ | 14.69 | $ | 14.96 | |||||||||||||||||||||||||||
(1) | Long-term debt - other and ABS issued presented above do not include deferred securities issuance costs. |
(2) | Excludes ABS obligations of consolidated securitization entities, including legacy Sequoia securitizations completed prior to 2012, the residential resecuritization completed in 2011, and the commercial securitization completed in 2012. Also excludes commercial secured borrowings associated with commercial A-notes that were sold, but treated as secured borrowings under GAAP. |
THE REDWOOD REVIEW I 2ND QUARTER 2017 | Table 5: Financial Ratios and Book Value 51 | |
| Table 6: Securities and Loan Activity ($ in thousands) | |||||||||||||||||||||||||||||||||||||||||||||||||||
2017 Q2 | 2017 Q1 | 2016 Q4 | 2016 Q3 | 2016 Q2 | 2016 Q1 | 2017 Q2 | 2017 Q1 | 2016 Q4 | 2016 Q3 | 2016 Q2 | 2016 Q1 | |||||||||||||||||||||||||||||||||||||||||
Securities – Senior | Residential Loans, held-for-sale | |||||||||||||||||||||||||||||||||||||||||||||||||||
Beginning fair value | $ | 176,099 | $ | 173,613 | $ | 95,782 | $ | 96,456 | $ | 168,207 | $ | 533,602 | Beginning carrying value | $ | 376,607 | $ | 835,399 | $ | 1,188,514 | $ | 882,380 | $ | 441,076 | $ | 1,115,738 | |||||||||||||||||||||||||||
Acquisitions | 12,842 | 3,231 | 4,943 | — | — | — | Acquisitions | 1,221,051 | 1,108,304 | 1,132,561 | 1,252,135 | 1,342,079 | 1,218,649 | |||||||||||||||||||||||||||||||||||||||
Sales | (628 | ) | (4,944 | ) | (1,463 | ) | — | (57,309 | ) | (328,303 | ) | Sales | (694,875 | ) | (1,377,637 | ) | (1,268,943 | ) | (774,106 | ) | (830,974 | ) | (1,269,135 | ) | ||||||||||||||||||||||||||||
Effect of principal payments | (7,828 | ) | (6,247 | ) | (5,364 | ) | (4,552 | ) | (5,676 | ) | (16,011 | ) | Principal repayments | (9,273 | ) | (12,995 | ) | (24,427 | ) | (20,574 | ) | (12,332 | ) | (23,589 | ) | |||||||||||||||||||||||||||
Transfers between portfolios (1) | — | 12,229 | 75,058 | 1,889 | — | — | Transfers between portfolios | (61,922 | ) | (184,996 | ) | (186,116 | ) | (151,919 | ) | (63,328 | ) | (606,026 | ) | |||||||||||||||||||||||||||||||||
Change in fair value, net | (3,523 | ) | (1,783 | ) | 4,657 | 1,989 | (8,766 | ) | (21,081 | ) | Changes in fair value, net | 5,783 | 8,532 | (6,190 | ) | 598 | 5,859 | 5,439 | ||||||||||||||||||||||||||||||||||
Ending fair value | $ | 176,962 | $ | 176,099 | $ | 173,613 | $ | 95,782 | $ | 96,456 | $ | 168,207 | Ending fair value | $ | 837,371 | $ | 376,607 | $ | 835,399 | $ | 1,188,514 | $ | 882,380 | $ | 441,076 | |||||||||||||||||||||||||||
Securities – Re-REMIC | Residential Loans, held-for-investment at Redwood | |||||||||||||||||||||||||||||||||||||||||||||||||||
Beginning fair value | $ | 73,730 | $ | 85,479 | $ | 161,234 | $ | 165,707 | $ | 162,970 | $ | 165,064 | Beginning carrying value | $ | 2,350,013 | $ | 2,261,016 | $ | 2,282,674 | $ | 2,277,561 | $ | 2,343,953 | $ | 1,791,195 | |||||||||||||||||||||||||||
Effect of principal payments | (488 | ) | (866 | ) | (1,828 | ) | (4,917 | ) | (13 | ) | — | Principal repayments | (60,055 | ) | (93,666 | ) | (162,512 | ) | (146,151 | ) | (129,073 | ) | (76,731 | ) | ||||||||||||||||||||||||||||
Transfers between portfolios (1) | — | (12,229 | ) | (75,058 | ) | (1,889 | ) | — | — | Transfers between portfolios | 61,922 | 184,996 | 186,116 | 151,919 | 63,328 | 606,026 | ||||||||||||||||||||||||||||||||||||
Change in fair value, net | 95 | 1,346 | 1,131 | 2,333 | 2,750 | (2,094 | ) | Changes in fair value, net | 8,354 | (2,333 | ) | (45,262 | ) | (655 | ) | (647 | ) | 23,463 | ||||||||||||||||||||||||||||||||||
Ending fair value | $ | 73,337 | $ | 73,730 | $ | 85,479 | $ | 161,234 | $ | 165,707 | $ | 162,970 | Ending fair value | $ | 2,360,234 | $ | 2,350,013 | $ | 2,261,016 | $ | 2,282,674 | $ | 2,277,561 | $ | 2,343,953 | |||||||||||||||||||||||||||
Securities – Subordinate (2) | Ending Balances for Other Loan and MSR Investments | |||||||||||||||||||||||||||||||||||||||||||||||||||
Beginning fair value | $ | 916,111 | $ | 759,347 | $ | 679,894 | $ | 621,638 | $ | 588,750 | $ | 534,590 | Residential Loans, HFI, at Consolidated Sequoia Entities | $ | 707,686 | $ | 745,621 | $ | 791,636 | $ | 839,976 | $ | 880,197 | $ | 930,027 | |||||||||||||||||||||||||||
Acquisitions | 104,018 | 167,498 | 106,415 | 75,676 | 77,016 | 63,345 | ||||||||||||||||||||||||||||||||||||||||||||||
Sales | (69,048 | ) | (16,816 | ) | (11,809 | ) | (25,610 | ) | (42,631 | ) | (8,485 | ) | Commercial Loans | $ | — | $ | 2,700 | $ | 2,700 | $ | 30,400 | $ | 259,823 | $ | 298,712 | |||||||||||||||||||||||||||
Effect of principal payments | (7,538 | ) | (7,798 | ) | (8,182 | ) | (7,985 | ) | (11,323 | ) | (5,404 | ) | Mortgage Servicing Rights | $ | 63,770 | $ | 111,013 | $ | 118,526 | $ | 106,009 | $ | 110,046 | $ | 126,620 | |||||||||||||||||||||||||||
Change in fair value, net | 24,661 | 13,880 | (6,971 | ) | 16,175 | 9,826 | 4,704 | |||||||||||||||||||||||||||||||||||||||||||||
Ending fair value | $ | 968,204 | $ | 916,111 | $ | 759,347 | $ | 679,894 | $ | 621,638 | $ | 588,750 | ||||||||||||||||||||||||||||||||||||||||
Ending Balances for Subordinate Categories | ||||||||||||||||||||||||||||||||||||||||||||||||||||
RMBS 2.0 Mezzanine | $ | 343,013 | $ | 368,919 | $ | 315,397 | $ | 283,561 | $ | 308,243 | $ | 324,667 | ||||||||||||||||||||||||||||||||||||||||
RMBS 2.0 Subordinate | 195,039 | 191,321 | 177,760 | 165,721 | 144,072 | 138,844 | ||||||||||||||||||||||||||||||||||||||||||||||
Agency CRT | 229,510 | 198,197 | 152,126 | 134,460 | 96,008 | 84,456 | ||||||||||||||||||||||||||||||||||||||||||||||
Legacy RMBS Subordinate | 30,333 | 18,993 | 22,294 | 23,542 | 25,195 | 30,425 | ||||||||||||||||||||||||||||||||||||||||||||||
Total residential subordinates | 797,895 | 777,430 | 667,577 | 607,284 | 573,518 | 578,392 | ||||||||||||||||||||||||||||||||||||||||||||||
Multifamily | 170,309 | 138,681 | 91,770 | 72,610 | 48,120 | 10,358 | ||||||||||||||||||||||||||||||||||||||||||||||
Total subordinate securities | $ | 968,204 | $ | 916,111 | $ | 759,347 | $ | 679,894 | $ | 621,638 | $ | 588,750 | ||||||||||||||||||||||||||||||||||||||||
(1) | In 2016 and 2017, certain Re-REMIC securities we held were exchanged for the underlying senior securities. |
(2) | Securities-subordinate, as presented above, includes mezzanine securities. |
THE REDWOOD REVIEW I 2ND QUARTER 2017 | Table 6: Securities and Loan Portfolio Activity 52 | |
| Table 7: Consolidating Balance Sheet ($ in thousands) | ||||||||||||||||||||||||
June 30, 2017 | March 31, 2017 | ||||||||||||||||||||||||
At Redwood (1) | Consolidated Sequoia Entities (1) | Redwood Consolidated | At Redwood (1) | Consolidated Sequoia Entities (1) | Redwood Consolidated | ||||||||||||||||||||
Residential loans | $ | 3,197,605 | $ | 707,686 | $ | 3,905,291 | $ | 2,726,620 | $ | 745,621 | $ | 3,472,241 | |||||||||||||
Real estate securities | 1,218,503 | — | 1,218,503 | 1,165,940 | — | 1,165,940 | |||||||||||||||||||
Mortgage servicing rights | 63,770 | — | 63,770 | 111,013 | — | 111,013 | |||||||||||||||||||
Cash and cash equivalents | 217,218 | — | 217,218 | 221,781 | — | 221,781 | |||||||||||||||||||
Total earning assets | 4,697,096 | 707,686 | 5,404,782 | 4,225,354 | 745,621 | 4,970,975 | |||||||||||||||||||
Other assets (2) | 244,982 | 5,718 | 250,700 | 238,243 | 5,073 | 243,316 | |||||||||||||||||||
Total assets | $ | 4,942,078 | $ | 713,404 | $ | 5,655,482 | $ | 4,463,597 | $ | 750,694 | $ | 5,214,291 | |||||||||||||
Short-term debt | $ | 1,294,807 | $ | — | $ | 1,294,807 | $ | 563,773 | $ | — | $ | 563,773 | |||||||||||||
Other liabilities | 151,768 | 531 | 152,299 | 134,330 | 532 | 134,862 | |||||||||||||||||||
ABS issued | — | 692,606 | 692,606 | — | 728,391 | 728,391 | |||||||||||||||||||
Long-term debt, net | 2,336,346 | — | 2,336,346 | 2,621,494 | — | 2,621,494 | |||||||||||||||||||
Total liabilities | 3,782,921 | 693,137 | 4,476,058 | 3,319,597 | 728,923 | 4,048,520 | |||||||||||||||||||
Equity | 1,159,157 | 20,267 | 1,179,424 | 1,144,000 | 21,771 | 1,165,771 | |||||||||||||||||||
Total liabilities and equity | $ | 4,942,078 | $ | 713,404 | $ | 5,655,482 | $ | 4,463,597 | $ | 750,694 | $ | 5,214,291 | |||||||||||||
(1) | The format of this consolidating balance sheet is provided to more clearly delineate between the assets belonging to consolidated Sequoia securitization entities that we are required to consolidate on our balance sheet in accordance with GAAP, but which are not legally ours, and the liabilities of these consolidated entities, which are payable only from the cash flows generated by their assets and are, therefore, nonrecourse to us, and the assets that are legally ours and the liabilities of ours for which there is recourse to us. |
(2) | At both June 30, 2017 and March 31, 2017, other assets at Redwood included a total of $43 million of assets held by third-party custodians and pledged as collateral to the GSEs in connection with credit risk-sharing arrangements relating to conforming residential loans. These pledged assets can only be used to settle obligations to the GSEs under these risk-sharing arrangements. |
THE REDWOOD REVIEW I 2ND QUARTER 2017 | Table 7: Consolidating Balance Sheet 53 | |