
T A B L E O F C O N T E N T S |
Introduction | |
Shareholder Letter | |
Quarterly Overview | |
Ñ First Quarter Highlights | |
Ñ GAAP Net Income and Reconciliation to Non-GAAP Core Earnings | |
Ñ Analysis of Earnings | |
Ñ GAAP Book Value | |
Ñ Capital Allocations | |
Ñ 2018 Updated Financial Outlook | |
Financial Insights | |
Ñ Segment Results | |
Ñ Balance Sheet Analysis | |
Financial Tables | |
Appendix | |
Ñ Dividend Policy | |
Ñ Core Earnings Definition | |
Ñ Forward-Looking Statements | |
THE REDWOOD REVIEW I 1ST QUARTER 2018 |
1 |
C A U T I O N A R Y S T A T E M E N T |
THE REDWOOD REVIEW I 1ST QUARTER 2018 |
2 |
I N T R O D U C T I O N |
Selected Financial Highlights | |||||||||||
Quarter:Year | GAAP Income per Share | REIT Taxable Income per Share (1) | Annualized GAAP Return on Equity | GAAP Book Value per Share | Dividends per Share | ||||||
Q118 | $0.50 | $0.44 | 15% | $16.12 | $0.28 | ||||||
Q417 | $0.35 | $0.42 | 10% | $15.83 | $0.28 | ||||||
Q317 | $0.41 | $0.26 | 12% | $15.67 | $0.28 | ||||||
Q217 | $0.43 | $0.25 | 12% | $15.29 | $0.28 | ||||||
Q117 | $0.43 | $0.22 | 13% | $15.13 | $0.28 | ||||||
Q416 | $0.31 | $0.34 | 9% | $14.96 | $0.28 | ||||||
Q316 | $0.58 | $0.34 | 19% | $14.74 | $0.28 | ||||||
Q216 | $0.48 | $0.36 | 15% | $14.20 | $0.28 | ||||||
Q116 | $0.15 | $0.23 | 4% | $14.17 | $0.28 | ||||||
(1) | REIT taxable income per share for 2017 and 2018 are estimates until we file our tax returns. |
THE REDWOOD REVIEW I 1ST QUARTER 2018 |
3 |
S H A R E H O L D E R L E T T E R |
THE REDWOOD REVIEW I 1ST QUARTER 2018 |
4 |
S H A R E H O L D E R L E T T E R |
 |  | |
Christopher J. Abate | Dashiell I. Robinson | |
President | Executive Vice President | |
THE REDWOOD REVIEW I 1ST QUARTER 2018 |
5 |
S H A R E H O L D E R L E T T E R |
 |
Marty Hughes |
Chief Executive Officer |
THE REDWOOD REVIEW I 1ST QUARTER 2018 |
6 |
Q U A R T E R L Y O V E R V I E W |
Ñ | Our GAAP earnings were $0.50 per share for the first quarter of 2018, as compared with $0.35 per share for the fourth quarter of 2017. This increase was primarily driven by higher mortgage banking income, as well as higher realized gains from the sale of securities relative to the fourth quarter. |
Ñ | Our non-GAAP core earnings(1) were $0.60 per share for the first quarter of 2018, as compared with $0.35 per share for the fourth quarter of 2017. Core earnings exceeded GAAP earnings in the first quarter primarily due to gains from sales of trading securities during the quarter. |
Ñ | Our GAAP book value was $16.12 per share at March 31, 2018, an increase of $0.29 per share from the fourth quarter, and represented an economic return(2) of 3.6% for the quarter. This increase was driven primarily by our quarterly earnings exceeding our dividend and an increase in the value of our long-term debt hedge. |
Ñ | We deployed $92 million of capital in the first quarter of 2018 toward new investments, including $49 million in Sequoia and third-party RMBS, $26 million in Agency residential CRT securities, and $18 million in Agency multifamily securities. |
Ñ | We also deployed $16 million of capital to repurchase shares of Redwood stock at an average price of $14.93 per share during the first quarter. In February 2018, Redwood's Board of Directors approved additional share repurchases, increasing the total amount authorized for repurchases to $100 million, all of which remained outstanding as of March 31, 2018. |
Ñ | We sold $244 million of securities during the first quarter of 2018, capturing $28 million of previously unrealized gains ($9 million of realized gains from AFS securities and $18 million of non-GAAP core fair value gains from trading securities) and generating $141 million of capital for reinvestment after the repayment of associated debt. |
Ñ | As a result of certain securities sales in the first quarter of 2018, we anticipate a portion of our 2018 dividend distributions will be characterized as long-term capital gains, which are taxed at a maximum rate of 20% for individuals. Additionally, we expect the remainder of our 2018 dividend distributions will be eligible for the new 20% REIT dividend deduction that reduces the maximum federal effective tax rate for individual taxpayers (see the Dividend Policy section in the Appendix for further information). |
Ñ | We purchased $1.8 billion of residential jumbo loans during the first quarter of 2018. At March 31, 2018, our pipeline of jumbo residential loans identified for purchase was $1.2 billion. |
Ñ | Residential loan sales totaled $2.0 billion during the first quarter of 2018 and included $1.8 billion of loans that were securitized and $0.3 billion of whole loan sales to third parties. |
Ñ | Our recourse debt to equity leverage ratio was 3.4x at the end of the first quarter of 2018. |
THE REDWOOD REVIEW I 1ST QUARTER 2018 |
7 |
Q U A R T E R L Y O V E R V I E W |
GAAP Net Income and Reconciliation to Non-GAAP Core Earnings | ||||||||
($ in millions, except per share data) | ||||||||
Three Months Ended | ||||||||
3/31/2018 | 12/31/2017 | |||||||
Interest income | $ | 77 | $ | 71 | ||||
Interest expense | (42 | ) | (36 | ) | ||||
Net interest income | 35 | 35 | ||||||
Non-interest income | ||||||||
Mortgage banking activities, net | 27 | 3 | ||||||
MSR income, net | 1 | 2 | ||||||
Investment fair value changes, net | 2 | — | ||||||
Other income | 1 | 1 | ||||||
Realized gains, net | 9 | 5 | ||||||
Total non-interest income, net | 40 | 11 | ||||||
Operating expenses | (23 | ) | (20 | ) | ||||
(Provision for) benefit from income taxes | (5 | ) | 5 | |||||
GAAP net income | $ | 47 | $ | 31 | ||||
Core earnings adjustments | ||||||||
Eliminate mark-to-market changes on long-term investments and associated derivatives | (7 | ) | (7 | ) | ||||
Include cumulative gain (loss) on long-term investments sold, net | 18 | 5 | ||||||
Income tax adjustments associated with core earnings adjustments | — | 2 | ||||||
Non-GAAP core earnings | $ | 58 | $ | 30 | ||||
GAAP net income per diluted common share | $ | 0.50 | $ | 0.35 | ||||
Non-GAAP core earnings per diluted common share (1) | $ | 0.60 | $ | 0.35 | ||||
(1) | Consistent with the calculation of net income per diluted common share for GAAP purposes, non-GAAP core earnings per diluted common share is calculated following the "two-class" method. Additional information on the calculation of core earnings using the "two-class" method can be found in Table 2 in the Financial Tables section of this Redwood Review. |
THE REDWOOD REVIEW I 1ST QUARTER 2018 |
8 |
Q U A R T E R L Y O V E R V I E W |
Ñ | Net interest income was $35 million for the first quarter of 2018, consistent with the fourth quarter of 2017. The benefit from higher average returns resulting from portfolio optimization was mostly offset by lower average balances as we continue to redeploy capital from recent sales. |
Ñ | Mortgage banking activities, net, increased to $27 million for the first quarter of 2018, from $3 million for the fourth quarter of 2017, driven primarily by higher gross margins on similar volume relative to the fourth quarter. Gross margins during the first quarter improved primarily due to tighter spreads on securitizations as well as from a higher than usual balance of loans outstanding at the prior quarter-end. |
Ñ | Investment fair value changes, net, on a GAAP basis were $2 million for the first quarter of 2018, as hedge costs and the effect of principal paydowns on our loans and securities held at a premium were more than offset by the net benefit from spread tightening on our securities portfolio. On a non-GAAP core earnings basis, after eliminating certain mark-to-market changes on long-term investments (and associated derivatives), investment fair value changes, net, were negative $6 million for the first quarter of 2018, as compared with negative $7 million for the fourth quarter of 2017. |
Ñ | On a GAAP basis, we realized gains of $9 million during the first quarter of 2018, which were primarily related to the sale of $51 million of available-for-sale securities, as compared with realized gains of $5 million during the fourth quarter of 2017. On a non-GAAP core earnings basis, realized gains also include the cumulative net gains or losses on trading securities sold, which increased realized gains, net, to $28 million for the first quarter from the sale of $193 million of trading securities, as compared with $9 million for the fourth quarter. |
Ñ | Operating expenses were $23 million for the first quarter of 2018, as compared with $20 million for the fourth quarter of 2017. First quarter operating expenses were above our expected run rate, as variable compensation was accrued in-line with our strong operating results for the quarter. |
Ñ | We recorded a tax provision of $5 million during the first quarter of 2018, as compared with a tax benefit of $5 million for the fourth quarter of 2017. The tax benefit in the fourth quarter included an $8 million benefit associated with the reduction of our net federal deferred tax liabilities from recent tax reform. A reconciliation of GAAP and taxable income is set forth in Table 5 in the Financial Tables section of this Redwood Review. |
Ñ | Additional details on our earnings are included in the Segment Results portion of the Financial Insights section that follows. |
THE REDWOOD REVIEW I 1ST QUARTER 2018 |
9 |
Q U A R T E R L Y O V E R V I E W |
Changes in GAAP Book Value per Share | ||||||||
($ in per share) | ||||||||
Three Months Ended | ||||||||
3/31/2018 | 12/31/2017 | |||||||
Beginning book value per share | $ | 15.83 | $ | 15.67 | ||||
Earnings | 0.50 | 0.35 | ||||||
Changes in unrealized gains on securities, net, from: | ||||||||
Realized gains recognized in earnings | (0.09 | ) | (0.03 | ) | ||||
Amortization income recognized in earnings | (0.04 | ) | (0.04 | ) | ||||
Mark-to-market adjustments, net | — | 0.12 | ||||||
Total change in unrealized gains on securities, net | (0.13 | ) | 0.05 | |||||
Dividends | (0.28 | ) | (0.28 | ) | ||||
Share repurchases | 0.01 | — | ||||||
Equity compensation, net | 0.03 | (0.02 | ) | |||||
Changes in unrealized losses on derivatives hedging long-term debt | 0.11 | 0.02 | ||||||
Other, net | 0.05 | 0.04 | ||||||
Ending book value per share | $ | 16.12 | $ | 15.83 | ||||
Ñ | Our GAAP book value per share increased $0.29 per share to $16.12 per share during the first quarter of 2018. This increase was driven primarily by earnings exceeding the dividend and an increase in value of derivatives hedging our long-term debt. |
Ñ | Unrealized gains on our available-for-sale securities decreased $0.13 per share during the first quarter of 2018. This decrease primarily resulted from $0.09 per share of previously unrealized net gains that were realized as income from the sale of securities, as well as $0.04 per share of discount accretion income recognized in earnings from the appreciation in the amortized cost basis of our available-for-sale securities. |
Ñ | Higher benchmark interest rates during the first quarter of 2018 resulted in an $0.11 per share increase to book value due to a decrease in unrealized losses on the derivatives hedging a portion of our long-term debt. At March 31, 2018, the cumulative unrealized loss on these derivatives, which is included in our GAAP book value per share, was $0.46 per share. |
THE REDWOOD REVIEW I 1ST QUARTER 2018 |
10 |
Q U A R T E R L Y O V E R V I E W |
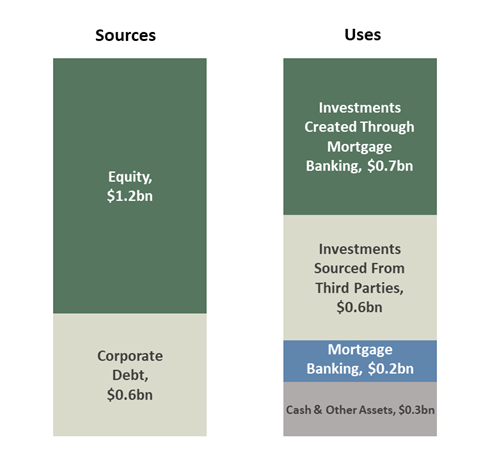
Ñ | Our total capital of $1.8 billion at March 31, 2018 included $1.2 billion of equity capital and $0.6 billion of the total $2.6 billion of long-term debt on our consolidated balance sheet. This portion of debt includes $201 million of exchangeable debt due in 2019, $245 million of convertible debt due in 2023, and $140 million of trust-preferred securities due in 2037. This portion of debt has a weighted average cost of approximately 6.0%. |
Ñ | We also utilize various forms of short-term and long-term collateralized debt to finance certain investments and to warehouse our inventory of certain residential loans held-for-sale. We do not consider this collateralized debt as "capital" and, therefore, exclude it from our capital allocation analysis. |
Ñ | The Balance Sheet Analysis portion of the Financial Insights section that follows describes our long-term and short-term borrowings in further detail. |
THE REDWOOD REVIEW I 1ST QUARTER 2018 |
11 |
Q U A R T E R L Y O V E R V I E W |
Capital Allocation Detail | ||||||||||||||
By Investment Type | ||||||||||||||
March 31, 2018 | ||||||||||||||
($ in millions) | ||||||||||||||
GAAP Fair Value | Collateralized Debt | Allocated Capital | % of Total Capital | |||||||||||
Residential loans (1) | $ | 2,419 | $ | (2,000 | ) | $ | 419 | 23% | ||||||
Securities portfolio | ||||||||||||||
Third party residential securities | 684 | (186 | ) | 498 | 28% | |||||||||
Sequoia residential securities (2) | 384 | (127 | ) | 257 | 14% | |||||||||
Multifamily securities | 377 | (280 | ) | 97 | 5% | |||||||||
Total securities portfolio | 1,445 | (592 | ) | 853 | 47% | |||||||||
Mortgage servicing rights | 66 | — | 66 | 4% | ||||||||||
Other assets/(liabilities) | 155 | (43 | ) | 112 | 6% | |||||||||
Cash and liquidity capital | 395 | N/A | ||||||||||||
(Capital allocated to convert. repayment) | (250 | ) | N/A | |||||||||||
Total Investments | $ | 4,086 | $ | (2,636 | ) | $ | 1,596 | 90% | ||||||
Residential mortgage banking | $ | 200 | 10% | |||||||||||
Total | $ | 1,796 | 100% | |||||||||||
(1) | Includes $43 million of FHLB stock. |
(2) | In addition to our $1.4 billion of securities on our GAAP balance sheet, securities presented above also include $87 million of securities retained from our Sequoia Choice securitizations. For GAAP purposes, we consolidated these Sequoia Choice securitizations. |
Ñ | During the first quarter of 2018, we continued to optimize our portfolio by selling lower-yielding CRT, mezzanine, and third-party legacy securities and redeploying proceeds into higher-yielding alternatives in our Sequoia and multifamily portfolios. (See Table 7 in the Financial Tables section for additional detail on asset activity and balances.) |
Ñ | We expect to continue to optimize our portfolio throughout 2018, and beginning in the second quarter, we expect to deploy an increasing amount of capital towards new investment initiatives in the single-family rental and multifamily housing sectors. |
Ñ | As of March 31, 2018, our cash and liquidity capital included $380 million of available capital, a portion of which was subsequently used to repay our $250 million of convertible debt that matured in April. Going forward, as our new initiatives require additional capital, we will consider the most efficient sources of capital both from continued optimization within our portfolio and from the capital markets. |
THE REDWOOD REVIEW I 1ST QUARTER 2018 |
12 |
Q U A R T E R L Y O V E R V I E W |
(1) | As with all forward-looking statements, our forward-looking statements relating to our 2018 financial outlook are subject to risks and uncertainties, including, among other things, those described in our Annual Report on Form 10-K under the caption “Risk Factors” and other risks, uncertainties, and factors that could cause actual results to differ materially from those described above and under the heading "Forward-Looking Statements" in the Appendix to this Redwood Review, including those described in the “Cautionary Statement” at the beginning of this Redwood Review. Although we may update our 2018 financial outlook subsequently in 2018, as a general matter we undertake no obligation to update or revise forward-looking statements, whether as a result of new information, future events, or otherwise. |
(2) | Includes net interest income, changes in fair value of the investments and their associated hedges that flow through GAAP earnings, realized gains, direct operating expenses, taxes, and other income. Excludes unrealized gains and losses on our AFS securities portfolio, and corporate operating expenses. Returns are calculated based on average capital allocated during the period. |
THE REDWOOD REVIEW I 1ST QUARTER 2018 |
13 |
F I N A N C I A L I N S I G H T S |
Segment Results Summary (1) | ||||||||
($ in millions) | ||||||||
Three Months Ended | ||||||||
3/31/2018 | 12/31/2017 | |||||||
Investment portfolio | ||||||||
Net interest income | $ | 39 | $ | 39 | ||||
Investment fair value changes, net | 2 | 5 | ||||||
Other income | 2 | 3 | ||||||
Realized gains | 9 | 5 | ||||||
Operating expenses | (2 | ) | (2 | ) | ||||
Provision for income taxes | (1 | ) | (1 | ) | ||||
Segment contribution | $ | 49 | $ | 48 | ||||
Residential mortgage banking | ||||||||
Net interest income | $ | 7 | $ | 7 | ||||
Mortgage banking activities | 27 | 3 | ||||||
Operating expenses | (9 | ) | (7 | ) | ||||
(Provision for) benefit from income taxes | (4 | ) | 6 | |||||
Segment contribution | $ | 21 | $ | 9 | ||||
Corporate/Other | (23 | ) | (26 | ) | ||||
Net income | $ | 47 | $ | 31 | ||||
(1) | See Table 3 in the Financial Tables section of this Redwood Review for a more comprehensive presentation of our segment results. |
THE REDWOOD REVIEW I 1ST QUARTER 2018 |
14 |
F I N A N C I A L I N S I G H T S |
Segment Contribution of Investment Portfolio by Type | ||||||||||||||||||||
For the Three Months Ended March 31, 2018 | ||||||||||||||||||||
($ in millions) | ||||||||||||||||||||
Residential Loans | Residential Securities | Multifamily Securities | MSRs | Total | ||||||||||||||||
Total net interest income | $ | 16 | $ | 21 | $ | 2 | $ | — | $ | 39 | ||||||||||
Non-interest income | ||||||||||||||||||||
MSR income, net | — | — | — | 1 | 1 | |||||||||||||||
Investment fair value changes, net | (3 | ) | 1 | 4 | — | 2 | ||||||||||||||
Other income | — | 1 | — | — | 1 | |||||||||||||||
Realized gains, net | — | 9 | — | — | 9 | |||||||||||||||
Total non-interest income, net | (2 | ) | 11 | 4 | — | 13 | ||||||||||||||
Direct operating expenses | — | (1 | ) | — | — | (2 | ) | |||||||||||||
Provision for income taxes | — | (1 | ) | — | — | (1 | ) | |||||||||||||
Segment contribution | $ | 13 | $ | 30 | $ | 5 | $ | — | $ | 49 | ||||||||||
Core Earnings adjustments (1) | ||||||||||||||||||||
Eliminate mark-to-market changes on long-term investments and associated derivatives | — | (3 | ) | (4 | ) | — | (7 | ) | ||||||||||||
Include cumulative gain (loss) on long-term investments sold, net | — | 16 | 2 | — | 18 | |||||||||||||||
Income taxes associated with core earnings adjustments | — | — | — | — | — | |||||||||||||||
Total core earnings adjustments | — | 13 | (2 | ) | — | 11 | ||||||||||||||
Non-GAAP core segment contribution (1) | $ | 13 | $ | 43 | $ | 3 | $ | — | $ | 60 | ||||||||||
(1) | Consistent with management's definition of core earnings set forth on page 34, non-GAAP core segment contribution reflects GAAP segment contribution adjusted to reflect the portion of core earnings adjustments allocable to this segment. |
Ñ | Both segment contribution and non-GAAP core segment contribution from our investment portfolio improved during the first quarter, primarily due to higher realized gains from the sales of securities as part of our ongoing portfolio optimization activities, as well as tighter spreads on multifamily securities. |
Ñ | Credit fundamentals in our investment portfolio remain strong, benefiting from continued housing price growth and improvements in the general economy. |
THE REDWOOD REVIEW I 1ST QUARTER 2018 |
15 |
F I N A N C I A L I N S I G H T S |
Ñ | Segment contribution from residential mortgage banking improved during the first quarter of 2018 as a result of higher gross margins relative to the fourth quarter of 2017. LPCs, adjusted for fallout expectations, were $1.7 billion for the first quarter of 2018, as compared with $1.8 billion for the fourth quarter of 2017. |
Ñ | Gross margins for this segment, which we define as net interest income plus mortgage banking activities, net, divided by loan purchase commitments (LPCs), were above our long-term expectation of 75 to 100 basis points during the first quarter. Tighter securitization spreads in the first quarter benefited our gross margins both through the LPCs we entered into during the quarter as well as the larger than normal inventory we held at the prior quarter-end, much of which was securitized in the first quarter. |
Ñ | Loan purchase volumes, as presented below, decreased in the first quarter of 2018, reflecting an expected seasonal decline, but grew 64% from the same quarter last year. |
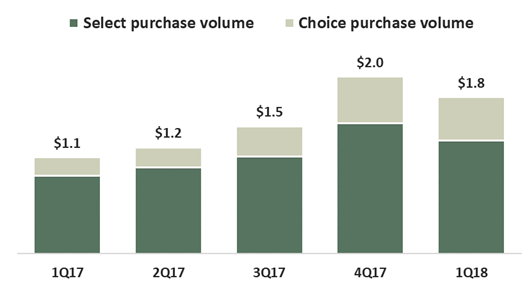
Ñ | During the first quarter of 2018, we completed three traditional Select securitizations and our third Choice securitization (since inception of our Choice program). Loan sales in the first quarter of 2018 increased to $2.0 billion from $1.2 billion in the fourth quarter (inclusive of securitized loans). |
Ñ | To date in the second quarter, we have completed two Select securitizations and expect to execute additional securitizations later in the second quarter. |
Ñ | At March 31, 2018, we had 454 loan sellers, which included 178 jumbo sellers and 276 MPF Direct sellers from various FHLB districts. Currently, 84% of our jumbo sellers have rolled out the Choice program and 97% of these sellers have begun locking Choice loans. |
THE REDWOOD REVIEW I 1ST QUARTER 2018 |
16 |
F I N A N C I A L I N S I G H T S |
Consolidated Balance Sheets (1) | ||||||||
($ in millions) | ||||||||
3/31/2018 | 12/31/2017 | |||||||
Residential loans | $ | 5,146 | $ | 5,115 | ||||
Real estate securities | 1,358 | 1,477 | ||||||
Mortgage servicing rights | 66 | 64 | ||||||
Cash and cash equivalents | 179 | 145 | ||||||
Total earning assets | 6,749 | 6,800 | ||||||
Other assets | 251 | 240 | ||||||
Total assets | $ | 7,000 | $ | 7,040 | ||||
Short-term debt | ||||||||
Mortgage loan warehouse debt | $ | 662 | $ | 1,040 | ||||
Security repurchase facilities | 592 | 649 | ||||||
Convertible notes, net (2) | 250 | 250 | ||||||
Other liabilities | 158 | 149 | ||||||
Asset-backed securities issued | 1,542 | 1,165 | ||||||
Long-term debt, net | 2,576 | 2,575 | ||||||
Total liabilities | 5,780 | 5,828 | ||||||
Stockholders’ equity | 1,220 | 1,212 | ||||||
Total liabilities and equity | $ | 7,000 | $ | 7,040 | ||||
(1) | Our consolidated balance sheets include assets of consolidated variable interest entities (“VIEs”) that can only be used to settle obligations of these VIEs and liabilities of consolidated VIEs for which creditors do not have recourse to the primary beneficiary (Redwood Trust, Inc.). At March 31, 2018 and December 31, 2017, assets of consolidated VIEs totaled $1.6 billion and $1.3 billion, respectively, and liabilities of consolidated VIEs totaled $1.5 billion and $1.2 billion, respectively. See Table 8 in the Financial Tables section of the Appendix to this Redwood Review for additional detail on consolidated VIEs. |
(2) | Certain of our convertible notes are classified as Short-term debt as the maturity of the notes was less than one year as of the dates presented. |
THE REDWOOD REVIEW I 1ST QUARTER 2018 |
17 |
F I N A N C I A L I N S I G H T S |
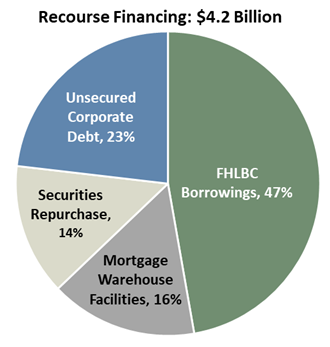 | |||
Borrowing Type | Average Cost of Funds | Average Remaining Term (yrs.) | |
FHLBC Borrowings | 1.6% | 7 | |
Unsecured Corporate Debt | 5.6% | 5 | |
Mortgage Warehouse | 3.2% | <1 | |
Securities Repurchase | 2.8% | <1 | |
Weighted Average Cost of Funds | 2.9% | ||
Ñ | Our long-term unsecured corporate debt is comprised of $245 million of 4.75% convertible notes due in 2023, $201 million of 5.625% exchangeable notes due in 2019, and $140 million of trust-preferred securities due in 2037 (that we hedge to yield approximately 6.8%). In addition, unsecured corporate debt included $250 million of convertible notes that we repaid in April 2018. |
Ñ | Our FHLBC borrowings and securities repurchase debt are used to finance our whole loan and securities investments, respectively, and we utilize mortgage warehouse facilities to finance our mortgage banking activities. These are discussed in further detail in the following sections. |
Ñ | Our recourse debt to equity leverage ratio was 3.4x at the end of the first quarter of 2018. |
Ñ | In addition to our recourse financing, we have ABS debt issued by securitization entities that we consolidate that is non-recourse to us. |
THE REDWOOD REVIEW I 1ST QUARTER 2018 |
18 |
F I N A N C I A L I N S I G H T S |
Residential Loans by Product Type | |||||||
March 31, 2018 | |||||||
($ in millions) | |||||||
Product Type | Total | Weighted Average Coupon | |||||
Fixed rate | $ | 2,134 | 4.08 | % | |||
Hybrid | 242 | 4.10 | % | ||||
Total | $ | 2,376 | 4.07 | % | |||
Ñ | Our held-for-investment loans are prime-quality, first lien jumbo loans, most of which were originated between 2013 and 2018. At March 31, 2018, the weighted average FICO score of borrowers backing these loans was 771 (at origination) and the weighted average loan-to-value ("LTV") ratio of these loans was 66% (at origination). At March 31, 2018, 0.04% of these loans (by unpaid principal balance) were more than 90 days delinquent. |
Ñ | We finance our residential loan investments with $2.0 billion of FHLB debt through our FHLB-member subsidiary. The interest cost for these borrowings resets every 13 weeks, and we seek to effectively fix the interest cost of this debt over its weighted average maturity by using a combination of swaps, TBAs, and other derivative instruments. |
Ñ | Under a final rule published by the Federal Housing Finance Agency in January 2016, our FHLB-member subsidiary's existing $2.0 billion of FHLB debt is permitted to remain outstanding until the stated maturities (between 2024 and 2026). As residential loans pledged as collateral for this debt pay down, we are permitted to pledge additional loans or other eligible assets to collateralize this debt; however, we do not expect to be able to increase our subsidiary's FHLB debt above the existing $2.0 billion. |
Ñ | In connection with these borrowings, our FHLB-member subsidiary is required to hold $43 million of FHLB stock. |
THE REDWOOD REVIEW I 1ST QUARTER 2018 |
19 |
F I N A N C I A L I N S I G H T S |
Securities Portfolio - By Source and Security Type | |||||||||||||||||||||||
March 31, 2018 | |||||||||||||||||||||||
($ in millions) | |||||||||||||||||||||||
Interest-Only Securities | Senior (1) | Mezzanine | Subordinate | Total | % of Total Securities | ||||||||||||||||||
Sequoia (2) | $ | 58 | $ | — | $ | 175 | $ | 151 | $ | 384 | 27 | % | |||||||||||
Third Party New Issue (3) | 31 | — | 111 | 109 | 251 | 17 | % | ||||||||||||||||
Third Party Legacy (3) | 2 | 166 | — | 20 | 187 | 13 | % | ||||||||||||||||
Agency CRT (4) | — | — | — | 246 | 246 | 17 | % | ||||||||||||||||
Total residential securities | $ | 91 | $ | 166 | $ | 286 | $ | 526 | $ | 1,068 | 74 | % | |||||||||||
Multifamily securities (4) | — | — | 377 | — | 377 | 26 | % | ||||||||||||||||
Total securities portfolio | $ | 91 | $ | 166 | $ | 663 | $ | 526 | $ | 1,445 | 100 | % | |||||||||||
(1) | Includes $38 million of re-REMIC securities at March 31, 2018. |
(2) | Presents securities retained from our Sequoia securitizations that were issued from 2012 through 2018. These securities included $9 million of interest-only securities, $42 million of mezzanine securities, and $36 million of subordinate securities retained from our Sequoia Choice securitizations, which were consolidated for GAAP purposes. |
(3) | Presents RMBS issued by third parties after 2012 for New Issue and prior to 2008 for Legacy. |
(4) | Agency CRT and Multifamily securities were issued after 2012. |
THE REDWOOD REVIEW I 1ST QUARTER 2018 |
20 |
F I N A N C I A L I N S I G H T S |
Real Estate Securities Financed with Repurchase Debt | |||||||||||||||||||
March 31, 2018 | |||||||||||||||||||
($ in millions, except weighted average price) | |||||||||||||||||||
Real Estate Securities | Repurchase Debt | Allocated Capital | Weighted Average Price (1) | Financing Haircut (2) | |||||||||||||||
Residential securities | |||||||||||||||||||
Senior | $ | 127 | $ | (112 | ) | $ | 15 | $ | 98 | 12 | % | ||||||||
Mezzanine | 237 | (200 | ) | 36 | $ | 96 | 15 | % | |||||||||||
Total residential securities | 364 | (313 | ) | 51 | |||||||||||||||
Multifamily securities | 357 | (280 | ) | 77 | $ | 95 | 22 | % | |||||||||||
Total | $ | 721 | $ | (592 | ) | $ | 128 | $ | 96 | 18 | % | ||||||||
(1) | GAAP fair value per $100 of principal. |
(2) | Allocated capital divided by GAAP fair value. |
Ñ | In addition to the allocated capital listed in the table above that directly supports our repurchase facilities (i.e., “the haircut”), we continue to hold a designated amount of supplemental risk capital available for potential margin calls or future obligations relating to these facilities. |
Ñ | At March 31, 2018, we had securities repurchase facilities with eight different counterparties. |
Ñ | Additional information on the residential securities we own is set forth in Table 7 in the Financial Tables section of this Redwood Review. |
Ñ | At March 31, 2018, we had $66 million of MSR investments, which are primarily comprised of jumbo MSRs retained from loans transferred to Sequoia securitizations we completed over the past several years. |
Ñ | We earn fees from these MSRs, but outsource the actual servicing of the associated loans to third-party servicers. |
THE REDWOOD REVIEW I 1ST QUARTER 2018 |
21 |
F I N A N C I A L I N S I G H T S |
Ñ | At March 31, 2018, we had $1.1 billion of residential mortgages held-for-sale financed with $0.7 billion of warehouse debt. |
Ñ | Our warehouse capacity at March 31, 2018 totaled $1.4 billion across four separate counterparties. |
Ñ | The $1.1 billion of residential loans held-for-sale at March 31, 2018 included $766 million, or 68%, of Select loans, and $364 million, or 32%, of expanded-prime Choice loans. |
Ñ | At March 31, 2018, our pipeline of jumbo residential loans identified for purchase was $1.2 billion. |
Ñ | We seek to minimize the exposure we have to interest rates on our loan pipeline (for loans both on balance sheet and identified for purchase) by using a combination of TBAs, interest rate swaps, and other derivative instruments. |
THE REDWOOD REVIEW I 1ST QUARTER 2018 |
22 |
G L O S S A R Y |

THE REDWOOD REVIEW I 1ST QUARTER 2018 |
23 |
 | Table 1: GAAP Earnings (in thousands, except per share data) | |||||||||||||||||||||||||||||||||||||||||||||
2018 Q1 | 2017 Q4 | 2017 Q3 | 2017 Q2 | 2017 Q1 | 2016 Q4 | 2016 Q3 | 2016 Q2 | 2016 Q1 | Twelve Months 2017 | Twelve Months 2016 | ||||||||||||||||||||||||||||||||||||
Interest income | $ | 72,559 | $ | 67,370 | $ | 58,106 | $ | 54,419 | $ | 49,367 | $ | 50,612 | $ | 54,781 | $ | 60,307 | $ | 54,071 | $ | 229,262 | $ | 219,771 | ||||||||||||||||||||||||
Discount amortization on securities, net | 4,060 | 4,098 | 4,631 | 4,805 | 5,261 | 5,722 | 6,125 | 6,339 | 8,068 | 18,795 | 26,254 | |||||||||||||||||||||||||||||||||||
Discount (premium) amortization on loans, net | — | — | — | — | — | — | — | 141 | 189 | — | 330 | |||||||||||||||||||||||||||||||||||
Total interest income | 76,619 | 71,468 | 62,737 | 59,224 | 54,628 | 56,334 | 60,906 | 66,787 | 62,328 | 248,057 | 246,355 | |||||||||||||||||||||||||||||||||||
Interest expense on short-term debt | (10,424 | ) | (9,841 | ) | (7,158 | ) | (6,563 | ) | (4,453 | ) | (4,848 | ) | (5,405 | ) | (5,337 | ) | (6,697 | ) | (28,015 | ) | (22,287 | ) | ||||||||||||||||||||||||
Interest expense on short-term convertible notes (1) | (3,011 | ) | (3,025 | ) | (3,024 | ) | (2,787 | ) | — | — | — | — | — | (8,836 | ) | — | ||||||||||||||||||||||||||||||
Interest expense on ABS issued from consolidated trusts | (11,401 | ) | (7,917 | ) | (3,956 | ) | (3,705 | ) | (3,530 | ) | (3,278 | ) | (3,193 | ) | (3,982 | ) | (4,282 | ) | (19,108 | ) | (14,735 | ) | ||||||||||||||||||||||||
Interest expense on long-term debt | (16,678 | ) | (15,325 | ) | (13,305 | ) | (11,179 | ) | (13,048 | ) | (12,411 | ) | (12,999 | ) | (13,125 | ) | (12,971 | ) | (52,857 | ) | (51,506 | ) | ||||||||||||||||||||||||
Total interest expense | (41,514 | ) | (36,108 | ) | (27,443 | ) | (24,234 | ) | (21,031 | ) | (20,537 | ) | (21,597 | ) | (22,444 | ) | (23,950 | ) | (108,816 | ) | (88,528 | ) | ||||||||||||||||||||||||
Net interest income | 35,105 | 35,360 | 35,294 | 34,990 | 33,597 | 35,797 | 39,309 | 44,343 | 38,378 | 139,241 | 157,827 | |||||||||||||||||||||||||||||||||||
Reversal of (provision for) loan losses – Commercial | — | — | — | — | — | — | 859 | 6,532 | (289 | ) | — | 7,102 | ||||||||||||||||||||||||||||||||||
Net interest income after provision | 35,105 | 35,360 | 35,294 | 34,990 | 33,597 | 35,797 | 40,168 | 50,875 | 38,089 | 139,241 | 164,929 | |||||||||||||||||||||||||||||||||||
Non-interest income | ||||||||||||||||||||||||||||||||||||||||||||||
Mortgage banking activities, net | 26,576 | 3,058 | 21,200 | 12,046 | 17,604 | 13,979 | 9,766 | 7,728 | 7,218 | 53,908 | 38,691 | |||||||||||||||||||||||||||||||||||
Mortgage servicing rights income, net | 957 | 1,754 | 1,615 | 2,778 | 1,713 | 1,519 | 3,770 | 2,783 | 6,281 | 7,860 | 14,353 | |||||||||||||||||||||||||||||||||||
Investment fair value changes, net | 1,609 | 384 | 324 | 8,115 | 1,551 | (9,888 | ) | 11,918 | (11,066 | ) | (19,538 | ) | 10,374 | (28,574 | ) | |||||||||||||||||||||||||||||||
Realized gains, net | 9,363 | 4,546 | 1,734 | 1,372 | 5,703 | 1,972 | 6,615 | 9,884 | 9,538 | 13,355 | 28,009 | |||||||||||||||||||||||||||||||||||
Other income | 1,161 | 1,209 | 1,197 | 986 | 1,184 | 2,181 | 1,643 | 1,559 | 955 | 4,576 | 6,338 | |||||||||||||||||||||||||||||||||||
Total non-interest income (loss), net | 39,666 | 10,951 | 26,070 | 25,297 | 27,755 | 9,763 | 33,712 | 10,888 | 4,454 | 90,073 | 58,817 | |||||||||||||||||||||||||||||||||||
Fixed compensation expense | (6,439 | ) | (5,555 | ) | (5,233 | ) | (5,321 | ) | (6,002 | ) | (5,310 | ) | (5,253 | ) | (5,875 | ) | (7,894 | ) | (22,111 | ) | (24,332 | ) | ||||||||||||||||||||||||
Variable compensation expense | (6,907 | ) | (5,861 | ) | (6,467 | ) | (4,313 | ) | (3,933 | ) | (4,757 | ) | (5,802 | ) | (4,262 | ) | (1,760 | ) | (20,574 | ) | (16,581 | ) | ||||||||||||||||||||||||
Equity compensation expense | (2,697 | ) | (2,507 | ) | (2,337 | ) | (3,121 | ) | (2,176 | ) | (1,976 | ) | (2,031 | ) | (2,754 | ) | (2,332 | ) | (10,141 | ) | (9,093 | ) | ||||||||||||||||||||||||
Restructuring charges | — | — | — | — | — | 144 | (4 | ) | 118 | (10,659 | ) | — | (10,401 | ) | ||||||||||||||||||||||||||||||||
Other operating expense | (6,987 | ) | (6,444 | ) | (5,885 | ) | (5,886 | ) | (6,115 | ) | (5,925 | ) | (7,265 | ) | (7,382 | ) | (7,807 | ) | (24,330 | ) | (28,379 | ) | ||||||||||||||||||||||||
Total operating expenses | (23,030 | ) | (20,367 | ) | (19,922 | ) | (18,641 | ) | (18,226 | ) | (17,824 | ) | (20,355 | ) | (20,155 | ) | (30,452 | ) | (77,156 | ) | (88,786 | ) | ||||||||||||||||||||||||
(Provision for) benefit from income taxes | (4,896 | ) | 4,989 | (5,262 | ) | (5,322 | ) | (6,157 | ) | (2,381 | ) | (972 | ) | (327 | ) | (28 | ) | (11,752 | ) | (3,708 | ) | |||||||||||||||||||||||||
Net income | $ | 46,845 | $ | 30,933 | $ | 36,180 | $ | 36,324 | $ | 36,969 | $ | 25,355 | $ | 52,553 | $ | 41,281 | $ | 12,063 | $ | 140,406 | $ | 131,252 | ||||||||||||||||||||||||
Diluted average shares (2) | 108,195 | 109,621 | 102,703 | 97,494 | 97,946 | 85,838 | 97,832 | 97,762 | 77,138 | 101,975 | 97,909 | |||||||||||||||||||||||||||||||||||
Diluted earnings per common share | $ | 0.50 | $ | 0.35 | $ | 0.41 | $ | 0.43 | $ | 0.43 | $ | 0.31 | $ | 0.58 | $ | 0.48 | $ | 0.15 | $ | 1.60 | $ | 1.54 | ||||||||||||||||||||||||
(1) | Represents interest expense on $250 million of convertible notes that were reclassified from Long-term debt to Short-term debt as the maturity of the notes was less than one year as of April 2017. |
(2) | Diluted average shares includes shares from the assumed conversion of our convertible and/or exchangeable debt in certain periods, in accordance with GAAP diluted EPS provisions. See Table 2 that follows for details of this calculation for the current and prior quarter and our respective Quarterly Reports on Form 10-Q and Annual Reports on Form 10-K for prior periods. |
THE REDWOOD REVIEW I 1ST QUARTER 2018 | Table 1: GAAP Earnings 24 | |
| Table 2: GAAP and Non-GAAP Core Basic and Diluted Earnings (1) per Common Share (in thousands, except per share data) | ||||||||
2018 Q1 | 2017 Q4 | ||||||||
GAAP Earnings per Common Share ("EPS"): | |||||||||
Net income attributable to Redwood | $ | 46,845 | $ | 30,933 | |||||
Less: Dividends and undistributed earnings allocated to participating securities | (1,433 | ) | (828 | ) | |||||
Net income allocated to common shareholders for GAAP basic EPS | 45,412 | 30,105 | |||||||
Incremental adjustment to dividends and undistributed earnings allocated to participating securities | 39 | (88 | ) | ||||||
Add back: Interest expense on convertible notes for the period, net of tax (2) | 8,641 | 8,259 | |||||||
Net income allocated to common shareholders for GAAP diluted EPS | $ | 54,092 | $ | 38,276 | |||||
Basic weighted average common shares outstanding | 75,397 | 76,762 | |||||||
Net effect of dilutive equity awards | 35 | 96 | |||||||
Net effect of assumed convertible notes conversion to common shares (2) | 32,763 | 32,763 | |||||||
Diluted weighted average common shares outstanding | 108,195 | 109,621 | |||||||
GAAP Basic Earnings per Common Share | $ | 0.60 | $ | 0.39 | |||||
GAAP Diluted Earnings per Common Share | $ | 0.50 | $ | 0.35 | |||||
Non-GAAP Core Earnings per Common Share: | |||||||||
Non-GAAP core earnings | $ | 57,674 | $ | 30,473 | |||||
Less: Dividends and undistributed earnings allocated to participating securities | (1,749 | ) | (816 | ) | |||||
Non-GAAP core earnings allocated to common shareholders for core basic EPS | 55,925 | 29,657 | |||||||
Incremental adjustment to dividends and undistributed earnings allocated to participating securities | 133 | (92 | ) | ||||||
Add back: Interest expense on convertible notes for the period, net of tax (2) | 8,641 | 8,259 | |||||||
Non-GAAP core earnings allocated to common shareholders for core diluted EPS | $ | 64,699 | $ | 37,824 | |||||
Basic weighted average common share outstanding | 75,397 | 76,762 | |||||||
Net effect of dilutive equity awards | 35 | 96 | |||||||
Net effect of assumed convertible notes conversion to common shares (2) | 32,763 | 32,763 | |||||||
Diluted weighted average common shares outstanding | 108,195 | 109,621 | |||||||
Non-GAAP Core Basic Earnings per Common Share | $ | 0.74 | $ | 0.39 | |||||
Non-GAAP Core Diluted Earnings per Common Share | $ | 0.60 | $ | 0.35 | |||||
(1) | A reconciliation of GAAP net income to non-GAAP core earnings is included in the GAAP Net Income and Reconciliation to Non-GAAP Core Earnings section that starts on page 8 and a definition of core earnings is included in the Core Earnings Definition section of the Appendix. |
(2) | Certain convertible notes were determined to be dilutive in the periods presented and were included in the calculations of diluted EPS under the "if-converted" method. Under this method, the periodic interest expense (net of applicable taxes) for dilutive notes is added back to the numerator and the number of shares that the notes are entitled to (if converted, regardless of whether they are in or out of the money) are included in the denominator. |
THE REDWOOD REVIEW I 1ST QUARTER 2018 | Table 2: GAAP and Non-GAAP Core Earnings per Basic and Diluted Common Share 25 | |
| Table 3: Segment Results ($ in thousands) | ||||||||||||||||||||||||||||||||||||||||||||
2018 Q1 | 2017 Q4 | 2017 Q3 | 2017 Q2 | 2017 Q1 | 2016 Q4 | 2016 Q3 | 2016 Q2 | 2016 Q1 | Twelve Months 2017 | Twelve Months 2016 | |||||||||||||||||||||||||||||||||||
Investment Portfolio | |||||||||||||||||||||||||||||||||||||||||||||
Net interest income | |||||||||||||||||||||||||||||||||||||||||||||
Residential securities | $ | 21,164 | $ | 21,123 | $ | 19,364 | $ | 18,163 | $ | 17,081 | $ | 16,368 | $ | 16,441 | $ | 16,707 | $ | 18,454 | $ | 75,731 | $ | 67,970 | |||||||||||||||||||||||
Residential loans | 15,842 | 16,032 | 16,916 | 18,461 | 18,448 | 18,676 | 19,069 | 19,536 | 16,529 | 69,857 | 73,810 | ||||||||||||||||||||||||||||||||||
Multifamily and commercial investments | 1,888 | 1,749 | 1,298 | 1,978 | 1,457 | 2,853 | 6,653 | 11,644 | 6,273 | 6,482 | 27,423 | ||||||||||||||||||||||||||||||||||
Total net interest income | 38,894 | 38,904 | 37,578 | 38,602 | 36,986 | 37,897 | 42,163 | 47,887 | 41,256 | 152,070 | 169,203 | ||||||||||||||||||||||||||||||||||
Reversal of (provision for) loan losses | — | — | — | — | — | — | 859 | 6,532 | (289 | ) | — | 7,102 | |||||||||||||||||||||||||||||||||
Non-interest income | |||||||||||||||||||||||||||||||||||||||||||||
MSR income, net | 957 | 1,754 | 1,615 | 2,778 | 1,713 | 1,519 | 3,770 | 2,783 | 6,281 | 7,860 | 14,353 | ||||||||||||||||||||||||||||||||||
Investment fair value changes, net | 1,590 | 4,568 | 1,372 | 9,115 | 3,359 | (7,862 | ) | 12,176 | (10,779 | ) | (17,902 | ) | 18,414 | (24,367 | ) | ||||||||||||||||||||||||||||||
Other income | 1,161 | 1,209 | 1,197 | 986 | 1,184 | 2,181 | 1,643 | 1,559 | 955 | 4,576 | 6,338 | ||||||||||||||||||||||||||||||||||
Realized gains | 9,363 | 4,546 | 1,734 | 2,124 | 5,703 | 1,972 | 6,615 | 9,884 | 9,246 | 14,107 | 27,717 | ||||||||||||||||||||||||||||||||||
Total non-interest income, net | 13,071 | 12,077 | 5,918 | 15,003 | 11,959 | (2,190 | ) | 24,204 | 3,447 | (1,420 | ) | $ | 44,957 | $ | 24,041 | ||||||||||||||||||||||||||||||
Operating expenses | (2,007 | ) | (1,657 | ) | (1,324 | ) | (1,454 | ) | (1,593 | ) | (2,732 | ) | (2,751 | ) | (2,827 | ) | (2,111 | ) | (6,028 | ) | (10,421 | ) | |||||||||||||||||||||||
Provision for income taxes | (888 | ) | (838 | ) | (433 | ) | (2,320 | ) | (1,737 | ) | (761 | ) | (732 | ) | (327 | ) | (28 | ) | (5,328 | ) | (1,848 | ) | |||||||||||||||||||||||
Segment contribution | $ | 49,070 | $ | 48,486 | $ | 41,739 | $ | 49,831 | $ | 45,615 | $ | 32,214 | $ | 63,743 | $ | 54,712 | $ | 37,408 | $ | 185,671 | $ | 188,077 | |||||||||||||||||||||||
Residential Mortgage Banking | |||||||||||||||||||||||||||||||||||||||||||||
Net interest income | $ | 6,760 | $ | 6,887 | $ | 6,491 | $ | 4,012 | $ | 4,550 | $ | 5,579 | $ | 5,005 | $ | 4,306 | $ | 4,580 | $ | 21,940 | $ | 19,470 | |||||||||||||||||||||||
Non-interest income | |||||||||||||||||||||||||||||||||||||||||||||
Mortgage banking activities | 26,576 | 3,058 | 21,200 | 12,046 | 17,604 | 13,979 | 9,766 | 7,728 | 9,280 | 53,908 | 40,753 | ||||||||||||||||||||||||||||||||||
Operating expenses | (8,632 | ) | (7,104 | ) | (6,107 | ) | (6,021 | ) | (5,881 | ) | (6,077 | ) | (5,807 | ) | (6,047 | ) | (5,321 | ) | (25,113 | ) | (23,252 | ) | |||||||||||||||||||||||
(Provision for) benefit from income taxes | (4,008 | ) | 5,827 | (4,829 | ) | (3,002 | ) | (4,420 | ) | (1,620 | ) | (240 | ) | — | — | (6,424 | ) | (1,860 | ) | ||||||||||||||||||||||||||
Segment contribution | $ | 20,696 | $ | 8,668 | $ | 16,755 | $ | 7,035 | $ | 11,853 | $ | 11,861 | $ | 8,724 | $ | 5,987 | $ | 8,539 | $ | 44,311 | $ | 35,111 | |||||||||||||||||||||||
Corporate/other | (22,921 | ) | (26,221 | ) | (22,314 | ) | (20,542 | ) | (20,499 | ) | (18,720 | ) | (19,914 | ) | (19,418 | ) | (33,884 | ) | (89,576 | ) | (91,936 | ) | |||||||||||||||||||||||
GAAP net income | $ | 46,845 | $ | 30,933 | $ | 36,180 | $ | 36,324 | $ | 36,969 | $ | 25,355 | $ | 52,553 | $ | 41,281 | $ | 12,063 | $ | 140,406 | $ | 131,252 | |||||||||||||||||||||||
THE REDWOOD REVIEW I 1ST QUARTER 2018 | Table 3: Segment Results 26 | |
| Table 4: Segment Assets and Liabilities ($ in thousands) | ||||||||||||||||||||||||||||||||||
March 31, 2018 | December 31, 2017 | ||||||||||||||||||||||||||||||||||
Investment Portfolio | Residential Mortgage Banking | Corporate/ Other | Total | Investment Portfolio | Residential Mortgage Banking | Corporate/ Other | Total | ||||||||||||||||||||||||||||
Residential loans | |||||||||||||||||||||||||||||||||||
At Redwood | $ | 2,375,785 | $ | 1,130,185 | $ | — | $ | 3,505,970 | $ | 2,434,386 | $ | 1,427,945 | $ | — | $ | 3,862,331 | |||||||||||||||||||
At consolidated Sequoia entities | 1,013,619 | — | 626,151 | 1,639,770 | 620,062 | — | 632,817 | 1,252,879 | |||||||||||||||||||||||||||
Real estate securities | 1,357,720 | — | — | 1,357,720 | 1,476,510 | — | — | 1,476,510 | |||||||||||||||||||||||||||
Mortgage servicing rights | 66,496 | — | — | 66,496 | 63,598 | — | — | 63,598 | |||||||||||||||||||||||||||
Cash and cash equivalents | 19,854 | — | 158,708 | 178,562 | 14,405 | — | 130,258 | 144,663 | |||||||||||||||||||||||||||
Other assets | 178,761 | 24,228 | 48,066 | 251,055 | 134,912 | 25,124 | 79,805 | 239,841 | |||||||||||||||||||||||||||
Total assets | $ | 5,012,235 | $ | 1,154,413 | $ | 832,925 | $ | 6,999,573 | $ | 4,743,873 | $ | 1,453,069 | $ | 842,880 | $ | 7,039,822 | |||||||||||||||||||
Short-term debt | |||||||||||||||||||||||||||||||||||
Mortgage loan warehouse debt | $ | — | $ | 661,782 | $ | — | $ | 661,782 | $ | — | $ | 1,039,666 | $ | — | $ | 1,039,666 | |||||||||||||||||||
Security repurchase facilities | 592,294 | — | — | 592,294 | 648,746 | — | — | 648,746 | |||||||||||||||||||||||||||
Convertible notes, net | — | — | 250,384 | 250,384 | — | — | 250,270 | 250,270 | |||||||||||||||||||||||||||
Other liabilities | 43,451 | 19,034 | 94,970 | 157,455 | 40,287 | 14,087 | 94,871 | 149,245 | |||||||||||||||||||||||||||
ABS issued | 926,238 | — | 615,849 | 1,542,087 | 542,140 | — | 622,445 | 1,164,585 | |||||||||||||||||||||||||||
Long-term debt, net | 1,999,999 | — | 575,589 | 2,575,588 | 1,999,999 | — | 575,024 | 2,575,023 | |||||||||||||||||||||||||||
Total liabilities | $ | 3,561,982 | $ | 680,816 | $ | 1,536,792 | $ | 5,779,590 | $ | 3,231,172 | $ | 1,053,753 | $ | 1,542,610 | $ | 5,827,535 | |||||||||||||||||||
THE REDWOOD REVIEW I 1ST QUARTER 2018 | Table 4: Segment Assets and Liabilities 27 | |
| Table 5: Taxable and GAAP Income (1) Differences and Dividends (In thousands, except for per share data) | ||||||||||||||||||||||||||||||||||||
Estimated Three Months 2018 (2) | Estimated Twelve Months 2017 (2) | Actual Twelve Months 2016 (2) | |||||||||||||||||||||||||||||||||||
Taxable Income | GAAP Income | Differences | Taxable Income | GAAP Income | Differences | Taxable Income | GAAP Income | Differences | |||||||||||||||||||||||||||||
Taxable and GAAP Income Differences | |||||||||||||||||||||||||||||||||||||
Interest income | $ | 62,352 | $ | 76,619 | $ | (14,267 | ) | $ | 224,644 | $ | 248,057 | $ | (23,413 | ) | $ | 233,258 | $ | 246,355 | $ | (13,097 | ) | ||||||||||||||||
Interest expense | (30,266 | ) | (41,514 | ) | 11,248 | (89,662 | ) | (108,816 | ) | 19,154 | (76,396 | ) | (88,528 | ) | 12,132 | ||||||||||||||||||||||
Net interest income | 32,086 | 35,105 | (3,019 | ) | 134,982 | 139,241 | (4,259 | ) | 156,862 | 157,827 | (965 | ) | |||||||||||||||||||||||||
Reversal of provision for loan losses | — | — | — | — | — | — | — | 7,102 | (7,102 | ) | |||||||||||||||||||||||||||
Realized credit losses | (736 | ) | — | (736 | ) | (3,442 | ) | — | (3,442 | ) | (7,989 | ) | — | (7,989 | ) | ||||||||||||||||||||||
Mortgage banking activities, net | 26,530 | 26,576 | (46 | ) | 44,162 | 53,908 | (9,746 | ) | 26,477 | 38,691 | (12,214 | ) | |||||||||||||||||||||||||
MSR income (loss), net | 3,746 | 957 | 2,789 | 3,930 | 7,860 | (3,930 | ) | 86,955 | 14,353 | 72,602 | |||||||||||||||||||||||||||
Investment fair value changes, net | 297 | 1,609 | (1,312 | ) | (11,191 | ) | 10,374 | (21,565 | ) | (10,410 | ) | (28,574 | ) | 18,164 | |||||||||||||||||||||||
Operating expenses | (21,671 | ) | (23,030 | ) | 1,359 | (74,932 | ) | (77,156 | ) | 2,224 | (88,416 | ) | (88,786 | ) | 370 | ||||||||||||||||||||||
Other income (expense), net | 605 | 1,161 | (556 | ) | 27,395 | 4,576 | 22,819 | 2,760 | 6,338 | (3,578 | ) | ||||||||||||||||||||||||||
Realized gains, net | 16,827 | 9,363 | 7,464 | (735 | ) | 13,355 | (14,090 | ) | 284 | 28,009 | (27,725 | ) | |||||||||||||||||||||||||
(Provision for) benefit from income taxes | (129 | ) | (4,896 | ) | 4,767 | (515 | ) | (11,752 | ) | 11,237 | (155 | ) | (3,708 | ) | 3,553 | ||||||||||||||||||||||
Income | $ | 57,555 | $ | 46,845 | $ | 10,710 | $ | 119,654 | $ | 140,406 | $ | (20,752 | ) | $ | 166,368 | $ | 131,252 | $ | 35,116 | ||||||||||||||||||
REIT taxable income | $ | 33,474 | $ | 87,994 | $ | 97,576 | |||||||||||||||||||||||||||||||
Taxable income at taxable subsidiaries | 24,081 | 31,660 | 68,792 | ||||||||||||||||||||||||||||||||||
Taxable income | $ | 57,555 | $ | 119,654 | $ | 166,368 | |||||||||||||||||||||||||||||||
Shares used for taxable EPS calculation | 75,703 | 76,600 | 76,835 | ||||||||||||||||||||||||||||||||||
REIT taxable income per share (3) | $ | 0.44 | $ | 1.15 | $ | 1.27 | |||||||||||||||||||||||||||||||
Taxable income (loss) per share at taxable subsidiaries | $ | 0.32 | $ | 0.41 | $ | 0.90 | |||||||||||||||||||||||||||||||
Taxable income per share (3) | $ | 0.76 | $ | 1.56 | $ | 2.17 | |||||||||||||||||||||||||||||||
Dividends | |||||||||||||||||||||||||||||||||||||
Dividends declared | $ | 21,195 | $ | 86,271 | $ | 86,240 | |||||||||||||||||||||||||||||||
Dividends per share (4) | $ | 0.28 | $ | 1.12 | $ | 1.12 | |||||||||||||||||||||||||||||||
(1) | Taxable income for 2017 and 2018 are estimates until we file our tax returns for these years. To the extent we expect to pay tax at the corporate level (generally as a result of activity at our taxable REIT subsidiaries), we are required to record a tax provision for GAAP reporting purposes. Any tax provision (or benefit) is not necessarily the actual amount of tax currently due (or receivable as a refund) as a portion of our provision (or benefit) is deferred in nature. It is our intention to retain any excess inclusion income generated in 2018 at our TRS and not pass it through to our shareholders. |
(2) | Reconciliation of GAAP income to taxable income (loss) for prior quarters is provided in the respective Redwood Reviews for those quarters. |
(3) | REIT taxable income per share and taxable income (loss) per share are based on the number of shares outstanding at the end of each quarter. The annual REIT taxable income per share and taxable income (loss) per share are the sum of the quarterly per share estimates. |
(4) | Dividends in 2017 are expected to be characterized as 71% ordinary dividend income (or $61 million) and 29% qualified dividend income (or $25 million). Dividends in 2016 were characterized as 100% ordinary income (or $86 million). |
THE REDWOOD REVIEW I 1ST QUARTER 2018 | Table 5: Taxable and GAAP Income Differences and Dividends 28 | |
| Table 6: Financial Ratios and Book Value ($ in thousands, except per share data) | ||||||||||||||||||||||||||||||||||||||||||||
2018 Q1 | 2017 Q4 | 2017 Q3 | 2017 Q2 | 2017 Q1 | 2016 Q4 | 2016 Q3 | 2016 Q2 | 2016 Q1 | Twelve Months 2017 | Twelve Months 2016 | |||||||||||||||||||||||||||||||||||
Financial performance ratios | |||||||||||||||||||||||||||||||||||||||||||||
Net interest income | $ | 35,105 | $ | 35,360 | $ | 35,294 | $ | 34,990 | $ | 33,597 | $ | 35,797 | $ | 39,309 | $ | 44,343 | $ | 38,378 | $ | 139,241 | $ | 157,827 | |||||||||||||||||||||||
Operating expenses | $ | (23,030 | ) | $ | (20,367 | ) | $ | (19,922 | ) | $ | (18,641 | ) | $ | (18,226 | ) | $ | (17,824 | ) | $ | (20,355 | ) | $ | (20,155 | ) | $ | (30,452 | ) | $ | (77,156 | ) | $ | (88,786 | ) | ||||||||||||
GAAP net income | $ | 46,845 | $ | 30,933 | $ | 36,180 | $ | 36,324 | $ | 36,969 | $ | 25,355 | $ | 52,553 | $ | 41,281 | $ | 12,063 | $ | 140,406 | $ | 131,252 | |||||||||||||||||||||||
Average total assets | $ | 6,922,611 | $ | 6,652,937 | $ | 5,851,133 | $ | 5,685,460 | $ | 5,471,154 | $ | 5,613,048 | $ | 5,880,281 | $ | 5,954,162 | $ | 6,131,715 | $ | 5,918,233 | $ | 5,893,998 | |||||||||||||||||||||||
Average total equity | $ | 1,218,015 | $ | 1,207,879 | $ | 1,189,540 | $ | 1,167,438 | $ | 1,158,732 | $ | 1,137,948 | $ | 1,111,507 | $ | 1,089,289 | $ | 1,110,187 | $ | 1,181,056 | $ | 1,112,313 | |||||||||||||||||||||||
Operating expenses / average total assets | 1.33 | % | 1.22 | % | 1.36 | % | 1.31 | % | 1.33 | % | 1.27 | % | 1.38 | % | 1.35 | % | 1.99 | % | 1.30 | % | 1.51 | % | |||||||||||||||||||||||
Operating expenses / total capital | 5.13 | % | 4.56 | % | 4.47 | % | 4.22 | % | 4.08 | % | 4.03 | % | 4.65 | % | 4.71 | % | 7.15 | % | 4.32 | % | 5.02 | % | |||||||||||||||||||||||
Operating expenses / average total equity | 7.56 | % | 6.74 | % | 6.70 | % | 6.39 | % | 6.29 | % | 6.27 | % | 7.33 | % | 7.40 | % | 10.97 | % | 6.53 | % | 7.98 | % | |||||||||||||||||||||||
GAAP net income / average total assets | 2.71 | % | 1.86 | % | 2.47 | % | 2.56 | % | 2.70 | % | 1.81 | % | 3.57 | % | 2.77 | % | 0.79 | % | 2.37 | % | 2.23 | % | |||||||||||||||||||||||
GAAP net income / average equity (GAAP ROE) | 15.38 | % | 10.24 | % | 12.17 | % | 12.45 | % | 12.76 | % | 8.91 | % | 18.91 | % | 15.16 | % | 4.35 | % | 11.89 | % | 11.80 | % | |||||||||||||||||||||||
Leverage ratios and book value per share | |||||||||||||||||||||||||||||||||||||||||||||
Short-term debt | $ | 1,504,460 | $ | 1,938,682 | $ | 1,238,196 | $ | 1,294,807 | $ | 563,773 | $ | 791,539 | $ | 1,117,405 | $ | 1,059,045 | $ | 804,175 | |||||||||||||||||||||||||||
Long-term debt – Commercial secured borrowing | — | — | — | — | — | — | — | 65,240 | 65,181 | ||||||||||||||||||||||||||||||||||||
Long-term debt – Other (1) | 2,585,264 | 2,585,264 | 2,585,264 | 2,340,264 | 2,627,764 | 2,627,764 | 2,627,764 | 2,627,764 | 2,627,764 | ||||||||||||||||||||||||||||||||||||
Total debt at Redwood | $ | 4,089,724 | $ | 4,523,946 | $ | 3,823,460 | $ | 3,635,071 | $ | 3,191,537 | $ | 3,419,303 | $ | 3,745,169 | $ | 3,752,049 | $ | 3,497,120 | |||||||||||||||||||||||||||
ABS issued at consolidated entities | |||||||||||||||||||||||||||||||||||||||||||||
Legacy Sequoia entities ABS issued | $ | 615,849 | $ | 622,445 | $ | 657,960 | $ | 692,606 | $ | 728,391 | $ | 773,462 | $ | 819,868 | $ | 859,628 | $ | 907,023 | |||||||||||||||||||||||||||
Sequoia Choice entities ABS issued | 926,238 | 542,140 | 286,328 | — | — | — | — | — | — | ||||||||||||||||||||||||||||||||||||
Total ABS issued (1) | $ | 1,542,087 | $ | 1,164,585 | $ | 944,288 | $ | 692,606 | $ | 728,391 | $ | 773,462 | $ | 819,868 | $ | 859,628 | $ | 958,703 | |||||||||||||||||||||||||||
Consolidated debt | $ | 5,631,811 | $ | 5,688,531 | $ | 4,767,748 | $ | 4,327,677 | $ | 3,919,928 | $ | 4,192,765 | $ | 4,565,037 | $ | 4,611,677 | $ | 4,455,823 | |||||||||||||||||||||||||||
Stockholders' equity | $ | 1,219,983 | $ | 1,212,287 | $ | 1,208,640 | $ | 1,179,424 | $ | 1,165,771 | $ | 1,149,428 | $ | 1,130,130 | $ | 1,092,603 | $ | 1,085,750 | |||||||||||||||||||||||||||
Total capital (2) | $ | 1,795,572 | $ | 1,787,701 | $ | 1,783,301 | $ | 1,765,784 | $ | 1,787,266 | $ | 1,770,074 | $ | 1,750,000 | $ | 1,711,802 | $ | 1,704,000 | |||||||||||||||||||||||||||
Recourse debt at Redwood to stockholders' equity (3) | 3.4x | 3.7x | 3.2x | 3.1x | 2.7x | 3.0x | 3.3x | 3.4x | 3.2x | ||||||||||||||||||||||||||||||||||||
Consolidated debt to stockholders' equity | 4.6x | 4.7x | 3.9x | 3.7x | 3.4x | 3.6x | 4.0x | 4.2x | 4.1x | ||||||||||||||||||||||||||||||||||||
Shares outstanding at period end (in thousands) | 75,703 | 76,600 | 77,123 | 77,117 | 77,039 | 76,835 | 76,682 | 76,935 | 76,627 | ||||||||||||||||||||||||||||||||||||
Book value per share | $ | 16.12 | $ | 15.83 | $ | 16.05 | $ | 15.29 | $ | 15.13 | $ | 14.96 | $ | 14.74 | $ | 14.20 | $ | 14.17 | |||||||||||||||||||||||||||
(1) | Long-term debt - other and ABS issued presented above do not include deferred securities issuance costs. |
(2) | Our total capital of $1.8 billion at March 31, 2018 included $1.2 billion of equity capital and $0.6 billion of the total $2.6 billion of long-term debt on our consolidated balance sheet. |
(3) | Excludes ABS issued at consolidated entities and commercial secured borrowings associated with commercial A-notes that were sold, but treated as secured borrowings under GAAP. |
THE REDWOOD REVIEW I 1ST QUARTER 2018 | Table 6: Financial Ratios and Book Value 29 | |
| Table 7: Loans and Securities Activity and Balances ($ in thousands) | ||||||||||||||||||||||||||||||||||||
2018 Q1 | 2017 Q4 | 2017 Q3 | 2017 Q2 | 2017 Q1 | 2016 Q4 | 2016 Q3 | 2016 Q2 | 2016 Q1 | |||||||||||||||||||||||||||||
Residential Loans, Held-for-Sale - Activity | |||||||||||||||||||||||||||||||||||||
Beginning carrying value | $ | 1,427,945 | $ | 925,681 | $ | 837,371 | $ | 376,607 | $ | 835,399 | $ | 1,188,514 | $ | 882,380 | $ | 441,076 | $ | 1,115,738 | |||||||||||||||||||
Acquisitions | 1,815,294 | 1,950,180 | 1,462,116 | 1,221,051 | 1,108,304 | 1,132,561 | 1,252,135 | 1,342,079 | 1,218,649 | ||||||||||||||||||||||||||||
Sales | (1,594,531 | ) | (834,977 | ) | (1,393,323 | ) | (694,875 | ) | (1,377,637 | ) | (1,268,943 | ) | (774,106 | ) | (830,974 | ) | (1,269,135 | ) | |||||||||||||||||||
Principal repayments | (17,017 | ) | (14,771 | ) | (16,436 | ) | (9,273 | ) | (12,995 | ) | (24,427 | ) | (20,574 | ) | (12,332 | ) | (23,589 | ) | |||||||||||||||||||
Transfers between portfolios | (507,616 | ) | (601,554 | ) | 20,025 | (61,922 | ) | (184,996 | ) | (186,116 | ) | (151,919 | ) | (63,328 | ) | (606,026 | ) | ||||||||||||||||||||
Changes in fair value, net | 6,110 | 3,386 | 15,928 | 5,783 | 8,532 | (6,190 | ) | 598 | 5,859 | 5,439 | |||||||||||||||||||||||||||
Ending fair value | $ | 1,130,185 | $ | 1,427,945 | $ | 925,681 | $ | 837,371 | $ | 376,607 | $ | 835,399 | $ | 1,188,514 | $ | 882,380 | $ | 441,076 | |||||||||||||||||||
Residential Loans, Held-for-Investment at Redwood - Activity | |||||||||||||||||||||||||||||||||||||
Beginning carrying value | $ | 2,434,386 | $ | 2,268,802 | $ | 2,360,234 | $ | 2,350,013 | $ | 2,261,016 | $ | 2,282,674 | $ | 2,277,561 | $ | 2,343,953 | $ | 1,791,195 | |||||||||||||||||||
Principal repayments | (74,954 | ) | (93,916 | ) | (74,530 | ) | (60,055 | ) | (93,666 | ) | (162,512 | ) | (146,151 | ) | (129,073 | ) | (76,731 | ) | |||||||||||||||||||
Transfers between portfolios | 55,775 | 273,994 | (20,045 | ) | 61,922 | 184,996 | 186,116 | 151,919 | 63,328 | 606,026 | |||||||||||||||||||||||||||
Changes in fair value, net | (39,422 | ) | (14,494 | ) | 3,143 | 8,354 | (2,333 | ) | (45,262 | ) | (655 | ) | (647 | ) | 23,463 | ||||||||||||||||||||||
Ending fair value | $ | 2,375,785 | $ | 2,434,386 | $ | 2,268,802 | $ | 2,360,234 | $ | 2,350,013 | $ | 2,261,016 | $ | 2,282,674 | $ | 2,277,561 | $ | 2,343,953 | |||||||||||||||||||
Ending Balances for Other Loan and MSR Investments | |||||||||||||||||||||||||||||||||||||
Residential Loans, HFI | |||||||||||||||||||||||||||||||||||||
Consolidated Legacy Sequoia entities | $ | 626,151 | $ | 632,817 | $ | 673,134 | $ | 707,686 | $ | 745,621 | $ | 791,636 | $ | 839,976 | $ | 880,197 | $ | 930,027 | |||||||||||||||||||
Consolidated Sequoia Choice entities | $ | 1,013,619 | $ | 620,062 | $ | 317,303 | $ | — | $ | — | $ | — | $ | — | $ | — | $ | — | |||||||||||||||||||
Commercial Loans | $ | — | $ | — | $ | — | $ | — | $ | 2,700 | $ | 2,700 | $ | 30,400 | $ | 259,823 | $ | 298,712 | |||||||||||||||||||
Mortgage Servicing Rights | $ | 66,496 | $ | 63,598 | $ | 62,928 | $ | 63,770 | $ | 111,013 | $ | 118,526 | $ | 106,009 | $ | 110,046 | $ | 126,620 | |||||||||||||||||||
Securities - Activity | |||||||||||||||||||||||||||||||||||||
Beginning fair value | $ | 1,476,510 | $ | 1,356,272 | $ | 1,218,503 | $ | 1,165,940 | $ | 1,018,439 | $ | 936,910 | $ | 883,801 | $ | 919,927 | $ | 1,233,256 | |||||||||||||||||||
Acquisitions | 144,465 | 204,733 | 188,138 | 116,860 | 170,729 | 111,358 | 75,676 | 77,016 | 63,345 | ||||||||||||||||||||||||||||
Sales | (234,509 | ) | (75,887 | ) | (47,076 | ) | (69,676 | ) | (21,760 | ) | (13,272 | ) | (25,610 | ) | (99,940 | ) | (336,788 | ) | |||||||||||||||||||
Effect of principal payments | (15,707 | ) | (21,503 | ) | (19,497 | ) | (15,854 | ) | (14,911 | ) | (15,374 | ) | (17,454 | ) | (17,012 | ) | (21,415 | ) | |||||||||||||||||||
Change in fair value, net | (13,039 | ) | 12,895 | 16,204 | 21,233 | 13,443 | (1,183 | ) | 20,497 | 3,810 | (18,471 | ) | |||||||||||||||||||||||||
Ending fair value | $ | 1,357,720 | $ | 1,476,510 | $ | 1,356,272 | $ | 1,218,503 | $ | 1,165,940 | $ | 1,018,439 | $ | 936,910 | $ | 883,801 | $ | 919,927 | |||||||||||||||||||
Ending Balances for Securities Sub-Categories | |||||||||||||||||||||||||||||||||||||
Residential | |||||||||||||||||||||||||||||||||||||
Senior - Legacy | $ | 127,240 | $ | 140,988 | $ | 153,232 | $ | 128,330 | $ | 137,210 | $ | 136,547 | $ | 71,290 | $ | 73,324 | $ | 140,616 | |||||||||||||||||||
Senior - IO | 82,062 | 69,975 | 62,767 | 48,632 | 38,889 | 37,066 | 24,492 | 23,132 | 27,591 | ||||||||||||||||||||||||||||
Senior - Re-REMIC | 38,370 | 38,875 | 39,033 | 73,337 | 73,730 | 85,479 | 161,234 | 165,707 | 162,970 | ||||||||||||||||||||||||||||
Mezzanine - New issue | 228,114 | 331,451 | 334,915 | 343,013 | 368,919 | 315,397 | 283,561 | 308,243 | 324,667 | ||||||||||||||||||||||||||||
Subordinate - New issue | 239,565 | 247,897 | 209,554 | 195,039 | 191,321 | 177,760 | 165,721 | 144,072 | 138,844 | ||||||||||||||||||||||||||||
Subordinate - Agency CRT | 245,654 | 300,713 | 286,780 | 229,510 | 198,197 | 152,126 | 134,460 | 96,008 | 84,456 | ||||||||||||||||||||||||||||
Subordinate - Legacy | 19,707 | 22,586 | 26,920 | 30,333 | 18,993 | 22,294 | 23,542 | 25,195 | 30,425 | ||||||||||||||||||||||||||||
Multifamily (mezzanine) | 377,008 | 324,025 | 243,071 | 170,309 | 138,681 | 91,770 | 72,610 | 48,120 | 10,358 | ||||||||||||||||||||||||||||
Total securities | $ | 1,357,720 | $ | 1,476,510 | $ | 1,356,272 | $ | 1,218,503 | $ | 1,165,940 | $ | 1,018,439 | $ | 936,910 | $ | 883,801 | $ | 919,927 | |||||||||||||||||||
Sequoia Choice Securities (1) | $ | 87,381 | $ | 77,922 | $ | 30,975 | $ | — | $ | — | $ | — | $ | — | $ | — | $ | — | |||||||||||||||||||
(1) | Represents securities retained from our Sequoia Choice securitizations. We consolidate the loans associated with these retained securities in accordance with GAAP. |
THE REDWOOD REVIEW I 1ST QUARTER 2018 | Table 7: Loans and Securities Activity and Balances 30 | |
| Table 8: Consolidating Balance Sheet ($ in thousands) | ||||||||||||||||||||||||||||||||
March 31, 2018 | December 31, 2017 | ||||||||||||||||||||||||||||||||
Consolidated VIEs (1) | Consolidated VIEs (1) | ||||||||||||||||||||||||||||||||
At Redwood (1) | Legacy Sequoia | Sequoia Choice | Redwood Consolidated | At Redwood (1) | Legacy Sequoia | Sequoia Choice | Redwood Consolidated | ||||||||||||||||||||||||||
Residential loans | $ | 3,505,970 | $ | 626,151 | $ | 1,013,619 | $ | 5,145,740 | $ | 3,862,331 | $ | 632,817 | $ | 620,062 | $ | 5,115,210 | |||||||||||||||||
Real estate securities | 1,357,720 | — | — | 1,357,720 | 1,476,510 | — | — | 1,476,510 | |||||||||||||||||||||||||
Mortgage servicing rights | 66,496 | — | — | 66,496 | 63,598 | — | — | 63,598 | |||||||||||||||||||||||||
Cash and cash equivalents | 178,562 | — | — | 178,562 | 144,663 | — | — | 144,663 | |||||||||||||||||||||||||
Total earning assets | 5,108,748 | 626,151 | 1,013,619 | 6,748,518 | 5,547,102 | 632,817 | 620,062 | 6,799,981 | |||||||||||||||||||||||||
Other assets (2) | 242,975 | 4,016 | 4,064 | 251,055 | 232,946 | 4,367 | 2,528 | 239,841 | |||||||||||||||||||||||||
Total assets | $ | 5,351,723 | $ | 630,167 | $ | 1,017,683 | $ | 6,999,573 | $ | 5,780,048 | $ | 637,184 | $ | 622,590 | $ | 7,039,822 | |||||||||||||||||
Short-term debt | $ | 1,504,460 | $ | — | $ | — | $ | 1,504,460 | $ | 1,938,682 | $ | — | $ | — | $ | 1,938,682 | |||||||||||||||||
Other liabilities | 153,476 | 534 | 3,445 | 157,455 | 146,673 | 537 | 2,035 | 149,245 | |||||||||||||||||||||||||
ABS issued | — | 615,849 | 926,238 | 1,542,087 | — | 622,445 | 542,140 | 1,164,585 | |||||||||||||||||||||||||
Long-term debt, net | 2,575,588 | — | — | 2,575,588 | 2,575,023 | — | — | 2,575,023 | |||||||||||||||||||||||||
Total liabilities | 4,233,524 | 616,383 | 929,683 | 5,779,590 | 4,660,378 | 622,982 | 544,175 | 5,827,535 | |||||||||||||||||||||||||
Equity | 1,118,199 | 13,784 | 88,000 | 1,219,983 | 1,119,670 | 14,202 | 78,415 | 1,212,287 | |||||||||||||||||||||||||
Total liabilities and equity | $ | 5,351,723 | $ | 630,167 | $ | 1,017,683 | $ | 6,999,573 | $ | 5,780,048 | $ | 637,184 | $ | 622,590 | $ | 7,039,822 | |||||||||||||||||
(1) | The format of this consolidating balance sheet is provided to more clearly delineate between the assets belonging to consolidated Sequoia securitization entities that we are required to consolidate on our balance sheet in accordance with GAAP, but which are not legally ours, and the liabilities of these consolidated entities, which are payable only from the cash flows generated by their assets and are, therefore, nonrecourse to us, and the assets that are legally ours and the liabilities of ours for which there is recourse to us. |
(2) | At March 31, 2018 and December 31, 2017, other assets at Redwood included a total of $42 million and $43 million of assets, respectively, held by third-party custodians and pledged as collateral to the GSEs in connection with credit risk-sharing arrangements relating to conforming residential loans. These pledged assets can only be used to settle obligations to the GSEs under these risk-sharing arrangements. |
THE REDWOOD REVIEW I 1ST QUARTER 2018 | Table 8: Consolidating Balance Sheet 31 | |

D I V I D E N D P O L I C Y |
THE REDWOOD REVIEW I 1ST QUARTER 2018 |
33 |
C O R E E A R N I N G S D E F I N I T I O N |
• | Under GAAP, available-for-sale securities are reported at their fair value with periodic changes in fair value recognized through the balance sheet in Shareholders’ equity. When an available-for-sale security is sold, the cumulative gain or loss since purchase is recognized through the income statement, in Realized gains, net, in the period the sale occurred. As a result, any such cumulative gains or losses are reflected in core earnings in the period the sale occurred. |
• | Under GAAP, trading securities are reported at their fair value with periodic changes in fair value recognized through the income statement in Investment fair value changes, net. Certain of these periodic changes in fair value (as described above) are excluded from core earnings. Core earnings includes an adjustment to include the cumulative net gains or losses (from purchase through the sale of the investment) for sold trading securities in the period they are sold. The result is to consistently present within core earnings the cumulative gains or losses from the sale of long-term investments, regardless of how they are accounted for under GAAP. |
THE REDWOOD REVIEW I 1ST QUARTER 2018 |
34 |
C O R E E A R N I N G S D E F I N I T I O N |
THE REDWOOD REVIEW I 1ST QUARTER 2018 |
35 |
C O R E E A R N I N G S D E F I N I T I O N |
Components of Investment Portfolio Fair Value Changes, Net by Investment Type | ||||||||
($ in millions) | ||||||||
Three Months Ended | ||||||||
3/31/2018 | 12/31/2017 | |||||||
Market valuation changes on: | ||||||||
Residential loans held-for-investment | ||||||||
Change in fair value from the reduction of principal (1) | $ | (1 | ) | $ | (2 | ) | ||
Other fair value changes (2) | (38 | ) | (13 | ) | ||||
Total change in fair value of residential loans held-for-investment | (39 | ) | (15 | ) | ||||
Real estate securities | ||||||||
Change in fair value from the reduction of principal (1) | (2 | ) | (2 | ) | ||||
Other fair value changes (2) | (1 | ) | 10 | |||||
Total change in fair value of real estate securities | (3 | ) | 8 | |||||
Risk management derivatives | ||||||||
Interest component of derivative expense | (3 | ) | (3 | ) | ||||
Other fair value changes (3) | 47 | 15 | ||||||
Total change in fair value of risk management derivatives | 44 | 12 | ||||||
Total investment portfolio fair value changes, net | $ | 2 | $ | 5 | ||||
(1) | Reflects the change in fair value due to principal changes, which is calculated as the change in principal on a given investment during the period, multiplied by the prior quarter ending price or acquisition price for that investment in percentage terms. |
(2) | Reflects changes in prepayment assumptions and credit spreads on our residential loans, trading securities and conforming risk-sharing investments primarily due to changes in benchmark interest rates. This item is excluded from management's definition of core earnings. |
(3) | Reflects the change in fair value of our risk management derivatives that are associated with changes in benchmark interest rates during the period. This item is excluded from management's definition of core earnings. |
THE REDWOOD REVIEW I 1ST QUARTER 2018 |
36 |
F O R W A R D - L O O K I N G S T A T E M E N T S |
THE REDWOOD REVIEW I 1ST QUARTER 2018 |
37 |
F O R W A R D - L O O K I N G S T A T E M E N T S |
• | the pace at which we redeploy our available capital into new investments; |
• | interest rate volatility, changes in credit spreads, and changes in liquidity in the market for real estate securities and loans; |
• | changes in the demand from investors for residential mortgages and investments, and our ability to distribute residential mortgages through our whole-loan distribution channel; |
• | our ability to finance our investments in securities and our acquisition of residential mortgages with short-term debt; |
• | changes in the values of assets we own; |
• | general economic trends, the performance of the housing, real estate, mortgage, credit, and broader financial markets, and their effects on the prices of earning assets and the credit status of borrowers; |
• | federal and state legislative and regulatory developments, and the actions of governmental authorities, including the new U.S. presidential administration, and in particular those affecting the mortgage industry or our business (including, but not limited to, the Federal Housing Finance Agency’s rules relating to FHLB membership requirements and the implications for our captive insurance subsidiary’s membership in the FHLB); |
• | strategic business and capital deployment decisions we make; |
• | developments related to the fixed income and mortgage finance markets and the Federal Reserve’s statements regarding its future open market activity and monetary policy; |
• | our exposure to credit risk and the timing of credit losses within our portfolio; |
• | the concentration of the credit risks we are exposed to, including due to the structure of assets we hold and the geographical concentration of real estate underlying assets we own; |
• | our exposure to adjustable-rate mortgage loans; |
• | the efficacy and expense of our efforts to manage or hedge credit risk, interest rate risk, and other financial and operational risks; |
• | changes in credit ratings on assets we own and changes in the rating agencies’ credit rating methodologies; |
• | changes in interest rates; |
• | changes in mortgage prepayment rates; |
• | changes in liquidity in the market for real estate securities and loans; |
• | our ability to finance the acquisition of real estate-related assets with short-term debt; |
• | the ability of counterparties to satisfy their obligations to us; |
• | our involvement in securitization transactions, the profitability of those transactions, and the risks we are exposed to in engaging in securitization transactions; |
• | exposure to claims and litigation, including litigation arising from our involvement in securitization transactions; |
• | ongoing litigation against various trustees of RMBS transactions; |
• | whether we have sufficient liquid assets to meet short-term needs; |
• | our ability to successfully compete and retain or attract key personnel; |
THE REDWOOD REVIEW I 1ST QUARTER 2018 |
38 |
F O R W A R D - L O O K I N G S T A T E M E N T S |
• | our ability to adapt our business model and strategies to changing circumstances; |
• | changes in our investment, financing, and hedging strategies and new risks we may be exposed to if we expand our business activities; |
• | our exposure to a disruption or breach of the security of our technology infrastructure and systems; |
• | exposure to environmental liabilities; |
• | our failure to comply with applicable laws and regulations; |
• | our failure to maintain appropriate internal controls over financial reporting and disclosure controls and procedures; |
• | the impact on our reputation that could result from our actions or omissions or from those of others; changes in accounting principles and tax rules; |
• | our ability to maintain our status as a REIT for tax purposes; |
• | limitations imposed on our business due to our REIT status and our status as exempt from registration under the Investment Company Act of 1940; |
• | decisions about raising, managing, and distributing capital; and |
• | other factors not presently identified. |
THE REDWOOD REVIEW I 1ST QUARTER 2018 |
39 |