
T A B L E O F C O N T E N T S |
Introduction | |
Shareholder Letter | |
Quarterly Overview | |
Ñ Fourth Quarter Highlights | |
Ñ Quarterly Earnings and Analysis | |
Ñ Book Value | |
Ñ Capital Allocations | |
Ñ 2019 Financial Outlook | |
Financial Insights | |
Ñ Balance Sheet Analysis | |
Financial Tables | |
Appendix | |
Ñ Dividends | |
Ñ Non-GAAP Measurements | |
Ñ Forward-Looking Statements | |
THE REDWOOD REVIEW I 4TH QUARTER 2018 |
1 |
F O R W A R D - L O O K I N G S T A T E M E N T S |
THE REDWOOD REVIEW I 4TH QUARTER 2018 |
2 |
I N T R O D U C T I O N |
Selected Financial Highlights | |||||||||||||||
Quarter:Year | GAAP Income (Loss) per Share | Non-GAAP Core Earnings per Share (1) | REIT Taxable Income per Share (2) | Annualized GAAP Return on Equity | GAAP Book Value per Share | Dividends per Share | Economic Return on Book Value (3) | ||||||||
Q418 | $(0.02) | $0.39 | $0.32 | —% | $15.89 | $0.30 | (1.4)% | ||||||||
Q318 | $0.42 | $0.39 | $0.27 | 12% | $16.42 | $0.30 | 3.0% | ||||||||
Q218 | $0.38 | $0.41 | $0.35 | 11% | $16.23 | $0.30 | 2.5% | ||||||||
Q118 | $0.50 | $0.60 | $0.44 | 15% | $16.12 | $0.28 | 3.6% | ||||||||
Q417 | $0.35 | $0.35 | $0.44 | 10% | $15.83 | $0.28 | 2.8% | ||||||||
2018 | $1.34 | $1.78 | $1.38 | 9% | $15.89 | $1.18 | 8% | ||||||||
2017 | $1.60 | $1.40 | $1.17 | 12% | $15.83 | $1.12 | 13% | ||||||||
(1) | Additional information on non-GAAP core earnings, including a definition and reconciliation to GAAP earnings per share, is included in the Non-GAAP Measurements section of the Appendix. |
(2) | REIT taxable income per share for 2018 is an estimate until we file our tax return. |
(3) | Economic return on book value is based on the periodic change in GAAP book value per common share plus dividends declared per common share during the period. |
THE REDWOOD REVIEW I 4TH QUARTER 2018 |
3 |
S H A R E H O L D E R L E T T E R |
THE REDWOOD REVIEW I 4TH QUARTER 2018 |
4 |
S H A R E H O L D E R L E T T E R |
 |  | |
Christopher J. Abate | Dashiell I. Robinson | |
Chief Executive Officer | President | |
THE REDWOOD REVIEW I 4TH QUARTER 2018 |
5 |
Q U A R T E R L Y O V E R V I E W |
Key Financial Results and Metrics | ||||||||
Three Months Ended | ||||||||
12/31/2018 | 9/30/2018 | |||||||
GAAP Earnings (Loss) per Share | $ | (0.02 | ) | $ | 0.42 | |||
Non-GAAP Core Earnings per Share (1) | $ | 0.39 | $ | 0.39 | ||||
Book Value per Share | $ | 15.89 | $ | 16.42 | ||||
Economic Return on Book Value (2) | (1.4 | )% | 3.0 | % | ||||
Recourse Leverage (3) | 3.5x | 3.1x | ||||||
Ñ | Growth in portfolio net interest income from continued capital deployment and solid mortgage banking results were offset by the negative impact to GAAP earnings and book value from spread widening during the fourth quarter on the majority of our portfolio investments. |
Ñ | Core earnings, a non-GAAP measure not impacted by most mark-to-market adjustments, were strong and remained consistent quarter-over-quarter. Despite recent volatility in credit spreads, cash flows and credit fundamentals in our investment portfolio remain strong. |
Ñ | We deployed $235 million of capital into new investments in the fourth quarter of 2018, bringing our full-year deployment to a record $810 million. Recent activity has further diversified our exposure to housing credit, including investments in excess servicing off of seasoned non-Agency securitizations as well as re-performing loan securities. |
Ñ | Residential jumbo loan purchase commitments were $1.3 billion, and we purchased $1.6 billion of jumbo loans during the fourth quarter of 2018, bringing our full-year purchases to $7.1 billion. |
Ñ | We closed one Sequoia securitization of jumbo whole loans, totaling $0.5 billion, during the fourth quarter, bringing our total securitization volume in 2018 to $5.0 billion through 12 separate securitizations. Additionally during the fourth quarter, we sold $0.8 billion of jumbo whole loans to third parties, bringing our full-year whole loan sales to $2.2 billion. |
Ñ | Additionally, in January 2019, we raised $177 million of equity capital in a follow-on offering, exercised our option to purchase the remainder of the 5 Arches platform, and invested in a limited partnership created to acquire $1 billion of light-renovation multifamily loans from Freddie Mac. |
(3) | Recourse debt excludes $5.7 billion of consolidated debt (ABS issued and servicer advance financing) that is non-recourse to Redwood. |
THE REDWOOD REVIEW I 4TH QUARTER 2018 |
6 |
Q U A R T E R L Y O V E R V I E W |
GAAP Net Income | ||||||||
($ in millions, except per share data) | ||||||||
Three Months Ended | ||||||||
12/31/2018 | 9/30/2018 | |||||||
Interest income | $ | 120 | $ | 99 | ||||
Interest expense | (85 | ) | (64 | ) | ||||
Net interest income | 35 | 35 | ||||||
Non-interest income | ||||||||
Mortgage banking activities, net | 11 | 11 | ||||||
Investment fair value changes, net | (39 | ) | 10 | |||||
Other income, net | 4 | 3 | ||||||
Realized gains, net | 6 | 7 | ||||||
Total non-interest (loss) income, net | (18 | ) | 32 | |||||
Operating expenses | (19 | ) | (21 | ) | ||||
Benefit from (provision for) income taxes | 1 | (5 | ) | |||||
GAAP net income (loss) | $ | (1 | ) | $ | 41 | |||
GAAP diluted earnings per common share | $ | (0.02 | ) | $ | 0.42 | |||
Non-GAAP Core Earnings (1) | ||||||||
($ in millions, except per share data) | ||||||||
Three Months Ended | ||||||||
12/31/2018 | 9/30/2018 | |||||||
GAAP net interest income | $ | 35 | $ | 35 | ||||
Change in basis and hedge expense | (1 | ) | (2 | ) | ||||
Non-GAAP economic net interest income (1) | 34 | 33 | ||||||
Non-interest income | ||||||||
Mortgage banking activities, net | 11 | 11 | ||||||
Core other fair value changes, net (1) | — | — | ||||||
Other income, net | 4 | 3 | ||||||
Core realized gains, net (1) | 9 | 15 | ||||||
Total non-interest income, net | 24 | 30 | ||||||
Operating expenses | (19 | ) | (21 | ) | ||||
Core provision for income taxes (1) | (1 | ) | (5 | ) | ||||
Core earnings (1) | $ | 38 | $ | 37 | ||||
Core diluted earnings per common share (2) | $ | 0.39 | $ | 0.39 | ||||
(1) | Additional information on Redwood's non-GAAP measures, including: economic net interest income; core other fair value changes, net; core realized gains, net; core provision for income taxes; and core earnings as well as reconciliations to associated GAAP measures, is included in the Non-GAAP Measurements section of the Appendix. |
(2) | Additional information on the calculation of non-GAAP core diluted EPS can be found in Table 2 in the Financial Tables section of this Redwood Review. |
THE REDWOOD REVIEW I 4TH QUARTER 2018 |
7 |
Q U A R T E R L Y O V E R V I E W |
Ñ | Net interest income from our investment portfolio increased in the fourth quarter, benefiting from our elevated pace of capital deployment during the past six months. This increase was offset by lower net interest income from our mortgage banking business as loan purchase volume decreased in the fourth quarter. We note that gross interest income and interest expense increased meaningfully from the third to fourth quarter of 2018, primarily due to the consolidation of several securitizations we invested in during the second half of 2018. |
Ñ | Mortgage banking activities, net, was $11 million for the fourth quarter of 2018, consistent with the third quarter of 2018. Our ability to utilize both securitization and whole loan sale execution in recent quarters has helped us maintain more consistent gross margins, amidst declines in volume across the industry and an increasingly competitive landscape. |
Ñ | Investment fair value changes in both our loan and securities portfolios were negatively impacted by credit spread widening late in the fourth quarter. Our non-GAAP core earnings excludes these market valuation adjustments and was not impacted by these changes. |
Ñ | Realized gains in the third quarter were $6 million on a GAAP basis and $9 million on a non-GAAP core basis, resulting from the sale of $115 million of securities, which freed up $58 million of capital for reinvestment after the repayment of associated debt. |
Ñ | Operating expenses decreased to $19 million in the fourth quarter of 2018 from $21 million in the third quarter of 2018, primarily resulting from lower variable compensation expense commensurate with lower GAAP earnings in the fourth quarter. This decrease was partially offset by initial set-up costs associated with certain of our new investments made during the quarter. |
Ñ | Income tax provision decreased to a benefit of $1 million during the fourth quarter of 2018, from a provision of $5 million for the third quarter of 2018, primarily due to spread widening during the fourth quarter on securities held at our taxable subsidiary. A reconciliation of GAAP and taxable income is set forth in Table 6 in the Financial Tables section of this Redwood Review. |
Ñ | Additional details on our earnings are included in the Segment Results section that follows. |
THE REDWOOD REVIEW I 4TH QUARTER 2018 |
8 |
Q U A R T E R L Y O V E R V I E W |
Investment Portfolio Segment Contribution | ||||||||
($ in millions) | ||||||||
Three Months Ended | ||||||||
12/31/2018 | 9/30/2018 | |||||||
GAAP net interest income | $ | 40 | $ | 39 | ||||
Change in basis and hedge expense | (1 | ) | (2 | ) | ||||
Non-GAAP economic net interest income (1) | 39 | 37 | ||||||
Non-GAAP other fair value changes, net (2) | (37 | ) | 12 | |||||
Other income, net | 4 | 3 | ||||||
Realized gains, net | 6 | 7 | ||||||
Operating expenses | (4 | ) | (3 | ) | ||||
Benefit from (provision for) income taxes | 1 | (3 | ) | |||||
Segment contribution (3) | $ | 9 | $ | 54 | ||||
Core earnings adjustments (4) | ||||||||
Eliminate mark-to-market changes on long-term investments and associated derivatives | 37 | (12 | ) | |||||
Include cumulative gain (loss) on long-term investments sold, net | 4 | 8 | ||||||
Income taxes associated with core earnings adjustments | (2 | ) | — | |||||
Non-GAAP core segment contribution | $ | 47 | $ | 50 | ||||
(1) | Consistent with management's definition of non-GAAP economic net interest income set forth in the Non-GAAP Measurements section of the Appendix, this measure, as presented above, is calculated in the same manner, inclusive only of amounts allocable to this segment. |
(2) | Non-GAAP other fair value changes, net, represents GAAP investment fair value changes adjusted to exclude the change in basis and hedge expense that is presented in the table above and included in non-GAAP economic net interest income. |
(3) | Segment contribution totals above are presented in accordance with GAAP. Within the table, "change in basis and hedge expense" has been reallocated between investment fair value changes and net interest income as described above. |
(4) | Consistent with management's definition of core earnings set forth on page 35, non-GAAP core segment contribution reflects GAAP segment contribution adjusted to reflect the portion of core earnings adjustments allocable to this segment. |
Ñ | Segment contribution from our investment portfolio declined during the fourth quarter, as the increase in non-GAAP economic net interest income from net capital deployment was more than offset by the negative impact from spread widening on our investments. |
Ñ | Despite recent credit spread widening, credit fundamentals in our investment portfolio remain strong, benefiting from continued stability in the general economy and in housing. |
* | We report on our business using two distinct segments: Investment Portfolio and Mortgage Banking. Table 3 in the Financial Tables section of this Redwood Review includes a comprehensive presentation of our segment results reconciled to net income. |
THE REDWOOD REVIEW I 4TH QUARTER 2018 |
9 |
Q U A R T E R L Y O V E R V I E W |
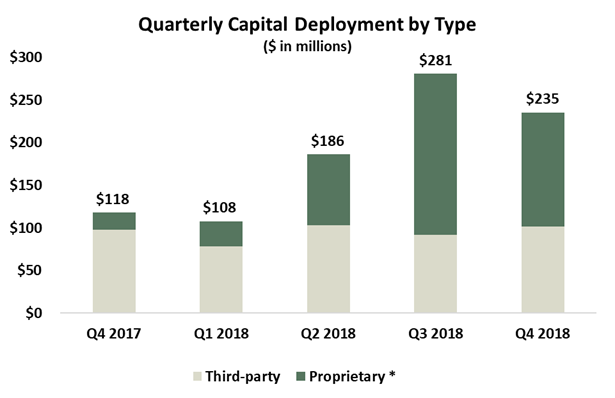
Ñ | We deployed $133 million of capital into proprietary investments in the fourth quarter, including $98 million into excess servicing investments, $30 million to complete an investment in securities backed by seasoned re-performing loans, and $5 million into Sequoia RMBS. |
Ñ | We deployed $102 million into third-party investments in the fourth quarter, including $52 million into a multifamily b-piece investment, $16 million of residential securities, $22 million of Agency CRT securities, and $12 million of Agency multifamily securities. |
Ñ | One of our excess servicing investments required us to consolidate $303 million of servicing-related assets and $263 million of short-term non-recourse securitization debt used to finance the servicing advances on our balance sheet in the fourth quarter. We expect to settle additional portions of this investment in the first quarter of 2019, further increasing our consolidated assets and non-recourse securitization debt. |
Ñ | Our $30 million investment in seasoned re-performing loans during the fourth quarter represented the remaining portion of an $87 million investment that was partially funded with a $58 million deposit at the end of the third quarter. This transaction ("Freddie Mac SLST") required us to consolidate $1.2 billion of residential loans and $1.0 billion of non-recourse securitization debt on our balance sheet in the fourth quarter. |
THE REDWOOD REVIEW I 4TH QUARTER 2018 |
10 |
Q U A R T E R L Y O V E R V I E W |
Mortgage Banking Segment Contribution | ||||||||
($ in millions) | ||||||||
Three Months Ended | ||||||||
12/31/2018 | 9/30/2018 | |||||||
Net interest income | $ | 5 | $ | 7 | ||||
Mortgage banking activities, net | 11 | 11 | ||||||
Mortgage banking income | 16 | 18 | ||||||
Operating expenses | (7 | ) | (7 | ) | ||||
Provision for income taxes | — | (2 | ) | |||||
Segment contribution | $ | 9 | $ | 9 | ||||
Loan purchase commitments | $ | 1,252 | $ | 1,457 | ||||
Ñ | Segment contribution from our mortgage banking business in the fourth quarter of 2018 was consistent with the third quarter of 2018 as a decrease in mortgage banking income from lower volumes and consistent margins was offset by a lower tax provision. We define gross margins for this segment as mortgage banking income divided by loan purchase commitments. |
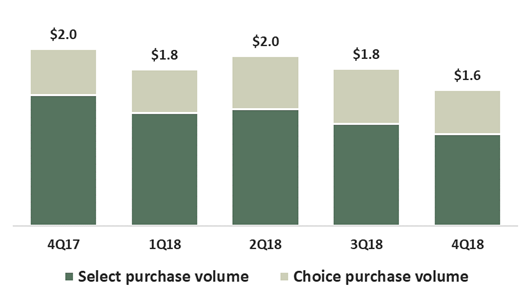
Ñ | Jumbo residential loan purchase volumes in the fourth quarter of 2018, as presented above, decreased 13% from the prior quarter and 20% from the same quarter last year. At December 31, 2018, our pipeline of jumbo residential loans identified for purchase was $0.5 billion. |
Ñ | During the fourth quarter of 2018, we completed $1.3 billion of jumbo residential loan sales, including one Select securitization of $0.5 billion and $0.8 billion of whole loan sales to third parties. |
THE REDWOOD REVIEW I 4TH QUARTER 2018 |
11 |
Q U A R T E R L Y O V E R V I E W |
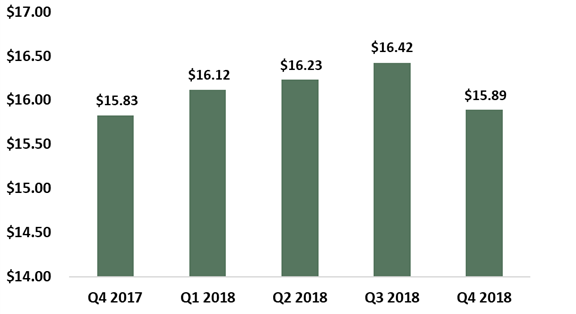
Ñ | Our GAAP book value declined $0.53 per share to $15.89 per share during the fourth quarter of 2018. This decline was primarily due to negative market valuation adjustments that drove a GAAP loss for the quarter, a decrease in the value of derivatives hedging our long-term debt, and dilution from annual equity awards distributed in the fourth quarter. |
Ñ | The decline in book value per share in the fourth quarter of 2018 contributed to an economic return on book value(2) of negative (1.4)% for the quarter and a full-year economic return on book value of 7.8%. |
Ñ | As housing credit investors, we employ hedging strategies that seek to minimize our exposure to interest rates, and our book value is most sensitive to changes in actual and perceived credit performance, credit spreads, and the outlook for economic growth. While interest rates have been volatile over the past several quarters, we have also seen strong economic growth and housing credit performance, which has generally supported strong book value performance for Redwood during that time. |
(2) | Economic return on book value is based on the periodic change in GAAP book value per common share plus dividends declared per common share during the period. |
THE REDWOOD REVIEW I 4TH QUARTER 2018 |
12 |
Q U A R T E R L Y O V E R V I E W |
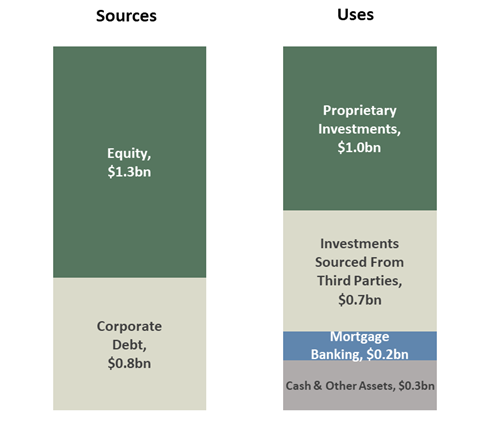
Ñ | Our total capital of $2.1 billion at December 31, 2018 was comprised of $1.3 billion of equity capital and $0.8 billion of convertible notes and other long-term debt, including $201 million of exchangeable debt due in 2019, $245 million of convertible debt due in 2023, $200 million of convertible debt due in 2024, and $140 million of trust-preferred securities due in 2037, and has a weighted average cost of approximately 6.1%. |
Ñ | We also utilize various forms of collateralized debt to finance certain investments and to warehouse our inventory of certain residential loans held-for-sale. We do not consider this collateralized debt as "capital" and, therefore, exclude it from our capital allocation analysis. |
Ñ | The Balance Sheet Analysis portion of the Financial Insights section that follows describes our long-term and short-term borrowings in further detail. |
THE REDWOOD REVIEW I 4TH QUARTER 2018 |
13 |
Q U A R T E R L Y O V E R V I E W |
Capital Allocation Detail | ||||||||||||||
By Investment Type | ||||||||||||||
December 31, 2018 | ||||||||||||||
($ in millions) | ||||||||||||||
GAAP Fair Value | Collateralized Debt | Allocated Capital | % of Total Capital | |||||||||||
Residential loans (1) | $ | 2,427 | $ | (2,000 | ) | $ | 427 | 20% | ||||||
Securities portfolio | ||||||||||||||
Third-party residential securities | 610 | (266 | ) | 344 | 16% | |||||||||
Re-performing residential loan securities (2) | 351 | (184 | ) | 166 | 8% | |||||||||
Sequoia residential securities | 486 | (180 | ) | 306 | 14% | |||||||||
Multifamily securities | 555 | (360 | ) | 194 | 9% | |||||||||
Total securities portfolio (3) | 2,001 | (989 | ) | 1,012 | 48% | |||||||||
Business purpose loans | 113 | (66 | ) | 46 | 2% | |||||||||
Other investments | 439 | (263 | ) | 176 | 8% | |||||||||
Other assets/(liabilities) | 200 | (86 | ) | 113 | 5% | |||||||||
Cash and liquidity capital | 176 | N/A | ||||||||||||
Total Investments | $ | 5,179 | $ | (3,404 | ) | $ | 1,951 | 92% | ||||||
Mortgage banking | $ | 170 | 8% | |||||||||||
Total | $ | 2,121 | 100% | |||||||||||
(1) | Includes $43 million of FHLB stock. |
(2) | Re-performing residential loan securities represent third-party securities collateralized by seasoned re-performing residential loans. |
(3) | In addition to our $1.5 billion of securities on our GAAP balance sheet, securities presented above also include $194 million, $229 million, and $126 million of securities retained from Sequoia Choice, Freddie Mac SLST, and Freddie Mac K-Series securitizations, respectively. For GAAP purposes, we consolidate these securitizations. |
Ñ | During the fourth quarter of 2018, we continued to optimize our portfolio by selling appreciated, lower-yielding securities and deploying capital into higher-yielding alternatives, including into new initiatives. (See Tables 8 and 9 in the Financial Tables section for additional detail on asset activity and balances.) |
Ñ | During the fourth quarter of 2018, we reallocated capital from our mortgage banking business to our investment portfolio, leveraging operational changes that will allow us to manage our mortgage banking business with less capital. |
Ñ | As of December 31, 2018, our cash and liquidity capital included $85 million of capital available for investment. |
THE REDWOOD REVIEW I 4TH QUARTER 2018 |
14 |
Q U A R T E R L Y O V E R V I E W |
Ñ | We expect to allocate over 90% of our capital towards portfolio investments and generate returns on equity of 11-13%. Investment returns include an estimate of net interest income, hedging costs, the effect of principal paydowns, realized gains, direct operating expenses, and taxes. |
Ñ | Our return range incorporates the potential variability in timing of our capital deployment (partially impacted by the timing of subsequent larger investments) and the associated returns, as well as the gains we may realize from portfolio sales. |
Ñ | We expect to allocate 6-7% of our capital to support our mortgage banking business, and to generate a return on equity in the mid-teens. Mortgage banking returns include an estimate of loan purchase volume, gross margins, direct operating expenses, and taxes. |
Ñ | Returns on our mortgage banking business will also be impacted by our ability to continue diversifying our loan distribution channels and improving distribution timelines. |
Ñ | We expect our baseline corporate operating expenses to be between $48 million and $50 million, with variable compensation commensurate with company performance. |
(1) | As with all forward-looking statements, our forward-looking statements relating to our 2019 financial outlook are subject to risks and uncertainties, including, among other things, those described in our Annual Report on Form 10-K under the caption “Risk Factors” and other risks, uncertainties, and factors that could cause actual results to differ materially from those described above and under the heading "Forward-Looking Statements" in the Appendix to this Redwood Review, including those described in the “Forward-Looking Statements” at the beginning of this Redwood Review. Although we may update our 2019 financial outlook subsequently in 2019, as a general matter we undertake no obligation to update or revise forward-looking statements, whether as a result of new information, future events, or otherwise. |
THE REDWOOD REVIEW I 4TH QUARTER 2018 |
15 |
F I N A N C I A L I N S I G H T S |
Consolidated Balance Sheets (1) | ||||||||
($ in millions) | ||||||||
12/31/2018 | 9/30/2018 | |||||||
Residential loans | $ | 7,255 | $ | 5,922 | ||||
Business purpose loans | 141 | 116 | ||||||
Multifamily loans | 2,145 | 942 | ||||||
Real estate securities | 1,452 | 1,470 | ||||||
Other investments | 439 | 114 | ||||||
Cash and cash equivalents | 176 | 174 | ||||||
Other assets | 330 | 402 | ||||||
Total assets | $ | 11,937 | $ | 9,140 | ||||
Short-term debt | ||||||||
Mortgage loan warehouse debt | $ | 861 | $ | 578 | ||||
Security repurchase facilities | 989 | 781 | ||||||
Business purpose loan warehouse facilities | 88 | 65 | ||||||
Servicer advance financing | 263 | — | ||||||
Convertible notes, net | 200 | — | ||||||
Other liabilities | 206 | 176 | ||||||
Asset-backed securities issued | ||||||||
Residential | 3,391 | 2,531 | ||||||
Multifamily | 2,019 | 876 | ||||||
Long-term debt, net | 2,572 | 2,771 | ||||||
Total liabilities | 10,589 | 7,778 | ||||||
Stockholders’ equity | 1,349 | 1,361 | ||||||
Total liabilities and equity | $ | 11,937 | $ | 9,140 | ||||
(1) | Our consolidated balance sheets include assets of consolidated variable interest entities (“VIEs”) that can only be used to settle obligations of these VIEs and liabilities of consolidated VIEs for which creditors do not have recourse to the primary beneficiary (Redwood Trust, Inc.). At December 31, 2018 and September 30, 2018, assets of consolidated VIEs totaled $6.3 billion and $3.7 billion, respectively, and liabilities of consolidated VIEs totaled $5.7 billion and $3.4 billion, respectively. See Table 10 in the Financial Tables section of this Redwood Review for additional detail on consolidated VIEs. |
Ñ | During the fourth quarter of 2018, we invested in the subordinate bonds of an Agency multifamily securitization and a re-performing loan securitization that we were required to consolidate under GAAP. Additionally, we invested in excess servicing assets that required us to consolidate servicing-related assets and liabilities, including $263 million of non-recourse securitization debt. See Table 9 in the Financial Tables section of this Redwood Review for additional information on these securitizations. |
THE REDWOOD REVIEW I 4TH QUARTER 2018 |
16 |
F I N A N C I A L I N S I G H T S |
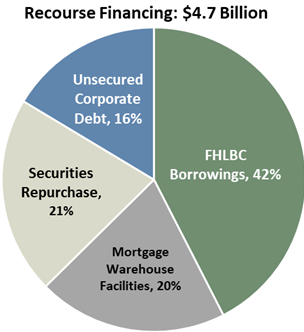 | |||
Borrowing Type | Average Cost of Funds | Average Remaining Term (yrs.) | |
FHLBC Borrowings | 2.5% | 7 | |
Unsecured Corporate Debt | 6.1% | 6 | |
Mortgage Warehouse | 4.2% | <1 | |
Securities Repurchase | 3.4% | <1 | |
Weighted Average Cost of Funds | 3.6% | ||
Ñ | Our long-term unsecured corporate debt is comprised of $200 million of 5.625% convertible notes due in 2024, $245 million of 4.75% convertible notes due in 2023, $201 million of 5.625% exchangeable notes due in 2019, and $140 million of trust-preferred securities due in 2037 (that we hedge to yield approximately 6.9%). |
Ñ | Our FHLBC borrowings and securities repurchase debt are used to finance our whole loan and securities investments, respectively, and we utilize mortgage warehouse facilities to finance our mortgage banking activities. These are discussed in further detail in the following sections. |
Ñ | Our recourse debt to equity leverage ratio was 3.5x at the end of the fourth quarter of 2018, an increase from 3.1x at the end of the third quarter. (1) |
Ñ | In addition to our recourse financing, we have non-recourse ABS debt issued by securitization entities and other non-recourse short-term securitization debt that we consolidate. |
(1) | See Table 7 in the Financial Tables section of this Redwood Review for details of how our recourse debt to equity leverage ratio is calculated. |
THE REDWOOD REVIEW I 4TH QUARTER 2018 |
17 |
F I N A N C I A L I N S I G H T S |
Ñ | At December 31, 2018, we had $2.4 billion of residential loans held-for-investment. These loans are prime-quality, first lien jumbo loans, most of which were originated between 2013 and 2018. At December 31, 2018, 87% of these loans were fixed-rate and the remainder were hybrid, and in aggregate, had a weighted average coupon of 4.14%. |
Ñ | At December 31, 2018, the weighted average FICO score of borrowers backing these loans was 768 (at origination) and the weighted average loan-to-value ("LTV") ratio of these loans was 66% (at origination). At December 31, 2018, 0.03% of these loans (by unpaid principal balance) were more than 90 days delinquent. |
Ñ | We finance our residential loan investments with $2.0 billion of FHLB debt through our FHLB-member subsidiary. The interest cost for these borrowings resets every 13 weeks, and we seek to effectively fix the interest cost of this debt over its weighted average maturity by using a combination of swaps, TBAs, and other derivative instruments. |
Ñ | In connection with these borrowings, our FHLB-member subsidiary is required to hold $43 million of FHLB stock. |
Ñ | At December 31, 2018, our $113 million of business purpose loans held-for-investment were comprised of short-term, residential bridge loans, most of which were originated in 2018. At December 31, 2018, the portfolio contained 157 loans with a weighted average coupon of 9.16%, and a weighted average LTV ratio of 76% (at origination). At December 31, 2018, seven of these loans with a cumulative unpaid principal balance of $12 million were more than 90 days delinquent. These loans had a weighted average current LTV ratio of 82% (at origination), and we currently expect to recover the full carrying amount of these loans. |
Ñ | We finance our business purpose loan investments with warehouse debt that had a balance of $66 million at December 31, 2018. |
Ñ | At December 31, 2018, we had $439 million of other investments, primarily comprised of $313 million of investments in excess servicing assets ($57 million of capital invested, net of non-recourse securitization debt collateralized by servicing-related assets and other consolidated assets and liabilities), $60 million of MSRs retained from our Sequoia securitizations, $40 million of investments in customized financing for our jumbo loan sellers, and our minority investment in 5 Arches. |
THE REDWOOD REVIEW I 4TH QUARTER 2018 |
18 |
F I N A N C I A L I N S I G H T S |
Securities Portfolio - By Source and Security Type | |||||||||||||||||||||||
December 31, 2018 | |||||||||||||||||||||||
($ in millions) | |||||||||||||||||||||||
Interest-Only Securities | Senior | Mezzanine | Subordinate | Total | % of Total Securities | ||||||||||||||||||
Sequoia (1) | $ | 77 | $ | — | $ | 234 | $ | 175 | $ | 486 | 24 | % | |||||||||||
Third Party New Issue (2) | 45 | 77 | 171 | 325 | 618 | 31 | % | ||||||||||||||||
Third Party Legacy (2) | 2 | 88 | — | 16 | 105 | 5 | % | ||||||||||||||||
Agency CRT (3) | — | — | — | 238 | 238 | 12 | % | ||||||||||||||||
Total residential securities | $ | 123 | $ | 165 | $ | 405 | $ | 754 | $ | 1,447 | 72 | % | |||||||||||
Multifamily securities (3)(4) | — | — | 447 | 108 | 555 | 28 | % | ||||||||||||||||
Total securities portfolio | $ | 123 | $ | 165 | $ | 852 | $ | 862 | $ | 2,001 | 100 | % | |||||||||||
(1) | Presents securities retained from our Sequoia securitizations that were issued from 2012 through 2018. These securities included $15 million of interest-only securities, $134 million of mezzanine securities, and $45 million of subordinate securities retained from our Sequoia Choice securitizations, which were consolidated for GAAP purposes. |
(2) | Presents RMBS issued by third parties after 2012 as New Issue and prior to 2008 as Legacy. New issue securities include $229 million of subordinate securities issued from an Agency residential securitization that is consolidated for GAAP purposes. |
(3) | Agency CRT and Multifamily securities were issued after 2012. |
(4) | Multifamily securities include $18 million of mezzanine securities and $108 million of subordinate securities issued from Agency multifamily securitizations that are consolidated for GAAP purposes. |
THE REDWOOD REVIEW I 4TH QUARTER 2018 |
19 |
F I N A N C I A L I N S I G H T S |
Real Estate Securities Financed with Repurchase Debt | |||||||||||||||||||
December 31, 2018 | |||||||||||||||||||
($ in millions, except weighted average price) | |||||||||||||||||||
Real Estate Securities (3) | Repurchase Debt | Allocated Capital | Weighted Average Price (1) | Financing Haircut (2) | |||||||||||||||
Residential securities | |||||||||||||||||||
Senior | $ | 148 | $ | (133 | ) | $ | 15 | $ | 99 | 10 | % | ||||||||
Mezzanine | 369 | (311 | ) | 57 | 97 | 16 | % | ||||||||||||
Subordinate | 258 | (185 | ) | 73 | 74 | 28 | % | ||||||||||||
Total residential securities | 774 | (629 | ) | 145 | |||||||||||||||
Multifamily securities | 447 | (360 | ) | 87 | 94 | 19 | % | ||||||||||||
Total | $ | 1,221 | $ | (989 | ) | $ | 232 | $ | 90 | 19 | % | ||||||||
(1) | GAAP fair value per $100 of principal. |
(2) | Allocated capital divided by GAAP fair value. |
(3) | Includes $130 million, $229 million, and $18 million of securities we owned that were issued by consolidated Sequoia Choice, Freddie Mac SLST, and Freddie Mac K-Series securitizations, respectively. |
Ñ | In addition to the allocated capital listed in the table above that directly supports our repurchase facilities (i.e., “the haircut”), we continue to hold a designated amount of supplemental risk capital available for potential margin calls or future obligations relating to these facilities. |
Ñ | At December 31, 2018, we had securities repurchase facilities with eight different counterparties. |
Ñ | Additional information on the residential securities we own is set forth in Table 9 in the Financial Tables section of this Redwood Review. |
THE REDWOOD REVIEW I 4TH QUARTER 2018 |
20 |
F I N A N C I A L I N S I G H T S |
Ñ | At December 31, 2018, we had $1.0 billion of residential mortgages held-for-sale financed with $861 million of warehouse debt. These loans included $863 million of Select loans, and $186 million of expanded-prime Choice loans. |
Ñ | Our warehouse capacity at December 31, 2018 totaled $1.4 billion across four separate counterparties. |
Ñ | At December 31, 2018, our pipeline of jumbo residential loans identified for purchase was $0.5 billion. |
Ñ | We seek to minimize the exposure we have to interest rates on our loan pipeline (for loans both on balance sheet and identified for purchase) by using a combination of TBAs, interest rate swaps, and other derivative instruments. |
Ñ | At December 31, 2018, we had 501 loan sellers, which included 191 jumbo sellers and 310 MPF Direct sellers from various FHLB districts. |
Ñ | At December 31, 2018, we had $28 million of business purpose loans held-for-sale, collateralized by single-family rental properties. |
Ñ | At December 31, 2018, the weighted average coupon on these loans was 5.9% and the LTV ratio was 64% (at origination). |
Ñ | We financed these loans with $22 million of short-term warehouse debt. |
THE REDWOOD REVIEW I 4TH QUARTER 2018 |
21 |
G L O S S A R Y |

THE REDWOOD REVIEW I 4TH QUARTER 2018 |
22 |
 | Table 1: GAAP Earnings (in thousands, except per share data) | |||||||||||||||||||||||||||||||||||||||||
2018 Q4 | 2018 Q3 | 2018 Q2 | 2018 Q1 | 2017 Q4 | 2017 Q3 | 2017 Q2 | 2017 Q1 | Twelve Months 2018 | Twelve Months 2017 | |||||||||||||||||||||||||||||||||
Interest income | $ | 116,858 | $ | 96,074 | $ | 79,128 | $ | 72,559 | $ | 67,370 | $ | 58,106 | $ | 54,419 | $ | 49,367 | $ | 364,619 | $ | 229,262 | ||||||||||||||||||||||
Discount amortization on securities, net | 2,867 | 3,323 | 3,848 | 4,060 | 4,098 | 4,631 | 4,805 | 5,261 | 14,098 | 18,795 | ||||||||||||||||||||||||||||||||
Total interest income | 119,725 | 99,397 | 82,976 | 76,619 | 71,468 | 62,737 | 59,224 | 54,628 | 378,717 | 248,057 | ||||||||||||||||||||||||||||||||
Interest expense on short-term debt | (16,567 | ) | (14,146 | ) | (12,666 | ) | (10,424 | ) | (9,841 | ) | (7,158 | ) | (6,563 | ) | (4,453 | ) | (53,803 | ) | (28,015 | ) | ||||||||||||||||||||||
Interest expense on short-term convertible notes (1) | (1,594 | ) | — | (509 | ) | (3,011 | ) | (3,025 | ) | (3,024 | ) | (2,787 | ) | — | (5,114 | ) | (8,836 | ) | ||||||||||||||||||||||||
Interest expense on ABS issued from consolidated trusts | (44,258 | ) | (27,421 | ) | (16,349 | ) | (11,401 | ) | (7,917 | ) | (3,956 | ) | (3,705 | ) | (3,530 | ) | (99,429 | ) | (19,108 | ) | ||||||||||||||||||||||
Interest expense on long-term debt | (22,542 | ) | (22,784 | ) | (18,689 | ) | (16,678 | ) | (15,325 | ) | (13,305 | ) | (11,179 | ) | (13,048 | ) | (80,693 | ) | (52,857 | ) | ||||||||||||||||||||||
Total interest expense | (84,961 | ) | (64,351 | ) | (48,213 | ) | (41,514 | ) | (36,108 | ) | (27,443 | ) | (24,234 | ) | (21,031 | ) | (239,039 | ) | (108,816 | ) | ||||||||||||||||||||||
Net interest income | 34,764 | 35,046 | 34,763 | 35,105 | 35,360 | 35,294 | 34,990 | 33,597 | 139,678 | 139,241 | ||||||||||||||||||||||||||||||||
Non-interest income | ||||||||||||||||||||||||||||||||||||||||||
Mortgage banking activities, net | 11,170 | 11,224 | 10,596 | 26,576 | 3,058 | 21,200 | 12,046 | 17,604 | 59,566 | 53,908 | ||||||||||||||||||||||||||||||||
Investment fair value changes, net | (38,519 | ) | 10,332 | 889 | 1,609 | 384 | 324 | 8,115 | 1,551 | (25,689 | ) | 10,374 | ||||||||||||||||||||||||||||||
Realized gains, net | 5,689 | 7,275 | 4,714 | 9,363 | 4,546 | 1,734 | 1,372 | 5,703 | 27,041 | 13,355 | ||||||||||||||||||||||||||||||||
Other income, net | 3,981 | 3,453 | 3,322 | 2,118 | 2,963 | 2,812 | 3,764 | 2,897 | 12,874 | 12,436 | ||||||||||||||||||||||||||||||||
Total non-interest income (loss), net | (17,679 | ) | 32,284 | 19,521 | 39,666 | 10,951 | 26,070 | 25,297 | 27,755 | 73,792 | 90,073 | |||||||||||||||||||||||||||||||
Fixed compensation expense | (6,309 | ) | (5,922 | ) | (5,775 | ) | (6,439 | ) | (5,555 | ) | (5,233 | ) | (5,321 | ) | (6,002 | ) | (24,445 | ) | (22,111 | ) | ||||||||||||||||||||||
Variable compensation expense | (934 | ) | (4,923 | ) | (1,825 | ) | (6,907 | ) | (5,861 | ) | (6,467 | ) | (4,313 | ) | (3,933 | ) | (14,589 | ) | (20,574 | ) | ||||||||||||||||||||||
Equity compensation expense | (2,823 | ) | (3,033 | ) | (3,835 | ) | (2,697 | ) | (2,507 | ) | (2,337 | ) | (3,121 | ) | (2,176 | ) | (12,388 | ) | (10,141 | ) | ||||||||||||||||||||||
Loan acquisition costs | (1,837 | ) | (1,887 | ) | (2,155 | ) | (1,818 | ) | (1,625 | ) | (1,187 | ) | (1,005 | ) | (1,205 | ) | (7,697 | ) | (5,022 | ) | ||||||||||||||||||||||
Other operating expense | (7,350 | ) | (5,725 | ) | (5,419 | ) | (5,169 | ) | (4,819 | ) | (4,698 | ) | (4,881 | ) | (4,910 | ) | (23,663 | ) | (19,308 | ) | ||||||||||||||||||||||
Total operating expenses | (19,253 | ) | (21,490 | ) | (19,009 | ) | (23,030 | ) | (20,367 | ) | (19,922 | ) | (18,641 | ) | (18,226 | ) | (82,782 | ) | (77,156 | ) | ||||||||||||||||||||||
Benefit from (provision for) income taxes | 1,255 | (4,919 | ) | (2,528 | ) | (4,896 | ) | 4,989 | (5,262 | ) | (5,322 | ) | (6,157 | ) | (11,088 | ) | (11,752 | ) | ||||||||||||||||||||||||
Net (loss) income | $ | (913 | ) | $ | 40,921 | $ | 32,747 | $ | 46,845 | $ | 30,933 | $ | 36,180 | $ | 36,324 | $ | 36,969 | $ | 119,600 | $ | 140,406 | |||||||||||||||||||||
Diluted average shares (2) | 83,217 | 114,683 | 100,432 | 108,195 | 109,621 | 102,703 | 97,494 | 97,946 | 110,028 | 101,975 | ||||||||||||||||||||||||||||||||
Diluted (loss) earnings per common share | $ | (0.02 | ) | $ | 0.42 | $ | 0.38 | $ | 0.50 | $ | 0.35 | $ | 0.41 | $ | 0.43 | $ | 0.43 | $ | 1.34 | $ | 1.60 | |||||||||||||||||||||
Supplemental information: | ||||||||||||||||||||||||||||||||||||||||||
Net interest income | $ | 34,764 | $ | 35,046 | $ | 34,763 | $ | 35,105 | $ | 35,360 | $ | 35,294 | $ | 34,990 | $ | 33,597 | $ | 139,678 | $ | 139,241 | ||||||||||||||||||||||
Change in basis of fair value investments | (2,015 | ) | (2,458 | ) | (2,465 | ) | (2,875 | ) | (4,097 | ) | (3,058 | ) | (1,898 | ) | (3,318 | ) | (9,813 | ) | (12,371 | ) | ||||||||||||||||||||||
Interest component of hedges | 857 | 550 | 22 | (2,884 | ) | (2,927 | ) | (2,909 | ) | (3,768 | ) | (3,693 | ) | (1,455 | ) | (13,297 | ) | |||||||||||||||||||||||||
Non-GAAP economic net interest income | $ | 33,606 | $ | 33,138 | $ | 32,320 | $ | 29,346 | $ | 28,336 | $ | 29,327 | $ | 29,324 | $ | 26,586 | $ | 128,410 | $ | 113,573 | ||||||||||||||||||||||
(1) | At December 31, 2018 and 2017, represents interest expense on $201 million of exchangeable notes and $250 million of convertible notes, respectively, that were reclassified from Long-term debt to Short-term debt as the maturity of the notes was less than one year as of the dates presented. The convertible notes were repaid in April 2018. |
(2) | Diluted average shares includes shares from the assumed conversion of our convertible and/or exchangeable debt in certain periods, in accordance with GAAP diluted EPS provisions. See Table 2 that follows for details of this calculation for the current and prior quarter and our respective Quarterly Reports on Form 10-Q and Annual Reports on Form 10-K for prior periods. |
THE REDWOOD REVIEW I 4TH QUARTER 2018 | Table 1: GAAP Earnings 23 | |
| Table 2: GAAP and Non-GAAP Core Basic and Diluted Earnings (1) per Common Share (in thousands, except per share data) | |||||||||||||||||
2018 Q4 | 2018 Q3 | Twelve Months 2018 | Twelve Months 2017 | |||||||||||||||
GAAP Earnings per Common Share ("EPS"): | ||||||||||||||||||
Net (loss) income attributable to Redwood | $ | (913 | ) | $ | 40,921 | $ | 119,600 | $ | 140,406 | |||||||||
Less: Dividends and undistributed earnings allocated to participating securities | (834 | ) | (1,231 | ) | (3,754 | ) | (3,632 | ) | ||||||||||
Net (loss) income allocated to common shareholders for GAAP basic EPS | (1,747 | ) | 39,690 | 115,846 | 136,774 | |||||||||||||
Incremental adjustment to dividends and undistributed earnings allocated to participating securities | — | (53 | ) | (529 | ) | (204 | ) | |||||||||||
Add back: Interest expense on convertible notes for the period, net of tax (2) | — | 8,666 | 32,653 | 26,898 | ||||||||||||||
Net (loss) income allocated to common shareholders for GAAP diluted EPS | $ | (1,747 | ) | $ | 48,303 | $ | 147,970 | $ | 163,468 | |||||||||
Basic weighted average common shares outstanding | 83,217 | 80,797 | 78,725 | 76,793 | ||||||||||||||
Net effect of dilutive equity awards | — | 443 | 189 | 185 | ||||||||||||||
Net effect of assumed convertible notes conversion to common shares (2) | — | 33,443 | 31,114 | 24,997 | ||||||||||||||
Diluted weighted average common shares outstanding | 83,217 | 114,683 | 110,028 | 101,975 | ||||||||||||||
GAAP Basic Earnings per Common Share | $ | (0.02 | ) | $ | 0.49 | $ | 1.47 | $ | 1.78 | |||||||||
GAAP Diluted Earnings per Common Share | $ | (0.02 | ) | $ | 0.42 | $ | 1.34 | $ | 1.60 | |||||||||
Non-GAAP Core Earnings per Common Share: | ||||||||||||||||||
Non-GAAP core earnings | $ | 37,592 | $ | 36,691 | $ | 168,287 | $ | 119,281 | ||||||||||
Less: Dividends and undistributed earnings allocated to participating securities | (1,178 | ) | (1,101 | ) | (5,243 | ) | (3,330 | ) | ||||||||||
Non-GAAP core earnings allocated to common shareholders for core basic EPS | 36,414 | 35,590 | 163,044 | 115,951 | ||||||||||||||
Incremental adjustment to dividends and undistributed earnings allocated to participating securities | (89 | ) | (91 | ) | (114 | ) | (446 | ) | ||||||||||
Add back: Interest expense on convertible notes for the period, net of tax (2) | 8,676 | 8,666 | 32,653 | 26,898 | ||||||||||||||
Non-GAAP core earnings allocated to common shareholders for core diluted EPS | $ | 45,001 | $ | 44,165 | $ | 195,583 | $ | 142,403 | ||||||||||
Basic weighted average common shares outstanding | 83,217 | 80,797 | 78,725 | 76,793 | ||||||||||||||
Net effect of dilutive equity awards | 1 | 443 | 189 | 185 | ||||||||||||||
Net effect of assumed convertible notes conversion to common shares (2) | 33,443 | 33,443 | 31,114 | 24,997 | ||||||||||||||
Diluted weighted average common shares outstanding | 116,661 | 114,683 | 110,028 | 101,975 | ||||||||||||||
Non-GAAP Core Basic Earnings per Common Share | $ | 0.44 | $ | 0.44 | $ | 2.07 | $ | 1.51 | ||||||||||
Non-GAAP Core Diluted Earnings per Common Share | $ | 0.39 | $ | 0.39 | $ | 1.78 | $ | 1.40 | ||||||||||
(1) | A reconciliation of GAAP net income to non-GAAP core earnings and a definition of core earnings is included in the Non-GAAP Measurements section of the Appendix. |
(2) | Certain convertible notes were determined to be dilutive in the periods presented and were included in the calculations of diluted EPS under the "if-converted" method. Under this method, the periodic interest expense (net of applicable taxes) for dilutive notes is added back to the numerator and the number of shares that the notes are entitled to (if converted, regardless of whether they are in or out of the money) are included in the denominator. |
THE REDWOOD REVIEW I 4TH QUARTER 2018 | Table 2: GAAP and Non-GAAP Core Earnings per Basic and Diluted Common Share 24 | |
| Table 3: Segment Results ($ in thousands) | ||||||||||||||||||||||||||||||||||||||||
2018 Q4 | 2018 Q3 | 2018 Q2 | 2018 Q1 | 2017 Q4 | 2017 Q3 | 2017 Q2 | 2017 Q1 | Twelve Months 2018 | Twelve Months 2017 | ||||||||||||||||||||||||||||||||
Investment Portfolio | |||||||||||||||||||||||||||||||||||||||||
Net interest income | |||||||||||||||||||||||||||||||||||||||||
Residential loans | |||||||||||||||||||||||||||||||||||||||||
At Redwood | $ | 11,659 | $ | 12,478 | $ | 13,842 | $ | 15,842 | $ | 16,032 | $ | 16,916 | $ | 18,461 | $ | 18,448 | $ | 53,821 | $ | 69,857 | |||||||||||||||||||||
At consolidated Sequoia Choice entities | 3,608 | 2,880 | 2,002 | 1,386 | 836 | 22 | — | — | 9,876 | 858 | |||||||||||||||||||||||||||||||
At consolidated Freddie Mac SLST entity | 1,297 | — | — | — | — | — | — | — | 1,297 | — | |||||||||||||||||||||||||||||||
Business purpose loans | 1,861 | 974 | — | — | — | — | — | — | 2,835 | — | |||||||||||||||||||||||||||||||
Residential securities | 17,700 | 19,412 | 19,700 | 19,778 | 20,287 | 19,342 | 18,163 | 17,081 | 76,590 | 74,873 | |||||||||||||||||||||||||||||||
Multifamily and commercial investments | 3,296 | 2,209 | 1,860 | 1,888 | 1,749 | 1,298 | 1,978 | 1,457 | 9,253 | 6,482 | |||||||||||||||||||||||||||||||
Other investments | 913 | 751 | 161 | — | — | — | — | — | 1,825 | — | |||||||||||||||||||||||||||||||
Total net interest income | 40,334 | 38,704 | 37,565 | 38,894 | 38,904 | 37,578 | 38,602 | 36,986 | 155,497 | 152,070 | |||||||||||||||||||||||||||||||
Non-interest income | |||||||||||||||||||||||||||||||||||||||||
Investment fair value changes, net | (38,449 | ) | 10,566 | 1,600 | 1,590 | 4,568 | 1,372 | 9,115 | 3,359 | (24,693 | ) | 18,414 | |||||||||||||||||||||||||||||
Other income | 3,659 | 3,334 | 3,322 | 2,118 | 2,963 | 2,812 | 3,764 | 2,897 | 12,433 | 12,436 | |||||||||||||||||||||||||||||||
Realized gains | 5,689 | 7,275 | 4,714 | 9,363 | 4,546 | 1,734 | 2,124 | 5,703 | 27,041 | 14,107 | |||||||||||||||||||||||||||||||
Total non-interest income, net | (29,101 | ) | 21,175 | 9,636 | 13,071 | 12,077 | 5,918 | 15,003 | 11,959 | 14,781 | 44,957 | ||||||||||||||||||||||||||||||
Operating expenses | (3,833 | ) | (2,659 | ) | (1,858 | ) | (2,007 | ) | (1,657 | ) | (1,324 | ) | (1,454 | ) | (1,593 | ) | (10,357 | ) | (6,028 | ) | |||||||||||||||||||||
Benefit from (provision for) income taxes | 1,117 | (2,840 | ) | (1,130 | ) | (888 | ) | (838 | ) | (433 | ) | (2,320 | ) | (1,737 | ) | (3,741 | ) | (5,328 | ) | ||||||||||||||||||||||
Segment contribution | $ | 8,517 | $ | 54,380 | $ | 44,213 | $ | 49,070 | $ | 48,486 | $ | 41,739 | $ | 49,831 | $ | 45,615 | $ | 156,180 | $ | 185,671 | |||||||||||||||||||||
Mortgage Banking | |||||||||||||||||||||||||||||||||||||||||
Net interest income | $ | 5,015 | $ | 6,890 | $ | 5,455 | $ | 6,760 | $ | 6,887 | $ | 6,491 | $ | 4,012 | $ | 4,550 | $ | 24,120 | $ | 21,940 | |||||||||||||||||||||
Non-interest income | |||||||||||||||||||||||||||||||||||||||||
Mortgage banking activities | 11,170 | 11,224 | 10,596 | 26,576 | 3,058 | 21,200 | 12,046 | 17,604 | 59,566 | 53,908 | |||||||||||||||||||||||||||||||
Operating expenses | (7,231 | ) | (6,570 | ) | (5,739 | ) | (8,632 | ) | (7,104 | ) | (6,107 | ) | (6,021 | ) | (5,881 | ) | (28,172 | ) | (25,113 | ) | |||||||||||||||||||||
Benefit from (provision for) income taxes | 138 | (2,079 | ) | (1,398 | ) | (4,008 | ) | 5,827 | (4,829 | ) | (3,002 | ) | (4,420 | ) | (7,347 | ) | (6,424 | ) | |||||||||||||||||||||||
Segment contribution | $ | 9,092 | $ | 9,465 | $ | 8,914 | $ | 20,696 | $ | 8,668 | $ | 16,755 | $ | 7,035 | $ | 11,853 | $ | 48,167 | $ | 44,311 | |||||||||||||||||||||
Corporate/other | (18,522 | ) | (22,924 | ) | (20,380 | ) | (22,921 | ) | (26,221 | ) | (22,314 | ) | (20,542 | ) | (20,499 | ) | (84,747 | ) | (89,576 | ) | |||||||||||||||||||||
GAAP net (loss) income | $ | (913 | ) | $ | 40,921 | $ | 32,747 | $ | 46,845 | $ | 30,933 | $ | 36,180 | $ | 36,324 | $ | 36,969 | $ | 119,600 | $ | 140,406 | ||||||||||||||||||||
THE REDWOOD REVIEW I 4TH QUARTER 2018 | Table 3: Segment Results 25 | |
| Table 4: Segment Assets and Liabilities ($ in thousands) | ||||||||||||||||||||||||||||||||||
December 31, 2018 | September 30, 2018 | ||||||||||||||||||||||||||||||||||
Investment Portfolio | Mortgage Banking | Corporate/ Other | Total | Investment Portfolio | Mortgage Banking | Corporate/ Other | Total | ||||||||||||||||||||||||||||
Residential loans | |||||||||||||||||||||||||||||||||||
At Redwood | $ | 2,383,932 | $ | 1,048,801 | $ | — | $ | 3,432,733 | $ | 2,320,662 | $ | 866,444 | $ | — | $ | 3,187,106 | |||||||||||||||||||
At consolidated Sequoia entities | 2,079,382 | — | 519,958 | 2,599,340 | 2,181,195 | — | 553,958 | 2,735,153 | |||||||||||||||||||||||||||
At consolidated Freddie Mac SLST entity | 1,222,669 | — | — | 1,222,669 | — | — | — | — | |||||||||||||||||||||||||||
Business purpose loans | 112,798 | 28,460 | — | 141,258 | 95,515 | 20,105 | — | 115,620 | |||||||||||||||||||||||||||
Multifamily loans | 2,144,598 | — | — | 2,144,598 | 942,165 | — | — | 942,165 | |||||||||||||||||||||||||||
Real estate securities | 1,452,494 | — | — | 1,452,494 | 1,470,084 | — | — | 1,470,084 | |||||||||||||||||||||||||||
Other investments | 427,764 | — | 10,754 | 438,518 | 103,004 | — | 10,772 | 113,776 | |||||||||||||||||||||||||||
Cash and cash equivalents | 55,973 | 2,325 | 117,466 | 175,764 | 44,179 | 3,735 | 125,602 | 173,516 | |||||||||||||||||||||||||||
Other assets | 214,383 | 23,504 | 92,145 | 330,032 | 279,870 | 19,642 | 102,703 | 402,215 | |||||||||||||||||||||||||||
Total assets | $ | 10,093,993 | $ | 1,103,090 | $ | 740,323 | $ | 11,937,406 | $ | 7,436,674 | $ | 909,926 | $ | 793,035 | $ | 9,139,635 | |||||||||||||||||||
Short-term debt | |||||||||||||||||||||||||||||||||||
Mortgage loan warehouse debt | $ | — | $ | 860,650 | $ | — | $ | 860,650 | $ | — | $ | 578,157 | $ | — | $ | 578,157 | |||||||||||||||||||
Security repurchase facilities | 988,890 | — | — | 988,890 | 780,818 | — | — | 780,818 | |||||||||||||||||||||||||||
Business purpose loan warehouse facilities | 66,327 | 22,053 | — | 88,380 | 49,441 | 15,859 | — | 65,300 | |||||||||||||||||||||||||||
Servicer advance financing | 262,740 | — | — | 262,740 | — | — | — | — | |||||||||||||||||||||||||||
Convertible notes, net | — | — | 199,619 | 199,619 | — | — | — | — | |||||||||||||||||||||||||||
Other liabilities | 103,192 | 19,752 | 83,158 | 206,102 | 55,590 | 15,580 | 104,908 | 176,078 | |||||||||||||||||||||||||||
ABS issued | 4,897,833 | — | 512,240 | 5,410,073 | 2,862,062 | — | 544,923 | 3,406,985 | |||||||||||||||||||||||||||
Long-term debt, net | 1,999,999 | — | 572,159 | 2,572,158 | 1,999,999 | — | 770,971 | 2,770,970 | |||||||||||||||||||||||||||
Total liabilities | $ | 8,318,981 | $ | 902,455 | $ | 1,367,176 | $ | 10,588,612 | $ | 5,747,910 | $ | 609,596 | $ | 1,420,802 | $ | 7,778,308 | |||||||||||||||||||
THE REDWOOD REVIEW I 4TH QUARTER 2018 | Table 4: Segment Assets and Liabilities 26 | |
| Table 5: Changes in Book Value per Share ($ in per share) | ||||||||||||||||||||||||||||||||||||||||
2018 Q4 | 2018 Q3 | 2018 Q2 | 2018 Q1 | 2017 Q4 | 2017 Q3 | 2017 Q2 | 2017 Q1 | Twelve Months 2018 | Twelve Months 2017 | ||||||||||||||||||||||||||||||||
Beginning book value per share | $ | 16.42 | $ | 16.23 | $ | 16.12 | $ | 15.83 | $ | 15.67 | $ | 15.29 | $ | 15.13 | $ | 14.96 | $ | 15.83 | $ | 14.96 | |||||||||||||||||||||
Earnings | (0.02 | ) | 0.42 | 0.38 | 0.50 | 0.35 | 0.41 | 0.43 | 0.43 | 1.34 | 1.60 | ||||||||||||||||||||||||||||||
Changes in unrealized gains on securities, net, from: | |||||||||||||||||||||||||||||||||||||||||
Realized gains recognized in earnings | (0.07 | ) | (0.05 | ) | (0.05 | ) | (0.09 | ) | (0.03 | ) | (0.03 | ) | (0.02 | ) | (0.04 | ) | (0.23 | ) | (0.13 | ) | |||||||||||||||||||||
Amortization income recognized in earnings | (0.03 | ) | (0.03 | ) | (0.04 | ) | (0.04 | ) | (0.04 | ) | (0.05 | ) | (0.05 | ) | (0.05 | ) | (0.13 | ) | (0.18 | ) | |||||||||||||||||||||
Mark-to-market adjustments, net | 0.06 | 0.01 | 0.01 | — | 0.12 | 0.27 | 0.09 | 0.11 | 0.09 | 0.58 | |||||||||||||||||||||||||||||||
Total change in unrealized gains on securities, net | (0.04 | ) | (0.07 | ) | (0.08 | ) | (0.13 | ) | 0.05 | 0.19 | 0.02 | 0.02 | (0.27 | ) | 0.27 | ||||||||||||||||||||||||||
Dividends | (0.30 | ) | (0.30 | ) | (0.30 | ) | (0.28 | ) | (0.28 | ) | (0.28 | ) | (0.28 | ) | (0.28 | ) | (1.18 | ) | (1.12 | ) | |||||||||||||||||||||
Issuance of common stock | — | 0.01 | — | — | — | — | — | — | 0.01 | — | |||||||||||||||||||||||||||||||
Share repurchases | — | — | — | 0.01 | — | — | — | — | 0.01 | — | |||||||||||||||||||||||||||||||
Equity compensation, net | (0.07 | ) | 0.03 | 0.03 | 0.03 | (0.02 | ) | 0.02 | — | (0.01 | ) | 0.01 | — | ||||||||||||||||||||||||||||
Changes in unrealized losses on derivatives hedging long-term debt | (0.09 | ) | 0.06 | 0.05 | 0.11 | 0.02 | — | (0.03 | ) | 0.02 | 0.11 | 0.01 | |||||||||||||||||||||||||||||
Other, net | (0.01 | ) | 0.04 | 0.03 | 0.05 | 0.04 | 0.04 | 0.02 | (0.01 | ) | 0.03 | 0.11 | |||||||||||||||||||||||||||||
Ending book value per share | $ | 15.89 | $ | 16.42 | $ | 16.23 | $ | 16.12 | $ | 15.83 | $ | 15.67 | $ | 15.29 | $ | 15.13 | $ | 15.89 | $ | 15.83 | |||||||||||||||||||||
Economic return on book value (1) | (1.4 | )% | 3.0 | % | 2.5 | % | 3.6 | % | 2.8 | % | 4.3 | % | 2.9 | % | 3.0 | % | 7.8 | % | 13.3 | % | |||||||||||||||||||||
(1) | Economic return on book value is based on the periodic change in GAAP book value per common share plus dividends declared per common share during the period. |
THE REDWOOD REVIEW I 4TH QUARTER 2018 | Table 5: Changes in Book Value per Share 27 | |
| Table 6: Taxable and GAAP Income (1) Differences and Dividends (In thousands, except for per share data) | ||||||||||||||||||||||||||||||||||||
Estimated Twelve Months 2018 (2) | Actual Twelve Months 2017 (2) | Actual Twelve Months 2016 (2) | |||||||||||||||||||||||||||||||||||
Taxable Income | GAAP Income | Differences | Taxable Income | GAAP Income | Differences | Taxable Income | GAAP Income | Differences | |||||||||||||||||||||||||||||
Taxable and GAAP Income Differences | |||||||||||||||||||||||||||||||||||||
Interest income | $ | 265,753 | $ | 378,717 | $ | (112,964 | ) | $ | 225,079 | $ | 248,057 | $ | (22,978 | ) | $ | 233,258 | $ | 246,355 | $ | (13,097 | ) | ||||||||||||||||
Interest expense | (139,588 | ) | (239,039 | ) | 99,451 | (89,662 | ) | (108,816 | ) | 19,154 | (76,396 | ) | (88,528 | ) | 12,132 | ||||||||||||||||||||||
Net interest income | 126,165 | 139,678 | (13,513 | ) | 135,417 | 139,241 | (3,824 | ) | 156,862 | 157,827 | (965 | ) | |||||||||||||||||||||||||
Reversal of provision for loan losses | — | — | — | — | — | — | — | 7,102 | (7,102 | ) | |||||||||||||||||||||||||||
Realized credit losses | (1,738 | ) | — | (1,738 | ) | (3,442 | ) | — | (3,442 | ) | (7,989 | ) | — | (7,989 | ) | ||||||||||||||||||||||
Mortgage banking activities, net | 57,297 | 59,566 | (2,269 | ) | 44,143 | 53,908 | (9,765 | ) | 26,477 | 38,691 | (12,214 | ) | |||||||||||||||||||||||||
Investment fair value changes, net | 4,995 | (25,689 | ) | 30,684 | (11,191 | ) | 10,374 | (21,565 | ) | (10,410 | ) | (28,574 | ) | 18,164 | |||||||||||||||||||||||
Operating expenses | (78,890 | ) | (82,782 | ) | 3,892 | (73,203 | ) | (77,156 | ) | 3,953 | (88,416 | ) | (88,786 | ) | 370 | ||||||||||||||||||||||
Other income (expense), net | 17,254 | 12,874 | 4,380 | 31,325 | 12,436 | 18,889 | 89,715 | 20,691 | 69,024 | ||||||||||||||||||||||||||||
Realized gains, net | 43,099 | 27,041 | 16,058 | (736 | ) | 13,355 | (14,091 | ) | 284 | 28,009 | (27,725 | ) | |||||||||||||||||||||||||
(Provision for) benefit from income taxes | (534 | ) | (11,088 | ) | 10,554 | (516 | ) | (11,752 | ) | 11,236 | (155 | ) | (3,708 | ) | 3,553 | ||||||||||||||||||||||
Income | $ | 167,648 | $ | 119,600 | $ | 48,048 | $ | 121,797 | $ | 140,406 | $ | (18,609 | ) | $ | 166,368 | $ | 131,252 | $ | 35,116 | ||||||||||||||||||
REIT taxable income | $ | 110,092 | $ | 90,122 | $ | 97,576 | |||||||||||||||||||||||||||||||
Taxable income at taxable subsidiaries | 57,556 | 31,675 | 68,792 | ||||||||||||||||||||||||||||||||||
Taxable income | $ | 167,648 | $ | 121,797 | $ | 166,368 | |||||||||||||||||||||||||||||||
Shares used for taxable EPS calculation | 84,884 | 76,600 | 76,835 | ||||||||||||||||||||||||||||||||||
REIT taxable income per share | $ | 1.38 | $ | 1.17 | $ | 1.27 | |||||||||||||||||||||||||||||||
Taxable income (loss) per share at taxable subsidiaries | $ | 0.74 | $ | 0.42 | $ | 0.90 | |||||||||||||||||||||||||||||||
Taxable income per share (3) | $ | 2.12 | $ | 1.59 | $ | 2.17 | |||||||||||||||||||||||||||||||
Dividends | |||||||||||||||||||||||||||||||||||||
Dividends declared | $ | 94,134 | $ | 86,271 | $ | 86,240 | |||||||||||||||||||||||||||||||
Dividends per share (4) | $ | 1.18 | $ | 1.12 | $ | 1.12 | |||||||||||||||||||||||||||||||
(1) | Taxable income for 2018 is an estimate until we file our tax returns for this year. To the extent we expect to pay tax at the corporate level (generally as a result of activity at our taxable REIT subsidiaries), we are required to record a tax provision for GAAP reporting purposes. Any tax provision (or benefit) is not necessarily the actual amount of tax currently due (or receivable as a refund) as a portion of our provision (or benefit) is deferred in nature. It is our intention to retain any excess inclusion income generated in 2018 at our TRS and not pass it through to our shareholders. |
(2) | Reconciliation of GAAP income to taxable income (loss) for prior quarters is provided in the respective Redwood Reviews for those quarters. |
(3) | Taxable income (loss) per share is based on the number of shares outstanding at the end of each quarter. The annual taxable income (loss) per share is the sum of the quarterly per share estimates. |
(4) | Dividends in 2018 are expected to be characterized as 69% ordinary dividend income (or $65 million) and 31% long-term capital gain dividend income (or $29 million). Dividends in 2017 were characterized as 71% ordinary dividend income (or $61 million) and 29% qualified dividend income (or $25 million). Dividends in 2016 were characterized as 100% ordinary income (or $86 million). |
THE REDWOOD REVIEW I 4TH QUARTER 2018 | Table 6: Taxable and GAAP Income Differences and Dividends 28 | |
| Table 7: Financial Ratios and Book Value ($ in thousands, except per share data) | ||||||||||||||||||||||||||||||||||||||||
2018 Q4 | 2018 Q3 | 2018 Q2 | 2018 Q1 | 2017 Q4 | 2017 Q3 | 2017 Q2 | 2017 Q1 | Twelve Months 2018 | Twelve Months 2017 | ||||||||||||||||||||||||||||||||
Financial performance ratios | |||||||||||||||||||||||||||||||||||||||||
Net interest income | $ | 34,764 | $ | 35,046 | $ | 34,763 | $ | 35,105 | $ | 35,360 | $ | 35,294 | $ | 34,990 | $ | 33,597 | $ | 139,678 | $ | 139,241 | |||||||||||||||||||||
Operating expenses | $ | (19,253 | ) | $ | (21,490 | ) | $ | (19,009 | ) | $ | (23,030 | ) | $ | (20,367 | ) | $ | (19,922 | ) | $ | (18,641 | ) | $ | (18,226 | ) | $ | (82,782 | ) | $ | (77,156 | ) | |||||||||||
GAAP net income | $ | (913 | ) | $ | 40,921 | $ | 32,747 | $ | 46,845 | $ | 30,933 | $ | 36,180 | $ | 36,324 | $ | 36,969 | $ | 119,600 | $ | 140,406 | ||||||||||||||||||||
Average total assets | $ | 10,163,283 | $ | 8,503,749 | $ | 7,134,026 | $ | 6,922,611 | $ | 6,652,937 | $ | 5,851,133 | $ | 5,685,460 | $ | 5,471,154 | $ | 8,190,681 | $ | 5,918,233 | |||||||||||||||||||||
Average total equity | $ | 1,342,967 | $ | 1,331,497 | $ | 1,226,735 | $ | 1,218,015 | $ | 1,207,879 | $ | 1,189,540 | $ | 1,167,438 | $ | 1,158,732 | $ | 1,280,287 | $ | 1,181,056 | |||||||||||||||||||||
Operating expenses / average total assets | 0.76 | % | 1.01 | % | 1.07 | % | 1.33 | % | 1.22 | % | 1.36 | % | 1.31 | % | 1.33 | % | 1.01 | % | 1.30 | % | |||||||||||||||||||||
Operating expenses / total capital | 3.63 | % | 4.03 | % | 3.80 | % | 5.13 | % | 4.56 | % | 4.47 | % | 4.22 | % | 4.08 | % | 3.90 | % | 4.33 | % | |||||||||||||||||||||
Operating expenses / average total equity | 5.73 | % | 6.46 | % | 6.20 | % | 7.56 | % | 6.74 | % | 6.70 | % | 6.39 | % | 6.29 | % | 6.47 | % | 6.53 | % | |||||||||||||||||||||
GAAP net income / average total assets | (0.04 | )% | 1.92 | % | 1.84 | % | 2.71 | % | 1.86 | % | 2.47 | % | 2.56 | % | 2.70 | % | 1.46 | % | 2.37 | % | |||||||||||||||||||||
GAAP net income / average equity (GAAP ROE) | (0.27 | )% | 12.29 | % | 10.68 | % | 15.38 | % | 10.24 | % | 12.17 | % | 12.45 | % | 12.76 | % | 9.34 | % | 11.89 | % | |||||||||||||||||||||
Leverage ratios and book value per share | |||||||||||||||||||||||||||||||||||||||||
Short-term debt | $ | 2,138,686 | $ | 1,424,275 | $ | 1,426,288 | $ | 1,504,460 | $ | 1,938,682 | $ | 1,238,196 | $ | 1,294,807 | $ | 563,773 | |||||||||||||||||||||||||
Long-term debt – Other | 2,584,499 | 2,785,264 | 2,785,264 | 2,585,264 | 2,585,264 | 2,585,264 | 2,340,264 | 2,627,764 | |||||||||||||||||||||||||||||||||
Total debt at Redwood | $ | 4,723,185 | $ | 4,209,539 | $ | 4,211,552 | $ | 4,089,724 | $ | 4,523,946 | $ | 3,823,460 | $ | 3,635,071 | $ | 3,191,537 | |||||||||||||||||||||||||
At consolidated securitization entities | |||||||||||||||||||||||||||||||||||||||||
ABS issued | 5,410,073 | 3,406,985 | 1,929,662 | 1,542,087 | 1,164,585 | 944,288 | 692,606 | 728,391 | |||||||||||||||||||||||||||||||||
Non-recourse short-term debt | 265,637 | — | — | — | — | — | — | — | |||||||||||||||||||||||||||||||||
Total ABS and non-recourse short-term debt | $ | 5,675,710 | $ | 3,406,985 | $ | 1,929,662 | $ | 1,542,087 | $ | 1,164,585 | $ | 944,288 | $ | 692,606 | $ | 728,391 | |||||||||||||||||||||||||
Consolidated debt (1) | $ | 10,398,895 | $ | 7,616,524 | $ | 6,141,214 | $ | 5,631,811 | $ | 5,688,531 | $ | 4,767,748 | $ | 4,327,677 | $ | 3,919,928 | |||||||||||||||||||||||||
Stockholders' equity | $ | 1,348,794 | $ | 1,361,327 | $ | 1,228,955 | $ | 1,219,983 | $ | 1,212,287 | $ | 1,208,640 | $ | 1,179,424 | $ | 1,165,771 | |||||||||||||||||||||||||
Total capital (2) | $ | 2,120,572 | 2,132,298 | $ | 1,999,177 | $ | 1,795,572 | $ | 1,787,701 | $ | 1,783,301 | $ | 1,765,784 | $ | 1,787,266 | ||||||||||||||||||||||||||
Recourse debt at Redwood to stockholders' equity (3) | 3.5x | 3.1x | 3.4x | 3.4x | 3.7x | 3.2x | 3.1x | 2.7x | |||||||||||||||||||||||||||||||||
Consolidated debt to stockholders' equity | 7.7x | 5.6x | 5.0x | 4.6x | 4.7x | 3.9x | 3.7x | 3.4x | |||||||||||||||||||||||||||||||||
Shares outstanding at period end (in thousands) | 84,884 | 82,930 | 75,743 | 75,703 | 76,600 | 77,123 | 77,117 | 77,039 | |||||||||||||||||||||||||||||||||
Book value per share | $ | 15.89 | $ | 16.42 | $ | 16.23 | $ | 16.12 | $ | 15.83 | $ | 15.67 | $ | 15.29 | $ | 15.13 | |||||||||||||||||||||||||
(1) | Amounts presented in Consolidated debt above do not include deferred issuance costs or debt discounts. |
(2) | Our total capital of $2.1 billion at December 31, 2018 included $1.3 billion of equity capital and $0.8 billion of convertible debt. |
(3) | Excludes ABS issued and non-recourse debt at consolidated entities. See Table 10 for additional detail on our ABS issued and short-term debt at consolidated entities. |
THE REDWOOD REVIEW I 4TH QUARTER 2018 | Table 7: Financial Ratios and Book Value 29 | |
| Table 8: Loans and Securities Activity ($ in thousands) | ||||||||||||||||||||||||||||||||||||||||
2018 Q4 | 2018 Q3 | 2018 Q2 | 2018 Q1 | 2017 Q4 | 2017 Q3 | 2017 Q2 | 2017 Q1 | Twelve Months 2018 | Twelve Months 2017 | ||||||||||||||||||||||||||||||||
Residential Loans, Held-for-Sale | |||||||||||||||||||||||||||||||||||||||||
Beginning carrying value | $ | 866,444 | $ | 1,104,660 | $ | 1,130,185 | $ | 1,427,945 | $ | 925,681 | $ | 837,371 | $ | 376,607 | $ | 835,399 | $ | 1,427,945 | $ | 835,399 | |||||||||||||||||||||
Acquisitions | 1,562,573 | 1,804,125 | 1,951,566 | 1,815,294 | 1,950,180 | 1,462,116 | 1,221,051 | 1,108,304 | 7,133,558 | 5,741,651 | |||||||||||||||||||||||||||||||
Sales | (1,290,337 | ) | (1,133,078 | ) | (1,408,358 | ) | (1,594,531 | ) | (834,977 | ) | (1,393,323 | ) | (694,875 | ) | (1,377,637 | ) | (5,426,304 | ) | (4,300,812 | ) | |||||||||||||||||||||
Principal repayments | (14,862 | ) | (21,198 | ) | (14,612 | ) | (17,017 | ) | (14,771 | ) | (16,436 | ) | (9,273 | ) | (12,995 | ) | (67,689 | ) | (53,475 | ) | |||||||||||||||||||||
Transfers between portfolios | (81,639 | ) | (896,129 | ) | (561,710 | ) | (507,616 | ) | (601,554 | ) | 20,025 | (61,922 | ) | (184,996 | ) | (2,047,094 | ) | (828,447 | ) | ||||||||||||||||||||||
Changes in fair value, net | 6,622 | 8,064 | 7,589 | 6,110 | 3,386 | 15,928 | 5,783 | 8,532 | 28,385 | 33,629 | |||||||||||||||||||||||||||||||
Ending fair value | $ | 1,048,801 | $ | 866,444 | $ | 1,104,660 | $ | 1,130,185 | $ | 1,427,945 | $ | 925,681 | $ | 837,371 | $ | 376,607 | $ | 1,048,801 | $ | 1,427,945 | |||||||||||||||||||||
Residential Loans, Held-for-Investment at Redwood | |||||||||||||||||||||||||||||||||||||||||
Beginning carrying value | $ | 2,320,662 | $ | 2,313,336 | $ | 2,375,785 | $ | 2,434,386 | $ | 2,268,802 | $ | 2,360,234 | $ | 2,350,013 | $ | 2,261,016 | $ | 2,434,386 | $ | 2,261,016 | |||||||||||||||||||||
Principal repayments | (59,854 | ) | (76,144 | ) | (79,375 | ) | (74,954 | ) | (93,916 | ) | (74,530 | ) | (60,055 | ) | (93,666 | ) | (290,327 | ) | (322,167 | ) | |||||||||||||||||||||
Transfers between portfolios | 81,639 | 100,533 | 31,936 | 55,775 | 273,994 | (20,045 | ) | 61,922 | 184,996 | 269,883 | 500,867 | ||||||||||||||||||||||||||||||
Changes in fair value, net | 41,485 | (17,063 | ) | (15,010 | ) | (39,422 | ) | (14,494 | ) | 3,143 | 8,354 | (2,333 | ) | (30,010 | ) | (5,330 | ) | ||||||||||||||||||||||||
Ending fair value | $ | 2,383,932 | $ | 2,320,662 | $ | 2,313,336 | $ | 2,375,785 | $ | 2,434,386 | $ | 2,268,802 | $ | 2,360,234 | $ | 2,350,013 | $ | 2,383,932 | $ | 2,434,386 | |||||||||||||||||||||
Business Purpose Loans | |||||||||||||||||||||||||||||||||||||||||
Beginning carrying value | $ | 115,620 | $ | — | $ | — | $ | — | $ | — | $ | — | $ | — | $ | — | $ | — | $ | — | |||||||||||||||||||||
Acquisitions | 41,563 | 126,214 | — | — | — | — | — | — | 167,777 | — | |||||||||||||||||||||||||||||||
Effect of principal payments | (16,469 | ) | (10,912 | ) | — | — | — | — | — | — | (27,381 | ) | — | ||||||||||||||||||||||||||||
Changes in fair value, net | 544 | 318 | — | — | — | — | — | — | 862 | — | |||||||||||||||||||||||||||||||
Ending fair value | $ | 141,258 | $ | 115,620 | $ | — | $ | — | $ | — | $ | — | $ | — | $ | — | $ | 141,258 | $ | — | |||||||||||||||||||||
Securities | |||||||||||||||||||||||||||||||||||||||||
Beginning fair value | $ | 1,470,084 | $ | 1,453,936 | $ | 1,357,720 | $ | 1,476,510 | $ | 1,356,272 | $ | 1,218,503 | $ | 1,165,940 | $ | 1,018,439 | $ | 1,476,510 | $ | 1,018,439 | |||||||||||||||||||||
Acquisitions | 132,457 | 161,534 | 223,022 | 144,465 | 204,733 | 188,138 | 116,860 | 170,729 | 661,478 | 680,460 | |||||||||||||||||||||||||||||||
Sales | (109,782 | ) | (106,972 | ) | (103,685 | ) | (234,509 | ) | (75,887 | ) | (47,076 | ) | (69,676 | ) | (21,760 | ) | (554,948 | ) | (214,399 | ) | |||||||||||||||||||||
Effect of principal payments | (22,562 | ) | (26,571 | ) | (17,022 | ) | (15,707 | ) | (21,503 | ) | (19,497 | ) | (15,854 | ) | (14,911 | ) | (81,862 | ) | (71,765 | ) | |||||||||||||||||||||
Transfers between portfolios | (6,090 | ) | (11,091 | ) | — | — | — | — | — | — | (17,181 | ) | — | ||||||||||||||||||||||||||||
Change in fair value, net | (11,613 | ) | (752 | ) | (6,099 | ) | (13,039 | ) | 12,895 | 16,204 | 21,233 | 13,443 | (31,503 | ) | 63,775 | ||||||||||||||||||||||||||
Ending fair value | $ | 1,452,494 | $ | 1,470,084 | $ | 1,453,936 | $ | 1,357,720 | $ | 1,476,510 | $ | 1,356,272 | $ | 1,218,503 | $ | 1,165,940 | $ | 1,452,494 | $ | 1,476,510 | |||||||||||||||||||||
THE REDWOOD REVIEW I 4TH QUARTER 2018 | Table 8: Loans and Securities Activity 30 | |
| Table 9: Investment Portfolio Detailed Balances ($ in thousands) | ||||||||||||||||||||||||||||||||
2018 Q4 | 2018 Q3 | 2018 Q2 | 2018 Q1 | 2017 Q4 | 2017 Q3 | 2017 Q2 | 2017 Q1 | ||||||||||||||||||||||||||
Residential Loans Held-for-Investment at Redwood | $ | 2,383,932 | $ | 2,320,662 | $ | 2,313,336 | $ | 2,375,785 | $ | 2,434,386 | $ | 2,268,802 | $ | 2,360,234 | $ | 2,350,013 | |||||||||||||||||
Business Purpose (Residential Bridge) Loans Held-for-Investment | 112,798 | 95,515 | — | — | — | — | — | — | |||||||||||||||||||||||||
Securities with Sub-Categories | |||||||||||||||||||||||||||||||||
Residential | |||||||||||||||||||||||||||||||||
Senior - New Issue | 76,917 | 76,950 | 49,099 | — | — | — | — | — | |||||||||||||||||||||||||
Senior - Legacy | 70,944 | 97,374 | 113,799 | 127,240 | 140,988 | 153,232 | 128,330 | 137,210 | |||||||||||||||||||||||||
Senior - IO | 81,753 | 86,072 | 89,230 | 82,062 | 69,975 | 62,767 | 48,632 | 38,889 | |||||||||||||||||||||||||
Senior - Re-REMIC | 16,671 | 17,254 | 33,691 | 38,370 | 38,875 | 39,033 | 73,337 | 73,730 | |||||||||||||||||||||||||
Mezzanine - New issue | 218,147 | 221,358 | 239,107 | 228,114 | 331,451 | 334,915 | 343,013 | 368,919 | |||||||||||||||||||||||||
Subordinate - New issue | 305,149 | 301,847 | 272,508 | 239,565 | 247,897 | 209,554 | 195,039 | 191,321 | |||||||||||||||||||||||||
Subordinate - Agency CRT | 237,841 | 235,720 | 239,767 | 245,654 | 300,713 | 286,780 | 229,510 | 198,197 | |||||||||||||||||||||||||
Subordinate - Legacy | 15,993 | 16,255 | 17,950 | 19,707 | 22,586 | 26,920 | 30,333 | 18,993 | |||||||||||||||||||||||||
Multifamily (mezzanine) | 429,079 | 417,254 | 398,785 | 377,008 | 324,025 | 243,071 | 170,309 | 138,681 | |||||||||||||||||||||||||
Total Securities on Balance Sheet | 1,452,494 | 1,470,084 | 1,453,936 | 1,357,720 | 1,476,510 | 1,356,272 | 1,218,503 | 1,165,940 | |||||||||||||||||||||||||
Sequoia Choice Securities (1) | 194,372 | 194,739 | 133,718 | 87,381 | 77,922 | 30,975 | — | — | |||||||||||||||||||||||||
Freddie Mac SLST Securities (1) | 228,921 | — | — | — | — | — | — | — | |||||||||||||||||||||||||
Freddie Mac K-Series Securities (1) | 125,523 | 66,559 | — | — | — | — | — | — | |||||||||||||||||||||||||
Adjusted Total Securities | 2,001,310 | 1,731,382 | 1,587,654 | 1,445,101 | 1,554,432 | 1,387,247 | 1,218,503 | 1,165,940 | |||||||||||||||||||||||||
Other Investments | |||||||||||||||||||||||||||||||||
Servicer Advance Investments | 300,468 | — | — | — | — | — | — | — | |||||||||||||||||||||||||
Mortgage Servicing Rights | 60,281 | 63,785 | 64,674 | 66,496 | 63,598 | 62,928 | 63,770 | 111,013 | |||||||||||||||||||||||||
Investment in 5 Arches | 10,754 | 10,772 | 10,973 | — | — | — | — | — | |||||||||||||||||||||||||
Participation in Loan Warehouse Facility | 39,703 | 39,219 | 41,658 | — | — | — | — | — | |||||||||||||||||||||||||
Excess MSR IO Strip | 27,312 | — | — | — | — | — | — | — | |||||||||||||||||||||||||
Total earning assets | $ | 4,936,558 | $ | 4,261,335 | $ | 4,018,295 | $ | 3,887,382 | $ | 4,052,416 | $ | 3,718,977 | $ | 3,642,507 | $ | 3,626,966 | |||||||||||||||||
Supplemental Information | |||||||||||||||||||||||||||||||||
Residential Loans at Consolidated Sequoia Choice Entities (2) | $ | 2,079,382 | $ | 2,181,195 | $ | 1,481,145 | $ | 1,013,619 | $ | 620,062 | $ | 317,303 | $ | — | $ | — | |||||||||||||||||
Residential Loans at Consolidated Freddie Mac SLST Entity (2) | $ | 1,222,669 | $ | — | $ | — | $ | — | $ | — | $ | — | $ | — | $ | — | |||||||||||||||||
Multifamily Loans at Consolidated Freddie Mac K-Series Entities (2) | $ | 2,144,598 | $ | 942,165 | $ | — | $ | — | $ | — | $ | — | $ | — | $ | — | |||||||||||||||||
(1) | Represents securities retained from our consolidated Sequoia Choice securitizations and securities owned in consolidated Freddie Mac SLST and Freddie Mac K-Series securitizations. |
(2) | Represents the gross assets of securitizations consolidated on our balance sheet in accordance with GAAP. |
THE REDWOOD REVIEW I 4TH QUARTER 2018 | Table 9: Investment Portfolio Detailed Balances 31 | |
| Table 10: Consolidating Balance Sheet ($ in thousands) | ||||||||||||||||||||||||||||||||||||||||||||||||||||||||
December 31, 2018 | September 30, 2018 | ||||||||||||||||||||||||||||||||||||||||||||||||||||||||
Consolidated VIEs (1) | Consolidated VIEs (1) | ||||||||||||||||||||||||||||||||||||||||||||||||||||||||
At Redwood (1) | Legacy Sequoia | Sequoia Choice | Freddie Mac SLST | Freddie Mac K-Series | Servicing Advances | Redwood Consolidated | At Redwood (1) | Legacy Sequoia | Sequoia Choice | Freddie Mac SLST | Freddie Mac K-Series | Servicing Advances | Redwood Consolidated | ||||||||||||||||||||||||||||||||||||||||||||
Residential loans | $ | 3,432,733 | $ | 519,958 | $ | 2,079,382 | $ | 1,222,669 | $ | — | $ | — | $ | 7,254,742 | $ | 3,187,106 | $ | 553,958 | $ | 2,181,195 | $ | — | $ | — | $ | — | $ | 5,922,259 | |||||||||||||||||||||||||||||
Business purpose loans | 141,258 | — | — | — | — | — | 141,258 | 115,620 | — | — | — | — | — | 115,620 | |||||||||||||||||||||||||||||||||||||||||||
Multifamily loans | — | — | — | — | 2,144,598 | — | 2,144,598 | — | — | — | — | 942,165 | — | 942,165 | |||||||||||||||||||||||||||||||||||||||||||
Real estate securities | 1,452,494 | — | — | — | — | — | 1,452,494 | 1,470,084 | — | — | — | — | — | 1,470,084 | |||||||||||||||||||||||||||||||||||||||||||
Other investments | 125,830 | — | — | — | 312,688 | 438,518 | 113,776 | — | — | — | — | — | 113,776 | ||||||||||||||||||||||||||||||||||||||||||||
Cash and cash equivalents | 175,764 | — | — | — | — | — | 175,764 | 173,516 | — | — | — | — | — | 173,516 | |||||||||||||||||||||||||||||||||||||||||||
Other assets (2) | 278,136 | 4,911 | 10,010 | 3,926 | 6,595 | 26,454 | 330,032 | 386,393 | 3,922 | 9,057 | — | 2,843 | — | 402,215 | |||||||||||||||||||||||||||||||||||||||||||
Total assets | $ | 5,606,215 | $ | 524,869 | $ | 2,089,392 | $ | 1,226,595 | $ | 2,151,193 | $ | 339,142 | $ | 11,937,406 | $ | 5,446,495 | $ | 557,880 | $ | 2,190,252 | $ | — | $ | 945,008 | $ | — | $ | 9,139,635 | |||||||||||||||||||||||||||||
Short-term debt | $ | 2,137,539 | $ | — | $ | — | $ | — | $ | — | $ | 262,740 | $ | 2,400,279 | $ | 1,424,275 | $ | — | $ | — | $ | — | $ | — | $ | — | $ | 1,424,275 | |||||||||||||||||||||||||||||
Other liabilities | 169,108 | 571 | 8,202 | 2,907 | 6,239 | 19,075 | 206,102 | 165,228 | 590 | 7,654 | — | 2,606 | — | 176,078 | |||||||||||||||||||||||||||||||||||||||||||
ABS issued | — | 512,240 | 1,885,010 | 993,748 | 2,019,075 | — | 5,410,073 | — | 544,923 | 1,986,456 | — | 875,606 | — | 3,406,985 | |||||||||||||||||||||||||||||||||||||||||||
Long-term debt, net | 2,572,158 | — | — | — | — | — | 2,572,158 | 2,770,970 | — | — | — | — | — | 2,770,970 | |||||||||||||||||||||||||||||||||||||||||||
Total liabilities | 4,878,805 | 512,811 | 1,893,212 | 996,655 | 2,025,314 | 281,815 | 10,588,612 | 4,360,473 | 545,513 | 1,994,110 | — | 878,212 | — | 7,778,308 | |||||||||||||||||||||||||||||||||||||||||||
Equity | 727,410 | 12,058 | 196,180 | 229,940 | 125,879 | 57,327 | 1,348,794 | 1,086,022 | 12,367 | 196,142 | — | 66,796 | — | 1,361,327 | |||||||||||||||||||||||||||||||||||||||||||
Total liabilities and equity | $ | 5,606,215 | $ | 524,869 | $ | 2,089,392 | $ | 1,226,595 | $ | 2,151,193 | $ | 339,142 | $ | 11,937,406 | $ | 5,446,495 | $ | 557,880 | $ | 2,190,252 | $ | — | $ | 945,008 | $ | — | $ | 9,139,635 | |||||||||||||||||||||||||||||
(1) | The format of this consolidating balance sheet is provided to more clearly delineate between the assets belonging to consolidated securitization entities that we are required to consolidate on our balance sheet in accordance with GAAP, but which are not legally ours, and the liabilities of these consolidated entities, which are payable only from the cash flows generated by their assets and are, therefore, non-recourse to us, and the assets that are legally ours and the liabilities of ours for which there is recourse to us. |
(2) | At both December 31, 2018 and September 30, 2018, other assets at Redwood included a total of $42 million of assets held by third-party custodians and pledged as collateral to the GSEs in connection with credit risk-sharing arrangements relating to conforming residential loans. These pledged assets can only be used to settle obligations to the GSEs under these risk-sharing arrangements. |
THE REDWOOD REVIEW I 4TH QUARTER 2018 | Table 10: Consolidating Balance Sheet 32 | |

D I V I D E N D S |
THE REDWOOD REVIEW I 4TH QUARTER 2018 |
34 |
N O N - G A A P M E A S U R E M E N T S |
• | Under GAAP, available-for-sale securities are reported at their fair value with periodic changes in fair value recognized through the balance sheet in Shareholders’ equity. When an available-for-sale security is sold, the cumulative gain or loss since purchase is recognized through the income statement, in Realized gains, net, in the period the sale occurred. As a result, any such cumulative gains or losses are reflected in core earnings in the period the sale occurred. |
• | Under GAAP, trading securities are reported at their fair value with periodic changes in fair value recognized through the income statement in Investment fair value changes, net. Certain of these periodic changes in fair value (as described above) are excluded from core earnings. Core earnings includes an adjustment to include the cumulative net gains or losses (from purchase through the sale of the investment) for sold trading securities in the period they are sold. The result is to consistently present within core earnings the cumulative gains or losses from the sale of long-term investments, regardless of how they are accounted for under GAAP. |
THE REDWOOD REVIEW I 4TH QUARTER 2018 |
35 |
N O N - G A A P M E A S U R E M E N T S |
Reconciliation of Non-GAAP Core Earnings | ||||||||||||
($ in millions) | ||||||||||||
Three Months Ended December 31, 2018 | ||||||||||||
GAAP | Adjustments | Non-GAAP | ||||||||||
Net interest income | $ | 35 | $ | — | $ | 35 | ||||||
Non-interest income | ||||||||||||
Mortgage banking activities, net | 11 | — | 11 | |||||||||
Investment fair value changes, net (1) | (39 | ) | 37 | (1 | ) | |||||||
Other income, net | 4 | — | 4 | |||||||||
Realized gains, net (2) | 6 | 4 | 9 | |||||||||
Total non-interest income (loss), net | (18 | ) | 41 | 23 | ||||||||
Operating expenses | (19 | ) | — | (19 | ) | |||||||
Benefit from (provision for) income taxes (3) | 1 | (2 | ) | (1 | ) | |||||||
GAAP Net Income (Loss)/Non-GAAP Core Earnings | $ | (1 | ) | $ | 39 | $ | 38 | |||||
Three Months Ended September 30, 2018 | ||||||||||||
GAAP | Adjustments | Non-GAAP | ||||||||||
Net interest income | $ | 35 | $ | — | $ | 35 | ||||||
Non-interest income | ||||||||||||
Mortgage banking activities, net | 11 | — | 11 | |||||||||
Investment fair value changes, net (1) | 10 | (12 | ) | (2 | ) | |||||||
Other income, net | 3 | — | 3 | |||||||||
Realized gains, net (2) | 7 | 8 | 15 | |||||||||
Total non-interest income, net | 32 | (5 | ) | 28 | ||||||||
Operating expenses | (21 | ) | — | (21 | ) | |||||||
Provision for income taxes (3) | (5 | ) | — | (5 | ) | |||||||
GAAP Net Income/Non-GAAP Core Earnings | $ | 41 | $ | (4 | ) | $ | 37 | |||||
(1) | References in this Redwood Review to core investment fair value changes, net refer to GAAP investment fair value changes, net as adjusted by the amount described in the "Adjustments" column, as further described above under the heading "Core Earnings." |
(2) | References in this Redwood Review to core realized gains, net refer to GAAP realized gains, net as adjusted by the amount described in the "Adjustments" column, as further described above under the heading "Core Earnings." |
(3) | References in this Redwood Review to core provision for income taxes refer to GAAP provision for income taxes as adjusted by the amount described in the "Adjustments" column, as further described above under the heading "Core Earnings." |
THE REDWOOD REVIEW I 4TH QUARTER 2018 |
36 |
N O N - G A A P M E A S U R E M E N T S |
Reconciliation to Non-GAAP Core Earnings | ||||||||
($ in millions) | ||||||||
Years Ended | ||||||||
12/31/2018 | 12/31/2017 | |||||||
GAAP net income | $ | 120 | $ | 140 | ||||
Core earnings adjustments | ||||||||
Eliminate mark-to-market on long-term investments and associated derivatives | 14 | (36 | ) | |||||
Include cumulative gain (loss) on long-term investments sold, net | 37 | 10 | ||||||
Income tax adjustments associated with core earnings adjustments | (2 | ) | 5 | |||||
Non-GAAP core earnings | $ | 168 | $ | 119 | ||||
GAAP net income per diluted common share | $ | 1.34 | $ | 1.60 | ||||
Non-GAAP core earnings per diluted common share | $ | 1.78 | $ | 1.40 | ||||
THE REDWOOD REVIEW I 4TH QUARTER 2018 |
37 |
N O N - G A A P M E A S U R E M E N T S |
Components of Investment Portfolio Fair Value Changes, Net by Investment Type | ||||||||
($ in millions) | ||||||||
Three Months Ended | ||||||||
12/31/2018 | 9/30/2018 | |||||||
Market valuation changes on: | ||||||||
Residential loans held-for-investment at fair value | ||||||||
Change in fair value from the reduction in basis (1) | $ | 1 | $ | — | ||||
Other fair value changes (2) | 40 | (17 | ) | |||||
Total change in fair value of residential loans held-for-investment | 41 | (17 | ) | |||||
Real estate securities classified as trading | ||||||||
Change in fair value from the reduction in basis (1) | (3 | ) | (3 | ) | ||||
Other fair value changes (2) | (4 | ) | 9 | |||||
Total change in fair value of real estate securities | (7 | ) | 6 | |||||
Risk management derivatives | ||||||||
Interest component of hedges (3) | 1 | 1 | ||||||
Other fair value changes (4) | (73 | ) | 21 | |||||
Total change in fair value of risk management derivatives | (73 | ) | 22 | |||||
Total investment portfolio fair value changes, net | $ | (38 | ) | $ | 11 | |||
(1) | Reflects the change in fair value due to principal changes, which is calculated as the change in principal on a given investment during the period, multiplied by the amount that the prior quarter ending price or acquisition price for that investment is above or below par in percentage terms. |
(2) | Reflects changes in prepayment assumptions and credit spreads on our residential loans, trading securities and conforming risk-sharing investments primarily due to changes in benchmark interest rates. This item is excluded from management's definition of core earnings. |
(3) | Reflects the net interest paid or received on hedges associated with fair value investments. |
(4) | Reflects the change in fair value of our risk management derivatives that are associated with changes in benchmark interest rates during the period. This item is excluded from management's definition of core earnings. |
THE REDWOOD REVIEW I 4TH QUARTER 2018 |
38 |
N O N - G A A P M E A S U R E M E N T S |
Reconciliation to Non-GAAP Economic Net Interest Income | ||||||||
($ in millions) | ||||||||
Three Months Ended | ||||||||
12/31/2018 | 9/30/2018 | |||||||
Net interest income | $ | 35 | $ | 35 | ||||
Adjustments | ||||||||
Change in basis of fair value investments | (2 | ) | (2 | ) | ||||
Interest component of hedges | 1 | 1 | ||||||
Non-GAAP economic net interest income | $ | 34 | $ | 33 | ||||
THE REDWOOD REVIEW I 4TH QUARTER 2018 |
39 |
N O N - G A A P M E A S U R E M E N T S |
• | Other fair value changes, net represents GAAP investment fair value changes, net, adjusted to exclude the same adjustments that are included in economic net interest income, as described above. Effectively, these adjustment amounts are excluded from investment fair value changes, net and included with net interest income to calculate economic net interest income. |
• | Core other fair value changes, net represents non-GAAP other fair value changes, net, adjusted to exclude the component of mark-to-market changes on long-term investments and associated derivatives that were not otherwise included in the adjustment to arrive at Other fair value changes, net. |
Reconciliation to Non-GAAP Other Fair Value Changes, Net and Non-GAAP Core Other Fair Value Changes, Net | ||||||||
($ in millions) | ||||||||
Three Months Ended | ||||||||
12/31/2018 | 9/30/2018 | |||||||
Investment fair value changes, net | $ | (39 | ) | $ | 10 | |||
Adjustments | ||||||||
Change in basis of fair value investments | 2 | 2 | ||||||
Interest component of hedges | (1 | ) | (1 | ) | ||||
Non-GAAP Other Fair Value Changes, Net | $ | (37 | ) | $ | 12 | |||
Core adjustments | ||||||||
Eliminate mark-to-market changes on long-term investments and associated derivatives | 37 | (12 | ) | |||||
Non-GAAP Core Other Fair Value Changes, Net | $ | — | $ | — | ||||
THE REDWOOD REVIEW I 4TH QUARTER 2018 |
40 |
F O R W A R D - L O O K I N G S T A T E M E N T S |
THE REDWOOD REVIEW I 4TH QUARTER 2018 |
41 |
F O R W A R D - L O O K I N G S T A T E M E N T S |
• | the pace at which we redeploy our available capital into new investments and initiatives; |
• | our ability to scale our platform and systems, particularly with respect to our new initiatives; |
• | interest rate volatility, changes in credit spreads, and changes in liquidity in the market for real estate securities and loans; |
• | changes in the demand from investors for residential mortgages and investments, and our ability to distribute residential mortgages through our whole-loan distribution channel; |
• | our ability to finance our investments in securities and our acquisition of residential mortgages with short-term debt; |
• | changes in the values of assets we own; |
• | general economic trends, the performance of the housing, real estate, mortgage, credit, and broader financial markets, and their effects on the prices of earning assets and the credit status of borrowers; |
• | federal and state legislative and regulatory developments, and the actions of governmental authorities, including the new U.S. presidential administration, and in particular those affecting the mortgage industry or our business (including, but not limited to, the Federal Housing Finance Agency’s rules relating to FHLB membership requirements and the implications for our captive insurance subsidiary’s membership in the FHLB); |
• | strategic business and capital deployment decisions we make; |
• | developments related to the fixed income and mortgage finance markets and the Federal Reserve’s statements regarding its future open market activity and monetary policy; |
• | our exposure to credit risk and the timing of credit losses within our portfolio; |
• | the concentration of the credit risks we are exposed to, including due to the structure of assets we hold and the geographical concentration of real estate underlying assets we own; |
• | our exposure to adjustable-rate mortgage loans; |
• | the efficacy and expense of our efforts to manage or hedge credit risk, interest rate risk, and other financial and operational risks; |
• | changes in credit ratings on assets we own and changes in the rating agencies’ credit rating methodologies; |
• | changes in interest rates; |
• | changes in mortgage prepayment rates; |
• | changes in liquidity in the market for real estate securities and loans; |
• | our ability to finance the acquisition of real estate-related assets with short-term debt; |
• | the ability of counterparties to satisfy their obligations to us; |
THE REDWOOD REVIEW I 4TH QUARTER 2018 |
42 |
F O R W A R D - L O O K I N G S T A T E M E N T S |
• | our involvement in securitization transactions, the profitability of those transactions, and the risks we are exposed to in engaging in securitization transactions; |
• | exposure to claims and litigation, including litigation arising from our involvement in securitization transactions; |
• | ongoing litigation against various trustees of RMBS transactions; |
• | whether we have sufficient liquid assets to meet short-term needs; |
• | our ability to successfully compete and retain or attract key personnel; |
• | our ability to adapt our business model and strategies to changing circumstances; |
• | changes in our investment, financing, and hedging strategies and new risks we may be exposed to if we expand our business activities; |
• | our exposure to a disruption or breach of the security of our technology infrastructure and systems; |
• | exposure to environmental liabilities; |
• | our failure to comply with applicable laws and regulations; |
• | our failure to maintain appropriate internal controls over financial reporting and disclosure controls and procedures; |
• | the impact on our reputation that could result from our actions or omissions or from those of others; changes in accounting principles and tax rules; |
• | our ability to maintain our status as a REIT for tax purposes; |
• | limitations imposed on our business due to our REIT status and our status as exempt from registration under the Investment Company Act of 1940; |
• | decisions about raising, managing, and distributing capital; and |
• | other factors not presently identified. |
THE REDWOOD REVIEW I 4TH QUARTER 2018 |
43 |