
T A B L E O F C O N T E N T S |
Introduction | |
Shareholder Letter | |
Quarterly Overview | |
Ñ Third Quarter Highlights | |
Ñ Quarterly Earnings and Analysis | |
Ñ Book Value | |
Ñ Capital Allocations | |
Ñ 2019 Updated Financial Outlook | |
Ñ Segment Results | |
Ñ Balance Sheet Analysis | |
Financial Tables | |
Appendix | |
Ñ Dividends | |
Ñ Non-GAAP Measurements | |
Ñ Forward-Looking Statements | |
THE REDWOOD REVIEW I 3RD QUARTER 2019 |
1 |
F O R W A R D - L O O K I N G S T A T E M E N T S |
THE REDWOOD REVIEW I 3RD QUARTER 2019 |
2 |
I N T R O D U C T I O N |
Selected Financial Highlights | |||||||||||||||
Quarter: Year | GAAP Income (Loss) per Share | REIT Taxable Income per Share (1) | Annualized GAAP Return on Equity | GAAP Book Value per Share | Dividends per Share | Economic Return on Book Value (2) | Recourse Leverage (3) | ||||||||
Q319 | $0.31 | $0.34 | 9% | $15.92 | $0.30 | 1.3% | 2.7x | ||||||||
Q219 | $0.30 | $0.25 | 8% | $16.01 | $0.30 | 1.9% | 3.1x | ||||||||
Q119 | $0.49 | $0.30 | 15% | $16.00 | $0.30 | 2.6% | 2.9x | ||||||||
Q418 | $(0.02) | $0.32 | —% | $15.89 | $0.30 | (1.4)% | 3.5x | ||||||||
Q318 | $0.42 | $0.27 | 12% | $16.42 | $0.30 | 3.0% | 3.1x | ||||||||
(1) | REIT taxable income per share for 2019 is an estimate until we file our tax return. |
(2) | Economic return on book value is based on the periodic change in GAAP book value per common share plus dividends declared per common share during the period. |
(3) | See Table 7 in the Financial Tables section of this Redwood Review for details of how our recourse debt to equity leverage ratio is calculated. |
THE REDWOOD REVIEW I 3RD QUARTER 2019 |
3 |
S H A R E H O L D E R L E T T E R |
THE REDWOOD REVIEW I 3RD QUARTER 2019 |
4 |
S H A R E H O L D E R L E T T E R |
 |  | |
Christopher J. Abate | Dashiell I. Robinson | |
Chief Executive Officer | President | |
THE REDWOOD REVIEW I 3RD QUARTER 2019 |
5 |
Q U A R T E R L Y O V E R V I E W |
Ñ | During the third quarter, we issued $228 million of common stock and generated $248 million of capital through portfolio optimization, ending the quarter with approximately $590 million of available capital and reducing our recourse leverage ratio to 2.7x, below our historical target range of 3.0x - 4.0x. |
Ñ | Our portfolio optimization activities during the quarter included the sale of $262 million of lower yielding securities, which freed-up $118 million of capital, and the completion of a new $185 million, non-mark-to-market, 3-year term facility, collateralized by a portion of our retained Sequoia securities, which generated $130 million of capital, after repayment of existing financing. |
Ñ | We deployed $152 million of capital toward new investments in the third quarter of 2019, including $55 million into proprietary investments and $98 million into third-party investments (which included $73 million into subordinate re-performing loan (RPL) securities issued by Freddie Mac). On page 12, we provide a supplemental overview of our RPL investment strategy. |
Ñ | We purchased $1.5 billion of residential jumbo loans during the third quarter of 2019, including a record $0.7 billion of Choice loans, and sold $1.6 billion of loans, through a combination of whole loan sales and three Sequoia securitizations, including our 100th overall. At September 30, 2019, our pipeline of jumbo residential loans identified for purchase was $1.3 billion. |
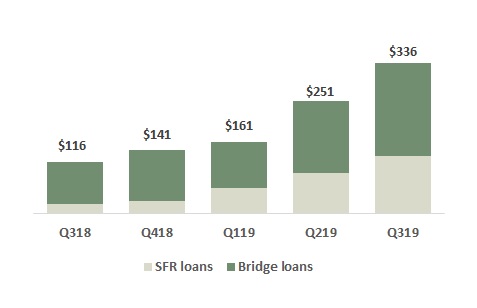
Ñ | We originated $162 million of business purpose residential loans (BPLs) during the third quarter and at September 30, 2019, our total portfolio of BPLs was $336 million, including both single-family rental and residential bridge loans. On page 21, we provide additional detail on BPL activity at our 5 Arches subsidiary. |
Ñ | In September, we issued $201 million of 5.75% 6-year exchangeable debt, which is excluded from our available capital, and will replace our $201 million of exchangeable debt maturing in November 2019. |
Ñ | Following the end of the third quarter, we completed our acquisition of CoreVest, a leading nationwide originator and portfolio manager of business purpose residential loans. The acquisition included CoreVest's operating platform and $900 million of related financial assets. Total transaction consideration was $492 million, net of in-place financing on certain of the financial assets. |
THE REDWOOD REVIEW I 3RD QUARTER 2019 |
6 |
Q U A R T E R L Y O V E R V I E W |
GAAP Net Income | ||||||||
($ in millions, except per share data) | ||||||||
Three Months Ended | ||||||||
9/30/2019 | 6/30/2019 | |||||||
Net interest income | $ | 34 | $ | 32 | ||||
Non-interest income | ||||||||
Mortgage banking activities, net | 10 | 19 | ||||||
Investment fair value changes, net | 11 | 3 | ||||||
Other income, net | 2 | 2 | ||||||
Realized gains, net | 5 | 3 | ||||||
Total non-interest income, net | 27 | 28 | ||||||
Operating expenses | (27 | ) | (26 | ) | ||||
Provision for income taxes | — | (2 | ) | |||||
GAAP net income | $ | 34 | $ | 31 | ||||
GAAP diluted earnings per common share | $ | 0.31 | $ | 0.30 | ||||
Non-GAAP Core Earnings (1) | ||||||||
($ in millions, except per share data) | ||||||||
Three Months Ended | ||||||||
9/30/2019 | 6/30/2019 | |||||||
GAAP net interest income | $ | 34 | $ | 32 | ||||
Change in basis and hedge interest | (3 | ) | 1 | |||||
Non-GAAP economic net interest income (1) | 31 | 34 | ||||||
Non-interest income | ||||||||
Mortgage banking activities, net | 10 | 19 | ||||||
Core investment fair value changes, net (1) | — | — | ||||||
Core other income, net (1) | 4 | 4 | ||||||
Core realized gains, net (1) | 25 | 16 | ||||||
Total non-interest income, net | 38 | 40 | ||||||
Core operating expenses | (25 | ) | (26 | ) | ||||
Core provision for income taxes (1) | — | (4 | ) | |||||
Core earnings (1) | $ | 43 | $ | 43 | ||||
Core diluted earnings per common share (2) | $ | 0.37 | $ | 0.39 | ||||
(1) | During the third quarter of 2019, we updated our definition of core earnings and economic net interest income. Prior period amounts presented above have been conformed. Additional information on Redwood's non-GAAP measures, including: economic net interest income; core investment fair value changes, net; core other income, net; core realized gains, net; core provision for income taxes; and core earnings as well as reconciliations to associated GAAP measures, is included in the Non-GAAP Measurements section of the Appendix. |
(2) | Additional information on the calculation of non-GAAP core diluted EPS can be found in Table 2 in the Financial Tables section of this Redwood Review. |
THE REDWOOD REVIEW I 3RD QUARTER 2019 |
7 |
Q U A R T E R L Y O V E R V I E W |
Ñ | Net interest income increased from the second quarter of 2019, as the benefit from continued capital deployment during the third quarter was partially offset by capital inflows that resulted from increased portfolio optimization activities, including an increase in opportunistic asset sales and the addition of incremental term financing within our investment portfolio. |
Ñ | Non-GAAP economic net interest income declined from the second quarter of 2019, due to lower mortgage rates and strong prepayment activity. Faster prepayments helped to improve the fair value of our subordinate investments, but negatively impacted our portfolio investments held at a premium. |
Ñ | Mortgage banking activities decreased primarily due to lower gross margins in our residential mortgage banking business, on similar loan purchase volume as the second quarter. Gross margins were driven lower primarily due to the impact of rate volatility on securitizations we executed during the third quarter. |
Ñ | Investment fair value changes was positively impacted by tightening credit spreads in our securities portfolio during the third quarter, benefiting fair values to a greater extent than in the second quarter. Our non-GAAP core earnings excludes these market valuation adjustments. |
Ñ | Realized gains in the third quarter resulted from the sale of $262 million of securities. After the repayment of associated debt, the security sales freed up $118 million of capital for reinvestment. |
Ñ | GAAP operating expenses increased primarily due to $2 million of transaction costs incurred in relation to the acquisition of CoreVest. We exclude these expenses from our non-GAAP core operating expenses. |
Ñ | The provision for income tax declined during the third quarter due to lower residential mortgage banking income at our taxable subsidiary during the third quarter, as compared with the second quarter. A reconciliation of GAAP and taxable income is set forth in Table 6 in the Financial Tables section of this Redwood Review. |
Ñ | Additional details on our earnings are included in the Segment Results section. |
THE REDWOOD REVIEW I 3RD QUARTER 2019 |
8 |
Q U A R T E R L Y O V E R V I E W |
Changes in GAAP Book Value per Share | ||||||||
($ in per share) | ||||||||
Three Months Ended | ||||||||
9/30/2019 | 6/30/2019 | |||||||
Beginning book value per share | $ | 16.01 | $ | 16.00 | ||||
Earnings | 0.31 | 0.30 | ||||||
Changes in unrealized gains on securities, net, from: | ||||||||
Realized gains recognized in earnings | (0.03 | ) | (0.02 | ) | ||||
Amortization income recognized in earnings | (0.01 | ) | (0.02 | ) | ||||
Mark-to-market adjustments, net | 0.06 | 0.11 | ||||||
Total change in unrealized gains on securities, net | 0.02 | 0.07 | ||||||
Dividends | (0.30 | ) | (0.30 | ) | ||||
Equity compensation, net | 0.02 | 0.02 | ||||||
Changes in unrealized losses on derivatives hedging long-term debt | (0.11 | ) | (0.10 | ) | ||||
Other, net | (0.03 | ) | 0.02 | |||||
Ending book value per share | $ | 15.92 | $ | 16.01 | ||||
Ñ | Our GAAP book value declined $0.09 per share to $15.92 per share during the third quarter of 2019. While GAAP earnings exceeded our third quarter dividend, book value decreased primarily due to an $0.11 per share decline in the value of derivatives hedging our long-term debt, which were impacted by the decline in benchmark interest rates during the third quarter. |
Ñ | Combining our third quarter dividend with our change in book value during the third quarter contributed to a positive economic return on book value(1) of 1.3% for the quarter. |
(1) | Economic return on book value is based on the periodic change in GAAP book value per common share plus dividends declared per common share during the period. |
THE REDWOOD REVIEW I 3RD QUARTER 2019 |
9 |
Q U A R T E R L Y O V E R V I E W |
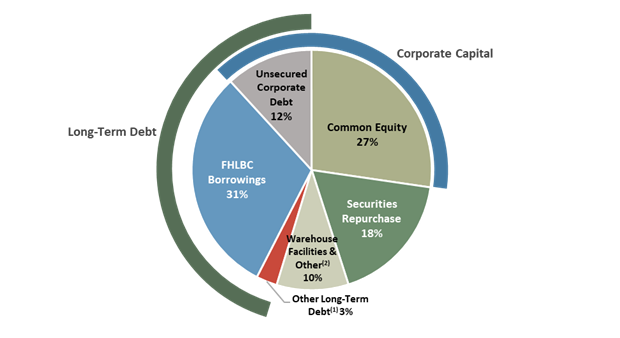
Ñ | We capitalize our business with a combination of equity and long-term unsecured corporate debt (which we collectively refer to as corporate “capital”). Our total capital of $2.6 billion at September 30, 2019 was comprised of $1.8 billion of equity capital and $0.8 billion of convertible notes and other long-term unsecured debt. |
Ñ | We also utilize various forms of collateralized debt to finance certain investments and to warehouse our inventory of certain loans held-for-sale. We do not consider this collateralized debt as "capital" and, therefore, exclude it from our capital allocation analysis. |
Ñ | Collectively, over 73% of our total funding sources are corporate capital and other long-term secured debt. |
Ñ | During the third quarter, capital raising combined with the completion of a new secured financing facility and portfolio optimization raised over $476 million of capital. This combined activity included $228 million of common equity raised in early September, a $185 million long-term, non-mark-to-market, 3-year-term secured debt facility collateralized by retained Sequoia residential securities (that generated $130 million of capital, after repayment of existing financing), and $118 million from security sales. |
Ñ | In late September, we issued $201 million of 5.75% 6-year exchangeable debt. This issuance will replace our exchangeable notes maturing in November of this year, and we therefore do not consider it incremental capital. |
THE REDWOOD REVIEW I 3RD QUARTER 2019 |
10 |
Q U A R T E R L Y O V E R V I E W |
Capital Allocation Detail | ||||||||||||||||||
By Investment Type | ||||||||||||||||||
September 30, 2019 | ||||||||||||||||||
($ in millions) | ||||||||||||||||||
GAAP Fair Value | Collateralized Short-Term Debt | Collateralized Long-Term Debt | Allocated Capital | % of Total Capital | ||||||||||||||
Residential loans (1) | $ | 2,420 | $ | — | $ | (1,945 | ) | $ | 475 | 19% | ||||||||
Business purpose residential loans | 226 | (139 | ) | (14 | ) | 72 | 3% | |||||||||||
Securities portfolio | ||||||||||||||||||
Sequoia residential securities | 505 | (155 | ) | (185 | ) | 166 | 6% | |||||||||||
Agency CRT securities | 141 | (8 | ) | — | 133 | 5% | ||||||||||||
Multifamily securities | 683 | (517 | ) | — | 167 | 7% | ||||||||||||
Re-performing residential loan securities (2) | 627 | (315 | ) | (41 | ) | 270 | 11% | |||||||||||
Other third-party residential securities | 254 | (163 | ) | — | 91 | 4% | ||||||||||||
Total securities portfolio (3) | 2,211 | (1,158 | ) | (226 | ) | 827 | 32% | |||||||||||
Other investments | 201 | — | — | 201 | 8% | |||||||||||||
Other assets/(liabilities) | (74 | ) | (3)% | |||||||||||||||
Cash and liquidity capital | 868 | N/A | ||||||||||||||||
Total Investments | $ | 5,057 | $ | (1,297 | ) | $ | (2,185 | ) | $ | 2,370 | 93% | |||||||
Residential mortgage banking | 130 | 5% | ||||||||||||||||
Business purpose mortgage banking | 55 | 2% | ||||||||||||||||
Total Mortgage banking | $ | 185 | 7% | |||||||||||||||
Total | $ | 2,554 | 100% | |||||||||||||||
(1) | Includes $43 million of FHLB stock, $34 million of cash and cash equivalents, and $77 million of restricted cash. |
(2) | Re-performing residential loan securities represent third-party securities collateralized by seasoned re-performing residential loans. |
(3) | In addition to our $1.3 billion of securities on our GAAP balance sheet, securities presented above also include $257 million, $454 million, and $214 million of securities retained from Sequoia Choice, Freddie Mac SLST, and Freddie Mac K-Series securitizations, respectively. For GAAP purposes, we consolidate these securitizations. |
Ñ | During the third quarter, we deployed capital into re-performing residential loan securities and business purpose residential loans, and reduced our capital allocations to Agency CRT securities, other third-party residential securities, and multifamily mezzanine securities. |
Ñ | Over the last several quarters, we have increased our allocation of capital to re-performing residential loan securities. The following section provides a summary of this investment opportunity. |
Ñ | At September 30, 2019, our cash and liquidity capital included $590 million of available capital. |
Ñ | In October 2019, we completed the acquisition of CoreVest for $492 million, net of in-place financing on financial assets acquired, with a mix of cash on hand and shares of Redwood stock. |
THE REDWOOD REVIEW I 3RD QUARTER 2019 |
11 |
Q U A R T E R L Y O V E R V I E W |
THE REDWOOD REVIEW I 3RD QUARTER 2019 |
12 |
Q U A R T E R L Y O V E R V I E W |
Re-Performing Residential Loan Securities by Type | ||||||||||||||||
September 30, 2019 | ||||||||||||||||
($ in millions) | ||||||||||||||||
GAAP Fair Value | Collateralized Short-Term Debt | Collateralized Long-Term Debt | Allocated Capital | |||||||||||||
Consolidated RPL securities | ||||||||||||||||
Subordinate | $ | 454 | $ | (289 | ) | $ | — | $ | 165 | |||||||
Other RPL securities | ||||||||||||||||
Senior / IO | 70 | — | (41 | ) | 29 | |||||||||||
Subordinate | 103 | (26 | ) | — | 76 | |||||||||||
Total other RPL securities | 173 | (26 | ) | (41 | ) | 105 | ||||||||||
Total Re-Performing Residential Loan Securities | $ | 627 | $ | (315 | ) | $ | (41 | ) | $ | 270 | ||||||
THE REDWOOD REVIEW I 3RD QUARTER 2019 |
13 |
Q U A R T E R L Y O V E R V I E W |
Ñ | Our investment portfolio returns through the first nine months of 2019, were near the high end of the 11-13% return on equity range previously provided, benefiting from higher gains associated with increased portfolio optimization activity. For the remainder of 2019, we expect economic net interest income to increase and core realized gains to moderate, keeping expected returns for this portfolio for the full year towards the higher end of our original range of 11-13%. With the acquisition of CoreVest, we expect to allocate approximately 85% of our capital to our investment portfolio for the remainder of 2019. |
Ñ | Investment returns include an estimate of portfolio economic net interest income, interest expense on corporate debt capital, core realized gains, direct operating expenses, and taxes. |
(1) | As with all forward-looking statements, our forward-looking statements relating to our 2019 financial outlook are subject to risks and uncertainties, including, among other things, those described in our Annual Report on Form 10-K under the caption “Risk Factors” and other risks, uncertainties, and factors that could cause actual results to differ materially from those described above and under the heading "Forward-Looking Statements" in the Appendix to this Redwood Review, including those described in the “Forward-Looking Statements” at the beginning of this Redwood Review. Although we may update our 2019 financial outlook subsequently in 2019, as a general matter we undertake no obligation to update or revise forward-looking statements, whether as a result of new information, future events, or otherwise. |
THE REDWOOD REVIEW I 3RD QUARTER 2019 |
14 |
Q U A R T E R L Y O V E R V I E W |
Ñ | Our residential mortgage banking platform had strong performance through the first nine months of 2019, generating a return on equity in excess of our originally projected range of mid to high teens. The outperformance was driven by gross margins above our long-term expectations of 75-100 basis points and strong volume growth. For the remainder of 2019, we expect gross margins to be within our long-term expected range and volume to remain stable, supporting full year results that we expect to be above our previously disclosed return range. We expect to maintain our current 5% allocation of capital to this platform for the remainder of 2019. |
Ñ | Mortgage banking returns include an estimate of loan purchase volume, gross margins, direct operating expenses, and taxes. |
Ñ | In May, subsequent to the acquisition of 5 Arches, we estimated we would allocate 3-4% of our capital to our business purpose mortgage banking platform for the remainder of 2019 and generate a return on equity in the low double digits. |
Ñ | Inclusive of both CoreVest's origination platform and 5 Arches, we expect to allocate approximately 10% of our capital to our business purpose mortgage banking platform for the remainder of 2019. This includes the platform premiums for both businesses and the working capital required to fund single-family rental loans in inventory. For the remainder of 2019, we expect to generate an overall return on equity from the platforms of 12-14%, bringing full-year results slightly below our previously disclosed return range. |
Ñ | Additionally, we expect both of these businesses to provide new accretive business purpose loans and securities for our investment portfolio, the anticipated returns on which are included in our investment portfolio outlook. |
Ñ | Expected returns include an estimate of mortgage banking income (including origination points and fees), other income, direct operating expenses, and taxes. Return expectations exclude the amortization of purchase-related intangibles and other items, consistent with what we exclude for core earnings. |
Ñ | We continue to expect our baseline corporate operating expenses to be between $48 million and $50 million, exclusive of any CoreVest acquisition-related expenses, with variable compensation commensurate with company performance. |
THE REDWOOD REVIEW I 3RD QUARTER 2019 |
15 |
Q U A R T E R L Y O V E R V I E W |
Ñ | Over the past several quarters, as demand for residential mortgage credit has continued to strengthen and drive prices higher, we have taken advantage of the opportunity to rotate out of portfolio investments whose forward return profile fell below our long-term targets. Year-to-date through the third quarter of 2019, we have sold over $500 million of securities and freed-up approximately $230 million of capital through portfolio optimization, locking in $53 million in core realized gains. These activities have benefited our GAAP and core results, but have impacted economic net interest income (ENII) as we have been selective in redeploying capital due to the overall credit spread environment. ENII is also impacted by hedging costs and premium amortization, and as such has been affected by the sharp rally in rates and overall heightened interest rate volatility we have observed since early in the second quarter of 2019. |
Ñ | With substantial portfolio optimization and the CoreVest acquisition complete, our investment portfolio has meaningfully increased sustainable earnings potential and we expect ENII to begin growing in the fourth quarter of 2019 and into 2020. We anticipate the key drivers towards this increase will be: |
Ñ | the investments acquired as part of the CoreVest acquisition; |
Ñ | a full quarter of income from our most recent investment in RPL securities issued by Freddie Mac; |
Ñ | improved returns on SFR loans originated by 5 Arches that we expect to be financed with long-term FHLB debt; and |
Ñ | incremental interest income from higher-returning BPL investments created by our newly expanded BPL origination platform |
THE REDWOOD REVIEW I 3RD QUARTER 2019 |
16 |
Q U A R T E R L Y O V E R V I E W |
Investment Portfolio Segment Contribution | ||||||||
($ in millions) | ||||||||
Three Months Ended | ||||||||
9/30/2019 | 6/30/2019 | |||||||
GAAP net interest income | $ | 38 | $ | 38 | ||||
Change in basis and hedge interest | (3 | ) | 1 | |||||
Non-GAAP economic net interest income (1) | 36 | 39 | ||||||
Non-GAAP other fair value changes, net (2) | 15 | 2 | ||||||
Other income, net | 2 | 3 | ||||||
Realized gains, net | 5 | 3 | ||||||
Operating expenses | (2 | ) | (2 | ) | ||||
Provision for income taxes | — | (1 | ) | |||||
Segment contribution (3) | $ | 55 | $ | 44 | ||||
Core earnings adjustments (4) | ||||||||
Eliminate non-GAAP other fair value changes, net (2) | (15 | ) | (2 | ) | ||||
Include cumulative gain on long-term investments sold, net | 20 | 13 | ||||||
Income taxes associated with core earnings adjustments | — | (1 | ) | |||||
Non-GAAP core segment contribution | $ | 60 | $ | 54 | ||||
(1) | During the third quarter of 2019, we updated our definition of non-GAAP economic net interest income. Consistent with management's definition of non-GAAP economic net interest income set forth in the Non-GAAP Measurements section of the Appendix, this measure, as presented above, is calculated in the same manner, inclusive only of amounts allocable to this segment. |
(2) | Non-GAAP other fair value changes, net, represents GAAP investment fair value changes adjusted to exclude the change in basis and hedge interest that is presented in the table above and included in non-GAAP economic net interest income. |
(3) | Segment contribution totals above are presented in accordance with GAAP. Within the table, "Change in basis and hedge interest" has been reallocated between investment fair value changes and net interest income as described above. |
(4) | During the third quarter of 2019, we updated our definition of core earnings. Consistent with management's definition of core earnings set forth on page 41, non-GAAP core segment contribution reflects GAAP segment contribution adjusted to reflect the portion of core earnings adjustments allocable to this segment. |
Ñ | Segment contribution from our investment portfolio improved during the third quarter, as we experienced a benefit to investment fair value changes from spread tightening and higher realized gains from sales of available-for-sale securities, offset by increased hedging costs from interest rate volatility and higher levels of prepayments on loans and securities held at premiums. |
THE REDWOOD REVIEW I 3RD QUARTER 2019 |
17 |
Q U A R T E R L Y O V E R V I E W |
Ñ | Core segment contribution improved during the third quarter, driven by an increase in gain on sale of long-term investments from portfolio optimization activities. |
Ñ | We deployed $152 million of capital in the third quarter, including $55 million into proprietary investments and $98 million into third-party investments. Proprietary investments included $21 million of business purpose loans originated by 5 Arches, $21 million into Sequoia RMBS, and $12 million into a home equity shared appreciation investment. Third-party investments included $73 million of Freddie Mac subordinate re-performing loan securities, $16 million of Agency CRT securities, a $5 million multifamily mezzanine loan, $3 million of Agency multifamily securities, and $1 million of third-party securities. |
Ñ | During the third quarter, we sold $262 million of lower yielding securities, which freed up approximately $118 million of capital for redeployment. Additionally, we completed a 3-year secured, non-mark-to-market term securities repurchase facility that generated approximately $130 million of capital for redeployment (after repayment of existing financing), while effectively enhancing the yield on the portfolio. |
Ñ | Credit fundamentals in our investment portfolio remain strong, benefiting from continued stability in the general economy and in housing. |
THE REDWOOD REVIEW I 3RD QUARTER 2019 |
18 |
Q U A R T E R L Y O V E R V I E W |
Mortgage Banking Segment Contribution | ||||||||
($ in millions) | ||||||||
Three Months Ended | ||||||||
9/30/2019 | 6/30/2019 | |||||||
Residential Mortgage Banking | ||||||||
Net interest income | $ | 5 | $ | 4 | ||||
Mortgage banking activities, net | 5 | 15 | ||||||
Mortgage banking income | 10 | 20 | ||||||
Other income, net | — | — | ||||||
Operating expenses | (6 | ) | (6 | ) | ||||
Provision for income taxes | — | (1 | ) | |||||
Residential mortgage banking segment contribution | $ | 5 | $ | 13 | ||||
Business Purpose Mortgage Banking | ||||||||
Net interest income | $ | 1 | $ | — | ||||
Mortgage banking activities, net | 4 | 4 | ||||||
Mortgage banking income | 5 | 4 | ||||||
Other income, net | ||||||||
Loan administration fees and other | 2 | 2 | ||||||
Amortization of intangible asset expense | (2 | ) | (2 | ) | ||||
Operating expenses | (6 | ) | (6 | ) | ||||
Provision for income taxes | — | — | ||||||
Business purpose mortgage banking segment contribution | $ | (1 | ) | $ | (2 | ) | ||
Mortgage banking segment contribution | $ | 3 | $ | 11 | ||||
Core earnings adjustments (1) | 2 | 2 | ||||||
Non-GAAP core segment contribution (2) | $ | 5 | $ | 12 | ||||
Jumbo loan purchase commitments | $ | 1,700 | $ | 1,695 | ||||
(1) | Includes amounts to eliminate purchase accounting adjustments and income tax adjustments of $0.4 million for both the third and second quarters of 2019, related to our business purpose mortgage banking operations. |
(2) | Consistent with management's definition of core earnings set forth on page 41, non-GAAP core segment contribution reflects GAAP segment contribution adjusted to reflect the portion of core earnings adjustments allocable to this segment. |
THE REDWOOD REVIEW I 3RD QUARTER 2019 |
19 |
Q U A R T E R L Y O V E R V I E W |
Ñ | Segment contribution from our residential mortgage banking operations decreased to $5 million in the third quarter from $13 million in the second quarter, due to lower gross margins on stable volume of purchase commitments. We define gross margins for this segment as mortgage banking income divided by loan purchase commitments. |
Ñ | Rate volatility during the quarter negatively impacted margins as the sharp decline in rates impacted execution on our mortgage loan pipeline. Toward the end of the quarter, volatility decreased and we saw pricing and margins improve. |
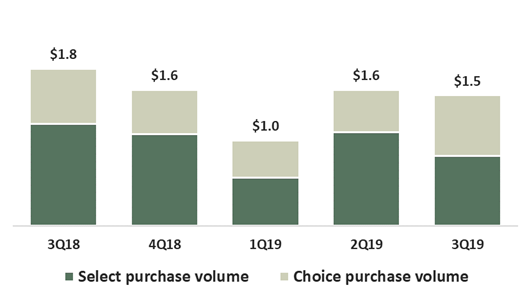
Ñ | The continued lower interest rate environment helped keep mortgage purchase volumes elevated, and we saw a 37% increase in Choice purchase volume, representing record quarterly volume for this loan type. At September 30, 2019, our pipeline of jumbo residential loans identified for purchase was $1.3 billion. |
Ñ | During the third quarter, we completed one Select securitization of $376 million and two Choice securitizations totaling $727 million. Additionally, we sold $470 million of whole loans to third parties. |
Ñ | Non-GAAP core segment contribution from our business purpose mortgage banking operations was $0.2 million for the third quarter. |
Ñ | During the third quarter of 2019, we originated $162 million of loans and associated funding commitments, including $126 million of residential bridge loans and $36 million of single-family rental loans. Loan fundings during this period totaled $127 million, including $91 million of residential bridge loans and $36 million of single-family rental loans. |
THE REDWOOD REVIEW I 3RD QUARTER 2019 |
20 |
Q U A R T E R L Y O V E R V I E W |
Ñ | The third quarter of 2019 represented our second full quarter of ownership of the 5 Arches platform, following our initial 20% investment in the platform in May 2018 and our full acquisition of the company in March 2019. We currently retain the majority of the single-family rental and bridge loans originated by 5 Arches, and at September 30, 2019, our portfolio of these assets totaled $336 million. Since the end of the third quarter, 5 Arches has originated an additional $140 million of business purpose loans (through October 28th), all of which we have retained on our balance-sheet. |
Ñ | Since our initial minority investment in 5 Arches and through September 30, 2019, we have deployed $68 million of capital into $207 million of bridge loans created by 5 Arches, which have generated core returns on capital of approximately 11% for our investment portfolio. Optimizing this capital for our currently available financing terms, we estimate levered returns to increase to 12-15%. |
Ñ | Additionally, during the third quarter we began financing 5 Arches originated SFR loans using our FHLB financing facility and as of September 30, 2019, we had $17 million of these loans financed with FHLB borrowings. Going forward, we anticipate transferring the majority of our remaining 5 Arches-originated SFR loans to our investment portfolio and financing them at the FHLB with an estimated core return on capital of 11-12%. |
Ñ | Total operating revenue in the third quarter of 2019 from 5 Arches origination and asset management activities rose 16% from the prior quarter, versus a 6% increase in operating expenses. |
THE REDWOOD REVIEW I 3RD QUARTER 2019 |
21 |
Q U A R T E R L Y O V E R V I E W |
Consolidated Balance Sheets (1) | ||||||||
($ in millions) | ||||||||
9/30/2019 | 6/30/2019 | |||||||
Residential loans | $ | 8,682 | $ | 7,283 | ||||
Business purpose residential loans | 336 | 251 | ||||||
Multifamily loans | 3,792 | 3,750 | ||||||
Real estate securities | 1,285 | 1,477 | ||||||
Other investments | 348 | 372 | ||||||
Cash and cash equivalents | 395 | 218 | ||||||
Other assets | 639 | 500 | ||||||
Total assets | $ | 15,476 | $ | 13,852 | ||||
Short-term debt | ||||||||
Mortgage loan warehouse facilities | $ | 233 | $ | 638 | ||||
Business purpose mortgage loan warehouse facilities | 198 | 174 | ||||||
Security repurchase facilities | 1,158 | 1,214 | ||||||
Servicer advance financing | 191 | 236 | ||||||
Convertible notes, net | 201 | 200 | ||||||
Other liabilities | 410 | 340 | ||||||
Asset-backed securities issued | ||||||||
Residential | 4,768 | 3,370 | ||||||
Multifamily | 3,578 | 3,543 | ||||||
Long-term debt, net | 2,954 | 2,573 | ||||||
Total liabilities | 13,691 | 12,288 | ||||||
Stockholders’ equity | 1,785 | 1,564 | ||||||
Total liabilities and equity | $ | 15,476 | $ | 13,852 | ||||
(1) | Our consolidated balance sheets include assets of consolidated variable interest entities (“VIEs”) that can only be used to settle obligations of these VIEs and liabilities of consolidated VIEs for which creditors do not have recourse to the primary beneficiary (Redwood Trust, Inc.). At September 30, 2019 and June 30, 2019, assets of consolidated VIEs totaled $9.6 billion and $7.9 billion, respectively, and liabilities of consolidated VIEs totaled $8.6 billion and $7.2 billion, respectively. See Table 10 in the Financial Tables section of this Redwood Review for additional detail on consolidated VIEs. |
Ñ | We have invested in several securitizations that we were required to consolidate under GAAP. See Table 9 in the Financial Tables section of this Redwood Review for additional information on these securitizations and other entities that we consolidate. |
THE REDWOOD REVIEW I 3RD QUARTER 2019 |
22 |
Q U A R T E R L Y O V E R V I E W |
Ñ | At September 30, 2019, we had $2.3 billion of residential loans held-for-investment. These loans are prime-quality, first lien jumbo loans, most of which were originated between 2013 and 2019. At September 30, 2019, 88% of these loans were fixed rate and the remainder were hybrid, and in aggregate, had a weighted average coupon of 4.16%. |
Ñ | At September 30, 2019, the weighted average FICO score of borrowers backing these loans was 768 (at origination) and the weighted average loan-to-value ("LTV") ratio of these loans was 66% (at origination). At September 30, 2019, 0.03% of these loans (by unpaid principal balance) were more than 90 days delinquent. |
Ñ | We finance our residential loan investments with $1.9 billion of variable-rate FHLB debt through our FHLB-member subsidiary. In connection with these borrowings, our FHLB-member subsidiary is required to hold $43 million of FHLB stock. |
Ñ | We seek to minimize the interest rate risk in this portfolio by using a combination of swaps, TBAs, and other derivative instruments. |
Ñ | At September 30, 2019, our $226 million of business purpose residential loans held-for-investment were comprised of $207 million of short-term, residential bridge loans, which were originated in 2018 and 2019, and $19 million of single-family rental loans, which were financed with variable-rate FHLB debt through our FHLB-member subsidiary. |
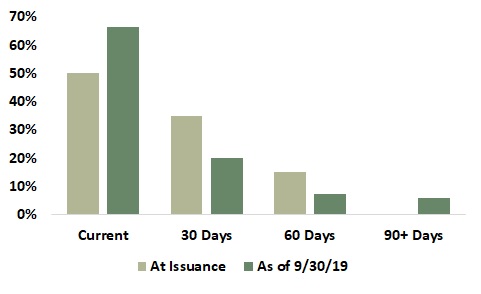
Ñ | At September 30, 2019, the residential bridge portfolio contained 392 loans with a weighted average coupon of 8.90% and a weighted average LTV ratio of 70% (at origination). At September 30, 2019, nine of these loans with a cumulative unpaid principal balance and fair value of $6 million were more than 90 days delinquent or in foreclosure. These delinquent loans had a weighted average LTV ratio of 79% (at origination), and we currently expect to recover the full carrying amount of these loans. Since September 30, 2019, two of these loans with a cumulative unpaid principal balance and fair value of $1 million were resolved with full repayment of principal, regular interest and expenses. |
Ñ | We finance our residential bridge loan investments with warehouse debt that had a balance of $139 million at September 30, 2019. |
Ñ | At September 30, 2019, our business purpose residential warehouse capacity for financing residential bridge loans totaled $330 million across four separate counterparties. |
THE REDWOOD REVIEW I 3RD QUARTER 2019 |
23 |
Q U A R T E R L Y O V E R V I E W |
Securities Portfolio - By Source and Security Type | |||||||||||||||||||||||
September 30, 2019 | |||||||||||||||||||||||
($ in millions) | |||||||||||||||||||||||
Interest-Only Securities | Senior | Mezzanine | Subordinate | Total | % of Total Securities | ||||||||||||||||||
Sequoia (1) | $ | 55 | $ | — | $ | 251 | $ | 200 | $ | 505 | 23 | % | |||||||||||
Re-performing (2) | 29 | 41 | 416 | 140 | 627 | 28 | % | ||||||||||||||||
Agency CRT | — | — | — | 141 | 141 | 6 | % | ||||||||||||||||
Other third-party | — | 84 | 89 | 81 | 254 | 12 | % | ||||||||||||||||
Total residential securities | $ | 84 | $ | 125 | $ | 756 | $ | 562 | $ | 1,527 | 69 | % | |||||||||||
Multifamily securities (3) | — | — | 494 | 190 | 683 | 31 | % | ||||||||||||||||
Total securities portfolio | $ | 84 | $ | 125 | $ | 1,249 | $ | 752 | $ | 2,211 | 100 | % | |||||||||||
(1) | Presents securities retained from our Sequoia securitizations that were issued from 2012 through 2019. These securities included $13 million of interest-only securities, $181 million of mezzanine securities, and $63 million of subordinate securities retained from our Sequoia Choice securitizations, which were consolidated for GAAP purposes. |
(2) | Re-performing securities included $454 million of mezzanine and subordinate securities issued from Agency residential securitizations that are consolidated for GAAP purposes. |
(3) | Multifamily securities included $24 million of mezzanine securities and $190 million of subordinate securities issued from Agency multifamily securitizations that are consolidated for GAAP purposes. |
THE REDWOOD REVIEW I 3RD QUARTER 2019 |
24 |
Q U A R T E R L Y O V E R V I E W |
Real Estate Securities Financed with Repurchase Debt | |||||||||||||||||||
September 30, 2019 | |||||||||||||||||||
($ in millions, except weighted average price) | |||||||||||||||||||
Real Estate Securities (3) | Repurchase Debt | Allocated Capital | Weighted Average Price (1) | Financing Haircut (2) | |||||||||||||||
Residential securities | |||||||||||||||||||
Senior | $ | 84 | $ | (77 | ) | $ | 7 | $ | 101 | 8 | % | ||||||||
Mezzanine | 289 | (249 | ) | 40 | 104 | 14 | % | ||||||||||||
Re-performing | 416 | (315 | ) | 101 | 91 | 24 | % | ||||||||||||
Total residential securities | 789 | (641 | ) | 148 | |||||||||||||||
Multifamily securities | 653 | (517 | ) | 137 | 88 | 21 | % | ||||||||||||
Total | $ | 1,443 | $ | (1,158 | ) | $ | 285 | $ | 93 | 20 | % | ||||||||
(1) | GAAP fair value per $100 of principal. |
(2) | Allocated capital divided by GAAP fair value. |
(3) | Includes $113 million, $385 million, and $209 million of securities we owned that were issued by consolidated Sequoia Choice, Freddie Mac SLST, and Freddie Mac K-Series securitizations, respectively. |
Ñ | In addition to the allocated capital listed in the table above that directly supports our repurchase facilities (i.e., “the haircut”), we continue to hold a designated amount of supplemental risk capital available for potential margin calls or future obligations relating to these facilities. |
Ñ | Additional information on the residential securities we own is set forth in Table 9 in the Financial Tables section of this Redwood Review. |
Ñ | At September 30, 2019, our other investments were primarily comprised of $238 million of servicer advance investments and associated excess servicing ($75 million of capital invested, net of non-recourse securitization debt collateralized by servicing-related assets), $40 million of MSRs retained from our Sequoia securitizations, $17 million of other excess servicing investments, and a $32 million investment in a light-renovation multifamily loan fund. |
THE REDWOOD REVIEW I 3RD QUARTER 2019 |
25 |
F I N A N C I A L I N S I G H T S |
Ñ | At September 30, 2019, we had $926 million of residential mortgages held-for-sale financed with $233 million of warehouse debt. These loans included $647 million of Select loans and $279 million of expanded-prime Choice loans. |
Ñ | Our residential warehouse capacity at September 30, 2019 totaled $1.4 billion across four separate counterparties. |
Ñ | At September 30, 2019, our pipeline of jumbo residential loans identified for purchase was $1.3 billion. |
Ñ | We seek to minimize the exposure we have to interest rates on our loan pipeline (for loans both on balance sheet and identified for purchase) by using a combination of TBAs, interest rate swaps, and other derivative instruments. |
Ñ | At September 30, 2019, we had 482 loan sellers, which included 184 jumbo sellers and 298 MPF Direct sellers from various FHLB districts. |
Ñ | At September 30, 2019, we had $110 million of single-family rental loans held-for-sale that were financed with $59 million of short-term warehouse debt. Going forward, we anticipate transferring the majority of our 5 Arches originated SFR loans to our investment portfolio and financing them at the FHLB. |
Ñ | At September 30, 2019, the weighted average coupon on these loans was 5.35% and the LTV ratio was 68% (at origination). |
Ñ | At September 30, 2019, our business purpose residential warehouse capacity for financing single-family rental loans totaled $400 million across two separate counterparties. |
Ñ | We seek to minimize the exposure we have to interest rates on our business purpose loan pipeline by using interest rate swaps and other derivative instruments. |
THE REDWOOD REVIEW I 3RD QUARTER 2019 |
26 |
Q U A R T E R L Y O V E R V I E W |
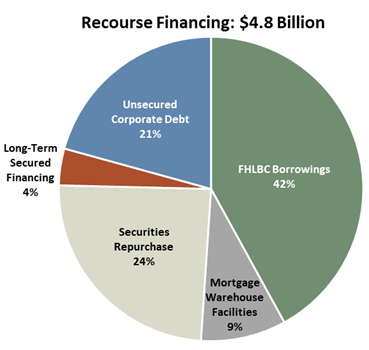 | |||
Borrowing Type | Average Cost of Funds | Average Remaining Term (yrs.) | |
FHLBC Borrowings | 2.5% | 6 | |
Unsecured Corporate Debt | 6.1% | 6 | |
Long-Term Secured Financing | 4.3% | 3 | |
Mortgage Warehouse | 4.2% | <1 | |
Securities Repurchase | 3.4% | <1 | |
Weighted Average Cost of Funds | 3.7% | ||
Ñ | Our unsecured corporate debt is comprised of $201 million of 5.75% exchangeable notes due in 2025, $200 million of 5.625% convertible notes due in 2024, $245 million of 4.75% convertible notes due in 2023, $201 million of 5.625% exchangeable notes due in 2019, and $140 million of trust-preferred securities due in 2037 (that we hedge to yield approximately 6.9%). |
Ñ | Proceeds from the issuance of our new exchangeable notes in September were used to pay down mortgage warehouse debt and we expect the balance of these borrowings to increase when we repay our exchangeable notes maturing in November 2019. |
Ñ | Our recourse debt to equity leverage ratio(1) decreased to 2.7x at the end of the third quarter from 3.1x at the end of the second quarter, primarily resulting from the issuance of $228 million of equity capital during the third quarter. As a result of the CoreVest acquisition, we expect our leverage ratio to increase toward the higher-end of our historical 3.0x - 4.0x target range. |
Ñ | In addition to our recourse financing, we have non-recourse ABS debt issued by securitization entities and other non-recourse short-term securitization debt that we consolidate. |
(1) | See Table 7 in the Financial Tables section of this Redwood Review for details of how our recourse debt to equity leverage ratio is calculated. |
THE REDWOOD REVIEW I 3RD QUARTER 2019 |
27 |
G L O S S A R Y |

THE REDWOOD REVIEW I 3RD QUARTER 2019 |
28 |
 | Table 1: GAAP Earnings (in thousands, except per share data) | |||||||||||||||||||||||||||||||||||||||||||||
2019 Q3 | 2019 Q2 | 2019 Q1 | 2018 Q4 | 2018 Q3 | 2018 Q2 | 2018 Q1 | 2017 Q4 | 2017 Q3 | Nine Months 2019 | Nine Months 2018 | ||||||||||||||||||||||||||||||||||||
Interest income | $ | 148,283 | $ | 146,483 | $ | 129,111 | $ | 116,858 | $ | 96,074 | $ | 79,128 | $ | 72,559 | $ | 67,370 | $ | 58,106 | $ | 423,877 | $ | 247,761 | ||||||||||||||||||||||||
Discount amortization on securities, net | 1,834 | 2,059 | 1,930 | 2,867 | 3,323 | 3,848 | 4,060 | 4,098 | 4,631 | 5,823 | 11,231 | |||||||||||||||||||||||||||||||||||
Total interest income | 150,117 | 148,542 | 131,041 | 119,725 | 99,397 | 82,976 | 76,619 | 71,468 | 62,737 | 429,700 | 258,992 | |||||||||||||||||||||||||||||||||||
Interest expense on short-term debt | (21,100 | ) | (21,141 | ) | (19,090 | ) | (16,567 | ) | (14,146 | ) | (12,666 | ) | (10,424 | ) | (9,841 | ) | (7,158 | ) | (61,331 | ) | (37,236 | ) | ||||||||||||||||||||||||
Interest expense on short-term convertible notes (1) | (3,139 | ) | (3,134 | ) | (3,128 | ) | (1,594 | ) | — | (509 | ) | (3,011 | ) | (3,025 | ) | (3,024 | ) | (9,401 | ) | (3,520 | ) | |||||||||||||||||||||||||
Interest expense on ABS issued from consolidated trusts | (71,065 | ) | (70,113 | ) | (55,295 | ) | (44,258 | ) | (27,421 | ) | (16,349 | ) | (11,401 | ) | (7,917 | ) | (3,956 | ) | (196,473 | ) | (55,171 | ) | ||||||||||||||||||||||||
Interest expense on long-term debt | (21,300 | ) | (21,832 | ) | (21,763 | ) | (22,542 | ) | (22,784 | ) | (18,689 | ) | (16,678 | ) | (15,325 | ) | (13,305 | ) | (64,895 | ) | (58,151 | ) | ||||||||||||||||||||||||
Total interest expense | (116,604 | ) | (116,220 | ) | (99,276 | ) | (84,961 | ) | (64,351 | ) | (48,213 | ) | (41,514 | ) | (36,108 | ) | (27,443 | ) | (332,100 | ) | (154,078 | ) | ||||||||||||||||||||||||
Net interest income | 33,513 | 32,322 | 31,765 | 34,764 | 35,046 | 34,763 | 35,105 | 35,360 | 35,294 | 97,600 | 104,914 | |||||||||||||||||||||||||||||||||||
Non-interest income | ||||||||||||||||||||||||||||||||||||||||||||||
Mortgage banking activities, net | 9,515 | 19,160 | 12,309 | 11,170 | 11,224 | 10,596 | 26,576 | 3,058 | 21,200 | 40,984 | 48,396 | |||||||||||||||||||||||||||||||||||
Investment fair value changes, net | 11,444 | 3,138 | 20,159 | (38,519 | ) | 10,332 | 889 | 1,609 | 384 | 324 | 34,741 | 12,830 | ||||||||||||||||||||||||||||||||||
Realized gains, net | 4,714 | 2,827 | 10,686 | 5,689 | 7,275 | 4,714 | 9,363 | 4,546 | 1,734 | 18,227 | 21,352 | |||||||||||||||||||||||||||||||||||
Other income, net | 1,825 | 2,407 | 3,587 | 3,981 | 3,453 | 3,322 | 2,118 | 2,963 | 2,812 | 7,819 | 8,893 | |||||||||||||||||||||||||||||||||||
Total non-interest income (loss), net | 27,498 | 27,532 | 46,741 | (17,679 | ) | 32,284 | 19,521 | 39,666 | 10,951 | 26,070 | 101,771 | 91,471 | ||||||||||||||||||||||||||||||||||
Fixed compensation expense | (9,391 | ) | (9,252 | ) | (8,205 | ) | (6,309 | ) | (5,922 | ) | (5,775 | ) | (6,439 | ) | (5,555 | ) | (5,233 | ) | (26,848 | ) | (18,136 | ) | ||||||||||||||||||||||||
Variable compensation expense | (4,090 | ) | (4,021 | ) | (4,402 | ) | (934 | ) | (4,923 | ) | (1,825 | ) | (6,907 | ) | (5,861 | ) | (6,467 | ) | (12,513 | ) | (13,655 | ) | ||||||||||||||||||||||||
Equity compensation expense | (3,155 | ) | (4,024 | ) | (2,953 | ) | (2,823 | ) | (3,033 | ) | (3,835 | ) | (2,697 | ) | (2,507 | ) | (2,337 | ) | (10,132 | ) | (9,565 | ) | ||||||||||||||||||||||||
Loan acquisition costs | (1,392 | ) | (1,516 | ) | (1,477 | ) | (1,837 | ) | (1,887 | ) | (2,155 | ) | (1,818 | ) | (1,625 | ) | (1,187 | ) | (4,385 | ) | (5,860 | ) | ||||||||||||||||||||||||
Other operating expense | (8,787 | ) | (7,442 | ) | (6,122 | ) | (7,350 | ) | (5,725 | ) | (5,419 | ) | (5,169 | ) | (4,819 | ) | (4,698 | ) | (22,351 | ) | (16,313 | ) | ||||||||||||||||||||||||
Total operating expenses | (26,815 | ) | (26,255 | ) | (23,159 | ) | (19,253 | ) | (21,490 | ) | (19,009 | ) | (23,030 | ) | (20,367 | ) | (19,922 | ) | (76,229 | ) | (63,529 | ) | ||||||||||||||||||||||||
(Provision for) benefit from income taxes | 114 | (2,333 | ) | (883 | ) | 1,255 | (4,919 | ) | (2,528 | ) | (4,896 | ) | 4,989 | (5,262 | ) | (3,102 | ) | (12,343 | ) | |||||||||||||||||||||||||||
Net income (loss) | $ | 34,310 | $ | 31,266 | $ | 54,464 | $ | (913 | ) | $ | 40,921 | $ | 32,747 | $ | 46,845 | $ | 30,933 | $ | 36,180 | $ | 120,040 | $ | 120,513 | |||||||||||||||||||||||
Diluted average shares (2) | 136,523 | 130,697 | 126,278 | 83,217 | 114,683 | 100,432 | 108,195 | 109,621 | 102,703 | 131,203 | 107,792 | |||||||||||||||||||||||||||||||||||
Diluted earnings (loss) per common share | $ | 0.31 | $ | 0.30 | $ | 0.49 | $ | (0.02 | ) | $ | 0.42 | $ | 0.38 | $ | 0.50 | $ | 0.35 | $ | 0.41 | $ | 1.09 | $ | 1.30 | |||||||||||||||||||||||
(1) | Represents interest expense on $201 million of exchangeable notes and $250 million of convertible notes, respectively, that were reclassified from Long-term debt to Short-term debt as the maturity of the notes was less than one year as of the dates presented. Convertible notes of $250 million were repaid in April 2018 and exchangeable notes of $201 million are due in November 2019. |
(2) | Diluted average shares includes shares from the assumed conversion of our convertible and/or exchangeable debt in certain periods, in accordance with GAAP diluted EPS provisions. See Table 2 that follows for details of this calculation for the current and prior quarter and our respective Quarterly Reports on Form 10-Q and Annual Reports on Form 10-K for prior periods. |
THE REDWOOD REVIEW I 3RD QUARTER 2019 | Table 1: GAAP Earnings 29 | |
| Table 2: GAAP and Non-GAAP Core Basic and Diluted Earnings (1) per Common Share (in thousands, except per share data) | ||||||||
2019 Q3 | 2019 Q2 | ||||||||
GAAP Earnings per Common Share ("EPS"): | |||||||||
Net income attributable to Redwood | $ | 34,310 | $ | 31,266 | |||||
Less: Dividends and undistributed earnings allocated to participating securities | (856 | ) | (877 | ) | |||||
Net income allocated to common shareholders for GAAP basic EPS | 33,454 | 30,389 | |||||||
Incremental adjustment to dividends and undistributed earnings allocated to participating securities | (180 | ) | (176 | ) | |||||
Add back: Interest expense on convertible notes for the period, net of tax (2) | 8,887 | 8,698 | |||||||
Net income allocated to common shareholders for GAAP diluted EPS | $ | 42,161 | $ | 38,911 | |||||
Basic weighted average common shares outstanding | 101,872 | 96,984 | |||||||
Net effect of dilutive equity awards | 363 | 271 | |||||||
Net effect of assumed convertible notes conversion to common shares (2) | 34,288 | 33,443 | |||||||
Diluted weighted average common shares outstanding | 136,523 | 130,697 | |||||||
GAAP Basic Earnings per Common Share | $ | 0.33 | $ | 0.31 | |||||
GAAP Diluted Earnings per Common Share | $ | 0.31 | $ | 0.30 | |||||
Non-GAAP Core Earnings per Common Share: | |||||||||
Non-GAAP core earnings | $ | 43,326 | $ | 43,286 | |||||
Less: Dividends and undistributed earnings allocated to participating securities | (1,099 | ) | (1,219 | ) | |||||
Non-GAAP core earnings allocated to common shareholders for core basic EPS | 42,227 | 42,067 | |||||||
Incremental adjustment to dividends and undistributed earnings allocated to participating securities | (121 | ) | (89 | ) | |||||
Add back: Interest expense on convertible notes for the period, net of tax (2) | 8,887 | 8,698 | |||||||
Non-GAAP core earnings allocated to common shareholders for core diluted EPS | $ | 50,993 | $ | 50,676 | |||||
Basic weighted average common shares outstanding | 101,872 | 96,984 | |||||||
Net effect of dilutive equity awards | 363 | 271 | |||||||
Net effect of assumed convertible notes conversion to common shares (2) | 34,288 | 33,443 | |||||||
Diluted weighted average common shares outstanding | 136,523 | 130,697 | |||||||
Non-GAAP Core Basic Earnings per Common Share | $ | 0.41 | $ | 0.43 | |||||
Non-GAAP Core Diluted Earnings per Common Share | $ | 0.37 | $ | 0.39 | |||||
(1) | A reconciliation of GAAP net income to non-GAAP core earnings and a definition of core earnings (which we updated during the third quarter of 2019) is included in the Non-GAAP Measurements section of the Appendix. |
(2) | Certain convertible notes were determined to be dilutive in the periods presented and were included in the calculations of diluted EPS under the "if-converted" method. Under this method, the periodic interest expense (net of applicable taxes) for dilutive notes is added back to the numerator and the number of shares that the notes are entitled to (if converted, regardless of whether they are in or out of the money) are included in the denominator. |
THE REDWOOD REVIEW I 3RD QUARTER 2019 | Table 2: GAAP and Non-GAAP Core Earnings per Basic and Diluted Common Share 30 | |
| Table 3: Segment Results ($ in thousands) | ||||||||||||||||||||||||||||||||||||||||||||
2019 Q3 | 2019 Q2 | 2019 Q1 | 2018 Q4 | 2018 Q3 | 2018 Q2 | 2018 Q1 | 2017 Q4 | 2017 Q3 | Nine Months 2019 | Nine Months 2018 | |||||||||||||||||||||||||||||||||||
Investment Portfolio | |||||||||||||||||||||||||||||||||||||||||||||
Net interest income | |||||||||||||||||||||||||||||||||||||||||||||
Residential loans | |||||||||||||||||||||||||||||||||||||||||||||
At Redwood | $ | 10,934 | $ | 11,115 | $ | 11,022 | $ | 11,659 | $ | 12,478 | $ | 13,842 | $ | 15,842 | $ | 16,032 | $ | 16,916 | $ | 33,071 | $ | 42,162 | |||||||||||||||||||||||
At consolidated Sequoia Choice entities | 3,979 | 3,694 | 3,549 | 3,608 | 2,880 | 2,002 | 1,386 | 836 | 22 | 11,222 | 6,268 | ||||||||||||||||||||||||||||||||||
At consolidated Freddie Mac SLST entities | 3,121 | 3,038 | 3,047 | 1,297 | — | — | — | — | — | 9,206 | — | ||||||||||||||||||||||||||||||||||
Business purpose residential loans | 2,454 | 1,740 | 1,521 | 1,861 | 974 | — | — | — | — | 5,715 | 974 | ||||||||||||||||||||||||||||||||||
Residential securities | 13,096 | 14,304 | 14,291 | 17,700 | 19,412 | 19,700 | 19,778 | 20,287 | 19,342 | 41,691 | 58,890 | ||||||||||||||||||||||||||||||||||
Multifamily and commercial investments | 3,760 | 4,063 | 3,964 | 3,296 | 2,209 | 1,860 | 1,888 | 1,749 | 1,298 | 11,787 | 5,957 | ||||||||||||||||||||||||||||||||||
Other investments | 1,031 | 182 | 171 | 913 | 751 | 161 | — | — | — | 1,384 | 912 | ||||||||||||||||||||||||||||||||||
Total net interest income | 38,375 | 38,136 | 37,565 | 40,334 | 38,704 | 37,565 | 38,894 | 38,904 | 37,578 | 114,076 | 115,163 | ||||||||||||||||||||||||||||||||||
Non-interest income | |||||||||||||||||||||||||||||||||||||||||||||
Investment fair value changes, net | 11,896 | 3,297 | 20,556 | (38,449 | ) | 10,566 | 1,600 | 1,590 | 4,568 | 1,372 | 35,749 | 13,756 | |||||||||||||||||||||||||||||||||
Other income, net | 2,313 | 2,874 | 1,221 | 3,659 | 3,334 | 3,322 | 2,118 | 2,963 | 2,812 | 6,408 | 8,774 | ||||||||||||||||||||||||||||||||||
Realized gains | 4,714 | 2,827 | 10,686 | 5,689 | 7,275 | 4,714 | 9,363 | 4,546 | 1,734 | 18,227 | 21,352 | ||||||||||||||||||||||||||||||||||
Total non-interest income, net | 18,923 | 8,998 | 32,463 | (29,101 | ) | 21,175 | 9,636 | 13,071 | 12,077 | 5,918 | 60,384 | 43,882 | |||||||||||||||||||||||||||||||||
Operating expenses | (2,191 | ) | (2,258 | ) | (2,661 | ) | (3,833 | ) | (2,659 | ) | (1,858 | ) | (2,007 | ) | (1,657 | ) | (1,324 | ) | (7,110 | ) | (6,524 | ) | |||||||||||||||||||||||
(Provision for) benefit from income taxes | (89 | ) | (896 | ) | (342 | ) | 1,117 | (2,840 | ) | (1,130 | ) | (888 | ) | (838 | ) | (433 | ) | (1,327 | ) | (4,858 | ) | ||||||||||||||||||||||||
Segment contribution | $ | 55,018 | $ | 43,980 | $ | 67,025 | $ | 8,517 | $ | 54,380 | $ | 44,213 | $ | 49,070 | $ | 48,486 | $ | 41,739 | $ | 166,023 | $ | 147,663 | |||||||||||||||||||||||
Mortgage Banking | |||||||||||||||||||||||||||||||||||||||||||||
Net interest income | $ | 5,834 | $ | 4,757 | $ | 4,813 | $ | 5,015 | $ | 6,890 | $ | 5,455 | $ | 6,760 | $ | 6,887 | $ | 6,491 | $ | 15,404 | $ | 19,105 | |||||||||||||||||||||||
Non-interest income | |||||||||||||||||||||||||||||||||||||||||||||
Mortgage banking activities | 9,515 | 19,160 | 12,309 | 11,170 | 11,224 | 10,596 | 26,576 | 3,058 | 21,200 | 40,984 | 48,396 | ||||||||||||||||||||||||||||||||||
Other income (expense), net | (252 | ) | (156 | ) | (167 | ) | — | — | — | — | — | — | (575 | ) | — | ||||||||||||||||||||||||||||||
Total non-interest income, net | 9,263 | 19,004 | 12,142 | 11,170 | 11,224 | 10,596 | 26,576 | 3,058 | 21,200 | 40,409 | 48,396 | ||||||||||||||||||||||||||||||||||
Operating expenses | (11,907 | ) | (11,571 | ) | (8,104 | ) | (7,231 | ) | (6,570 | ) | (5,739 | ) | (8,632 | ) | (7,104 | ) | (6,107 | ) | (31,582 | ) | (20,941 | ) | |||||||||||||||||||||||
Benefit from (provision for) income taxes | 203 | (1,437 | ) | (541 | ) | 138 | (2,079 | ) | (1,398 | ) | (4,008 | ) | 5,827 | (4,829 | ) | (1,775 | ) | (7,485 | ) | ||||||||||||||||||||||||||
Segment contribution | $ | 3,393 | $ | 10,753 | $ | 8,310 | $ | 9,092 | $ | 9,465 | $ | 8,914 | $ | 20,696 | $ | 8,668 | $ | 16,755 | $ | 22,456 | $ | 39,075 | |||||||||||||||||||||||
Corporate/other | (24,101 | ) | (23,467 | ) | (20,871 | ) | (18,522 | ) | (22,924 | ) | (20,380 | ) | (22,921 | ) | (26,221 | ) | (22,314 | ) | (68,439 | ) | (66,225 | ) | |||||||||||||||||||||||
GAAP net income (loss) | $ | 34,310 | $ | 31,266 | $ | 54,464 | $ | (913 | ) | $ | 40,921 | $ | 32,747 | $ | 46,845 | $ | 30,933 | $ | 36,180 | $ | 120,040 | $ | 120,513 | ||||||||||||||||||||||
THE REDWOOD REVIEW I 3RD QUARTER 2019 | Table 3: Segment Results 31 | |
| Table 4: Segment Assets and Liabilities ($ in thousands) | ||||||||||||||||||||||||||||||||||
September 30, 2019 | June 30, 2019 | ||||||||||||||||||||||||||||||||||
Investment Portfolio | Mortgage Banking | Corporate/ Other | Total | Investment Portfolio | Mortgage Banking | Corporate/ Other | Total | ||||||||||||||||||||||||||||
Residential loans | |||||||||||||||||||||||||||||||||||
At Redwood | $ | 2,267,218 | $ | 925,887 | $ | — | $ | 3,193,105 | $ | 2,395,314 | $ | 1,047,856 | $ | — | $ | 3,443,170 | |||||||||||||||||||
At consolidated Sequoia entities | 2,618,316 | — | 429,159 | 3,047,475 | 2,147,356 | — | 457,750 | 2,605,106 | |||||||||||||||||||||||||||
At consolidated Freddie Mac SLST entities | 2,441,223 | — | — | 2,441,223 | 1,235,089 | — | — | 1,235,089 | |||||||||||||||||||||||||||
Business purpose residential loans | 225,601 | 110,434 | — | 336,035 | 159,353 | 91,501 | — | 250,854 | |||||||||||||||||||||||||||
Multifamily loans at consolidated entities | 3,791,622 | — | — | 3,791,622 | 3,749,657 | — | — | 3,749,657 | |||||||||||||||||||||||||||
Real estate securities | 1,285,426 | — | — | 1,285,426 | 1,477,486 | — | — | 1,477,486 | |||||||||||||||||||||||||||
Other investments | 346,136 | 1,571 | — | 347,707 | 369,900 | 2,230 | — | 372,130 | |||||||||||||||||||||||||||
Cash and cash equivalents | 68,966 | 58,431 | 267,231 | 394,628 | 66,263 | 8,444 | 143,438 | 218,145 | |||||||||||||||||||||||||||
Other assets | 302,952 | 70,316 | 265,794 | 639,062 | 190,001 | 75,086 | 234,862 | 499,949 | |||||||||||||||||||||||||||
Total assets | $ | 13,347,460 | $ | 1,166,639 | $ | 962,184 | $ | 15,476,283 | $ | 11,790,419 | $ | 1,225,117 | $ | 836,050 | $ | 13,851,586 | |||||||||||||||||||
Short-term debt | |||||||||||||||||||||||||||||||||||
Mortgage loan warehouse debt | $ | — | $ | 233,224 | $ | — | $ | 233,224 | $ | — | $ | 638,055 | $ | — | $ | 638,055 | |||||||||||||||||||
Security repurchase facilities | 1,157,646 | — | — | 1,157,646 | 1,213,920 | — | — | 1,213,920 | |||||||||||||||||||||||||||
Business purpose residential loan warehouse facilities | 138,988 | 59,204 | — | 198,192 | 120,445 | 53,998 | — | 174,443 | |||||||||||||||||||||||||||
Servicer advance financing | 191,203 | — | — | 191,203 | 236,231 | — | — | 236,231 | |||||||||||||||||||||||||||
Convertible notes, net | — | — | 200,552 | 200,552 | — | — | 200,236 | 200,236 | |||||||||||||||||||||||||||
Other liabilities | 232,945 | 35,012 | 142,677 | 410,634 | 182,390 | 29,897 | 126,080 | 338,367 | |||||||||||||||||||||||||||
ABS issued | 7,926,161 | — | 419,890 | 8,346,051 | 6,464,267 | — | 448,862 | 6,913,129 | |||||||||||||||||||||||||||
Long-term debt, net | 2,184,663 | — | 769,059 | 2,953,722 | 1,999,999 | — | 573,174 | 2,573,173 | |||||||||||||||||||||||||||
Total liabilities | $ | 11,831,606 | $ | 327,440 | $ | 1,532,178 | $ | 13,691,224 | $ | 10,217,252 | $ | 721,950 | $ | 1,348,352 | $ | 12,287,554 | |||||||||||||||||||
THE REDWOOD REVIEW I 3RD QUARTER 2019 | Table 4: Segment Assets and Liabilities 32 | |
| Table 5: Changes in Book Value per Share ($ in per share) | ||||||||||||||||||||||||||||||||||||||||||||
2019 Q3 | 2019 Q2 | 2019 Q1 | 2018 Q4 | 2018 Q3 | 2018 Q2 | 2018 Q1 | 2017 Q4 | 2017 Q3 | Nine Months 2019 | Nine Months 2018 | |||||||||||||||||||||||||||||||||||
Beginning book value per share | $ | 16.01 | $ | 16.00 | $ | 15.89 | $ | 16.42 | $ | 16.23 | $ | 16.12 | $ | 15.83 | $ | 15.67 | $ | 15.29 | $ | 15.89 | $ | 15.83 | |||||||||||||||||||||||
Earnings | 0.31 | 0.30 | 0.49 | (0.02 | ) | 0.42 | 0.38 | 0.50 | 0.35 | 0.41 | 1.09 | 1.30 | |||||||||||||||||||||||||||||||||
Changes in unrealized gains on securities, net, from: | |||||||||||||||||||||||||||||||||||||||||||||
Realized gains recognized in earnings | (0.03 | ) | (0.02 | ) | (0.08 | ) | (0.07 | ) | (0.05 | ) | (0.05 | ) | (0.09 | ) | (0.03 | ) | (0.03 | ) | (0.12 | ) | (0.18 | ) | |||||||||||||||||||||||
Amortization income recognized in earnings | (0.01 | ) | (0.02 | ) | (0.02 | ) | (0.03 | ) | (0.03 | ) | (0.04 | ) | (0.04 | ) | (0.04 | ) | (0.05 | ) | (0.04 | ) | (0.10 | ) | |||||||||||||||||||||||
Mark-to-market adjustments, net | 0.06 | 0.11 | 0.10 | 0.06 | 0.01 | 0.01 | — | 0.12 | 0.27 | 0.26 | 0.02 | ||||||||||||||||||||||||||||||||||
Total change in unrealized gains on securities, net | 0.02 | 0.07 | — | (0.04 | ) | (0.07 | ) | (0.08 | ) | (0.13 | ) | 0.05 | 0.19 | 0.10 | (0.26 | ) | |||||||||||||||||||||||||||||
Dividends | (0.30 | ) | (0.30 | ) | (0.30 | ) | (0.30 | ) | (0.30 | ) | (0.30 | ) | (0.28 | ) | (0.28 | ) | (0.28 | ) | (0.90 | ) | (0.88 | ) | |||||||||||||||||||||||
Equity compensation, net | 0.02 | 0.02 | (0.02 | ) | (0.07 | ) | 0.03 | 0.03 | 0.03 | (0.02 | ) | 0.02 | 0.03 | 0.09 | |||||||||||||||||||||||||||||||
Changes in unrealized losses on derivatives hedging long-term debt | (0.11 | ) | (0.10 | ) | (0.06 | ) | (0.09 | ) | 0.06 | 0.05 | 0.11 | 0.02 | — | (0.28 | ) | 0.21 | |||||||||||||||||||||||||||||
Other, net | (0.03 | ) | 0.02 | — | (0.01 | ) | 0.05 | 0.03 | 0.06 | 0.04 | 0.04 | (0.01 | ) | 0.13 | |||||||||||||||||||||||||||||||
Ending book value per share | $ | 15.92 | $ | 16.01 | $ | 16.00 | $ | 15.89 | $ | 16.42 | $ | 16.23 | $ | 16.12 | $ | 15.83 | $ | 15.67 | $ | 15.92 | $ | 16.42 | |||||||||||||||||||||||
Economic return on book value (1) | 1.3 | % | 1.9 | % | 2.6 | % | (1.4 | )% | 3.0 | % | 2.5 | % | 3.6 | % | 2.8 | % | 4.3 | % | 5.9 | % | 9.3 | % | |||||||||||||||||||||||
(1) | Economic return on book value is based on the periodic change in GAAP book value per common share plus dividends declared per common share during the period. |
THE REDWOOD REVIEW I 3RD QUARTER 2019 | Table 5: Changes in Book Value per Share 33 | |
| Table 6: Taxable and GAAP Income (1) Differences and Dividends (In thousands, except for per share data) | ||||||||||||||||||||||||||||||||||||
Estimated Nine Months 2019 (2) | Actual Twelve Months 2018 (2) | Actual Twelve Months 2017 (2) | |||||||||||||||||||||||||||||||||||
Taxable Income | GAAP Income | Differences | Taxable Income | GAAP Income | Differences | Taxable Income | GAAP Income | Differences | |||||||||||||||||||||||||||||
Taxable and GAAP Income Differences | |||||||||||||||||||||||||||||||||||||
Interest income | $ | 226,174 | $ | 429,700 | $ | (203,526 | ) | $ | 265,400 | $ | 378,717 | $ | (113,317 | ) | $ | 225,079 | $ | 248,057 | $ | (22,978 | ) | ||||||||||||||||
Interest expense | (135,733 | ) | (332,100 | ) | 196,367 | (139,147 | ) | (239,039 | ) | 99,892 | (89,662 | ) | (108,816 | ) | 19,154 | ||||||||||||||||||||||
Net interest income | 90,441 | 97,600 | (7,159 | ) | 126,253 | 139,678 | (13,425 | ) | 135,417 | 139,241 | (3,824 | ) | |||||||||||||||||||||||||
Realized credit losses | 197 | — | 197 | (1,738 | ) | — | (1,738 | ) | (3,442 | ) | — | (3,442 | ) | ||||||||||||||||||||||||
Mortgage banking activities, net | 39,670 | 40,984 | (1,314 | ) | 57,212 | 59,566 | (2,354 | ) | 44,143 | 53,908 | (9,765 | ) | |||||||||||||||||||||||||
Investment fair value changes, net | 803 | 34,741 | (33,938 | ) | 4,927 | (25,689 | ) | 30,616 | (11,191 | ) | 10,374 | (21,565 | ) | ||||||||||||||||||||||||
Operating expenses | (71,097 | ) | (76,229 | ) | 5,132 | (78,097 | ) | (82,782 | ) | 4,685 | (73,203 | ) | (77,156 | ) | 3,953 | ||||||||||||||||||||||
Other income (expense), net | 15,634 | 7,819 | 7,815 | 17,519 | 12,874 | 4,645 | 31,325 | 12,436 | 18,889 | ||||||||||||||||||||||||||||
Realized gains, net | 42,566 | 18,227 | 24,339 | 43,099 | 27,041 | 16,058 | (736 | ) | 13,355 | (14,091 | ) | ||||||||||||||||||||||||||
(Provision for) benefit from income taxes | (401 | ) | (3,102 | ) | 2,701 | (538 | ) | (11,088 | ) | 10,550 | (516 | ) | (11,752 | ) | 11,236 | ||||||||||||||||||||||
Income | $ | 117,813 | $ | 120,040 | $ | (2,227 | ) | $ | 168,637 | $ | 119,600 | $ | 49,037 | $ | 121,797 | $ | 140,406 | $ | (18,609 | ) | |||||||||||||||||
REIT taxable income | $ | 91,948 | $ | 110,161 | $ | 90,122 | |||||||||||||||||||||||||||||||
Taxable income at taxable subsidiaries | 25,865 | 58,476 | 31,675 | ||||||||||||||||||||||||||||||||||
Taxable income | $ | 117,813 | $ | 168,637 | $ | 121,797 | |||||||||||||||||||||||||||||||
Shares used for taxable EPS calculation | 112,102 | 84,884 | 76,600 | ||||||||||||||||||||||||||||||||||
REIT taxable income per share | $ | 0.89 | $ | 1.38 | $ | 1.17 | |||||||||||||||||||||||||||||||
Taxable income (loss) per share at taxable subsidiaries | $ | 0.27 | $ | 0.75 | $ | 0.42 | |||||||||||||||||||||||||||||||
Taxable income per share (3) | $ | 1.16 | $ | 2.13 | $ | 1.59 | |||||||||||||||||||||||||||||||
Dividends | |||||||||||||||||||||||||||||||||||||
Dividends declared | $ | 91,931 | $ | 94,134 | $ | 86,271 | |||||||||||||||||||||||||||||||
Dividends per share (4) | $ | 0.90 | $ | 1.18 | $ | 1.12 | |||||||||||||||||||||||||||||||
(1) | Taxable income for 2019 is an estimate until we file our tax returns for 2019. To the extent we expect to pay tax at the corporate level (generally as a result of activity at our taxable REIT subsidiaries), we are required to record a tax provision for GAAP reporting purposes. Any tax provision (or benefit) is not necessarily the actual amount of tax currently due (or receivable as a refund) as a portion of our provision (or benefit) is deferred in nature. It is our intention to retain any excess inclusion income generated in 2019 at our TRS and not pass it through to our shareholders. |
(2) | Reconciliation of GAAP income to taxable income (loss) for prior quarters is provided in the respective Redwood Reviews for those quarters. |
(3) | Taxable income (loss) per share is based on the number of shares outstanding at the end of each quarter. The annual taxable income (loss) per share is the sum of the quarterly per share estimates. |
(4) | Dividends in 2018 were characterized as 69% ordinary dividend income (or $65 million) and 31% long-term capital gain dividend income (or $29 million). Dividends in 2017 were characterized as 71% ordinary dividend income (or $61 million) and 29% qualified dividend income (or $25 million). |
THE REDWOOD REVIEW I 3RD QUARTER 2019 | Table 6: Taxable and GAAP Income Differences and Dividends 34 | |
| Table 7: Financial Ratios and Book Value ($ in thousands, except per share data) | ||||||||||||||||||||||||||||||||||||||||||||
2019 Q3 | 2019 Q2 | 2019 Q1 | 2018 Q4 | 2018 Q3 | 2018 Q2 | 2018 Q1 | 2017 Q4 | 2017 Q3 | Nine Months 2019 | Nine Months 2018 | |||||||||||||||||||||||||||||||||||
Financial performance ratios | |||||||||||||||||||||||||||||||||||||||||||||
Net interest income | $ | 33,513 | $ | 32,322 | $ | 31,765 | $ | 34,764 | $ | 35,046 | $ | 34,763 | $ | 35,105 | $ | 35,360 | $ | 35,294 | $ | 97,600 | $ | 104,914 | |||||||||||||||||||||||
Operating expenses | $ | (26,815 | ) | $ | (26,255 | ) | $ | (23,159 | ) | $ | (19,253 | ) | $ | (21,490 | ) | $ | (19,009 | ) | $ | (23,030 | ) | $ | (20,367 | ) | $ | (19,922 | ) | $ | (76,229 | ) | $ | (63,529 | ) | ||||||||||||
GAAP net income | $ | 34,310 | $ | 31,266 | $ | 54,464 | $ | (913 | ) | $ | 40,921 | $ | 32,747 | $ | 46,845 | $ | 30,933 | $ | 36,180 | $ | 120,040 | $ | 120,513 | ||||||||||||||||||||||
Average total assets | $ | 14,017,627 | $ | 13,596,337 | $ | 11,795,343 | $ | 10,163,283 | $ | 8,503,749 | $ | 7,134,026 | $ | 6,922,611 | $ | 6,652,937 | $ | 5,851,133 | $ | 13,144,576 | $ | 7,519,264 | |||||||||||||||||||||||
Average total equity | $ | 1,591,792 | $ | 1,556,850 | $ | 1,452,282 | $ | 1,342,967 | $ | 1,331,497 | $ | 1,226,735 | $ | 1,218,015 | $ | 1,207,879 | $ | 1,189,540 | $ | 1,534,152 | $ | 1,259,165 | |||||||||||||||||||||||
Operating expenses / average total equity | 6.74 | % | 6.75 | % | 6.38 | % | 5.73 | % | 6.46 | % | 6.20 | % | 7.56 | % | 6.74 | % | 6.70 | % | 6.63 | % | 6.73 | % | |||||||||||||||||||||||
GAAP net income / average equity (GAAP ROE) | 8.62 | % | 8.03 | % | 15.00 | % | (0.27 | )% | 12.29 | % | 10.68 | % | 15.38 | % | 10.24 | % | 12.17 | % | 10.43 | % | 12.76 | % | |||||||||||||||||||||||
Leverage ratios and book value per share | |||||||||||||||||||||||||||||||||||||||||||||
Short-term debt | $ | 1,789,827 | $ | 2,227,183 | $ | 1,914,514 | $ | 2,138,686 | $ | 1,424,275 | $ | 1,426,288 | $ | 1,504,460 | $ | 1,938,682 | $ | 1,238,196 | |||||||||||||||||||||||||||
Long-term debt – Other | 2,971,552 | 2,584,499 | 2,584,499 | 2,584,499 | 2,785,264 | 2,785,264 | 2,585,264 | 2,585,264 | 2,585,264 | ||||||||||||||||||||||||||||||||||||
Total debt at Redwood | $ | 4,761,379 | $ | 4,811,682 | $ | 4,499,013 | $ | 4,723,185 | $ | 4,209,539 | $ | 4,211,552 | $ | 4,089,724 | $ | 4,523,946 | $ | 3,823,460 | |||||||||||||||||||||||||||
At consolidated securitization entities | |||||||||||||||||||||||||||||||||||||||||||||
ABS issued | 8,346,051 | 6,913,129 | 5,637,644 | 5,410,073 | 3,406,985 | 1,929,662 | 1,542,087 | 1,164,585 | 944,288 | ||||||||||||||||||||||||||||||||||||
Non-recourse short-term debt | 191,556 | 237,363 | 251,875 | 265,637 | — | — | — | — | — | ||||||||||||||||||||||||||||||||||||
Total ABS and non-recourse short-term debt | $ | 8,537,607 | $ | 7,150,492 | $ | 5,889,519 | $ | 5,675,710 | $ | 3,406,985 | $ | 1,929,662 | $ | 1,542,087 | $ | 1,164,585 | $ | 944,288 | |||||||||||||||||||||||||||
Consolidated debt (1) | $ | 13,298,986 | $ | 11,962,174 | $ | 10,388,532 | $ | 10,398,895 | $ | 7,616,524 | $ | 6,141,214 | $ | 5,631,811 | $ | 5,688,531 | $ | 4,767,748 | |||||||||||||||||||||||||||
Stockholders' equity | $ | 1,785,059 | $ | 1,564,032 | $ | 1,549,927 | $ | 1,348,794 | $ | 1,361,327 | $ | 1,228,955 | $ | 1,219,983 | $ | 1,212,287 | $ | 1,208,640 | |||||||||||||||||||||||||||
Total capital (2) | $ | 2,554,118 | $ | 2,337,442 | $ | 2,322,515 | $ | 2,120,572 | $ | 2,132,298 | $ | 1,999,177 | $ | 1,795,572 | $ | 1,787,701 | $ | 1,783,301 | |||||||||||||||||||||||||||
Recourse debt at Redwood to stockholders' equity (3) | 2.7x | 3.1x | 2.9x | 3.5x | 3.1x | 3.4x | 3.4x | 3.7x | 3.2x | ||||||||||||||||||||||||||||||||||||
Consolidated debt to stockholders' equity | 7.5x | 7.6x | 6.7x | 7.7x | 5.6x | 5.0x | 4.6x | 4.7x | 3.9x | ||||||||||||||||||||||||||||||||||||
Shares outstanding at period end (in thousands) | 112,102 | 97,715 | 96,866 | 84,884 | 82,930 | 75,743 | 75,703 | 76,600 | 77,123 | ||||||||||||||||||||||||||||||||||||
Book value per share | $ | 15.92 | $ | 16.01 | $ | 16.00 | $ | 15.89 | $ | 16.42 | $ | 16.23 | $ | 16.12 | $ | 15.83 | $ | 15.67 | |||||||||||||||||||||||||||
(1) | Amounts presented in Consolidated debt above do not include deferred issuance costs or debt discounts. |
(2) | Our total capital of $2.6 billion at September 30, 2019 included $1.8 billion of equity capital and $0.8 billion of unsecured corporate debt. |
(3) | Excludes ABS issued and non-recourse debt at consolidated entities. See Table 10 for additional detail on our ABS issued and short-term debt at consolidated entities. |
THE REDWOOD REVIEW I 3RD QUARTER 2019 | Table 7: Financial Ratios and Book Value 35 | |
| Table 8: Loans and Securities Activity ($ in thousands) | ||||||||||||||||||||||||||||||||||||||||||||
2019 Q3 | 2019 Q2 | 2019 Q1 | 2018 Q4 | 2018 Q3 | 2018 Q2 | 2018 Q1 | 2017 Q4 | 2017 Q3 | Nine Months 2019 | Nine Months 2018 | |||||||||||||||||||||||||||||||||||
Residential Loans, Held-for-Sale | |||||||||||||||||||||||||||||||||||||||||||||
Beginning carrying value | $ | 1,056,287 | $ | 819,221 | $ | 1,048,801 | $ | 866,444 | $ | 1,104,660 | $ | 1,130,185 | $ | 1,427,945 | $ | 925,681 | $ | 837,371 | $ | 1,048,801 | $ | 1,427,945 | |||||||||||||||||||||||
Acquisitions | 1,482,786 | 1,561,752 | 982,929 | 1,562,573 | 1,804,125 | 1,951,566 | 1,815,294 | 1,950,180 | 1,462,116 | 4,027,467 | 5,570,985 | ||||||||||||||||||||||||||||||||||
Sales | (846,677 | ) | (1,252,416 | ) | (833,078 | ) | (1,290,337 | ) | (1,133,078 | ) | (1,408,358 | ) | (1,594,531 | ) | (834,977 | ) | (1,393,323 | ) | (2,932,171 | ) | (4,135,967 | ) | |||||||||||||||||||||||
Principal repayments | (26,737 | ) | (32,401 | ) | (17,425 | ) | (14,862 | ) | (21,198 | ) | (14,612 | ) | (17,017 | ) | (14,771 | ) | (16,436 | ) | (76,563 | ) | (52,827 | ) | |||||||||||||||||||||||
Transfers between portfolios | (735,449 | ) | (43,250 | ) | (366,672 | ) | (81,639 | ) | (896,129 | ) | (561,710 | ) | (507,616 | ) | (601,554 | ) | 20,025 | (1,145,371 | ) | (1,965,455 | ) | ||||||||||||||||||||||||
Changes in fair value, net | (4,323 | ) | 3,381 | 4,666 | 6,622 | 8,064 | 7,589 | 6,110 | 3,386 | 15,928 | 3,724 | 21,763 | |||||||||||||||||||||||||||||||||
Ending fair value | $ | 925,887 | $ | 1,056,287 | $ | 819,221 | $ | 1,048,801 | $ | 866,444 | $ | 1,104,660 | $ | 1,130,185 | $ | 1,427,945 | $ | 925,681 | $ | 925,887 | $ | 866,444 | |||||||||||||||||||||||
Residential Loans, Held-for-Investment at Redwood (1) | |||||||||||||||||||||||||||||||||||||||||||||
Beginning carrying value | $ | 2,386,883 | $ | 2,404,870 | $ | 2,383,932 | $ | 2,320,662 | $ | 2,313,336 | $ | 2,375,785 | $ | 2,434,386 | $ | 2,268,802 | $ | 2,360,234 | $ | 2,383,932 | $ | 2,434,386 | |||||||||||||||||||||||
Acquisitions | — | — | 39,269 | — | — | — | — | — | — | 39,269 | — | ||||||||||||||||||||||||||||||||||
Sales | (6,641 | ) | (2,780 | ) | — | — | — | — | — | — | — | (9,421 | ) | — | |||||||||||||||||||||||||||||||
Principal repayments | (129,122 | ) | (94,005 | ) | (63,583 | ) | (59,854 | ) | (76,144 | ) | (79,375 | ) | (74,954 | ) | (93,916 | ) | (74,530 | ) | (286,710 | ) | (230,473 | ) | |||||||||||||||||||||||
Transfers between portfolios | 8,431 | 43,250 | 17,144 | 81,639 | 100,533 | 31,936 | 55,775 | 273,994 | (20,045 | ) | 68,825 | 188,244 | |||||||||||||||||||||||||||||||||
Changes in fair value, net | 7,667 | 35,548 | 28,108 | 41,485 | (17,063 | ) | (15,010 | ) | (39,422 | ) | (14,494 | ) | 3,143 | 71,323 | (71,495 | ) | |||||||||||||||||||||||||||||
Ending fair value | $ | 2,267,218 | $ | 2,386,883 | $ | 2,404,870 | $ | 2,383,932 | $ | 2,320,662 | $ | 2,313,336 | $ | 2,375,785 | $ | 2,434,386 | $ | 2,268,802 | $ | 2,267,218 | $ | 2,320,662 | |||||||||||||||||||||||
Business Purpose Residential Loans | |||||||||||||||||||||||||||||||||||||||||||||
Beginning carrying value | $ | 250,854 | $ | 160,612 | $ | 141,258 | $ | 115,620 | $ | — | $ | — | $ | — | $ | — | $ | — | $ | 141,258 | $ | — | |||||||||||||||||||||||
Originations | 126,742 | 134,133 | 35,968 | — | — | — | — | — | — | 296,843 | — | ||||||||||||||||||||||||||||||||||
Acquisitions | — | — | 29,093 | 41,563 | 126,214 | — | — | — | — | 29,093 | 126,214 | ||||||||||||||||||||||||||||||||||
Sales | (3,306 | ) | (22,811 | ) | (20,590 | ) | — | — | — | — | — | — | (46,707 | ) | — | ||||||||||||||||||||||||||||||
Principal repayments | (40,479 | ) | (22,939 | ) | (20,992 | ) | (16,469 | ) | (10,912 | ) | — | — | — | — | (84,410 | ) | (10,912 | ) | |||||||||||||||||||||||||||
Transfers between portfolios | — | — | (4,996 | ) | — | — | — | — | — | — | (4,996 | ) | — | ||||||||||||||||||||||||||||||||
Changes in fair value, net | 2,224 | 1,859 | 871 | 544 | 318 | — | — | — | — | 4,954 | 318 | ||||||||||||||||||||||||||||||||||
Ending fair value | $ | 336,035 | $ | 250,854 | $ | 160,612 | $ | 141,258 | $ | 115,620 | $ | — | $ | — | $ | — | $ | — | $ | 336,035 | $ | 115,620 | |||||||||||||||||||||||
Securities | |||||||||||||||||||||||||||||||||||||||||||||
Beginning fair value | $ | 1,477,486 | $ | 1,543,152 | $ | 1,452,494 | $ | 1,470,084 | $ | 1,453,936 | $ | 1,357,720 | $ | 1,476,510 | $ | 1,356,272 | $ | 1,218,503 | $ | 1,452,494 | $ | 1,476,510 | |||||||||||||||||||||||
Acquisitions | 68,167 | 91,960 | 157,472 | 132,457 | 161,534 | 223,022 | 144,465 | 204,733 | 188,138 | 317,599 | 529,021 | ||||||||||||||||||||||||||||||||||
Sales | (255,679 | ) | (164,372 | ) | (67,358 | ) | (109,782 | ) | (106,972 | ) | (103,685 | ) | (234,509 | ) | (75,887 | ) | (47,076 | ) | (487,409 | ) | (445,166 | ) | |||||||||||||||||||||||
Effect of principal repayments | (22,286 | ) | (13,953 | ) | (19,356 | ) | (22,562 | ) | (26,571 | ) | (17,022 | ) | (15,707 | ) | (21,503 | ) | (19,497 | ) | (55,595 | ) | (59,300 | ) | |||||||||||||||||||||||
Transfers between portfolios | — | (4,951 | ) | — | (6,090 | ) | (11,091 | ) | — | — | — | — | (4,951 | ) | (11,091 | ) | |||||||||||||||||||||||||||||
Change in fair value, net | 17,738 | 25,650 | 19,900 | (11,613 | ) | (752 | ) | (6,099 | ) | (13,039 | ) | 12,895 | 16,204 | 63,288 | (19,890 | ) | |||||||||||||||||||||||||||||
Ending fair value | $ | 1,285,426 | $ | 1,477,486 | $ | 1,543,152 | $ | 1,452,494 | $ | 1,470,084 | $ | 1,453,936 | $ | 1,357,720 | $ | 1,476,510 | $ | 1,356,272 | $ | 1,285,426 | $ | 1,470,084 | |||||||||||||||||||||||
(1) | Amounts presented include loans held-for-investment at Redwood that are financed at FHLB and exclude loans from consolidated securitization entities. |
THE REDWOOD REVIEW I 3RD QUARTER 2019 | Table 8: Loans and Securities Activity 36 | |
| Table 9: Investment Portfolio Detailed Balances ($ in thousands) | ||||||||||||||||||||||||||||||||||||
2019 Q3 | 2019 Q2 | 2019 Q1 | 2018 Q4 | 2018 Q3 | 2018 Q2 | 2018 Q1 | 2017 Q4 | 2017 Q3 | |||||||||||||||||||||||||||||
Residential Loans Held-for-Investment at Redwood | $ | 2,267,218 | $ | 2,386,883 | $ | 2,404,870 | $ | 2,383,932 | $ | 2,320,662 | $ | 2,313,336 | $ | 2,375,785 | $ | 2,434,386 | $ | 2,268,802 | |||||||||||||||||||
Business Purpose (Residential Bridge) Loans Held-for-Investment | 225,601 | 159,353 | 103,916 | 112,798 | 95,515 | — | — | — | — | ||||||||||||||||||||||||||||
Securities with Sub-Categories | |||||||||||||||||||||||||||||||||||||
Residential | |||||||||||||||||||||||||||||||||||||
Senior - New Issue | 50,497 | 76,923 | 79,389 | 48,553 | 48,076 | 49,099 | — | — | — | ||||||||||||||||||||||||||||
Senior - Legacy | 33,457 | 44,467 | 47,755 | 87,615 | 114,628 | 147,490 | 165,610 | 179,863 | 192,265 | ||||||||||||||||||||||||||||
Senior - IO | 41,831 | 49,019 | 57,542 | 62,601 | 64,673 | 64,018 | 53,957 | 38,990 | 40,671 | ||||||||||||||||||||||||||||
Mezzanine - New issue | 158,080 | 187,947 | 238,685 | 207,124 | 210,110 | 221,586 | 210,567 | 325,162 | 328,659 | ||||||||||||||||||||||||||||
Subordinate - New issue | 206,064 | 205,074 | 197,845 | 202,646 | 251,655 | 232,047 | 208,417 | 224,581 | 209,554 | ||||||||||||||||||||||||||||
Subordinate - Agency CRT | 140,881 | 208,603 | 274,112 | 276,894 | 235,720 | 239,767 | 245,654 | 300,713 | 286,780 | ||||||||||||||||||||||||||||
Subordinate - Legacy | 12,488 | 13,986 | 15,163 | 15,993 | 16,255 | 17,950 | 19,707 | 22,586 | 26,920 | ||||||||||||||||||||||||||||
Re-performing | 172,759 | 163,545 | 120,415 | 121,989 | 111,713 | 83,194 | 76,800 | 60,590 | 28,352 | ||||||||||||||||||||||||||||
Multifamily (mezzanine) | 469,369 | 527,922 | 512,246 | 429,079 | 417,254 | 398,785 | 377,008 | 324,025 | 243,071 | ||||||||||||||||||||||||||||
Total Securities on Balance Sheet | 1,285,426 | 1,477,486 | 1,543,152 | 1,452,494 | 1,470,084 | 1,453,936 | 1,357,720 | 1,476,510 | 1,356,272 | ||||||||||||||||||||||||||||
Sequoia Choice Securities (1) | 257,205 | 217,912 | 215,892 | 194,372 | 194,739 | 133,718 | 87,381 | 77,922 | 30,975 | ||||||||||||||||||||||||||||
Freddie Mac SLST Securities (1) | 453,750 | 243,323 | 235,285 | 228,921 | — | — | — | — | — | ||||||||||||||||||||||||||||
Freddie Mac K-Series Securities (1) | 214,045 | 206,600 | 128,642 | 125,523 | 66,559 | — | — | — | — | ||||||||||||||||||||||||||||
Adjusted Total Securities | 2,210,426 | 2,145,321 | 2,122,971 | 2,001,310 | 1,731,382 | 1,587,654 | 1,445,101 | 1,554,432 | 1,387,247 | ||||||||||||||||||||||||||||
Other Investments | |||||||||||||||||||||||||||||||||||||
Servicer Advance Investments (2) | 31,388 | 22,992 | 54,363 | 37,728 | — | — | — | — | — | ||||||||||||||||||||||||||||
Mortgage Servicing Rights | 39,837 | 47,396 | 55,284 | 60,281 | 63,785 | 64,674 | 66,496 | 63,598 | 62,928 | ||||||||||||||||||||||||||||
Excess MSRs | 32,937 | 33,620 | 28,992 | 27,312 | — | — | — | — | — | ||||||||||||||||||||||||||||
Investment in Multifamily Loan Fund | 32,158 | 28,678 | 22,416 | — | — | — | — | — | — | ||||||||||||||||||||||||||||
Other | 20,184 | 3,214 | 3,586 | 50,457 | 49,991 | 52,631 | — | — | — | ||||||||||||||||||||||||||||
Total earning assets | $ | 4,859,749 | $ | 4,827,457 | $ | 4,796,398 | $ | 4,673,818 | $ | 4,261,335 | $ | 4,018,295 | $ | 3,887,382 | $ | 4,052,416 | $ | 3,718,977 | |||||||||||||||||||
(1) | Represents securities retained from our consolidated Sequoia Choice securitizations and securities owned in consolidated Freddie Mac SLST and Freddie Mac K-Series securitizations. |
(2) | Represents our servicer advance investments net of associated non-recourse, short-term securitization debt. |
THE REDWOOD REVIEW I 3RD QUARTER 2019 | Table 9: Investment Portfolio Detailed Balances 37 | |
| Table 10: Consolidating Balance Sheet ($ in thousands) | ||||||||||||||||||||||||||||||||||||||||||||||||||||||||
September 30, 2019 | June 30, 2019 | ||||||||||||||||||||||||||||||||||||||||||||||||||||||||
Consolidated VIEs (1) | Consolidated VIEs (1) | ||||||||||||||||||||||||||||||||||||||||||||||||||||||||
At Redwood (1) | Legacy Sequoia | Sequoia Choice | Freddie Mac SLST | Freddie Mac K-Series | Servicing Investment | Redwood Consolidated | At Redwood (1) | Legacy Sequoia | Sequoia Choice | Freddie Mac SLST | Freddie Mac K-Series | Servicing Investment | Redwood Consolidated | ||||||||||||||||||||||||||||||||||||||||||||
Residential loans | $ | 3,193,105 | $ | 429,159 | $ | 2,618,316 | $ | 2,441,223 | $ | — | $ | — | $ | 8,681,803 | $ | 3,443,170 | $ | 457,750 | $ | 2,147,356 | $ | 1,235,089 | $ | — | $ | — | $ | 7,283,365 | |||||||||||||||||||||||||||||
Business purpose residential loans | 336,035 | — | — | — | — | — | 336,035 | 250,854 | — | — | — | — | — | 250,854 | |||||||||||||||||||||||||||||||||||||||||||
Multifamily loans | — | — | — | — | 3,791,622 | — | 3,791,622 | — | — | — | — | 3,749,657 | — | 3,749,657 | |||||||||||||||||||||||||||||||||||||||||||
Real estate securities | 1,285,426 | — | — | — | — | — | 1,285,426 | 1,477,486 | — | — | — | — | — | 1,477,486 | |||||||||||||||||||||||||||||||||||||||||||
Other investments | 109,391 | — | — | — | 238,316 | 347,707 | 97,513 | — | — | — | 274,617 | 372,130 | |||||||||||||||||||||||||||||||||||||||||||||
Cash and cash equivalents | 373,388 | — | — | — | — | 21,240 | 394,628 | 198,752 | — | — | — | — | 19,393 | 218,145 | |||||||||||||||||||||||||||||||||||||||||||
Other assets (2) | 582,401 | 1,319 | 10,821 | 7,299 | 11,300 | 25,922 | 639,062 | 446,126 | 2,363 | 8,960 | 3,786 | 11,317 | 27,397 | 499,949 | |||||||||||||||||||||||||||||||||||||||||||
Total assets | $ | 5,879,746 | $ | 430,478 | $ | 2,629,137 | $ | 2,448,522 | $ | 3,802,922 | $ | 285,478 | $ | 15,476,283 | $ | 5,913,901 | $ | 460,113 | $ | 2,156,316 | $ | 1,238,875 | $ | 3,760,974 | $ | 321,407 | $ | 13,851,586 | |||||||||||||||||||||||||||||
Short-term debt | $ | 1,789,614 | $ | — | $ | — | $ | — | $ | — | $ | 191,203 | $ | 1,980,817 | $ | 2,226,654 | $ | — | $ | — | $ | — | $ | — | $ | 236,231 | $ | 2,462,885 | |||||||||||||||||||||||||||||
Other liabilities | 365,293 | 456 | 8,964 | 5,498 | 10,805 | 19,618 | 410,634 | 298,641 | 519 | 7,336 | 2,774 | 10,822 | 18,275 | 338,367 | |||||||||||||||||||||||||||||||||||||||||||
ABS issued | — | 419,890 | 2,361,111 | 1,987,473 | 3,577,577 | — | 8,346,051 | — | 448,862 | 1,929,444 | 991,766 | 3,543,057 | — | 6,913,129 | |||||||||||||||||||||||||||||||||||||||||||
Long-term debt, net | 2,953,722 | — | — | — | — | — | 2,953,722 | 2,573,173 | — | — | — | — | — | 2,573,173 | |||||||||||||||||||||||||||||||||||||||||||
Total liabilities | 5,108,629 | 420,346 | 2,370,075 | 1,992,971 | 3,588,382 | 210,821 | 13,691,224 | 5,098,468 | 449,381 | 1,936,780 | 994,540 | 3,553,879 | 254,506 | 12,287,554 | |||||||||||||||||||||||||||||||||||||||||||
Equity | 771,117 | 10,132 | 259,062 | 455,551 | 214,540 | 74,657 | 1,785,059 | 815,433 | 10,732 | 219,536 | 244,335 | 207,095 | 66,901 | 1,564,032 | |||||||||||||||||||||||||||||||||||||||||||
Total liabilities and equity | $ | 5,879,746 | $ | 430,478 | $ | 2,629,137 | $ | 2,448,522 | $ | 3,802,922 | $ | 285,478 | $ | 15,476,283 | $ | 5,913,901 | $ | 460,113 | $ | 2,156,316 | $ | 1,238,875 | $ | 3,760,974 | $ | 321,407 | $ | 13,851,586 | |||||||||||||||||||||||||||||
(1) | The format of this consolidating balance sheet is provided to more clearly delineate between the assets belonging to consolidated securitization entities that we are required to consolidate on our balance sheet in accordance with GAAP, but which are not legally ours, and the liabilities of these consolidated entities, which are payable only from the cash flows generated by their assets and are, therefore, non-recourse to us, and the assets that are legally ours and the liabilities of ours for which there is recourse to us. |
(2) | At September 30, 2019 and June 30, 2019, other assets at Redwood included a total of $33 million and $43 million of assets, respectively, held by third-party custodians and pledged as collateral to the GSEs in connection with credit risk-sharing arrangements relating to conforming residential loans. These pledged assets can only be used to settle obligations to the GSEs under these risk-sharing arrangements. |
THE REDWOOD REVIEW I 3RD QUARTER 2019 | Table 10: Consolidating Balance Sheet 38 | |

D I V I D E N D S |
THE REDWOOD REVIEW I 3RD QUARTER 2019 |
40 |
N O N - G A A P M E A S U R E M E N T S |
THE REDWOOD REVIEW I 3RD QUARTER 2019 |
41 |
N O N - G A A P M E A S U R E M E N T S |
• | Investments impacted by this change include certain multifamily mezzanine securities and B-pieces, residential securities relating to re-performing residential loans, our servicer advance investment and related excess spread investment, and beginning in the second quarter of 2019, we also included certain subordinate securities. |
• | This change was introduced because there is an increasing amount of these types of investments in Redwood’s portfolio and management believes this change represents a more precise method of eliminating mark-to-market changes in the value of these assets which may not be reflective of the total return management would expect to earn from them over the longer-term. |
• | Under GAAP, available-for-sale securities are reported at their fair value with periodic changes in fair value recognized through the balance sheet in Shareholders’ equity. When an available-for-sale security is sold, the cumulative gain or loss since purchase is recognized through the income statement, in Realized gains, net, in the period the sale occurred. As a result, any such cumulative gains or losses are reflected in core earnings in the period the sale occurred. |
• | Under GAAP, trading securities are reported at their fair value with periodic changes in fair value recognized through the income statement in Investment fair value changes, net. Certain of these periodic changes in fair value (as described above) are excluded from core earnings. Core earnings includes an adjustment to include the cumulative net gains or losses (from purchase through the sale of the investment) for sold trading securities in the period they are sold. The result is to consistently present within core earnings the cumulative gains or losses from the sale of long-term investments, regardless of how they are accounted for under GAAP. |
THE REDWOOD REVIEW I 3RD QUARTER 2019 |
42 |
N O N - G A A P M E A S U R E M E N T S |
THE REDWOOD REVIEW I 3RD QUARTER 2019 |
43 |
N O N - G A A P M E A S U R E M E N T S |
THE REDWOOD REVIEW I 3RD QUARTER 2019 |
44 |
N O N - G A A P M E A S U R E M E N T S |
Reconciliation of Non-GAAP Core Earnings | ||||||||||||
($ in millions) | ||||||||||||
Three Months Ended September 30, 2019 | ||||||||||||
GAAP | Adjustments | Non-GAAP | ||||||||||
Net interest income | $ | 34 | $ | (3 | ) | $ | 31 | |||||
Non-interest income | ||||||||||||
Mortgage banking activities, net | 10 | — | 10 | |||||||||
Investment fair value changes, net (1) | 11 | (11 | ) | — | ||||||||
Other income, net (2) | 2 | 2 | 4 | |||||||||
Realized gains, net (3) | 5 | 20 | 25 | |||||||||
Total non-interest income, net | 27 | 11 | 38 | |||||||||
Operating expenses (4) | (27 | ) | 2 | (25 | ) | |||||||
Provision for income taxes (5) | — | (1 | ) | — | ||||||||
GAAP Net Income/Non-GAAP Core Earnings | $ | 34 | $ | 9 | $ | 43 | ||||||
Three Months Ended June 30, 2019 | ||||||||||||
GAAP | Adjustments | Non-GAAP | ||||||||||
Net interest income | $ | 32 | $ | 1 | $ | 34 | ||||||
Non-interest income | ||||||||||||
Mortgage banking activities, net | 19 | — | 19 | |||||||||
Investment fair value changes, net (1) | 3 | (3 | ) | — | ||||||||
Other income, net (2) | 2 | 2 | 4 | |||||||||
Realized gains, net (3) | 3 | 13 | 16 | |||||||||
Total non-interest income, net | 27 | 12 | 40 | |||||||||
Operating expenses (4) | (26 | ) | — | (26 | ) | |||||||
Provision for income taxes (5) | (2 | ) | (2 | ) | (4 | ) | ||||||
GAAP Net Income/Non-GAAP Core Earnings | $ | 31 | $ | 12 | $ | 43 | ||||||
(1) | References in this Redwood Review to core investment fair value changes, net refer to GAAP investment fair value changes, net as adjusted by the amount described in the "Adjustments" column, as further described above under the heading "What is Core Earnings?" |
(2) | References in this Redwood Review to core other income net, refer to GAAP other income, net as adjusted by the amount described in the "Adjustments" column, as further described above under the heading "What is Core Earnings?" |
(3) | References in this Redwood Review to core realized gains, net refer to GAAP realized gains, net as adjusted by the amount described in the "Adjustments" column, as further described above under the heading "What is Core Earnings?" |
(4) | References in this Redwood Review to core operating expenses refer to GAAP operating expenses as adjusted by the amount described in the "Adjustments" column, as further described above under the heading "What is Core Earnings?" |
(5) | References in this Redwood Review to core provision for income taxes refer to GAAP provision for income taxes as adjusted by the amount described in the "Adjustments" column, as further described above under the heading "What is Core Earnings?" |
THE REDWOOD REVIEW I 3RD QUARTER 2019 |
45 |
N O N - G A A P M E A S U R E M E N T S |
• | Core other income, net |
• | Core realized gains, net |
• | Core operating expenses |
• | Core provision for income taxes |
THE REDWOOD REVIEW I 3RD QUARTER 2019 |
46 |
N O N - G A A P M E A S U R E M E N T S |
Components of Investment Portfolio Fair Value Changes, Net by Investment Type | ||||||||
($ in millions) | ||||||||
Three Months Ended | ||||||||
9/30/2019 | 6/30/2019 | |||||||
Market valuation changes on: | ||||||||
Residential loans held-for-investment at fair value | ||||||||
Change in fair value from the reduction in basis (1) | $ | (2 | ) | $ | (1 | ) | ||
Other fair value changes (2) | 10 | 37 | ||||||
Total change in fair value of residential loans held-for-investment | 8 | 36 | ||||||
Real estate securities classified as trading | ||||||||
Change in fair value from the reduction in basis (1) | — | 1 | ||||||
Other fair value changes (2) | 42 | 31 | ||||||
Total change in fair value of real estate securities | 42 | 32 | ||||||
Risk management derivatives | ||||||||
Interest component of hedges (3) | — | 1 | ||||||
Other fair value changes (4) | (37 | ) | (66 | ) | ||||
Total change in fair value of risk management derivatives | (37 | ) | (65 | ) | ||||
Total investment portfolio fair value changes, net | $ | 12 | $ | 3 | ||||
(1) | Reflects the change in fair value due to principal changes, which is calculated as the change in principal on a given investment during the period, multiplied by the amount that the acquisition price for that investment is above or below par in percentage terms or for certain securities, the change in fair value reflecting the expected receipt of cash flows. During the third quarter of 2019, we updated our calculation of the quarterly change in basis for certain investments accounted for under the fair value option. Prior period amounts presented above have been conformed. |
(2) | Reflects changes in prepayment assumptions and credit spreads on our residential loans, trading securities and conforming risk-sharing investments primarily due to changes in benchmark interest rates. This item is excluded from management's definition of core earnings. |
(3) | Reflects the net interest paid or received on hedges associated with fair value investments. |
(4) | Reflects the change in fair value of our risk management derivatives that are associated with changes in benchmark interest rates during the period. This item is excluded from management's definition of core earnings. |
THE REDWOOD REVIEW I 3RD QUARTER 2019 |
47 |
N O N - G A A P M E A S U R E M E N T S |
THE REDWOOD REVIEW I 3RD QUARTER 2019 |
48 |
N O N - G A A P M E A S U R E M E N T S |
• | Investments impacted by this change include certain multifamily mezzanine securities and B-pieces, residential securities relating to re-performing residential loans, our servicer advance investment and related excess spread investment, and beginning in the second quarter of 2019, we also included certain subordinate securities accounted for under the fair value option. As noted above, these investments are principal-only securities and investments that do not generally receive cash flows until maturity. |
• | This change has been introduced because there is an increasing amount of these types of investments in Redwood’s portfolio and management believes this change represents a more precise method of determining the impact that this aspect of the change in basis for these fair value investments should have on economic net interest income. |
Reconciliation to Non-GAAP Economic Net Interest Income | ||||||||
($ in millions) | ||||||||
Three Months Ended | ||||||||
9/30/2019 | 6/30/2019 | |||||||
Net interest income | $ | 34 | $ | 32 | ||||
Adjustments | ||||||||
Change in basis of fair value investments | (2 | ) | (1 | ) | ||||
Interest component of hedges | — | 2 | ||||||
Non-GAAP economic net interest income | $ | 31 | $ | 34 | ||||
THE REDWOOD REVIEW I 3RD QUARTER 2019 |
49 |
N O N - G A A P M E A S U R E M E N T S |
• | Non-GAAP other fair value changes, net represents GAAP investment fair value changes, net, adjusted to exclude the amount of fair value changes that are included in non-GAAP economic net interest income, as described above. Effectively, this amount of fair value changes is excluded from investment fair value changes, net and included with net interest income to calculate economic net interest income. |
• | Core investment fair value changes, net represents non-GAAP other fair value changes, net, adjusted to exclude the component of mark-to-market changes on long-term investments and associated derivatives that were not otherwise included in the adjustment to arrive at non-GAAP other fair value changes, net. |
THE REDWOOD REVIEW I 3RD QUARTER 2019 |
50 |
N O N - G A A P M E A S U R E M E N T S |
Reconciliation to Non-GAAP Other Fair Value Changes, Net and Non-GAAP Core Investment Fair Value Changes, Net | ||||||||
($ in millions) | ||||||||
Three Months Ended | ||||||||
9/30/2019 | 6/30/2019 | |||||||
Investment fair value changes, net | $ | 11 | $ | 3 | ||||
Adjustments | ||||||||
Change in basis of fair value investments | 2 | 1 | ||||||
Interest component of hedges | — | (2 | ) | |||||
Non-GAAP Other Fair Value Changes, Net | $ | 14 | $ | 2 | ||||
Core adjustments | ||||||||
Eliminate mark-to-market changes on long-term investments and associated derivatives | (14 | ) | (2 | ) | ||||
Non-GAAP Core Investment Fair Value Changes, Net | $ | — | $ | — | ||||
THE REDWOOD REVIEW I 3RD QUARTER 2019 |
51 |
F O R W A R D - L O O K I N G S T A T E M E N T S |
THE REDWOOD REVIEW I 3RD QUARTER 2019 |
52 |
F O R W A R D - L O O K I N G S T A T E M E N T S |
• | the pace at which we redeploy our available capital into new investments and initiatives; |
• | our ability to scale our platform and systems, particularly with respect to our new initiatives; |
• | interest rate volatility, changes in credit spreads, and changes in liquidity in the market for real estate securities and loans; |
• | changes in the demand from investors for residential mortgages and investments, and our ability to distribute residential mortgages through our whole-loan distribution channel; |
• | our ability to finance our investments in securities and our acquisition of residential mortgages with short-term debt; |
• | changes in the values of assets we own; |
• | general economic trends, the performance of the housing, real estate, mortgage, credit, and broader financial markets, and their effects on the prices of earning assets and the credit status of borrowers; |
• | federal and state legislative and regulatory developments, and the actions of governmental authorities, including the new U.S. presidential administration, and in particular those affecting the mortgage industry or our business (including, but not limited to, the Federal Housing Finance Agency’s rules relating to FHLB membership requirements and the implications for our captive insurance subsidiary’s membership in the FHLB); |
• | strategic business and capital deployment decisions we make; |
• | developments related to the fixed income and mortgage finance markets and the Federal Reserve’s statements regarding its future open market activity and monetary policy; |
• | our exposure to credit risk and the timing of credit losses within our portfolio; |
• | the concentration of the credit risks we are exposed to, including due to the structure of assets we hold and the geographical concentration of real estate underlying assets we own; |
• | our exposure to adjustable-rate mortgage loans; |
• | the efficacy and expense of our efforts to manage or hedge credit risk, interest rate risk, and other financial and operational risks; |
THE REDWOOD REVIEW I 3RD QUARTER 2019 |
53 |
F O R W A R D - L O O K I N G S T A T E M E N T S |
• | changes in credit ratings on assets we own and changes in the rating agencies’ credit rating methodologies; |
• | changes in interest rates; |
• | changes in mortgage prepayment rates; |
• | changes in liquidity in the market for real estate securities and loans; |
• | our ability to finance the acquisition of real estate-related assets with short-term debt; |
• | the ability of counterparties to satisfy their obligations to us; |
• | our involvement in securitization transactions, the profitability of those transactions, and the risks we are exposed to in engaging in securitization transactions; |
• | exposure to claims and litigation, including litigation arising from our involvement in securitization transactions; |
• | ongoing litigation against various trustees of RMBS transactions; |
• | whether we have sufficient liquid assets to meet short-term needs; |
• | our ability to successfully compete and retain or attract key personnel; |
• | our ability to adapt our business model and strategies to changing circumstances; |
• | changes in our investment, financing, and hedging strategies and new risks we may be exposed to if we expand our business activities; |
• | our exposure to a disruption or breach of the security of our technology infrastructure and systems; |
• | exposure to environmental liabilities; |
• | our failure to comply with applicable laws and regulations; |
• | our failure to maintain appropriate internal controls over financial reporting and disclosure controls and procedures; |
• | the impact on our reputation that could result from our actions or omissions or from those of others; changes in accounting principles and tax rules; |
• | our ability to maintain our status as a REIT for tax purposes; |
• | limitations imposed on our business due to our REIT status and our status as exempt from registration under the Investment Company Act of 1940; |
• | decisions about raising, managing, and distributing capital; and |
• | other factors not presently identified. |
THE REDWOOD REVIEW I 3RD QUARTER 2019 |
54 |