Exhibit 99.2
| | |
|
| T A B L E O F C O N T E N T S |
| | | | | |
| Introduction | |
| |
| Shareholder Letter | |
| |
| Quarterly Results | |
| |
Ñ Fourth Quarter Overview | |
| |
Ñ Quarterly Earnings and Analysis | |
| |
Ñ Book Value | |
| |
Ñ Analysis of Operating Results | |
| |
| 2021 Financial Outlook | |
| |
| Quarterly Positions | |
| |
Ñ Capital Allocations | |
| |
Ñ Financing Overview | |
| |
Ñ Credit Overview | |
| |
| Financial Tables | |
| |
| Appendix | |
| |
Ñ Segment Overview | |
| |
Ñ Dividends and Taxable Income | |
| |
Ñ Non-GAAP Measurements | |
| |
Ñ Forward-Looking Statements | |
| |
| Endnotes | |
| | |
|
|
| THE REDWOOD REVIEW I 4TH QUARTER 2020 |
1 |
Note to Readers:
We file annual reports (on Form 10-K) and quarterly reports (on Form 10-Q) with the Securities and Exchange Commission. These filings and our earnings press releases provide information about Redwood and our financial results in accordance with generally accepted accounting principles (GAAP). These documents, as well as information about our business and a glossary of terms we use in this and other publications, are available through our website, www.redwoodtrust.com. We encourage you to review these documents.
Within this document, in addition to our GAAP results, we also present certain non-GAAP measures. When we present a non-GAAP measure, we accompany it with a description of that measure and a reconciliation to the comparable GAAP measure.
References herein to “Redwood,” the “company,” “we,” “us,” and “our” include Redwood Trust, Inc. and its consolidated subsidiaries. Note that because we generally round numbers in the tables to millions, except per share amounts, some numbers may not foot due to rounding. References to the “fourth quarter” refer to the quarter ended December 31, 2020, and references to the “third quarter” refer to the quarter ended September 30, 2020, unless otherwise specified.
Forward-looking statements:
This Redwood Review contains forward-looking statements within the meaning of the safe harbor provisions of the Private Securities Litigation Reform Act of 1995. Forward-looking statements involve numerous risks and uncertainties. Our actual results may differ from our expectations, estimates, and projections and, consequently, you should not rely on these forward-looking statements as predictions of future events. Forward-looking statements are not historical in nature and can be identified by words such as “anticipate,” “estimate,” “will,” “should,” “expect,” “believe,” “intend,” “seek,” “plan,” and similar expressions or their negative forms, or by references to strategy, plans, goals, or intentions. These forward-looking statements are subject to risks and uncertainties, including, among other things, those described in our Annual Report on Form 10-K under the caption “Risk Factors”, in our first quarter 2020 Form 10-Q under the caption "Risk Factors", and in our Current Report on Form 8-K filed on April 2, 2020. Many of these risks and uncertainties have been, and will be, exacerbated by the COVID-19 pandemic and any worsening of the global business and economic environment as a result. Other risks, uncertainties, and factors that could cause actual results to differ materially from those projected are described below and may be described from time to time in reports we file with the Securities and Exchange Commission, including reports on Forms 10-K, 10-Q, and 8-K. We undertake no obligation to update or revise forward-looking statements, whether as a result of new information, future events, or otherwise.
Statements regarding the following subjects, among others, are forward-looking by their nature: statements we make regarding Redwood’s business strategy and strategic focus, statements related to our financial outlook and expectations for 2021 and future years, statements regarding our available capital and sourcing additional capital both internally and from the capital markets, and other statements regarding pending business activities and expectations and estimates relating to our business and financial results. Additional detail regarding the forward-looking statements in this Redwood Review and the important factors that may affect our actual results in 2021 are described in the Appendix of this Redwood Review under the heading “Forward-Looking Statements.”
| | |
| Detailed endnotes are included at the end of this Redwood Review. |
|
| THE REDWOOD REVIEW I 4TH QUARTER 2020 |
2 |
| | |
|
| S H A R E H O L D E R L E T T E R |
Dear Fellow Shareholders:
What a difference a year makes. As we tried to reflect on these past twelve months, it’s hard to contextualize what our country has been through in the opening weeks of 2021, let alone all of 2020. With unprecedented turmoil in Washington, an economy still rocked by the coronavirus pandemic, and a populist revolt seemingly underway on Wall Street, it’s hard for any investor to navigate all the tumult and volatility. So we feel all the more fortunate to have emerged from such an unprecedented year in a renewed position of strength. It’s motivated us to make 2021 the best year in our Company’s history.
First, a quick recap of the fourth quarter of 2020. GAAP earnings were $0.42 per share – well in excess of our $0.14 per share fourth quarter dividend – driven by sparkling results at our operating platforms. Our Residential business locked a record $3.8 billion in loans (unadjusted for pipeline fallout), an 81% increase from the third quarter. And our BPL business logged $448 million of originations – an increase of 71% from the third quarter and headlined by strong single-family rental (SFR) loan originations. Collectively our operating platforms contributed $35 million(1) to the quarter’s bottom line, net of direct expenses. We have allocated additional capital to these businesses, responsive to what we believe to be a long runway of borrower demand for our loan programs. This deployment includes further investments in the financial assets created by our platforms, investments we expect to drive sustainably higher net interest income as we progress through the year. Factoring all this in, it gives us great confidence that we can safely support a stable to growing dividend in 2021.
Our GAAP book value per share increased to $9.91 at year-end, as compared to $9.41 at the end of the third quarter. Overall credit performance in our investment portfolio remains strong, as delinquencies have continued to decrease since their peak in the summer and strong home price appreciation has kept actual credit losses low. This means that, even if we retrace back to “pre-COVID-19” valuations, we continue to expect significant further upside on these investments. Coupled with positive credit trends, high prepayment speeds have begun to unlock additional value on most of our credit investments held at a discount to par. To channel the late Yogi Berra, “loans that prepay, don’t default”. As prepayments rise and the collateral backing our Sequoia and CoreVest issuances pays down, the call rights we own within these structures are also becoming more valuable. Based on current prepayment trends, we expect up to $600 million of loans backing these securitizations to become callable in 2021, well below their estimated fair values.
Strategically speaking, the COVID-19 pandemic has only further validated our core investment thesis, as demand for single-family detached housing has grown significantly. We expect much of that demand to be durable, as families choose to move away from dense urban areas, and more people can work remotely out of their homes regardless of proximity to the workplace. This has already caused ripple effects across both the residential and commercial property sectors, especially in major metropolitan areas.
| | |
| Detailed endnotes are included at the end of this Redwood Review. |
|
| THE REDWOOD REVIEW I 4TH QUARTER 2020 |
3 |
| | |
|
| S H A R E H O L D E R L E T T E R |
That’s why our primary focus for 2021 will remain on our residential consumer and business purpose lending platforms. The operating capital we allocate to these businesses is currently expected to generate returns on equity north of 20%, levels very difficult to come by when sourcing third-party investments in today’s compressed yield environment. Most importantly, these businesses serve large and growing markets not covered by government lending programs, and as such are positioned to generate scalable and repeatable sources of future earnings, even in a less accommodative interest rate environment. Since they are earned within our taxable subsidiary, the earnings generated can also be retained to provide a steady stream of internally sourced capital that can be deployed to further grow earnings and book value.
Over time, we expect the significant capital we’ve allocated to these platforms to be valued as a function of their forecasted earnings streams. This represents a large departure from passive REIT investment portfolios, which are traditionally assessed in relation to their net asset value given that substantially all earnings are distributed versus retained.
Speed and disruption are front of mind in 2021 across the Redwood enterprise. The goal is not simply to grow volume, or issue more securitizations. We want to fundamentally change how the non-Agency sector operates, from end-to-end. That entails more speed and automation, and keeping technology at the forefront of our go-forward plans. In December, our residential team officially launched a new technology initiative, Redwood Rapid Funding, with demand exceeding our expectations. At CoreVest, we are pressing our technology advantage in speed to market, client service, and our use of data to optimize lead generation. In the coming months, we’ll have a steady stream of new technology releases across our platforms that we’re excited to share with you.
But organic innovation is only part of our strategy. In January, we launched RWT Horizons, a home-grown venture investing effort focused on early-stage technology companies with business plans squarely focused on innovations that can disrupt the mortgage finance landscape. The amount of capital deployed through this new platform will likely be small at first, however the investments are designed to have an outsized impact on how our businesses operate. This strategy centers on extracting value at more points along the mortgage value chain, thereby making us a more meaningful partner to the broad network of market constituents to whom we provide liquidity, and building a symbiotic relationship designed to benefit all parties.
Putting all the pieces together, we’re positioned to generate durable margins and attractive assets that we expect will result in high-quality earnings in 2021. Our Business Purpose Lending team continues to post strong volumes, fueled by growing consumer demand for single-family homes for rent and investor demand for access to this asset class. This addressable market is $3 trillion and growing, and with CoreVest’s competitive moat our market share continues to expand. The securitization market and investor appetite for our SFR securitizations also continues to be a highlight, with new alternative funding vehicles already being implemented to diversify our funding channels. We expect to continue to maintain a strong foothold in our line of credit and build-to-rent bridge products, with an opportunity to delve significantly deeper into these markets.
| | |
| Detailed endnotes are included at the end of this Redwood Review. |
|
| THE REDWOOD REVIEW I 4TH QUARTER 2020 |
4 |
| | |
|
| S H A R E H O L D E R L E T T E R |
Our Residential team continues to show strong momentum, with January 2021 lock volume run rates trending even higher than what we saw in the fourth quarter. While the yield curve has room to steepen with the prospect of another round of fiscal stimulus (and therefore mortgage rates have room to rise), we expect most existing jumbo loans will remain “in the money” and re-financeable in 2021. Additionally, our recent volumes have been almost exclusively from Select loans, with some of the strongest borrower credit profiles we’ve seen since the Great Financial Crisis of 2008. This leaves a significant opportunity to again diversify our purchase mix into Redwood Choice expanded prime and non-QM products. These loans have represented as much as 40% of our quarterly lock activity in recent years.
We’ll close by reaffirming Redwood’s commitment to all our stakeholders – including our shareholders, our employees, and our communities. We’re proud to stand behind our core values, including an earnest focus on diversity, equity and inclusion, and a commitment to strong corporate citizenship, both socially and environmentally. Caring for our employees has never been as important, as we continue to support our team members and their families through the impacts of COVID-19. Investment in our employee programs and stewardship of our culture remain strategic priorities, and we’re proud of the work that we’ve done to engage, develop, and retain our workforce over the past year. Our commitment to our larger communities through volunteerism and charitable giving have also remained in sharp focus for us, particularly as our shared humanity has been amplified by the COVID-19 pandemic. With optimism on the horizon for 2021, we’re looking forward to the positive impact that Redwood can make for our collective stakeholders this year.
Thanks for your continued support.
| | | | | | | | |
| | |
| Christopher J. Abate | | Dashiell I. Robinson |
| Chief Executive Officer | | President |
| | |
| Detailed endnotes are included at the end of this Redwood Review. |
|
| THE REDWOOD REVIEW I 4TH QUARTER 2020 |
5 |
| | |
|
| Q U A R T E R L Y R E S U L T S |
Fourth Quarter Overview
| | | | | | | | | | | | | | | | | |
|
Key Financial Results and Metrics |
| | | |
| Three Months Ended | | | | |
| 12/31/2020 | | 9/30/2020 | | | | |
| | | | | | | |
| Earnings per Share | $ | 0.42 | | | $ | 1.02 | | | | | |
| Return on Equity (annualized) | 20 | % | | 57 | % | | | | |
| | | | | | | |
| Book Value per Share | $ | 9.91 | | | $ | 9.41 | | | | | |
| Dividend per Share | $ | 0.14 | | | $ | 0.14 | | | | | |
Economic Return on Book Value (1) | 6.8 | % | | 17.2 | % | | | | |
| | | | | | | |
| Unrestricted Cash (in millions) | $ | 461 | | | $ | 451 | | | | | |
Recourse Leverage Ratio (2) | 1.3x | | 1.4x | | | | |
| | | | | | | |
Ñ Our fourth quarter 2020 results benefited from continued momentum in our operating businesses and further spread tightening in our investment portfolio. Volumes grew significantly at both our residential and business purpose lending operations, with financial results benefiting from favorable securitization and whole-loan sale execution. These strong operating results, along with a 3% increase in the value of our securities portfolio, contributed to a 7% economic return on book value during the fourth quarter.
Ñ During the fourth quarter, we completed four securitizations totaling $1 billion across Residential and Business Purpose Lending, including two traditional marketed deals and two innovative single-investor transactions placed directly with insurance companies. The single-investor deals allowed us to distribute loans more quickly than our traditional securitizations, increasing capital efficiency and reducing our reliance on traditional warehouse funding.
Ñ During the fourth quarter, we locked a record $3.8 billion of jumbo loans with over 90 discrete sellers (up 81% from the third quarter of 2020) and purchased $1.6 billion of jumbo loans. At December 31, 2020, our pipeline of jumbo residential loans identified for purchase was $3.1 billion (up 72% from the third quarter of 2020).
Ñ Additionally, during the fourth quarter, we completed the first residential loan purchases through "Rapid Funding," a proprietary technology-enabled program that significantly accelerates purchase timelines for qualified originators.
Ñ We originated $448 million of business purpose loans in the fourth quarter (up 71% from the third quarter of 2020), including $348 million of single-family rental (SFR) loans and $100 million of bridge loans.
| | |
| Detailed endnotes are included at the end of this Redwood Review. |
|
| THE REDWOOD REVIEW I 4TH QUARTER 2020 |
6 |
| | |
|
| Q U A R T E R L Y R E S U L T S |
Quarterly Earnings and Analysis
Below we present GAAP net income for the fourth and third quarters of 2020.
| | | | | | | | | | | | | | |
| |
GAAP Net Income |
($ in millions, except per share data) |
| Three Months Ended | |
| 12/31/2020 | | 9/30/2020 | |
| | | | |
| | | | |
| Net interest income | | | | |
| Investment portfolio | $ | 29 | | | $ | 30 | | |
| Mortgage banking | 4 | | | 1 | | |
| Corporate | (9) | | | (9) | | |
| Total net interest income | 24 | | | 22 | | |
| | | | |
| Non-interest income | | | | |
| Residential mortgage banking activities, net | 23 | | | 12 | | |
| Business purpose mortgage banking activities, net | 31 | | | 48 | | |
| Investment fair value changes, net | 23 | | | 107 | | |
| Other income, net | — | | | — | | |
| Realized gains, net | — | | | 1 | | |
| Total non-interest income, net | 77 | | | 167 | | |
| | | | |
| General and administrative expenses | (30) | | | (28) | | |
| Loan acquisition costs | (3) | | | (2) | | |
| Other expenses | (4) | | | (8) | | |
| Provision for income taxes | (8) | | | (9) | | |
| | | | |
| Net income | $ | 54 | | | $ | 142 | | |
| | | | |
| Earnings per diluted common share | $ | 0.42 | | | $ | 1.02 | | |
| | | | |
GAAP Net Income by Segment |
($ in millions) |
| Three Months Ended | |
| 12/31/2020 | | 9/30/2020 | |
| | | | |
| | | | |
| Residential Lending | $ | 23 | | | $ | 9 | | |
| Business Purpose Lending | 29 | | | 53 | | |
| Third-Party Investments | 27 | | | 101 | | |
| Corporate | (24) | | | (21) | | |
| Net income | $ | 54 | | | $ | 142 | | |
| | |
| Detailed endnotes are included at the end of this Redwood Review. |
|
| THE REDWOOD REVIEW I 4TH QUARTER 2020 |
7 |
| | |
|
| Q U A R T E R L Y R E S U L T S |
Analysis of GAAP Earnings
Ñ Net interest income increased from the third quarter of 2020, primarily due to a higher average balance of loans in inventory at both our residential and business purpose lending operations during the fourth quarter.
Ñ Residential mortgage banking activities improved significantly from the third quarter of 2020, as loan purchase commitments of $2.5 billion in the fourth quarter were more than double from the third quarter with slightly higher gross margins.
Ñ Business purpose mortgage banking activities remained elevated in the fourth quarter of 2020, as spreads tightened further on securitization execution, benefiting both the $286 million of SFR loans held in inventory at the beginning of the fourth quarter and the $348 million of SFR loans we originated during the fourth quarter. Results for the third quarter of 2020 benefited from greater spread tightening and a higher balance of SFR loans in inventory at the beginning of the quarter ($380 million at June 30, 2020), relative to the fourth quarter of 2020.
Ñ Investment fair value changes in the fourth quarter reflected further increases in the fair value of our investment assets, as spreads continued to tighten during the quarter.
Ñ General and administrative expenses increased from the third quarter, as we added head-count in the third and fourth quarters to support continued growth at our operating businesses and to accelerate technology initiatives we plan to further develop in 2021.
Ñ Loan acquisition costs increased in the fourth quarter in conjunction with higher acquisition and origination volumes at our residential and business purpose mortgage banking operations.
Ñ Other expenses are primarily comprised of acquisition-related intangible amortization expense. In the third quarter of 2020 we incurred other non-amortization, pandemic-related expenses that we generally don't expect to recur in 2021.
Ñ Income tax provision decreased during the fourth quarter, as we experienced smaller positive fair value changes on investments held at our taxable REIT subsidiary relative to the third quarter of 2020.
| | |
| Detailed endnotes are included at the end of this Redwood Review. |
|
| THE REDWOOD REVIEW I 4TH QUARTER 2020 |
8 |
| | |
|
| Q U A R T E R L Y R E S U L T S |
Book Value
| | | | | | | | | | | | | | |
| |
Changes in Book Value per Share |
($ in per share) |
| Three Months Ended | |
| 12/31/2020 | | 9/30/2020 | |
| | | | |
| Beginning book value per share | $ | 9.41 | | | $ | 8.15 | | |
| Basic earnings per share | 0.47 | | | 1.21 | | |
Investment fair value changes in comprehensive income (1) | 0.14 | | | 0.07 | | |
| Dividends | (0.14) | | | (0.14) | | |
| Stock repurchases | — | | | 0.03 | | |
| Equity compensation, net | 0.01 | | | 0.03 | | |
| | | | |
| Other, net | 0.02 | | | 0.06 | | |
| | | | |
| Ending book value per share | $ | 9.91 | | | $ | 9.41 | | |
Ñ Our GAAP book value increased $0.50 per share during the fourth quarter of 2020, as basic earnings per share and comprehensive income from investments significantly exceeded our fourth quarter dividend of $0.14 per share.
| | |
| Detailed endnotes are included at the end of this Redwood Review. |
|
| THE REDWOOD REVIEW I 4TH QUARTER 2020 |
9 |
| | |
|
| Q U A R T E R L Y R E S U L T S |
Analysis of Operating Results
This section provides additional information on quarterly activity within each of our business segments. A full description of our segments is included in the Appendix of this Redwood Review, and detailed segment income statements are presented in Table 2 within the Financial Tables section of this Redwood Review.
Mortgage Banking
Below we present a summary of the key operating metrics of each of our mortgage banking operations, by segment.
| | | | | | | | | | | | | | | | | |
|
Mortgage Banking Key Operating Metrics |
| ($ in millions) |
| | | | | | | |
| Three Months Ended December 31, 2020 | | | | |
| Residential Mortgage Banking | | Business Purpose Mortgage Banking | | | | |
| | | | | | | |
Mortgage banking income (1) | $ | 24 | | | $ | 33 | | | | | |
G&A and Loan acquisition costs, excluding amortization (2) | (6) | | | (10) | | | | | |
Net contribution, excluding amortization (3) | 14 | | | 21 | | | | | |
| | | | | | | |
| Production Volumes | | | | | | | |
| Residential loan purchase commitments (fallout adjusted) | $ | 2,483 | | | | | | | |
| SFR loan originations | | | $ | 348 | | | | | |
| Bridge loan originations | | | $ | 100 | | | | | |
| | | | | | | |
Residential Mortgage Banking
Ñ During the fourth quarter, we locked $3.8 billion of loans ($2.5 billion adjusted for expected pipeline fallout – i.e., loan purchase commitments), including $3.7 billion of Select loans and $0.1 billion of Choice loans, and purchased $1.6 billion of loans. During the third quarter, we locked $2.1 billion of loans ($1.2 billion adjusted for expected pipeline fallout).
Ñ Approximately 32% of loans locked in the fourth quarter were purchase-money loans and 68% were refinancings.
Ñ During the fourth quarter, we distributed $810 million of loans through whole loan sales, and completed two securitizations for a total of $669 million.
Ñ At December 31, 2020, we had $177 million of jumbo loans in inventory on our balance sheet and our loan pipeline included $3.1 billion of loans identified for purchase (locked loans, unadjusted for expected fallout). Additionally, at quarter-end we had entered into forward sale agreements for $1.0 billion of loans.
| | |
| See Appendix for details on non-GAAP measures. Detailed endnotes are included at the end of this Redwood Review. |
|
| THE REDWOOD REVIEW I 4TH QUARTER 2020 |
10 |
| | |
|
| Q U A R T E R L Y R E S U L T S |
Ñ Our gross margin for the fourth quarter was 98 basis points, up from 95 basis points in the third quarter of 2020. Our gross margin represents mortgage banking income earned in the quarter (net interest income on loan inventory plus mortgage banking activities) divided by loan purchase commitments entered into during the quarter.
Business Purpose Mortgage Banking
Ñ During the fourth quarter, we originated $348 million of SFR loans and $100 million of bridge loans, up 78% and 52%, respectively, from the third quarter of 2020. Additionally, we completed one broadly distributed SFR securitization of $275 million, and transferred $60 million of SFR loans to a single-investor securitization with a unique ramp-up feature that enhances capital efficiency and reduces reliance on traditional warehouse funding.
Ñ At December 31, 2020, we had $245 million of SFR loans in inventory on our balance sheet.
Ñ Mortgage banking income for the fourth quarter benefited from strong securitization execution, as we saw spreads tighten from levels experienced in the third quarter of 2020. This improved valuations on both the $286 million of SFR loans we had in inventory at the beginning of the fourth quarter and the $348 million of SFR loans we originated in the fourth quarter.
Ñ During the fourth quarter, we called one of our previously issued SFR securitizations with $75 million of outstanding loans. As of December 31, 2020, we had re-financed $46 million of these loans (the refinancings are included in our fourth quarter SFR loan originations metric), and $9 million of these loans were included in our SFR securitization completed in the fourth quarter.
| | |
| See Appendix for details on non-GAAP measures. Detailed endnotes are included at the end of this Redwood Review. |
|
| THE REDWOOD REVIEW I 4TH QUARTER 2020 |
11 |
| | |
|
| Q U A R T E R L Y R E S U L T S |
Investment Portfolio
Below we present key financial results for our investment portfolio organized by segment for the fourth quarter of 2020.
| | | | | | | | | | | | | | | | | | | | | | | | | | | | |
|
| Investment Portfolio Key Financial Results |
| ($ in millions) |
| Three Months Ended December 31, 2020 | |
| Residential Lending | | Business Purpose Lending | | Third-Party Investments | | | | Total(1) | |
| | | | | | | | | | |
| Net interest income | $ | 6 | | | $ | 10 | | | $ | 13 | | | | | $ | 29 | | |
Economic net interest income (non-GAAP) (2) | 3 | | | 8 | | | 18 | | | | | 29 | | |
| | | | | | | | | | |
| Investment fair value changes | 6 | | | 4 | | | 15 | | | | | 24 | | |
| Other income (loss), net | (2) | | | — | | | — | | | | | (2) | | |
| Net contribution | 9 | | | 13 | | | 27 | | | | | 48 | | |
| | | | | | | | | | |
| At December 31, 2020 | | | | | | | | | | |
| Carrying values of investments | $ | 419 | | | $ | 901 | | | $ | 773 | | | | | $ | 2,093 | | |
Secured debt balances (3) | $ | 226 | | | $ | 559 | | | $ | 234 | | | | | $ | 1,019 | | |
| | | | | | | | | | |
| | | | | | | | | | |
Ñ GAAP Net interest income for the majority of our investments is recorded using a cash-based accrual method. Non-GAAP Economic net interest income (ENII) utilizes a historical cost methodology to calculate an effective yield based on estimated future cash flows, taking into account discounts and premiums on our investments relative to a historical basis.
Ñ ENII for our Residential Lending and Business Purpose Lending investment portfolios reflects the net impact of premium amortization on our interest-only and certificated servicing investments. ENII for our Third-Party Investments portfolio reflects net discount accretion associated with subordinate securities, most notably those backed by re-performing loans.
Ñ Across our portfolio, we experienced positive net investment fair value changes in the fourth quarter of 2020, as the benefits from spread tightening and higher prepayment speeds on our subordinate investments outweighed the negative impact from higher prepayment speeds on our interest only and servicing-related investments.
Ñ Other income (loss), net for Residential Lending investments reflects negative valuation changes on legacy Sequoia MSRs, as prepayment speeds continued to accelerate during the fourth quarter.
| | |
| See Appendix for details on non-GAAP measures. Detailed endnotes are included at the end of this Redwood Review. |
|
| THE REDWOOD REVIEW I 4TH QUARTER 2020 |
12 |
| | |
|
| Q U A R T E R L Y R E S U L T S |
2021 Financial Outlook (1)
For 2021, we will continue to focus on growth, technological efficiency, and increased profitability in our operating businesses, which should allow us to retain more capital within our taxable subsidiary and grow book value. We also expect these activities to support incremental capital deployment into our investment portfolio, which should drive higher net interest income and support a stable to growing dividend. Following are additional details on our expected activity in 2021:
Operating Businesses
At December 31, 2020, we had approximately $375 million of capital allocated to our operating businesses, including $215 million for our residential mortgage banking operations and $160 million for our BPL mortgage banking operations (including remaining purchase intangibles).
Ñ In 2021, we expect after-tax returns on this capital to exceed 20% (net of operating expenses and excluding acquisition-related amortization).
Ñ This return expectation accounts for potential variability in volumes and margins, as well as benefits from capital efficiencies and new technology initiatives.
Ñ We may allocate additional capital to each of these businesses to support growth in volumes throughout the year with return expectations similar to our currently deployed capital.
Investment portfolio
At December 31, 2020, we had approximately $1.1 billion of capital deployed into our investment portfolio, which we expect can generate returns on capital in 2021 between 10% to 12% relative to our year-end basis (return range includes an estimate of non-GAAP economic net interest income(2), hedging costs, operating expenses, and taxes).
Ñ We expect net interest income to trend higher throughout 2021 as we deploy incremental capital into portfolio investments at returns consistent with or higher than our in-place portfolio.
Ñ Given current market conditions, we forecast the average cost of funds on our secured debt to continue improving throughout 2021, with an expectation to maintain our current mix of marginable versus non-marginable secured borrowings over the year.
Available Capital
At December 31, 2020, we estimate we had approximately $200 million of capital available for investment. We expect the majority of this capital to be deployed throughout 2021 to support continued growth in our operating businesses and fund incremental investments for our portfolio.
| | |
| See Appendix for details on non-GAAP measures. Detailed endnotes are included at the end of this Redwood Review. |
|
| THE REDWOOD REVIEW I 4TH QUARTER 2020 |
13 |
| | |
|
| Q U A R T E R L Y R E S U L T S |
Corporate Overhead and Unsecured Debt
Ñ To support our operating businesses and investment portfolio, we expect corporate operating expenses(1) to be between $50 million to $55 million for 2021, with variable compensation commensurate with company performance.
Ñ We expect long-term unsecured debt service costs over 2021 to remain consistent with 2020, at approximately $40 million annually.
| | |
| See Appendix for details on non-GAAP measures. Detailed endnotes are included at the end of this Redwood Review. |
|
| THE REDWOOD REVIEW I 4TH QUARTER 2020 |
14 |
| | |
|
| Q U A R T E R L Y P O S I T I O N S |
Capital Allocations
The following table presents our allocations of capital by segment and by investment type as of December 31, 2020.
| | | | | | | | | | | | | | | | | | | | | | | |
|
| Capital Allocation Detail |
| By Investment Type |
| December 31, 2020 |
| ($ in millions) |
| | | | | | | |
| Fair Value of Assets (1) | | Recourse Debt | Non-Recourse Debt (2) | | Total Capital | |
| | | | | | | |
| Residential Lending | | | | | | | |
| Sequoia securities | $ | 373 | | | $ | (226) | | $ | — | | | $ | 147 | | |
| MSRs/Other | 45 | | | — | | — | | | 45 | | |
Capital allocated to mortgage banking operations(3) | 352 | | | (137) | | — | | | 215 | | |
| Total Residential Lending | 770 | | | (363) | | — | | | 407 | | |
| | | | | | | |
| Business Purpose Lending | | | | | | | |
| SFR securities | 239 | | | (103) | | — | | | 136 | | |
Bridge loans(4) | 663 | | | (89) | | (367) | | | 207 | | |
Capital allocated to mortgage banking operations(3) | 242 | | | (142) | | — | | | 100 | | |
| Platform premium | 57 | | | — | | — | | | 57 | | |
| Total Business Purpose Lending | 1,201 | | | (334) | | (367) | | | 500 | | |
| | | | | | | |
| Third-Party Investments | | | | | | | |
RPL securities(4) | 483 | | | — | | (205) | | | 278 | | |
| Other third-party securities | 79 | | | — | | — | | | 79 | | |
| Multifamily securities | 78 | | | (30) | | — | | | 48 | | |
| Other investments | 133 | | | — | | — | | | 133 | | |
| Total Third-Party Investments | 773 | | | (30) | | (205) | | | 538 | | |
| | | | | | | |
| | | | | | | |
| Corporate capital | 294 | | | | | | 294 | | |
| Other assets/(liabilities), net | 34 | | | | | | 34 | | |
| Corporate debt | — | | | (661) | | — | | | (661) | | |
| | | | | | | |
| Totals | $ | 3,072 | | | $ | (1,388) | | $ | (572) | | | $ | 1,111 | | |
Ñ During the fourth quarter, we allocated additional capital to support activities at our mortgage banking operations. Additionally, we retained $26 million of securities from CoreVest securitizations and $4 million of securities from Sequoia securitizations, and sold $24 million of other third party investments.
Ñ At December 31, 2020, we estimate we had approximately $200 million of capital available for investment.
| | |
| Detailed endnotes are included at the end of this Redwood Review. |
|
| THE REDWOOD REVIEW I 4TH QUARTER 2020 |
15 |
| | |
|
| Q U A R T E R L Y P O S I T I O N S |
Financing Overview
We finance our business with a diversified mix of secured recourse and non-recourse debt, as well as unsecured corporate debt. Following is an overview of our current financing structure.
Recourse Debt
The following summaries present the composition of our recourse debt and its characteristics as of December 31, 2020.
| | | | | | | | | | | | | | | | | | | | | | | | | | | | | | | | | | | | | | |
| | | | | | | | | | | | |
Recourse Debt Balances at December 31, 2020 |
($ in millions) |
| | | | | | | | | | | | |
| | | Secured Debt | | | | | | | |
| Fair Value of Secured Assets | | Non-Marginable Debt (1) | | Marginable Debt (1) | | Unsecured Debt | | Total Debt | | Average Borrowing Cost (2) | |
| | | | | | | | | | | | |
| Corporate debt | N/A | | $ | 1 | | | $ | — | | | $ | 660 | | | $ | 661 | | | 4.7 | % | |
| Securities portfolio | 478 | | | 281 | | | 78 | | | — | | | 359 | | | 3.8 | % | |
| SFR loans | 189 | | | 142 | | | — | | | — | | | 142 | | | 3.4 | % | |
| Bridge loans | 117 | | | 89 | | | — | | | — | | | 89 | | | 3.1 | % | |
| Residential loans | 156 | | | 119 | | | 19 | | | — | | | 138 | | | 2.5 | % | |
| | | | | | | | | | | | |
| Total | $ | 940 | | | $ | 632 | | | $ | 97 | | | $ | 660 | | | $ | 1,389 | | | 4.0 | % | |
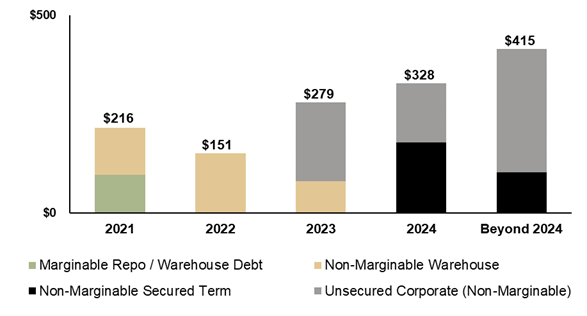
Recourse Debt Scheduled Maturities
($ in millions)
| | |
| Detailed endnotes are included at the end of this Redwood Review. |
|
| THE REDWOOD REVIEW I 4TH QUARTER 2020 |
16 |
| | |
|
| Q U A R T E R L Y P O S I T I O N S |
Leverage
Ñ Our recourse leverage ratio was 1.3x at December 31, 2020 and 1.4x at September 30, 2020(1)
Warehouse Capacity
Ñ At December 31, 2020, we had residential warehouse facilities outstanding with four different counterparties, with $1.3 billion of total capacity and $1.2 billion of available capacity. These included non-marginable facilities with $600 million of total capacity and marginable facilities with $700 million of total capacity.
Ñ At December 31, 2020, we had business purpose warehouse facilities outstanding with five different counterparties, with $1.0 billion of total capacity and $0.8 billion of available capacity. All of these facilities are non-marginable.
Non-Recourse Debt
In addition to our secured recourse debt, we also utilize secured term, non-recourse debt to finance the substantial majority of our business purpose bridge loans and RPL investments. Unlike the standard non-recourse securitization debt we consolidate on our balance sheet that is associated with subordinate securities that we own in those securitizations, the non-recourse financings for bridge loans have two-year terms (one of the facilities is prepayable in June 2021), and the RPL re-securitization financing becomes prepayable in July 2022 and has a rate step-up beginning in July 2023.
As this debt is non-recourse, our net economic exposure represents the difference between the fair value of the investment collateral, and the associated non-recourse debt. At December 31, 2020, we had $545 million of bridge loans(2) financed with $367 million of non-recourse debt, for a net economic exposure of approximately $178 million to these assets. Additionally, at December 31, 2020, we had $428 million of RPL securities financed with $205 million of non-recourse debt, for a net economic exposure of approximately $224 million to these assets.
| | |
| Detailed endnotes are included at the end of this Redwood Review. |
|
| THE REDWOOD REVIEW I 4TH QUARTER 2020 |
17 |
| | |
|
| Q U A R T E R L Y P O S I T I O N S |
Credit Overview
This section presents select credit characteristics for our major investment types, with current information as of December 31, 2020.
| | | | | | | | | | | | | | | | | | | | |
|
Residential Investments Credit Characteristics (1) |
December 31, 2020 | |
($ in millions, except where noted) | |
| Sequoia Select Securities(2) | | Sequoia Choice Securities(2) | | Re-Performing Loan Securities | |
| | | | | | |
| Market value | $ | 140 | | | $ | 213 | | | $ | 483 | | |
| Average FICO (at origination) | 769 | | | 741 | | | 608 | | |
HPI updated LTV (3) | 43 | % | | 62 | % | | 68 | % | |
| Average loan size (in thousands) | $ | 647 | | | $ | 709 | | | $ | 166 | | |
| Gross weighted average coupon | 4.0 | % | | 4.9 | % | | 4.5 | % | |
| Current 3-month prepayment rate | 50 | % | | 46 | % | | 9 | % | |
90+ days delinquency (as a % of UPB)(4) | 0.9 | % | | 4.8 | % | | 16.4 | % | |
Investment thickness (5) | 5 | % | | 16 | % | | 24 | % | |
| | | | | | |
Ñ Sequoia Select Securities — As of December 31, 2020, we had securitized $22.1 billion of Sequoia Select loans since 2010. Our securitized Select portfolio includes fully documented loans to prime borrowers with an average FICO score (at loan origination) of 770, maximum loan-to-value (at origination) of 80%, and a maximum debt-to-income ratio (at origination) of 43%. We retain all first-loss securities from our Sequoia Select securitizations, and on average we currently have exposure up to 5% of credit losses resulting from loans underlying the securities.
Ñ Sequoia Choice Securities — As of December 31, 2020, we had securitized $3.7 billion of Sequoia Choice loans since 2017. Our securitized Choice portfolio includes fully documented loans to prime borrowers with an average FICO score (at loan origination) of 742, maximum loan-to-value (at origination) of 90%, and a maximum debt-to-income ratio (at origination) of 49.9%. We retain all of the first-loss securities issued as part of our Sequoia Choice program, and on average we currently have exposure up to the first 16% of credit losses resulting from loans underlying the securities.
Ñ Re-Performing Loan Securities — As of December 31, 2020, we held $483 million of securities collateralized by re-performing loans, and on average we currently have exposure to up to 24% of the credit losses resulting from loans underlying the securities. The collateral underlying these securities are seasoned re-performing, and to a lesser extent non-performing, loans. In most cases, these loans experienced a credit event leading up to the securitization and were modified in order to keep the borrower in their home and current in their payments under recast loan terms.
| | |
| Detailed endnotes are included at the end of this Redwood Review. |
|
| THE REDWOOD REVIEW I 4TH QUARTER 2020 |
18 |
| | |
|
| Q U A R T E R L Y P O S I T I O N S |
| | | | | | | | | | | | | | | | | | | | |
|
Business Purpose and Multifamily Investments Credit Characteristics |
December 31, 2020 | |
($ in millions, except where noted) | |
| SFR Securities | | BPL Bridge Loans(1) | | Multifamily
B-Pieces | |
| | | | | | |
| Market value | $ | 239 | | | $ | 663 | | | $ | 79 | | |
Average current DSCR (2) | 1.4x | | N/A | | 1.5x | |
LTV (at origination) (3) | 68 | % | | 70 | % | | 73 | % | |
| Average loan size (in thousands) | $ | 2,809 | | | $ | 376 | | | $ | 25,973 | | |
| Gross weighted average coupon | 5.5 | % | | 8.1 | % | | 3.2 | % | |
| 90+ days delinquency (as a % of UPB) | 2.0 | % | | 6.1 | % | | 0.0 | % | |
Investment thickness (4) | 10 | % | | N/A | | 10 | % | |
| | | | | | |
Ñ SFR Securities — As of December 31, 2020, we had $239 million of SFR securities, comprised of subordinate and interest-only securities retained from the 15 CAFL securitizations completed by CoreVest through December 31, 2020. We own and retain the first-loss securities from the CAFL securitizations, and on average have exposure to the first 10% of credit losses.
Ñ BPL Bridge Loans — Our business purpose bridge loans and investments are collateralized by residential and multifamily properties, many of which are being rehabilitated for either re-sale or rental purposes. The average loan term at origination ranges between 12 to 24 months.
Ñ Multifamily B-Pieces — As of December 31, 2020, we had $79 million of multifamily b-pieces, which represent first-loss risk on $1.3 billion of underlying multifamily loan collateral across three separate Freddie Mac sponsored securitizations. On average, we have exposure to the first 10% of credit losses resulting from loans underlying the securities.
| | |
| Detailed endnotes are included at the end of this Redwood Review. |
|
| THE REDWOOD REVIEW I 4TH QUARTER 2020 |
19 |

| | | | | | | | | | | | | | | | | | | | | | | | | | | | | | | | | | | | | | | | | | | | |
| Table 1: GAAP Earnings (in thousands, except per share data) | |
| | | | | | | | | | | | | | |
| | 2020
Q4 | | 2020
Q3 | | 2020
Q2 | | 2020
Q1 | | 2019
Q4 | | | Twelve Months 2020 | |
| Net interest income | | | | | | | | | | | | | |
| From investments | $ | 29,156 | | | $ | 29,651 | | | $ | 34,556 | | | $ | 57,116 | | | $ | 50,096 | | | | $ | 150,479 | | |
| From mortgage banking activities | 3,502 | | | 729 | | | 2,330 | | | 5,355 | | | 7,232 | | | | 11,916 | | |
| Corporate debt expense | (9,008) | | | (8,809) | | | (9,606) | | | (11,061) | | | (12,455) | | | | (38,484) | | |
| Net interest income | 23,650 | | | 21,571 | | | 27,280 | | | 51,410 | | | 44,873 | | | | 123,911 | | |
| Non-interest income (loss) | | | | | | | | | | | | | |
| Residential mortgage banking activities, net | 22,943 | | | 11,864 | | | (8,005) | | | (23,081) | | | 16,539 | | | | 3,721 | | |
| Business purpose mortgage banking activities, net | 31,018 | | | 47,531 | | | 2,023 | | | (5,821) | | | 29,743 | | | | 74,751 | | |
| Investment fair value changes, net | 23,119 | | | 107,047 | | | 152,228 | | | (870,832) | | | 759 | | | | (588,438) | | |
| Realized gains, net | 5 | | | 602 | | | 25,965 | | | 3,852 | | | 5,594 | | | | 30,424 | | |
| Other income (loss), net | 209 | | | (114) | | | 1,165 | | | 2,928 | | | 5,417 | | | | 4,188 | | |
| Total non-interest income (loss), net | 77,294 | | | 166,930 | | | 173,376 | | | (892,954) | | | 58,052 | | | | (475,354) | | |
| Compensation expense | (19,572) | | | (18,624) | | | (18,358) | | | (16,690) | | | (26,541) | | | | (73,244) | | |
Acquisition-related equity compensation expense (1) | (1,212) | | | (1,212) | | | (1,212) | | | (1,212) | | | (1,010) | | | | (4,848) | | |
| Other general and administrative expense | (9,588) | | | (7,794) | | | (8,950) | | | (10,780) | | | (10,464) | | | | (37,112) | | |
| Total general and administrative expenses | (30,372) | | | (27,630) | | | (28,520) | | | (28,682) | | | (38,015) | | | | (115,204) | | |
| Loan acquisition costs (including commissions) | (3,307) | | | (2,158) | | | (1,572) | | | (3,986) | | | (4,428) | | | | (11,023) | | |
| Other expenses | (4,499) | | | (7,788) | | | (5,083) | | | (91,415) | | | (7,001) | | | | (108,785) | | |
| (Provision for) benefit from income taxes | (8,471) | | | (9,113) | | | (37) | | | 22,229 | | | (4,338) | | | | 4,608 | | |
| Net income (loss) | $ | 54,295 | | | $ | 141,812 | | | $ | 165,444 | | | $ | (943,398) | | | $ | 49,143 | | | | $ | (581,847) | | |
Diluted average shares (2) | 140,641 | | 141,970 | | 147,099 | | 114,077 | | 152,983 | | | 113,936 | |
| Diluted earnings (loss) per common share | $ | 0.42 | | | $ | 1.02 | | | $ | 1.00 | | | $ | (8.28) | | | $ | 0.38 | | | | $ | (5.12) | | |
(1)Acquisition-related equity compensation expense relates to shares of restricted stock that were issued to members of CoreVest management as a component of the consideration paid to them for our purchase of their interests in CoreVest.
(2)Diluted average shares includes shares from the assumed conversion of our convertible and/or exchangeable debt in certain periods, in accordance with GAAP diluted EPS provisions. See Table 3 that follows for details of this calculation for the current and prior quarter and our respective Quarterly Reports on Form 10-Q and Annual Report on Form 10-K.
| | | | | | | | |
| THE REDWOOD REVIEW I 4TH QUARTER 2020 | | Table 1: GAAP Earnings 21 |
| | | | | | | | | | | | | | | | | | | | | | | | | | | | | | | | | | | | | | | | | | | | | | | | | | | | | | | | | | | | | | |
| Table 2: Segment Results ($ in thousands) | | |
| | | | | | | | | | | | | | | | | | | | |
| Three Months Ended December 31, 2020 | | |
| Residential Mortgage Banking | | Residential Investments | | Total Residential Lending | | Business Purpose Mortgage Banking | | Business Purpose Investments | | Total Business Purpose Lending | | Third-Party Investments | | Corporate / Other | | Total | | |
| | | | | | | | | | | | | | | | | | | |
| Net interest income (expense) | $ | 1,471 | | | $ | 5,833 | | | $ | 7,304 | | | $ | 2,031 | | | $ | 9,978 | | | $ | 12,009 | | | $ | 13,345 | | | $ | (9,008) | | | $ | 23,650 | | | |
| | | | | | | | | | | | | | | | | | | |
| Non-interest income | | | | | | | | | | | | | | | | | | | |
| Mortgage banking activities, net | 22,943 | | | — | | | 22,943 | | | 31,018 | | | — | | | 31,018 | | | — | | | — | | | 53,961 | | | |
| Investment fair value changes, net | — | | | 5,719 | | | 5,719 | | | — | | | 3,795 | | | 3,795 | | | 14,692 | | | (1,087) | | | 23,119 | | | |
| Other income, net | — | | | (2,364) | | | (2,364) | | | 1,175 | | | (17) | | | 1,158 | | | 422 | | | 993 | | | 209 | | | |
| Realized gains, net | — | | | — | | | — | | | — | | | — | | | — | | | 5 | | | — | | | 5 | | | |
| Total non-interest income (loss), net | 22,943 | | | 3,355 | | | 26,298 | | | 32,193 | | | 3,778 | | | 35,971 | | | 15,119 | | | (94) | | | 77,294 | | | |
| | | | | | | | | | | | | | | | | | | |
| General and administrative expenses | (4,631) | | | (407) | | | (5,038) | | | (8,740) | | | (602) | | | (9,342) | | | (816) | | | (15,176) | | | (30,372) | | | |
| Loan acquisition costs | (1,261) | | | (12) | | | (1,273) | | | (1,556) | | | (358) | | | (1,914) | | | (117) | | | (3) | | | (3,307) | | | |
| Other expenses | (805) | | | — | | | (805) | | | (3,404) | | | — | | | (3,404) | | | (153) | | | (137) | | | (4,499) | | | |
| | | | | | | | | | | | | | | | | | | |
| (Provision for) benefit from income taxes | (3,260) | | | — | | | (3,260) | | | (4,540) | | | — | | | (4,540) | | | (671) | | | — | | | (8,471) | | | |
| | | | | | | | | | | | | | | | | | | |
| Net income (loss) | $ | 14,457 | | | $ | 8,769 | | | $ | 23,226 | | | $ | 15,984 | | | $ | 12,796 | | | $ | 28,780 | | | $ | 26,707 | | | $ | (24,418) | | | $ | 54,295 | | | |
| | | | | | | | | | | | | | | | | | | |
| Three Months Ended September 30, 2020 | | |
| Residential Mortgage Banking | | Residential Investments | | Total Residential Lending | | Business Purpose Mortgage Banking | | Business Purpose Investments | | Total Business Purpose Lending | | Third-Party Investments | | Corporate / Other | | Total | | |
| | | | | | | | | | | | | | | | | | | |
| Net interest income (expense) | $ | (546) | | | $ | 5,817 | | | $ | 5,271 | | | $ | 1,275 | | | $ | 10,496 | | | $ | 11,771 | | | $ | 13,338 | | | $ | (8,809) | | | $ | 21,571 | | | |
| | | | | | | | | | | | | | | | | | | |
| Non-interest income | | | | | | | | | | | | | | | | | | | |
| Mortgage banking activities, net | 11,864 | | | — | | | 11,864 | | | 47,531 | | | — | | | 47,531 | | | — | | | — | | | 59,395 | | | |
| Investment fair value changes, net | — | | | 2,443 | | | 2,443 | | | — | | | 16,892 | | | 16,892 | | | 87,890 | | | (178) | | | 107,047 | | | |
| Other income, net | — | | | (2,011) | | | (2,011) | | | 149 | | | 474 | | | 623 | | | 340 | | | 934 | | | (114) | | | |
| Realized gains, net | — | | | — | | | — | | | — | | | — | | | — | | | 602 | | | — | | | 602 | | | |
| Total non-interest income (loss), net | 11,864 | | | 432 | | | 12,296 | | | 47,680 | | | 17,366 | | | 65,046 | | | 88,832 | | | 756 | | | 166,930 | | | |
| | | | | | | | | | | | | | | | | | | |
| General and administrative expenses | (4,211) | | | (391) | | | (4,602) | | | (8,792) | | | (529) | | | (9,321) | | | (709) | | | (12,998) | | | (27,630) | | | |
| Loan acquisition costs | (282) | | | (22) | | | (304) | | | (1,382) | | | (278) | | | (1,660) | | | (194) | | | — | | | (2,158) | | | |
| Other expenses | (3,309) | | | — | | | (3,309) | | | (3,874) | | | — | | | (3,874) | | | (470) | | | (135) | | | (7,788) | | | |
| | | | | | | | | | | | | | | | | | | |
| (Provision for) benefit from income taxes | (826) | | | — | | | (826) | | | (8,544) | | | — | | | (8,544) | | | 257 | | | — | | | (9,113) | | | |
| | | | | | | | | | | | | | | | | | | |
| Net income (loss) | $ | 2,690 | | | $ | 5,836 | | | $ | 8,526 | | | $ | 26,363 | | | $ | 27,055 | | | $ | 53,418 | | | $ | 101,054 | | | $ | (21,186) | | | $ | 141,812 | | | |
| | | | | | | | |
| THE REDWOOD REVIEW I 4TH QUARTER 2020 | | Table 2: Segment Results 22 |
| | | | | | | | | | | | | | | | | | | | | | | | | | | | | | | | | | | | | | | | | | | | | | |
| Table 3: GAAP Basic and Diluted Earnings per Common Share (in thousands, except per share data) | |
| | | | | | | | | | | | | | | | |
| | 2020
Q4 | | 2020
Q3 | | 2020
Q2 | | 2020
Q1 | | 2019
Q4 | | | Twelve Months 2020 | | | |
| | | | | | | | | | | | | | | |
| | | | | | | | | | | | | | | |
| | | | | | | | | | | | | | | |
| | | | | | | | | | | | | | | |
| | | | | | | | | | | | | | | |
| | | | | | | | | | | | | | | |
| | | | | | | | | | | | | | | |
| | | | | | | | | | | | | | | |
| GAAP Earnings per Common Share ("EPS"): | | | | | | | | | | | | | | | |
| Net income attributable to Redwood | $ | 54,295 | | | $ | 141,812 | | | $ | 165,444 | | | $ | (943,398) | | | $ | 49,143 | | | | $ | (581,847) | | | | |
| Adjust for dividends and undistributed earnings allocated to participating securities | (1,705) | | | (4,067) | | | (4,528) | | | (1,209) | | | (1,546) | | | | (1,990) | | | | |
| Net income allocated to common shareholders for GAAP basic EPS | 52,590 | | | 137,745 | | | 160,916 | | | (944,607) | | | 47,597 | | | | (583,837) | | | | |
| Incremental adjustment to dividends and undistributed earnings allocated to participating securities | 58 | | | 555 | | | 1,412 | | | — | | | (113) | | | | — | | | | |
Adjust for interest expense and gain on extinguishment on convertible notes for the period, net of tax (1) | 6,999 | | | 6,990 | | | (15,835) | | | — | | | 9,941 | | | | — | | | | |
| Net income allocated to common shareholders for GAAP diluted EPS | $ | 59,647 | | | $ | 145,290 | | | $ | 146,493 | | | $ | (944,607) | | | $ | 57,425 | | | | $ | (583,837) | | | | |
| | | | | | | | | | | | | | | |
| Basic weighted average common shares outstanding | 112,074 | | 113,403 | | 114,383 | | 114,077 | | 112,818 | | | 113,936 | | | |
| Net effect of dilutive equity awards | — | | | — | | | — | | | — | | | 221 | | | | — | | | | |
Net effect of assumed convertible notes conversion to common shares (1) | 28,567 | | | 28,567 | | | 32,716 | | | — | | | 39,943 | | | | — | | | | |
| Diluted weighted average common shares outstanding | 140,641 | | 141,970 | | 147,099 | | 114,077 | | 152,982 | | | 113,936 | | | |
| | | | | | | | | | | | | | | |
| GAAP Basic Earnings per Common Share | $ | 0.47 | | | $ | 1.21 | | | $ | 1.41 | | | $ | (8.28) | | | $ | 0.42 | | | | $ | (5.12) | | | | |
| GAAP Diluted Earnings per Common Share | $ | 0.42 | | | $ | 1.02 | | | $ | 1.00 | | | $ | (8.28) | | | $ | 0.38 | | | | $ | (5.12) | | | | |
| | | | | | | | | | | | | | | |
| | | | | | | | | | | | | | | |
| | | | | | | | | | | | | | | |
| | | | | | | | | | | | | | | |
| | | | | | | | | | | | | | | |
| | | | | | | | | | | | | | | |
| | | | | | | | | | | | | | | |
| | | | | | | | | | | | | | | |
| | | | | | | | | | | | | | | |
| | | | | | | | | | | | | | | |
| | | | | | | | | | | | | | | |
| | | | | | | | | | | | | | | |
| | | | | | | | | | | | | | | |
| | | | | | | | | | | | | | | |
| | | | | | | | | | | | | | | |
| | | | | | | | | | | | | | | |
| | | | | | | | | | | | | | | | |
| | | | | | | | | | | | | | | |
(1)Certain convertible notes were determined to be dilutive during the second through fourth quarters of 2020 and the fourth quarter of 2019 and were included in the calculation of diluted EPS under the "if-converted" method. Under this method, the periodic interest expense and gains on extinguishment of debt (net of applicable taxes) for dilutive notes is added back to the numerator and the number of shares that the notes are entitled to (if converted, regardless of whether they are in or out of the money) are included in the denominator.
| | | | | | | | |
| THE REDWOOD REVIEW I 4TH QUARTER 2020 | | Table 3: GAAP Earnings per Basic and Diluted Common Share 23 |
| | | | | | | | | | | | | | | | | | | | | | | | | | | | | | | | | | | | | | | | | |
| Table 4: Financial Ratios and Book Value ($ in thousands, except per share data) | |
| | | | | | | | | | | | | |
| | 2020
Q4 | | 2020
Q3 | | 2020
Q2 | | 2020
Q1 | | 2019
Q4 | | Twelve Months 2020 | |
| Financial performance ratios | | | | | | | | | | | | |
| Net interest income | $ | 23,650 | | | $ | 21,571 | | | $ | 27,280 | | | $ | 51,410 | | | $ | 44.873 | | | $ | 123,911 | | |
| Corporate general and administrative expenses | $ | (15,176) | | | $ | (12,998) | | | $ | (13,818) | | | $ | (10,908) | | | $ | (15,428) | | | $ | (52,900) | | |
| | | | | | | | | | | | |
| GAAP net income (loss) | $ | 54,295 | | | $ | 141,812 | | | $ | 165,444 | | | $ | (943,398) | | | $ | 49,143 | | | $ | (581,847) | | |
| Average total assets | $ | 10,362,681 | | | $ | 10,098,372 | | | $ | 10,410,067 | | | $ | 17,838,481 | | | $ | 17,551,586 | | | $ | 12,166,762 | | |
| Average total equity | $ | 1,079,952 | | | $ | 999,381 | | | $ | 808,896 | | | $ | 1,613,920 | | | $ | 1,800,390 | | | $ | 1,125,068 | | |
| | | | | | | | | | | | |
| | | | | | | | | | | | |
| | | | | | | | | | | | |
| | | | | | | | | | | | |
| Corporate general and administrative expenses / average total equity | 5.62 | % | | 5.20 | % | | 6.83 | % | | 2.70 | % | | 3.43 | % | | 4.70 | % | |
| | | | | | | | | | | | |
| | | | | | | | | | | | |
| GAAP net income / average equity (GAAP ROE) | 20.11 | % | | 56.76 | % | | 81.81 | % | | N/A | | 10.92 | % | | N/A | |
| | | | | | | | | | | | |
| | | | | | | | | | | | | |
| Leverage ratios and book value per share | | | | | | | | | | | | |
| Short-term recourse debt | $ | 314,234 | | | $ | 253,763 | | | $ | 418,370 | | | $ | 2,082,717 | | | $ | 2,176,591 | | | | |
| | | | | | | | | | | | |
| Long-term recourse debt | 1,074,529 | | | 1,094,950 | | | 1,402,688 | | | 2,470,928 | | | 2,970,415 | | | | |
| Total recourse debt | $ | 1,388,763 | | | $ | 1,348,713 | | | $ | 1,821,058 | | | $ | 4,553,645 | | | $ | 5,147,006 | | | | |
| At consolidated securitization and non-recourse entities | | | | | | | | | | | | |
| ABS issued | 7,100,662 | | | 7,172,398 | | | 6,856,086 | | | 6,461,864 | | | 10,515,475 | | | | |
| Other non-recourse debt | 576,176 | | | 688,656 | | | 600,356 | | | 259,876 | | | 153,696 | | | | |
| Total ABS issued and non-recourse debt | $ | 7,676,838 | | | $ | 7,861,054 | | | $ | 7,456,442 | | | $ | 6,721,740 | | | $ | 10,669,171 | | | | |
Consolidated debt (1) | $ | 9,065,601 | | | $ | 9,209,767 | | | $ | 9,277,500 | | | $ | 11,275,385 | | | $ | 15,816,177 | | | | |
Tangible stockholders' equity (non-GAAP (2)) | $ | 1,054,035 | | | $ | 992,727 | | | $ | 871,966 | | | $ | 656,719 | | | $ | 1,665,767 | | | | |
| Total stockholders' equity | $ | 1,110,899 | | | $ | 1,053,464 | | | $ | 936,576 | | | $ | 725,202 | | | $ | 1,827,231 | | | | |
Total capital (3) | $ | 1,760,658 | | | $ | 1,702,599 | | | $ | 1,585,096 | | | $ | 1,495,700 | | | $ | 2,596,984 | | | | |
Recourse leverage ratio (recourse debt at Redwood to tangible stockholders' equity)(4) | 1.3x | | 1.4x | | 2.1x | | 6.9x | | 3.1x | | | |
| Consolidated debt to tangible stockholders' equity | 8.6x | | 9.3x | | 10.6x | | 17.2x | | 9.5x | | | |
| Shares outstanding at period end (in thousands) | 112,090 | | | 111,904 | | | 114,940 | | | 114,838 | | | 114,353 | | | | |
| Book value per share | $ | 9.91 | | | $ | 9.41 | | | $ | 8.15 | | | $ | 6.32 | | | $ | 15.98 | | | | |
| | | | | | | | | | | | | |
(1)Amounts presented in Consolidated debt above do not include deferred issuance costs or debt discounts.
(2)At December 31, 2020, September 30, 2020, June 30, 2020, March 31, 2020, and December 31, 2019, tangible stockholders' equity excluded $57 million, $61 million, $65 million, $68 million, and $161 million, respectively, of goodwill and intangible assets.
(3)Our total capital of $1.8 billion at December 31, 2020 included $1.1 billion of equity capital and $0.6 billion of unsecured corporate debt.
(4)Excludes ABS issued and non-recourse debt at consolidated entities. See Table 6 for additional detail on our ABS issued and short-term debt at consolidated entities.
| | | | | | | | |
| THE REDWOOD REVIEW I 4TH QUARTER 2020 | | Table 4: Financial Ratios and Book Value 24 |
| | | | | | | | | | | | | | | | | | | | | | | | | | | | | | | | | | | | | | | | | | | | | | | | | | | | | | | | | | | | | | | | | | | | | | | | | | | | | | | | |
Table 5A: Combined Investment Portfolio Detail
($ in thousands) | | Table 5B: Combined Investment Portfolio Rollforward
($ in thousands) |
| | | | | | | | | | | | | | | | | | | | | | | | | | |
| | 12/31/20 | | 9/30/20 | | 6/30/20 | | Asset Rollforward | | Sequoia Securities | | MSRs / Other | | SFR Securities | | Bridge Loans | | RPL Securities | | Other Third-Party | | Multifamily Securities | | Other Investments | | Total |
| | | | | | | | | | | | | | | | | | | | | | | | | | |
| Investment Portfolio Assets | | | | | | Balance at 6/30/20 | | $ | 345 | | | $ | 54 | | | $ | 203 | | | $ | 814 | | | $ | 394 | | | $ | 86 | | | $ | 52 | | | $ | 131 | | | $ | 2,079 | |
| Sequoia securities | $ | 373 | | | $ | 356 | | | $ | 345 | | | New investments | | — | | | — | | | 16 | | | 64 | | | — | | | 16 | | | 28 | | | 29 | | | 153 | |
| MSRs/Other | 45 | | | 50 | | | 54 | | | Sales/Paydowns | | — | | | — | | | — | | | (159) | | | — | | | (16) | | | — | | | (30) | | | (205) | |
| SFR securities | 239 | | | 229 | | | 203 | | | MTM | | 10 | | | (5) | | | 10 | | | 7 | | | 83 | | | 2 | | | 3 | | | 1 | | | 111 | |
| Bridge loans | 663 | | | 725 | | | 814 | | | Other, net | | 1 | | | 1 | | | — | | | (1) | | | — | | | 1 | | | (1) | | | — | | | 1 | |
| RPL securities | 483 | | | 477 | | | 394 | | | Balance at 9/30/20 | | $ | 356 | | | $ | 50 | | | $ | 229 | | | $ | 725 | | | $ | 477 | | | $ | 89 | | | $ | 82 | | | $ | 131 | | | $ | 2,139 | |
| Other third-party securities | 79 | | | 89 | | | 86 | | | New investments | | 4 | | | — | | | 26 | | | 99 | | | — | | | 7 | | | — | | | 3 | | | 139 | |
| Multifamily securities | 78 | | | 82 | | | 52 | | | Sales/Paydowns | | — | | | — | | | (19) | | | (160) | | | — | | | (29) | | | (5) | | | (1) | | | (214) | |
| Other investments | 133 | | | 131 | | | 131 | | | MTM | | 16 | | | (6) | | | 2 | | | (1) | | | 7 | | | 12 | | | 1 | | | — | | | 31 | |
| Total investments | $ | 2,093 | | | $ | 2,139 | | | $ | 2,079 | | | Other, net | | (3) | | | 1 | | | — | | | (1) | | | — | | | — | | | — | | | — | | | (3) | |
| | | | | | | Balance at 12/31/20 | | $ | 373 | | | $ | 45 | | | $ | 239 | | | $ | 663 | | | $ | 483 | | | $ | 79 | | | $ | 78 | | | $ | 133 | | | $ | 2,093 | |
| Debt Secured by Portfolio Assets | | | | | | | | | | | | | | | | | | | | | | | | |
| Sequoia securities | $ | (226) | | | $ | (225) | | | $ | (224) | | | | | | | | | | | | | | | | | | | | | |
| MSRs/Other | — | | | — | | | (20) | | | | | | | | | | | | | | | | | | | | | |
| SFR securities | (103) | | | (103) | | | (103) | | | | | | | | | | | | | | | | | | | | | |
| Bridge loans | (456) | | | (524) | | | (611) | | | | | | | | | | | | | | | | | | | | | |
| RPL securities | (205) | | | (208) | | | (242) | | | | | | | | | | | | | | | | | | | | | |
| Other third-party securities | — | | | — | | | — | | | | | | | | | | | | | | | | | | | | | |
| Multifamily securities | (30) | | | (31) | | | (28) | | | | | | | | | | | | | | | | | | | | | |
| Other investments | — | | | — | | | — | | | | | | | | | | | | | | | | | | | | | |
| Total debt secured by investments | $ | (1,019) | | | $ | (1,091) | | | $ | (1,228) | | | | | | | | | | | | | | | | | | | | | |
| | | | | | | | | | | | | | | | | | | | | | | | | |
| Net Capital Invested in Portfolio Assets | | | | | | | | | | | | | | | | | | | | | | |
| Sequoia securities | $ | 147 | | | $ | 131 | | | $ | 121 | | | | | | | | | | | | | | | | | | | | | |
| MSRs/Other | 45 | | | 50 | | | 34 | | | | | | | | | | | | | | | | | | | | | |
| SFR securities | 136 | | | 126 | | | 100 | | | | | | | | | | | | | | | | | | | | | |
| Bridge loans | 207 | | | 201 | | | 203 | | | | | | | | | | | | | | | | | | | | | |
| RPL securities | 278 | | | 269 | | | 152 | | | | | | | | | | | | | | | | | | | | | |
| Other third-party securities | 79 | | | 89 | | | 86 | | | | | | | | | | | | | | | | | | | | | |
| Multifamily securities | 48 | | | 51 | | | 24 | | | | | | | | | | | | | | | | | | | | | |
| Other investments | 133 | | | 131 | | | 131 | | | | | | | | | | | | | | | | | | | | | |
| Total capital invested | $ | 1,073 | | | $ | 1,048 | | | $ | 851 | | | | | | | | | | | | | | | | | | | | | |
| | | | | | | | Notes | | | | | | | | | | | | | | | | | | |
Total leverage (1) | 0.95x | | 1.04x | | 1.44x | | (1) Leverage calculated using both secured recourse and secured pre-payable non-recourse debt.. |
| | | | | | | | | | | | | | | | | | | | | | | | | | |
| | | | | | | | |
| THE REDWOOD REVIEW I 4TH QUARTER 2020 | | Table 5: Combined Investment Portfolio 25 |
| | | | | | | | | | | | | | | | | | | | | | | | | | | | | | | | | | | | | | | | | | | | | | | | | | | | | | | | | | | | | | | | | | | | | | | | | | | | | | | | | | |
| Table 6: Consolidated Balance Sheet ($ in thousands) | |
| | | | | | | | | | | | | | | | | | | | | | | | | | | | | | | | | | | | |
| | | | | | December 31, 2020 | | | |
| | | | | | | Consolidated VIEs (1) | | | | | | | | | | |
| | Dec 31, 2020 | | Sep 30, 2020 | | At Redwood (1) | | Sequoia Choice | | Freddie Mac SLST | | Freddie Mac
K-Series | | CAFL | | Other VIEs (2) | | Other (3) | | Redwood
Consolidated | | | | | | | | | | | | | | | |
| Residential loans | | $ | 4,249,051 | | | $ | 4,494,936 | | | $ | 176,641 | | | $ | 1,565,322 | | | $ | 2,221,153 | | | $ | — | | | $ | — | | | $ | 285,935 | | | $ | — | | | $ | 4,249,051 | | | | | | | | | | | | | | | | |
| Business purpose loans | | 4,136,353 | | | 3,956,101 | | | 363,370 | | | — | | | — | | | — | | | 3,249,194 | | | — | | | 523,789 | | | 4,136,353 | | | | | | | | | | | | | | | | |
| Multifamily loans | | 492,221 | | | 491,415 | | | — | | | — | | | — | | | 492,221 | | | — | | | — | | | — | | | 492,221 | | | | | | | | | | | | | | | | |
| Real estate securities | | 344,125 | | | 351,335 | | | 344,125 | | | — | | | — | | | — | | | — | | | — | | | — | | | 344,125 | | | | | | | | | | | | | | | | |
| Other investments | | 348,175 | | | 384,628 | | | 75,592 | | | — | | | — | | | | | — | | | 251,773 | | | 20,810 | | | 348,175 | | | | | | | | | | | | | | | | |
| Cash and cash equivalents | | 461,260 | | | 450,684 | | | 449,681 | | | — | | | — | | | — | | | — | | | 11,579 | | | — | | | 461,260 | | | | | | | | | | | | | | | | |
Other assets (4) | | 323,881 | | | 273,313 | | | 259,989 | | | 6,802 | | | 7,400 | | | 1,337 | | | 15,985 | | | 32,368 | | | — | | | 323,881 | | | | | | | | | | | | | | | | |
| Total assets | | $ | 10,355,066 | | | $ | 10,402,412 | | | $ | 1,669,398 | | | $ | 1,572,124 | | | $ | 2,228,553 | | | $ | 493,558 | | | $ | 3,265,179 | | | $ | 581,655 | | | $ | 544,599 | | | $ | 10,355,066 | | | | | | | | | | | | | | | | |
| Short-term debt | | $ | 522,609 | | | $ | 482,761 | | | $ | 314,234 | | | $ | — | | | $ | — | | | $ | — | | | $ | — | | | $ | 208,375 | | | $ | — | | | $ | 522,609 | | | | | | | | | | | | | | | | |
| Other liabilities | | 195,412 | | | 157,601 | | | 155,735 | | | 4,747 | | | 4,846 | | | 1,177 | | | 10,278 | | | 18,629 | | | — | | | 195,412 | | | | | | | | | | | | | | | | |
| ABS issued | | 7,100,661 | | | 7,172,398 | | | — | | | 1,347,357 | | | 1,993,919 | | | 463,966 | | | 3,013,093 | | | 282,326 | | | — | | | 7,100,661 | | | | | | | | | | | | | | | | |
| Long-term debt, net | | 1,425,485 | | | 1,536,188 | | | 1,058,683 | | | — | | | — | | | — | | | — | | | — | | | 366,802 | | | 1,425,485 | | | | | | | | | | | | | | | | |
| Total liabilities | | 9,244,167 | | | 9,348,948 | | | 1,528,652 | | | 1,352,104 | | | 1,998,765 | | | 465,143 | | | 3,023,371 | | | 509,330 | | | 366,802 | | | 9,244,167 | | | | | | | | | | | | | | | | |
| | | | | | | | | | | | | | | | | | | | | | | | | | | | | | | | | | | |
| Equity | | 1,110,899 | | | 1,053,464 | | | 140,746 | | | 220,020 | | | 229,788 | | | 28,415 | | | 241,808 | | | 72,325 | | | 177,797 | | | 1,110,899 | | | | | | | | | | | | | | | | |
| Total liabilities and equity | | $ | 10,355,066 | | | $ | 10,402,412 | | | $ | 1,669,398 | | | $ | 1,572,124 | | | $ | 2,228,553 | | | $ | 493,558 | | | $ | 3,265,179 | | | $ | 581,655 | | | $ | 544,599 | | | $ | 10,355,066 | | | | | | | | | | | | | | | | |
| | | | | | | | | | | | | | | | | | | | | | | | | | | | | | | | | | | |
(1)The format of this consolidating balance sheet is provided to more clearly delineate between the assets and liabilities belonging to securitization entities (Consolidated VIEs) that we are required to consolidate on our balance sheet in accordance with GAAP, and the assets that are legally ours and the liabilities of ours for which there is recourse to us. Each of these entities is independent of Redwood and of each other and the assets and liabilities of these entities are not owned by and are not legal obligations of ours. Our exposure to these entities is primarily through the financial interests we have retained or acquired in these entities (generally subordinate and interest-only securities), the fair value of which is represented by our equity in each entity, as presented in this table.
(2)Includes our consolidated Legacy Sequoia and Servicing Investment entities. At December 31, 2020, our equity in the Legacy Sequoia and Servicing Investment entities was $5 million and $68 million, respectively. At September 30, 2020, our equity in the Legacy Sequoia and Servicing Investment entities was $5 million and $65 million, respectively.
(3)Includes business purpose bridge loans and associated non-recourse secured financing.
(4)At both December 31, 2020 and September 30, 2020, restricted cash and other assets at Redwood included a total of $46 million of assets held by third-party custodians and pledged as collateral to the GSEs in connection with credit risk-sharing arrangements. These pledged assets can only be used to settle obligations to the GSEs under these risk-sharing arrangements.
| | | | | | | | |
| THE REDWOOD REVIEW I 4TH QUARTER 2020 | | Table 6: Consolidated Balance Sheet 26 |
| | |
|
| S E G M E N T O V E R V I E W |
Segment Overview
In the fourth quarter of 2019, we reorganized our operations into four business segments, representing the areas of the housing market in which we operate. Given changes in the composition of our portfolio in early 2020 resulting from the impact of the COVID-19 pandemic, in the second quarter of 2020, we combined our Third-Party Residential Investments and Multifamily Investments segments into a new segment called Third-Party Investments. Our two lending segments represent vertically integrated platforms and our third segment now captures all of our third-party investments.
Each segment includes all revenue and direct expense associated with the origination, acquisition and management of its associated financial assets. Our three business segments currently include:
Residential Lending – Comprised of our residential mortgage banking operations and investments created from these activities, including primarily securities retained from our residential loan securitization activities.
Business Purpose Lending – Comprised of our business purpose mortgage banking operations and investments created from these activities, including: SFR securities retained from CoreVest-sponsored securitizations and investments in residential and small-balance multifamily bridge loans.
Third-Party Investments – Comprised of other investments not sourced through our residential or business purpose lending operations, including: re-performing loan securities, third-party RMBS (including CRT securities and legacy securities), multifamily securities and loans we have acquired, and other housing-related investments.
| | |
| Detailed endnotes are included at the end of this Redwood Review. |
|
| THE REDWOOD REVIEW I 4TH QUARTER 2020 |
28 |
| | |
|
| D I V I D E N D S A N D T A X A B L E I N C O M E |
Dividends and Taxable Income
Summary
As a REIT, Redwood is required to distribute to shareholders at least 90% of its annual REIT taxable income, excluding net capital gains. To the extent Redwood retains REIT taxable income, including net capital gains, it is taxed at corporate tax rates. Redwood also earns taxable income at its taxable REIT subsidiaries (TRS), which it is not required to distribute.
Dividends Overview
In recent years, our Board of Directors has maintained a practice of paying regular quarterly dividends, including when in excess of the amount required to comply with the provisions of the Internal Revenue Code applicable to REITs. In December 2020, the Board of Directors declared a regular dividend of $0.14 per share for the fourth quarter of 2020, which was paid on December 29, 2020 to shareholders of record on December 17, 2020.
REIT Taxable Income and Dividend Distribution Requirement
Our estimated REIT taxable income/(loss) was $6 million, or $0.05 per share, for the fourth quarter of 2020 and $7 million, or $0.07 per share, for the third quarter of 2020. Under normal circumstances, our minimum REIT dividend requirement would be 90% of our annual REIT taxable income. However, we carried a $29 million federal net operating loss carry forward (NOL) into 2020 at the REIT that affords us the option of retaining REIT taxable income up to the NOL amount, tax free, rather than distributing it as dividends. Federal income tax rules require the dividends paid deduction to be applied to reduce REIT taxable income before the applicability of NOLs is considered; therefore, REIT taxable income must exceed our dividend distribution for us to utilize a portion of our NOL and any remaining NOL amount will carry forward into future years. Since annual REIT taxable income, exclusive of the dividends paid deduction, was a taxable loss of $7 million in 2020, the NOL will be increased by this amount.
Income Tax Characterization of Dividend for Shareholders
Our 2020 dividend distributions are expected to be characterized for federal income tax purposes as 100% return of capital, which in general is non-taxable (provided it does not exceed a shareholder's tax basis in Redwood shares) and reduces a shareholder's basis in Redwood shares (but not below zero). To the extent such distributions exceed a shareholder's basis in Redwood shares, such excess amount would be taxable as capital gain. Under the federal income tax rules applicable to REITs, none of Redwood’s 2020 dividend distributions are expected to be characterized as ordinary income, qualified dividends, or long-term capital gain dividends.
| | |
| Detailed endnotes are included at the end of this Redwood Review. |
|
| THE REDWOOD REVIEW I 4TH QUARTER 2020 |
29 |
| | |
|
| D I V I D E N D S A N D T A X A B L E I N C O M E |
Individual taxpayers may generally deduct 20% of their ordinary REIT dividends from taxable income. This results in a maximum federal effective tax rate of 29.6% on an individual taxpayer's ordinary REIT dividends, compared to the highest marginal rate of 37%. This deduction does not apply to REIT dividends classified as qualified dividend income or long-term capital gain dividends, as those dividends are taxed at a maximum rate of 20% for individuals.
Taxable Income
Below we present details of our taxable income for the years ended December 31, 2020 and December 31, 2019.
| | | | | | | | | | | | | | | | | | | | | | | |
| | |
Taxable Income (1) |
| (In millions, except for per share data) |
| | | | | | | | | | | |
| | Estimated Twelve Months 2020 (2) | | Actual Twelve Months 2019 (2) | | | |
| | | | | | | | | | |
| | | | | | | | | | |
| | | | | | | | | | |
| | | | | | | | | | |
| | | | | | | | | | |
| | | | | | | | | | |
| | | | | | | | | | |
| | | | | | | | | | |
| | | | | | | | | | |
| | | | | | | | | | |
| | | | | | | | | | |
| | | | | | | | | | |
| | | | | | | | | | |
| | | | | | | | | | |
| | | | | | | | | | |
| | | | | | | | | | |
| REIT taxable (loss) income | $ | (7) | | | $ | 136 | | | | | | | | |
| Taxable income (loss) at taxable subsidiaries | 68 | | | (1) | | | | | | | | |
| Taxable income | $ | 61 | | | $ | 135 | | | | | | | | |
| | | | | | | | | | |
Shares used for taxable EPS calculation(3) | 112 | | | 114 | | | | | | | | |
| REIT taxable income per share | $ | (0.05) | | | $ | 1.28 | | | | | | | | |
| Taxable income per share at taxable subsidiaries | $ | 0.61 | | | $ | (0.01) | | | | | | | | |
Taxable income per share (3) | $ | 0.56 | | | $ | 1.27 | | | | | | | | |
| | | | | | | | | | |
| | |
| Detailed endnotes are included at the end of this Redwood Review. |
|
| THE REDWOOD REVIEW I 4TH QUARTER 2020 |
30 |
| | |
|
| N O N - G A A P M E A S U R E M E N T S |
Non-GAAP Measurements
Information about our non-GAAP financial measures is provided in this Appendix, which supplements the descriptions and information about these non-GAAP financial measures that is set forth in previous sections of this Redwood Review. In addition, this Appendix provides reconciliations of non-GAAP financial measures to the most directly comparable GAAP financial measures to the extent those reconciliations are not otherwise set forth in the previous sections of this Redwood Review or in the Financial Tables in the Appendix to this Redwood Review.
What is Economic Net Interest Income for our Investment Portfolio?
Economic net interest income for our investment portfolio is a non-GAAP financial measure derived from GAAP net interest income.
Economic net interest income presents a measure of our current expected economic return on our portfolio investments, calculated under an alternative amortized historical cost methodology, whereby interest income is calculated on an effective basis. Economic net interest income utilizes a historical cost basis (initially established in the third quarter of 2020 at the June 30, 2020 market value of our portfolio investments) to calculate an effective yield based on estimated future cash flows, rather than the cash-based accrual method primarily utilized for purposes of reporting GAAP net interest income for our portfolio investments.
The table below presents a reconciliation of this non-GAAP measurement to the associated GAAP amounts, by segment.
| | | | | | | | | | | | | | | | | | | | |
| | | |
Reconciliation of Non-GAAP Measurements |
($ in millions) |
| Three Months Ended December 31, 2020 | |
| GAAP | | Adjustments | | Non-GAAP | |
| | | | | | |
| Net interest income / Economic net interest income | | | | | | |
| Residential Lending | $ | 6 | | | $ | (3) | | | $ | 3 | | |
| Business Purpose Lending | 10 | | | (2) | | | 8 | | |
| Third-Party Investments | 13 | | | 5 | | | 18 | | |
| | | | | | |
Why does management believe that Economic Net Interest Income provides useful information to investors in Redwood? How does management use this metric to analyze Redwood’s performance?
Management utilizes this measure internally as an alternative way of analyzing the performance of Redwood’s portfolio investments, as management believes it provides useful comparative results, calculated in a manner similar to historical cost accounting, by presenting management's currently expected economic yield for Redwood's portfolio investments over the life of those investments, relative to a historical basis.
| | |
|
|
| THE REDWOOD REVIEW I 4TH QUARTER 2020 |
31 |
| | |
|
| N O N - G A A P M E A S U R E M E N T S |
What factors should be considered when comparing non-GAAP Economic Net Interest Income to GAAP net interest income?
We caution that Economic net interest income for our investment portfolio should not be utilized in isolation, nor should it be considered as an alternative to GAAP net interest income or other measurements of results of operations computed in accordance with GAAP.
| | |
|
|
| THE REDWOOD REVIEW I 4TH QUARTER 2020 |
32 |
| | |
|
| F O R W A R D - L O O K I N G S T A T E M E N T S |
Forward-Looking Statements
As noted above under the heading “Forward-Looking Statements,” this Redwood Review contains forward-looking statements within the meaning of the safe harbor provisions of the Private Securities Litigation Reform Act of 1995. Forward-looking statements involve numerous risks and uncertainties. Our actual results may differ from our expectations, estimates, and projections and, consequently, you should not rely on these forward-looking statements as predictions of future events. Forward-looking statements are not historical in nature and can be identified by words such as “anticipate,” “estimate,” “will,” “should,” “expect,” “believe,” “intend,” “seek,” “plan,” and similar expressions or their negative forms, or by references to strategy, plans, goals, or intentions. These forward-looking statements are subject to risks and uncertainties, including, among other things, those described in our Annual Report on Form 10-K under the caption “Risk Factors” and in our Current Report on Form 8-K filed on April 2, 2020. Other risks, uncertainties, and factors that could cause actual results to differ materially from those projected are described below and may be described from time to time in reports we file with the Securities and Exchange Commission, including reports on Forms 10-K, 10-Q, and 8-K. We undertake no obligation to update or revise forward-looking statements, whether as a result of new information, future events, or otherwise.
Statements regarding the following subjects, among others, are forward-looking by their nature: (i) statements we make regarding Redwood's business strategy and strategic focus, including statements relating to our overall market position, strategy and long-term prospects (including trends driving the flow of capital in the housing finance market, our strategic initiatives designed to capitalize on those trends, our ability to attract capital to finance those initiatives, our approach to raising capital, our ability to pay dividends in the future, and the prospects for federal housing finance reform); (ii) statements related to our financial outlook and expectations for 2021, including with respect to: 2021 GAAP earnings, our operating businesses (including expected after-tax returns on allocated capital and expected capital allocation), our investment portfolio (including expected returns on allocated capital, expectations that net interest income will trend higher throughout 2021 as we deploy incremental capital into portfolio investments at returns consistent with or higher than our in-place portfolio, and expectations that the average cost of funds on our secured debt will continue to improve throughout 2021, and that we will maintain our current mix of marginable versus non-marginable secured borrowings over the year), available capital (including that we expect to deploy the majority of our available capital throughout 2021 to support continued growth in our operating businesses and fund incremental investments for our investment portfolio), and corporate operating expenses and unsecured debt service; (iii) statements related to our investment portfolio, including that we continue to expect significant further upside on our investments from "pre-COVID-19" valuations, and that we expect up to $600 million of loans backing Sequoia and CoreVest issuances to become callable in 2021, well below their estimated fair values; (iv) statements related to our residential consumer and business purpose lending platforms, including that, over time, we expect that the capital allocated to these platforms will be valued as a function of their forecasted earnings
| | |
| Detailed endnotes are included at the end of this Redwood Review. |
|
| THE REDWOOD REVIEW I 4TH QUARTER 2020 |
33 |
| | |
|
| F O R W A R D - L O O K I N G S T A T E M E N T S |
streams, and that we expect to see a significant opportunity to diversify our residential loan purchase mix into Redwood Choice expanded prime and non-QM products; (v) statements relating to our estimate of our available capital (including that we estimate our available capital at December 31, 2020 was approximately $200 million); (vi) statements relating to acquiring residential mortgage loans in the future that we have identified for purchase or plan to purchase, including the amount of such loans that we identified for purchase during the fourth quarter of 2020, at December 31, 2020, and to date in the first quarter of 2021, and expected fallout and the corresponding volume of residential mortgage loans expected to be available for purchase, and expected residential mortgage loan sales in the first quarter of 2021, including through forward sales agreements we entered into during the fourth quarter of 2020; (vii) statements we make regarding future dividends, including with respect to our regular quarterly dividends in 2020; and (viii) statements regarding our expectations and estimates relating to the characterization for income tax purposes of our dividend distributions, our expectations and estimates relating to tax accounting, tax liabilities and tax savings, and GAAP tax provisions, and our estimates of REIT taxable income and TRS taxable income.
Important factors, among others, that may affect our actual results include:
•the COVID-19 pandemic and any worsening of the global business and economic environment as a result;
•the pace at which we redeploy our available capital into new investments and initiatives;
•our ability to scale our platform and systems, particularly with respect to our new initiatives;
•interest rate volatility, changes in credit spreads, and changes in liquidity in the market for real estate securities and loans;
•changes in the demand from investors for residential mortgages and investments, and our ability to distribute residential mortgages through our whole-loan distribution channel;
•our ability to finance our investments in securities and our acquisition of residential mortgages with short-term debt;
•changes in the values of assets we own;
•general economic trends, the performance of the housing, real estate, mortgage, credit, and broader financial markets, and their effects on the prices of earning assets and the credit status of borrowers;
•federal and state legislative and regulatory developments, and the actions of governmental authorities, including the new U.S. presidential administration, and in particular those affecting the mortgage industry or our business (including, but not limited to, the Federal Housing Finance Agency’s rules relating to FHLB membership requirements and the implications for our captive insurance subsidiary’s membership in the FHLB);
•strategic business and capital deployment decisions we make;
•developments related to the fixed income and mortgage finance markets and the Federal Reserve’s statements regarding its future open market activity and monetary policy;
| | |
| Detailed endnotes are included at the end of this Redwood Review. |
|
| THE REDWOOD REVIEW I 4TH QUARTER 2020 |
34 |
| | |
|
| F O R W A R D - L O O K I N G S T A T E M E N T S |
•our exposure to credit risk and the timing of credit losses within our portfolio;
•the concentration of the credit risks we are exposed to, including due to the structure of assets we hold and the geographical concentration of real estate underlying assets we own;
•our exposure to adjustable-rate mortgage loans;
•the efficacy and expense of our efforts to manage or hedge credit risk, interest rate risk, and other financial and operational risks;
•changes in credit ratings on assets we own and changes in the rating agencies’ credit rating methodologies;
•changes in interest rates;
•changes in mortgage prepayment rates;
•changes in liquidity in the market for real estate securities and loans;
•our ability to finance the acquisition of real estate-related assets with short-term debt;
•the ability of counterparties to satisfy their obligations to us;
•our involvement in securitization transactions, the profitability of those transactions, and the risks we are exposed to in engaging in securitization transactions;
•exposure to claims and litigation, including litigation arising from our involvement in securitization transactions;
•ongoing litigation against various trustees of RMBS transactions;
•whether we have sufficient liquid assets to meet short-term needs;
•our ability to successfully compete and retain or attract key personnel;
•our ability to adapt our business model and strategies to changing circumstances;
•changes in our investment, financing, and hedging strategies and new risks we may be exposed to if we expand our business activities;
•our exposure to a disruption or breach of the security of our technology infrastructure and systems;
•exposure to environmental liabilities;
•our failure to comply with applicable laws and regulations;
•our failure to maintain appropriate internal controls over financial reporting and disclosure controls and procedures;
•the impact on our reputation that could result from our actions or omissions or from those of others; changes in accounting principles and tax rules;
•our ability to maintain our status as a REIT for tax purposes;
•limitations imposed on our business due to our REIT status and our status as exempt from registration under the Investment Company Act of 1940;
•decisions about raising, managing, and distributing capital; and
•other factors not presently identified.
| | |
| Detailed endnotes are included at the end of this Redwood Review. |
|
| THE REDWOOD REVIEW I 4TH QUARTER 2020 |
35 |
Recourse Debt Note
Redwood's recourse debt excludes $7.7 billion and $7.9 billion of consolidated securitization debt (ABS issued and servicer advance financing) and other debt that is non-recourse to Redwood at December 31, 2020 and September 30, 2020, respectively.
Non-GAAP Tangible Book Value Note
Non-GAAP tangible shareholders' equity (or book value) is a measurement of stockholders’ equity excluding the value of acquisition-related intangible assets associated with historical acquisitions. Management believes tangible shareholders’ equity provides useful information to investors and management because it eliminates the impact of these acquisition-related items that may not be reflective of the underlying performance of Redwood’s ongoing operations, and which may not be reflective of their impact over the longer term. At December 31, 2020 and September 30, 2020, tangible stockholders' equity excluded $57 million and $61 million of intangible assets, respectively.
Page 3 (Shareholder Letter)
(1)$35 million combined contribution from operating platforms, excludes acquisition-related amortization expense of $5 million.
Page 6 (Fourth Quarter Overview)
(1)Economic return on book value is based on the periodic change in GAAP book value per common share plus dividends declared per common share during the period.
(2)Recourse leverage ratio is defined as recourse debt (see Recourse Debt Note above) at Redwood divided by tangible stockholders' equity (see Non-GAAP Tangible Book Value Note above).
Page 9 (Book Value)
(1)"Investment fair value changes in comprehensive income" presented within this table represent market valuation adjustments on our available-for-sale securities recorded through accumulated other comprehensive income on our balance sheet.
Page 10 (Analysis of Operating Results)
(1)"Mortgage banking income" presented in this table represents the sum of net interest income earned on loan inventory and income from mortgage banking activities within each of our mortgage banking operations.
(2)"G&A and loan acquisition costs excluding amortization" within this table represents general and administrative expenses and loan acquisition costs within each of our mortgage banking
operations, excluding $1 million of purchase-related stock-based consideration amortization expense within our business purpose mortgage banking operations.
(3)"Net contribution, excluding amortization" within this table represents the contribution to net income from each of our mortgage banking operations, excluding $5 million of cumulative purchase-related stock-based consideration amortization expense and amortization expense associated with acquisition-related intangible assets within our business purpose mortgage banking operations.
Page 12 (Analysis of Operating Results, Ctd.)
(1)Amounts in the "Total" column within this table may not agree to amounts on our consolidated income statement, as certain investments in consolidated legacy Sequoia securitizations are not included in our investment portfolio.
(2)See the Non-GAAP measurements section of the Appendix of this Redwood Review for a full description of Non-GAAP economic net interest income.
(3)Secured debt includes both recourse debt and certain non-recourse debt (including for bridge loans and resecuritized RPL securities), secured by our investment assets.
Page 13 (2021 Financial Outlook)
(1)As with all forward-looking statements, our forward-looking statements relating to our 2021 financial outlook are subject to risks and uncertainties, including, among other things, those described in our Annual Report on Form 10-K under the caption "Risk Factors" and other risks, uncertainties, and factors that could cause actual results to differ materially from those described above and under the heading "Forward-Looking Statements" in the Appendix to this Redwood Review, including those described in the "Forward-Looking Statements" at the beginning of this Redwood Review. Although we may update our 2021 financial outlook subsequently in 2021, as a general matter we undertake no obligation to update or revise forward-looking statements, whether as a result of new information, future events, or otherwise.
(2)See the Non-GAAP measurements section of the Appendix of this Redwood Review for a full description of Non-GAAP economic net interest income.
Page 14 (2021 Financial Outlook, Ctd.)
(1)Corporate operating expenses exclude operating expenses incurred directly by the operating businesses as well as certain corporate overhead costs directly allocable to the operating businesses.
| | |
|
|
| THE REDWOOD REVIEW I 4TH QUARTER 2020 |
36 |
Page 15 (Capital Allocations)
(1)Other assets and liabilities are presented on a net basis within this column.
(2)Non-recourse debt presented within this table excludes ABS issued from whole loan securitizations consolidated on our balance sheet, including Sequoia, CoreVest, Freddie Mac and Servicing Investment securitization entities.
(3)Capital allocated to mortgage banking activities represents the working capital we have allocated to manage our loan inventory at each of our operating businesses. This amount generally includes our net capital in loans held on balance (net of financing), capital to acquire loans in our pipeline, net capital utilized for hedges, and risk capital.
(4)In our Third Quarter Redwood Review, we netted certain non-recourse debt (including for bridge loans and resecuritized RPL securities) with its associated secured assets, to present our net economic exposure to the assets. In this table, we present the assets and non-recourse debt separately.
Page 16 (Financing Overview)
(1)Non-marginable debt and marginable debt refers to whether such debt is subject to market value-based margin calls on underlying collateral that is non-delinquent.
(2)Average borrowing cost represents the weighted average contractual cost on non-recourse debt outstanding at December 31, 2020 and does not include deferred issuance costs or debt discounts.
Page 17 (Financing Overview, Ctd.)
(1)Recourse leverage ratio is defined as recourse debt (see Recourse Debt Note above) at Redwood divided by tangible stockholders' equity (see Non-GAAP Tangible Book Value Note above).
(2)Includes $524 million of business purpose bridge loans and $21 million of other related assets.
Page 18 (Credit Overview)
(1)Underlying loan performance information provided in this table is generally reported on a one-month lag. As such, the data reported in this table is from December reports, which reflect a loan performance date of November 30.
(2)Sequoia Select and Sequoia Choice securities presented in this table include subordinate securities and do not include interest only or certificated servicing securities.
(3)HPI updated LTV is calculated based on the current loan balance and an updated property value amount that is formulaically adjusted from value at origination based on the FHFA home price index (HPI).
(4)Delinquency percentages at underlying securitizations are calculated using UPB. Aggregate delinquency amounts by security type are weighted using the market value of our investments in each securitization.
(5)"Investment thickness" represents the average size of the subordinate securities we own as investments in securitizations, relative to the average overall size of the securitizations. For example, if our investment thickness (of first-loss securities) with respect to a particular securitization is 14%, we have exposure to the first 14% of credit losses resulting from loans underlying that securitization.
Page 19 (Credit Overview, Ctd.)
(1)Bridge loans as presented in this table, include $642 million of business purpose bridge loans and $21 million of other related assets.
(2)Average current debt service coverage ratio (or DSCR) is the ratio by which net operating income of a property exceeds it fixed debt costs.
(3)Average loan to value (or LTV) (at origination) is calculated based on the original loan amount and the property value at the time the loan was originated.
(4)"Investment thickness" represents the average size of the securities we own as investments in securitizations, relative to the average overall size of the securitizations. For example, if our investment thickness (of first-loss securities) with respect to a particular securitization is 14%, we have exposure to the first 14% of credit losses resulting from loans underlying that securitization.
Page 30 (Dividends and Taxable Income)
(1)Taxable income for 2020 is an estimate until we file our tax returns for such year. To the extent we expect to pay tax at the corporate level (generally as a result of activity at our TRS), we are required to record a tax provision for GAAP reporting purposes. Any tax provision (or benefit) is not necessarily the actual amount of tax currently due (or receivable as a refund) as a portion of our provision (or benefit) is deferred in nature. It is our intention to retain any excess inclusion income generated in 2020 at our TRS and not pass it through to our shareholders.
(2)TRS taxable income for the twelve-month periods ended December 31, 2020 and December 31, 2019 was adjusted to recognize $59 million of losses in Q4 2019 that were incurred in Q1 2020, in accordance with recent tax law changes.
(3)Taxable income per share is based on the number of shares outstanding at the end of each quarter. The annual taxable income per share is the sum of the quarterly per share estimates.
| | |
|
|
| THE REDWOOD REVIEW I 4TH QUARTER 2020 |
37 |