| | | | | | | | | | | | | | |
| Exhibit 99.2 |
T H E R E D W O O D R E V I E W
T H I R D Q U A R T E R 2 0 2 1 |
R E D W O O D T R U S T |
| | | | |
|
| | | | |
| | |
|
| T A B L E O F C O N T E N T S |
| | | | | |
| Introduction | |
| |
| Shareholder Letter | |
| |
| Quarterly Results | |
| |
Ñ Third Quarter Financial Overview | |
| |
Ñ Quarterly Earnings and Analysis | |
| |
Ñ Book Value | |
| |
Ñ Analysis of Operating Results | |
| |
Ñ RWT Horizons Updates | |
| |
| Quarterly Positions | |
| |
Ñ Capital Allocations | |
| |
Ñ Financing Overview | |
| |
Ñ Credit Overview | |
| |
| Financial Tables | |
| |
| Appendix | |
| |
Ñ Segment Overview | |
| |
Ñ Dividends and Taxable Income | |
| |
Ñ Non-GAAP Measurements | |
| |
Ñ Forward-Looking Statements | |
| |
| Endnotes | |
| | |
|
|
| THE REDWOOD REVIEW I 3RD QUARTER 2021 |
1 |
Note to Readers:
We file annual reports (on Form 10-K) and quarterly reports (on Form 10-Q) with the Securities and Exchange Commission. These filings and our earnings press releases provide information about Redwood and our financial results in accordance with generally accepted accounting principles (GAAP). These documents, as well as information about our business and a glossary of terms we use in this and other publications, are available through our website, www.redwoodtrust.com. We encourage you to review these documents.
Within this document, in addition to our GAAP results, we also present certain non-GAAP measures. When we present a non-GAAP measure, we provide a description of that measure and a reconciliation to the comparable GAAP measure within the Non-GAAP Measurement section of the Appendix.
References herein to “Redwood,” the “company,” “we,” “us,” and “our” include Redwood Trust, Inc. and its consolidated subsidiaries. Note that because we generally round numbers in the tables to millions, except per share amounts, some numbers may not foot due to rounding. References to the “third quarter” refer to the quarter ended September 30, 2021, and references to the “second quarter” refer to the quarter ended June 30, 2021, unless otherwise specified.
Forward-looking statements:
This Redwood Review contains forward-looking statements within the meaning of the safe harbor provisions of the Private Securities Litigation Reform Act of 1995. Forward-looking statements involve numerous risks and uncertainties. Our actual results may differ from our expectations, estimates, and projections and, consequently, you should not rely on these forward-looking statements as predictions of future events. Forward-looking statements are not historical in nature and can be identified by words such as “anticipate,” “estimate,” “will,” “should,” “expect,” “believe,” “intend,” “seek,” “plan,” "could" and similar expressions or their negative forms, or by references to strategy, plans, goals, or intentions. These forward-looking statements are subject to risks and uncertainties, including, among other things, those described in our Annual Report on Form 10-K under the caption “Risk Factors.” Other risks, uncertainties, and factors that could cause actual results to differ materially from those projected are described below and may be described from time to time in reports we file with the Securities and Exchange Commission, including reports on Forms 10-K, 10-Q, and 8-K. We undertake no obligation to update or revise forward-looking statements, whether as a result of new information, future events, or otherwise.
Statements regarding the following subjects, among others, are forward-looking by their nature: statements we make regarding Redwood’s business strategy and strategic focus, statements related to our financial outlook and expectations for 2021 and future years, statements regarding our available capital and sourcing additional capital both internally and from the capital markets, and other statements regarding pending business activities and expectations and estimates relating to our business and financial results. Additional detail regarding the forward-looking statements in this Redwood Review and the important factors that may affect our actual results in 2021 are described in the Appendix of this Redwood Review under the heading “Forward-Looking Statements.”
| | |
| Detailed endnotes are included at the end of this Redwood Review. |
|
| THE REDWOOD REVIEW I 3RD QUARTER 2021 |
2 |
| | |
|
| S H A R E H O L D E R L E T T E R |
Dear Fellow Shareholders:
The third quarter reminded us of the virtue of in-person collaboration, as we were able to successfully host Redwood’s third annual Investor Day – our first since the onset of the pandemic. We were grateful to have so many of you join us, either live in New York City or virtually. During our event we affirmed our commitment to our corporate mission to make quality housing, whether rented or owned, accessible to all American households and unveiled a new strategic vision to become the leading operator and strategic capital provider driving sustainable innovation in housing finance.
We were candid with our audience that we’ve only recently been in a position to pursue such a bold vision, after significantly enhancing our relevance to the housing market over the past several years. This entailed expanding our business footprint beyond the traditional jumbo mortgage space, while staying true to the core competencies of the firm – namely our expertise in residential housing credit. That opened the door for our partnership with CoreVest – which has now been part of our platform for two years – and investments in several other areas of housing finance that have proven accretive to our bottom line. More recently, our vision has mandated further evolution in how we think about capital deployment. Our progress this year seeding and growing our RWT Horizons initiative – investing in cutting-edge technologies with the potential to transform our businesses – reflects an important step in that process. While our capital remains predominantly allocated to our operating businesses and investment portfolio, Horizons embraces the strategic imperatives of innovation and partnership in driving profitable scale.
And our opportunities for transformative growth have perhaps never been more tangible. Our vision hinges upon the immense addressable market we see in front of us, driven by macroeconomic and market forces that have made liquidity from the private markets essential for a robust housing finance system, for both consumers and investors alike. The recent modest uptick in benchmark rates belies a lack of yield in the market that – but for some brief and notable intervals – has been persistent for over a decade. Taken together, this puts an unprecedented premium on enterprises with the know-how to directly access markets efficiently and with discipline. That know-how, coupled with capital optimization and efficiency gains, will drive our bottom line, and continuing to creatively expand distribution channels for our loan products will be the next logical evolution. Putting it all together, as we execute our strategy, we expect to produce high quality earnings from the diverse, durable and recurring revenue streams we have been augmenting over time.
| | |
| Detailed endnotes are included at the end of this Redwood Review. |
|
| THE REDWOOD REVIEW I 3RD QUARTER 2021 |
3 |
| | |
|
| S H A R E H O L D E R L E T T E R |
Turning to the third quarter, after a historic first half of the year, our team continued apace on our path of profitable growth. Even after communicating an ambitious second half 2021 forecast, our third quarter results still managed to exceed expectations. CoreVest maintained its remarkable momentum, funding $639 million of loans for the quarter, including a record $239 million in September alone; and that was momentum we took directly into what has historically been the busiest quarter of the year for business-purpose lending. Our third quarter saw strong contributions from both our SFR and Bridge teams, and we made key progress in our correspondent loan business and capitalized on our strategic investment in Churchill. Meanwhile, the Residential business made quick work of its previous volume record with $4.7 billion of locks in the third quarter. Notwithstanding that benchmark rates hit lows not seen since February, almost 60% of our locks during the third quarter were on purchase-money loans – an important statement about the quality of our pipeline, our sellers, and the durability of volumes we could expect in a rising rate environment.
Our investment portfolio remained in step with this operating progress, with our securities portfolio appreciating in value by approximately 2% during the third quarter. As detailed in our quarterly investor presentation, net of third quarter gains, there remains potential upside of $3.04 per share in our portfolio through a combination of accretable market discount and call rights that we control.
These successes drove another strong quarter of financial results, with GAAP earnings of $0.65 per diluted share, a 27% annualized return on equity for the quarter. Book value increased 4.7% on the quarter to $12.00 per share, contributing to an overall year-to-date increase of 21%. We delivered our third consecutive dividend increase of the year ahead of market expectations – up 17% to $0.21 per share – and have now earned a 27% economic return year to date, which represents growth in GAAP book value combined with dividends paid.
Our uniquely diverse platform is beginning to command attention in an industry where differentiation isn’t commonplace. The array of records or “firsts” we have produced this year reflects a commitment to scale through creativity and iteration, earning us accolades as “one of the premier innovators and disruptors in housing over the next decade” by one highly respected Investor Day attendee. That’s not the tag line of the typical REIT – much less the longest-tenured publicly traded mortgage REIT in the country. But as we reminded our Investor Day audience in New York, we’ve never defined our business by way of a federal tax election. Those who do risk missing the strength of this Redwood forest for the trees, particularly as we continue to analyze our optimal long-term corporate structure.
| | |
| Detailed endnotes are included at the end of this Redwood Review. |
|
| THE REDWOOD REVIEW I 3RD QUARTER 2021 |
4 |
| | |
|
| S H A R E H O L D E R L E T T E R |
As always, the bigger picture is more than a simple sum of its constituent parts, and we have sustained our momentum as an early mover. To wit: this past September alone we crisply executed a series of strategic and novel transactions across various disciplines within our firm that were both accretive to earnings and foundational for our future operating progress. Our Residential team completed a first-of-its-kind securitization leveraging blockchain technology for enhanced payment reporting for our Sequoia bond investors. Historically, investors have needed to wait until well into the following month to see a month’s worth of remittance details on underlying loans. Liquid Mortgage – an early portfolio company of RWT Horizons – has integrated with our sub-servicer to publish daily remittance information on a public blockchain. We believe this milestone just scratches the surface of how this technology can be applied across our company.
Next up was the completion of CoreVest’s inaugural bridge loan securitization, which priced inside of comparable transactions and unlocked meaningful value for that channel. This new form of distribution provides a valuable capital management tool with a 30-month reinvestment feature, the longest of its kind to date for this type of transaction. We expect CoreVest to continue issuing bridge loan securitizations in conjunction with our traditional single-family rental ("SFR") loan securitizations, having recently priced the 19th overall CAFL securitization in October.
Last but certainly not least, our portfolio team co-sponsored the first ever securitization backed entirely by residential Home Equity Investment contracts (“HEIs”). Co-sponsored with Point Digital, a fintech platform, this hallmark transaction allowed investors to participate in a new sector of the residential market that enables homeowners to participate in the benefits of home price appreciation without having to sell their homes or incur additional debt obligations. In parallel with this securitization, we re-upped our flow purchase arrangement with Point, providing us with continuing HEI acquisition and securitization opportunities.
RWT Horizons also continued its strong investment pace, completing six investments during the third quarter with several more currently in underwriting. The Horizons team is assessing a broad array of opportunities, including several in the climate analytics area, which continues to see a flurry of activity as firms attempt to evolve traditional methods of predicting how climate change impacts property valuation and insurability, and overall credit performance. With a direct nexus to our firmwide ESG work, we expect to continue dedicating focus to this area through Horizons.
Rounding the bend toward the end of the year, we’re proceeding cautiously. We see several macro and market risks ahead, including COVID-19 variants, rising inflation, central bank tapering (now officially signaled by the Fed) and Federal debt ceiling extension strife, to name a few. More fundamentally, recent trends in unemployment claims data suggest that we are still in a recovery phase and the current economic situation is far from stable, notwithstanding consistent upward pressure on home prices and rents that has otherwise been a tailwind to our
| | |
| Detailed endnotes are included at the end of this Redwood Review. |
|
| THE REDWOOD REVIEW I 3RD QUARTER 2021 |
5 |
| | |
|
| S H A R E H O L D E R L E T T E R |
business results. Our interest rate, capital and broader risk management posture reflects this view: While we’ve generated strong earnings thus far in 2021, we have done so with record levels cash on hand – including $557 million at September 30, 2021.
But it's not good enough for us to be healthy, profitable and produce returns for shareholders. We’re also focused on making a positive impact for our people, our customers, our communities, and the overall society within which we operate. In investor parlance, this is ESG – a focus on a business model vision and a set of core values that produces long-term and sustainable benefits for all our stakeholders. For us, it cuts right to our core values and the mission of the firm, which are embedded in everything we do – from the investments and strategies we pursue, to the partners with whom we choose to do business, to the manner in which we engage with our employees, customers and communities.
There are several recent examples that underscore how our partnerships further our mission and promote a greater benefit beyond the economic value to Redwood – for which we need to look no further back than this past September. Our co-sponsored securitization with Point was a first in a sector that can continue to channel liquidity and capital to homeowners seeking to unlock a portion of the wealth tied up in their homes. Working together with Liquid Mortgage, we were able to provide housing investors more transparency around remittance data, another step forward in enhancing efficiency in an industry where efficiencies ultimately benefit the consumer. Our Horizons investment in Flock, self-described as the “People’s REIT” for the value they drive for their communities, has the potential to revolutionize the way rental properties are owned by small and mid-size housing investors. And, as always, our core activities in BPL continue to support the construction and stabilization of high-quality and accessible rental housing stock, benefiting renters and local communities alike.
Going forward, our stakeholders should expect that we will continue operating to fulfill our broadly-conceived mission, focusing on the significant addressable markets in front of us, embracing the cusp of innovation, running a business grounded in fundamentals and sound analysis, and nurturing a diverse talent bench engaged and aligned with our values.
Thanks for your continued support.
| | | | | | | | |
| | |
| Christopher J. Abate | | Dashiell I. Robinson |
| Chief Executive Officer | | President |
| | |
| Detailed endnotes are included at the end of this Redwood Review. |
|
| THE REDWOOD REVIEW I 3RD QUARTER 2021 |
6 |
| | |
|
| Q U A R T E R L Y R E S U L T S |
Third Quarter Financial Overview
| | | | | | | | | | | | | | | | | |
|
Key Financial Results and Metrics |
| | | |
| Three Months Ended | | | | |
| 9/30/2021 | | 6/30/2021 | | | | |
| | | | | | | |
| Earnings per Share | $ | 0.65 | | | $ | 0.66 | | | | | |
| Return on Equity (annualized) | 27 | % | | 29 | % | | | | |
| | | | | | | |
| Book Value per Share | $ | 12.00 | | | $ | 11.46 | | | | | |
| Dividend per Share | $ | 0.21 | | | $ | 0.18 | | | | | |
Economic Return on Book Value (1) | 6.5 | % | | 8.2 | % | | | | |
| | | | | | | |
| Available Capital (in millions) | $ | 350 | | | $ | 175 | | | | | |
Recourse Leverage Ratio (2) | 2.2x | | 2.2x | | | | |
| | | | | | | |
Ñ Our third quarter 2021 results reflect ongoing strength of our operating platforms with higher volumes and strong margins driving increased revenues, improved returns in our investment portfolio from more efficient financing, and a tax benefit realized during the quarter. These results, along with an increase in the value of our securities portfolio attributable to continued, positive fundamental trends, contributed to a 4.7% increase in our book value per share during the quarter.
Ñ In September, we announced a 17% increase in our quarterly dividend to $0.21 per share.
Ñ We funded $639 million of business purpose loans in the third quarter (a 21% increase from the second quarter), including $394 million of single-family rental (SFR) loans and $245 million of bridge loans.
Ñ We locked a record $4.7 billion of jumbo loans with over 125 discrete sellers and purchased $3.2 billion of jumbo loans.
Ñ We securitized $1.0 billion of loans through three securitizations across Residential and Business Purpose Lending, and distributed $2.4 billion of jumbo loans through whole loan sales.
Ñ We completed the first-ever securitization backed entirely by residential Home Equity Investment contracts (HEIs), issuing approximately $146 million of securities through a transaction co-sponsored with Point Digital.
Ñ Funded six venture investments through our RWT Horizons venture investment arm.
Ñ We added over $350 million of financing capacity to support growth of our operating platforms and completed a new $100 million non-marginable term financing collateralized by retained securities in our investment portfolio.
Ñ At September 30, 2021, our unrestricted cash was $557 million, and our estimated available capital was $350 million.
| | |
| Detailed endnotes are included at the end of this Redwood Review. |
|
| THE REDWOOD REVIEW I 3RD QUARTER 2021 |
7 |
| | |
|
| Q U A R T E R L Y R E S U L T S |
Quarterly Earnings and Analysis
Below we present GAAP net income for the third and second quarters of 2021.
| | | | | | | | | | | | | | |
| |
GAAP Net Income |
($ in millions, except per share data) |
| Three Months Ended | |
| 9/30/2021 | | 6/30/2021 | |
| | | | |
| | | | |
| Net interest income | | | | |
| Investment portfolio | $ | 42 | | | $ | 33 | | |
| Mortgage banking | 9 | | | 7 | | |
| Corporate | (9) | | | (9) | | |
| Total net interest income | 42 | | | 31 | | |
| | | | |
| Non-interest income | | | | |
| Residential mortgage banking activities, net | 33 | | | 21 | | |
| Business purpose mortgage banking activities, net | 30 | | | 33 | | |
| Investment fair value changes, net | 26 | | | 49 | | |
| Other income, net | 2 | | | 2 | | |
| Realized gains, net | 7 | | | 8 | | |
| Total non-interest income, net | 98 | | | 114 | | |
| | | | |
| General and administrative expenses | (48) | | | (41) | | |
| Loan acquisition costs | (5) | | | (4) | | |
| Other expenses | (4) | | | (4) | | |
| Benefit from (provision for) income taxes | 4 | | | (7) | | |
| | | | |
| Net income | $ | 88 | | | $ | 90 | | |
| | | | |
| Earnings per diluted common share | $ | 0.65 | | | $ | 0.66 | | |
| | | | |
GAAP Net Income by Segment |
($ in millions) |
| Three Months Ended | |
| 9/30/2021 | | 6/30/2021 | |
| | | | |
| | | | |
| Residential Lending | $ | 39 | | | $ | 31 | | |
| Business Purpose Lending | 32 | | | 33 | | |
| Third-Party Investments | 30 | | | 54 | | |
| Corporate | (13) | | | (27) | | |
| Net income | $ | 88 | | | $ | 90 | | |
| | |
| Detailed endnotes are included at the end of this Redwood Review. |
|
| THE REDWOOD REVIEW I 3RD QUARTER 2021 |
8 |
| | |
|
| Q U A R T E R L Y R E S U L T S |
Analysis of Earnings
Ñ Net interest income increased from the second quarter of 2021, primarily due to higher discount accretion income on our available-for-sale securities (reflecting anticipated calls of Redwood sponsored securitizations), lower cost of funds on bridge loan financing, and a higher average balance of loans in inventory at our operating businesses.
Ñ Income from residential mortgage banking activities increased from second quarter levels, as loan purchase commitments of $3.3 billion in the third quarter were 20% higher than the second quarter and margins improved from the second quarter.
Ñ Income from business purpose mortgage banking activities decreased slightly from the second quarter as spread tightening moderated quarter-over-quarter. Aside from this moderation, our results for the quarter benefited from an increase in funding volume from the second quarter, as well as strong execution on an SFR securitization completed in the quarter.
Ñ Positive investment fair value changes in the third quarter reflected continued strength in credit performance and spread tightening across our investment portfolio during the quarter, particularly in our third-party re-performing loan ("RPL") and CoreVest SFR ("CAFL") securities. Additional positive fair value changes were realized through our co-sponsored securitization of Home Equity Investment contracts, the first of its kind.
Ñ Realized gains in the third quarter included $6 million from called securities. During the quarter, we called two Sequoia securitizations resulting in the acquisition of $66 million of seasoned jumbo loans at par.
Ñ General and administrative expenses increased from the second quarter, as variable compensation increased commensurate with year-to-date GAAP earnings and returns.
Ñ Other expenses were primarily comprised of acquisition-related intangible amortization expense.
Ñ Our income tax provision decreased in the third quarter, compared to the second quarter, as we realized a benefit from the release of valuation allowance on a portion of our deferred tax assets, which was partially offset by an increase in state taxes (together accounting for $16 million of net benefit during the quarter). Exclusive of these two amounts, our provision for income taxes increased during the quarter, reflecting higher income earned at our taxable REIT subsidiary.
| | |
| Detailed endnotes are included at the end of this Redwood Review. |
|
| THE REDWOOD REVIEW I 3RD QUARTER 2021 |
9 |
| | |
|
| Q U A R T E R L Y R E S U L T S |
Book Value
| | | | | | | | | | | | | | |
| |
Changes in Book Value per Share |
($ in per share) |
| Three Months Ended | |
| 9/30/2021 | | 6/30/2021 | |
| | | | |
| Beginning book value per share | $ | 11.46 | | | $ | 10.76 | | |
| Basic earnings per share | 0.75 | | | 0.77 | | |
| Changes in accumulated other comprehensive income | | | | |
| Unrealized gains on AFS securities, net | 0.03 | | | 0.11 | | |
| Realized gains on AFS securities | (0.06) | | | (0.07) | | |
| Discount accretion on AFS securities | (0.06) | | | (0.01) | | |
| Dividends | (0.21) | | | (0.18) | | |
| Equity compensation, net | 0.04 | | | 0.05 | | |
| | | | |
| Other, net | 0.05 | | | 0.03 | | |
| | | | |
| Ending book value per share | $ | 12.00 | | | $ | 11.46 | | |
Ñ Our GAAP book value increased $0.54 per share during the third quarter of 2021, as basic earnings per share significantly exceeded our third quarter dividend of $0.21 per share.
| | |
| Detailed endnotes are included at the end of this Redwood Review. |
|
| THE REDWOOD REVIEW I 3RD QUARTER 2021 |
10 |
| | |
|
| Q U A R T E R L Y R E S U L T S |
Analysis of Operating Results
This section provides additional information on quarterly activity within each of our business segments. A full description of our segments is included in the Appendix of this Redwood Review, and detailed segment income statements are presented in Table 2 within the Financial Tables section of this Redwood Review.
Mortgage Banking Operations
Below we present a summary of the key operating metrics of each of our mortgage banking operations, by segment.
| | | | | | | | | | | | | | | | | | | | |
|
Mortgage Banking Key Operating Metrics |
| ($ in millions) |
| | | | | | |
| Q3 2021 | |
| Business Purpose Mortgage Banking | | Residential Mortgage Banking | | Total | |
| | | | | | |
Mortgage banking income (1) | $ | 32 | | | $ | 40 | | | $ | 73 | | |
| Net contributions (GAAP) | $ | 11 | | | $ | 19 | | | $ | 30 | | |
Add back: acquisition amortization expenses (2) | 5 | | | — | | | 5 | | |
| After-tax net operating contribution (non-GAAP) | $ | 16 | | | $ | 19 | | | $ | 35 | | |
| | | | | | |
Capital utilized (average for quarter) (3) | $ | 147 | | | $ | 302 | | | $ | 449 | | |
| | | | | | |
| Return on capital (GAAP) | 29 | % | | 26 | % | | 27 | % | |
After-tax operating return on capital (non-GAAP) (4) | 43 | % | | 26 | % | | 31 | % | |
| | | | | | |
| Production Volumes | | | | | | |
| SFR loan fundings | $ | 394 | | | | | | |
| Bridge loan fundings | $ | 245 | | | | | | |
| | | | | | |
| Residential loan locks | | | $ | 4,743 | | | | |
| Residential loan purchase commitments (fallout adjusted) | | | $ | 3,288 | | | | |
| | | | | | |
Business Purpose Mortgage Banking
Ñ Business purpose mortgage banking income in the third quarter benefited from higher loan funding volume and improved SFR securitization execution relative to the second quarter, however, decreased overall from $35 million in the second quarter, as the benefit of spread tightening on beginning inventory balances moderated quarter-over-quarter.
Ñ Third quarter SFR loan fundings increased 26% and bridge loan fundings increased 14% from respective second quarter volumes.
Ñ Approximately 66% of total origination volumes in the third quarter were from repeat borrowers.
| | |
| See Appendix for details on non-GAAP measures. Detailed endnotes are included at the end of this Redwood Review. |
|
| THE REDWOOD REVIEW I 3RD QUARTER 2021 |
11 |
| | |
|
| Q U A R T E R L Y R E S U L T S |
Ñ At September 30, 2021, we had $466 million of SFR loans held-for-sale in inventory on our balance sheet. All bridge loans originated during the quarter were transferred into our investment portfolio.
Ñ In July 2021, we completed our second broadly-distributed SFR securitization of the year, which included approximately $306 million of single-family rental loans. In September 2021, we completed our first-ever bridge loan securitization, initially backed by $272 million of bridge loans, and structured with $300 million of total funding capacity and a feature to allow reinvestment of loan payoffs for the first 30 months of the transaction.
Residential Mortgage Banking
Ñ Third quarter residential loan locks increased 22% from second quarter volumes, and included $4.2 billion of Select loans and $0.5 billion of Choice loans. Third quarter loan purchases totaled $3.2 billion.
Ñ Approximately 59% of loans locked in the third quarter were purchase-money loans and 41% were refinancings, largely consistent with the mix of second quarter locks.
Ñ During the third quarter, we distributed $2.4 billion of loans through whole loan sales and completed one securitization backed by $449 million of loans.
Ñ At September 30, 2021, we had $1.5 billion of loans in inventory on our balance sheet and our loan pipeline included $2.8 billion of loans identified for purchase (locked loans, unadjusted for expected fallout). Additionally, at quarter-end we had entered into forward sale agreements for $662 million of loans.
Ñ Our gross margin(1) for the third quarter was 122 basis points, up from 98 basis points in the second quarter of 2021.
| | |
| See Appendix for details on non-GAAP measures. Detailed endnotes are included at the end of this Redwood Review. |
|
| THE REDWOOD REVIEW I 3RD QUARTER 2021 |
12 |
| | |
|
| Q U A R T E R L Y R E S U L T S |
Investment Portfolio
Below we present key financial results for our investment portfolio organized by segment for the third quarter of 2021.
| | | | | | | | | | | | | | | | | | | | | | | | | | |
|
| Investment Portfolio Key Financial Results |
| ($ in millions) |
| Q3 2021 | |
| Business Purpose Lending | | Residential Lending | | Third-Party Investments | | Total(1) | |
| | | | | | | | |
| Net interest income | $ | 18 | | | $ | 12 | | | $ | 12 | | | $ | 42 | | |
| Net contribution (GAAP) | $ | 21 | | | $ | 19 | | | $ | 30 | | | $ | 71 | | |
Less: realized gains (2) | — | | | (6) | | | — | | | (7) | | |
Less: investment fair value changes (2) | (3) | | | (2) | | | (21) | | | (26) | | |
| Adjusted net contribution (non-GAAP) | $ | 17 | | | $ | 11 | | | $ | 10 | | | $ | 38 | | |
| | | | | | | | |
| Capital utilized (average for quarter) | | | | | | | $ | 1,132 | | |
| | | | | | | | |
| Return on capital (GAAP) | | | | | | | 25 | % | |
Adjusted return on capital (non-GAAP) (3) | | | | | | | 13 | % | |
| | | | | | | | |
| At period end | | | | | | | | |
| Carrying values of assets | | | | | | | $ | 2,458 | | |
Secured debt balances (4) | | | | | | | (1,355) | | |
| Capital invested | | | | | | | $ | 1,103 | | |
Leverage ratio (5) | | | | | | | 1.24x | |
| | | | | | | | |
| | | | | | | | |
Ñ Portfolio net interest income increased to $42 million in the third quarter from $33 million in the second quarter of 2021, driven by lower interest expense on bridge loan financing and increased discount accretion income on our available-for-sale securities, each accounting for approximately $5 million of the change. The increase in discount accretion in the third quarter was driven by expectations for certain of our retained Sequoia securities to be called over the next several quarters, affecting our cash flow forecasts and effective yields for those investments.
Ñ Adjusted return on capital (a non-GAAP measure that excludes realized gains and investment fair value changes) was 13% on an annualized basis in the third quarter, compared with 11% on an annualized basis in the second quarter of 2021. The increase was driven by higher incremental leverage employed in the portfolios through new non-marginable borrowings, and higher net interest income as discussed above.
Ñ Positive investment fair value changes in the third quarter reflected continuing improvement in credit performance and spread tightening within our investment portfolio during the quarter – particularly for our RPL and CAFL securities (see Table 5 in the Financial Tables section for additional detail).
| | |
| See Appendix for details on non-GAAP measures. Detailed endnotes are included at the end of this Redwood Review. |
|
| THE REDWOOD REVIEW I 3RD QUARTER 2021 |
13 |
| | |
|
| Q U A R T E R L Y R E S U L T S |
RWT Horizons Updates
RWT Horizons was launched in December 2020, as a venture investment strategy focused on early and mid-stage companies driving innovation in financial and real estate technology, and digital infrastructure. Investments made through RWT Horizons are designed to support companies whose technologies are accretive to our businesses, including our residential and business-purpose lending platforms. New partnerships forged through RWT Horizons are expected to enhance our technology roadmap and drive innovation that can reduce inefficiencies and promote scalability and transparency to our customers, counterparties and investors.
Since inception, we have completed investments in 11 technology companies, including six in the third quarter of 2021. Our third quarter investments included our previously-announced investments in Canopy, an innovative platform focused on digitizing the due-diligence review process, Flock Homes, a pioneering rental ownership platform, and Frontiers Capital, which supports the expansion of our Horizons investment pipeline. Additional activity during the third quarter included investments in Amenify, a technology enabled platform focused on providing tenant services to property owners across the US, and Beekin, a firm focused on providing data-driven revenue management tools to property owners, as well as an incremental investment in Point, a leading financial technology platform that allows homeowners to unlock the value of their home equity through Home Equity Investment contracts.
Highlights of the third quarter activity with our Horizons portfolio companies included completing the market's first non-agency securitization that leverages blockchain-based technology with Liquid Mortgage on SEMT 2021-6, and the successful securitization of Point Digital’s Home Equity Investment product, also a first of its kind. Our early Horizons investments were now made eight to twelve months ago, and we remain actively engaged with these companies on a number of strategic fronts.
| | |
| See Appendix for details on non-GAAP measures. Detailed endnotes are included at the end of this Redwood Review. |
|
| THE REDWOOD REVIEW I 3RD QUARTER 2021 |
14 |
| | |
|
| Q U A R T E R L Y P O S I T I O N S |
Capital Allocations
The following table presents our allocations of capital by segment and by investment type as of September 30, 2021.
| | | | | | | | | | | | | | | | | | | | | | | | | | |
|
| Capital Allocation Detail by Segment |
| By Investment Type |
| September 30, 2021 |
| ($ in millions) |
| | | | | | | | |
| Fair Value of Assets (1) | | Recourse Debt | | Non-Recourse Debt (2) | | Total Capital | |
| | | | | | | | |
| Residential Lending | | | | | | | | |
| Sequoia securities | $ | 382 | | | $ | (199) | | | $ | — | | | $ | 183 | | |
| Called Sequoia loans | 151 | | | (137) | | | — | | | 13 | | |
| Other investments | 32 | | | — | | | — | | | 32 | | |
Capital allocated to mortgage banking operations(3) | 1,513 | | | (1,198) | | | — | | | 315 | | |
| Total Residential Lending | 2,078 | | | (1,534) | | | — | | | 543 | | |
| | | | | | | | |
| Business Purpose Lending | | | | | | | | |
| SFR securities | 288 | | | (197) | | | — | | | 91 | | |
| Bridge loans | 832 | | | (204) | | | (429) | | | 199 | | |
Capital allocated to mortgage banking operations(3) | 432 | | | (327) | | | — | | | 105 | | |
| Platform premium | 45 | | | — | | | — | | | 45 | | |
| Total Business Purpose Lending | 1,597 | | | (728) | | | (429) | | | 440 | | |
| | | | | | | | |
| Third-Party Investments | | | | | | | | |
| RPL securities | 517 | | | — | | | (161) | | | 356 | | |
| Other third-party securities | 94 | | | — | | | — | | | 94 | | |
| Multifamily securities | 74 | | | (28) | | | — | | | 46 | | |
| Other investments | 88 | | | — | | | — | | | 88 | | |
| Total Third-Party Investments | 773 | | | (28) | | | (161) | | | 584 | | |
| | | | | | | | |
| Corporate capital | 427 | | | | | | | 427 | | |
| Other assets/(liabilities), net | 42 | | | | | | | 42 | | |
| Corporate debt | — | | | (660) | | | — | | | (660) | | |
| | | | | | | | |
| Totals | $ | 4,917 | | | $ | (2,951) | | | $ | (590) | | | $ | 1,376 | | |
| | |
| Detailed endnotes are included at the end of this Redwood Review. |
|
| THE REDWOOD REVIEW I 3RD QUARTER 2021 |
15 |
| | |
|
| Q U A R T E R L Y P O S I T I O N S |
The following table presents our allocations between our operating platforms and our investment portfolios at September 30, 2021 and June 30, 2021.
| | | | | | | | | | | | | | |
|
| Capital Allocation Summary |
| ($ in millions) |
| | | | |
| September 30, 2021 | | June 30, 2021 | |
| | | | |
| Operating Platforms | | | | |
| Redwood Residential working capital | $ | 315 | | | $ | 315 | | |
| CoreVest working capital | 105 | | | 100 | | |
CoreVest platform premium (1) | 45 | | | 49 | | |
| Total | 465 | | | 464 | | |
| | | | |
| Investment Portfolio | | | | |
| Residential | 229 | | | 220 | | |
| Business Purpose | 290 | | | 424 | | |
| Third Party | 584 | | | 592 | | |
| Total | 1,103 | | | 1,237 | | |
| | | | |
| Available Capital | 350 | | | 175 | | |
| | | | |
| Corporate | 118 | | | 79 | | |
| Total Capital | 2,036 | | | 1,955 | | |
| | | | |
| Unsecured Debt | (660) | | | (660) | | |
| Total Equity | $ | 1,376 | | | $ | 1,295 | | |
| | | | |
Ñ During the third quarter, the decline in capital allocated to our investment portfolio was driven primarily by use of incremental non-marginable leverage, including $100 million of new secured term financing on retained CoreVest SFR securities, the securitization of $272 million of bridge loans (and $30 million of initial cash collateral) with $270 million of non-recourse debt and the securitization of Home Equity Investment contracts.
Ñ This decrease was partially offset by deployment of capital into new investments, including a $90 million net increase in bridge loans outstanding, $17 million of securities retained from a CoreVest securitization, $2 million of securities retained from a Sequoia securitization and $11 million of third-party securities purchases. See Table 5 in the Financial Tables section of this Redwood Review for additional detail on investment portfolio activities.
Ñ At September 30, 2021, we estimate we had approximately $350 million of available capital.
Ñ The difference between our unrestricted cash and our available capital is generally attributable to risk capital that we retain to manage liquidity risk in our operations, and can also be comprised of temporarily unutilized working capital allocated to our mortgage banking operations, which can fluctuate based on the timing of loan acquisitions and dispositions.
| | |
| Detailed endnotes are included at the end of this Redwood Review. |
|
| THE REDWOOD REVIEW I 3RD QUARTER 2021 |
16 |
| | |
|
| Q U A R T E R L Y P O S I T I O N S |
Financing Overview
We finance our business with a diversified mix of secured recourse and non-recourse debt, as well as unsecured corporate debt. Following is an overview of our current financing structure.
Recourse Debt
The following summaries present the composition of our recourse debt and its characteristics as of September 30, 2021.
| | | | | | | | | | | | | | | | | | | | | | | | | | | | | | | | | | | | | | | | | | | | |
| | | | | | | | | | | | | | |
Recourse Debt Balances at September 30, 2021 |
($ in millions) |
| | | | | | | | | | | | | | |
| | | Secured Debt | | | | | | | |
| Fair Value of Secured Assets | | Non-Marginable Debt (1) | | Marginable Debt (1) | | Total Secured Debt | | Unsecured Debt | | Total Debt | | Average Borrowing Cost (2) | |
| | | | | | | | | | | | | | |
| Corporate debt | N/A | | $ | — | | | $ | — | | | $ | — | | | $ | 660 | | | $ | 660 | | | 4.7 | % | |
| Securities portfolio | 612 | | | 345 | | | 80 | | | 425 | | | — | | | 425 | | | 3.8 | % | |
| SFR loans | 426 | | | 327 | | | — | | | 327 | | | — | | | 327 | | | 3.2 | % | |
| Bridge loans | 277 | | | 204 | | | — | | | 204 | | | — | | | 204 | | | 3.4 | % | |
| Residential loans | 1,478 | | | 717 | | | 618 | | | 1,335 | | | — | | | 1,335 | | | 1.9 | % | |
| | | | | | | | | | | | | | |
| Total | $ | 2,793 | | | $ | 1,593 | | | $ | 698 | | | $ | 2,291 | | | $ | 660 | | | $ | 2,951 | | | 3.0 | % | |
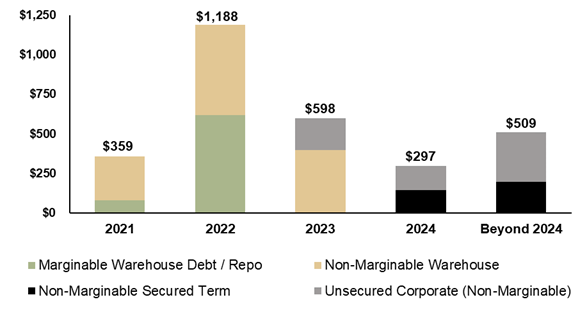
Recourse Debt Scheduled Maturities
($ in millions)
| | |
| Detailed endnotes are included at the end of this Redwood Review. |
|
| THE REDWOOD REVIEW I 3RD QUARTER 2021 |
17 |
| | |
|
| Q U A R T E R L Y P O S I T I O N S |
Leverage
Ñ Our recourse leverage ratio(1) was 2.2x at September 30, 2021, unchanged from June 30, 2021.
Ñ Our warehouse debt coming due in 2021 and 2022 is used to finance residential loans that we generally expect to sell over a one to three month time frame, as well as business purpose bridge loan investments with shorter durations that are generally matched with their associated borrowings.
Warehouse Capacity
Ñ At September 30, 2021, we had residential warehouse facilities outstanding with seven different counterparties, with $2.7 billion of total capacity and $1.4 billion of available capacity. These included non-marginable facilities with $1.2 billion of total capacity and marginable facilities with $1.5 billion of total capacity.
Ñ At September 30, 2021, we had business purpose warehouse facilities outstanding with four different counterparties, with $1.3 billion of total capacity and $0.7 billion of available capacity (inclusive of capacity on non-recourse facilities). All of these facilities are non-marginable.
Non-Recourse Debt
In addition to our secured recourse debt, we also utilize secured, non-recourse term debt to finance certain of our business purpose bridge loans, the majority of our RPL securities investments and certain other investments. Unlike the non-recourse Sequoia and CAFL securitization debt we consolidate on our balance sheet that is associated with subordinate securities that we own in those securitizations, these structures have prepayment and other provisions allowing for or requiring repayment over a shorter term.
As this debt is non-recourse, our net economic exposure represents the difference between the fair value of the investment collateral and the associated non-recourse debt. At September 30, 2021, we had $223 million of bridge loans financed with $159 million of non-recourse term debt for a net economic exposure of approximately $64 million to these assets, and $304 million of bridge loans and restricted cash financed with $270 million of non-recourse securitization debt for a net economic exposure of approximately $39 million to these assets (this structure includes a feature to allow reinvestment of loan payoffs for the first 30 months of the transaction). Additionally, at September 30, 2021, we had: $451 million of RPL securities financed with $161 million of non-recourse debt, for a net economic exposure of approximately $290 million to these assets; $167 million of HEIs financed with $145 million of non-recourse securitization debt, for a net economic exposure of approximately $10 million to these assets(2); and $179 million of servicing advances and restricted cash financed with $152 million of non-recourse short-term debt, for a net economic exposure of approximately $27 million to these assets.
| | |
| Detailed endnotes are included at the end of this Redwood Review. |
|
| THE REDWOOD REVIEW I 3RD QUARTER 2021 |
18 |
| | |
|
| Q U A R T E R L Y P O S I T I O N S |
Credit Overview
This section presents select credit characteristics for our major investment types, with current information as of September 30, 2021.
| | | | | | | | | | | | | | | | | | | | |
|
Residential Investments Credit Characteristics (1) |
September 30, 2021 | |
($ in millions, except where noted) | |
| Sequoia Select Securities(2) | | Sequoia Choice Securities(2) | | Re-Performing Loan Securities | |
| | | | | | |
| Market value | $ | 131 | | | $ | 225 | | | $ | 517 | | |
| Average FICO (at origination) | 768 | | | 739 | | | 609 | | |
HPI updated average LTV (3) | 40 | % | | 54 | % | | 68 | % | |
| Average loan size (in thousands) | $ | 632 | | | $ | 699 | | | $ | 164 | | |
| Gross weighted average coupon | 4.0 | % | | 4.9 | % | | 4.5 | % | |
| Current 3-month prepayment rate | 42 | % | | 52 | % | | 14 | % | |
90+ days delinquency (as a % of UPB)(4) | 0.6 | % | | 2.9 | % | | 10.2 | % | |
Investment thickness (5) | 6 | % | | 30 | % | | 24 | % | |
| | | | | | |
Ñ Sequoia Select Securities — Through the third quarter of 2021, we had securitized $24.8 billion of Sequoia Select loans since 2010. As of September 30, 2021, our securitized Select portfolio includes fully documented loans to prime borrowers with an average FICO score (at loan origination) of 768, maximum loan-to-value (at origination) of 85%, and a maximum debt-to-income ratio (at origination) of 49.9%. We retain all first-loss securities from our Sequoia Select securitizations, and on average we currently have exposure to the first 6% of credit losses resulting from loans underlying these securities.
Ñ Sequoia Choice Securities — Through the third quarter of 2021, we had securitized $3.7 billion of Sequoia Choice loans since 2017. As of September 30, 2021, our securitized Choice portfolio includes fully documented loans to prime borrowers with an average FICO score (at loan origination) of 739, maximum loan-to-value (at origination) of 90%, and a maximum debt-to-income ratio (at origination) of 49.9%. We retain all of the first-loss securities issued as part of our Sequoia Choice program, and on average we currently have exposure to the first 30% of credit losses resulting from loans underlying these securities.
Ñ Re-Performing Loan Securities — As of September 30, 2021, we held $517 million of securities collateralized by re-performing loans, and on average we currently have exposure to the first 24% of the credit losses resulting from loans underlying the securities. The collateral underlying these securities are seasoned re-performing, and to a lesser extent non-performing, loans. In most cases, these loans experienced a credit event leading up to the securitization and were modified in order to keep the borrower in their home and current on their payments under recast loan terms.
| | |
| Detailed endnotes are included at the end of this Redwood Review. |
|
| THE REDWOOD REVIEW I 3RD QUARTER 2021 |
19 |
| | |
|
| Q U A R T E R L Y P O S I T I O N S |
| | | | | | | | | | | | | | | | | | | | |
|
Business Purpose and Multifamily Investments Credit Characteristics |
September 30, 2021 | |
($ in millions, except where noted) | |
| SFR Securities | | BPL Bridge Loans(1) | | Multifamily
B-Pieces | |
| | | | | | |
| Market value | $ | 288 | | | $ | 832 | | | $ | 74 | | |
Average current DSCR (2) | 1.4x | | N/A | | 1.5x | |
Average LTV (at origination) (3) | 68 | % | | 71 | % | | 71 | % | |
| Average loan size (in thousands) | $ | 2,820 | | | $ | 2,458 | | | $ | 27,704 | | |
| Gross weighted average coupon | 5.4 | % | | 7.4 | % | | 3.4 | % | |
90+ days delinquency (as a % of UPB) (4) | 1.7 | % | | 3.7 | % | | — | % | |
Investment thickness (5) | 10 | % | | N/A | | 10 | % | |
| | | | | | |
Ñ SFR Securities — Through the third quarter of 2021, CoreVest had securitized $4.5 billion of SFR loans across 17 CAFL securitizations since 2015. We own and retain the first-loss securities from CAFL securitizations, and on average have exposure to the first 10% of credit losses resulting from loans underlying the securities.
Ñ BPL Bridge Loans — Through the third quarter of 2021, CoreVest had securitized $0.3 billion of Bridge loans in one CAFL securitization. Our business purpose bridge loans and investments are collateralized by residential and multifamily properties, many of which are being rehabilitated or constructed for either re-sale or rental purposes. The average loan term at funding ranges between 12 to 24 months.
Ñ Multifamily B-Pieces — As of September 30, 2021, we owned $74 million of multifamily b-piece securities, which represent first-loss risk on $1.0 billion of underlying multifamily loan collateral across three separate Freddie Mac sponsored securitizations. On average, we have exposure to the first 10% of credit losses resulting from loans underlying these securities.
| | |
| Detailed endnotes are included at the end of this Redwood Review. |
|
| THE REDWOOD REVIEW I 3RD QUARTER 2021 |
20 |

| | | | | | | | | | | | | | | | | | | | | | | | | | | | | | | | | | | | | | | | | |
| Table 1: GAAP Earnings (in thousands, except per share data) | |
| | | | | | | | | | | | | |
| 2021
Q3 | | 2021
Q2 | | 2021
Q1 | | 2020
Q4 | | 2020
Q3 | | | Nine
Months
2021 | |
| Net interest income | | | | | | | | | | | | | |
| From investments | $ | 41,945 | | | $ | 32,555 | | | $ | 30,564 | | | $ | 29,156 | | | $ | 29,651 | | | | $ | 105,064 | | |
| From mortgage banking activities | 9,129 | | | 7,133 | | | 4,088 | | | 3,502 | | | 729 | | | | 20,350 | | |
| Corporate debt expense | (9,106) | | | (9,058) | | | (8,899) | | | (9,008) | | | (8,809) | | | | (27,063) | | |
| Net interest income | 41,968 | | | 30,630 | | | 25,753 | | | 23,650 | | | 21,571 | | | | 98,351 | | |
| Non-interest income | | | | | | | | | | | | | |
| Residential mortgage banking activities, net | 32,946 | | | 21,265 | | | 61,435 | | | 22,943 | | | 11,864 | | | | 115,646 | | |
| Business purpose mortgage banking activities, net | 30,217 | | | 33,154 | | | 21,172 | | | 31,018 | | | 47,531 | | | | 84,543 | | |
| Investment fair value changes, net | 26,077 | | | 49,480 | | | 45,087 | | | 23,119 | | | 107,047 | | | | 120,644 | | |
| Realized gains, net | 6,703 | | | 8,384 | | | 2,716 | | | 5 | | | 602 | | | | 17,803 | | |
| Other income (loss), net | 2,388 | | | 2,126 | | | 3,843 | | | 209 | | | (114) | | | | 8,357 | | |
| Total non-interest income, net | 98,331 | | | 114,409 | | | 134,253 | | | 77,294 | | | 166,930 | | | | 346,993 | | |
| Compensation expense | (36,044) | | | (29,459) | | | (34,643) | | | (19,572) | | | (18,624) | | | | (100,146) | | |
Acquisition-related equity compensation expense (1) | (1,189) | | | (1,212) | | | (1,212) | | | (1,212) | | | (1,212) | | | | (3,613) | | |
| Other general and administrative expense | (10,459) | | | (9,923) | | | (7,696) | | | (9,588) | | | (7,794) | | | | (28,078) | | |
| Total general and administrative expenses | (47,692) | | | (40,594) | | | (43,551) | | | (30,372) | | | (27,630) | | | | (131,837) | | |
| Loan acquisition costs (including commissions) | (4,621) | | | (3,748) | | | (3,559) | | | (3,307) | | | (2,158) | | | | (11,928) | | |
| Other expenses | (4,023) | | | (3,985) | | | (4,096) | | | (4,499) | | | (7,788) | | | | (12,104) | | |
| Benefit from (provision for) income taxes | 4,323 | | | (6,687) | | | (11,543) | | | (8,471) | | | (9,113) | | | | (13,907) | | |
| Net income | $ | 88,286 | | | $ | 90,025 | | | $ | 97,257 | | | $ | 54,295 | | | $ | 141,812 | | | | $ | 275,568 | | |
Diluted average shares (2) | 141,855 | | 141,761 | | 141,039 | | 140,641 | | 141,970 | | | 141,575 | |
| Diluted earnings per common share | $ | 0.65 | | | $ | 0.66 | | | $ | 0.72 | | | $ | 0.42 | | | $ | 1.02 | | | | $ | 2.03 | | |
(1)Acquisition-related equity compensation expense relates to shares of restricted stock that were issued to members of CoreVest management as a component of the consideration paid to them for our purchase of their interests in CoreVest.
(2)Diluted average shares includes shares from the assumed conversion of our convertible and/or exchangeable debt in certain periods, in accordance with GAAP diluted EPS provisions. See Table 3 that follows for details of this calculation for the current and prior quarter and our respective Quarterly Reports on Form 10-Q and Annual Report on Form 10-K.
| | | | | | | | |
| THE REDWOOD REVIEW I 3RD QUARTER 2021 | | Table 1: GAAP Earnings 22 |
| | | | | | | | | | | | | | | | | | | | | | | | | | | | | | | | | | | | | | | | | | | | | | | | | | | | | | | | | | | | | | |
| Table 2: Segment Results ($ in thousands) | | |
| | | | | | | | | | | | | | | | | | | | |
| Three Months Ended September 30, 2021 | | |
| Residential Mortgage Banking | | Residential Investments | | Total Residential Lending | | Business Purpose Mortgage Banking | | Business Purpose Investments | | Total Business Purpose Lending | | Third-Party Investments | | Corporate / Other | | Total | | |
| | | | | | | | | | | | | | | | | | | |
| Net interest income (expense) | $ | 7,175 | | | $ | 11,650 | | | $ | 18,825 | | | $ | 1,954 | | | $ | 18,447 | | | $ | 20,401 | | | $ | 11,848 | | | $ | (9,106) | | | $ | 41,968 | | | |
| | | | | | | | | | | | | | | | | | | |
| Non-interest income | | | | | | | | | | | | | | | | | | | |
| Mortgage banking activities, net | 32,946 | | | — | | | 32,946 | | | 30,217 | | | — | | | 30,217 | | | — | | | — | | | 63,163 | | | |
| Investment fair value changes, net | — | | | 2,285 | | | 2,285 | | | — | | | 3,470 | | | 3,470 | | | 20,569 | | | (247) | | | 26,077 | | | |
| Other income, net | — | | | 874 | | | 874 | | | 216 | | | 968 | | | 1,184 | | | — | | | 330 | | | 2,388 | | | |
| Realized gains, net | — | | | 6,389 | | | 6,389 | | | — | | | 314 | | | 314 | | | — | | | — | | | 6,703 | | | |
| Total non-interest income (loss), net | 32,946 | | | 9,548 | | | 42,494 | | | 30,433 | | | 4,752 | | | 35,185 | | | 20,569 | | | 83 | | | 98,331 | | | |
| | | | | | | | | | | | | | | | | | | |
| General and administrative expenses | (7,891) | | | (1,098) | | | (8,989) | | | (12,017) | | | (1,970) | | | (13,987) | | | (1,415) | | | (23,301) | | | (47,692) | | | |
| Loan acquisition costs | (2,395) | | | — | | | (2,395) | | | (2,175) | | | — | | | (2,175) | | | (51) | | | — | | | (4,621) | | | |
| Other expenses, net | — | | | — | | | — | | | (3,873) | | | — | | | (3,873) | | | (150) | | | — | | | (4,023) | | | |
| | | | | | | | | | | | | | | | | | | |
| Benefit from (provision for) income taxes | (10,429) | | | (710) | | | (11,139) | | | (3,485) | | | — | | | (3,485) | | | (335) | | | 19,282 | | | 4,323 | | | |
| | | | | | | | | | | | | | | | | | | |
| Net income (loss) | $ | 19,406 | | | $ | 19,390 | | | $ | 38,796 | | | $ | 10,837 | | | $ | 21,229 | | | $ | 32,066 | | | $ | 30,466 | | | $ | (13,042) | | | $ | 88,286 | | | |
| | | | | | | | | | | | | | | | | | | |
| Three Months Ended June 30, 2021 | | |
| Residential Mortgage Banking | | Residential Investments | | Total Residential Lending | | Business Purpose Mortgage Banking | | Business Purpose Investments | | Total Business Purpose Lending | | Third-Party Investments | | Corporate / Other | | Total | | |
| | | | | | | | | | | | | | | | | | | |
| Net interest income (expense) | $ | 5,628 | | | $ | 6,349 | | | $ | 11,977 | | | $ | 1,505 | | | $ | 14,568 | | | $ | 16,073 | | | $ | 11,638 | | | $ | (9,058) | | | $ | 30,630 | | | |
| | | | | | | | | | | | | | | | | | | |
| Non-interest income | | | | | | | | | | | | | | | | | | | |
| Mortgage banking activities, net | 21,265 | | | — | | | 21,265 | | | 33,154 | | | — | | | 33,154 | | | — | | | — | | | 54,419 | | | |
| Investment fair value changes, net | — | | | 3,927 | | | 3,927 | | | — | | | 3,782 | | | 3,782 | | | 42,018 | | | (247) | | | 49,480 | | | |
| Other income, net | — | | | 839 | | | 839 | | | 156 | | | 861 | | | 1,017 | | | 5 | | | 265 | | | 2,126 | | | |
| Realized gains, net | — | | | 6,687 | | | 6,687 | | | — | | | 390 | | | 390 | | | 1,307 | | | — | | | 8,384 | | | |
| Total non-interest income (loss), net | 21,265 | | | 11,453 | | | 32,718 | | | 33,310 | | | 5,033 | | | 38,343 | | | 43,330 | | | 18 | | | 114,409 | | | |
| | | | | | | | | | | | | | | | | | | |
| General and administrative expenses | (6,898) | | | (895) | | | (7,793) | | | (12,356) | | | (1,332) | | | (13,688) | | | (930) | | | (18,183) | | | (40,594) | | | |
| Loan acquisition costs | (1,887) | | | — | | | (1,887) | | | (1,861) | | | — | | | (1,861) | | | — | | | — | | | (3,748) | | | |
| Other expenses | — | | | — | | | — | | | (3,873) | | | — | | | (3,873) | | | (112) | | | — | | | (3,985) | | | |
| | | | | | | | | | | | | | | | | | | |
| Benefit from (provision for) income taxes | (3,725) | | | (446) | | | (4,171) | | | (2,182) | | | — | | | (2,182) | | | (334) | | | — | | | (6,687) | | | |
| | | | | | | | | | | | | | | | | | | |
| Net income (loss) | $ | 14,383 | | | $ | 16,461 | | | $ | 30,844 | | | $ | 14,543 | | | $ | 18,269 | | | $ | 32,812 | | | $ | 53,592 | | | $ | (27,223) | | | $ | 90,025 | | | |
| | | | | | | | |
| THE REDWOOD REVIEW I 3RD QUARTER 2021 | | Table 2: Segment Results 23 |
| | | | | | | | | | | | | | | | | | | | | | | | | | | | | | | | | | | | | | | | | | | |
| Table 3: GAAP Basic and Diluted Earnings per Common Share (in thousands, except per share data) | |
| | | | | | | | | | | | | | | |
| 2021
Q3 | | 2021
Q2 | | 2021
Q1 | | 2020
Q4 | | 2020
Q3 | | | Nine
Months
2021 | | | |
| | | | | | | | | | | | | | | |
| | | | | | | | | | | | | | | |
| | | | | | | | | | | | | | | |
| | | | | | | | | | | | | | | |
| | | | | | | | | | | | | | | |
| | | | | | | | | | | | | | | |
| | | | | | | | | | | | | | | |
| | | | | | | | | | | | | | | |
| GAAP Earnings per Common Share ("EPS"): | | | | | | | | | | | | | | | |
| Net income attributable to Redwood | $ | 88,286 | | | $ | 90,025 | | | $ | 97,257 | | | $ | 54,295 | | | $ | 141,812 | | | | $ | 275,568 | | | | |
| Adjust for dividends and undistributed earnings allocated to participating securities | (2,984) | | | (3,149) | | | (3,294) | | | (1,705) | | | (4,067) | | | | (8,979) | | | | |
| Net income allocated to common shareholders for GAAP basic EPS | 85,302 | | | 86,876 | | | 93,963 | | | 52,590 | | | 137,745 | | | | 266,589 | | | | |
| Incremental adjustment to dividends and undistributed earnings allocated to participating securities | 237 | | | 280 | | | 343 | | | 58 | | | 555 | | | | 828 | | | | |
Adjust for interest expense on convertible notes for the period, net of tax (1) | 6,870 | | | 6,990 | | | 7,007 | | | 6,999 | | | 6,990 | | | | 20,585 | | | | |
| Net income allocated to common shareholders for GAAP diluted EPS | $ | 92,409 | | | $ | 94,146 | | | $ | 101,313 | | | $ | 59,647 | | | $ | 145,290 | | | | $ | 288,002 | | | | |
| | | | | | | | | | | | | | | |
| Basic weighted average common shares outstanding | 112,996 | | 112,921 | | 112,277 | | 112,074 | | 113,403 | | | 112,755 | | | |
| Net effect of dilutive equity awards | 293 | | | 273 | | | 196 | | | — | | | — | | | | 254 | | | | |
Net effect of assumed convertible notes conversion to common shares (1) | 28,567 | | | 28,567 | | | 28,567 | | | 28,567 | | | 28,567 | | | | 28,567 | | | | |
| Diluted weighted average common shares outstanding | 141,855 | | 141,761 | | 141,040 | | 140,641 | | 141,970 | | | 141,575 | | | |
| | | | | | | | | | | | | | | |
| GAAP Basic Earnings per Common Share | $ | 0.75 | | | $ | 0.77 | | | $ | 0.84 | | | $ | 0.47 | | | $ | 1.21 | | | | $ | 2.36 | | | | |
| GAAP Diluted Earnings per Common Share | $ | 0.65 | | | $ | 0.66 | | | $ | 0.72 | | | $ | 0.42 | | | $ | 1.02 | | | | $ | 2.03 | | | | |
| | | | | | | | | | | | | | | |
| | | | | | | | | | | | | | | |
| | | | | | | | | | | | | | | |
| | | | | | | | | | | | | | | |
| | | | | | | | | | | | | | | |
| | | | | | | | | | | | | | | |
| | | | | | | | | | | | | | | |
| | | | | | | | | | | | | | | |
| | | | | | | | | | | | | | | |
| | | | | | | | | | | | | | | |
| | | | | | | | | | | | | | | |
| | | | | | | | | | | | | | | |
| | | | | | | | | | | | | | | |
| | | | | | | | | | | | | | | |
| | | | | | | | | | | | | | | |
| | | | | | | | | | | | | | | |
| | | | | | | | | | | | | | | |
| | | | | | | | | | | | | | | |
(1)Certain convertible notes were determined to be dilutive in the periods presented and were included in the calculation of diluted EPS under the "if-converted" method. Under this method, the periodic interest expense (net of applicable taxes) for dilutive notes is added back to the numerator and the number of shares that the notes are entitled to (if converted, regardless of whether they are in or out of the money) are included in the denominator.
| | | | | | | | |
| THE REDWOOD REVIEW I 3RD QUARTER 2021 | | Table 3: GAAP Earnings per Basic and Diluted Common Share 24 |
| | | | | | | | | | | | | | | | | | | | | | | | | | | | | | | | | | | | | | | | | |
| Table 4: Financial Ratios and Book Value ($ in thousands, except per share data) | |
| | | | | | | | | | | | | |
| | 2021
Q3 | | 2021
Q2 | | 2021
Q1 | | 2020
Q4 | | 2020
Q3 | | Nine
Months
2021 | |
| Financial performance ratios | | | | | | | | | | | | |
| GAAP net income | $ | 88,286 | | | $ | 90,025 | | | $ | 97,257 | | | $ | 54,295 | | | $ | 141,812 | | | $ | 275,568 | | |
| Corporate general and administrative expenses | $ | (23,301) | | | $ | (18,183) | | | $ | (17,504) | | | $ | (15,176) | | | $ | (12,998) | | | $ | (58,988) | | |
| Average total assets | $ | 12,590,752 | | | $ | 11,649,799 | | | $ | 10,703,876 | | | $ | 10,362,681 | | | $ | 10,098,372 | | | $ | 11,655,915 | | |
| Average total equity | $ | 1,324,053 | | | $ | 1,255,621 | | | $ | 1,142,855 | | | $ | 1,079,952 | | | $ | 999,381 | | | $ | 1,241,507 | | |
| Corporate general and administrative expenses / average total equity | 7.04 | % | | 5.79 | % | | 6.13 | % | | 5.62 | % | | 5.20 | % | | 6.34 | % | |
| GAAP net income / average equity (GAAP ROE) | 26.67 | % | | 28.68 | % | | 34.04 | % | | 20.11 | % | | 56.76 | % | | 29.60 | % | |
| | | | | | | | | | | | | |
| Leverage ratios and book value per share | | | | | | | | | | | | |
| Short-term recourse debt | $ | 1,546,722 | | | $ | 1,321,629 | | | $ | 1,061,811 | | | $ | 314,234 | | | $ | 253,763 | | | | |
| Long-term recourse debt | 1,404,094 | | | 1,392,322 | | | 1,126,147 | | | 1,074,529 | | | 1,094,950 | | | | |
| Total recourse debt | $ | 2,950,816 | | | $ | 2,713,951 | | | $ | 2,187,958 | | | $ | 1,388,763 | | | $ | 1,348,713 | | | | |
| At consolidated securitization and non-recourse entities | | | | | | | | | | | | |
| ABS issued | 8,183,825 | | | 7,536,995 | | | 6,671,678 | | | 7,100,662 | | | 7,172,398 | | | | |
| Other non-recourse debt | 310,835 | | | 267,179 | | | 518,365 | | | 576,176 | | | 688,656 | | | | |
| Total ABS issued and non-recourse debt | $ | 8,494,660 | | | $ | 7,804,174 | | | $ | 7,190,043 | | | $ | 7,676,838 | | | $ | 7,861,054 | | | | |
Consolidated debt (1) | $ | 11,445,476 | | | $ | 10,518,125 | | | $ | 9,378,001 | | | $ | 9,065,601 | | | $ | 9,209,767 | | | | |
Tangible stockholders' equity (non-GAAP) (2) | $ | 1,330,577 | | | $ | 1,246,022 | | | $ | 1,162,583 | | | $ | 1,054,035 | | | $ | 992,727 | | | | |
| Total stockholders' equity | $ | 1,375,823 | | | $ | 1,295,142 | | | $ | 1,215,575 | | | $ | 1,110,899 | | | $ | 1,053,464 | | | | |
Total capital (3) | $ | 2,027,511 | | | $ | 1,946,177 | | | $ | 1,865,968 | | | $ | 1,760,658 | | | $ | 1,702,599 | | | | |
Recourse leverage ratio (recourse debt at Redwood to tangible stockholders' equity)(4) | 2.2x | | 2.2x | | 1.9x | | 1.3x | | 1.4x | | | |
| Consolidated debt to tangible stockholders' equity | 8.6x | | 8.4x | | 8.1x | | 8.6x | | 9.3x | | | |
| Shares outstanding at period end (in thousands) | 114,662 | | | 113,053 | | | 112,999 | | | 112,090 | | | 111,904 | | | | |
| Book value per share | $ | 12.00 | | | $ | 11.46 | | | $ | 10.76 | | | $ | 9.91 | | | $ | 9.41 | | | | |
| | | | | | | | | | | | | |
(1)Amounts presented in Consolidated debt above do not include deferred issuance costs or debt discounts.
(2)At September 30, 2021, June 30, 2021, March 31, 2021, December 31, 2020, and September 30, 2020, tangible stockholders' equity excluded $45 million, $49 million, $53 million, $57 million, and $61 million, respectively, of intangible assets.
(3)Our total capital of $2.0 billion at September 30, 2021 included $1.4 billion of equity capital and $0.7 billion of unsecured corporate debt.
(4)Excludes ABS issued and non-recourse debt at consolidated entities. See Table 6 for additional detail on our ABS issued and short-term debt at consolidated entities.
| | | | | | | | |
| THE REDWOOD REVIEW I 3RD QUARTER 2021 | | Table 4: Financial Ratios and Book Value 25 |
| | | | | | | | | | | | | | | | | | | | | | | | | | | | | | | | | | | | | | | | | | | | | | | | | | | | | | | | | | | | | | | | | | | | | | | | | | | | | | | | |
Table 5A: Combined Investment Portfolio Detail
($ in thousands) | | Table 5B: Combined Investment Portfolio Rollforward
($ in thousands) |
| | | | | | | | | | | | | | | | | | | | | | | | | | |
| | 9/30/21 | | 6/30/21 | | 3/31/21 | | Asset Rollforward | | Sequoia Securities | | SFR Securities | | RPL Securities | | Multifamily Securities | | Other Third-Party Securities | | Bridge Loans | | Called
Sequoia Loans | | Other Investments | | Total |
| | | | | | | | | | | | | | | | | | | | | | | | | | |
| Investment Portfolio Assets | | | | | | Balance at 3/31/21 | | $ | 383 | | | $ | 261 | | | $ | 497 | | | $ | 77 | | | $ | 83 | | | $ | 646 | | | $ | 19 | | | $ | 178 | | | $ | 2,144 | |
| Sequoia securities | $ | 382 | | | $ | 391 | | | $ | 383 | | | New investments | | 8 | | | 15 | | | 1 | | | — | | | 2 | | | 216 | | | 83 | | | — | | | 325 | |
| SFR securities | 288 | | | 268 | | | 261 | | | Sales/Paydowns | | (13) | | | (12) | | | (26) | | | (5) | | | (3) | | | (118) | | | (6) | | | (14) | | | (197) | |
| RPL securities | 517 | | | 513 | | | 497 | | | MTM | | 13 | | | 4 | | | 41 | | | 1 | | | 4 | | | — | | | 1 | | | (3) | | | 61 | |
| Multifamily securities | 74 | | | 73 | | | 77 | | | Other, net | | — | | | — | | | — | | | — | | | — | | | (3) | | | — | | | — | | | (3) | |
| Other third-party securities | 94 | | | 86 | | | 83 | | | Balance at 6/30/21 | | $ | 391 | | | $ | 268 | | | $ | 513 | | | $ | 73 | | | $ | 86 | | | $ | 741 | | | $ | 97 | | | $ | 161 | | | $ | 2,330 | |
| Bridge loans | 832 | | | 741 | | | 646 | | | New investments | | 2 | | | 17 | | | — | | | 4 | | | 7 | | | 245 | | | 54 | | | — | | | 329 | |
| Called Sequoia loans | 151 | | | 97 | | | 19 | | | Sales/Paydowns | | (13) | | | — | | | (13) | | | (3) | | | (3) | | | (156) | | | (1) | | | (44) | | | (233) | |
Other investments (1) | 120 | | | 161 | | | 178 | | | MTM | | 2 | | | 3 | | | 17 | | | — | | | 4 | | | 4 | | | 1 | | | 3 | | | 34 | |
| Total investments | $ | 2,458 | | | $ | 2,330 | | | $ | 2,144 | | | Other, net | | — | | | — | | | — | | | — | | | — | | | (3) | | | — | | | — | | | (3) | |
| | | | | | | Balance at 9/30/21 | | $ | 382 | | | $ | 288 | | | $ | 517 | | | $ | 74 | | | $ | 94 | | | $ | 831 | | | $ | 151 | | | $ | 120 | | | $ | 2,458 | |
| Debt Secured by Portfolio Assets | | | | | | | | | | | | | | | | | | | | | | | | |
| Sequoia securities | $ | (199) | | | $ | (213) | | | $ | (226) | | | | | | | | | | | | | | | | | | | | | |
| SFR securities | (197) | | | (102) | | | (102) | | | | | | | | | | | | | | | | | | | | | |
| RPL securities | (161) | | | (179) | | | (200) | | | | | | | | | | | | | | | | | | | | | |
| Multifamily securities | (28) | | | (28) | | | (29) | | | | | | | | | | | | | | | | | | | | | |
| Other third-party securities | — | | | — | | | — | | | | | | | | | | | | | | | | | | | | | |
| Bridge loans | (633) | | | (483) | | | (428) | | | | | | | | | | | | | | | | | | | | | |
| Called Sequoia loans | (137) | | | (88) | | | — | | | | | | | | | | | | | | | | | | | | | |
Other investments (1) | — | | | — | | | — | | | | | | | | | | | | | | | | | | | | | |
| Total debt secured by investments | $ | (1,355) | | | $ | (1,093) | | | $ | (985) | | | | | | | | | | | | | | | | | | | | | |
| | | | | | | | | | | | | | | | | | | | | | | | | |
| Net Capital Invested in Portfolio Assets | | | | | | | | | | | | | | | | | | | | | | |
| Sequoia securities | $ | 183 | | | $ | 178 | | | $ | 157 | | | | | | | | | | | | | | | | | | | | | |
| SFR securities | 91 | | | 166 | | | 159 | | | | | | | | | | | | | | | | | | | | | |
| RPL securities | 356 | | | 334 | | | 297 | | | | | | | | | | | | | | | | | | | | | |
| Multifamily securities | 46 | | | 45 | | | 48 | | | | | | | | | | | | | | | | | | | | | |
| Other third-party securities | 94 | | | 86 | | | 83 | | | | | | | | | | | | | | | | | | | | | |
| Bridge loans | 199 | | | 258 | | | 218 | | | | | | | | | | | | | | | | | | | | | |
| Called Sequoia loans | 14 | | | 9 | | | 45 | | | | | | | | | | | | | | | | | | | | | |
Other investments (1) | 120 | | | 161 | | | 133 | | | Notes | | | | | | | | | | | | | | | | | | |
| Total capital invested | $ | 1,103 | | | $ | 1,237 | | | $ | 1,140 | | | (1) Other investments is primarily comprised of servicing receivable investments, Home Equity Investment contracts, excess MSRs and other residential and business purpose related investments.
(2) Total leverage is calculated by dividing the total debt secured by portfolio assets (both secured recourse and secured pre-payable non-recourse debt), by the total capital invested in portfolio assets. |
| | | | | | | |
Total leverage (2) | 1.23 | x | | 0.88 | x | | 0.86 | x | |
| | | | | | | | | | | | | | | | | | | | | | | | | | |
| | | | | | | | |
| THE REDWOOD REVIEW I 3RD QUARTER 2021 | | Table 5: Combined Investment Portfolio 26 |
| | | | | | | | | | | | | | | | | | | | | | | | | | | | | | | | | | | | | | | | | | | | | | | | | | | | | | | | | | | | | | | | | | | | | | | | | | | | | | | | | | |
| Table 6: Consolidated Balance Sheet ($ in thousands) | |
| | | | | | | | | | | | | | | | | | | | | | | | | | | | | | | | | | | | |
| | | | | | September 30, 2021 | | | |
| | | | | | | Consolidated VIEs (1) | | | | | | | | | | |
| | 9/30/2021 | | 6/30/2021 | | At Redwood (1) | | Sequoia | | CAFL | | Freddie Mac SLST | | Freddie Mac
K-Series | | Other VIEs (2) | | Other (3) | | Redwood
Consolidated | | | | | | | | | | | | | | | |
| Residential loans | | $ | 6,216,468 | | | $ | 5,742,600 | | | $ | 1,495,079 | | | $ | 2,479,750 | | | $ | — | | | $ | 1,999,405 | | | $ | — | | | $ | 242,234 | | | $ | — | | | $ | 6,216,468 | | | | | | | | | | | | | | | | |
| Business purpose loans | | 4,693,555 | | | 4,408,889 | | | 791,847 | | | — | | | 3,678,764 | | | — | | | — | | | — | | | 222,944 | | | 4,693,555 | | | | | | | | | | | | | | | | |
| Multifamily loans | | 482,791 | | | 485,157 | | | — | | | — | | | — | | | — | | | 482,791 | | | — | | | — | | | 482,791 | | | | | | | | | | | | | | | | |
| Real estate securities | | 353,286 | | | 354,886 | | | 353,286 | | | — | | | — | | | — | | | — | | | — | | | — | | | 353,286 | | | | | | | | | | | | | | | | |
| Other investments | | 422,366 | | | 308,732 | | | 67,044 | | | — | | | — | | | — | | | | | 355,322 | | | — | | | 422,366 | | | | | | | | | | | | | | | | |
| Cash and cash equivalents | | 556,989 | | | 421,223 | | | 544,012 | | | — | | | — | | | — | | | — | | | 12,977 | | | — | | | 556,989 | | | | | | | | | | | | | | | | |
Other assets (4) | | 347,259 | | | 274,904 | | | 240,185 | | | 7,869 | | | 56,897 | | | 8,026 | | | 1,321 | | | 32,961 | | | — | | | 347,259 | | | | | | | | | | | | | | | | |
| Total assets | | $ | 13,072,714 | | | $ | 11,996,391 | | | $ | 3,491,453 | | | $ | 2,487,619 | | | $ | 3,735,661 | | | $ | 2,007,431 | | | $ | 484,112 | | | $ | 643,494 | | | $ | 222,944 | | | $ | 13,072,714 | | | | | | | | | | | | | | | | |
| Short-term debt | | $ | 1,750,941 | | | $ | 1,484,999 | | | $ | 1,546,209 | | | $ | — | | | $ | — | | | $ | — | | | $ | — | | | $ | 151,910 | | | $ | 52,822 | | | $ | 1,750,941 | | | | | | | | | | | | | | | | |
| Other liabilities | | 262,548 | | | 194,945 | | | 206,522 | | | 5,918 | | | 11,854 | | | 4,279 | | | 1,195 | | | 32,780 | | | — | | | 262,548 | | | | | | | | | | | | | | | | |
| ABS issued | | 8,183,825 | | | 7,536,997 | | | — | | | 2,243,299 | | | 3,393,576 | | | 1,710,664 | | | 451,402 | | | 384,884 | | | — | | | 8,183,825 | | | | | | | | | | | | | | | | |
| Long-term debt, net | | 1,499,577 | | | 1,484,308 | | | 1,393,616 | | | — | | | — | | | — | | | — | | | — | | | 105,961 | | | 1,499,577 | | | | | | | | | | | | | | | | |
| Total liabilities | | 11,696,891 | | | 10,701,249 | | | 3,146,347 | | | 2,249,217 | | | 3,405,430 | | | 1,714,943 | | | 452,597 | | | 569,574 | | | 158,783 | | | 11,696,891 | | | | | | | | | | | | | | | | |
| | | | | | | | | | | | | | | | | | | | | | | | | | | | | | | | | | | |
| Equity | | 1,375,823 | | | 1,295,142 | | | 345,106 | | | 238,402 | | | 330,231 | | | 292,488 | | | 31,515 | | | 73,920 | | | 64,161 | | | 1,375,823 | | | | | | | | | | | | | | | | |
| Total liabilities and equity | | $ | 13,072,714 | | | $ | 11,996,391 | | | $ | 3,491,453 | | | $ | 2,487,619 | | | $ | 3,735,661 | | | $ | 2,007,431 | | | $ | 484,112 | | | $ | 643,494 | | | $ | 222,944 | | | $ | 13,072,714 | | | | | | | | | | | | | | | | |
| | | | | | | | | | | | | | | | | | | | | | | | | | | | | | | | | | | |
(1)The format of this consolidating balance sheet is provided to more clearly delineate between the assets and liabilities belonging to securitization entities (Consolidated VIEs) that we are required to consolidate on our balance sheet in accordance with GAAP, and the assets that are legally ours and the liabilities of ours for which there is recourse to us. Each of these entities is independent of Redwood and of each other and the assets and liabilities of these entities are not owned by and are not legal obligations of ours. Our exposure to these entities is primarily through the financial interests we have retained or acquired in these entities (generally subordinate and interest-only securities), the fair value of which is represented by our equity in each entity, as presented in this table.
(2)Includes our consolidated Legacy Sequoia, Servicing Investment, and Point entities. At September 30, 2021, our equity in the Legacy Sequoia, Servicing Investment, and Point entities was $3 million, $60 million, and $10 million, respectively. At June 30, 2021, our equity in the Legacy Sequoia, Servicing Investment, and Point entities was $4 million, $62 million, and zero, respectively.
(3)Includes business purpose bridge loans and associated non-recourse secured financing.
(4)At both September 30, 2021 and June 30, 2021, restricted cash and other assets at Redwood included a total of $34 million of assets held by third-party custodians and pledged as collateral to the GSEs in connection with credit risk-sharing arrangements. These pledged assets can only be used to settle obligations to the GSEs under these risk-sharing arrangements.
| | | | | | | | |
| THE REDWOOD REVIEW I 3RD QUARTER 2021 | | Table 6: Consolidated Balance Sheet 27 |
| | |
|
| S E G M E N T O V E R V I E W |
Segment Overview
We operate our business in three segments: Residential Lending, Business Purpose Lending and Third-Party Investments. Our two lending segments represent vertically integrated platforms and our third segment captures our investments in third-party assets.
Each segment includes all revenue and direct expense associated with the origination, acquisition and management of its associated financial assets. Our three business segments currently include:
Residential Lending – Comprised of our residential mortgage banking operations and investments created from these activities, including primarily securities retained from our residential loan securitization activities.
Business Purpose Lending – Comprised of our business purpose mortgage banking operations and investments created from these activities, including SFR securities retained from CoreVest-sponsored securitizations and investments in residential and small-balance multifamily bridge loans.
Third-Party Investments – Comprised of other investments not sourced through our residential or business purpose lending segments, including: re-performing loan securities, third-party RMBS (including CRT securities and legacy securities), multifamily securities and loans we have acquired, and other housing-related investments.
| | |
| Detailed endnotes are included at the end of this Redwood Review. |
|
| THE REDWOOD REVIEW I 3RD QUARTER 2021 |
29 |
| | |
|
| D I V I D E N D S A N D T A X A B L E I N C O M E |
Dividends and Taxable Income
Summary
As a REIT, Redwood is required to distribute to shareholders at least 90% of its annual REIT taxable income, excluding net capital gains. To the extent Redwood retains REIT taxable income, including net capital gains, it is taxed at corporate tax rates. Redwood also earns taxable income at its taxable REIT subsidiaries (TRS), which it is not required to distribute.
Dividends Overview
In recent years, our Board of Directors has maintained a practice of paying regular quarterly dividends, including when in excess of the amount required to comply with the provisions of the Internal Revenue Code of 1986, as amended (Internal Revenue Code), applicable to REITs. In September 2021, the Board of Directors declared a regular dividend of $0.21 per share for the third quarter of 2021, which was paid on September 30, 2021 to shareholders of record on September 23, 2021.
REIT Taxable Income and Dividend Distribution Requirement
Our estimated REIT taxable income (non-GAAP) was $16 million, or $0.14 per share, for the third quarter of 2021 and $12 million, or $0.11 per share, for the second quarter of 2021. Realized net capital gains are not included in REIT taxable income as they are offset by a capital loss carryforward of $328 million which was generated in 2020. Any unused portion of the capital loss carryforward will expire at the end of 2025. Under normal circumstances, our minimum REIT dividend requirement would be 90% of our annual REIT taxable income. However, we carried a $37 million federal net operating loss carry forward (NOL) into 2021 at the REIT that affords us the option of retaining REIT taxable income up to the NOL amount, tax free, rather than distributing it as dividends. Federal income tax rules require the dividends paid deduction to be applied to reduce REIT taxable income before the applicability of NOLs is considered; therefore, REIT taxable income must exceed our dividend distribution for us to utilize a portion of our NOL and any remaining NOL amount will carry forward into future years.
Income Tax Characterization of Dividend for Shareholders
We currently expect all or nearly all of our 2021 dividend distributions to be taxable as ordinary income for federal income tax purposes. Any remaining amount is currently expected to be characterized as a return of capital, which in general is non-taxable (provided it does not exceed a shareholder's tax basis in Redwood shares) and reduces a shareholder's basis in Redwood shares (but not below zero). To the extent such distributions exceed a shareholder's basis in Redwood shares, such excess amount would be taxable as capital gain. Under the federal income tax rules applicable to REITs, none of Redwood’s 2021 dividend distributions are expected to be characterized as long-term capital gain dividends; however, to the extent we distribute a dividend from our TRS to our REIT, we currently expect that a portion of the ordinary dividend income received by a shareholder would be qualified dividend income.
| | |
| See Appendix for details on non-GAAP measures. Detailed endnotes are included at the end of this Redwood Review. |
|
| THE REDWOOD REVIEW I 3RD QUARTER 2021 |
30 |
| | |
|
| D I V I D E N D S A N D T A X A B L E I N C O M E |
Individual taxpayers may generally deduct 20% of their ordinary REIT dividends from taxable income. This generally results in a maximum federal effective tax rate of 29.6% on an individual taxpayer's ordinary REIT dividends, compared to the highest marginal rate of 37%. This deduction does not apply to REIT dividends classified as qualified dividend income or long-term capital gain dividends, as those dividends are taxed at a maximum rate of 20% for individuals.
Taxable Income (Non-GAAP)
Below we present details of our estimated taxable income for the nine months ended September 30, 2021 and our taxable income for the year ended December 31, 2020.
| | | | | | | | | | | | | | | | | | | | | | | |
| | |
Taxable Income (Non-GAAP) (1) |
| (In millions, except for per share data) |
| | | | | | | | | | | |
| | Estimated Nine
Months 2021 | | Twelve Months 2020 (2) | | | |
| | | | | | | | | | |
| REIT taxable income (loss) | $ | 39 | | | $ | (9) | | | | | | | | |
| Taxable income at taxable subsidiaries | 120 | | | 67 | | | | | | | | |
| Taxable income | $ | 159 | | | $ | 59 | | | | | | | | |
| | | | | | | | | | |
Shares used for taxable EPS calculation(3) | 115 | | | 112 | | | | | | | | |
| REIT taxable income (loss) per share | $ | 0.34 | | | $ | (0.06) | | | | | | | | |
| Taxable income per share at taxable subsidiaries | $ | 1.06 | | | $ | 0.60 | | | | | | | | |
Taxable income per share(3) | $ | 1.40 | | | $ | 0.54 | | | | | | | | |
| | | | | | | | | | |
| | |
| See Appendix for details on non-GAAP measures. Detailed endnotes are included at the end of this Redwood Review. |
|
| THE REDWOOD REVIEW I 3RD QUARTER 2021 |
31 |
| | |
|
| N O N - G A A P M E A S U R E M E N T S |
Non-GAAP Measurements
Information about our non-GAAP financial measures is provided in this Appendix, which supplements the descriptions and information about these non-GAAP financial measures that is set forth in previous sections of this Redwood Review.
After-Tax Net Operating Contribution and After-Tax Operating Return on Capital
What is After-Tax Net Operating Contribution and After-Tax Operating Return on Capital for our Mortgage Banking Operations?
After-Tax Net Operating Contribution and After-Tax Operating Return on Capital are non-GAAP measures derived from GAAP Net Contribution and Return on Capital, respectively, for our mortgage banking operations.
After-Tax Net Operating Contribution presents a measure of the profitability of these business operations, exclusive of non-cash amortization for amounts related to historical business acquisitions (adjusted for tax effects).
After-Tax Operating Return on Capital presents an alternative measure of profitability relative to the amount of capital utilized in the operations of the business during a period, and is calculated by dividing annualized non-GAAP After-Tax Net Operating Contribution by the average capital utilized by the business during the period.
Why does management believe that After-Tax Net Operating Contribution and After-Tax Operating Return on Capital provide useful information to investors in Redwood? How does management use these metrics to analyze Redwood’s performance?
Management utilizes these measures internally as an alternative way of analyzing the performance of Redwood’s mortgage banking operations, as management believes it provides useful comparative results of profitability, exclusive of non-cash amortization for amounts related to historical business acquisitions.
What factors should be considered when comparing non-GAAP After-Tax Net Operating Contribution and After-Tax Operating Return on Capital to GAAP Net Contribution and Return on Capital?
We caution that After-Tax Net Operating Contribution and After-Tax Operating Return on Capital for our mortgage banking operations should not be utilized in isolation, nor should they be considered as alternatives to GAAP Net Contribution, GAAP Return on Capital or other measurements of results of operations computed in accordance with GAAP.
| | |
|
|
| THE REDWOOD REVIEW I 3RD QUARTER 2021 |
32 |
| | |
|
| N O N - G A A P M E A S U R E M E N T S |
Adjusted Net Contribution and Adjusted Return on Capital
What is Adjusted Net Contribution and Adjusted Return on Capital for our Investment Portfolio?
Adjusted Net Contribution and Adjusted Return on Capital are non-GAAP measures derived from GAAP Net Contribution and Return on Capital, respectively, for our investment portfolio.
Adjusted Net Contribution presents a measure of the profitability of the investment portfolio assets of each business segment, exclusive of realized gains and investment fair value changes (each adjusted for tax effects).
Adjusted Return on Capital presents an alternative measure of profitability relative to the amount of capital utilized within our investment portfolio during a period, and is calculated by dividing annualized non-GAAP Adjusted Net Contribution by the average capital utilized by our investment portfolio during the period.
Why does management believe that Adjusted Net Contribution and Adjusted Return on Capital provide useful information to investors in Redwood? How does management use these metrics to analyze Redwood’s performance?
Management utilizes these measures internally as an alternative way of analyzing the performance of Redwood’s portfolio investments, as management believes it provides useful comparative results, by excluding amounts that may experience variability period-to-period and may not be reflective of the expected recurring earnings over the life of those investments.
What factors should be considered when comparing non-GAAP Adjusted Net Contribution and Adjusted Return on Capital to GAAP Net Contribution and Return on Capital?
We caution that Adjusted Net Contribution and Adjusted Return on Capital for our investment portfolio should not be utilized in isolation, nor should they be considered as alternatives to GAAP Net Contribution, GAAP Return on Capital or other measurements of results of operations computed in accordance with GAAP.
| | |
|
|
| THE REDWOOD REVIEW I 3RD QUARTER 2021 |
33 |
| | |
|
| N O N - G A A P M E A S U R E M E N T S |
Taxable Income
What is Taxable Income, REIT Taxable Income and Taxable Income at Taxable Subsidiaries?
Taxable Income (comprised of REIT taxable income and taxable income at taxable subsidiaries) is a non-GAAP measure, which is the amount of income earned by Redwood on a consolidated basis as calculated under the Internal Revenue Code. REIT taxable income represents the component of Taxable Income earned at Redwood Trust, Inc. on a stand-alone basis, along with income earned at its qualified REIT subsidiaries. Taxable Income at Taxable Subsidiaries, represents the component of Taxable Income earned at taxable subsidiaries owned by Redwood Trust, Inc.
Below we reconcile Taxable Income (non-GAAP) to GAAP net income (loss) for the nine months ended September 30, 2021 and the year ended December 31, 2020.
| | | | | | | | | | | | | | | | | | | | | | | |
| | |
| Differences Between GAAP Net Income (Loss) and |
| Taxable Income (Non-GAAP) |
| (In millions, except for per share data) |
| | | | | | | | | | | |
| | Estimated Nine
Months 2021 | | Twelve
Months 2020 | | | |
| | | | | | | | | | |
| REIT Taxable Income (loss) | $ | 39 | | | $ | (9) | | | | | | | | |
| Taxable income at taxable subsidiaries | 120 | | 67 | | | | | | | |
| Taxable Income | $ | 159 | | | $ | 59 | | | | | | | | |
| Differences in taxable income calculations: | | | | | | | | | | |
| Net interest income | 20 | | | 25 | | | | | | | | |
| Realized credit losses | 2 | | | 2 | | | | | | | | |
| Mortgage banking activities, net | 13 | | | (68) | | | | | | | | |
| Investment fair value changes, net | 122 | | | (493) | | | | | | | | |
| Other income | (1) | | | (17) | | | | | | | | |
| Realized gains, net | 18 | | | 7 | | | | | | | | |
| Operating expenses | (38) | | | (6) | | | | | | | | |
| Other expenses | (5) | | | (96) | | | | | | | | |
| Benefit from (provision for) income taxes | (14) | | | 5 | | | | | | | | |
| GAAP net income (loss) | 276 | | | (582) | | | | | | | | |
| | | | | | | | | | |
Shares used for taxable EPS calculation (1) | 115 | | 112 | | | | | | | |
| | | | | | | | | | | |
| REIT Taxable income (loss) per share | $ | 0.34 | | | $ | (0.06) | | | | | | | | |
| Taxable income per share at taxable subsidiaries | $ | 1.06 | | | $ | 0.60 | | | | | | | | |
| Total taxable income (loss) per common share (non-GAAP) | $ | 1.40 | | | $ | 0.54 | | | | | | | | |
| | | | | | | | | | | |
| Basic earnings (loss) per common share (GAAP) | $ | 2.36 | | | $ | (5.12) | | | | | | | | |
| | | | | | | | | | |
| | |
|
|
| THE REDWOOD REVIEW I 3RD QUARTER 2021 |
34 |
| | |
|
| N O N - G A A P M E A S U R E M E N T S |
Why does management believe that Taxable Income, REIT Taxable Income and Taxable Income at Taxable Subsidiaries provide useful information to investors in Redwood? How does management use these metrics to analyze Redwood’s performance?
Management uses Taxable Income primarily to determine the amount of taxes that are owed by Redwood and uses REIT Taxable Income to ensure compliance with various REIT requirements, including minimum required amounts of income that it must distribute to shareholders in order to maintain its REIT status. This information is also useful to investors as it helps to determine the taxability of Redwood's dividends.
What factors should be considered when comparing non-GAAP Taxable Income (inclusive of REIT Taxable income and Taxable Income at Taxable Subsidiaries) to GAAP Net Income?
We caution that Taxable Income (inclusive of REIT Taxable Income and Taxable Income at Taxable Subsidiaries) should not be utilized in isolation, nor should it be considered as an alternative to GAAP Net Income or other measurements of results of operations computed in accordance with GAAP.
| | |
|
|
| THE REDWOOD REVIEW I 3RD QUARTER 2021 |
35 |
| | |
|
| F O R W A R D - L O O K I N G S T A T E M E N T S |
Forward-Looking Statements
As noted above under the heading “Forward-Looking Statements,” this Redwood Review contains forward-looking statements within the meaning of the safe harbor provisions of the Private Securities Litigation Reform Act of 1995. Forward-looking statements involve numerous risks and uncertainties. Our actual results may differ from our expectations, estimates, and projections and, consequently, you should not rely on these forward-looking statements as predictions of future events. Forward-looking statements are not historical in nature and can be identified by words such as “anticipate,” “estimate,” “will,” “should,” “expect,” “believe,” “intend,” “seek,” “plan,” and similar expressions or their negative forms, or by references to strategy, plans, goals, or intentions. These forward-looking statements are subject to risks and uncertainties, including, among other things, those described in our Annual Report on Form 10-K under the caption “Risk Factors”. Other risks, uncertainties, and factors that could cause actual results to differ materially from those projected are described below and may be described from time to time in reports we file with the Securities and Exchange Commission, including reports on Forms 10-K, 10-Q, and 8-K. We undertake no obligation to update or revise forward-looking statements, whether as a result of new information, future events, or otherwise.
Statements regarding the following subjects, among others, are forward-looking by their nature: (i) statements we make regarding Redwood's business strategy and strategic focus, including statements relating to our overall market position, strategy and long-term prospects (including trends driving the flow of capital in the housing finance market, our strategic initiatives designed to capitalize on those trends, our ability to attract capital to finance those initiatives, our approach to raising capital, our ability to pay dividends in the future, and the prospects for federal housing finance reform); (ii) statements related to our financial outlook and expectations for 2021 and future years; (iii) statements related to our opportunities to reach transformative scale, including by continuing to creatively expand distribution channels for our loans products; (iv) statements related to our investment portfolio, including that there remains potential upside of $3.04 per share in our portfolio through a combination of accretable market discount and call rights that we control, and that we reinitiated our flow purchase arrangement with Point, providing us with continuing HEI acquisition and securitization opportunities; (v) statements related to our residential and business purpose lending platforms, including statements regarding the durability of residential loan acquisition volumes we could expect in a rising interest rate environment, and that we expect CoreVest to continue issuing bridge loan securitizations in conjunction with our traditional SFR loan securitizations; (vi) statements relating to our estimate of our available capital (including that we estimate our available capital at September 30, 2021 was approximately $350 million); (vii) statements relating to acquiring residential mortgage loans in the future that we have identified for purchase or plan to purchase, including the amount of such loans that we identified for purchase during the third quarter of 2021 and at September 30, 2021, and expected fallout and the corresponding volume of residential mortgage loans expected to be available for purchase; (viii) statements we make regarding future dividends, including with respect to our regular quarterly dividends in 2021; and
| | |
| Detailed endnotes are included at the end of this Redwood Review. |
|
| THE REDWOOD REVIEW I 3RD QUARTER 2021 |
36 |
| | |
|
| F O R W A R D - L O O K I N G S T A T E M E N T S |
(ix) statements regarding our expectations and estimates relating to the characterization for income tax purposes of our dividend distributions, our expectations and estimates relating to tax accounting, tax liabilities and tax savings, and GAAP tax provisions, and our estimates of REIT taxable income and TRS taxable income.
Important factors, among others, that may affect our actual results include:
•the impact of the COVID-19 pandemic;
•general economic trends and the performance of the housing, real estate, mortgage finance, and broader financial markets;
•federal and state legislative and regulatory developments and the actions of governmental authorities and entities;
•changing benchmark interest rates, and the Federal Reserve’s actions and statements regarding monetary policy;
•our ability to compete successfully;
•our ability to adapt our business model and strategies to changing circumstances;
•strategic business and capital deployment decisions we make;
•our use of financial leverage;
•our exposure to a breach of our cybersecurity or data security;
•our exposure to credit risk and the timing of credit losses within our portfolio;
•the concentration of the credit risks we are exposed to, including due to the structure of assets we hold, the geographical concentration of real estate underlying assets we own, and our exposure to environmental and climate-related risks;
•the efficacy and expense of our efforts to manage or hedge credit risk, interest rate risk, and other financial and operational risks;
•changes in credit ratings on assets we own and changes in the rating agencies’ credit rating methodologies;
•changes in mortgage prepayment rates;
•changes in interest rates;
•our ability to redeploy our available capital into new investments;
•interest rate volatility, changes in credit spreads, and changes in liquidity in the market for real estate securities and loans;
•our ability to finance the acquisition of real estate-related assets with short-term debt;
•changes in the values of assets we own;
•the ability of counterparties to satisfy their obligations to us;
•our exposure to the discontinuation of LIBOR;
•our exposure to liquidity risk, risks associated with the use of leverage, and market risks;
•changes in the demand from investors for residential and business purpose mortgages and investments, and our ability to distribute residential and business purpose mortgages through our whole-loan distribution channel;
•our involvement in securitization transactions, the profitability of those transactions, and the risks we are exposed to in engaging in securitization transactions;
| | |
| Detailed endnotes are included at the end of this Redwood Review. |
|
| THE REDWOOD REVIEW I 3RD QUARTER 2021 |
37 |
| | |
|
| F O R W A R D - L O O K I N G S T A T E M E N T S |
•exposure to claims and litigation, including litigation arising from our involvement in loan origination and securitization transactions;
•whether we have sufficient liquid assets to meet short-term needs;
•our ability to successfully retain or attract key personnel;
•changes in our investment, financing, and hedging strategies and new risks we may be exposed to if we expand our business activities;
•our exposure to a disruption of our technology infrastructure and systems;
•the impact on our reputation that could result from our actions or omissions or from those of others;
•our failure to maintain appropriate internal controls over financial reporting and disclosure controls and procedures;
•the termination of our captive insurance subsidiary’s membership in the Federal Home Loan Bank and the implications for our income generating abilities;
•the impact of changes to U.S. federal income tax laws on the U.S. housing market, mortgage finance markets, and our business;
•our failure to comply with applicable laws and regulation, including our ability to obtain or maintain the governmental licenses;
•our ability to maintain our status as a REIT for tax purposes;
•limitations imposed on our business due to our REIT status and our status as exempt from registration under the Investment Company Act of 1940;
•our common stock may experience price declines, volatility, and poor liquidity, and we may reduce our dividends in a variety of circumstances;
•decisions about raising, managing, and distributing capital;
•our exposure to broad market fluctuations; and
•other factors not presently identified.
| | |
| Detailed endnotes are included at the end of this Redwood Review. |
|
| THE REDWOOD REVIEW I 3RD QUARTER 2021 |
38 |
Recourse Debt Note
Redwood's recourse debt excludes $8.5 billion and $7.8 billion of consolidated securitization debt (ABS issued and servicer advance financing) and other debt that is non-recourse to Redwood at September 30, 2021 and June 30, 2021, respectively.
Non-GAAP Tangible Book Value Note
Non-GAAP tangible shareholders' equity (or book value) is a measurement of stockholders’ equity excluding the value of acquisition-related intangible assets associated with historical acquisitions. Management believes tangible shareholders’ equity provides useful information to investors and management because it eliminates the impact of these acquisition-related items that may not be reflective of the underlying performance of Redwood’s ongoing operations, and which may not be reflective of their impact over the longer term. At September 30, 2021 and June 30, 2021, tangible stockholders' equity excluded $45 million and $49 million of intangible assets, respectively.
Page 7 (Third Quarter Financial Overview)
(1)Economic return on book value is based on the periodic change in GAAP book value per common share plus dividends declared per common share during the period.
(2)Recourse leverage ratio is defined as recourse debt (see Recourse Debt Note above) at Redwood divided by tangible stockholders' equity (see Non-GAAP Tangible Book Value Note above).
Page 11 (Analysis of Operating Results)
(1)"Mortgage banking income" presented in this table represents the sum of net interest income earned on loan inventory, income from mortgage banking activities, and other income within each of our mortgage banking operations.
(2)"Acquisition amortization expenses" within this table represent purchase related stock-based consideration amortization expense (a component of General and administrative expenses) and amortization of purchase intangibles (a component of Other expenses), each on a tax-adjusted basis.
(3)Capital utilized during the quarter for business purpose mortgage banking operations includes $100 million of working capital allocation and $47 million platform premium.
(4)After-tax Operating return on capital (non-GAAP) presented in this table represents the quotient of annualized After-tax net operating contribution (non-GAAP), divided by Capital utilized during the period. See the Non-GAAP Measurements section of the Appendix of this Redwood Review for a full description of After-tax Operating return on capital (non-GAAP). GAAP Return on capital (calculated by
dividing annualized Net contribution by Capital Utilized) for the three months ended September 30, 2021 was 27% for our combined mortgage banking operations, 29% for our business purpose mortgage banking operations, and 26% for our residential mortgage banking operations, each on an annualized basis.
Page 12 (Analysis of Operating Results, Ctd.)
(1)Our gross margin represents mortgage banking income earned in the quarter (net interest income on loan inventory plus mortgage banking activities) divided by loan purchase commitments entered into during the quarter.
Page 13 (Analysis of Operating Results, Ctd.)
(1)Amounts in the "Total" column within this table may not agree to amounts on our consolidated income statement, as certain investments in consolidated legacy Sequoia securitizations are not included in our investment portfolio.
(2)Realized gains and investment fair value changes presented in this table to calculate Adjusted net contribution (non-GAAP), are presented on a tax-adjusted basis.
(3)Adjusted return on capital (non-GAAP) represents the quotient of annualized Adjusted net contribution (non-GAAP), divided by Capital utilized during the period. See the Non-GAAP Measurements section of the Appendix of this Redwood Review for a full description of Adjusted return on capital (non-GAAP). GAAP Return on capital (calculated by dividing annualized Net contribution by Capital Utilized) for the three months ended September 30, 2021 was 25% on an annualized basis.
(4)Secured debt includes both recourse debt and non-recourse debt (including for bridge loans and resecuritized RPL securities), secured by our investment assets.
(5)Leverage ratio is calculated by dividing Capital invested by Secured debt balances, as presented within this table.
| | |
|
|
| THE REDWOOD REVIEW I 3RD QUARTER 2021 |
39 |
Page 15 (Capital Allocations)
(1)Sequoia securities, SFR securities and third-party other investments each include assets presented as our economic investment in entities that are consolidated under GAAP rules. Third party other investments is primarily comprised of our $60 million economic investment in certain servicing assets (presented net of $152 million of non-recourse debt), our $10 million economic investment in Point HEIs (presented net of $145 million of non-recourse debt), and other housing related investments. See Table 6 in the Financial Tables section of this Redwood Review for additional information on consolidated VIEs.
(2)Non-recourse debt presented within this table excludes ABS issued from whole loan securitizations consolidated on our balance sheet, including Sequoia, CoreVest, Freddie Mac and Servicing Investment securitization entities.
(3)Capital allocated to mortgage banking operations represents the working capital we have allocated to manage our loan inventory at each of our operating businesses. This amount generally includes our net capital in loans held on balance (net of financing), capital to acquire loans in our pipeline, net capital utilized for hedges, and risk capital.
Page 16 (Capital Allocations, Ctd.)
(1)CoreVest platform premium represents the unamortized balance of intangible assets we recorded in association with the acquisition of CoreVest.
Page 17 (Financing Overview)
(1)Non-marginable debt and marginable debt refers to whether such debt is subject to market value-based margin calls on underlying collateral that is non-delinquent.
(2)Average borrowing cost represents the weighted average contractual cost of recourse debt outstanding at September 30, 2021 and does not include deferred issuance costs or debt discounts.
Page 18 (Financing Overview, Ctd.)
(1)Recourse leverage ratio is defined as recourse debt (see Recourse Debt Note above) at Redwood divided by tangible stockholders' equity (see Non-GAAP Tangible Book Value Note above).
(2)Net economic exposure to Point HEIs is reflective of $17 million of non-controlling interests in the securitization held by third parties.
Page 19 (Credit Overview)
(1)Underlying loan performance information provided in this table is generally reported on a one-month lag. As such, the data reported in this table is from
September 2021 reports, which reflect a loan performance date of August 31, 2021.
(2)Sequoia Select and Sequoia Choice securities presented in this table include subordinate securities and do not include interest only or certificated servicing securities.
(3)HPI updated LTV is calculated based on the current loan balance and an updated property value amount that is formulaically adjusted from value at origination based on the FHFA home price index (HPI).
(4)Delinquency percentages at underlying securitizations are calculated using unpaid principal balance ("UPB"). Aggregate delinquency amounts by security type are weighted using the market value of our investments in each securitization.
(5)"Investment thickness" represents the average size of the subordinate securities we own as investments in securitizations, relative to the average overall size of the securitizations. For example, if our investment thickness (of first-loss securities) with respect to a particular securitization is 10%, we have exposure to the first 10% of credit losses resulting from loans underlying that securitization.
Page 20 (Credit Overview, Ctd.)
(1)Bridge loans, as presented in this table, include $825 million of business purpose bridge loans and $7 million of other related assets.
(2)Average current debt service coverage ratio (or DSCR) with respect to a loan is the ratio by which net operating income of the underlying property exceeds it fixed debt costs.
(3)Average loan to value (or LTV) (at origination) is calculated based on the original loan amount and the property value at the time the loan was originated.
(4)Includes loans over 90 days delinquent and all loans in foreclosure (regardless of delinquency status).
(5)"Investment thickness" represents the average size of the securities we own as investments in securitizations, relative to the average overall size of the securitizations. For example, if our investment thickness (of first-loss securities) with respect to a particular securitization is 10%, we have exposure to the first 10% of credit losses resulting from loans underlying that securitization. Investment thickness is not applicable to our BPL Bridge Loan investments as they are whole loans.
Page 31 (Dividends and Taxable Income)
(1)Taxable income (comprised of REIT taxable income and taxable income at taxable subsidiaries), is a non-GAAP measure representing the amount of income earned by Redwood on a consolidated basis, as calculated under the Internal Revenue Code. See the Non-GAAP Measurements section of the Appendix of this Redwood Review for a full
| | |
|
|
| THE REDWOOD REVIEW I 3RD QUARTER 2021 |
40 |
description of taxable income. Taxable income for the first nine months of 2021 are estimates until we file our tax returns for the year. To the extent we expect to pay tax at the corporate level (generally as a result of activity at our TRS), we are required to record a tax provision for GAAP reporting purposes. Any tax provision (or benefit) is not necessarily the actual amount of tax currently due (or receivable as a refund) as a portion of our provision (or benefit) is deferred in nature. It is our intention to retain any excess inclusion income generated in 2021 at our TRS and not pass it through to our shareholders.
(2)In accordance with Internal Revenue Code rules applicable to disaster losses, taxable income at our taxable subsidiaries for the twelve-month period ended December 31, 2020, was adjusted to recognize $59 million of losses incurred in the first quarter of 2020 into the fourth quarter of 2019.
(3)Taxable income per share is based on the number of shares outstanding at the end of each quarter. The year-to-date taxable income per share is the sum of the quarterly per share estimates.
Page 34 (Non-GAAP Measurements)
(1)Taxable income per share is based on the number of shares outstanding at the end of each quarter. The year-to-date taxable income per share is the sum of the quarterly per share estimates.
| | |
|
|
| THE REDWOOD REVIEW I 3RD QUARTER 2021 |
41 |
| | | | | | | | |
| R E D W O O D T R U S T C O R P O R A T E I N F O R M A T I O N |
| | |
| | |
| D I R E C T O R S : | | O F F I C E L O C A T I O N S : |
| | |
| Richard D. Baum | | CORPORATE HEADQUARTERS: |
| Chairman of the Board | | One Belvedere Place, Suite 300 |
| and Former Chief Deputy Insurance | | Mill Valley, CA 94941 |
| Commissioner for the State of California | | Telephone: (415) 389-7373 |
| | |
| Greg H. Kubicek | | DENVER METRO AREA OFFICE: |
| Vice Chairman of the Board | | 8310 South Valley Highway, Suite 425 |
| and President, The Holt Group, Inc. | | Englewood, CO 80112 |
| | |
| Christopher J. Abate | | IRVINE OFFICE: |
| Chief Executive Officer | | 4 Park Plaza, Suite 900 |
| | Irvine, CA 92614 |
| Armando Falcon | | |
| CEO, Falcon Capital Advisors LLC | | NEW YORK OFFICE: |
| | 650 Fifth Avenue, Suite 2120 |
| Douglas B. Hansen | | New York, NY 10019 |
| Private Investor | | |
| | |
| Debora D. Horvath | | I N V E S T O R R E L A T I O N S : |
| Principal, Horvath Consulting LLC | | Lisa M. Hartman |
| | SVP, Head of Investor Relations |
| George W. Madison | | Phone: 415-384-3555 |
| Member, Madison Governance Advisors, LLC | | Email: investorrelations@redwoodtrust.com |
| Retired Partner, Sidley Austin LLP | | |
| | STOCK LISTING: |
| Jeffrey T. Pero | | The Company's common stock is traded |
| Retired Partner, Latham & Watkins LLP | | on the NYSE under the symbol RWT |
| | |
| Georganne C. Proctor | | TRANSFER AGENT: |
| Former Chief Financial Officer, TIAA-CREF | | Computershare Trust Company, N.A. |
| | 2 North LaSalle Street |
| Dashiell I. Robinson | | Chicago, IL 60602 |
| President | | Telephone: (888) 472-1955 |
| | |
| Faith A. Schwartz | | |
| President, Housing Finance Strategies, LLC | | |
| | |
| For more information about Redwood Trust, |
| please visit our website at: www.redwoodtrust.com |