0000930236DEF 14AFALSEiso4217:USDxbrli:pure00009302362024-01-012024-12-3100009302362023-01-012023-12-3100009302362022-01-012022-12-3100009302362021-01-012021-12-3100009302362020-01-012020-12-310000930236ecd:EqtyAwrdsInSummryCompstnTblForAplblYrMemberecd:PeoMember2024-01-012024-12-310000930236ecd:YrEndFrValOfEqtyAwrdsGrntdInCvrdYrOutsdngAndUnvstdMemberecd:PeoMember2024-01-012024-12-310000930236ecd:ChngInFrValOfOutsdngAndUnvstdEqtyAwrdsGrntdInPrrYrsMemberecd:PeoMember2024-01-012024-12-310000930236ecd:ChngInFrValAsOfVstngDtOfPrrYrEqtyAwrdsVstdInCvrdYrMemberecd:PeoMember2024-01-012024-12-310000930236ecd:DvddsOrOthrErngsPdOnEqtyAwrdsNtOthrwsRflctdInTtlCompForCvrdYrMemberecd:PeoMember2024-01-012024-12-310000930236ecd:EqtyAwrdsInSummryCompstnTblForAplblYrMemberecd:NonPeoNeoMember2024-01-012024-12-310000930236ecd:YrEndFrValOfEqtyAwrdsGrntdInCvrdYrOutsdngAndUnvstdMemberecd:NonPeoNeoMember2024-01-012024-12-310000930236ecd:ChngInFrValOfOutsdngAndUnvstdEqtyAwrdsGrntdInPrrYrsMemberecd:NonPeoNeoMember2024-01-012024-12-310000930236ecd:ChngInFrValAsOfVstngDtOfPrrYrEqtyAwrdsVstdInCvrdYrMemberecd:NonPeoNeoMember2024-01-012024-12-310000930236ecd:DvddsOrOthrErngsPdOnEqtyAwrdsNtOthrwsRflctdInTtlCompForCvrdYrMemberecd:NonPeoNeoMember2024-01-012024-12-31000093023612024-01-012024-12-31000093023652024-01-012024-12-31000093023622024-01-012024-12-31000093023632024-01-012024-12-31000093023642024-01-012024-12-31
UNITED STATES
SECURITIES AND EXCHANGE COMMISSION
Washington, D.C. 20549
SCHEDULE 14A
(RULE 14a-101)
SCHEDULE 14A INFORMATION
Proxy Statement Pursuant to Section 14(a) of the
Securities Exchange Act of 1934
| | | | | |
| Filed by the Registrant: | ý |
| Filed by a Party other than the Registrant: | o |
Check the appropriate box:
| | | | | | | | |
| o | Preliminary Proxy Statement |
| | | | | | | | |
| o | Confidential, for Use of the Commission Only (as Permitted by Rule 14a-6(e)(2)) |
| | | | | | | | |
| x | Definitive Proxy Statement |
| | | | | | | | |
| o | Definitive Additional Materials |
| | | | | | | | |
| o | Soliciting Material under §240.14a-12 |
REDWOOD TRUST, INC.
| | |
(Name of Registrant as Specified in Its Charter) |
(Name of Person(s) Filing Proxy Statement, if other than the Registrant) |
Payment of Filing Fee (Check the appropriate box): | | | | | | | | | | | |
| | | |
| ý | No fee required. |
| | | |
| o | Fee paid previously with preliminary materials. |
| | | |
| o | Fee computed on table in exhibit required by Item 25(b) per Exchange Act Rules 14a-6(i)(1) and 0-11. |
REDWOOD TRUST, INC.
One Belvedere Place, Suite 300
Mill Valley, California 94941
(415) 389-7373
NOTICE OF 2025 ANNUAL MEETING OF STOCKHOLDERS
To the Stockholders of Redwood Trust, Inc.:
You are cordially invited to attend the Annual Meeting of Stockholders of Redwood Trust, Inc., a Maryland corporation, to be held on May 22, 2025 at 8:30 a.m., Pacific time, at the Acqua Hotel, 555 Redwood Highway, Mill Valley, California 94941 (the “Annual Meeting”), for the following purposes:
1.To consider and vote upon the election of Greg H. Kubicek, Christopher J. Abate, Doneene K. Damon, Armando Falcon, Douglas B. Hansen, Debora D. Horvath, Georganne C. Proctor, Dashiell I. Robinson, and Faith A. Schwartz to serve as directors until the annual meeting of stockholders in 2026 and until their successors are duly elected and qualify;
2.To consider and vote upon the ratification of the appointment of Grant Thornton LLP as our independent registered public accounting firm for 2025;
3.To consider and vote upon a non-binding advisory resolution to approve named executive officer compensation; and
4.To transact such other business as may properly come before the Annual Meeting or any adjournment or postponement of the Annual Meeting.
We have elected to use the Internet as our primary means of providing our proxy materials to stockholders. Consequently, stockholders will not receive paper copies of our proxy materials unless they specifically request them. We will send a Notice of Internet Availability of Proxy Materials (the “Notice”) on or about April 11, 2025 to our stockholders of record as of the close of business on March 27, 2025. We are also providing access to our proxy materials over the Internet beginning on or about April 11, 2025. Electronic delivery of our proxy materials will reduce printing and mailing costs, as well as associated waste, relating to our Annual Meeting.
The Notice contains instructions for accessing the proxy materials, including the Proxy Statement and our annual report, and provides information on how stockholders may obtain paper copies free of charge. The Notice also provides the date and time of the Annual Meeting; the matters to be acted upon at the Annual Meeting and the Board of Directors' recommendation with regard to each matter to be acted upon; information about voting procedures; and information on how to attend the Annual Meeting.
Our Board of Directors has fixed the close of business on March 27, 2025 as the record date for determination of stockholders entitled to notice of, and to vote at, the Annual Meeting and any adjournment or postponement of the Annual Meeting.
| | |
| YOUR VOTE IS IMPORTANT. |
| PLEASE PROMPTLY AUTHORIZE A PROXY TO CAST YOUR VOTES THROUGH THE INTERNET FOLLOWING THE VOTING PROCEDURES DESCRIBED IN THE NOTICE OR, IF YOU HAVE REQUESTED AND RECEIVED PAPER COPIES OF THE PROXY MATERIALS, BY TELEPHONE OR BY SIGNING, DATING AND RETURNING THE PROXY CARD SENT TO YOU. |
We would like your shares to be represented at the Annual Meeting. Whether or not you plan to attend the Annual Meeting, we respectfully request that you authorize your proxy over the Internet following the voting procedures described in the Notice. In addition, if you have requested or received a paper or email copy of the proxy materials, you can authorize your proxy over the telephone or by signing, dating and returning the proxy card sent to you. We encourage you to authorize your proxy by any of these methods even if you currently plan to attend the Annual Meeting. By doing so, you will ensure that your shares are represented and voted at the Annual Meeting.
By Order of the Board of Directors,
/s/ Andrew P. Stone
Secretary
March 31, 2025
TABLE OF CONTENTS
REDWOOD TRUST, INC.
One Belvedere Place, Suite 300
Mill Valley, California 94941
(415) 389-7373
PROXY STATEMENT
ANNUAL MEETING OF STOCKHOLDERS
TO BE HELD ON MAY 22, 2025
INTRODUCTION
This Proxy Statement is being furnished in connection with the solicitation of proxies by the Board of Directors of Redwood Trust, Inc., a Maryland corporation (“Redwood,” the “Company,” “we,” or “us”), for exercise at the Annual Meeting of Stockholders (the “Annual Meeting”) to be held on May 22, 2025 at 8:30 a.m., Pacific time, at the Acqua Hotel, 555 Redwood Highway, Mill Valley, California 94941, and at any adjournment or postponement thereof.
We have elected to provide access to our proxy materials over the Internet. Accordingly, we are sending a Notice of Internet Availability of Proxy Materials (the “Notice”) to our stockholders of record, while brokers and other nominees who hold shares on behalf of beneficial owners will be sending their own similar notice of internet availability of proxy materials. All stockholders will have the ability to access proxy materials on the website referred to in the Notice or request to receive a printed set of the proxy materials. Instructions on how to request a printed copy by mail or electronically may be found on the Notice and on the website referred to in the Notice, including an option to request paper copies on an ongoing basis. We intend to make this Proxy Statement available on the Internet on or about April 11, 2025 and to mail the Notice to all stockholders entitled to vote at the Annual Meeting on or about April 11, 2025. We intend to mail this Proxy Statement, together with a proxy card, to those stockholders entitled to vote at the Annual Meeting who have properly requested paper copies of such materials on or about April 11, 2025 or within three business days of such request.
The address and telephone number of our principal executive office are as set forth above and our website is www.redwoodtrust.com. Information on our website is not a part of this Proxy Statement.
INFORMATION ABOUT THE ANNUAL MEETING
Who May Attend the Annual Meeting
Only stockholders who own our common stock as of the close of business on March 27, 2025, the record date for the Annual Meeting, will be entitled to attend the Annual Meeting. In the discretion of management, we may permit certain other individuals to attend the Annual Meeting, including members of the media and our employees.
Who May Vote
Each share of our common stock outstanding on the record date for the Annual Meeting entitles the holder thereof to one vote. The record date for determining stockholders entitled to notice of, and to vote at, the Annual Meeting is the close of business on March 27, 2025. As of March 27, 2025, there were 132,982,863 shares of common stock issued and outstanding. You can vote in person at the Annual Meeting or by proxy. You may authorize your proxy through the Internet by following the voting procedures described in the Notice or, if you have requested and received paper copies of the proxy materials, by telephone or by signing, dating, and returning the proxy card sent to you. To use a particular voting procedure, follow the instructions on the Notice or the proxy card that you request and receive by mail or email.
If your shares are held in the name of a bank, broker, or other holder of record, you will receive instructions from the holder of record that you must follow in order for your shares to be voted. If your shares are not registered in your own name and you plan to cast your votes at the Annual Meeting, you should contact your broker or agent to obtain a broker’s proxy card and bring it to the Annual Meeting in order to vote.
Voting by Proxy; Board of Directors’ Voting Recommendations
You may authorize your proxy over the Internet or, if you request and receive a proxy card by mail or email, over the phone or by signing, dating and returning the proxy card sent to you. If you vote by proxy, the individuals named on the proxy, or their substitutes, will cast your votes in the manner you indicate. If you date, sign, and return a proxy card without marking your voting instructions, your votes will be cast in accordance with the recommendations of Redwood’s Board of Directors, as follows:
•For the election of each of the nine nominees to serve as directors until the annual meeting of stockholders in 2026 and until their successors are duly elected and qualify;
•For the ratification of the appointment of Grant Thornton LLP as our independent registered public accounting firm for 2025;
•For the approval of the non-binding advisory resolution approving the compensation of our named executive officers; and
•In the discretion of the proxy holder on any other matter that properly comes before the Annual Meeting.
You may revoke or change your proxy at any time before it is exercised by submitting a new proxy through the Internet or by telephone, delivering to us a signed proxy with a date later than your previously delivered proxy, by voting in person at the Annual Meeting, or by sending a written revocation of your proxy addressed to Redwood’s Secretary at our principal executive office.
Why did I receive a one-page notice in the mail regarding the Internet availability of proxy materials instead of a full set of proxy materials?
Under rules adopted by the Securities and Exchange Commission (“SEC”), we have elected to provide access to our proxy materials over the Internet. Accordingly, we are sending the Notice to our stockholders. All stockholders will have the ability to access the proxy materials on the website referred to in the Notice or request to receive a printed set of the materials. Instructions on how to access the proxy materials over the Internet or to request a printed copy may be found in the Notice. In addition, stockholders may request to receive proxy materials in printed form by mail or electronically by email on an ongoing basis. We encourage stockholders to take advantage of the availability of the proxy materials on the Internet to help reduce printing and mailing costs, as well as associated waste, relating to our Annual Meeting.
Quorum Requirement
The presence, by attendance at the Annual Meeting or by proxy, of stockholders entitled to cast a majority of all the votes entitled to be cast at the Annual Meeting constitutes a quorum for the transaction of business. Abstentions and broker non-votes are counted as present for purposes of establishing a quorum. A broker non-vote occurs when a nominee holding shares for a beneficial owner has not received instructions from the beneficial owner and does not have discretionary authority to vote the shares.
Other Matters
Our Board of Directors knows of no other matters that may be presented for stockholder action at the Annual Meeting. If other matters properly come before the Annual Meeting, however, it is intended that the persons named in the proxies will vote on those matters in their discretion.
Information About the Proxy Statement and the Solicitation of Proxies
Your proxy is solicited by our Board of Directors, and we will bear the costs of this solicitation. Proxy solicitations will be made by mail, and also may be made by our directors, officers, and employees in person or by telephone, facsimile transmission, e-mail, or other means of communication. Banks, brokerage houses, nominees, and other fiduciaries will be requested to forward the proxy soliciting material to the beneficial owners of shares of our common stock entitled to be voted at the Annual Meeting and to obtain authorization for the execution of proxies on behalf of beneficial owners. We will, upon request, reimburse those parties for their reasonable expenses in forwarding proxy materials to their beneficial owners.
In addition, we have retained MacKenzie Partners, Inc., 7 Penn Plaza, Suite 530, New York, NY 10001, to aid in the solicitation of proxies by mail, telephone, facsimile, e-mail and personal solicitation and to contact brokerage houses and other nominees, fiduciaries and custodians to request that such entities forward soliciting materials to beneficial owners of our common stock. For these services, we will pay MacKenzie Partners, Inc. a fee not expected to exceed $16,000, plus expenses.
Annual Report
Our 2024 Annual Report, consisting of our Annual Report on Form 10-K for the year ended December 31, 2024, is being made available to stockholders together with this Proxy Statement and contains financial and other information about Redwood, including audited financial statements for our fiscal year ended December 31, 2024. Certain sections of our 2024 Annual Report are incorporated into this Proxy Statement by reference, as described in more detail under “Information Incorporated by Reference” at the end of this Proxy Statement. Our 2024 Annual Report is also available on our website.
Householding
We have adopted a procedure approved by the SEC called “householding.” Under this procedure, stockholders who have the same address and last name may receive only one copy of the Notice, unless one or more of these stockholders provide notice that they wish to continue receiving individual copies. This procedure reduces our printing and mailing costs, as well as associated waste.
Householding will not in any way affect dividend check mailings.
If you are eligible for householding, but you and other stockholders of record with whom you share an address currently receive multiple copies of the Notice, or if you hold stock in more than one account, and in either case you wish to receive only a single copy of this document for your household, please contact your bank or broker.
If you participate in householding and wish to receive a separate copy of the Notice, or if you do not wish to participate in householding and prefer to receive separate copies of this document in the future, please contact your bank or broker.
Beneficial owners can request additional information about householding from their banks or brokers.
CORPORATE GOVERNANCE
Corporate Governance Standards
Our Board of Directors has adopted Corporate Governance Standards (“Governance Standards”). Our Governance Standards are available on our website as well as in print at the written request of any stockholder addressed to Redwood’s Secretary at our principal executive office. The Governance Standards contain general principles regarding the composition and functions of our Board of Directors and its committees.
Process for Nominating Potential Director Candidates
Identifying and Evaluating Nominees for Directors. Our Board of Directors nominates director candidates for election by stockholders at each annual meeting and elects new directors to fill vacancies on our Board of Directors between annual meetings of the stockholders. Our Board of Directors has delegated the selection and initial evaluation of potential director nominees to the Governance and Nominating Committee with input from the Chief Executive Officer and President. The Governance and Nominating Committee makes the final recommendation of candidates to our Board of Directors for nomination. Our Board of Directors, taking into consideration the assessment of the Governance and Nominating Committee, also determines whether a nominee would be an independent director.
Stockholders’ Nominees. Our Bylaws permit stockholders to nominate a candidate for election as a director at an annual meeting of the stockholders subject to compliance with certain notice and informational requirements, as more fully described below in this Proxy Statement under “Stockholder Proposals for the 2026 Annual Meeting.” A copy of the full text of our current Bylaws may be obtained by any stockholder upon written request addressed to Redwood’s Secretary at our principal executive office. Among other matters required under our Bylaws, any stockholder nominations should include the nominee’s name and qualifications for Board membership and should be addressed to Redwood’s Secretary at our principal executive office.
The policy of the Governance and Nominating Committee is to consider properly submitted stockholder nominations for candidates for election to our Board of Directors. The Governance and Nominating Committee evaluates stockholder nominations in connection with its responsibilities set forth in its written charter and applies the qualification criteria set forth in the Governance Standards.
Director Qualifications. Our Governance Standards contain Board membership criteria that apply to nominees for our Board of Directors. Each member of our Board of Directors must exhibit high standards of integrity, commitment, and independence of thought and judgment, and must be committed to promoting the best interests of Redwood. In addition, each director must devote the time and effort necessary to be a responsible and productive member of our Board of Directors. This includes developing knowledge about Redwood’s business operations and doing the work necessary to participate actively and effectively in Board and committee meetings.
Our Governance Standards also contain criteria that are intended to guide our Governance and Nominating Committee’s considerations of diversity in identifying nominees for our Board of Directors. In particular, our Governance Standards provide that the members of our Board of Directors should collectively possess a broad range of talent, skill, expertise, background, and life experience useful to effective oversight of our business and affairs and sufficient to provide sound and prudent guidance with respect to our operations and interests. Our Board of Directors considers diversity as broadly construed to mean a variety of perspectives, personal and professional experiences and backgrounds/identities. The self-assessments that are conducted each year by our Board of Directors and our Governance and Nominating Committee include an assessment of whether the Board’s then current composition represents the broad range of talent, skill, expertise, background, and life experience that is called for by our Governance Standards.
We believe our directors collectively have a well-rounded variety of talents, skills, qualifications and experience, and represent an effective mix of deep company knowledge and outside perspectives. Additional information regarding the mix of experience, qualifications, attributes and skills of our directors is included under Item 1—Election of Directors on pages 18 - 23 of this Proxy Statement.
Director Independence
As required under Section 303A of the New York Stock Exchange (“NYSE”) Listed Company Manual and our Governance Standards, on February 26, 2025 our Board of Directors affirmatively determined that none of the following directors have a material relationship (either directly or as a partner, stockholder, or officer of an organization that has a relationship) with us and that each of them qualifies as “independent” under Section 303A: Greg H. Kubicek, Doneene K. Damon, Armando Falcon, Douglas B. Hansen, Debora D. Horvath, Georganne C. Proctor, and Faith A. Schwartz. The Board of Directors’ determinations were made after consideration of, among other things, the matters described below under “Additional Information About Directors and Executive Officers — Certain Relationships and Related Party Transactions” on page 101 of this Proxy Statement. Two members of our Board of Directors, Mr. Abate and Mr. Robinson, do not qualify as “independent” under Section 303A of the NYSE Listed Company Manual or our Governance Standards because they are Redwood’s Chief Executive Officer and President, respectively.
Board Leadership Structure
At Redwood, there is a separation between the chair of the Board (“Board Chair”) and chief executive officer roles. Redwood’s Board Chair presides over meetings of the Board and serves as a liaison between the Board and management of Redwood. In addition, Redwood’s Board Chair provides input regarding Board agendas, materials, and areas of focus, and may represent Redwood to external constituencies such as investors, governmental representatives, and business counterparties. The Board Chair is currently Greg H. Kubicek, who was elected Chair in May 2022 and who has served as an independent director of Redwood since 2002.
In addition, under the Governance Standards, each of the Audit Committee, Compensation Committee, and Governance and Nominating Committee of Redwood’s Board of Directors is comprised solely of independent directors.
The Board believes this leadership structure is appropriate for Redwood, as it provides for the Board to be led by, and its standing committees to be comprised of, independent directors. As an independent Board Chair, Mr. Kubicek brings two decades of experience of serving on Redwood’s Board along with the important perspective of an independent director to this leadership position.
Executive Sessions
Pursuant to our Governance Standards, our non-employee directors (i.e., the seven of our nine current directors who are not Redwood employees) meet in executive session at each regularly scheduled quarterly meeting of our Board of Directors and at such other times as determined by the Board Chair. In addition, if any non-employee director is not also an independent director, then, under our Governance Standards, our independent directors meet at least annually in executive session without any such non-independent directors.
Board of Directors’ Role in Risk Oversight
The Board of Directors takes a primary role in risk oversight. At its regular meetings, the Board of Directors reviews Redwood’s business and investment strategies and plans and seeks an understanding of the related risks as well as management’s approach to identifying and managing those risks. In carrying out its role in risk oversight, the Board of Directors receives and discusses quarterly reports from the Chief Executive Officer (and other officers of Redwood) and the Audit Committee, which also carries out a risk oversight function delegated by the Board of Directors.
Under its charter, the Audit Committee is specifically charged with (i) inquiring of management and Redwood’s independent registered public accounting firm about significant risks or exposures with respect to corporate accounting, reporting practices of Redwood, the quality and integrity of the financial reports and controls of Redwood, regulatory and accounting initiatives, and any off balance sheet structures and (ii) assessing the steps management has taken to monitor or minimize such risks. In addition, the Audit Committee is specifically charged with regularly discussing with management Redwood’s policies with respect to risk assessment and risk management, including identification of Redwood’s major financial and operational risk exposures and the steps management has taken to monitor or control those exposures. For example, the Audit Committee receives quarterly reports from management regarding various financial risk management topics (such as credit risk, interest rate risk, liquidity risk, and financial covenant compliance), and various operational risk management topics (such as cybersecurity, operations and regulatory compliance) and regularly discusses with management Redwood's exposure to, and management of, financial and operational risks.
The Audit Committee carries out this function by, among other things, receiving a quarterly risk management report from Redwood’s Chief Executive Officer and other Redwood officers, and a quarterly internal audit report from Redwood’s head of internal audit, reviewing these reports, and discussing them by asking questions and providing direction to management. In addition, as noted below under “Audit Committee Matters – Audit Committee Report,” the Audit Committee also receives and discusses regular and required communications from Redwood’s independent registered public accounting firm regarding, among other things, Redwood’s internal controls. In addition to discussion of these reports during Audit Committee meetings, as circumstances merit, the Audit Committee holds separate executive sessions with one or more of the Chief Executive Officer, Chief Financial Officer, Redwood’s head of internal audit, and representatives of Redwood’s independent registered public accounting firm to discuss any matters that the Audit Committee or these persons believe should be discussed in the absence of other members of management. Redwood's Chief Financial Officer and head of internal audit each also regularly communicate with the Chair of the Audit Committee between Audit Committee meetings.
Oversight of Cybersecurity Risk. As part of its risk oversight function, the Board of Directors, including through delegation to the Audit Committee, regularly receives risk management reporting from various officers of the Company responsible for cybersecurity and information technology (“IT”) risk, and oversees management’s administration of Redwood’s cybersecurity risk management program. For example, officers within Redwood’s IT department provide periodic (generally at least once per quarter) reports from management to the Audit Committee related to cybersecurity, Redwood’s cybersecurity risk management program and related risks, with copies of these reports also provided to our full Board. These reports supplement materials and presentations from outside experts that are also provided to members of the Board of Directors from time to time as part of the Board’s and Audit Committee’s continuing education on risk oversight topics such as cybersecurity that impact companies in our industry and, more generally, publicly-traded companies. In addition, management has policies and procedures in place to provide event-driven updates on a timely basis to the Audit Committee and the Board of Directors regarding any material cybersecurity incidents and, as appropriate, any incidents with lesser impact potential. Additional discussion of Redwood’s Cybersecurity Risk Management and Strategy, as well of Cybersecurity Governance at Redwood is included within Part I, Item 1C of the Company’s Annual Report on Form 10-K for the year ended December 31, 2024, filed on March 3, 2025.
In addition, when appropriate, the Board of Directors may delegate to the Compensation Committee and Governance and Nominating Committee risk oversight responsibilities with respect to certain matters or request that other committees review certain risk oversight matters. For example, the Compensation Committee has been delegated the responsibility for determining, on an annual basis, whether Redwood’s compensation policies and practices are reasonably likely to have a material adverse effect on Redwood. As another example, the Governance and Nominating Committee reports to the Board of Directors the results of its analysis of potential risks related to board leadership and composition, board structure, and executive succession planning.
The Board of Directors believes that this manner of administering the risk oversight function effectively integrates oversight into the Board of Directors’ leadership structure, because the risk oversight function is carried out both at the Board level as well as through delegation to the Audit Committee, which consists solely of independent directors, and, when appropriate, to the Compensation Committee and Governance and Nominating Committee, which also consist solely of independent directors.
Board of Directors’ Self-Evaluation Process
The Board believes it is important to periodically assess its own performance and effectiveness in carrying out its strategic and oversight role with respect to the Company. The Board evaluates its performance through annual self-assessments at the Board and Committee levels, as well as through annual individual director self-assessments that include one-on-one meetings conducted by the Board Chair with each of the other directors (and with respect to the Board Chair, the Chair of the Governance and Nominating Committee). These self-assessments include analysis of the effectiveness of the Board, its Committees and its directors, how they are functioning and areas of potential improvement. The results of these self-assessments are also considered, among other things, by the Governance and Nominating Committee and the Board when considering whether to recommend a director for re-election and whether to consider new director candidates.
Board Tenure and Refreshment; Mandatory Retirement
Consistent with our Governance Standards, the Board is mindful that the composition of the Board, from a tenure and refreshment perspective, should reflect an appropriate mix of individuals with significant experience as a member of Redwood’s Board, together with individuals who are newer to service on Redwood’s Board, who bring fresh viewpoints and additional expertise and perspectives. For example, given Redwood’s business model, which includes engaging in mortgage banking activities, investing in long-term mortgage loan obligations and regularly accessing the mortgage loan finance markets, directors who have served on Redwood’s Board through multiple economic and financial market cycles are valued for the continuity and long-term perspectives they provide to other Board members and to management. At the same time, the business environment in which Redwood operates is constantly evolving – including from human capital and technological perspectives – and, therefore, Board refreshment is important to the continued effectiveness of the Board in the oversight of these and other evolving matters of importance to Redwood.
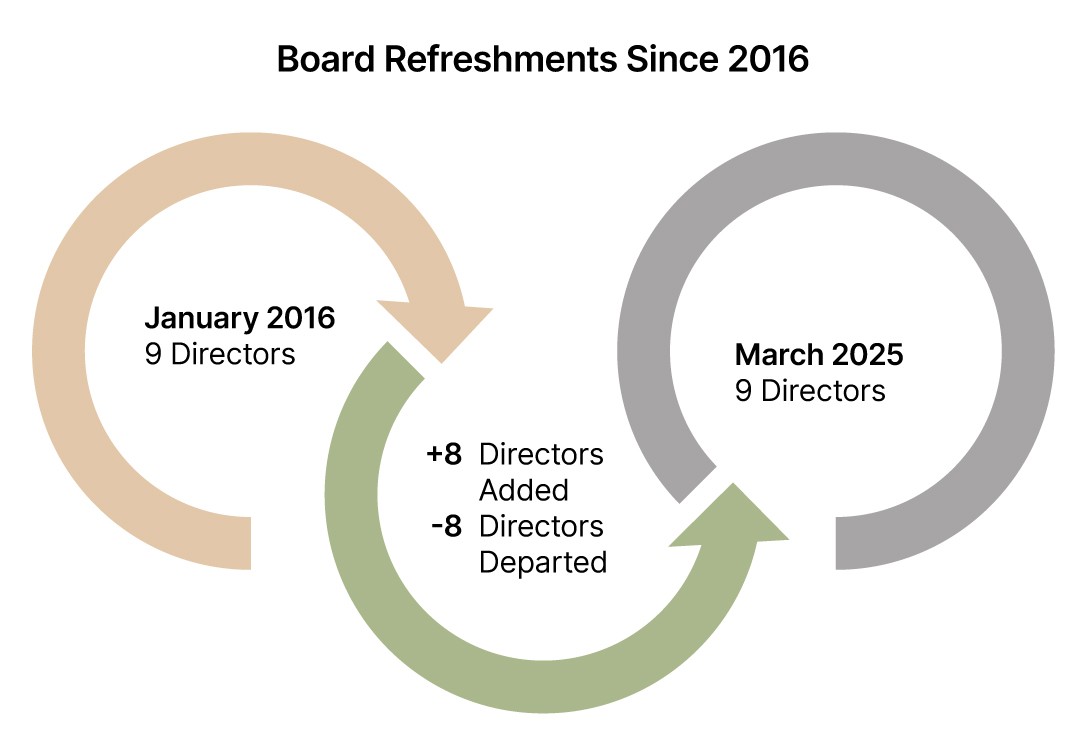
At Redwood, refreshment of the composition of Redwood’s Board regularly occurs, for a variety of reasons, including the following:
•Director Retirement / Departure. Director departures and retirements, including in accordance with the mandatory retirement age set forth in our Governance Standards, prompt refreshment.
◦For example, in 2023, one director retired from the Board of Directors at age 69 in order to attend to family matters.
•Mandatory Retirement. Under our Governance Standards, an individual, including an incumbent director, is generally ineligible to stand for election or re-election to the Board following the earlier of (i) 15 annual periods of Board service or (ii) after reaching age 75; provided, that the 15 annual period limitation on Board service began accruing upon adoption of this policy in 2024 for then-incumbent Directors.
◦For example, in 2022, two directors retired from the Board of Directors in accordance with the mandatory retirement provisions of our Governance Standards.
•Board Expansion. Redwood is permitted under its Charter to increase the size of the Board of Directors; expanding the size of the Board when merited enables Redwood to add new Board members to address emerging needs for Board-level expertise.
◦For example, in November 2023, Redwood increased the size of the Board from eight to nine directors, and Ms. Damon was elected to serve on the Board.
•Board’s Succession Planning / Self-Evaluation Process. The Board’s collective and individual self-assessment process (described further above under the heading “Board of Directors’ Self-Evaluation Process”) provides perspectives on Board composition that can prompt refreshment. In addition, Board refreshment results from the Board’s ongoing succession planning efforts to attract new directors to replace directors who are expected to retire or otherwise depart from the Board.
Refreshment of Board leadership positions is another area of focus that the Board believes is important to its continued effectiveness over the long-term. Redwood’s Governance Standards include guidelines regarding the rotation of Board leadership positions, including a stated expectation that the Board Chair position will rotate at least once every eight years, and the Committee Chair positions for each of the Board’s standing committees will rotate at least once every six years, in each case beginning from the date of adoption of these guidelines in 2024. Exceptions to these guidelines may be approved so that no more than one Committee Chair position rotates per year, or for other reasons, at the Board’s discretion, if it is determined to be in the best interests of the Company.
The Board’s expected refreshment schedule for Board Chair and Committee Chair positions is set forth below.
Communications with the Board of Directors
Stockholders and other interested parties may communicate with our Board of Directors by e-mail addressed to [email protected]. The Board Chair has access to this e-mail address and provides access to other directors as appropriate. Communications that are intended specifically for non-employee directors should be addressed to the Board Chair.
Director Attendance at Annual Meetings of Stockholders
Pursuant to our Governance Standards, Redwood’s directors are expected to attend annual meetings of stockholders. All of Redwood’s directors nominated for election in 2024 attended the 2024 annual meeting of stockholders in person. We currently expect all directors nominated for election to attend this year's Annual Meeting.
Code of Ethics; Insider Trading Policy
The Board of Directors has adopted a Code of Ethics that applies to all of Redwood’s directors, officers, and employees. The Code of Ethics is available on our website as well as in print at the written request of any stockholder addressed to Redwood’s Secretary at our principal executive office. We intend to post on our website and disclose in a Current Report on Form 8-K, to the extent required by applicable regulations, any change to the provisions of Redwood’s Code of Ethics and any waiver of a provision of the Code of Ethics.
We have adopted an Insider Trading Policy and related procedures governing the purchase, sale, and/or other dispositions of our securities by directors, officers, employees and other covered persons that we believe are reasonably designed to promote compliance with insider trading laws, rules and regulations, and the listing requirements of the NYSE. This policy imposes regular blackout periods during which certain individuals may not transact in our securities and pre-clearance procedures for transactions by certain specified individuals, including, among others, the members of our Board and our executive officers. In addition, this policy prohibits certain transactions that we have determined are higher risk or for which there is a heightened appearance of potential improper or inappropriate conduct, including short sales of our securities, options trading in puts, calls or other derivative securities involving our securities, hedging transactions, and margin accounts and pledging of our securities. We regularly review our Insider Trading Policy with our Board and management. A copy of our Insider Trading Policy is filed as Exhibit 19.1 to Redwood’s Annual Report on Form 10-K for the year ended December 31, 2024, filed on March 3, 2025.
STOCK OWNERSHIP REQUIREMENTS
Required Stock Ownership by Directors
Pursuant to our Governance Standards, non-employee directors are required to purchase from their own funds at least $50,000 of our common stock within three years from the date of commencement of their Board membership. Vested deferred stock units (“DSUs”) acquired by a director through the voluntary deferral of cash compensation that otherwise would have been paid to that director are counted towards this requirement. Any director whose status has changed from being an employee director to being a non-employee director is not subject to this requirement if that director held at least $50,000 of our common stock at the time of that change in status.
Additionally, non-employee directors are required to own common stock, including vested DSUs acquired through both voluntary and involuntary deferred compensation, equal to at least five times the annual cash retainer payable to non-employee directors (i.e., at least $450,000 in common stock/DSUs based on the current annual cash retainer in effect as of the date of this Proxy Statement) within five years from the date of commencement of their Board membership. Common stock and DSUs acquired with respect to the $50,000 stock purchase requirement count toward the attainment of this additional ownership requirement. Compliance with these ownership requirements is measured on a purchase/acquisition cost basis for shares of common stock, and on grant date value for vested DSUs.
As of the date of this Proxy Statement, all of our non-employee directors were in compliance with these requirements either due to ownership of the requisite number of shares of common stock and vested DSUs, or because the director was within the time period permitted to attain the required level of ownership.
Required Stock Ownership by Executive Officers
The Compensation Committee of our Board of Directors has set the following executive stock ownership requirements with respect to our executive officers:
•Each executive officer is required to own common stock with a value at least equal to (i) 6.25 times current salary for the Chief Executive Officer, (ii) 3.25 times current salary for the President, and (iii) 3.0 times current salary for the other executive officers;
•Five years are allowed to initially attain the required level of ownership and five years are allowed to acquire additional incremental shares if promoted to a position with a higher requirement or when a salary increase results in a higher requirement (if not in compliance at the indicated times, then the executive officer is required to retain net after-tax shares of common stock delivered as compensation or from the 2014 Incentive Plan or the Executive Deferred Compensation Plan until compliance is achieved);
•All shares of common stock owned outright are counted, including those held in trust for the executive officer and his or her immediate family, as well as vested and unvested DSUs and any other vested shares of common stock held pursuant to other employee plans; and
•Compliance with these requirements is measured on a purchase/acquisition cost basis for shares of common stock, and on grant date value for vested and unvested DSUs.
Redwood’s executive officers are currently the following individuals: Chief Executive Officer – Christopher J. Abate; President – Dashiell I. Robinson; Chief Financial Officer – Brooke E. Carillo; Executive Vice President, Chief Legal Officer and Secretary – Andrew P. Stone; and Chief Human Resource Officer – Sasha G. Macomber. All of Redwood’s executive officers were in compliance with these stock ownership requirements either due to ownership of the requisite number of shares and vested and unvested DSUs, or because he or she was within the time period permitted to attain the required level of ownership. The chart below illustrates compliance relative to the applicable requirement for each of our executive officers as of March 27, 2025.
Further information about each of Redwood’s executive officers is included within “Information About Our Executive Officers” on page 28 of this Proxy Statement.
ITEM 1 — ELECTION OF DIRECTORS
The nominees for the nine director positions are set forth below. In the event we are advised prior to the Annual Meeting that any nominee will be unable to serve or for good cause will not serve as a director if elected at the Annual Meeting, the proxies will cast votes for any person who shall be nominated by the present Board of Directors to fill such directorship. The nominees listed below are currently serving as directors of Redwood.
Vote Required
If a quorum is present, the election of each nominee as a director requires a majority of the votes cast with respect to such nominee at the Annual Meeting. For purposes of the election of directors, a majority of the votes cast means that the number of votes cast “for” a nominee for election as a director exceeds the number of votes cast “against” that nominee. Cumulative voting in the election of directors is not permitted. Abstentions and broker non-votes will not be counted as votes cast and will have no effect on the results of the vote in the election of directors. In accordance with Redwood’s Bylaws and its Policy Regarding Majority Voting, any incumbent nominee for director must offer to resign from the Board if he or she fails to receive the required number of votes for re-election. The Governance and Nominating Committee will consider any such offer of resignation and will recommend to the Board whether to accept the offer to resign. The Board will decide whether to accept any such offer to resign and will publicly disclose its decision.
Nominees to Board of Directors
| | | | | | | | |
| Name | | Current Position with Redwood |
| Greg H. Kubicek | | Chair of the Board |
| Christopher J. Abate | | Director and Chief Executive Officer |
| Doneene K. Damon | | Director |
| Armando Falcon | | Director |
| Douglas B. Hansen | | Director |
| Debora D. Horvath | | Director |
| Georganne C. Proctor | | Director |
| Dashiell I. Robinson | | Director and President |
| Faith A. Schwartz | | Director |
THE BOARD OF DIRECTORS UNANIMOUSLY RECOMMENDS A VOTE FOR THE NOMINEES IDENTIFIED ABOVE.
Set forth below are summaries of the experience, qualifications, attributes and skills, of each of the nominees for election at the Annual Meeting, as well as certain biographical information regarding each of these individuals.
For each nominee for election as a director, set forth below and on the following pages is biographical information regarding the nominee, as well as factors supporting the Board of Directors’ conclusion to nominate the nominee for election to continue to serve as a director.
| | | | | |
| Greg H. Kubicek, age 68, is Chair of the Board, having previously served as Vice Chair of the Board from December 2020 to May 2022. Mr. Kubicek has been a director of Redwood since 2002. After serving as Founder and CEO of The Holt Group, Inc. for 41 years, Mr. Kubicek was appointed CEO of GHK Enterprises, Inc. following Sekisui House’s acquisition of The Holt Group, Inc., a real estate company and its associated funds that purchase, develop, own, and manage |
manage real estate properties. Mr. Kubicek has also served as Chair of the Board of Cascade Corporation, an international manufacturing corporation. Mr. Kubicek holds an A.B. in Economics from Harvard College. |
The Board of Directors concluded that Mr. Kubicek should be nominated to continue to serve as a director on account of, among other things, the following experience, qualifications, attributes, and skills: •Leadership attributes •Management and entrepreneurial experience •Expertise and experience in the real estate development industry •Experience and expertise in the property management business •Professional and educational background |
| | | | | |
| Christopher J. Abate, age 45, has served as Chief Executive Officer since May 2018 and as a director since December 2017. Mr. Abate has been employed with Redwood since April 2006, previously serving as Redwood’s President from July 2016 to May 2018, Chief Financial Officer from March 2012 to August 2017, and Controller from January 2009 to March 2013. From October 2019 to December 2021, Mr. Abate served as Chair of the Board of Structured Finance Association |
| Association. Before joining Redwood, Mr. Abate was employed by PricewaterhouseCoopers LLP. He holds a B.A. in accounting and finance from Western Michigan University, an M.B.A. from the University of California at Berkeley and Columbia University. |
The Board of Directors concluded that Mr. Abate should be nominated to continue to serve as a director on account of, among other things, the following experience, qualifications, attributes, and skills: •Leadership attributes and management experience, including experience as Chief Executive Officer, President, Chief Financial Officer, and Controller of Redwood •Skill and experience in managing balance sheet exposures and managing risks •Skill and experience in executing capital markets transactions •Finance and accounting expertise and experience •Professional and educational background |
| | | | | |
| Doneene K. Damon, age 57, has been a director of Redwood since November 2023. Ms. Damon is a practicing attorney as a Director of Richards, Layton & Finger, P.A. (“RLF”), a multidisciplinary law firm based in Wilmington, Delaware, which she joined in 1992. Ms. Damon served as the President of RLF from 2019 to 2022, and currently serves as chair of the firm’s Corporate Trust and Agency Services Group. Ms. Damon also currently serves on the Board of Directors of Brown Advisory Delaware |
| Advisory Delaware Trust Company and as a board member of the Structured Finance Association, the Forum of Executive Women and the Delaware Business Roundtable. Ms. Damon’s commitment to public service and nonprofit organizations includes current or past service as a member of Delaware’s Judicial Nominating Commission, the Delaware Compensation Commission, and the Delaware Prosperity Partnership. Ms. Damon previously served as the Chair of the Board of Directors of Christiana Care Health System, Inc. and Health Services, Inc., and she currently serves on the Board of Directors of St. Joseph’s University and is a member of the Board of Visitors of Temple University’s Beasley School of Law. Ms. Damon holds a B.S. in Accounting from St. Joseph’s University in Philadelphia and a J.D. from Temple University’s School of Law. |
The Board of Directors concluded that Ms. Damon should be nominated to continue to serve as a director on account of, among other things, the following experience, qualifications, attributes, and skills: •Leadership attributes and management experience •Skill and experience in structured finance transactions •Expertise and experience in legal and regulatory matters •Expertise and experience relating to corporate and institutional governance •Professional and educational background |
| | | | | |
| Armando Falcon, age 64, has been a director of Redwood since March 2021. Mr. Falcon is CEO of Falcon Capital Advisors LLC, a management consulting firm based in Washington, DC, that provides strategic advice and technical assistance to financial services companies, mortgage industry companies, and government agencies on matters involving process reengineering, project management, regulatory compliance, and data analytics, which he founded in 2007. He previously served |
| served as the Director of the Office of Federal Housing Enterprise Oversight, and as the General Counsel for the Committee on Banking and Financial Services of the U.S. House of Representatives. Mr. Falcon currently serves on the Board of Directors of the Structured Finance Association. Mr. Falcon also serves as an advisor to the Board of Directors of the National Association of Hispanic Real Estate Professionals. Mr. Falcon holds a B.A. from St. Mary’s University, an M.P.P. from Harvard University, and a J.D. from the University of Texas. |
The Board of Directors concluded that Mr. Falcon should be nominated to continue to serve as a director on account of, among other things, the following experience, qualifications, attributes, and skills: •Leadership attributes and management experience •Experience in government service and financial regulation •Expertise and experience in the real estate finance and financial services industries •Expertise and experience relating to corporate and institutional governance •Professional and educational background |
| | | | | |
| Douglas B. Hansen, age 67, is a founder of Redwood, and served as Redwood’s President from 1994 through 2008. Mr. Hansen retired from his position as President of Redwood at the end of 2008. Mr. Hansen has been a director of Redwood since 1994. Mr. Hansen serves on the Board of Directors of Four Corners Property Trust, Inc., a publicly traded real estate investment trust. Mr. Hansen also serves on the board of River of Knowledge, a not-for-profit institution. Mr. Hansen holds |
| holds an A.B. in Economics from Harvard College and an M.B.A. from Harvard Business School. |
The Board of Directors concluded that Mr. Hansen should be nominated to continue to serve as a director on account of, among other things, the following experience, qualifications, attributes, and skills: •Leadership attributes and management experience, including experience as Redwood’s President from its founding in 1994 through 2008 •Skill and experience in investing in real estate-related assets and managing portfolios of such investments •Skill and experience in managing balance sheet exposures and managing risks •Skill and experience in executing capital markets transactions •Experience in finance and accounting matters •Professional and educational background |
| | | | | |
| Debora D. Horvath, age 70, has been a director of Redwood since 2016. Ms. Horvath is Principal of Horvath Consulting LLC, which she founded in 2010. Ms. Horvath served as an Executive Vice President for JP Morgan Chase & Co. from 2008 to 2010. Ms. Horvath served as an Executive Vice President and Chief Information Officer for Washington Mutual, Inc. (“WaMu”) from 2004 to 2008. In addition to being the technology leader at WaMu, Ms. Horvath was responsible for the Enterprise |
| Enterprise Project Office and was Chair of WaMu’s Environmental Council. Ms. Horvath, a 25-year veteran from General Electric Company (“GE”), served 12 years as a Senior Vice President and Chief Information Officer for the GE insurance businesses. Ms. Horvath has been a Director of StanCorp Financial Group, Inc. since 2013. She was a director of the Federal Home Loan Bank of Seattle from 2012 to January 2014. Ms. Horvath holds a B.A. in Business Administration from Baldwin Wallace University and is a graduate of GE’s Financial Management Program (FMP). |
The Board of Directors concluded that Ms. Horvath should be nominated to continue to serve as a director on account of, among other things, the following experience, qualifications, attributes, and skills: •Leadership attributes and management experience •Experience as a chief information officer •Expertise and experience relating to information technology and technology risk management •Accounting and finance experience •Expertise and experience relating to institutional governance •Professional and educational background |
| | | | | |
| Georganne C. Proctor, age 68, has been a director of Redwood since March 2006. Ms. Proctor is the former Chief Financial Officer of TIAA-CREF, and served in that position from June 2006 to July 2010. Additionally, Ms. Proctor served jointly as Chief Financial Officer and Executive Vice President for Enterprise Integration at TIAA-CREF from January 2010 to July 2010. From July 2010 to October 2010, she continued to serve as Executive Vice President for Enterprise Integration |
| Integration at TIAA-CREF. From 2003 to 2005, Ms. Proctor was Executive Vice President of Golden West Financial Corporation, a thrift institution. From 1994 to 1997, Ms. Proctor was Vice President of Bechtel Group, a global engineering firm, and also served as its Senior Vice President and Chief Financial Officer from 1997 to 2002 and as a director from 1999 to 2002. From 1991 to 1994, Ms. Proctor served as finance director of certain divisions of The Walt Disney Company, a diversified worldwide entertainment company. Ms. Proctor previously served as Chair of Avantax Inc.’s Board of Directors from July 2019 to November 2023. She also served on the Board of Directors of Sculptor Capital Management, Inc. from 2011 to 2021, Kaiser Aluminum Corporation from 2006 to 2009 and SunEdison, Inc. from 2013 to 2017. Ms. Proctor holds a B.S. in Business Management from the University of South Dakota and an M.B.A. from California State University East Bay. |
The Board of Directors concluded that Ms. Proctor should be nominated to continue to serve as a director on account of, among other things, the following experience, qualifications, attributes, and skills: •Management experience •Expertise as a chief financial officer •Expertise and experience in the banking, insurance, and investment management industries •Professional and educational background |
| | | | | |
| Dashiell I. Robinson, age 45, has served as Redwood’s President since December 2017 and as a director since August 2021. Prior to joining Redwood in September 2017, Mr. Robinson was employed at Wells Fargo Securities, serving as the Head of Mortgage Finance within the Asset-Backed Finance Group. In that role, Mr. Robinson led a team of banking professionals responsible for financing and distributing an array of residential mortgage products, and serving a broad suite of |
| of the firm's operating and investing clients. Prior to his employment at Wells Fargo, Mr. Robinson was employed within the Structured Credit Products Group at Wachovia Capital Markets from 2001 to 2008, serving in banking, structuring and risk mitigation roles. Mr. Robinson also serves as a member of the Board of Directors of the Jewish Community Center of San Francisco. Mr. Robinson holds a B.A. in English from Georgetown University. |
The Board of Directors concluded that Mr. Robinson should be nominated to continue to serve as a director on account of, among other things, the following experience, qualifications, attributes, and skills: •Leadership attributes and management experience, including experience as President and Executive Vice President of Redwood •Expertise and experience in the real estate finance and financial services industries •Skill and experience investing in mortgages and other real estate-related assets and managing portfolios of such investments •Skill and experience in executing capital markets and structured finance transactions •Professional and educational background |
| | | | | |
| Faith A. Schwartz, age 64, has been a director of Redwood since March 2021. Ms. Schwartz is the Founder and CEO of Housing Finance Strategies, LLC, a professional services and advisory practice focusing on capital markets, rating agencies, and mortgage modernization and innovation, which she founded in 2016. Ms. Schwartz currently serves on the boards of several privately held mortgage industry-focused companies, including Class Valuation LLC. From June 2019 to June 2024, |
| 2024, Ms. Schwartz served on the Board of Directors of Gateway First Bank. From 2013 to 2016, Ms. Schwartz served as Senior Vice President of Federal Practice of CoreLogic, Inc., a provider of property information, insight, analytics and data-enabled solutions. She is also the founder of HOPE NOW Alliance, a public-private initiative launched in 2007 to seek solutions for American families facing foreclosure during the Great Recession. Ms. Schwartz also previously served as Senior Vice President of Government, Housing, and Industry at Option One Mortgage Corporation, a subsidiary of H&R Block, from 2003 to 2007 and as Director of Alternative Markets and Director of National Sales at Freddie Mac between 1997 and 2003. From October 2021 to October 2023, Ms. Schwartz served on the Consumer Advisory Board for the Consumer Finance Protection Bureau (CFPB). She also previously served on the Federal Reserve Board’s Consumer Advisory Council. In 2010, Ms. Schwartz founded HOPE LoanPort, a technology non-profit organization that helps families reach and sustain their goal of homeownership. She started her career at Dominion Bancshares Mortgage Company as Vice President of Capital Markets and Wholesale Lending. Ms. Schwartz holds a B.S. from Shippensburg State College and an M.B.A. from the University of Pittsburgh. |
The Board of Directors concluded that Ms. Schwartz should be nominated to continue to serve as a director on account of, among other things, the following experience, qualifications, attributes, and skills: •Leadership attributes and management experience •Expertise and experience in the real estate finance industry and the use of technology within this industry •Expertise and experience in the banking and financial services industries •Professional and educational background |
MEETINGS AND COMMITTEES OF THE BOARD OF DIRECTORS
Our Board of Directors currently consists of nine directors. Our Board of Directors has established three standing committees of the Board: the Audit Committee, the Compensation Committee, and the Governance and Nominating Committee. The membership of each Committee and the function of each Committee are described below. Each of the Committees has adopted a charter and the charters of all Committees are available on our website and in print at the written request of any stockholder addressed to Redwood’s Secretary at our principal executive office.
Our Board of Directors held a total of ten meetings during 2024. The non-employee directors of Redwood met in executive session at five meetings during 2024. Mr. Kubicek presided at executive sessions of the non-employee directors during 2024, all of whom qualified as “independent” under Rule 303A of the NYSE Listed Company Manual. No director attended fewer than 75% of the meetings of the Board of Directors and the Committees on which he or she served and all of our directors attended last year’s annual meeting of stockholders in person.
Audit Committee. Redwood has a separately designated Audit Committee established in accordance with Section 3(a)(58)(A) of the Securities Exchange Act of 1934, as amended. The Audit Committee’s function includes providing oversight regarding accounting, auditing, risk management, and financial reporting practices of Redwood. The Audit Committee consists solely of non-employee directors, all of whom our Board of Directors has determined are independent within the meaning of the listing standards of the NYSE and the rules of the SEC. Our Board of Directors has determined that all members of the Audit Committee are “financially literate” within the meaning of the applicable regulations and standards and has designated each of Ms. Horvath and Ms. Proctor as an “audit committee financial expert” within the meaning of the applicable regulations and standards. The Audit Committee met eight times in 2024 in order to carry out its responsibilities, including as discussed below under “Audit Committee Matters — Audit Committee Report.”
Compensation Committee. The Compensation Committee’s function includes reviewing and approving Redwood’s compensation philosophy, reviewing the competitiveness of Redwood’s compensation practices, as well as risks that may arise from those practices, determining and approving the annual base salaries and incentive compensation paid to our executive officers, approving the terms and conditions of proposed incentive plans applicable to our executive officers and other employees, approving and overseeing the administration of Redwood’s employee benefit plans, and reviewing and approving hiring and severance arrangements for our executive officers. The Compensation Committee also oversees risk and opportunity related to human capital matters, which at Redwood includes, among other things, matters such as workforce trends, employee engagement efforts, and workforce succession planning. The Compensation Committee consists solely of non-employee directors, each of whom our Board of Directors has determined is independent within the meaning of the listing standards of the NYSE and are “non-employee directors” within the meaning of the rules of the SEC. The Compensation Committee met five times in 2024 in order to carry out its responsibilities, as discussed below under “Executive Compensation — Compensation Discussion and Analysis.”
Governance and Nominating Committee. The Governance and Nominating Committee’s function includes reviewing and considering corporate governance guidelines and principles, evaluating potential director candidates and recommending qualified candidates to the full Board, reviewing executive succession planning, and evaluating executives in connection with succession planning, and overseeing the self-assessment of the Board of Directors. The Governance and Nominating Committee also carries out responsibilities related to the receipt, retention, and treatment of reported concerns related to potential violations of Redwood’s Code of Ethics. The Governance and Nominating Committee consists solely of non-employee directors, each of whom our Board of Directors has determined is independent within the meaning of the listing standards of the NYSE. The Governance and Nominating Committee met four times in 2024 in order to carry out its responsibilities.
Committee Members
The current members of each of the three standing committees are listed below, with the Chair appearing first.
| | | | | | | | | | | | | | |
| Audit | | Compensation | | Governance and Nominating |
| Debora D. Horvath | | Georganne C. Proctor | | Armando Falcon |
| Armando Falcon | | Doneene K. Damon | | Doneene K. Damon |
| Georganne C. Proctor | | Debora D. Horvath | | Greg H. Kubicek |
| Faith A. Schwartz | | Greg H. Kubicek | | Faith A. Schwartz |
| | | | |
DIRECTOR COMPENSATION
Information on our non-employee director cash compensation paid (or currently scheduled to be paid) during the annual periods commencing in May 2023, May 2024, and May 2025, is set forth in the tables below. Non-employee director cash compensation is paid quarterly, in arrears.
| | | | | | | | | | | | | | | | | | | | | | | |
| | Non-Employee Director Cash Compensation | |
| | | | Annual Period Commencing May 1, | |
| | | | 2023 and 2024 | | 2025 | |
| | Annual Retainer * | | $ | 90,000 | | | $ | 100,000 | | |
| | Retainer for Service as a Committee Member (per Committee)** | | $ | 12,500 | | | $ | 12,500 | | |
| | ———— | | | |
| * | The Chairs of the Audit Committee and the Governance and Nominating Committee each receive an additional annual cash retainer of $20,000. The Chair of the Compensation Committee receives an additional annual cash retainer of $30,000. The additional annual cash retainer payable to the Chair of the Board of the Directors is currently $120,000 and will increase to $135,000 for the annual period commencing May 2025. | |
| ** | Non-employee directors who are members of Board Committees receive a retainer for their service on each Committee and do not receive Committee meeting attendance fees. In cases where a non-employee director is formally invited to participate in a Committee meeting of which he or she is not a member, he or she will be paid $2,000 per meeting for in-person attendance and $1,000 per meeting for telephonic attendance. | |
After submission of appropriate documentation on a timely basis, non-employee directors are also reimbursed for reasonable out-of-pocket expenses incurred in attending Board and committee meetings, as well as for their and, in some cases, their guests’ attendance at other Redwood-related meetings or events. Non-employee directors may also be reimbursed for out-of-pocket expenses incurred in attending conferences or educational seminars that relate to their Board service and are approved by the Chair of the Governance and Nominating Committee.
Non-employee directors are also granted deferred stock units (“DSUs”), or comparable equity-based awards, each year at the time of the annual meeting of stockholders. The number of DSUs granted is determined by dividing the dollar value of the grant by the closing price of Redwood’s common stock on the NYSE on the day of grant (and rounding to the nearest whole share amount). In May 2024, non-employee directors received an annual DSU award with a grant date value of $125,000.
On the 2025 Annual Meeting date, non-employee directors who are re-elected will receive an annual grant of vested DSUs for the May 2025 to May 2026 annual period determined by dividing $130,000 by the closing price of Redwood’s common stock on the meeting date. Non-employee directors may also be granted equity-based awards upon their initial election to the Board. These initial and annual DSU grants are fully vested upon grant, and they are generally subject to a mandatory three-year holding period. Dividend equivalent rights on DSUs are generally paid in cash to directors on each dividend distribution date.
In November 2024, following a review of director compensation by the Compensation Committee and Governance and Nominating Committee, with the assistance of the Compensation Committee’s independent compensation consultant, Semler Brossy Consulting Group, LLC (“Semler Brossy”), the Board of Directors approved certain changes to the compensation program for non-employee directors for the May 2025 to May 2026 annual compensation cycle, as described below. In connection with this review, Semler Brossy conducted an independent review of Redwood’s non-employee director compensation program at the request of the Compensation Committee. The review conducted by Semler Brossy included a comparison against non-employee director compensation at the companies that comprise Redwood's executive compensation peer group. The changes to the program, effective beginning with the May 2025 to May 2026 annual period, are intended to keep Redwood’s total average annual compensation for non-employee directors at or near the compensation peer group median. Further detail regarding the executive compensation peer group is provided on pages 56 - 57 of this Proxy Statement under the heading “Executive Compensation in 2024 — Compensation Peer Group for 2024.” In particular, the Board approved the following changes, in each case effective beginning with the May 2025 to May 2026 annual period: an increase to the annual cash retainer for Board service from $90,000 to $100,000 (an increase of $10,000); an increase in the value of the annual equity award grant for Board service from $125,000 to $130,000 (an increase of $5,000); and an increase to the annual cash retainer for service as Board Chair from $120,000 to $135,000 (an increase of $15,000).
Each director may elect to defer receipt of cash compensation or dividend equivalent rights through Redwood’s Executive Deferred Compensation Plan. Cash balances in the Executive Deferred Compensation Plan are unsecured liabilities of Redwood and are utilized by Redwood as available capital to fund investments and operations. Based on each director’s election, deferred compensation can either be deferred into a cash account and earn a rate of return that is equivalent to 120% of the applicable long-term federal rate published by the IRS compounded monthly or be deferred into deferred stock units which will, among other things, entitle them to receive dividend equivalent rights related to those units.
Each year the Compensation Committee and Governance and Nominating Committee review Redwood’s compensation of non-employee directors with the assistance of the Compensation Committee’s independent compensation consultant. Any changes to non-employee director compensation recommended by these Committees are subject to review and approval by the Board. These Committees intend to complete their annual review of Redwood’s non-employee director compensation prior to year-end in 2025, when updated comparative compensation data will be available. Any changes to non-employee director compensation that are approved by the Board following this 2025 review may increase or decrease non-employee director compensation for the May 2025 to May 2026 annual period and/or May 2026 to May 2027 annual period from the amounts set forth in the “Non-Employee Director Cash Compensation” table on the preceding page.
The following table provides information on non-employee director compensation for the 2024 calendar year. Director compensation is set by the Board and is subject to change. Directors who are employed by Redwood do not receive any compensation for their Board activities and do not appear in the following table.
Non-Employee Director Compensation — 2024
| | | | | | | | | | | | | | | | | | | | | | | | | | |
| Current Non-Employee Directors | | Fees Earned or Paid in Cash ($)(1) | | Stock Awards ($)(2)(3) | | All Other
Compensation
($) | | Total
($) |
| Doneene K. Damon | | $ | 115,000 | | | $ | 124,999 | | | — | | $ | 239,999 | |
| Armando Falcon | | $ | 135,000 | | | $ | 124,999 | | | — | | $ | 259,999 | |
| Douglas B. Hansen | | $ | 98,000 | | | $ | 124,999 | | | — | | $ | 222,999 | |
| Debora D. Horvath | | $ | 135,000 | | | $ | 124,999 | | | — | | $ | 259,999 | |
| Greg H. Kubicek | | $ | 235,000 | | | $ | 124,999 | | | — | | $ | 359,999 | |
| Georganne C. Proctor | | $ | 145,000 | | | $ | 124,999 | | | — | | $ | 269,999 | |
| Faith A. Schwartz | | $ | 115,000 | | | $ | 124,999 | | | — | | $ | 239,999 | |
_____________________________
(1)Fees earned are based on the non-employee director compensation policy in place for 2024: (i) annual cash retainer of $90,000; (ii) additional annual retainer for the Chair of the Board of $120,000; (iii) additional annual cash retainer for Audit Committee Chair and Governance and Nominating Committee Chair of $20,000 and for Compensation Committee Chair of $30,000; (iv) invitational committee fees of $2,000 (in person) and $1,000 (telephonic); and (v) an annual committee retainer of $12,500 per committee.
(2)Stock awards consisted of grants of vested DSUs. The value of DSUs awarded was determined in accordance with FASB Accounting Standards Codification Topic 718. Information regarding the assumptions used to value grants of DSUs is provided in Note 21 to our consolidated financial statements included in Redwood’s Annual Report on Form 10-K filed on March 3, 2025. The value of dividend equivalent rights associated with DSUs was taken into account in establishing the value of these DSUs and previously granted DSUs. Therefore, dividend equivalent rights payments made during 2024 to non-employee directors are not considered compensation or other amounts reported in the table above.
(3)As of December 31, 2024, the aggregate number of stock awards/DSUs outstanding for each then-serving non-employee director was as follows: Doneene K. Damon had 37,033 vested DSUs, Armando Falcon had 54,942 vested DSUs, Douglas B. Hansen had 53,914 vested DSUs; Debora D. Horvath had 102,579 vested DSUs; Greg H. Kubicek had 466,842 vested DSUs; Georganne C. Proctor had 227,941 vested DSUs; and Faith A. Schwartz had 54,942 vested DSUs. Additional information regarding ownership of shares of common stock/DSUs by non-employee directors is set forth on page 29 of this Proxy Statement.
The following table provides information on deferred stock unit distributions in the form of common stock to non-employee directors from our Executive Deferred Compensation Plan in 2024. Deferred stock units distributed represent compensation previously granted or deferred in prior years and were reported as director compensation in those prior years.
| | | | | | | | | | | | | | | | | |
| Current Non-Employee Directors | | DSUs Distributed in 2024 (#)(1) | | Aggregate Value of DSUs Distributed in 2024 ($)(2) |
| Armando Falcon | | | 10,054 | | $ | 64,044 | |
| Douglas B. Hansen | | 10,054 | | $ | 64,044 | |
| Debora Horvath | | 27,528 | | $ | 160,677 | |
| Faith A. Schwartz | | | 10,054 | | $ | 64,044 | |
(1)Mr. Falcon, Mr. Hansen, Ms. Horvath, and Ms. Schwartz’s 2024 DSU distributions included annual grants awarded in 2021. In addition, Ms. Horvath’s 2024 DSU distributions also included directors fees earned in 2022 which she elected to defer into DSUs under Redwood’s Executive Deferred Compensation Plan.
(2)The aggregate value of DSUs distributed is calculated by multiplying the number of DSUs distributed by the fair market value of Redwood common stock on the date of distribution.
INFORMATION ABOUT OUR EXECUTIVE OFFICERS
Executive officers of Redwood as of the date of this Proxy Statement are listed in the table below.
| | | | | | | | | | | | | | |
| Name | | Position | | Age |
| Christopher J. Abate | | Chief Executive Officer | | 45 |
| Dashiell I. Robinson | | President | | 45 |
| Brooke E. Carillo | | Chief Financial Officer | | 38 |
| Andrew P. Stone | | Executive Vice President, Chief Legal Officer and Secretary | | 54 |
| Sasha G. Macomber | | Chief Human Resource Officer | | 56 |
Biographical information regarding these executive officers is set forth below.
Christopher J. Abate, age 45, has served as Chief Executive Officer since May 2018 and as a director since December 2017. Mr. Abate has been employed with Redwood since April 2006, previously serving as Redwood’s President from July 2016 to May 2018, Chief Financial Officer from March 2012 to August 2017, and Controller from January 2009 to March 2013. From October 2019 to December 2021, Mr. Abate served as Chair of the Board of Structured Finance Association. Before joining Redwood, Mr. Abate was employed by PricewaterhouseCoopers LLP. He holds a B.A. in accounting and finance from Western Michigan University, an M.B.A. from the University of California at Berkeley and Columbia University.
Dashiell I. Robinson, age 45, has served as Redwood’s President since December 2017 and as a director since August 2021. Prior to joining Redwood in September 2017, Mr. Robinson was employed at Wells Fargo Securities, serving as the Head of Mortgage Finance within the Asset-Backed Finance Group. In that role, Mr. Robinson led a team of banking professionals responsible for financing and distributing an array of residential mortgage products, and serving a broad suite of the firm's operating and investing clients. Prior to his employment at Wells Fargo, Mr. Robinson was employed within the Structured Credit Products Group at Wachovia Capital Markets from 2001 to 2008, serving in banking, structuring and risk mitigation roles. Mr. Robinson also serves as a member of the Board of Directors of the Jewish Community Center of San Francisco. Mr. Robinson holds a B.A. in English from Georgetown University.
Brooke E. Carillo, age 38, serves as Chief Financial Officer of Redwood Trust, Inc. Prior to joining Redwood in May 2021, Ms. Carillo was employed at Annaly Capital Management, Inc., most recently serving as the Head of Corporate Development and Strategy. In that role, Ms. Carillo led the corporate strategy, capital markets and investor relations departments, and served on the firm's Operating Committee. Prior to her joining Annaly in 2010, Ms. Carillo worked in investment banking within the Financial Institutions Group at Bank of America Merrill Lynch. Ms. Carillo holds a B.S. in Economics from Duke University.
Andrew P. Stone, age 54, serves as Executive Vice President, Chief Legal Officer and Secretary of Redwood Trust, Inc. Mr. Stone has been employed by Redwood since December 2008. Prior to joining Redwood, he served as Deputy General Counsel of Thomas Weisel Partners Group, Inc. from 2006 to 2008 and between 1996 and 2006 practiced corporate and securities law at Sullivan & Cromwell LLP and Brobeck, Phleger & Harrison LLP. Mr. Stone holds a B.A. in mathematics and history from Kenyon College and a J.D. from New York University School of Law.
Sasha G. Macomber, age 56, serves as Chief Human Resource Officer of Redwood Trust, Inc. Ms. Macomber has been employed by Redwood since 2018. Prior to joining Redwood, Ms. Macomber spent eleven years with Peet’s Coffee in the San Francisco Bay Area, leading various aspects of human resources including talent acquisition, talent management, HR business partnerships, employee engagement, and leadership communications. Ms. Macomber has also held HR leadership roles within consumer goods and technology companies, including The North Face, Room & Board, and QRS Corporation. Ms. Macomber has a B.A. degree in English Literature from Mills College and a M.S. in Organizational Development from the University of San Francisco.
SECURITY OWNERSHIP OF DIRECTORS AND EXECUTIVE OFFICERS
The following table sets forth information, as of March 27, 2025, about the beneficial ownership of our capital stock by our current directors and executive officers, our NEOs and by all of our current directors, executive officers, and NEOs as a group. As indicated in the notes, the table includes certain common stock equivalents held by these individuals through Redwood-sponsored plans and benefits programs. Except as otherwise indicated and for such power that may be shared with a spouse, each person has sole investment and voting power with respect to the shares shown to be beneficially owned. Beneficial ownership is determined in accordance with SEC rules.
| | | | | | | | | | | | | | | | | |
| Executive Officers and NEOs | | Shares of Capital Stock Beneficially Owned(1) | | Percent of Class(2) | |
Christopher J. Abate(3) | | 641,238 | | * | |
Dashiell I. Robinson(4) | | 471,767 | | * | |
Brooke E. Carillo(5) | | 458,664 | | * | |
Andrew P. Stone(6) | | 228,356 | | * | |
Sasha G. Macomber(7) | | 140,128 | | * | |
| | | | | |
| Non-Employee Directors | | | | | |
Doneene K. Damon(8) | | 37,033 | | * | |
Armando Falcon(9) | | 71,752 | | * | |
Douglas B. Hansen(10) | | 481,838 | | * | |
Debora D. Horvath(11) | | 177,068 | | * | |
Greg H. Kubicek(12) | | 575,209 | | * | |
Georganne C. Proctor(13) | | 227,941 | | * | |
Faith A. Schwartz(14) | | 71,752 | | * | |
All directors, executive officers, and NEOs as a group (12 persons)(15) | | 3,582,746 | | 2.7% | |
* Less than 1%.
(1)Represents shares of common stock outstanding and common stock underlying deferred stock units and performance stock units that have vested or will vest within 60 days of March 27, 2025. Redwood’s directors and executive officers collectively own zero shares of the Company’s preferred stock.
(2)Based on 132,982,863 shares of our common stock outstanding as of March 27, 2025. All references to vested Deferred Stock Units (“DSUs”) in the footnotes below include vested DSUs scheduled to vest within 60 days of March 27, 2025.
(3)Includes 444,170 shares of common stock and 197,068 DSUs.
(4)Includes 248,172 shares of common stock and 223,595 DSUs.
(5)Includes 56,772 shares of common stock and 401,892 DSUs.
(6)Includes 149,671 shares of common stock and 78,685 DSUs.
(7)Includes 61,443 shares of common stock and 78,685 DSUs.
(8)Includes 37,033 DSUs.
(9)Includes 16,810 shares of common stock and 54,942 DSUs.
(10)Includes 427,924 shares of common stock and 53,914 DSUs.
(11)Includes 74,489 shares of common stock and 102,579 DSUs.
(12)Includes 106,454 shares of common stock held in direct ownership, living trusts and through an unaffiliated pension plan, 1,913 shares held of record by Mr. Kubicek’s spouse, and 466,842 DSUs.
(13)Includes 227,941 DSUs.
(14)Includes 16,810 shares of common stock and 54,942 DSUs.
(15)Includes 1,604,628 shares of common stock and 1,978,118 DSUs.
SECURITY OWNERSHIP OF CERTAIN BENEFICIAL OWNERS
The following table sets forth information as of the dates noted below, with respect to shares of our common stock owned by each person or entity known by us to be the beneficial owner of approximately 5% or more of our common stock.
| | | | | | | | | | | | | | |
| Name of Beneficial Owner | | Shares of Common Stock
Beneficially Owned | | Percent of Class(1) |
BlackRock, Inc.(2) | | 19,932,048 | | 15.0 | % |
The Vanguard Group(3) | | 12,973,503 | | 9.8 | % |
Wellington Management Group, LLP(4) | | 11,369,304 | | 8.5 | % |
(1)Based on 132,982,863 shares of our common stock outstanding as of March 27, 2025.
(2)Address: 50 Hudson Yards, New York, New York 10001. The information in the above table and this footnote concerning the shares of common stock beneficially owned by BlackRock, Inc. (BlackRock) is based on the amended Schedule 13G/A filed by BlackRock with the SEC on January 22, 2024, which indicates that BlackRock and certain other subsidiary entities make aggregate reports on Schedule 13G and that such entities, in the aggregate as of December 31, 2023, had sole dispositive power with respect to 19,932,048 shares and sole voting power with respect to 19,635,803 shares.
(3)Address: 100 Vanguard Boulevard, Malvern, Pennsylvania 19355. The information in the above table and this footnote concerning the shares of common stock beneficially owned by The Vanguard Group (Vanguard) is based on the amended Schedule 13G/A filed by Vanguard with the SEC on February 13, 2024, which indicates that Vanguard and certain other subsidiary entities make aggregate reports on Schedule 13G and that such entities, in the aggregate as of December 29, 2023, had sole dispositive power with respect to 12,782,563 shares, shared dispositive power with respect to 190,940 shares, and shared voting power with respect to 73,186 shares.
(4)Address: 280 Congress Street, Boston, Massachusetts 02210. The information in the above table and this footnote concerning the shares of common stock beneficially owned by Wellington Management Group, LLP (Wellington) is based on the amended Schedule 13G/A filed by Wellington with the SEC on February 10, 2025, which indicates that Wellington and certain other affiliated entities make aggregate reports on Schedule 13G and that such entities, in the aggregate as of December 31, 2024, did not have sole dispositive power over any shares, and had shared dispositive power with respect to 11,369,304 shares and shared voting power with respect to 11,107,755 shares.
EXECUTIVE COMPENSATION
Table of Contents
| | | | | |
| Executive Summary of Compensation Discussion and Analysis | 32 |
| Compensation Discussion and Analysis (CD&A) | 47 |
| Section I - Introduction | 47 |
| Named Executive Officers | 47 |
| Compensation Committee | 47 |
| Redwood’s Business Model and Internal Management Structure | 48 |
| Overall Compensation Philosophy and Objectives | 49 |
| Outreach to Stockholders | 50 |
| Stockholder Feedback | 51 |
| Section II - Executive Compensation in 2024 | 52 |
| Redwood’s 2024 Performance | 52 |
| Elements of Compensation in 2024 | 53 |
| Process for Compensation Determinations for 2024 | 54 |
| Compensation Peer Group for 2024 | 56 |
| 2024 Base Salaries | 57 |
| 2024 Performance-Based Annual Bonus Compensation | 58 |
| Performance-Based Annual Bonuses Earned for 2024 | 62 |
| 2024 Long-Term Equity-Based Incentive Awards | 66 |
| Vesting and Mandatory Holding Periods for 2024 Long-Term Equity-Based Incentive Awards | 69 |
| Pay-for-Performance Outcomes from Long-Term Equity-Based Incentive Awards | 70 |
| Section III - Other Compensation, Plans and Benefits | 72 |
| Deferred Compensation | 72 |
| Employee Stock Purchase Plan | 72 |
| 401(k) Plan and Other Matching Contributions | 73 |
| Other Compensation and Benefits | 73 |
| Severance and Change of Control Arrangements | 73 |
| Section IV - Compensation-Related Policies and Tax Considerations | 75 |
| Mandatory Executive Stock Ownership Requirements | 75 |
| Prohibition on Use of Margin, Pledging, and Hedging in Respect of Redwood Securities | 75 |
| Clawback Policy | 76 |
| Tax Considerations | 76 |
| Accounting Standards | 76 |
| Section V - Conclusion | 77 |
| Certain Compensation Determinations Relating to 2025 | 77 |
| 2025 Maximum Total Annual Bonus | 78 |
| Compensation Committee Report | 78 |
| Executive Compensation Tables | 79 |
| Compensation Risks | 92 |
| CEO Pay Ratio | 93 |
| Pay vs. Performance Comparison | 94 |
| | |
| COMPENSATION DISCUSSION & ANALYSIS (CD&A) – EXECUTIVE SUMMARY |
Introductory Remarks of the Compensation Committee Chair
In 2024 the Compensation Committee administered and oversaw an executive compensation program that had been updated and modified over the past several years to reflect Redwood’s evolving business and operating environment, as well as meaningful feedback from stockholders. While significant changes to the structure of the program were implemented in 2022 and 2023 (and detailed in our previously published CD&As), the focus continued to be on maintaining a pay-for-performance program that aligns management with stockholders and incentivizes the achievement of the Company’s short- and long-term strategic, financial and operational objectives.
In the Executive Summary of CD&A that follows, we review the key elements of the executive compensation program at Redwood and, using the CEO as an example, illustrate how we believe that the level of executive compensation realized in 2024 was aligned with the Company’s financial and operating results, on both an absolute and relative basis, as well as with its strategic and business positioning. A review of the compensation of all of the named executive officers, and a deeper level of detail with respect to the CEO, is provided in the full CD&A section of this annual proxy statement, together with the Executive Compensation Tables and additional disclosures that follow the CD&A.
As we engaged with stockholders over the past several years, we found that there is general consensus that a company’s executive compensation program, and the manner in which it is structured, occupies a key intersection point where the following meet:
▪the ability to attract and retain talent in a competitive environment;
▪the establishment of rigorous goals that incentivize and reward strong performance and adjust pay realization downward for below-target performance; and
▪the focus of management’s time, energy and resources on the strategic and operational goals that are critical to Redwood’s long-term and sustainable growth and profitability.
Our program seeks to balance these important aspects within a multi-faceted structure that strongly promotes stockholders’ interests.
As stockholders review this CD&A in advance of the Company’s 2025 Annual Meeting, I look forward to outreach and dialogue regarding the executive compensation program, hearing the feedback and differing perspectives that stockholders provide, and sharing them with the full Committee and Board. The level of meaningful engagement by our stockholders is valuable to us and we are grateful for the time and effort that is dedicated to understanding our compensation program and the pay-for-performance principles implemented within it.
Georganne C. Proctor,
Chair – Compensation Committee
| | |
| COMPENSATION PHILOSOPHY – BEST PRACTICES AND RISK MITIGANTS |
| | |
Performance-Based Executive Compensation Redwood’s pay-for-performance compensation program is administered by the independent Compensation Committee of the Board of Directors (the Committee) and is designed to: ▪Incentivize attainment of business goals and sustainable stockholder returns, including: ▪Generating attractive returns-on-equity, measured on both a GAAP and non-GAAP basis, that support regular and growing dividends and increasing book value; and ▪Meeting annual strategic, operational and risk-management goals. ▪Align the interests of executives with those of long-term stockholders in achieving strong stockholder returns, in absolute terms and relative to other mortgage REITs and small-cap financial services firms. ▪Enable Redwood to hire and retain executives with extensive mortgage, investment and financial services expertise in a competitive marketplace. ▪Peer and broader market compensation data is used to compare and evaluate compensation program structure, as well as target levels of executive compensation. ▪Avoid incentivizing inappropriate risk taking. Best Practices and Risk Mitigants The Committee seeks to incorporate best practices into Redwood’s executive compensation program, including by retaining a nationally recognized independent compensation consultant (Semler Brossy) to advise it. A summary of key best practices and risk mitigants that are part of the compensation program are set forth below. |
| | | | | | | | | | | | | | | | | | | | |
| Executive Compensation – Key Best Practices & Risk Mitigants |
|
| What Redwood Does | | What Redwood Does Not Do | |
| ü | Directly links annual bonuses to Redwood’s financial and operating performance, as well as to strategic and risk management-related goals | | × | No uncapped annual bonuses, with individual performance component and total bonus amount each subject to caps | |
| ü | Uses profitability- and return-based financial metrics, including total stockholder return (TSR), to support alignment with stockholders | | × | No revenue- or volume-based financial metrics are used in a manner that could incentivize inappropriate risk taking | |
| ü | Imposes three- or four-year performance/ vesting/holding periods on equity-based awards to executives(1) | | × | No above-target vesting of PSUs if absolute TSR over the three-year performance measurement period is negative | |
| ü | Provides the Compensation Committee discretion to reduce annual bonus amounts | | × | No “single-trigger” change-in-control severance or equity award acceleration | |
| ü | Maintains robust stock ownership require-ments for executives, with CEO subject to a peer-leading ownership requirement(2) | | × | No excise tax gross-up payments for any change-in-control related severance or other payments | |
| ü | Maintains a compensation “clawback” policy in line with requirements of the NYSE and the Dodd-Frank Act | | × | No margin, pledging, or hedging transactions permitted with respect to Redwood’s common or preferred stock | |
Endnotes are set forth on page 44, following the conclusion of this Executive Summary.
| | |
| STOCKHOLDER OUTREACH AND ENGAGEMENT |
Redwood’s Stockholder Outreach and Engagement
During 2024 Redwood continued its long-standing commitment to outreach and engagement with stockholders regarding executive compensation. Engagement with institutional stockholders is generally led by the Chair of the Committee and conducted primarily through virtual meetings and conference calls. Together with the Committee Chair, Redwood’s outreach team includes key members of the Company’s Investor Relations, Human Resources, Finance and Corporate Secretary departments.
| | | | | | | | |
Outreach and Engagement During 2024(3) | |
|
| | |
Outreach in 2024. In connection with the May 2024 annual meeting, Redwood undertook an outreach effort reaching institutional stockholders holding 90% of our common shares held by institutions. (These stockholders represented 72% of all outstanding shares of common stock.) | |
|
Response/Direct Engagement: Redwood received responses from and/or directly engaged with institutional stockholders holding 46% of our common shares held by institutions. (These stockholders represented 37% of all outstanding shares of common stock.) | |
“Say-on-Pay” Support”: At Redwood’s May 2024 annual meeting, 91.3% of stockholders voted in support for “Say-on-Pay”. This high level of support is reflective of the generally positive “Say-on-Pay” voting support that stockholders have provided following the May 2022 annual meeting of stockholders. ▪Excluding the low level of support received in May 2022, stockholders have provided an average of approximately 90% support since the inception of “Say-on-Pay” voting at Redwood. | |
Stockholder Feedback in 2024 As described above, in 2024 the Committee Chair and Redwood’s outreach team continued its practice of engaging with stockholders regarding executive compensation. Engagement was focused primarily on continuing proactively to gather feedback and perspectives on the changes to the design and structure of the executive compensation program that had been implemented by the Committee following the 2022 annual meeting of stockholders. Based on the extensive stockholder outreach conducted over the prior two years, many of the stockholders that were contacted responded that engagement in prior years had supported their understanding and support for the compensation program, without the need for direct engagement in 2024. Stockholders who did directly engage in 2024 were focused on understanding how stockholder concerns raised in 2022 had been fully addressed by the changes to the program over the course of 2022 and 2023 and were focused on how financial performance targets were established and the levels of compensation realized for performance at, above and below those target levels. | |
Endnotes are set forth on page 44, following the conclusion of this Executive Summary.
| | |
| CEO’S TARGET COMPENSATION STRUCTURE – OUTSET OF 2024 |
Elements of CEO’s Target Compensation Structure – Outset of 2024
Entering 2024, the Committee structured target compensation for Redwood’s CEO as illustrated in the chart below. As described further herein, the Committee’s determinations were made after taking into account Redwood’s business model and outlook, strategic and operational objectives, stockholder feedback and an overall review of the structure of Redwood’s executive compensation program compared to peers and competitive practice.
| | | | | | | | |
| | |
Key Highlights – CEO’s Target Compensation at Outset of 2024 |
| | |
| | |
Long-Term Incentives: Long-term equity-based incentive (LTI) awards continued to be the predominant element of target compensation for the CEO at the outset of 2024. ▪55% of LTI awards granted at year-end 2023 (as part of target compensation for 2024) were in the form of PSUs with a 3-year performance measurement/vesting period beginning on January 1, 2024. Performance-Based/Value at Risk: Elements of compensation in the form of LTI awards and/or with value at risk comprised approximately 85% of the CEO’s target compensation at the outset of 2024 – with annual bonus realization based on 2024 returns and PSU value realization driven by book value TSR and relative TSR over the 2024-2026 three-year period. Limited Fixed Compensation: Fixed elements (salary and benefits) represented approximately 15% of the CEO’s target compensation at the outset of 2024.
| |
|
| _____________________________ *The CEO’s target annual compensation at the outset of 2024 was comprised of the following elements: base salary of $950,000; target 2024 annual bonus of $1.9 million; $94,917 value of benefits; PSUs awarded at year-end 2023 with a grant date value of $2.3 million; and DSUs/csRSUs awarded at year-end 2023 with a grant date value of $1.8 million. Discussion of the CEO’s LTI awards granted at year-end 2024 and other elements of the CEO’s target annual compensation at the outset of 2025 are set forth below under “CEO’s Target Compensation Structure – Outset of 2025.” |
| | |
| | |
| REDWOOD’S 2024 ANNUAL FINANCIAL PERFORMANCE |
Key Financial Performance and Return Metrics
Redwood’s business includes two mortgage banking platforms – Sequoia and CoreVest – that originate and/or transact in residential mortgage loans. These operating businesses generate mortgage banking revenue and create investments to hold as portfolio assets. Investments that Redwood creates, together with other mortgage- and housing-related assets Redwood invests in, comprise the Redwood Investments portfolio that Redwood manages and through which it generates interest income and gains. Based on this business model, the Committee has viewed GAAP and non-GAAP return-on-equity metrics as highly relevant to measuring annual performance and driving annual bonus realization for executives, while stockholder return metrics, including book value TSR (bvTSR), as well as absolute TSR and relative TSR (rTSR), are drivers of vesting and value realization from executives’ long-term equity-based incentive compensation.
As further described in the full CD&A that follows, measurement of Redwood’s financial performance using these types of metrics is structurally incorporated into Redwood’s executive compensation program, along with consideration of operational metrics and satisfaction of other business, risk-management and strategic objectives that we believe will drive profitable and sustainable growth.
| | | | | | | | | | | | | | |
| Annual Financial Performance – 2024 | |
| |
| | | | |
| Positive Performance, but Below Internal Targets for Financial Performance: Overall, 2024 presented a challenging market and operating environment for Redwood and its closest industry peers. Key financial performance metrics for full-year 2024 for Redwood were: ▪Return on Common Equity (ROE): 4.1% ▪Non-GAAP EAD ROE(4): 6.4% ▪Book Value TSR(5): 5.7% ▪Quarterly Dividend: Increased to $0.18 per share in the fourth quarter of 2024, a 12.5% increase from fourth quarter of 2023 Significant volatility in key benchmark interest rates over the course of the year resulted in below-target performance on an absolute basis compared to Committee-established targets. On a relative basis, 2024 bvTSR and 2024 ROE were above certain peers and below others, as illustrated in the accompanying graphs. | | | |
| | |
| Below Target Annual Bonus Compensation: As further detailed on the following page, Redwood’s annual financial performance for 2024 was below the targets established by the Committee, which drove below-target annual bonus realization for Redwood’s CEO. | |
| | | | |
| | | | |
Endnotes are set forth on page 44, following the conclusion of this Executive Summary.
| | |
| REDWOOD’S 2024 OPERATIONAL/STRATEGIC PERFORMANCE |
2024 Operational Performance and Strategic Milestones
As noted above, a component of Redwood’s executive compensation program is focused on individual performance as measured by various operational metrics, as well as by the achievement of articulated strategic and risk management-related goals and other enterprise-wide priorities. Below is a summary of various accomplishments during 2024, including certain that were taken into account by the Committee in determining the CEO’s (and the other executive officers’) individual component of annual bonus for 2024, with an additional review set forth in the full body of CD&A that follows.
| | | | | | | | |
| 2024 Strategic and Operational Achievements |
|
| | |
| Leading into 2024, the Company began implementing a number of strategies meant to support performance in 2024 and beyond, including: enhancing capital and operational efficiency; expanding our product sets; diversifying distribution channels; and expanding relationships with bank counterparties. Accordingly, a key goal for management in 2024 was to execute on the objectives, preparation and foundation established to support these strategic initiatives. As further described below, actions taken in 2024 had both near- and long-term benefits and management continues to focus on forward-looking initiatives and actions that are designed to positively impact future returns. Sequoia Mortgage Banking Through our Sequoia business, we acquire residential mortgage loans (primarily “jumbo” mortgage loans) from third-party originators (which we refer to as “sellers”) and typically distribute these loans through subsequent sale to whole loan buyers or securitization through our SEMT® securitization program. Sequoia Mortgage Banking – Key Achievements in 2024: ▪Made further market-share and wallet-share inroads with our network of loan sellers, including the following achievements: ▪Locked $9.0 billion of loans (a 158% increase relative to 2023).(8) ▪Grew market share to 4-5%, up from our historical range of 1-2%.(9) ▪Ended 2024 with approximately 210 loan seller relationships – across banks, independent mortgage companies and other counterparties. ▪Distributed $6.9 billion of loans, including $5.2 billion through twelve SEMT® securitizations and $1.7 million through whole loan sales, almost four times our 2023 distribution volumes: ▪Maintained our position as the largest non-bank distributor of jumbo loans, supported by our most active year securitizing loans since 2013.(10) ▪Ongoing engagements with bank partners led to a resurgence of whole loan transactions in the fourth quarter 2024, with distribution of $1.4 billion of whole loans in the fourth quarter 2024, our highest level since the first quarter of 2022. ▪Launched new or enhanced loan acquisition programs, including for closed-end second (“CES”) lien loans and adjustable-rate mortgages (“ARMs”). ▪Improved business profitability, with Sequoia Mortgage Banking segment delivering a GAAP return on capital of 22% in 2024 relative to 10% in 2023.(11) ▪A combination of growth, scale and hedging contributed to ongoing improvement in overall efficiency metrics: our 2024 cost per loan of 29 basis points was significantly lower than 2023 (a 59% improvement) and better than our target range of 0.30% to 0.35%.(12) (continued on next page)
| |
Endnotes are set forth on pages 44-45, following the conclusion of this Executive Summary.
| | |
| REDWOOD’S 2024 OPERATIONAL/STRATEGIC PERFORMANCE (CONT.) |
| | | | | | | | |
| 2024 Strategic and Operational Achievements (cont.) |
|
| | |
| Sequoia Mortgage Banking – Key Actions Taken in 2024 for Future Positioning: ▪Grew financing capabilities and capacity to $2.2 billion at year-end (up 89% from $1.2 billion at year-end 2023) to support growth objectives and maintained a diversified distribution strategy across capital markets executions and whole loan sales – a strong foundation that will continue to support future growth across varying market environments. ▪Grew suite of products, including groundwork for early-2025 launch of expanded programs to support underserved part of the housing finance market. ▪Initiated process to incorporate and leverage the use of artificial intelligence (AI) tools and other emerging technologies to enhance speed and efficiency of our operational processes, including hiring new Chief Technology Officer with experience implementing AI technology within mortgage origination/finance platforms. CoreVest Mortgage Banking CoreVest originates and acquires residential investor mortgage loans (also known as business purpose mortgage loans) for subsequent distribution through our CAFL® securitization program, sale to whole loan buyers, or transfer into one of our joint ventures or our Redwood Investments portfolio. These loans are generally secured by residential single-family rental and multifamily rental properties, which we classify as either “term” loans (which include fixed-rate loans with maturities that generally range from 3 to 30 years) or “bridge” loans (which include floating-rate loans with maturities that generally range between 12 and 36 months). CoreVest Mortgage Banking – Key Achievements in 2024: ▪Funded $1.7 billion of loans (a 9% increase relative to 2023), including $1.0 billion of bridge loans and $0.7 billion of term loans: ▪Term loan production increased 39% relative to 2023, supported by increased demand for fixed-rate products. In response to market dynamics, bridge loan production was focused on key strategies, such as single-asset bridge loans (“SAB”) and debt service coverage ratio loans (“DSCR”). ▪SAB production in 2024 nearly doubled relative to 2023 and DSCR production in 2024 increased 10 times relative to 2023. ▪64% of units in rental properties that CoreVest has provided long-term financing for are considered affordable housing, a segment of the market that is supported by strong forward-looking supply-demand dynamics. (13) ▪Executed strategic relationship with CPP Investments, which included a joint venture to fund term and bridge loans; and added new whole loans buyers to our distribution network. ▪Distributed $1.5 billion of loans, including $0.8 billion through joint ventures, $0.3 billion through securitization transactions and $0.4 billion through whole loan sales. ▪Joint venture distributions increased by nearly 10 times compared to 2023, growing sequentially in each quarter of 2024; and our 2024 distribution efforts included our first securitization of loans held by our joint venture with CPP Investments. ▪Improved business profitability, with CoreVest Mortgage Banking segment delivering positive GAAP return on capital in 2024 relative to a loss in 2023. ▪Focus on operations and overhead expense contributed to ongoing improvement in overall efficiency metrics: our 2024 net cost to originate of 1.14% was significantly lower than 2023 (a 27% improvement) and at the lower end of our target range of 1.00% to 1.50%.(14) (continued on next page)
| |
Endnotes are set forth on page 45, following the conclusion of this Executive Summary.
| | |
| REDWOOD’S 2024 OPERATIONAL/STRATEGIC PERFORMANCE (CONT.) |
| | | | | | | | |
| 2024 Strategic and Operational Achievements (cont.) |
|
| | |
| CoreVest Mortgage Banking – Key Actions Taken in 2024 for Future Positioning: ▪Strengthened distribution channels, including broadening network of whole loan buyers, and expanded product set with guideline enhancements for key loan strategies. ▪Launched joint venture with CPP Investments enhanced forward-looking scale, distribution, fee streams and earnings power of the CoreVest Mortgage Banking business. ▪Initiated process to incorporate and leverage the use of artificial intelligence (AI) tools and other emerging technologies to enhance speed and efficiency of our operational processes. Portfolio Investments & Portfolio Financing Redwood’s investment portfolio, Redwood Investments, consists of residential housing-related assets created through our mortgage banking businesses or acquired from third parties, with approximately 78% of this portfolio at year-end 2024 having been created from our operating platforms. Redwood Investments has been carefully constructed over time and expresses our view on the long-term value in residential housing credit. Portfolio Investments & Financing – Key Achievements in 2024: ▪Deployed $525 million of capital into accretive investments, both created by our operating platforms and acquired from third-parties, a 140% increase relative to 2023. ▪Established $250 million revolving financing facility as part of executing strategic relationship with CPP Investments. ▪Organically unlocked nearly $300 million of capital through financing optimization and establishment of new warehouse lines, including executing two re-securitizations. ▪Raised $145 million of gross proceeds across two senior unsecured bond offerings: our inaugural offering of this product in January 2024 and a second offering in June 2024. ▪Grew excess warehouse financing capacity to $4.5 billion (up from $2.3 billion as of year-end 2023) to support operating businesses and growth objectives. ▪Through repayments and repurchases (at a discount to par), reduced convertible debt outstanding by 27% year-over-year. ▪Management of convertible debt position also included completion of an opportunistic $40 million reopening of our 7.75% convertible notes due 2027, effectively extending the overall maturity profile of our convertible debt outstanding. Key Actions Taken in 2024 for Future Positioning: ▪Through actions noted above, significantly enhanced overall capital, liquidity and financing position, supporting forward-looking growth objectives for our mortgage banking businesses and future capital deployment opportunities for our Redwood Investments portfolio. ▪Investments made in 2024 were focused on generating strong returns and contributing to stockholder value over both the near- and long-term.
| |
| | |
| CEO’S BONUS REALIZATION – 2024 |
CEO’S Annual Bonus Realization – 2024
Our CEO’s 2024 annual bonus was earned primarily based on performance against financial targets designated by the Committee at the outset of 2024, as well as achievement of pre-established strategic, operational and related goals.
| | | | | | | | | | | | | | |
| Key Highlights CEO’S 2024 Annual Bonus Realization | |
| |
| | | | |
| Overall Below-Target Bonus Realization: Overall, the CEO’s realized bonus of $1.57 million for 2024 represented 83% of his target bonus amount, primarily due to below-target financial performance. Below-Target Company Financial Performance: Financial performance for 2024 was below target, resulting in only 67% of target amount being realized for this component of annual bonus. ▪In particular, Redwood’s 2024 financial performance fell short of the Committee’s Adjusted ROE target for 2024 of 11.5% and its Adjusted EAD ROE target for 2024 of 6.5%.(15) A further discussion of these non-GAAP financial performance measures and the Committee’s process for setting these target performance levels is set forth within the full CD&A that follows. Above-Target Individual Performance: While market conditions impacted the ability of the Company to meet the financial performance targets established by the Committee, actions taken by management in 2024 relating to strategic, operational and risk-management goals had both near- and long-term benefits that should positively impact future returns. As a result, the individual performance component of the CEO’s bonus in 2024 was realized above target based on the Committee’s assessment of strong performance relating to strategic, operational and related goals. ▪A summary of strategic, operational and related achievements during 2024 that supported this level of realization for the individual performance component of annual bonus is set forth on the preceding pages of this Executive Summary.
| | |
| | _______________________ *CEO’s 2024 total target annual bonus was $1.9 million, comprised of a target Company Performance component of $1,425,000 and a target Individual Performance component of $475,000. CEO’s 2024 total realized annual bonus was $1,573,696, comprised of a Company Performance component of $956,196 (67% of target amount for this component) and an Individual Performance component of $617,500 (130% of target amount for this component).
| |
| | | | |
Endnotes are set forth on page 45, following the conclusion of this Executive Summary.
| | |
| CEO’S 2024 LONG-TERM PAY-FOR-PERFORMANCE OUTCOME |
Long-Term Performance
As described above, long-term incentive awards have been the predominant element of target compensation for Redwood’s CEO under the Company’s executive compensation program. Based on the structure of these awards, the CEO’s pay realization from long-term components of pay is generally linked to three-year performance as measured by absolute and relative stockholder returns, as well as to longer-term stock performance for awards that vest over a four-year service period.
| | | | | | | | | | | | | | |
| | | | |
| Redwood’s Long-Term TSR Performance |
|
|
Long-Term TSR: Three- and four-year total stockholder return is a key measure for assessing Redwood’s long-term performance – on both an absolute basis (TSR) and measured relative to peers and industry indices (rTSR) – and three- and four-year TSR metrics are structurally incorporated into Redwood’s executive compensation program and meaningfully impact realized pay values. ▪As illustrated in the accompanying graphs, Redwood’s three-year TSR (2022-2024) lagged peers and industry indices. Our longer-term four-year TSR (2021-2024) exceeded most of these same peers and industry indices. ▪As illustrated on the following page, pay realization from long-term components of compensation that vest over three- and four-year periods is correlated with these stockholder returns, in accordance with the pay-for-performance design of Redwood’s executive compensation program.
| | | |
| | | |
Endnotes are set forth on page 45, following the conclusion of this Executive Summary.
| | |
| CEO’S 2024 LONG-TERM PAY-FOR-PERFORMANCE OUTCOME (CONT.) |
Alignment of Long-Term Performance and CEO’s Long-Term Pay Realization
In December 2024, Redwood’s CEO had the opportunity to realize final value from long-term incentive awards that were granted in December 2020, which had a four-year vesting period, as well as from awards that were granted in December 2021, which had a three-year vesting period. Final value realized from these long-term awards is in alignment with stockholder returns over these same periods through the use of both service-based vesting and performance-based vesting for these awards.
| | | | | | | | | | | | | | |
| CEO’s Long-Term Pay Realization in 2024 | |
| |
| | | | |
| Components of Long-Term Compensation: In 2024, Redwood’s CEO had the opportunity to realize final value from final vesting of two different long-term components of compensation: ▪Performance-based stock units (PSUs) that were granted at year-end 2021 with a three-year performance measurement/vesting period. Under the terms of these PSUs, vesting was directly linked to achievement of book value TSR and relative TSR over the 2022-2024 three-year period. ▪Service-based stock units (DSUs) that were granted in December 2020 and that fully vested at the end of 2024 following a four-year vesting/mandatory holding period. Pay-for-Performance Outcome – Below Target: As illustrated in the accompanying graph to the right, in alignment with Redwood’s three- and four-year TSR performance illustrated above, the CEO’s overall pay realization from these long-term elements of compensation was 53% of target/awarded amount. | | |
| ▪Value Realized from DSUs. Realized value from DSUs granted in 2020 with a four-year vesting period was modestly above original grant/target value, generally in line with Redwood’s positive 4-year TSR of 9.9%. ▪Value Realized from PSUs. Realized value from PSUs granted in 2021 with a three-year performance-based vesting period was significantly below original realizable/target value, with the leveraged structure of the PSUs resulting in only approximately 15% of value realized – meaningfully lower than Redwood’s negative TSR over that three-year period. | |
| | | | |
| | | | |
Endnotes are set forth on page 46, following the conclusion of this Executive Summary.
| | |
| CEO’S TARGET COMPENSATION STRUCTURE – OUTSET OF 2025 |
Elements of CEO’s Target Compensation Structure – Outset of 2025
Looking forward at the outset of 2025, the Committee structured 2025 target compensation for Redwood’s CEO, as illustrated below. Consistent with its annual process, the Committee’s determinations were made after taking into account Redwood’s business model and outlook, strategic and operational objectives, stockholder feedback and an overall review of the structure of Redwood’s executive compensation program compared to peers and competitive practice.
| | | | | | | | | | | |
| | | |
| Key Highlights – CEO’s Target Compensation at Outset of 2025 | |
| | | |
Base Salary: The CEO’s base salary was increased by $25,000 for 2025, after review of peer and competitive practice. Fixed elements of compensation (salary and standard benefits) continued to represent approximately 15% of the CEO’s target compensation at the outset of 2025. Target Annual Bonus: The CEO’s target annual bonus was increased from 200% of base salary in 2024 to 215% of base salary for 2025, after review of peer and competitive practice. LTI Awards: Long-term equity-based incentive (LTI) awards continued to be the predominant element of target compensation for the CEO at the outset of 2025. ▪55% PSUs. 55% of LTI awards granted to the CEO at year-end 2024 (as part of target compensation at the outset of 2025) were in the form of PSUs with a 3-year performance measurement/vesting period beginning on January 1, 2025. Performance-Based/Value at Risk: Elements of compensation in the form of LTI awards and/or with value at risk – i.e., elements of compensation with value realization tied to stock performance and/or financial, strategic, operational or risk management target and goals – comprise approximately 85% of the CEO’s target compensation at the outset of 2025 – with annual bonus realization driven by 2025 returns and operational/strategic achievements, and the realization of value from equity-based awards driven by book value TSR, absolute TSR and relative TSR over the forward-looking three- and four-year periods.
| | |
| _____________________________ *Percentages may not foot due to rounding. The CEO’s target annual compensation at the outset of 2025 is comprised of the following elements: base salary of $975,000; target 2025 annual bonus of $2.1 million; estimated $125,000 value of benefits; PSUs awarded on December 19, 2024 with a grant date value of $2.4 million; DSUs/csRSUs awarded on December 19, 2024 with a grant date value of $2.0 million. DSUs/csRSUs awarded on December 19, 2024 have a four-year pro-rata vesting schedule, with one-quarter of units vesting annually, with csRSUs awarded on December 19, 2024 cash-settled at each annual vesting date.
| |
| | | |
Endnotes to Executive Summary of CD&A:
The following endnotes accompany the foregoing Executive Summary, organized by section heading and title of sub-section or graphic element that corresponds to endnote:
COMPENSATION PHILOSOPHY; BEST PRACTICES AND RISK MITIGANTS: | | | | | | | | | | | | | | | | | |
| (1) | In 2024, several types of long-term equity-based incentive awards were granted to executive officers: Performance Stock Units (“PSUs”) with a three-year vesting/performance period; Deferred Stock Units (“DSUs”) with a four-year vesting/holding period; and cash-settled Restricted Stock Units (“csRSUs”) with a four-year vesting period. In this Executive Summary of CD&A, we may refer to PSUs and cash-settled PSUs collectively as “PSUs” and we may refer to DSUs and csRSUs collectively as “DSUs/csRSUs”. | |
| | | | | |
| (2) | Peer comparison of executive stock ownership requirements refers to comparison to Redwood of the following group of mortgage-REIT peers – listed alphabetically using stock tickers: AGNC; ARR; CIM; DX; IVR; MFA; MITT; NLY; NYMT; PMT; RITM and TWO. We refer to this peer group within this Executive Summary of CD&A as Redwood’s “mREIT Peers”. This mREIT Peer group is a group of publicly-traded mortgage REITs whose business models share a common focus on investing in residential mortgages and related assets. Redwood regularly compares its financial performance to these mREIT Peers. This mREIT Peer group is distinct from the larger and broader “compensation peer group” identified by the Committee each year for purposes of peer comparison of executive compensation practices. | | |
| | |
STOCKHOLDER OUTREACH AND ENGAGEMENT – OUTREACH AND ENGAGEMENT DURING 2024:
| | | | | |
| (3) | Shareholder outreach, response and engagement percentages reflect outreach and engagement activity from January 1, 2024 through December 31, 2024. Shareholder outreach and engagement percentages are based on share ownership IHS Markit data as of September 30, 2024. |
| |
REDWOOD’S 2024 ANNUAL FINANCIAL PERFORMANCE: | | | | | |
| (4) | Non-GAAP EAD ROE is a non-GAAP performance measure that is defined and described, and is reconciled to ROE based on GAAP financial results, in Annex A to this Proxy Statement. |
| |
| (5) | Book value TSR (also referred to as book value total shareholder return, or “bvTSR”) for a designated period represents the period change in GAAP book value per common share plus dividends declared per common share in the period. |
| |
| (6) | Bar graph of “Return-on-Equity (ROE) – 2024” reflects (i) for “Redwood”, Redwood’s return-on-common equity (“ROE”) based on 2024 GAAP financial results; (ii) for “mREIT Peers”, the simple average of the 2024 ROEs for Redwood’s self-designated mortgage REIT peers (listed in note (2) above); (iii) for “mREIT NAREIT”, the simple average of the 2024 ROEs for the component companies of the FTSE Nareit Mortgage REITs index; and (iv) for “mREIT NAREIT (ex. Comm.)”, the simple average of the 2024 ROEs for the component companies of the FTSE Nareit Mortgage REITs index, excluding mortgage REITs classified as commercial-focused with that index. Source for peer and index companies: Bloomberg data for the respective periods presented. |
| |
| (7) | Bar graph of “Book Value TSR (bvTSR) – 2024” reflects (i) for “Redwood”, Redwood’s bvTSR based on 12/31/24 book value per share of $8.46, 12/31/23 book value per share of $8.64; and total common stock dividends paid in 2024 of $0.67 per share; (ii) for “mREIT Peers”, the simple average of the 2024 bvTSRs for Redwood’s mREIT Peers (listed in note (2) above); (iii) for “mREIT NAREIT”, the simple average of the 2024 bvTSRs for the component companies of the FTSE Nareit Mortgage REITs index; and (iv) for “mREIT NAREIT (ex. Comm.)”, the simple average of the 2024 bvTSRs for the component companies of the FTSE Nareit Mortgage REITs index, excluding mortgage REITs classified as commercial-focused within that index. Source for peer and index companies: Bloomberg data for the respective periods presented. |
REDWOOD’S 2024 OPERATIONAL/STRATEGIC PERFORMANCE: | | | | | |
| (8) | Lock volume represents loans identified for purchase from loan sellers. Lock volume does not account for potential fallout from pipeline that typically occurs through the lending process. |
| |
| (9) | Market share is calculated based on Sequoia lock volume divided by full year jumbo mortgage loan volume as sourced from Inside Mortgage Finance. |
| |
| (10) | Source: JP Morgan Research and based on 2024 jumbo mortgage loan securitization activity. |
| |
| (11) | Sequoia Mortgage Banking segment return on capital reflects: for 2024, segment contribution of $61.5 million and average capital utilized of $278 million; and, for 2023, segment contribution of $10.1 million and average capital utilized of $100 million. |
Endnotes to Executive Summary of CD&A: (cont.)
| | | | | |
| |
| (12) | Cost per loan for the Sequoia Mortgage Banking segment is calculated as annual operating expenses of this segment divided by annual loan purchase commitments of this segment. |
| |
| (13) | Percentage of units that were considered affordable housing based of Department of Housing and Urban Development (“HUD”) criteria. HUD defines affordable housing as housing that costs no more than 30% of a household’s income for rent and utilities or 28% for mortgage, property tax, and insurance. |
| |
| (14) | Net cost to originate for the CoreVest Mortgage Banking segment is calculated as annual operating expenses of this segment, less upfront origination fees of this segment, divided by origination volume of this segment. |
CEO’S ANNUAL BONUS REALIZATION – 2024:
| | | | | |
| (15) | Adjusted ROE and Adjusted EAD ROE are each non-GAAP performance measures that are defined and described on pages 58-59 within this CD&A under the heading “2024 Performance-Based Annual Bonus Compensation.” Annex B to this Proxy Statement contains additional discussion, disclosure and details regarding these non-GAAP financial performance metrics. Adjusted ROE and Adjusted EAD ROE should not be considered as alternatives to GAAP net income, GAAP ROE or other measurements of results of operations computed in accordance with GAAP or for federal income tax purposes. |
| |
CEO’S 2024 LONG-TERM PAY-FOR-PERFORMANCE OUTCOME – REDWOOD’S LONG-TERM TSR PERFORMANCE: | | | | | |
| (16) | Bar graph of “3-Year Total Shareholder Return (TSR)” reflects (i) for “Redwood”, Redwood’s TSR for the three-year period ending 12/31/2024; (ii) for “mREIT Peers”, the simple average of the TSRs for Redwood’s mREIT Peers (listed in note (2) above) for the three-year period ending 12/31/2024; (iii) for “mREIT NAREIT”, the simple average of the TSRs for the component companies of the FTSE Nareit Mortgage REITs index for the three-year period ending 12/31/2024 (excludes companies for which a three-year TSR was not available); and (iv) for “mREIT NAREIT (ex. Comm.)”, the simple average of the TSRs for the component companies of the FTSE Nareit Mortgage REITs index for the three-year period ending 12/31/2024, excluding mortgage REITs classified as commercial-focused with that index (excludes companies for which a three-year TSR was not available). Source: Bloomberg data for the respective periods presented. |
| |
| (17) | Bar graph of “4-Year Total Shareholder Return (TSR)” reflects (i) for “Redwood”, Redwood’s TSR for the four-year period ending 12/31/2024; (ii) for “mREIT Peers”, the simple average of the TSRs for Redwood’s mREIT Peers (listed in note (2) above) for the four-year period ending 12/31/2024; (iii) for “mREIT NAREIT”, the simple average of the TSRs for the component companies of the FTSE Nareit Mortgage REITs index for the four-year period ending 12/31/2024 (excludes companies for which a four-year TSR was not available); and (iv) for “mREIT NAREIT (ex. Comm.)”, the simple average of the TSRs for the component companies of the FTSE Nareit Mortgage REITs index for the four-year period ending 12/31/2024, excluding mortgage REITs classified as commercial-focused with that index (excludes companies for which a four-year TSR was not available). Source: Bloomberg data for the respective periods presented. |
| |
CEO’S 2024 LONG-TERM PAY-FOR-PERFORMANCE OUTCOME – CEO’S LONG-TERM PAY REALIZATION IN 2024:
| | | | | |
| (18) | Bar graph of “CEO’s Long-Term/Performance-Based Pay Realization – 2024” depicts: (i) a total of $4.875 million of realizable grant/target value of components of long-term compensation for the CEO for 2024, which is comprised of: DSUs and cash-settled DSUs (“csDSUs”) with a four-year vesting/delivery/settlement schedule that concluded in December 2024, which DSUs and csDSUs had an aggregate original grant date fair value in December 2020 of $1.875 million; and PSUs with a three-year performance-based vesting period that concluded on December 31, 2024, which PSUs had an original grant date value in December 2021 of $3.0 million; and (ii) total realized compensation value of $2.59 million from these realizable/target components of long-term compensation for the CEO for 2024, which is comprised of: the value of the 106,898 shares of RWT common stock underlying these DSUs which vested in December 2024 (valued at the per share closing price on December 31, 2024), plus the value of the 106,898 shares of RWT common stock underlying these csDSUs which vested in December 2024 (valued at the per share closing price on December 13, 2024, the settlement date for these csDSUs), plus the $0.69 million amount of aggregate dividend equivalent payments made in respect of these DSUs and csDSUs over the course of their four-year vesting period; and the value of the 67,591 shares of RWT common stock underlying these PSUs which vested based on the performance-based vesting criteria for these PSUs measured over a three-year performance period (valued at the per share closing price on December 31, 2024). Partial cash-settlement in December 2024 of one-quarter of the 118.421 cash-settled RSUs that were granted to the CEO in December 2023, and which have a four-year pro-rata vesting/settlement schedule, are not included in either “realizable/target value” or “long-term/performance- |
| |
Endnotes to Executive Summary of CD&A: (cont.)
| | | | | |
| |
| based pay realization” for 2024, as these cash-settled RSUs are considered a component of long-term compensation for which final pay realization will be reported in after the full four-year vesting period concludes in December 2028. |
Compensation Discussion and Analysis (CD&A)
| | | | | | | | | | | | | | |
| Section I - Introduction |
| | |
| Ø | Named Executive Officers |
| | |
| Ø | Compensation Committee |
| | |
| Ø | Redwood’s Business Model and Internal Management Structure |
| | |
| Ø | Overall Compensation Philosophy and Objectives |
| | | | |
| Ø | Outreach to Stockholders |
| | | | |
| Ø | Stockholder Feedback |
| | | | |
This CD&A is focused on the compensation of Redwood’s named executive officers in 2024, although it also provides a description of key updates to Redwood’s executive compensation program that will apply going forward in 2025, as well as some general discussion and analysis of aspects of Redwood’s compensation programs, plans, and practices that apply to all of Redwood’s officers and employees.
Named Executive Officers
Under SEC regulations, Redwood had five “Named Executive Officers” (“NEOs”) for 2024, who are listed below.
▪Christopher J. Abate, Chief Executive Officer
▪Dashiell I. Robinson, President
▪Brooke E. Carillo, Chief Financial Officer
▪Sasha G. Macomber, Chief Human Resource Officer
▪Andrew P. Stone, Executive Vice President, Chief Legal Officer, and Secretary
Compensation Committee
The Compensation Committee (the “Committee”) is committed to providing disclosure within this CD&A that gives insight into the process by which it arrives at executive compensation determinations and the underlying rationales. Among other things, this CD&A describes:
▪The Committee’s process for reviewing and determining the elements of the compensation of the Chief Executive Officer (“CEO”) and of the other executive officers.
▪The rationale for the different elements of the executive officers’ compensation and Redwood’s compensation philosophy, objectives, and methodology for peer comparisons.
▪The metrics and goals used for performance-based compensation and factors taken into account in the Committee’s determination of whether those metrics and goals were satisfied.
▪The severance and change of control payments that executive officers may become entitled to receive under certain circumstances.
▪The role of the Committee’s independent compensation consultant.
The Committee generally meets at least four times annually and, over the course of an annual period, reviews Redwood’s compensation philosophy and its executive compensation plans and programs. After taking into account various factors and analyses, including those described in this CD&A, input from its independent compensation consultant, feedback from stockholders obtained during ongoing outreach efforts, and the outcome of recent stockholder advisory votes on executive compensation (commonly referred to as
“Say-on-Pay” votes), the Committee makes compensation determinations it believes are appropriate in light of its executive compensation objectives.
Redwood’s Business Model and Internal Management Structure
Redwood is a specialty finance company focused on several distinct areas of housing credit where we provide liquidity to growing segments of the U.S. housing market not well served by government programs. Redwood is structured as an internally-managed real estate investment trust (“REIT”). Redwood’s mission is to make quality housing, whether rented or owned, accessible to all American households and we believe that the financing we provide makes a positive impact, not just on the American economy, but also on the families who have been able to purchase or rent homes because of Redwood’s important role in housing finance. The nature of Redwood’s business model and internally-managed structure are key factors the Committee has considered in designing Redwood’s executive compensation program and determining appropriate metrics and setting targets and goals for performance-based compensation.
Under the Internal Revenue Code, REITs are required to distribute as dividends at least 90% of the income earned under their REIT status. As a result, like other REITs, Redwood is limited in its ability to grow book value and its equity capital base through the reinvestment of retained earnings, and a key element of returns to stockholders is the level of dividends paid on shares of Redwood’s common stock.
Redwood’s primary sources of income are net interest income from its investments and non-interest income from the mortgage banking activities it conducts through its operating platforms. Net interest income primarily consists of the interest income earned on investments less the interest expense incurred on borrowed funds and other liabilities. Income from mortgage banking activities is generated through the origination and acquisition of loans, and their subsequent sale, securitization, or transfer to Redwood’s investment portfolio. Further details regarding Redwood’s business model include:
▪Key Aspects of Redwood’s Business Model. Redwood’s business model occupies a unique position in the housing finance value chain, delivering customized housing credit investments to a diverse mix of investors through its best-in-class securitization platforms, whole-loan distribution activities and its publicly-traded securities. Redwood’s aggregation, origination and investment activities have evolved to incorporate a diverse mix of residential consumer and residential investor housing credit assets. Redwood operates its business in three segments: Sequoia Mortgage Banking, CoreVest Mortgage Banking, and Redwood Investments.
◦Sequoia Mortgage Banking. Through its Sequoia Mortgage Banking platform, Redwood operates a mortgage loan conduit that acquires residential mortgage loans (e.g., private sector jumbo mortgage loans made to consumers and secured by owner-occupied housing) originated by third-party firms (banks and independent mortgage companies). These residential consumer loans are subsequently sold to whole loan buyers, securitized through Redwood’s SEMT® (Sequoia) private-label securitization program, or transferred into the Company’s Redwood Investments portfolio. Redwood does not originate residential consumer mortgage loans for owner-occupied housing and does not generally transact in mortgages guaranteed by Fannie Mae/Freddie Mac or the Federal government. Through its Redwood Investments portfolio segment (described below), Redwood also invests in assets created within or sourced through its Sequoia Mortgage Banking segment, primarily securities retained from securitization transactions.
◦CoreVest Mortgage Banking. Through its CoreVest Mortgage Banking platform, Redwood originates loans to investors in residential real estate (also referred to as business purpose mortgage loans (“BPLs”)) secured by investor-owned housing (e.g., single-family and multifamily rental housing). These residential investor loans are subsequently sold to whole loan buyers or to one of the joint ventures we have established with co-investors, securitized through the CoreVest’s CAFL® private-label securitization program, or transferred into the
Company’s Redwood Investments portfolio We classify residential investor loans as either "term" loans (which include loans with maturities that generally range from 3 to 30 years) or "bridge" loans (which include loans with maturities that generally range between 12 and 36 months). Term loans are mortgage loans secured by residential real estate (primarily 1-4 unit detached or multifamily) that the borrower owns as an investment property and rents to residential tenants. Bridge loans are mortgage loans which are generally secured by unoccupied (or in the case of certain multifamily properties, partially occupied) single-family or multifamily residential real estate that the borrower owns as an investment and that is being renovated, rehabilitated or constructed. Redwood generally distributes most of its term loans through its CAFL® private-label securitization program, or through whole loan sales, and typically transfers bridge loans to the Company’s Redwood Investments portfolio or as co-investments to joint ventures it has with capital partners, where they may be retained for investment, sold as whole loans or securitized.
◦Redwood Investments. Redwood Investments is a portfolio of investments that includes assets and investments created and sourced through Redwood’s mortgage banking platforms (including primarily securities retained from our Sequoia and CoreVest securitization activities), residential investor bridge loans, as well as investments sourced from third-parties (including asset-backed securities issued by third parties, investments in Freddie Mac K-Series multifamily mortgage loan securitizations and reperforming mortgage loan securitizations, servicer advance investments, home equity investments, and other housing-related investments). The assets that Redwood invests in are generally not guaranteed by Fannie Mae/Freddie Mac or the Federal government.
Redwood’s business model and internally-managed REIT structure inform the Committee’s selection of performance metrics and goals used in its performance-based compensation plans. In addition to total stockholder return (“TSR”) and relative TSR (“rTSR”), which measures Redwood’s TSR as compared to the TSRs of a comparator group of companies, the Committee believes that return-on-equity (“ROE”), book value total stockholder return (“bvTSR”), and other operational and profit-based measures (including certain non-GAAP financial metrics) are highly relevant metrics for determining annual bonuses and measuring longer-term performance because: (i) these financial performance metrics should correlate with Redwood’s ability to increase book value and pay attractive levels of sustainable and growing dividends; (ii) management has “line-of-sight” into how its strategic and operational decisions impact these financial and operational performance measures; and (iii) over the long-term, strong results under these financial and operational performance measures should correlate with strong TSR. Redwood’s approach to using leverage to finance its business and investments, as well as its approach to managing liquidity and operational risks, are factored in when the Committee sets financial and operational performance goals.
Overall Compensation Philosophy and Objectives
Redwood maintains a performance-based compensation philosophy and program for its executive officers that seeks to provide incentives to achieve business goals and sustainable stockholder returns, align the interests of executive officers with those of long-term stockholders, and enable it to hire and retain talented individuals in a competitive marketplace. The Committee is responsible for evaluating Redwood’s executive compensation programs, plans, and practices to ensure that they provide proper incentives and appropriately support Redwood’s business model and performance objectives without creating risks that are reasonably likely to have a material adverse effect on Redwood.
For 2024, Redwood’s executive compensation objectives continued to be as follows:
▪Incentivize attainment of business goals and sustainable stockholder returns, including:
▪Generating attractive returns-on-equity, measured on both a GAAP and non-GAAP basis, that support regular and growing dividends and stable-to-increasing book value; and
▪Meeting annual strategic, operational and risk-management goals.
▪Align the interests of executives with those of long-term stockholders in achieving strong stockholder returns, in absolute terms and relative to other mortgage REITs and small-cap financial services firms.
▪Enable Redwood to hire and retain executives with needed mortgage, investment and financial services expertise in a competitive marketplace.
▪Avoid incentivizing inappropriate risk taking.
As in prior years, during 2024, the Committee, with input and guidance from its independent compensation consultant, engaged in a review of the structure of Redwood’s executive compensation program. This included a review of the elements of executive compensation, the mix of annual and long-term compensation, the compensation peer group, the overall competitiveness of target levels of cash and equity-based compensation, and the mechanisms through which Redwood’s pay-for-performance philosophy is implemented. In following this process each year, the Committee seeks to incorporate evolving best practices and risk mitigants into Redwood’s executive compensation program.
Outreach to Stockholders
Outreach to stockholders regarding executive compensation during 2024, as well as over the past several years, has provided Redwood with the opportunity to discuss and receive stockholder feedback regarding Redwood’s philosophy and views on executive compensation and specific compensation practices. Redwood’s outreach to stockholders regarding executive compensation has taken place both shortly following the publication of Redwood’s annual proxy statement (i.e., during “proxy season”) and outside of “proxy season,” which often allows for more extensive and in-depth discussions. Additional outreach by the Chair of the Committee to institutional stockholders is contemplated for the future, including in advance of the 2025 Annual Meeting.
▪Independent Compensation Committee Chair Active in Ongoing Outreach to Stockholders. The Chair of the Committee generally leads Redwood’s stockholder outreach and engagement efforts, with members of Redwood’s management also participating. In 2024, engagement with institutional stockholders was often conducted via videoconferences, with the Committee Chair generally leading Redwood’s engagement team. Following each stockholder engagement with the Committee Chair, a summary of the dialogue was circulated to the full Committee, as well as to all other Directors, ensuring that feedback from stockholders reaches all members of Redwood’s Board.
▪In-House Outreach Team. Together with the Committee Chair, Redwood’s outreach team includes key members of the Company’s Investor Relations, Human Resources, Finance and Corporate Secretary departments. The Company’s in-house outreach team also meets and engages with a broad base of investors throughout the year to discuss the Company’s business and strategy, as well as other key topics of stockholder focus, including, corporate governance and risk management matters that are relevant to the Company’s business.
▪Outreach to Stockholders in 2024. In connection with the May 2024 annual meeting, Redwood undertook an outreach effort reaching institutional stockholders holding 90% of our common shares held by institutions. (These stockholders represented 72% of all outstanding shares of common stock.)
▪Response/Direct Engagement. Over the course of these outreach efforts, Redwood received responses from and/or directly engaged with institutional stockholders holding 46% of our common shares held by institutions. (These stockholders represented 37% of all outstanding shares of common stock.) Based on the extensive stockholder outreach conducted over the prior two years, many of the stockholders that were contacted responded that engagement in prior years had supported their understanding and support for the compensation program, without the need for direct engagement in 2024.
▪“Say on Pay Support” in 2024 and Over the Long-Term. At Redwood’s May 2024 annual meeting, stockholders representing approximately 91.3% of shares voted were in support of “Say-on-Pay”. This high level of “Say-on-Pay” support is reflective of the generally positive feedback that stockholders have provided following the May 2022 “Say-on-Pay” vote.
▪Excluding the low level of support received in May 2022, stockholders have provided an average of approximately 90% support since the inception of “Say-on-Pay” voting at Redwood in 2011.
The Committee believes that this ongoing stockholder outreach process results in a more detailed understanding of recent “Say-on-Pay” voting results and provides a forum for valuable feedback from stockholders regarding their views on Redwood’s executive compensation philosophy, practices and disclosures.
Stockholder Feedback
As described above, in 2024 the Committee Chair and Redwood’s outreach team continued its practice of engaging with stockholders regarding executive compensation. Engagement was focused primarily on continuing to gather feedback and perspectives on the changes to the design and structure of the executive compensation program that had been implemented by the Committee following the May 2022 annual meeting of stockholders.
▪As mentioned above, based on the extensive stockholder outreach conducted over the prior two years, many of the stockholders that were contacted in 2024 responded that engagement in prior years had supported their understanding and support for the compensation program, without the need for direct engagement in 2024. Stockholders who did directly engage in 2024 were focused on understanding how stockholder concerns raised in 2022 had been fully addressed by the changes to the program over the course of 2022 and 2023 and were focused on how financial performance targets were established and the levels of compensation realized for performance at, above and below those target levels.
| | | | | | | | | | | | | | |
| Section II - Executive Compensation in 2024 |
| | |
| Ø | Redwood’s 2024 Performance |
| | |
| Ø | Elements of Compensation in 2024 |
| | |
| Ø | Process for Compensation Determinations for 2024 |
| | |
| Ø | Compensation Peer Group for 2024 |
| | |
| Ø | 2024 Base Salaries |
| | | | |
| Ø | 2024 Performance-Based Annual Bonus Compensation |
| | | | |
| Ø | Performance-Based Annual Bonuses Earned for 2024 |
| | | | |
| Ø | 2024 Long-Term Equity-Based Incentive Awards |
| | | | |
| Ø | Vesting and Mandatory Holding Periods for 2024 Long-Term Equity-Based Incentive Awards |
| | | | |
| Ø | Pay-for-Performance Outcomes from Long-Term Equity-Based Incentive Awards |
| | | | |
Redwood’s 2024 Performance
Overall, 2024 presented a challenging market and operating environment for Redwood and its closest industry peers. Significant volatility in key benchmark interest rates over the course of the year resulted in below-target performance on an absolute basis compared to Committee-established targets. On a relative basis, 2024 bvTSR and 2024 ROE were above certain peers and below others, as illustrated within the preceding “Executive Summary of CD&A” under the heading “Annual Financial Performance – 2024” on page 36 of this Proxy Statement. As further detailed within this Compensation Discussion and Analysis, Redwood’s annual financial performance for 2024 was below the targets established by the Committee, which drove below-target annual bonus realization for Redwood’s CEO and other executive officers.
▪2024 Annual Financial Performance
•GAAP return on common equity (“ROE”) was 4.1%.
•Non-GAAP EAD ROE was 6.4%.
◦Non-GAAP EAD ROE is a non-GAAP performance measure that is defined and described, and is reconciled to ROE based on GAAP financial results, in Annex A to this Proxy Statement.
•Book value TSR was 5.7%.
◦Book value TSR (also referred to as book value total shareholder return, or “bvTSR”) for a designated period represents the period change in GAAP book value per common share plus dividends declared per common share in the period.
•Redwood paid $0.67 per share in common stock dividends in 2024.
◦Redwood’s common stock dividend increased to $0.18 per share in the fourth quarter of 2024, a 12.5% increase from the fourth quarter of 2023.
▪2024 Strategic and Operational Achievements
•Leading into 2024, the Company began implementing a number of strategies meant to support performance in 2024 and beyond, including: enhancing capital and operational efficiency; expanding its product sets; diversifying distribution channels; and expanding relationships with bank counterparties. Accordingly, a key goal for executive management in 2024 was to execute on the objectives, preparation and foundation to support these strategic initiatives.
Actions taken in 2024 to further strategic, operational and risk-management objectives had both near- and long-term benefits and management continues to focus on forward-looking initiatives and actions that are designed to positively impact future returns.
•A detailed review of strategic and operational achievements in 2024 is set forth within the preceding “Executive Summary of CD&A” under the heading “2024 Strategic and Operational Achievements” on pages 37-39 of this Proxy Statement and additional information regarding achievement of the company-wide goals is set forth below under the heading “Performance-Based Annual Bonuses Earned for 2024–Individual Performance Component of 2024 Annual Bonuses” on pages 63-65 of this Proxy Statement.
Elements of Compensation in 2024
In 2024, cash compensation for Redwood’s executive officers included a base salary and a performance-based annual bonus. Annual bonuses for 2024 were determined based on company financial performance and on each executive officer’s individual performance. For each executive officer, the Committee established a target annual bonus amount at the beginning of 2024 that would be earned if Redwood’s financial performance met Committee-established targets and the executive officer’s individual performance merited target-level payment. In particular, one portion of each executive officer’s annual bonus was determined based on company financial performance (referred to in this CD&A as the Company performance component of target bonus or Company performance or financial performance bonus), and another portion of each executive officer’s annual bonus was determined based on individual performance (referred to in this CD&A as the individual performance component of target bonus or individual performance bonus).
The Committee generally intends that the base salary and annual bonus target for each executive officer to be appropriate in comparison to a market-based median level, after taking into account factors such as the executive officer’s role and responsibilities, competitive factors, and internal equity. In addition, the Committee believes that performance-based bonuses for each executive officer should have adequate upside so that total annual compensation actually earned may reach the top-quartile of the market-based level for strong performance.
The market-based levels used by the Committee during 2024 were determined with the assistance of the Committee’s independent compensation consultant. The process included reviewing compensation practices of peer companies selected by the Committee (referred to in this CD&A as the compensation peer group). Further details regarding the compensation peer group and practices for comparisons to this peer group are provided on pages 56-57 within this CD&A under the heading “Compensation Peer Group for 2024.”
For 2024, the Committee established the Company performance component of the annual bonus for each executive officer such that half of this component would be realized based on Redwood’s 2024 “Adjusted ROE” and the other half of this component would be realized based on Redwood’s 2024 “Adjusted EAD ROE”. Adjusted ROE and Adjusted EAD ROE are each non-GAAP performance measures that are defined and described on pages 58-59 within this CD&A under the heading “2024 Performance-Based Annual Bonus Compensation.” Furthermore, for 2024, the Committee established an Adjusted ROE financial performance target of 11.5% and an Adjusted EAD ROE performance target of 6.5%.
With respect to long-term equity-based compensation, the Committee generally makes annual year-end awards to executive officers in amounts, and subject to terms and vesting conditions, that provide an incentive to create long-term stockholder value and align the interests of executive officers with the interests of long-term stockholders. These year-end awards are intended to provide performance-based compensation opportunities at levels that will be effective in retaining valued and productive executives. In determining the size of annual year-end long-term equity-based compensation opportunities, the Committee uses the same or
similar considerations as are applied when setting salaries and target annual bonus opportunities, with the value actually delivered/realized being a result of subsequent performance. For 2024, the value of long-term equity-based compensation granted at year-end to executive officers was determined after taking into account the Committee’s philosophy that:
◦Competitive pressure on executive officer compensation levels from higher-paying related market sectors should be addressed through the value of long-term equity-based awards. Annual target cash compensation amounts are generally intended to be appropriate in comparison to a median range of the compensation peer group, while long-term equity-based awards may be targeted above the median when justified by performance, experience, or the scope of the individual’s role. The value of long-term equity-based awards may also take into account each executive officer’s individual performance.
◦The terms and vesting conditions of long-term equity-based awards should result in realized compensation for executive officers that correlates with long-term stockholder value creation (through dividend distributions and share-price growth) over a minimum of three years.
Executive officers are also provided with other benefits that are also available to all eligible employees of Redwood on a substantially similar basis. These benefits, which are further described below on pages 72-74 within this CD&A, include standard health and welfare benefits and the ability to participate in Redwood’s tax-qualified 401(k) plan and Employee Stock Purchase Plan. In addition, executive officers may participate in Redwood’s Executive Deferred Compensation Plan and are eligible for a concierge medical benefit.
An illustration of the elements of the CEO’s target compensation at the outset of 2024, including base salary, annual bonus target, and long-term equity-based compensation is set forth under the heading “Elements of CEO’s Target Compensation Structure – Outset of 2024” in the Executive Summary of CD&A on page 35 of this Proxy Statement.
Process for Compensation Determinations for 2024
Each year the Committee makes determinations regarding the compensation of Redwood’s executive officers. The process is dynamic and the Committee has the authority to re-examine and adjust the compensation program or process to take into account changing circumstances throughout the year. For 2024 the Committee directly engaged and used the services of a nationally recognized compensation consultant, Semler Brossy Consulting Group LLC (Semler Brossy), to assist it in determining the elements of compensation and providing comparative analyses.
Semler Brossy reports directly to the Committee and acts as the Committee’s consultant regarding director and executive officer compensation-related matters. Semler Brossy is not retained by Redwood or its management in any other capacity and the Committee has the sole authority to establish and terminate the relationship with Semler Brossy. In addition, the Committee conducted an assessment of the independence of Semler Brossy and concluded that no conflict of interest currently exists or existed in 2024 that would result in Semler Brossy not being able to provide independent advice to the Committee.
On an annual basis, the Committee reviews the compensation program for Redwood’s executive officers with its independent compensation consultant and assesses the competitiveness of compensation levels and targets to determine whether it is aligned with Redwood’s compensation philosophy and is externally competitive. In addition, the Committee’s independent compensation consultant assists the Committee in determining the form and structure of the elements of Redwood’s executive compensation program and also provides the Committee with data regarding compensation practices among the compensation peer group. The independent compensation consultant’s analysis covers all elements of direct compensation, including base salary, annual incentives, and long-term incentives. Benefit and perquisite offerings at Redwood are also reviewed, as is equity ownership in Redwood by each executive officer. Analysis provided by its independent compensation consultant assists the Committee in understanding the extent to which different elements of each executive officer’s compensation are above or below market levels and in understanding the year-to-year changes in awarded, accumulated, and potential compensation.
As part of its year-end process for making compensation determinations for executive officers, in December 2024, the Committee also considered the following: the executive officers’ collective self-assessment of their individual contributions and performance over the year; Mr. Abate’s recommendations with respect to the compensation of the other executive officers; and Semler Brossy’s directional recommendations regarding the elements and amount of compensation for the CEO, and its opinion on the recommendations developed by the CEO for the other executive officers. These recommendations and opinions were based on peer comparisons, other supplemental comparative data, and Redwood’s compensation philosophy.
Compensation Peer Group for 2024
As in prior years, in 2024 the Committee asked its independent compensation consultant to conduct a market pay analysis with respect to the compensation of Redwood’s executive officers. For 2024, Semler Brossy’s market pay analysis relied primarily on publicly disclosed executive compensation data from the compensation peer group. The Committee may also consider supplemental data that provides insight into executive compensation practices at competitors that are externally managed and, therefore, do not generally disclose comprehensive compensation data for their named executive officers, as well as private companies and divisions of larger public companies for which individual compensation data are not publicly disclosed. Certain of the publicly-traded REITs that Redwood competes with for mortgage-industry talent are externally managed and do not disclose comprehensive executive compensation information and certain peers may not disclose information for officers with responsibilities comparable to all of Redwood’s executive officers.
The Committee considers the use of a market-based compensation analysis important for validating competitive positioning in attracting and retaining executive talent. Each year, to prepare for conducting the competitive pay analysis, the Committee, after consultation with its independent compensation consultant, designates a compensation peer group using a pre-defined process and objective industry and size criteria that is intended to include companies with which Redwood competes for business or for executive talent. The process and objective criteria used to select the 2024 compensation peer group (which was used in the 2024 competitive pay analysis) is detailed below.
| | | | | | | | | | | |
| | | |
| Step 1: | Begin with a broad screening process intended to identify publicly traded, U.S.-based companies that are internally managed (externally-managed companies generally have not disclosed comprehensive compensation data and are therefore excluded) | |
| | | |
| | | | | | | | | | | |
| | | |
| Step 2: | Identify REITs and other companies most similar to Redwood (i.e., direct peers), including: | |
| • | Mortgage REITs, which are considered “direct peers” along with real estate development and financial services companies with a focus on mortgage servicing or mortgage-related assets | |
| • | Exclude all companies with market capitalization values outside of a 0.25-4.0x range compared to Redwood, subject to reasonable exceptions for key business competitors and based on 12-month average market capitalization | |
| | | | | | | | | | | |
| | | |
| Step 3: | Identify other relevant business and labor-market competitors: | |
| • | Financial services companies with both market capitalization value in a 0.5-2.0x range compared to Redwood based on 12-month average market capitalization | |
| • | Exclude bank holding companies and companies in the cash advance/pawn broker businesses, due to fundamental differences in the underlying business model | |
| | | | | | | | | | | |
| | | |
| Step 4: | Select 15 to 25 companies for inclusion in the compensation peer group: | |
| • | Generally include all companies identified in Step 2 | |
| • | Generally include companies identified in Step 3 if they: (1) are included in the prior year’s compensation peer group or (2) have been identified as a peer of Redwood’s most-direct peers (e.g., a peer of another mortgage REIT identified in Step 2) | |
| • | Add additional companies identified in Step 3 to: (1) ensure that the sample size is sufficient and (2) position Redwood closer to the median on key size measures, focusing primarily on market capitalization and secondarily on total assets and net income | |
The Committee recognizes that the compensation peer group does not include generally higher-paying externally-managed REITs, mortgage-focused divisions of large publicly-traded financial institutions, private equity firms, and hedge funds with which Redwood competes for executive talent. These organizations are not included because they have different business economics and pay models from Redwood, and because comprehensive compensation data for their executives are generally not publicly available.
The Committee reviews the compensation peer group and the selection process and criteria on an annual basis to confirm that it continues to reflect relevant business and labor market competitors for whom comprehensive data is available. Accordingly, the companies included as peers may change from year to year as a result of updates to the selection process and criteria and changes in the real estate and capital markets. Following the completion of the Committee’s review process in 2024, there were no changes to the compensation peer group from the 2023 compensation peer group.
2024 Compensation Peer Group. Based on the above-described methodology, the compensation peer group approved by the Committee for use in preparing and reviewing the competitive pay analysis in 2024 consisted of the following 19 companies:
| | | | | | | | | | | | | | |
| • | Arbor Realty Trust, Inc. | | • | Acadian Asset Management(1) |
| • | Chimera Investment Corporation | | • | Dynex Capital, Inc. |
| • | Essent Group Ltd. | | • | Granite Point Mortgage, Inc. |
| • | Ladder Capital Corp. | | • | MFA Financial, Inc. |
| • | Mr. Cooper Group, Inc. | | • | New York Mortgage Trust, Inc. |
| • | NMI Holdings, Inc. | | • | PennyMac Financial Services, Inc. |
| • | Radian Group, Inc. | | • | Rithm Capital Corp. |
| • | Safehold, Inc. | | • | Two Harbors Investment Corp. |
| • | Victory Capital Holdings, Inc. | | • | Virtus Investment Partners, Inc. |
| • | Walker & Dunlop. Inc. | | | |
________________(1) BrightSphere Investments Group, Inc. rebranded as Acadian Asset Management effective January 1, 2025.
2024 Base Salaries
Base salary is a traditional element of executive compensation. The Committee annually establishes base salaries for executive officers after reviewing the market data for similar executives, as well as the experience, skills, and responsibilities of each executive officer. The Committee may adjust salaries at other times throughout the year, including at the time of a promotion.
In December 2023, after consultation with its independent compensation consultant and review of its analysis, the Committee made determinations with respect to 2024 NEO base salaries as follows:
◦Mr. Abate. The 2024 annual base salary for Mr. Abate, Redwood’s Chief Executive Officer, was increased from $900,000 to $950,000.
◦Mr. Robinson. The 2024 annual base salary for Mr. Robinson, Redwood’s President, was increased from $850,000 to $875,000.
◦Ms. Carillo. The 2024 annual base salary for Ms. Carillo, Redwood’s Chief Financial Officer, was increased from $800,000 to $825,000.
◦Ms. Macomber. The 2024 annual base salary for Ms. Macomber, Redwood’s Chief Human Resource Officer, was increased from $450,000 to $500,000.
◦Mr. Stone. The 2024 annual base salary for Mr. Stone, Redwood’s Executive Vice President and Chief Legal Officer, increased from $450,000 to $500,000.
2024 Performance-Based Annual Bonus Compensation
Redwood’s annual bonus program is designed to reward executive officers based on Redwood’s financial performance and each executive officer’s individual performance. In accordance with the Committee’s executive compensation philosophy, and the pay-for-performance structure of Redwood’s executive compensation program, there has been significant variability in the performance-based annual bonuses paid to Redwood’s CEO over the past ten years, reflecting the variations in Redwood’s compensation program and financial performance over the same period.
Set forth below is a description of the components of the 2024 performance-based annual bonus compensation for Redwood’s executive officers, including a description of the financial performance metrics and targets used within the bonus program’s structure.
Components of 2024 Annual Bonuses. In order to align executives’ interests with the interests of stockholders, in the first quarter of 2024 the Committee determined, after consultation with its independent compensation consultant, that 2024 target annual bonuses for executive officers would continue to be weighted as follows:
◦Company/Financial Performance Component. 75% on the achievement of predetermined target levels of Redwood’s financial performance for 2024; and
◦Individual Performance Component. 25% on individual contributions to the Company’s pre-established annual strategic, business, operational and risk management goals and objectives for 2024.
The weightings described above were used so that most of an executive officer’s target annual bonus will depend directly on company financial performance, while also providing incentives for achievement of individual strategic, business, operational and risk management goals that the Committee believes are in the interests of Redwood and its stockholders, but in some cases may be difficult to quantitatively link to annual company financial performance.
Financial Performance Metrics for 2024 Annual Bonuses. Also during the first quarter of 2024, after a review of Redwood’s compensation program, and following consultation with its independent compensation consultant, the Committee determined to continue to use two different non-GAAP financial performance metrics in 2024 within the methodology for determining realization of each executive officer’s performance-based annual bonus. In the process of reaching its conclusion to continue using these two financial performance metrics for 2024 – namely, Adjusted ROE and Adjusted EAD ROE1 – each of which is further described below, the Committee considered whether alternative or additional financial performance metrics should be used within the methodology for determining performance-based annual bonuses. Although for 2024, the Committee continued to use the same financial performance metrics that had been used in 2023, it discussed that as the Company’s business model continued to evolve, additional or alternative financial performance metrics could be incorporated into the annual bonus methodology in future years to continue to maintain strong alignment between the bonus program’s incentive structure and the metrics that are strongly correlated with increasing earnings and book value and driving stockholder returns.
For 2024, the Committee determined that 50% of the target amount of the financial performance component of annual bonuses would be realized based on 2024 Adjusted ROE and the other 50% of the target amount of the financial performance component of annual bonuses would be realized based on 2024 Adjusted EAD ROE.
◦Adjusted ROE. Adjusted ROE is a non-GAAP financial performance metric, which has historically been very closely correlated to Redwood’s ROE based on GAAP financial results, but differs in certain respects.
1 Note: Adjusted ROE and Adjusted EAD ROE should not be considered as alternatives to GAAP net income, GAAP ROE or other measurements of results of operations computed in accordance with GAAP or for federal income tax purposes. See Annex B to this Proxy Statement for additional discussion, disclosure and details regarding these non-GAAP financial performance metrics.
▪Adjusted ROE generally reflects adjusted earnings on average common equity capital adjusted to exclude certain unrealized mark-to-market gains and losses from equity. Because Adjusted ROE is a ratio of earnings to equity capital, the adjustment to exclude certain unrealized mark-to-market gains and losses from equity is made to enable the calculation of an “apples-to-apples” non-GAAP ratio of earnings to common equity capital for purposes of evaluating financial performance.
▪In addition, through adjustments to earnings, Adjusted ROE, among other things, excludes certain acquisition-related expenses – e.g., excludes amortization expense related to intangible assets acquired in acquisitions and the hypothetical income taxes associated with these adjustments.
The Committee believes that Adjusted ROE is an appropriate measure of financial performance to use within its methodology for determining realization of annual bonuses for Redwood’s executive officers because, among other reasons, a key source of earnings at Redwood is income from investments in mortgage loans and other real estate-related assets, as well as from mortgage banking activities and Adjusted ROE assists the Committee in analyzing the Company’s results of operations. It is also a performance metric that the Committee believes, over the long-term, should be correlated with long-term stockholder returns.
Additional discussion, disclosure and details relating to Adjusted ROE are set forth within Annex B to this Proxy Statement.
◦Adjusted EAD ROE. Adjusted EAD ROE is a non-GAAP financial performance metric derived from Redwood’s ROE based on GAAP financial results, but which differs in key respects. Adjusted EAD ROE is calculated by first deriving non-GAAP Adjusted Earnings Available for Distribution (“Adjusted EAD”) from earnings and then dividing Adjusted EAD by average common equity capital adjusted to exclude certain unrealized mark-to-market gains and losses from equity.
▪Adjusted EAD is derived from earnings through, among other things, the following adjustments: (i) exclude investment fair value changes, net; (ii) exclude realized gains and losses; (iii) exclude certain acquisition-related expenses – e.g., exclude amortization expense related to intangible assets acquired in acquisitions; and (vi) exclude certain organizational restructuring charges (as applicable).
The Committee believes that Adjusted EAD ROE is an appropriate measure of financial performance to use within its methodology for determining realization of annual bonuses for Redwood’s executive officers because, among other reasons, a key source of returns to Redwood’s stockholders is through regular quarterly dividends and Adjusted EAD ROE assists the Committee in analyzing the Company’s results of operations and helps to facilitate the Committee’s comparisons of Redwood’s financial performance to industry peers, including by supplementing the Committee’s analysis of the Company’s ability to pay dividends, and provides for the Committee an indication of the current income generating capacity of the Company's business operations on a quarterly basis. It is also a performance metric that the Committee believes, over the long-term, should be correlated with long-term stockholder returns.
Additional discussion, disclosure and details relating to Adjusted EAD and Adjusted EAD ROE are set forth within Annex B to this Proxy Statement.
Financial Performance Targets for 2024 Annual Bonuses. As noted above, for 2024, the Committee determined that 50% of the target amount of the financial performance component of annual bonuses would be realized based on 2024 Adjusted ROE and the other 50% of the target amount of the financial performance component of annual bonuses would be realized based on 2024 Adjusted EAD ROE, in each case based on 2024 financial performance relative to a 2024 target level established by the Committee in the first quarter of 2024. The 2024 financial performance targets established by the Committee were as follows: Adjusted ROE of 11.5% and Adjusted EAD ROE of 6.5%. In determining these financial performance targets for 2024, the
Committee took into account input from, management, its independent compensation consultant, and the Board of Directors, and followed a process consistent with how it has historically determined targets for the Company performance component of annual bonuses for executive officers.
The Committee decided to continue its historical practice of using an Adjusted ROE financial performance target determined at the beginning of each year based on a risk-free interest rate plus an incremental premium determined by the Committee to be appropriate (each of which can vary from year to year). This decision continued to be premised, as it was in 2023, in large part on the nature of Redwood’s business model, which has had a significant focus on investing in residential mortgage loans and other real-estate related loans and debt instruments. Returns that Redwood can earn on investments in residential mortgage loans and other real-estate related loans and debt investments are, to a certain extent, correlated with the market-driven interest rates for these and other types of loans and debt instruments (which rates depend on the perceived risk of these investments). These market-driven interest rates are typically analyzed as the risk-free interest rate for investment in U.S. Treasury obligations (or other debt backed by the full faith and credit of the U.S.) with a comparable duration plus an incremental risk premium above the risk-free rate.
The decision to use an Adjusted ROE target based on a risk-free interest rate plus an incremental premium was also premised on the fact that management believes that investors focused on investing in companies like Redwood, including companies that operate mortgage banking platforms, also compare return on equity to risk-free rates of return in evaluating Redwood’s financial performance and that the Adjusted ROE financial performance target should take into account stockholders’ return and dividend yield expectations. As a result, the Committee also reviewed recent and historical dividend yields on Redwood’s common stock and determined a range of incremental premiums above the risk-free rate that would be supportive of those yields. In addition to its review of market returns Redwood could earn on investments generated from mortgage banking operations, and the level of Adjusted ROE financial performance necessary to meet stockholders’ return and dividend yield expectations, the Committee reviewed the level of Adjusted ROE performance necessary to support the payment of regular quarterly dividends declared by the Board of Directors.
The Committee believes that setting an Adjusted ROE performance target at an appropriate level above the risk-free interest rate (by adding the incremental premium to the risk-free interest rate) establishes an incentive for executives to achieve attractive financial performance for Redwood (and aligns the interests of executives and stockholders in seeking this level of financial performance), without exposing Redwood to inappropriate risk. Overall, the Committee believes that the use of a performance target that can vary from year to year provides the ability to adjust compensation incentives in a manner consistent with Redwood’s business model and the market environment in which Redwood operates. For example, leading into 2024, when the 2024 target for Adjusted ROE was established, the market environment that Redwood would operate within during 2024 was generally contemplated to be one characterized by, among other things, declining benchmark interest rates, which would, all other factors being equal, support or increase the market value of certain portfolio assets and contribute to near-term mark-to-market gains that would be reflected in 2024 Adjusted ROE. This was one of various factors taken into account by the Committee in maintaining the Adjusted ROE target for 2024 at the 11.5% level that had been in place in 2023. Had the outlook for benchmark interest rates leading into 2024 been for a “higher-for-longer” benchmark interest rate environment, or for increasing benchmark interest rates, this would have been expected, all other factors being equal, to decrease the near-term market value of certain portfolio assets and contribute to mark-to-market losses, which could have contributed to a determination to lower the Adjusted ROE target to reflect these more challenging market conditions. Similarly, the outlook for credit spreads – which measure the yield on an investment demanded by the market based on that investment’s credit profile relative to benchmark interest rates – is an aspect of the market environment that Redwood operates in that is one of the factors the Committee considers when setting financial performance targets.
In setting an Adjusted EAD ROE financial performance target for 2024, the Committee took into account the factors described above with respect to its process for setting an Adjusted ROE target and also considered factors relating to the adjustments made to calculate Adjusted EAD ROE and how those adjustments assist management and investors in analyzing Redwood’s financial performance and help facilitate comparisons to
industry peers and how those adjustments can also supplement analysis of the Redwood’s ability to pay a sustainable and growing level of dividends. After consideration of the foregoing, as well as the alternative line-of-sight that this financial performance metric provides into fundamental Company performance and key metrics that drive stockholder value creation, the Committee believes it set the Adjusted EAD ROE target at an appropriate level for the market environment the Company expected to operate in during 2024 and thereby established an important incentive for executives to achieve attractive Adjusted EAD ROE financial performance for Redwood, without exposing Redwood to inappropriate risk.
Other Aspects of 2024 Annual Bonus Methodology. Following this process for determining the financial performance targets to be used in the methodology for determining Company performance bonuses, the Committee also established how above- and below-target bonus amounts would be formulaically determined based on these financial performance targets, as follows: (i) with respect to the portion of the financial performance component of annual bonus determined based on Adjusted ROE, no bonus amounts would be earned if Adjusted ROE was 2.875% or less; bonus amounts below or at the target bonus amounts would be earned if Adjusted ROE was between 2.875% and 11.5%; and bonus amounts in excess of the target bonus amounts would not be earned unless Adjusted ROE was more than 11.5%; and (ii) with respect to the portion of the financial performance component of annual bonus determined based on Adjusted EAD ROE, no bonus amounts would be earned if Adjusted EAD ROE was 1.625% or less; bonus amounts below or at the target bonus amounts would be earned if Adjusted EAD ROE was between 1.625% and 6.5%; and bonus amounts in excess of the target bonus amounts would not be earned unless Adjusted EAD ROE was more than 6.5%. Additional detail regarding the formulaic determination of above- and below-target bonus amounts based on these financial performance targets – i.e., the formulaic “leverage” of this annual bonus methodology – is set forth within Annex B to this Proxy Statement.
The use of an initial performance threshold of greater than 2.875% Adjusted ROE and greater than 1.625% Adjusted EAD ROE for the payment of any of portion of target Company performance bonuses based on these metrics, respectively, represents a determination by the Committee that financial performance below that threshold is not significant enough margin to merit payment of any portion of this component of annual bonuses. The payment of target Company performance bonuses or a portion of target Company performance bonuses for Adjusted ROE in the range between 2.875% and 11.5% and Adjusted EAD in the range between 1.625% and 6.5%, respectively, reflects the determination by the Committee that financial performance within this range merits payment of below-target or target Company performance bonuses as financial performance improves above the initial performance threshold.
The Committee also determined that for Adjusted ROE in excess of 11.5% and for Adjusted EAD ROE in excess of 6.5%, respectively, subject to the maximum total bonus opportunity for each executive officer noted below and assuming the individual performance bonuses are earned at target level, the Company performance bonus would be increased by a pro-rated amount for the portion based on such metric above the target amount (based on a straight-line, mathematical interpolation) as described in Annex B to this Proxy Statement, but subject to each executive officer’s maximum annual bonus opportunity (annual bonus cap).
Additionally, the Committee determined at the outset of 2024 that individual performance in 2024 for each executive officer would be reviewed in the context of, among other things, the specific pre-determined goals and factors discussed below under “Performance-Based Annual Bonuses Earned for 2024 — Individual Performance Component of 2024 Annual Bonuses.” As in past years, during 2024 these individual factors and goals were subject to adjustment when circumstances warranted, at the discretion of the Committee. For 2024, the individual performance component of annual bonuses could be earned up to 200% of the target amount depending on the Committee’s assessment of individual performance.
With respect to the maximum annual bonus opportunity (i.e., the maximum sum of the two components of the annual bonus) that each executive officer could earn for 2024, as disclosed in last year’s annual proxy statement, these annual bonus caps were reduced from the levels that applied in 2023 (3.5x of total target annual bonus for each executive officer) to 3.0x of total target annual bonus for each executive officer in 2024 and going forward.
Executive Officers’ 2024 Target Annual Bonus Amounts. At the end of 2023, the Committee made determinations with respect to each NEO’s target 2024 annual bonus after consultation with its independent compensation consultant and consideration of compensation peer group comparisons for the position, competitive factors and the executive officer’s role, experience, and performance at Redwood.
◦Mr. Abate. The Committee determined that the 2024 target bonus percentage for Mr. Abate would remain unchanged at 200% of base salary.
◦Mr. Robinson. The Committee determined that the 2024 target bonus percentage for Mr. Robinson would be increased from 190% to 195% of base salary.
◦Ms. Carillo. The Committee determined that the 2024 target bonus percentage for Ms. Carillo would be increased from 185% to 190% of base salary.
◦Ms. Macomber. The Committee determined that the 2024 target bonus percentage for Ms. Macomber would be increased from 150% to 175% of base salary.
◦Mr. Stone. The Committee determined that the 2024 target bonus percentage for Mr. Stone would be increased from 150% to 175% of base salary.
| | | | | | | | | | | | | | | | | | | | |
| 2024 | | 2024 | 2024 |
| Base Salary | | Target Annual Bonus | Target Annual Bonus |
NEO | ($ per annum) | | (as % of Base Salary) | | ($) |
Mr. Abate, Chief Executive Officer | $ | 950,000 | | 200% | $ | 1,900,000 |
Mr. Robinson, President | $ | 875,000 | | 195% | $ | 1,706,250 |
Ms. Carillo, Chief Financial Officer | $ | 825,000 | | 190% | $ | 1,567,500 |
Ms. Macomber, Chief Human Resource Officer | $ | 500,000 | | 175% | $ | 875,000 |
Mr. Stone, Executive Vice President and Chief Legal Officer | $ | 500,000 | | 175% | $ | 875,000 |
Performance-Based Annual Bonuses Earned for 2024
Annual performance-based bonuses earned by executive officers for 2024 consisted of both a Company performance component and an individual performance component. A further discussion of each of these components is set forth below.
Company Performance Component of 2024 Annual Bonuses. As described above, for 2024, the Committee determined that 50% of the target amount of the Company performance component of annual bonuses would be realized based on 2024 Adjusted ROE and the other 50% of the target amount of the Company performance component of annual bonuses would be realized based on 2024 Adjusted EAD ROE.
◦Redwood’s Adjusted ROE for 2024 was above the initial performance threshold of 2.875% Adjusted ROE, but below the financial performance target of 11.5% Adjusted ROE. Accordingly, the portion of the Company performance component of 2024 annual bonuses determined based on Adjusted ROE was realized at 39% of the target amount for that component.
◦Redwood’s Adjusted EAD ROE for 2024 was above the initial performance threshold of 1.625%, but below the financial performance target of 6.5% for Adjusted EAD ROE. Accordingly, the portion of the Company performance component of 2024 annual bonuses determined based on Adjusted EAD ROE was realized at 95% of the target amount for that component.
The table below sets forth the target bonus amount for each NEO for the Company performance component of annual bonus, together with the amount of this component each executive officer realized/earned based on the Company’s financial performance in 2024.
| | | | | | | | | | | | | | | | | | | | | | | |
| Company Performance Component of 2024 Target Annual Bonus | | 2024 Company Performance Component of Annual Bonus Earned | | % of Company Performance Component Earned |
NEO | ($) | | ($) | | (%) |
Mr. Abate, Chief Executive Officer | $ | 1,425,000 | | $ | 956,196 | | 67.1% |
Mr. Robinson, President | $ | 1,279,687 | | $ | 858,690 | | 67.1% |
Ms. Carillo, Chief Financial Officer | $ | 1,175,625 | | $ | 788,862 | | 67.1% |
Ms. Macomber, Chief Human Resource Officer | $ | 656,250 | | $ | 440,353 | | 67.1% |
Mr. Stone, Executive Vice President and Chief Legal Officer | $ | 656,250 | | $ | 440,353 | | 67.1% |
Individual Performance Component of 2024 Annual Bonuses. For 2024, the individual performance components of annual bonuses were determined after a review of each NEO’s individual achievements and contributions to the collective achievements of the senior management team. The Committee reviewed the performance of the NEOs as a team, which included a review of the NEOs’ self-assessment and the assessment by Mr. Abate of the other NEOs. Among other factors, the Committee considered contributions to the achievement of the company-wide goals noted below in assessing individual performance for 2024. With respect to each of these goals, the Committee took into account various factors (other than the Company’s financial performance) in evaluating the level of attainment of the goal and contributions to achieving the goal, including the principal factors described below and the related level of attainment (presented in italics after each listed goal). In considering these goals and factors, the Committee did not assign specific weightings to each factor and goal, but instead considered them together as part of a comprehensive qualitative review.
Goal – Capital, Financing and Liquidity: Diversify and manage overall sources and structures of capital and financing to mitigate risk, advance long-term asset management objectives through additional dedicated capital and financing relationships, and unlock and access additional capital for redeployment into our mortgage banking businesses and portfolio investments.
The Committee evaluated achievement of this goal in the context of various factors, including that during 2024 management’s initiatives relating to capital, financing, liquidity and financial risk management resulted in: successful completion of a senior notes offering in early 2024, followed by a second senior notes offering in June 2024; issuance of additional convertible debt through the reopening of Redwood’s outstanding series of convertible senior notes due in 2027; a significant reduction in the outstanding balance of debt maturing through year-end 2026; establishment of strategic capital relationship with the Canada Pension Plan (“CPP”), which included a secured corporate financing facility with a total capacity of up to $250 million and a $500 million asset joint venture to invest across the broad suite of CoreVest originated bridge and term loans; establishment and renewal of various secured financing lines, including to increase the investment capacity of the CPP joint venture to $1.5 billion; completing an inaugural securitization of CPP joint venture assets; and unlocking significant capital for reinvestment through securitization of portfolio assets.
Goal – CoreVest Mortgage Banking: Execute on strategic initiatives related to growth and increasing the profitability of Redwood’s CoreVest Mortgage Banking business – including initiatives related to product focus, origination volumes, distribution strategy, expense structure, and resolution of special assets – while maintaining risk and operational discipline and seeking synergies with other business units within Redwood.
The Committee evaluated achievement of this goal in the context of various factors, including that during 2024 management’s initiatives relating to the CoreVest Mortgage Banking business resulted in: an overall increase in loan fundings of 9% compared to 2023; establishment of relationships with insurance company capital and sale of more than $300 million of CoreVest originated loans to insurance company portfolios; the sale of more than $800 million of CoreVest originated loans to joint ventures; establishment of additional relationships with whole-loan buyers of CoreVest-originated loans, further diversifying loan distribution channels alongside continued distribution through securitization transactions; successful focus on origination and distribution of single-asset bridge loans, with record quarterly funding levels for this product across 2024; a meaningful increase in origination of debt-service coverage (“DSCR”) loans; enhanced non-performing loan asset management staffing and increased resolutions and line-of-sight to resolutions of special assets; and rationalization of workforce and expense structure, including increased cross-training across product line, resulting in a return to profitability for this business segment.
Goal – Sequoia Mortgage Banking: Execute on strategic initiatives responsive to evolving consumer residential mortgage market – including initiatives related to deepening relationships with banks, growing business activity under our Aspire initiative related to expanded prime mortgage loans and home equity investments (“HEI”) – while maintaining risk and operational discipline and seeking synergies with other business units within Redwood.
The Committee evaluated achievement of this goal in the context of various factors, including that during 2024 management’s initiatives relating to the Sequoia Mortgage Banking business resulted in: a greater than 150% increase in loan volume compared to 2023, significantly increasing overall market share; continued focus on relationships with banks, resulting in both enhanced acquisition and disposition channels for residential consumer mortgage loans; issuance of the highest number of residential consumer mortgage loan securitization transactions under the SEMT® brand since 2013 and 2018; a four-fold increase in whole-loan sales, an important distribution channel that balances reliance on the securitization market; the launch of our closed-end second mortgage loan acquisition initiative; responding to the evolving needs of the housing market through expansion of our Aspire initiative, which included establishing a footprint to directly originate HEI in more than ten states, and creating the infrastructure for new expanded prime product launches to commence in early 2025; and the successful leveraging of existing Sequoia operational staff to support Aspire initiatives, enhance efficiency, reduce cost-per-loan and increase profitability of this nosiness segment.
Goal – Investment Portfolio: Within Redwood’s Investment Portfolio pursue investing strategies complementary to Redwood’s mortgage banking businesses and generate net interest income to support regular quarterly dividends, proactively monitor markets for relative value opportunities in non-Agency mortgage credit, including interest-only securities and third-party issued residential consumer mortgage credit investments, and deploy capital within established guidelines, including relating to duration and use of leverage.
The Committee evaluated achievement of this goal in the context of various factors, including that during 2024 management’s actions related to portfolio investments resulted in: deployment of more than $500 million of capital into high-conviction strategies with attractive target yields, with an appropriate mix of third-party sourced investments and assets created from Redwood’s mortgage banking businesses; continuing generation of meaningful levels of net interest income supportive of quarterly dividends; and maintenance of discipline around the duration, liquidity and leverage profile targeted for deployment during 2024.
Goal – Human Capital: Support near- and long-term business and strategic goals and initiatives through strong human capital management and engagement initiatives; and continue to invest in training, programs, and mentorship efforts that contribute to leadership and talent development.
The Committee evaluated achievement of this goal in the context of various factors, including that during 2024 management’s initiatives relating to human capital resulted in: maintaining a strong workforce culture with a consistent cadence of employee programming, training, and events that were the foundation for maintaining a below-industry level of voluntary turnover and furthering workforce engagement, despite a rationalization of the workforce in the first quarter of 2024; consistent and constructive interaction among employees at all levels of the organization, including through regular company-wide and business unit-specific “town hall” meetings, community and volunteer events, and recognition and celebration of employee achievements; and implementation of an updated talent review and promotion framework that further clarified criteria for advancement, streamlined our promotion process, and provided management with further visibility into our succession pipeline.
Based on the review described above, the individual performance components of annual bonuses for each NEO for 2024 were determined, as set forth in the table below.
| | | | | | | | | | | | | | | | | | | | |
| Individual Performance Component of 2024 Target Annual Bonus | | % of Individual Performance Component Earned | 2024 Individual Performance Component of Annual Bonus Realized/Earned |
NEO | ($) | | (%) | | ($) |
Mr. Abate, Chief Executive Officer | $ | $475,000 | | 130% | $ | $617,500 |
Mr. Robinson, President | $ | $426,563 | | 130% | $ | $554,531 |
Ms. Carillo, Chief Financial Officer | $ | $391,875 | | 140% | $ | $548,625 |
Ms. Macomber, Chief Human Resource Officer | $ | $218,750 | | 120% | | $262,500 |
Mr. Stone, Executive Vice President and Chief Legal Officer | $ | $218,750 | | 120% | $ | $262,500 |
Total Performance-Based Annual Bonus Earned for 2024. Based on the realization of the Company performance and individual performance components of annual bonuses described above, the table below sets forth the total performance-based annual bonus realized by each NEO for 2024.
| | | | | | | | | | | | | | | | | | | | |
| 2024 Target Annual Bonus | | 2024
Annual Bonus
Realized | 2024 Annual Bonus Realized |
NEO | ($) | | ($) | | (% of Target) |
Mr. Abate, Chief Executive Officer | $ | $1,900,000 | | $1,573,696 | $ | 82.8% |
Mr. Robinson, President | $ | $1,706,250 | | $1,413,221 | $ | 82.8% |
Ms. Carillo, Chief Financial Officer | $ | $1,567,500 | | $1,337,487 | $ | 85.3% |
Ms. Macomber, Chief Human Resource Officer | $ | $875,000 | | $702,853 | | 80.3% |
Mr. Stone, Executive Vice President and Chief Legal Officer | $ | $875,000 | | $702,853 | $ | 80.3% |
2024 Long-Term Equity-Based Incentive Awards
Equity ownership in Redwood provides an important link between the interests of stockholders and executives by rewarding long-term stockholder value creation. To meet this objective, officers, directors, key employees, and other persons expected to contribute to Redwood’s management, growth, and profitability are eligible to receive long-term equity-based awards. The Committee oversees the issuance of these awards to NEOs. The Committee, in consultation with its independent compensation consultant, determines the types and sizes of awards granted based upon a number of factors, including the executive officer’s position, responsibilities, total compensation level, individual and company financial performance, competitive factors, and compensation peer group comparisons.
The Committee’s annual practice is generally to determine the size of long-term equity-based awards to NEOs at the regularly scheduled (pre-established) fourth quarter meeting of the Committee (which for 2024 occurred on in December 2024), with the grant date for such awards in 2024 being December 19, 2024.
The long-term equity-based awards the Committee granted to NEOs in 2024 were in three forms: Deferred Stock Units (“DSUs”), cash-settled RSUs (“csRSUs”), and Performance Stock Units (“PSUs”), the key terms of which are summarized below.
| | | | | |
| • | The DSUs granted to NEOs on December 19, 2024 will vest over four years, with 25% vesting on January 31, 2026, and an additional 6.25% vesting on the last day of each subsequent quarter (beginning with the quarter ending March 31, 2026), with full vesting occurring on December 18, 2028. Shares of Redwood common stock underlying these DSUs will be distributed to the recipients not earlier than December 18, 2028 and not later than December 31, 2028, unless electively deferred under the terms of Redwood’s Executive Deferred Compensation Plan. |
| | | | | |
| • | The csRSUs granted to NEOs on December 19, 2024 will vest over four years, with 25% vesting on December 18, 2025, and an additional 25% vesting on December 18th of each of 2026, 2027 and 2028. The terms of the csRSUs granted on December 19, 2024 are otherwise generally consistent with the terms of the DSUs noted above, except that at each csRSU vesting date, the value of the common stock referenced by the csRSUs vesting on such date will be settled with a cash payment, rather than through the delivery of shares of common stock, based on the closing price of Redwood’s common stock on such vesting date. |
| | | | | |
| • | The PSUs granted to NEOs on December 19, 2024 are performance-based equity awards which provide for vesting to generally range from 0% to 250% of the target number of PSUs granted, with the target number of PSUs adjusted to reflect the value of any dividends declared on Redwood common stock during the vesting period (as further described below). Vesting of these PSUs will generally occur based on the performance metrics described below during a three-year measurement period and continued employment through January 1, 2028. Further detail on performance-based vesting of the PSUs granted in December 2024 is set forth below. |
Performance-Based Vesting – PSUs Granted in December 2024. Performance-based vesting of the PSUs granted to NEOs in December 2024 will generally occur as of January 1, 2028, after a three-year performance measurement period encompassing January 1, 2025 to December 31, 2027, based on a three-step process as described below.
| | | | | |
First, the target number of PSUs granted (“Target PSUs”) is divided into two tranches of Target PSUs, as follows:
|
| (1) | one tranche (the “bvTSR Tranche”) represents 66.7% of the Target PSUs, with vesting for this portion of the Target PSUs to range from 0% to 250% of this portion of the Target PSUs based on the level of Redwood’s book value TSR (or “bvTSR”) over the three-year performance measurement period, with 100% of this portion of the Target PSUs vesting if cumulative bvTSR for the three-year performance period is 25%; and |
| (2) | a second tranche (the “rTSR Tranche”) represents 33.3% of the Target PSUs, with vesting for this portion of the Target PSUs to range from 0% to 250% of this portion of the Target PSUs based on the level of Redwood’s relative TSR (or “rTSR”) over the three-year performance measurement period, with 100% of this portion of the Target PSUs vesting if rTSR for the three-year performance period is at the 55th percentile relative to the comparator group of companies described below. |
◦Vesting for the bvTSR tranche of these PSUs will be in accordance with the following table:
| | | | | | | | | | | | | | | | | | | | | | | | | | | | | | | | | | | | | | | | | | | | | | | | | | | | | | | | | | | |
| | | | | Cumulative bvTSR Over Three-Year Period: | | % of Performance-Based Vesting:* | | |
| | | | | Less than 12.5% bvTSR | 0% | | |
| | | | | 12.5% bvTSR | 50% | | |
| | | | | 25% bvTSR | 100% | | |
| | | | | 37.5% or greater bvTSR | 250% | | |
| | | | | | | | | |
* | If actual bvTSR is between two of the performance thresholds set forth in this table, the percentage of performance-based vesting is determined based on a straight-line, mathematical interpolation between the applicable performance-based vesting percentages. | | |
◦Vesting for the rTSR tranche of these PSUs will be in accordance with the following table:
| | | | | | | | | | | | | | | | | | | | | | | | | | | | | | | | | | | | | | | | | | | | | | | | | | | | | | | | | | | |
| | Three-Year Relative TSR (“rTSR”): | | % of Performance-Based Vesting:* | | | |
| | Less than 27.5th percentile | | 0% | | |
| | | | 27.5th percentile | | | | 50% | | |
| | 55th percentile | | 100% | | |
| | 82.5th percentile or greater | | 250% | | |
| | |
| * | If actual relative TSR is between two of the performance thresholds set forth in this table, the adjustment to baseline vesting is determined based on a straight-line, mathematical interpolation between the applicable percentage point adjustments. | | | | | | |
◦bvTSR for the PSUs granted in December 2024 is generally defined as the percentage by which Redwood’s GAAP book value per share (after reversing the net impact of specified acquisition-related accounting items) has increased or decreased as of the last day of the three-year performance measurement period relative to the first day of such period, plus the value of cash dividends declared and/or paid during such period on Redwood common stock.
◦rTSR for the PSUs granted in December 2024 is generally defined as Redwood’s three-year rTSR compared to a subset of the component companies of the FTSE NAREIT Mortgage REITs Index, as constituted on December 31, 2024, categorized within that index as “Property Sector: Mortgage-Home Financing” (other than Redwood), expressed as a percentile of relative performance.
Second, at the end of the three-year vesting period, the aggregate vesting level of the two tranches would be determined as the sum of (i) the bvTSR-based vesting of the bvTSR Tranche and (ii) rTSR-based vesting of the rTSR Tranche.
Third, if the aggregate vesting level after steps one and two is greater than 100% of the Target PSUs, but Redwood’s absolute total shareholder return (“TSR”) is negative over the three-year performance period, performance-based vesting will be capped at 100% of Target PSUs.
◦Absolute TSR is generally defined as the percentage by which the per share price of Redwood’s common stock has increased or decreased as of the last day of the three-year performance measurement period relative to the first day of such period, adjusted to reflect the reinvestment of all dividends declared and/or paid during such period on Redwood common stock.
Vested shares of Redwood common stock underlying these PSUs, if any, will be distributed to the recipients not later than 45 days following April 1, 2028, unless electively deferred under the terms of Redwood’s Executive Deferred Compensation Plan. Prior to vesting, no dividend equivalent rights are paid in respect of PSUs. At the time of vesting, the value of any dividends paid during the vesting period will be reflected in the PSUs by increasing the target number of PSUs granted by an amount corresponding to the incremental number of shares of Redwood common stock that a stockholder would have acquired between the grant date and the end of the three-year performance measurement period, had all dividends during that period been reinvested in Redwood common stock on the applicable dividend payment dates. After the vesting of any of these PSUs on January 1, 2028, and until the delivery of the underlying shares of Redwood common stock, the underlying vested award shares will have attached dividend equivalent rights, resulting in the payment of dividend equivalents each time Redwood pays a common stock dividend.
Equity-Based Award Agreements. The terms of the DSUs, csRSUs, and PSUs granted in 2024 are established under applicable equity-based award agreements and Redwood’s 2014 Incentive Plan. These terms include provisions relating to dividend equivalent rights, forfeiture, retirement, mandatory net settlement for income tax withholding purposes, and change-in-control.
NEOs’ 2024 Year-End Long-Term Equity-Based Incentive Award Values. The Committee made the following determinations with respect to the value of 2024 year-end long-term equity-based incentive awards granted to NEOs in December 2024 after consultation with its independent compensation consultant, a review of compensation peer group comparisons for the position and consideration of competitive factors, and the executive officer’s role, experience, and performance at Redwood.
◦Mr. Abate. In December 2024, the Committee determined that the aggregate grant date fair value of year-end, long-term equity-based incentive awards granted to Mr. Abate would total $4.35 million, with this award value granted as: $2.3925 million in PSUs (55% of total value), $652,500 in DSUs (15% of total value), and $1.305 million in csRSUs (30% of total value).
◦Mr. Robinson. In December 2024, the Committee determined that the aggregate grant date fair value of year-end, long-term equity-based incentive awards granted to Mr. Robinson would total $3.6 million, with this award value granted as: $1.8 million in PSUs (50% of total value), $612,000 in DSUs (17% of total value), and $1.188 million in csRSUs (33% of total value).
◦Ms. Carillo. In December 2024, the Committee determined that the aggregate grant date fair value of year-end, long-term equity-based incentive awards granted to Ms. Carillo would total $3.5 million, with this award value granted as: $1.75 million in PSUs (50% of total value), $595,000 in DSUs (17% of total value), and $1.155 million in csRSUs (25% of total value).
◦Ms. Macomber. In December 2024, the Committee determined that the aggregate grant date fair value of year-end, long-term equity-based incentive awards granted to Ms. Macomber would total $1.5 million, with this award value granted as: $750,000 in PSUs (50% of total value), $255,000 in DSUs (17% of total value), and $495,000 in csRSUs (33% of total value).
◦Mr. Stone. In December 2024, the Committee determined that the aggregate grant date fair value of year-end, long-term equity-based incentive awards granted to Mr. Stone would total $1.5 million, with this award value granted as: $750,000 in PSUs (50% of total value), $255,000 in DSUs (17% of total value), and $495,000 in csRSUs (33% of total value).
The number and grant date fair value of DSUs, csRSUs and PSUs comprising the 2024 year-end long-term equity-based awards granted to each NEO in December 2024 are set forth in the table below.
| | | | | | | | | | | | | | | | | | | | | | | | | | | | | | | | | | | | | | | | | | | |
| | Deferred Stock Units (“DSUs”)(1) | | | | Cash Settled Restricted Stock Units (“csRSUs”)(1) | | | | Performance Stock Units (“PSUs”)(1) | |
NEO | | # | | Aggregate Grant Date Fair Value | | # | | Aggregate Grant Date Fair Value | | # | | Aggregate Grant Date Fair Value |
Mr. Abate, Chief Executive Officer | | 98,268 | | $ | 652,500 | | | 196,536 | | $ | 1,304,999 | | | 318,893 | | $ | 2,392,495 | |
Mr. Robinson, President | | 92,168 | | $ | 611,996 | | | 178,915 | | $ | 1,187,996 | | | 239,920 | | $ | 1,800,000 | |
Ms. Carillo, Chief Financial Officer | | 89,608 | | $ | 594,997 | | | 173,945 | | $ | 1,154,995 | | | 233,255 | | $ | 1,749,996 | |
| | | | | | | | | | | | |
Ms. Macomber, Chief Human Resource Officer | | 38,403 | | $ | 254,996 | | | 74,548 | | $ | 494,999 | | | 99,966 | | $ | 749,995 | |
Mr. Stone, Executive Vice President and Chief Legal Officer | | 38,403 | | $ | 254,996 | | | 74,548 | | $ | 494,999 | | | 99,966 | | $ | 749,995 | |
(1) Grant date fair value determined at the time the grant was made in accordance with FASB Accounting Standards Codification Topic 718. The value of dividend equivalent rights associated with DSUs and csRSUs and the value of any increase in the target number of PSUs to reflect dividends paid during the performance period were taken into account in establishing the grant date fair value of these DSUs, csRSUs and PSUs under FASB Accounting Standards Codification Topic 718 at the time the awards were granted. Therefore, dividend equivalent right payments and any increase in the target number of PSUs to reflect dividends paid during the performance period are not considered part of the compensation or other amounts reported in the summary table of executive compensation under “Executive Compensation Tables — Summary Compensation,” or reported below under “Executive Compensation Tables — Grants of Plan-Based Awards.”
Vesting and Mandatory Holding Periods for 2024 Long-Term Equity-Based Incentive Awards
DSUs Granted in December 2024. The DSUs granted to executive officers in December 2024 have the four-year vesting schedule described above on pages 66-69 within this CD&A under the heading “2024 Long-Term Equity-Based Incentive Awards.” Notwithstanding this vesting schedule, while continuously employed, the executive officers are subject to a mandatory four-year holding period with respect to these DSU awards, with the result that these DSU awards are not scheduled to be distributed to recipients in shares of Redwood common stock until four years following the grant date (i.e., in December 2028).
csRSUs Granted in December 2024. The cash-settled RSUs (“csRSUs”) granted to executive officers in December 2024 have the four-year vesting schedule described above on pages 66-69 within this CD&A under the heading “2024 Long-Term Equity-Based Incentive Awards.”
PSUs Granted in December 2024. The PSUs granted to executive officers in December 2024 have the three-year vesting/performance measurement period described above on pages 66-69 within this CD&A under the heading “2024 Long-Term Equity-Based Incentive Awards.” For any of these PSUs that vest, they will be distributed to recipients in shares of Redwood common stock not later than 45 days following April 1, 2028.
Pay-for-Performance Outcomes from Long-Term Equity-Based Incentive Awards
As described above, long-term incentive awards (collectively, “LTI Awards”), including awards in the form of DSUs and PSUs, are a significant component of Redwood’s performance-based compensation program, and generally account for a majority of each NEO’s annual target compensation. These LTI Awards are a key component of the overall executive compensation program, as actual value delivery/realization from these LTI Awards aligns executive compensation with long-term stockholder return experiences, with a key focus on three-year performance measurement periods.
As detailed below, in 2024 Redwood’s NEOs vested into realized and delivered compensation from LTI Awards awarded in prior years as follows:
Mr. Abate: (i) vesting and delivery of 106,898 DSUs granted in December 2020; (ii) vesting and settlement of 106,898 csDSUs granted in December 2020; (iii) vesting and settlement of 29,605 csRSUs (which was a tranche consisting of 25% of the csRSUs granted in December 2023); and (iv) performance-based vesting of 67,591 PSUs granted in December 2021, which represented 35% of the target number of PSUs granted in December 2021 (based on level of overall attainment of performance-based vesting criteria).
◦As described and illustrated above in the Executive Summary of CD&A on page 42 of this Proxy Statement with respect to Mr. Abate, performance-based vesting of the PSUs granted in December 2021 was driven by both (a) Redwood’s three-year TSR over the January 1, 2022 to December 31, 2024 period, which was significantly below target, and (b) Redwood’s bvTSR over this same period, which, as measured in accordance with the terms of these PSUs, was 27.5% of target level.
Mr. Robinson: (i) vesting and delivery of 71,265 DSUs granted in December 2020; (ii) vesting and settlement of 71,265 csDSUs granted in December 2020; (iii) vesting and settlement of 28,081 csRSUs (which was a tranche consisting of 25% of the csRSUs granted in December 2023); and (iv) performance-based vesting of 50,693 PSUs granted in December 2021, which represented 35% of the target number of PSUs granted in December 2021 (based on level of overall attainment of performance-based vesting criteria).
◦As described and illustrated above in the Executive Summary of CD&A on page 42 of this Proxy Statement with respect to Redwood’s CEO, performance-based vesting of the PSUs granted in December 2021 was driven by both (a) Redwood’s three-year TSR over the January 1, 2022 to December 31, 2024 period, which was significantly below target, and (b) Redwood’s bvTSR over this same period, which, as measured in accordance with the terms of these PSUs, was 27.5% of target level.
Ms. Carillo: (i) vesting and settlement of 26,075 csRSUs (which was a tranche consisting of 25% of the csRSUs granted in December 2023); and (ii) performance-based vesting of 30,979 PSUs granted in December 2021, which represented 35% of the target number of PSUs granted in December 2021 (based on level of overall attainment of performance-based vesting criteria).
◦As described and illustrated above in the Executive Summary of CD&A on page 42 of this Proxy Statement with respect to Redwood’s CEO, performance-based vesting of the PSUs granted in December 2021 was driven by both (a) Redwood’s three-year TSR over the January 1, 2022 to December 31, 2024 period, which was significantly below target, and (b) Redwood’s bvTSR over this same period, which, as measured in accordance with the terms of these PSUs, was 27.5% of target level.
Ms. Macomber: (i) vesting and delivery of 22,805 DSUs granted in December 2020; (ii) vesting and settlement of 22,805 csDSUs granted in December 2020; (iii) vesting and settlement of 12,035 csRSUs (which was a tranche consisting of 25% of the csRSUs granted in December 2023); and (iv) performance-based vesting of 16,897 PSUs granted in December 2021, which represented 35% of the target number of PSUs granted in December 2021 (based on level of overall attainment of performance-based vesting criteria).
◦As described and illustrated above in the Executive Summary of CD&A on page 42 of this Proxy Statement with respect to Redwood’s CEO, performance-based vesting of the PSUs granted in December 2021 was driven by both (a) Redwood’s three-year TSR over the January 1, 2022 to December 31, 2024 period, which was significantly below target, and (b) Redwood’s bvTSR over this same period, which, as measured in accordance with the terms of these PSUs, was 27.5% of target level.
Mr. Stone: (i) vesting and delivery of 29,931 DSUs granted in December 2020; (ii) vesting and settlement of 29,931 csDSUs granted in December 2020; (iii) vesting and settlement of 12,035 csRSUs (which was a tranche consisting of 25% of the csRSUs granted in December 2023); and (iv) performance-based vesting of 16,897 PSUs granted in December 2021, which represented 35% of the target number of PSUs granted in December 2021 (based on level of overall attainment of performance-based vesting criteria).
◦As described and illustrated above in the Executive Summary of CD&A on page 42 of this Proxy Statement with respect to Redwood’s CEO, performance-based vesting of the PSUs granted in December 2021 was driven by both (a) Redwood’s three-year TSR over the January 1, 2022 to December 31, 2024 period, which was significantly below target, and (b) Redwood’s bvTSR over this same period, which, as measured in accordance with the terms of these PSUs, was 27.5% of target level.
| | | | | | | | | | | | | | |
| Section III - Other Compensation, Plans and Benefits |
| | |
| Ø | Deferred Compensation |
| | |
| Ø | Employee Stock Purchase Plan |
| | |
| Ø | 401(k) Plan and Other Matching Contributions |
| | |
| Ø | Other Compensation and Benefits |
| | |
| Ø | Severance and Change of Control Arrangements |
| | | | |
Deferred Compensation
Under Redwood’s Executive Deferred Compensation Plan, NEOs (and other eligible officers of Redwood) may elect to defer up to 100% of their cash compensation as well as dividend equivalent right payments in respect of LTI Awards and, under certain circumstances, can also elect to re-defer scheduled distributions of cash or stock from the plan. Additionally, delivery of shares of Redwood common stock underlying LTI Awards granted under Redwood’s 2014 Incentive Plan may be deferred under the Executive Deferred Compensation Plan. Deferred amounts may be deferred until a date chosen by the participant in the plan at the time of the initial deferral (subject to certain restrictions) or until separation from service, at which time the balance in the participant’s account will be delivered in cash or common stock (as applicable), or paid out over a period of up to 15 years, depending upon deferral elections.
Cash amounts deferred under the Executive Deferred Compensation Plan are credited with interest at 120% of the long-term applicable federal rate as published by the IRS, which does not constitute above-market interest under IRS regulations. As an example, for December 2024, 120% of the long-term applicable federal rate was approximately 5.3% per annum. Cash balances deferred under the Executive Deferred Compensation Plan remain available to Redwood for general corporate purposes subject to the obligation to deliver the deferred amounts on the deferral date. The ability of participants to receive interest on deferred amounts is one incentive to participate in this Plan, and has the benefit of making the funds available for use by Redwood.
Redwood also matches 50% of cash compensation deferred by participants in the Executive Deferred Compensation Plan, provided that total matching payments and contributions made by Redwood to participants in the Executive Deferred Compensation Plan and Redwood’s 401(k) plan (discussed below) are limited to 6% of base salary. Participants are fully vested in all prior and all new matching payments after three years of employment. Redwood believes the Executive Deferred Compensation Plan provides a vehicle for executive officers and other participants to plan for retirement and supports tax planning flexibility.
Employee Stock Purchase Plan
Redwood offers all eligible employees (including NEOs) the opportunity to participate in a tax-qualified Employee Stock Purchase Plan (“ESPP”). Through payroll deductions, employees can purchase shares of Redwood’s common stock at a discount from fair market value on a quarterly basis. The purchase price per share is the lower of (a) 85% of the fair market value per share on the first day of each 12-month offering period (January 1st) and (b) 85% of the fair market value per share on the purchase date (the end of each calendar quarter, March 31st, June 30th, September 30th, and December 31st). An employee is eligible to participate in the ESPP at the beginning of the quarter following 90 consecutive days of employment. Employees are allowed to contribute up to 15% of their cash compensation, subject to a limit of $25,000 per offering period based on the stock’s value on the first day of the offering period, which is equivalent to a calendar year.
401(k) Plan and Other Matching Contributions
During 2024, Redwood offered a tax-qualified 401(k) plan to all eligible employees (including NEOs) for retirement savings. Under this plan, during 2024, eligible employees, including NEOs, were allowed to contribute and invest up to 100% of their cash earnings, subject to the maximum 401(k) contribution amount under Federal law. Contributions can be invested in a diversified selection of mutual funds.
In order to encourage participation and to provide a retirement planning benefit to employees, during 2024 Redwood also generally provided a matching contribution of up to 50% of employees’ 401(k) plan contributions, provided that matching contributions to the 401(k) plan were limited to the lesser of 4% of an employee’s cash compensation or $11,500. Employees who are provided with matching contributions are fully vested in all prior and all new matching contributions after three years of employment. As noted above, for 2024, total matching payments made to participants in the Executive Deferred Compensation Plan (taken together with matching contributions to the 401(k) plan) were limited to 6% of base salary.
Other Compensation and Benefits
During 2024, Redwood also provided employees (including NEOs) with certain other health and welfare benefits, generally consisting of: medical, dental, vision, disability, and life insurance, a disability income continuation program (which can supplement disability insurance payments), a paid parental leave program, an employee assistance program (which is a standard package of assistance benefits such as counseling and legal and financial consultation and referral services), a fitness-related activity reimbursement program, a housing-related benefit program (which assists with mortgage insurance and renter’s insurance premiums), a health savings account program and a flexible spending account program. The provision of these types of benefits is important in attracting and retaining employees. These plans were available in 2024 to all eligible employees on a substantially similar basis. During 2024, Redwood paid a portion of all employees’ monthly premium for medical and dental coverage, as well as for basic long-term disability and life insurance provided through Redwood plans. With respect to NEOs, in 2024 Redwood also offered a concierge medical benefit, which certain NEOs participated in.
Severance and Change of Control Arrangements
For NEOs and other Redwood employees, the terms of outstanding long-term incentive award agreements include “change of control” double-trigger protection that provide for the acceleration of outstanding awards in the event of a termination without “cause” or a termination of employment with “good reason,” following a “change of control.” Within these award agreements, Redwood’s entry into an agreement with a third-party management company to externally manage all or substantially all of Redwood’s assets and/or operations is referred to as an “externalization of management” and is generally treated analogously to a “change of control”.
In addition, each of Redwood’s NEOs has entered into an employment agreement with Redwood, which provide for severance payments and vesting (or, as applicable, non-forfeiture) of equity-related awards in the event Redwood terminates the executive’s employment without “cause” or the executive terminates his or her employment for “good reason” outside of a change of control context. These employment agreements also provide for payments and vesting of equity-related awards in the event of the executive’s death or disability. These agreements were entered into in order to attract and retain these executives in the competitive marketplace for executive talent.
In the event of a “change of control,” these employment agreements provide for vesting of long-term incentive awards only after a “double trigger” — meaning that no awards would vest unless the executive is terminated without “cause” or, in certain cases, terminates his or her employment with “good reason,” following such a “change of control.” In addition, under these employment agreements, following a “change of control,” if the surviving or acquiring corporation does not assume outstanding long-term incentive awards or substitute equivalent awards, then the long-term incentive awards will generally vest in full. Within the
employment agreement of each executive officer, Redwood’s entry into an agreement with a third-party management company to externally manage all or substantially all of Redwood’s assets and/or operations is referred to as an “externalization of management” and is generally treated analogously to a “change of control”.
For all NEOs, under the award agreements governing outstanding PSUs (and any outstanding cash-settled PSUs), in the event of a “change of control,” the per share price paid in connection with the change of control will be used to calculate TSR when determining performance-based vesting that is based on TSR. When applicable, absolute TSR performance goals will be annualized to reflect the number of days completed in the performance-measurement period (from the first day of the period through the closing date of the change of control).
The various levels of post-termination benefits for each of the NEOs were determined by the Committee to be appropriate based on that executive’s duties and responsibilities with Redwood and were the result of arm’s-length negotiations with these individuals. The different levels were also determined to be appropriate and reasonable when compared to post-termination benefits provided by Redwood’s peers to executives with similar titles and similar levels of responsibility. The levels of benefit were also intended to take into account the expected length of time and difficulty the executive may experience in trying to secure new employment. The amount of the severance is balanced against Redwood’s need to be responsible to its stockholders and also considers the potential impact the severance payments may have on other potential parties to a “change in control” transaction.
The terms of the severance and change of control arrangements that were in place with NEOs at the end of 2024 are described in more detail below under “Potential Payments upon Termination or Change of Control.”
Redwood does not provide for excise tax gross-ups for change-in-control severance payments. Redwood does not have any agreements in place with any NEO (or any other employee) that provide for an excise tax gross-up for a change-in-control severance payment, whether imposed under Section 280G of the Internal Revenue Code of 1986, as amended (the “Code”) or otherwise. The Committee does not intend to offer any such excise tax gross-up provisions in any future agreements.
| | | | | | | | | | | | | | |
| Section IV - Compensation-Related Policies and Tax Considerations |
| | |
| Ø | Mandatory Executive Stock Ownership Requirements |
| | |
| Ø | Prohibition on Use of Margin, Pledging, and Hedging in Respect of Redwood Securities |
| | |
| Ø | Clawback Policy |
| | |
| Ø | Tax Considerations |
| | |
| Ø | Accounting Standards |
| | | | |
Mandatory Executive Stock Ownership Requirements
As described on pages 16-17 of this Proxy Statement under the heading “Stock Ownership Requirements — Required Stock Ownership by Executive Officers,” the Committee maintains mandatory stock ownership requirements with respect to Redwood’s executive officers, which the Committee believes foster long-term alignment between executives and stockholders. The Committee regularly conducts a review of the executive stock ownership requirements and most recently updated these requirements in December 2022.
Mandatory Executive Stock Ownership Requirements
◦Each executive officer is required to own common stock with a value at least equal to (i) 6.25 times current salary for the Chief Executive Officer, (ii) 3.25 times current salary for the President, and (iii) three times current salary for the other executive officers;
◦Five years are allowed to initially attain the required level of ownership and five years are allowed to acquire additional incremental shares if promoted to a position with a higher requirement or when a salary increase results in a higher requirement (if not in compliance at the indicated times, then the executive officer is required to retain net after-tax shares of common stock delivered as compensation from the 2014 Incentive Plan or from the Executive Deferred Compensation Plan until compliance is achieved);
◦All shares owned outright are counted, including those held in trust for the executive officer and his or her immediate family, as well as vested and unvested DSUs and any other vested shares of common stock held pursuant to other employee plans; and
◦Compliance with these requirements is measured on a purchase/acquisition cost basis for shares of common stock, and on grant date value for vested and unvested DSUs.
As of the date of this Proxy Statement, all of Redwood’s executive officers were in compliance with these requirements either due to ownership of the requisite number of shares of common stock and/or deferred stock units or because the time period during which the executive officer is permitted to attain the required level of ownership had not expired.
Prohibition on Use of Margin, Pledging, and Hedging in Respect of Redwood Securities
Under Redwood’s Insider Trading Policy, Redwood’s executive officers, employees and directors may not acquire securities issued by Redwood using borrowed funds, may not use margin in respect of the purchase of securities issued by Redwood, may not use margin accounts to hold Redwood securities, may not pledge or otherwise use as collateral securities issued by Redwood, and may not engage in hedging or other transactions with respect to their ownership of securities issued by Redwood (including short sales or transactions in puts, calls, or other derivative securities). The Committee believes these proscribed activities would be inconsistent with the purposes and intent of Redwood’s stock ownership requirements.
Clawback Policy
Redwood has historically maintained a “clawback” policy (the “Legacy Clawback Policy”) with respect to bonus, equity, and other incentive payments made to any executive officer whose fraud or misconduct resulted in a financial restatement. Under the Legacy Clawback Policy, in the event of a significant restatement of Redwood’s financial results due to fraud or misconduct, the Board of Directors of Redwood would review all bonus and incentive compensation payments made on the basis of Redwood having met or exceeded specific performance targets during the period affected by the restatement and, if any of the payments would have been lower if determined using the restated results, the Board of Directors would, in its discretion and to the extent permitted by law, seek to recoup from the executive officers whose fraud or misconduct materially contributed to the restatement the excess value or benefit of the prior payments made to those executive officers.
In October 2022, the SEC adopted final rules implementing the incentive-based compensation recovery (“clawback”) provisions of the Dodd-Frank Act. Under these final rules, the New York Stock Exchange (NYSE) established listing standards requiring listed companies, such as Redwood, to develop and implement a policy providing for the recovery of erroneously awarded incentive-based compensation received by current or former executive officers and to satisfy related disclosure obligations. Subsequently, Redwood’s Board of Directors adopted a Policy for Recovery of Erroneously Awarded Compensation, effective from and after October 2, 2023 (the “Updated Clawback Policy”), which Updated Clawback Policy complies with the new SEC rules and NYSE listing standards and provides for the recovery of any erroneously awarded performance-based incentive compensation received by our executive officers following the effectiveness of the Updated Clawback Policy. Under the Updated Clawback Policy, Redwood is able to recoup any such erroneously awarded compensation from a variety of sources and forms of compensation, including time vesting equity-based awards. A copy of the Updated Clawback Policy is attached as Exhibit 97.1 to Redwood’s Annual Report on Form 10-K for the year ended December 31, 2024, filed on March 3, 2025. The Legacy Clawback Policy continues to apply to compensation received by our executive officers prior to the effectiveness of the Updated Clawback Policy.
Tax Considerations
The Committee considers the anticipated tax treatment to Redwood and to executive officers when reviewing executive compensation levels and Redwood’s compensation programs. The deductibility of some types of compensation payments can depend upon the timing of an executive’s vesting or exercise of previously granted rights or termination of employment. Interpretations of and changes in applicable tax laws and regulations, as well as other factors beyond the Committee’s control, also can affect the deductibility of compensation.
While the tax impact of any compensation arrangement is one factor considered by the Committee, that impact is evaluated in light of the Committee’s overall compensation philosophy and objectives. The Committee will consider the deductibility of executive compensation, while retaining the discretion it deems necessary to compensate officers in a manner commensurate with performance and the competitive environment for executive talent.
Accounting Standards
Under GAAP, ASC Topic 718 requires Redwood to calculate the grant date “fair value” of certain long-term incentive awards using a variety of assumptions. ASC Topic 718 also requires Redwood to recognize an expense for the fair value of certain equity-based and other long-term incentive compensation awards. Grants of deferred stock units, cash-settled deferred stock units, restricted stock, restricted stock units, cash-settled restricted stock units, performance stock units, and cash-settled performance stock units will be accounted for under ASC Topic 718. The Compensation Committee regularly considers the accounting implications of significant compensation decisions, especially in connection with decisions that relate to equity incentive award plans and programs. As accounting standards change, the Committee may revise certain programs to align appropriately the accounting expense of equity awards with Redwood’s overall executive compensation philosophy and objectives.
| | | | | | | | | | | | | | |
| Section V - Conclusion |
| | |
| Ø | Certain Compensation Determinations Relating to 2025 |
| | | | |
| Ø | 2025 Maximum Total Annual Bonuses |
| | |
| Ø | Compensation Committee Report |
| | | | |
Certain Compensation Determinations Relating to 2025
In accordance with its normal practice, at its meeting in December 2024, the Committee made certain decisions relating to 2025 base salaries and 2025 targets for performance-based annual bonuses for Redwood’s NEOs, as further described below. The Committee retains the discretion to make adjustments to these decisions prior to the completion of its annual year-end review in December 2025.
2025 Base Salaries. In accordance with its above-described policy and practice relating to base salaries (see discussion above on page 57 within this CD&A under the heading “2024 Base Salaries”), in December 2024 the Committee reviewed the base salaries of Redwood’s NEOs. The following table sets forth each of these NEO’s 2025 base salary rate per annum, together with a comparison to their 2024 rate per annum.
| | | | | | | | | | | | | | | | | | | | |
| | Base Salary | |
| NEOs | | 2024 | | | 2025 | |
Mr. Abate,
Chief Executive Officer | | $ | 950,000 | | | | $ | 975,000 | | |
Mr. Robinson,
President | | $ | 875,000 | | | | $ | 890,000 | | |
Ms. Carillo,
Chief Financial Officer | | $ | 825,000 | | | | $ | 860,000 | | |
| | | | | | |
Ms. Macomber,
Chief Human Resource Officer | | $ | 500,000 | | | | $ | 525,000 | | |
Mr. Stone,
Executive Vice President and Chief Legal Officer | | $ | 500,000 | | | | $ | 525,000 | | |
2025 Targets for Performance-Based Annual Bonuses. In December 2025, the Committee established a 2025 target annual bonus for each of Redwood’s NEOs. The table below sets forth the 2025 target annual bonuses for each of these NEOs.
| | | | | | | | | | | | | | | | | | | | | | | | | | |
| NEOs | | 2025 Base
Salary | | 2025 Target
Annual Bonus
(%) | | Change from 2024 Target Annual Bonus Percentage (%)(1) | | Total
2025 Target
Annual Bonus
($) |
Mr. Abate,
Chief Executive Officer | | $ | 975,000 | | | 215% | | 7.5% | | $ | 2,096,250 | |
Mr. Robinson,
President | | $ | 890,000 | | | 210% | | 7.7% | | $ | 1,869,000 | |
Ms. Carillo,
Chief Financial Officer | | $ | 860,000 | | | 205% | | 7.9% | | $ | 1,763,000 | |
| | | | | | | | |
Ms. Macomber,
Chief Human Resource Officer | | $ | 525,000 | | | 175% | | 0% | | $ | 918,750 | |
Mr. Stone,
Executive Vice President and Chief Legal Officer | | $ | 525,000 | | | 175% | | 0% | | $ | 918,750 | |
(1) Amounts set forth in the table under “Change from 2024 Target Annual Bonus Percentage (%)” reflect the increase, if any, in the 2025 Target Annual Bonus (%) from the 2024 Target Annual Bonus (%) in effect for each NEO at the end of 2024.
2025 Maximum Total Annual Bonuses
As discussed under the heading “2024 Performance-Based Annual Bonus Compensation” on pages 58-62 within this CD&A, in the fourth quarter of 2023 the Committee lowered the maximum annual bonus opportunity for the CEO and the other executive officers from 3.5x to 3.0x of their target annual bonuses – marking the second reduction to maximum annual bonus opportunities for executive officers since 2022.
Compensation Committee Report
The Compensation Committee has reviewed and discussed with management the Compensation Discussion and Analysis and Executive Summary of Compensation Discussion and Analysis included in this Proxy Statement. Based on this review and discussion, the Committee recommended to the Board of Directors that the Compensation Discussion and Analysis and Executive Summary of Compensation Discussion and Analysis be included in this Proxy Statement.
Compensation Committee:
Georganne C. Proctor, Chair
Doneene K. Damon
Greg H. Kubicek
Debora D. Horvath
Executive Compensation Tables
Summary Compensation
The following table includes information concerning compensation earned by the NEOs for the years ended December 31, 2024, 2023, and 2022, as applicable.
| | | | | | | | | | | | | | | | | | | | | | | | | | | | | | | | | | | | | | | | | | | | |
| Name and Principal Position | | Year | | Salary | | Bonus | | Stock Awards (1) | | Non-Equity Incentive Plan Compensation(2) | | All Other Compensation(3) | | Total |
Christopher J. Abate, Chief Executive Officer | | 2024 | | $ | 950,000 | | | — | | | $ | 4,349,994 | | | $ | 1,573,696 | | | $ | 94,917 | | | $ | 6,968,607 | |
| 2023 | | $ | 900,000 | | | — | | | $ | 4,099,997 | | | $ | 1,967,782 | | | $ | 54,000 | | | $ | 7,021,779 | |
| 2022 | | $ | 900,000 | | | — | | | $ | 3,999,993 | | | $ | 450,000 | | | $ | 55,000 | | | $ | 5,404,993 | |
| | | | | | | | | | | | | | |
Dashiell I. Robinson, President | | 2024 | | $ | 875,000 | | | — | | | $ | 3,599,992 | | | $ | 1,413,221 | | | $ | 87,500 | | | $ | 5,975,713 | |
| 2023 | | $ | 850,000 | | | — | | | $ | 3,499,988 | | | $ | 1,711,370 | | | $ | 51,000 | | | $ | 6,112,358 | |
| 2022 | | $ | 825,000 | | | — | | | $ | 3,249,981 | | | $ | 509,438 | | | $ | 49,500 | | | $ | 4,633,919 | |
Brooke E. Carillo, Chief Financial Officer | | 2024 | | $ | 825,000 | | | | | $ | 3,499,988 | | | $ | 1,337,487 | | | $ | 84,500 | | | $ | 5,746,975 | |
| 2023 | | $ | 800,000 | | | | | $ | 7,249,983 | | | $ | 1,001,287 | | | $ | 48,000 | | | $ | 9,099,270 | |
| 2022 | | $ | 700,000 | | | | | $ | 2,999,987 | | | $ | 505,000 | | | $ | 42,000 | | | $ | 4,246,987 | |
| | | | | | | | | | | | | |
Andrew P. Stone, Executive Vice-President and Chief Legal Officer | | 2024 | | $ | 500,000 | | | — | | | $ | 1,499,990 | | | $ | 702,853 | | | $ | 31,000 | | | $ | 2,733,843 | |
| 2023 | | $ | 450,000 | | | — | | | $ | 1,499,988 | | | $ | 689,168 | | | $ | 28,000 | | | $ | 2,667,156 | |
| 2022 | | $ | 445,000 | | | — | | | $ | 1,249,990 | | | $ | 250,313 | | | $ | 27,700 | | | $ | 1,973,003 | |
| | | | | | | | | | | | | | |
Sasha G. Macomber, Chief Human Resource Officer | | 2024 | | $ | 500,000 | | | — | | | $ | 1,499,990 | | | $ | 702,853 | | | $ | 46,500 | | | $ | 2,749,343 | |
| 2023 | | $ | 450,000 | | | — | | | $ | 1,499,988 | | | $ | 506,251 | | | $ | 11,250 | | | $ | 2,467,489 | |
| 2022 | | $ | 425,000 | | | — | | | $ | 1,249,990 | | | $ | 322,396 | | | $ | 10,250 | | | $ | 2,007,636 | |
| | | | | | | | | | | | | | |
(1)These amounts represent the grant date fair value of stock units awarded as determined in accordance with FASB Accounting Standards Codification Topic 718.
In 2024, Redwood’s NEOs received the following stock unit awards:
- Each of Mr. Abate, Mr. Robinson, Ms. Carillo, Mr. Stone and Ms. Macomber received an annual grant of deferred stock units, cash-settled restricted stock units and performance stock units on December 19, 2024. These deferred stock units, cash-settled restricted stock units, and performance stock units were granted with the grant date fair values of $6.64, $6.64 and $7.5025 per unit, respectively. The maximum potential value of the 2024 performance stock units granted to Mr. Abate, Mr. Robinson, Ms. Carillo, Mr. Stone, and Ms. Macomber on December 19, 2024 (assuming the maximum number of units vest and calculated based on the closing price of Redwood's common stock on the NYSE on the grant date) are $5,293,624, $3,982,672, $3,872,033, $1,659,436 and $1,659,436 respectively, assuming Redwood achieves the maximum performance goals during the performance period and that there is no adjustment to the target number of units to reflect the value of any dividends paid on Redwood common stock during the vesting period.
For additional details regarding these awards, see the following “Grants of Plan-Based Awards” table.
(2)These amounts include annual performance-based bonuses paid in cash for each year indicated with respect to performance during such year (but paid early in the following year). With respect to 2024, these amounts are further described on pages 62 - 65 of this Proxy Statement under the heading “Compensation Discussion and Analysis – Performance Based Annual Bonuses Earned for 2024”.
(3)These amounts include matching contributions to our 401(k) Plan and Executive Deferred Compensation Plan (“EDCP”), and amounts provided under our fitness-related activity reimbursement program – and, with respect to 2024, included the following: Mr. Abate – matching contributions to 401(k) and EDCP of $11,500 and $45,500, respectively; Mr. Robinson – matching contributions to 401(k) and EDCP of $11,500 and $41,000 respectively; Ms. Carillo – matching contributions to 401(k) and EDCP of $11,500 and $38,000, respectively; Mr. Stone – matching contributions to 401(k) and EDCP of $11,500 and $18,500, respectively, and fitness-related reimbursement of $1,000; and Ms. Macomber – matching contribution to 401(k) of $11,500. For each of Mr. Abate, Mr. Robinson, Ms. Carillo and Ms. Macomber these amounts also include cost of concierge medical service in the amount of $37,917, $35,000, $35,000 and $35,000 respectively. Additional details about these matching contributions and this reimbursement program are outlined on page 73 under headings “401(k) Plan and Other Matching Contributions” and “Other Compensation and Benefits.”
Grants of Plan-Based Awards
The following table reflects estimated possible payouts to the NEOs for 2024 under Redwood’s performance-based bonus compensation program, as well as grants of plan-based awards made in 2024 under Redwood’s Incentive Plan. Actual bonus payments for 2024 are reflected in the “Summary Compensation” table above. As discussed above under “Compensation Discussion and Analysis — 2024 Performance-Based Annual Bonus Compensation,” 2024 target annual performance-based bonuses for 2024 were structured to be earned on a weighted basis based on Adjusted ROE (37.5%), Adjusted EAD ROE (37.5%), and on individual contributions to the Company’s pre-established annual strategic, operational, and risk management goals for 2024 (25%). For 2024, total annual bonuses were subject to the overall maximum amounts (caps) set forth in the following table.
| | | | | | | | | | | | | | | | | | | | | | | | | | | | | | | | | | | | | | | | | | | | | | | | | | | | | | | | | | | | | | | | | | | | |
| Name | | Type of Award(1) | | Grant
Date | | Estimated Possible Payouts Under Non-Equity Incentive Plan Awards ($)(4) | |
Estimated Possible Payouts Under Equity Incentive Plan Awards ($) | | | All Other
Stock
Awards:
Number of
Shares of
Stock or
Units
(#) | | Grant Date Fair Value of Stock and Option Awards ($) (7) |
| Threshold | | Target | | Maximum | | Threshold | | Target (5) | | | Maximum (6) | | |
| Christopher J. Abate | | Annual Bonus | | — | | | — | | | 1,900,000 | | | 5,700,000 | | | — | | | — | | | | — | | | | — | | | — | |
| | DSU (2) | | 12/19/2024 | | — | | | — | | | — | | | — | | | — | | | | — | | | | 98,268 | | | 652,500 | |
| | csRSU (2) | | 12/19/2024 | | | | | | | | | | | | | | | | 196,536 | | | 1,304,999 | |
| | PSU (3) | | 12/19/2024 | | — | | | — | | | — | | | — | | | 318,893 | | | | 797,233 | | | | — | | | 2,392,495 | |
| Dashiell I. Robinson | | Annual Bonus | | | | — | | | 1,706,250 | | | 5,118,750 | | | — | | | — | | | | — | | | | — | | | — | |
| | DSU (2) | | 12/19/2024 | | — | | | — | | | — | | | — | | | — | | | | — | | | | 92,168 | | | 611,996 | |
| | csRSU (2) | | 12/19/2024 | | — | | | — | | | — | | | — | | | — | | | | — | | | | 178,915 | | | 1,187,996 | |
| | PSU (3) | | 12/19/2024 | | — | | | — | | | — | | | — | | | 239,920 | | | | 599,800 | | | | — | | | 1,800,000 | |
| Brooke E. Carillo | | Annual Bonus | | — | | | — | | | 1,567,500 | | | 4,702,500 | | | — | | | — | | | | — | | | | — | | | — | |
| | DSU (2) | | 12/19/2024 | | — | | | — | | | — | | | — | | | — | | | | — | | | | 89,608 | | | 594,997 | |
| | | csRSU (2) | | 12/19/2024 | | — | | | — | | | — | | | — | | | — | | | | — | | | | 173,945 | | | 1,154,995 | |
| | PSU (3) | | 12/19/2024 | | — | | | — | | | — | | | — | | | 233,255 | | | | 583,138 | | | | — | | | 1,749,996 | |
| Andrew P. Stone | | Annual Bonus | | — | | | — | | | 875,000 | | | 2,625,000 | | | — | | | — | | | | — | | | | — | | | — | |
| | DSU (2) | | 12/19/2024 | | — | | | — | | | — | | | — | | | — | | | | — | | | | 38,403 | | | 254,996 | |
| | csRSU (2) | | 12/19/2024 | | — | | | — | | | — | | | — | | | — | | | | — | | | | 74,548 | | | 494,999 | |
| | PSU (3) | | 12/19/2024 | | — | | | — | | | — | | | — | | | 99,966 | | | | 249,915 | | | | — | | | 749,995 | |
| Sasha G. Macomber | | Annual Bonus | | — | | | — | | | 875,000 | | | 2,625,000 | | | — | | | — | | | | — | | | | — | | | — | |
| | DSU (2) | | 12/19/2024 | | — | | | — | | | — | | | — | | | — | | | | — | | | | 38,403 | | | 254,996 | |
| | csRSU (2) | | 12/19/2024 | | — | | | — | | | — | | | — | | | — | | | | — | | | | 74,548 | | | 494,999 | |
| | PSU (3) | | 12/19/2024 | | — | | | — | | | — | | | — | | | 99,966 | | | | 249,915 | | | | — | | | 749,995 | |
(1) DSU refers to deferred stock units, csDSU refers to cash-settled deferred stock units, csRSU refers to cash-settled restricted stock units, and PSU refers to performance stock units.
(2) Mr. Abate received a 2024 annual long-term equity-based award in December 2024 and received 15% of that award value in the form of deferred stock units and 30% cash-settled restricted stock units on December 19, 2024. Each of Mr. Robinson, Ms. Carillo, Mr. Stone and Ms. Macomber also received a 2024 annual long-term equity-based award in December 2024 and received 17% of that award value in the form of deferred stock units and 33% in cash-settled restricted
stock units on December 19, 2024. Deferred stock units and cash-settled restricted stock units were granted with a grant date fair value of $6.64 per share subject to a four-year vesting schedule (fully vesting on December 18, 2028).
(3) Mr. Abate received a 2024 annual long-term equity-based award in December 2024 and received 55% of that award value in the form of a target number of performance stock units on December 19, 2024. The other NEOs also received a 2024 annual long-term equity-based award in December 2024 and received one-half of that award value in the form of a target number of performance stock units on December 19, 2024. The performance stock units were granted with a grant date fair value of $7.5025 per unit. Vesting of these performance stock units will generally occur, if at all, as of January 1, 2028 based on a three-step process, as described on pages 66-68 of this Proxy Statement under the heading “Compensation Discussion and Analysis – 2024 Long-Term Equity-Based Incentive Awards – Performance-Based Vesting – PSUs Granted in December 2024.”
(4) The amounts reported in the “Estimated Possible Payouts Under Non-Equity Incentive Plan Awards” column reflect the target, threshold and maximum payouts for each of the NEOs under Redwood’s performance-based bonus compensation program, which were structured to be earned based on Redwood’s 2024 Adjusted ROE, Redwood’s 2024 Adjusted EAD ROE and individual contributions to the Company’s pre-established annual strategic, operational and risk management goals for 2024. See “Compensation Discussion and Analysis — 2024 Performance-Based Annual Bonus Compensation” beginning on pages 58-62 for a more complete description of the Company’s performance-based annual bonus program. Actual bonus amounts awarded to NEOs for 2024 are reflected above in the “Summary Compensation” table.
(5) Represents the target number of shares to be awarded upon the contingent vesting of performance stock units as discussed above in Note 3. Information regarding the assumptions used to value our NEOs’ stock units is provided in Note 21 to our consolidated financial statements included in Redwood’s Annual Report on Form 10-K filed on March 3, 2025.
(6) For December 2024 awards of performance stock units, represents the maximum number of shares that could contingently vest, as discussed above in Note 3, subject to any adjustment of the target number of performance stock units granted to reflect the value of any dividends paid on Redwood common stock during the vesting period. The maximum potential value of the performance stock units granted in December 2024 to Mr. Abate, Mr. Robinson, Ms. Carillo, Mr. Stone and Ms. Macomber (assuming the maximum number of units vest and calculated based on the closing price of Redwood’s common stock on the NYSE on the grant date) are $5,293,624, $3,982,672, $3,872,033, $1,659,436 and $1,659,436 respectively, assuming the Company achieves the maximum performance goals during the performance period and that there is no adjustment to the target number of units to reflect the value of any dividends paid on Redwood common stock during the vesting period. Information regarding the assumptions used to value our NEOs’ stock units is provided in Note 21 to our consolidated financial statements included in Redwood’s Annual Report on Form 10-K filed on March 3, 2025.
(7) These awards were approved by the Compensation Committee of the Board of Directors and granted pursuant to Redwood’s 2014 Incentive Plan. The value of these awards is determined in accordance with FASB Accounting Standards Codification Topic 718 based on, among other things, the closing price of Redwood’s common stock on the grant date.
Outstanding Equity Awards at Fiscal Year-End
The following table sets forth certain information regarding outstanding equity awards for each NEO as of December 31, 2024.
| | | | | | | | | | | | | | | | | | | | | | | | | | |
| | Stock Awards |
| NEO | | Number of Shares or Units of Stock That Have Not Vested (#)(1) | | Market Value of Shares or Units of Stock That Have Not Vested ($)(2) | | Equity Incentive Plan Awards: Number of Unearned Shares, Units or Other Rights That Have Not Vested (#)(3) | | Equity Incentive Plan Awards: Market or Payout Value of Unearned Shares, That Have Not Vested ($)(4) |
| Christopher J. Abate | | 573,170 | | | $ | 3,742,800 | | | 1,206,168 | | | $ | 7,876,277 | |
| Dashiell I. Robinson | | 636,827 | | | $ | 4,158,480 | | | 760,808 | | | $ | 4,968,076 | |
| Brooke E. Carillo | | 1,070,550 | | | $ | 6,990,692 | | | 670,401 | | | $ | 4,377,719 | |
| Andrew P. Stone | | 262,224 | | | $ | 1,712,323 | | | 301,681 | | | $ | 1,969,977 | |
| Sasha G. Macomber | | 262,224 | | | $ | 1,712,323 | | | 301,681 | | | $ | 1,969,977 | |
(1) Represents unvested deferred stock units, cash-settled deferred stock units and cash-settled restricted stock units as of December 31, 2024. The table below shows the vesting schedule for these stock units as of December 31, 2024.
Deferred stock units and cash-settled deferred stock units generally time-vest over four years as follows: 25% after the first year, and 6.25% every quarter thereafter. Cash-settled restricted stock units generally time-vest over four years as follows: 25% after each annual anniversary of the grant date. Deferred stock unit, cash-settled deferred stock unit and cash-settled restricted stock unit awards relating to the schedule below were granted from December 2021 through December 2024.
| | | | | | | | | | | | | | | | | | | | | | | | | | | | | | | | |
Total DSUs
Scheduled to Vest On: | | Christopher J.
Abate | | Dashiell I. Robinson | | Brooke E. Carillo | | Andrew P.
Stone | | Sasha G. Macomber |
| 1/1/2025 | | 7,113 | | | 12,160 | | | 9,560 | | | 4,403 | | | 4,403 | |
| 1/31/2025 | | 29,606 | | | 28,081 | | | 265,309 | | | 12,035 | | | 12,035 | |
| 4/1/2025 | | 14,515 | | | 19,181 | | | 16,079 | | | 7,412 | | | 7,412 | |
| 7/1/2025 | | 14,515 | | | 19,181 | | | 16,079 | | | 7,412 | | | 7,412 | |
| 10/1/2025 | | 14,515 | | | 19,180 | | | 16,079 | | | 7,412 | | | 7,412 | |
| 12/13/2025 | | 7,113 | | | 5,335 | | | 3,260 | | | 1,778 | | | 1,778 | |
| 1/1/2026 | | 7,401 | | | 13,845 | | | 12,819 | | | 5,634 | | | 5,634 | |
| 1/31/2026 | | 24,567 | | | 23,042 | | | 22,402 | | | 9,601 | | | 9,601 | |
| 4/1/2026 | | 13,543 | | | 19,606 | | | 18,420 | | | 8,035 | | | 8,035 | |
| 7/1/2026 | | 13,543 | | | 19,606 | | | 18,420 | | | 8,035 | | | 8,035 | |
| 10/1/2026 | | 13,543 | | | 19,606 | | | 18,420 | | | 8,034 | | | 8,034 | |
| 12/14/2026 | | — | | | 6,825 | | | 6,300 | | | 2,625 | | | 2,625 | |
| 1/1/2027 | | 13,543 | | | 12,781 | | | 12,120 | | | 5,408 | | | 5,408 | |
| 1/31/2027 | | — | | | — | | | 239,234 | | | — | | | — | |
| 4/1/2027 | | 13,543 | | | 12,781 | | | 12,120 | | | 5,408 | | | 5,408 | |
| 7/1/2027 | | 13,543 | | | 12,781 | | | 12,119 | | | 5,408 | | | 5,408 | |
| 10/1/2027 | | 13,543 | | | 12,780 | | | 12,118 | | | 5,408 | | | 5,408 | |
| 12/14/2027 | | 7,401 | | | — | | | 6,518 | | | 3,008 | | | 3,008 | |
| 1/1/2028 | | 6,142 | | | 5,760 | | | 5,600 | | | 2,400 | | | 2,400 | |
| 4/1/2028 | | 6,142 | | | 5,760 | | | 5,600 | | | 2,400 | | | 2,400 | |
| 7/1/2028 | | 6,141 | | | 5,760 | | | 5,600 | | | 2,400 | | | 2,400 | |
| 10/1/2028 | | 6,141 | | | 5,760 | | | 5,600 | | | 2,400 | | | 2,400 | |
| 12/18/2028 | | 6,141 | | | 5,760 | | | 5,600 | | | 2,400 | | | 2,400 | |
| TOTAL | | 252,254 | | | 285,573 | | | 745,379 | | | 119,058 | | | 119,058 | |
[Additional table that accompanies this footnote (1) is set forth on the following page.]
| | | | | | | | | | | | | | | | | | | | | | | | | | | | | | | | |
Total csDSUs
Scheduled to Vest On: | | Christopher J.
Abate | | Dashiell I. Robinson | | Brooke E. Carillo | | Andrew P.
Stone | | Sasha G. Macomber |
| 1/1/2025 | | 7,113 | | | 12,160 | | | 9,561 | | | 4,403 | | | 4,403 | |
| 4/1/2025 | | 7,113 | | | 12,160 | | | 9,560 | | | 4,403 | | | 4,403 | |
| 7/1/2025 | | 7,113 | | | 12,159 | | | 9,560 | | | 4,403 | | | 4,403 | |
| 10/1/2025 | | 7,113 | | | 12,159 | | | 9,560 | | | 4,403 | | | 4,403 | |
| 12/14/2025 | | 7,113 | | | 5,334 | | | 3,260 | | | 1,778 | | | 1,778 | |
| 1/1/2026 | | — | | | 6,825 | | | 6,300 | | | 2,625 | | | 2,625 | |
| 4/1/2026 | | — | | | 6,825 | | | 6,300 | | | 2,625 | | | 2,625 | |
| 7/1/2026 | | — | | | 6,825 | | | 6,300 | | | 2,625 | | | 2,625 | |
| 10/1/2026 | | — | | | 6,825 | | | 6,300 | | | 2,625 | | | 2,625 | |
| 12/14/2026 | | — | | | 6,825 | | | 6,300 | | | 2,625 | | | 2,625 | |
| TOTAL | | 35,565 | | | 88,097 | | | 73,001 | | | 32,515 | | | 32,515 | |
| | | | | | | | | | | | | | | | | | | | | | | | | | | | | | | | |
Total csRSUs
Scheduled to Vest On: | | Christopher J.
Abate | | Dashiell I. Robinson | | Brooke E. Carillo | | Andrew P.
Stone | | Sasha G. Macomber |
| 12/14/2025 | | 29,605 | | | 28,081 | | | 26,075 | | | 12,035 | | | 12,035 | |
| 12/18/2025 | | 49,134 | | | 44,729 | | | 43,487 | | | 18,637 | | | 18,637 | |
| 12/14/2026 | | 29,605 | | | 28,081 | | | 26,075 | | | 12,034 | | | 12,034 | |
| 12/18/2026 | | 49,134 | | | 44,729 | | | 43,486 | | | 18,637 | | | 18,637 | |
| 12/14/2027 | | 29,605 | | | 28,080 | | | 26,075 | | | 12,034 | | | 12,034 | |
| 12/18/2027 | | 49,134 | | | 44,729 | | | 43,486 | | | 18,637 | | | 18,637 | |
| 12/18/2028 | | 49,134 | | | 44,728 | | | 43,486 | | | 18,637 | | | 18,637 | |
| TOTAL | | 285,351 | | | 263,157 | | | 252,170 | | | 110,651 | | | 110,651 | |
(2) Assumes a common stock value of $6.53 per share (the closing price of Redwood’s common stock on the NYSE on December 31, 2024).
(3) Represents unearned performance stock units, including cash-settled performance stock units, as of December 31, 2024. Performance stock units are performance-based equity awards under which the number of underlying shares of Redwood common stock that vest and that the award recipient becomes entitled to receive at the time of vesting (or, in the case of cash-settled performance stock units, the cash payment in respect of underlying reference shares) will generally range from 0% to 250% of the number of PSUs granted based on absolute, book value, and/or relative total shareholder return goals over the three-year performance period. Performance stock units are generally granted annually and vest, if at all, at the end of the three-year performance period, with the number of PSUs granted being adjusted to reflect the value of any dividends paid on shares of common stock during the vesting period. The tables below shows the vesting schedule for unearned performance stock units and cash-settled performance stock units, as of December 31, 2024. The number of PSUs shown below is dependent on the interim performance of the respective PSU grants as of December 31, 2024 and does not reflect any adjustment to the number of PSUs granted to reflect the value of any dividends paid on shares of common stock during the vesting period. Grant(s) performing at below-target level on December 31, 2024 are reflected as target number of shares, and grant(s) performing at above-target level on December 31, 2024 are reflected as the maximum number of shares that can be earned. The performance stock unit awards relating to the tables below were granted from December 2021 to December 2024.
[Additional table that accompanies this footnote (3) is set forth on the following page.]
| | | | | | | | | | | | | | | | | | | | | | | | | | | | | | | | | | | | | | |
PSUs
Scheduled to Vest On: | | PSUs Shown | | Christopher J.
Abate | | Dashiell I. Robinson | | Brooke E. Carillo | | Andrew P.
Stone | | Sasha G. Macomber |
| 1/1/2025 | | Target | | 191,326 | | | 143,494 | | | 87,691 | | | 47,831 | | | 47,831 | |
| 1/1/2026 | | Target | | 439,961 | | | 178,734 | | | 164,985 | | | 68,744 | | | 68,744 | |
| 1/1/2027 | | Target | | 255,988 | | | 198,660 | | | 184,470 | | | 85,140 | | | 85,140 | |
| 1/1/2028 | | Target | | 318,893 | | | 239,920 | | | 233,255 | | | 99,966 | | | 99,966 | |
| | TOTAL | | 1,206,168 | | | 760,808 | | | 670,401 | | 670,401 | | 301,681 | | | 301,681 | |
(4) Represents the applicable number of PSUs, including cash-settled performance stock units, multiplied by a value per share of $6.53 (the closing price of Redwood common stock on the NYSE on December 31, 2024). Please refer to the preceding “Grants of Plan-Based Awards” table for additional detail on the vesting of PSUs.
Options Exercised and Stock Vested
The following table sets forth the value of accumulated deferred stock unit awards, cash-settled deferred stock units, cash-settled restricted stock units and performance stock unit awards that vested during 2024 for each NEO. As of December 31, 2024, and as of the date of this Proxy Statement, there were no stock options outstanding under Redwood’s 2014 Incentive Award Plan.
| | | | | | | | | | | | | | |
| | Stock Awards |
| NEO | | Number of
Shares Acquired
on Vesting
(#) | | Value Realized on Vesting ($)(1) |
| Christopher J. Abate | | 367,869 | | | $ | 2,659,809 | |
| Dashiell I. Robinson | | 353,890 | | | $ | 2,508,616 | |
| Brooke E. Carillo | | 140,363 | | | $ | 960,030 | |
| Andrew P. Stone | | 141,788 | | | $ | 1,006,941 | |
| Sasha G. Macomber | | 125,156 | | | $ | 884,342 | |
(1) The value realized on vesting is calculated by multiplying the number of shares vesting by the fair market value of Redwood’s stock on the respective vesting date.
Non-Qualified Deferred Compensation
Our Executive Deferred Compensation Plan permits eligible employees to voluntarily defer receipt of a portion or all of their salary, bonus, and/or dividend equivalent right payments on a tax-deferred basis for distribution from the plan to the employee at a later date, and deferred stock units awarded to eligible employees can also be deferred for distribution from the plan at a later date. Distributions of deferred stock units and voluntary cash amounts deferred under the Executive Deferred Compensation Plan are distributed according to the date provided in a deferral election form or related award agreement, in accordance with the terms and conditions of the Executive Deferred Compensation Plan. The earliest permissible distribution date for deferred stock units is generally four years after the grant date, when they have vested in full. The earliest distribution date of voluntary cash amounts deferred is the May 1 that occurs sixteen months after the end of the plan year in which the deferral occurred. Most of our NEOs participate in our Executive Deferred Compensation Plan. Each of Mr. Abate, Mr. Robinson, Ms. Carillo and Mr. Stone voluntarily deferred a portion of his or her cash earnings during fiscal year 2024.
Interest accrual in respect of cash amounts deferred in our Executive Deferred Compensation Plan is described above under “Compensation Discussion and Analysis — Deferred Compensation.” Our NEOs are also entitled to a Redwood matching contribution on all or a portion of their deferred cash compensation, subject to vesting requirements and a matching contribution limit, as described above under “Compensation Discussion and Analysis — Deferred Compensation.” As of December 31, 2024, all of our NEOs were fully vested in matching payments made under our Executive Deferred Compensation Plan.
The following table sets forth information with respect to our NEOs’ cash contributions, vested deferred stock unit contributions, cash and deferred stock unit withdrawals, earnings, and aggregate balances in our Executive Deferred Compensation Plan for the fiscal year ended December 31, 2024.
| | | | | | | | | | | | | | | | | | | | | | | | | | | | | | | | |
| NEO | | Executive
Contributions
in 2024 | | Redwood Matching Contributions
in 2024 | | Aggregate Earnings in 2024(1) | | Aggregate
Withdrawals/
Distributions
in 2024 | | Aggregate Balance at 12/31/2024(2) |
Christopher J. Abate(3) | | $ | 2,750,809 | | | $ | 45,500 | | | $ | 15,740 | | | $ | (2,829,799) | | | $ | 1,305,073 | |
Dashiell I. Robinson(4) | | $ | 2,590,616 | | | $ | 41,000 | | | $ | 12,257 | | | $ | (1,919,849) | | | $ | 1,699,783 | |
Brooke E. Carillo(5) | | $ | 1,036,030 | | | $ | 38,000 | | | $ | 13,450 | | | $ | (91,775) | | | $ | 1,296,561 | |
Andrew P. Stone(6) | | $ | 1,043,941 | | | $ | 18,500 | | | $ | 4,882 | | | $ | (805,561) | | | $ | 603,184 | |
Sasha G. Macomber(7) | | $ | 884,342 | | | $ | — | | | $ | — | | | $ | (673,705) | | | $ | 495,470 | |
(1)Represents market rate interest earned on cash balances in our Executive Deferred Compensation Plan. “Market rate interest” is defined as 120% of long-term applicable federal rate compounded monthly, as published by the IRS.
(2)Reflects the value of vested stock units, assuming a price of $6.53 per share (the closing price of Redwood common stock on the NYSE on December 31, 2024), and the cash balance in the Executive Deferred Compensation Plan, all of which has been previously reported as compensation in 2024 or in prior years.
(3)Mr. Abate’s contribution included $91,000 in voluntary cash deferrals from his 2024 compensation (reported as compensation in the “Summary Compensation” table above) and $2,659,809 as a result of vesting of previously awarded deferred stock units, cash-settled deferred stock units and performance stock units (reported as compensation in previous years). Mr. Abate received a distribution of 321,448 shares of common stock underlying deferred stock units and performance stock units awarded in 2020. Mr. Abate also received $762,183 related to the settlement of cash-settled deferred stock units awarded in 2020.
(4)Mr. Robinson’s contribution included $82,000 in voluntary cash deferrals from his 2024 compensation (reported as compensation in the “Summary Compensation” table above) and $2,508,616 as a result of vesting of previously awarded deferred stock units, cash-settled deferred stock units and performance stock units (reported as compensation in previous years). Mr. Robinson received a distribution of 214,298 shares of common stock underlying deferred stock units and performance stock units awarded in 2020. Mr. Robinson also received $508,119 related to the settlement of cash-settled deferred stock units awarded in 2020.
(5)Ms. Carillo’s contribution included $76,000 in voluntary cash deferrals from her 2024 compensation (reported as compensation in the “Summary Compensation” table above) and $960,030 as a result of vesting of previously awarded deferred stock units and cash-settled deferred stock units (reported as compensation in previous years).
(6)Mr. Stone’s contribution included $37,000 in voluntary cash deferrals from his 2024 compensation (reported as compensation in the “Summary Compensation” table above) and $1,006,941 as a result of vesting of previously awarded deferred stock units, cash-settled deferred stock units and performance stock units (reported as compensation in previous years). Mr. Stone received a distribution of 90,004 shares of common stock underlying deferred stock units and performance stock units awarded in 2020. Mr. Stone also received $213,408 related to the settlement of cash-settled deferred stock units awarded in 2020.
(7)Ms. Macomber’s contribution included $884,342 as a result of vesting of previously awarded deferred stock units, cash-settled deferred stock units and performance stock units. Ms. Macomber received a distribution of 85,571 shares of common stock underlying deferred stock units and performance stock units awarded in 2020. Ms. Macomber also received $162,600 related to the settlement of cash-settled deferred stock units awarded in 2020.
Potential Payments upon Termination or Change of Control
In 2024, each of Mr. Abate, Mr. Robinson, Ms. Carillo, Mr. Stone, and Ms. Macomber had an employment agreement in place with Redwood that provides for cash severance payments, vesting of long-term equity-based incentive awards and other long-term incentive awards, and other benefits in the event the executive is terminated without “cause” or the executive terminates employment for “good reason,” each as defined in the applicable agreement. As compensation for employment prior to the date of any such termination, these employment agreements also provide for payment of base salary through the date of any such termination, as well as, in the event of a “change of control” a performance-based bonus payment, pro-rated as applicable, through the date of any such termination. Within these employment agreements, Redwood’s entry into an agreement with a third-party management company to externally manage all or substantially all of Redwood’s assets and/or operations is referred to as an “externalization of management” and is generally treated analogously to a “change of control”, and within this “Potential Payments upon Termination or Change of Control” section (and the tables set forth herein) the term “change of control” generally includes any such externalization of management. These employment agreements provide for a one-year term of service ending on December 31 of each year and are subject to automatic one-year renewals if not terminated by either party.
In particular, the employment agreements with each of Mr. Abate, Mr. Robinson, Ms. Carillo, Mr. Stone, and Ms. Macomber provide for the applicable executive to receive a cash severance payment in the event Redwood terminates the executive’s employment without “cause” or the executive terminates employment for “good reason.” The cash severance payments to these executives under these agreements in respect of any such termination are in addition to compensation for employment prior to the date of any such termination and, in each case, would be equal to the executive’s target annual bonus prorated through the date of termination plus the amount of additional cash severance specified in the table below.
| | | | | | | | | | | | | | | | | |
| | | Additional Cash Severance |
| | | In Connection With a | | Other Than in Connection With a |
| Name | | Change of Control (1) | | Change of Control |
| Christopher J. Abate | | 2x the sum of Base Salary plus Target Annual Bonus (2) | | 1.5x the sum of Base Salary plus Target Annual Bonus |
| Dashiell I. Robinson | | 1.5x the sum of Base Salary plus Target Annual Bonus(3) | | 1x the sum of Base Salary plus Target Annual Bonus |
| Brooke E. Carillo | | 1.25x the sum of Base Salary plus Target Annual Bonus(4) | | 1x the sum of Base Salary plus Target Annual Bonus |
| Andrew P. Stone | | 1x the sum of Base Salary plus Target Annual Bonus(5) | | 0.75x the sum of Base Salary plus Target Annual Bonus(7) |
| Sasha G. Macomber | | 1x the sum of Base Salary plus Target Annual Bonus(6) | | 0.75x the sum of Base Salary plus Target Annual Bonus |
| | | | | |
| | | | | |
| (1) | As noted above, within this table and the tables set forth below, the term “Change of Control” generally includes an “externalization of management”. |
| (2) | The total of the amount of the Additional Cash Severance in Connection With a Change of Control and the amount of the pro-rated target annual bonus, cannot exceed $7.5 million |
| (3) | The total of the amount of the Additional Cash Severance in Connection With a Change of Control and the amount of the pro-rated target annual bonus cannot exceed $5.5 million |
| (4) | The total of the amount of the Additional Cash Severance in Connection With a Change of Control and the amount of the pro-rated target annual bonus cannot exceed $5 million |
| (5) | The total of the amount of the Additional Cash Severance in Connection With a Change of Control and the amount of the pro-rated target annual bonus cannot exceed $2 million. |
| (6) | The total of the amount of the Additional Cash Severance in Connection With a Change of Control and the amount of the pro-rated target annual bonus cannot exceed $2 million |
| (7) | Subject to a minimum of 2x Base Salary plus pro-rated Base Salary. |
In addition, for Mr. Abate, Mr. Robinson, Ms. Carillo, Mr. Stone, and Ms. Macomber upon either such type of termination: (i) all outstanding time-based long-term equity-based incentive awards and other time-based long-term incentive awards will vest in full; and (ii) all outstanding performance-based long-term equity-based incentive awards and other performance-based long-term incentive awards will remain outstanding and continue to be eligible to vest in full or in part based on the achievement of relevant performance goals. Additionally, these five executives would be
entitled to receive all life insurance, disability insurance, and medical coverage fringe benefits for periods ranging from nine to 24 months following termination of employment, depending on the individual executive and the type of termination.
The employment agreements with Mr. Abate, Mr. Robinson, Ms. Carillo, Mr. Stone, and Ms. Macomber provide that 75% of severance amounts due will be paid in a lump sum six months following termination and the remaining 25% will be paid in equal monthly installments over the succeeding six months.
The employment agreements with Mr. Abate, Mr. Robinson, Ms. Carillo, Mr. Stone, and Ms. Macomber do not provide excise tax gross-ups with respect to any excise taxes that may be imposed on change-in-control severance payments. The agreements provide that in the event that any payments or benefits under the employment agreements constitute an “excess parachute payment” for purposes of Section 280G of the Code, the amounts otherwise payable and benefits otherwise due under these employment agreements will either (i) be delivered in full or (ii) be reduced or limited to the minimum extent necessary to ensure that no payments will be subject to the excise tax imposed under Section 4999 of the Code, taking into account applicable federal, state and local income and employment taxes, whichever results in the largest benefit to the executive on an after-tax basis, notwithstanding that all or some portion of such payments and/or benefits may be subject to the excise tax imposed under Section 4999 of the Code.
The payment and/or vesting of severance benefits under each employment agreement with these five executives may be contingent on the applicable executive executing a release of all claims against Redwood. To the extent enforceable under applicable law, each of the executives may be subject to non-solicitation restrictions for one year following a termination for which severance is paid.
“Cause” for purposes of Mr. Abate, Mr. Robinson, Ms. Carillo, Mr. Stone, and Ms. Macomber’s employment agreements is defined as (i) the executive’s material failure to substantially perform the reasonable and lawful duties of his or her position for Redwood, including any habitual or repeated neglect if such duties, which failure has caused, or could reasonably be expected to cause, significant injury to the interests, property, operations, business or reputation of Redwood, and which failure shall continue to be uncured for thirty (30) days after written notice thereof by the Board of Directors to the executive; (ii) acts or omissions constituting gross negligence, recklessness or willful misconduct on the part of the executive in respect of the performance of his or her duties hereunder, his or her fiduciary obligations or otherwise relating to the business of Redwood, which failure has caused material injury to the interests, property, operations, business or reputation of Redwood, and which failure shall continue to be uncured for thirty (30) days after written notice thereof by the Board to the executive; (iii) unauthorized use or disclosure of trade secrets or confidential or proprietary information pertaining Redwood business, which use or disclosure has caused, or could reasonably be expected to cause significant injury to the interests, property, operations, business or reputation of Redwood, and which failure shall continue to be uncured for thirty (30) days after written notice thereof by the Board to the executive; (iv) acts or omissions constituting willful misconduct on the part of the executive in respect of the performance of his or her fiduciary duty of loyalty to Redwood, which failure has caused material injury to the interests, property, operations, business or reputation of Redwood; (v) theft or embezzlement, or attempted theft or embezzlement, of money, tangible, or intangible assets or property of Redwood or its employees, customers, clients, or others having business relations with Redwood; (vi) the executive’s conviction of, or plea of guilty or nolo contendere to, a non-vehicular felony, including, without limitation, a non-vehicular felony the elements of which involve fraud, dishonesty, or moral turpitude; (vii) the executive’s conviction of, or plea of guilty or nolo contendere to, a misdemeanor the elements of which involve fraud, dishonesty, or moral turpitude, and which is substantially related to the executive’s employment and duties to Redwood; or (viii) the executive’s commission of a crime the elements of which involve fraud, dishonesty, or moral turpitude, and which has caused, or could reasonably be expected to cause, material injury to the interests, property, operations, business or reputation of Redwood.
“Good reason” for purposes of Mr. Abate, Mr. Robinson, Ms. Carillo, Mr. Stone, and Ms. Macomber’s employment agreements is defined as the occurrence, without the executive’s written consent, of (i) a material reduction in the executive’s responsibilities, title, duties or authority; (ii) a reduction in the executive’s base salary or target annual bonus, or a material reduction by Redwood in the value of the executive’s total compensation package if such a reduction is not made in proportion to an across-the-board reduction of all senior executives of Redwood; (iii)
the relocation of the executive’s principal office to a location not within a designated area in proximity to the executive’s current principal office; (iv) a failure at any time to renew the employment agreement; (v) the complete liquidation of Redwood; or (vi) in the event of a merger, consolidation, transfer, or closing of a sale of all or substantially all the assets of Redwood, the failure of the successor company to affirmatively adopt the employment agreement.
In the event of a “change of control” (as defined below) in which the surviving or acquiring corporation does not assume outstanding long-term equity-based incentive awards and other long-term incentive awards or substitute equivalent awards, outstanding long-term equity-based incentive awards and other long-term incentive awards for all the executives will immediately vest and become exercisable.
In the event of a “change of control” in which outstanding long-term equity-based incentive awards and other long-term incentive awards are assumed or substituted, then acceleration only would occur upon a qualifying employment termination as specified in the award agreement for such award or the executives’ employment agreements. The number or amount of any outstanding performance-based long-term equity-based incentive awards or other long-term incentive awards eligible to vest will be determined by reference to the applicable performance goals for each such award, pro-rated on an annualized basis to reflect the shortened performance period.
In addition, in the event of a termination due to the executive’s death or disability, the employment agreements with Mr. Abate, Mr. Robinson, Ms. Carillo, Mr. Stone, and Ms. Macomber provide for (i) the payment to the executive or his or her estate of (a) the executive’s base salary to the date of termination, and (b) the executive’s target annual bonus for the year, prorated to the date of termination (as well as any earned but unpaid annual bonus from a prior service year (as and when such bonus becomes payable generally)), (ii) vesting in full of all long-term equity-based incentive awards and other long-term incentive awards with time-based vesting, and (iii) with respect to long-term equity-based incentive awards and other long-term incentive awards with performance-based vesting, such awards to remain outstanding and to continue to be eligible to vest and become payable based on the number of target shares or granted award value and the performance goals set forth in the applicable award agreement by which such awards are evidenced, in each case unless otherwise provided in the award agreement for the award.
With respect to the employment agreements with Mr. Abate, Mr. Robinson, Ms. Carillo, Mr. Stone, and Ms. Macomber, “change of control” is defined as follows:
(1) a transaction or series of transactions (other than an offering of common stock to the general public through a registration statement filed with the Securities and Exchange Commission or a transaction or series of transactions that meets the requirements of clauses (a) and (b) of subsection (3) below) whereby any “person” or related “group” of “persons” (as such terms are used in Sections 13(d) and 14(d)(2) of the Securities Exchange Act of 1934, as amended) (other than Redwood, any of its subsidiaries, an employee benefit plan maintained by Redwood or any of its subsidiaries or a “person” that, prior to such transaction, directly or indirectly controls, is controlled by, or is under common control with, Redwood) directly or indirectly acquires beneficial ownership (within the meaning of Rule 13d-3 under the Exchange Act) of securities of Redwood possessing more than 30% of the total combined voting power of Redwood’s securities outstanding immediately after such acquisition; or
(2) during any period of two consecutive years, individuals who, at the beginning of such period, constitute the Board together with any new Director(s) (other than a Director designated by a person who shall have entered into an agreement with Redwood to effect a transaction described in subsections (1) or (3) of this definition) whose election by the Board or nomination for election by Redwood’s stockholders was approved by a vote of at least two-thirds of the Directors then still in office who either were Directors at the beginning of the two-year period or whose election or nomination for election was previously so approved, cease for any reason to constitute a majority thereof; or
(3) the consummation by Redwood (whether directly involving Redwood or indirectly involving Redwood through one or more intermediaries) of (x) a merger, consolidation, reorganization, or business combination or (y) a sale or other disposition of all or substantially all of Redwood’s assets in any single transaction or series of related transactions or (z) the acquisition of assets or stock of another entity, in each case other than a transaction:
a. which results in Redwood’s voting securities outstanding immediately before the transaction continuing to represent (either by remaining outstanding or by being converted into voting securities of Redwood or the person that, as a result of the transaction, controls, directly or indirectly, Redwood or owns, directly or indirectly, all or substantially all of Redwood’s assets or otherwise succeeds to the business of Redwood (Redwood or such person, the “Successor Entity”)) directly or indirectly, at least a majority of the combined voting power of the Successor Entity’s outstanding voting securities immediately after the transaction; and
b. after which no person or group beneficially owns voting securities representing 30% or more of the combined voting power of the Successor Entity; provided, however, that no person or group shall be treated for purposes of this clause (ii) as beneficially owning 30% or more of the combined voting power of the Successor Entity solely as a result of the voting power held in Redwood prior to the consummation of the transaction.
For additional information related to the employment agreements with Mr. Abate, Mr. Robinson, Ms. Carillo, Mr. Stone, and Ms. Macomber, please refer to Exhibits 10.29 through 10.33 to Redwood’s Annual Report on Form-K for the year ended December 31, 2024, filed on March 3, 2025.
Termination (No Change of Control)
If any of Mr. Abate, Mr. Robinson, Ms. Carillo, Mr. Stone, or Ms. Macomber had been terminated as of December 31, 2024 without “cause” or, if applicable, had terminated his or her employment as of that date for “good reason,” the approximate value of the severance benefits payable to him or her would have been as follows, as calculated in accordance with the terms of the respective agreements in place with each such NEO on December 31, 2024.
| | | | | | | | | | | | | | | | | | | | | | | | | | | | | | | | | | | | | | | | | | | | | | | |
| NEOs | | | Cash Severance Payment | | | Accelerated Vesting of Long-Term Cash Awards(1) | | | Accelerated Vesting of DSUs, csDSUs and csRSUs(1) | | | Benefits(2) | | | Total Value
Involuntary
Termination
Without
“Cause” or
Voluntary
Termination
for “Good
Reason” |
| Christopher J. Abate | | $ | 6,175,000 | | | $ | — | | | $ | 3,742,800 | | | $ | 221,538 | | | $ | 10,139,338 | |
| Dashiell I. Robinson | | $ | 4,287,500 | | | $ | — | | | $ | 4,158,479 | | | $ | 142,398 | | | $ | 8,588,377 | |
| Brooke E. Carillo | | $ | 3,960,000 | | | $ | — | | | $ | 6,990,694 | | | $ | 147,562 | | | $ | 11,098,256 | |
| Andrew P. Stone | | $ | 1,906,250 | | | $ | — | | | $ | 1,712,323 | | | $ | 36,994 | | | $ | 3,655,567 | |
| Sasha G. Macomber | | $ | 1,906,250 | | | $ | — | | | $ | 1,712,323 | | | $ | 110,661 | | | $ | 3,729,234 | |
(1) None of the NEOs had a long-term cash award outstanding at December 31, 2024. The value of acceleration of deferred stock units, cash-settled deferred stock units, and cash-settled restricted stock units assumes a common stock price of $6.53 per share (the closing price of Redwood’s common stock on the NYSE on December 31, 2024). Although unvested performance stock units are not forfeited following a termination without “cause” (or following a voluntary termination for “good reason”), no value for unvested performance stock units was included due to the fact that under the applicable award agreements the performance stock units would vest, if at all, only at the end of the performance period and only to the extent the performance vesting threshold is met at the end of the performance period.
(2) Each of the NEOs is entitled to a continuation of health insurance, life insurance, and long-term disability insurance for the respective periods specified in their employment agreement (ranging from nine to 18 months depending on the individual executive) following a termination without “cause” or a voluntary termination for “good reason.”
Termination (Change of Control)
If a “change of control” occurred on December 31, 2024 and any of Mr. Abate, Mr. Robinson, Ms. Carillo, Mr. Stone, or Ms. Macomber had been terminated as of December 31, 2024 without “cause” or, in certain circumstances, had terminated his or her employment as of that date for “good reason,” the approximate value of the severance benefits payable to him or her would have been as reported in the table below, as calculated in accordance with the terms of the respective agreements in place on December 31, 2024.
| | | | | | | | | | | | | | | | | | | | | | | | | | | | | | | | | | | | | | | | | | | | | | | | | | | | | | | | |
| NEOs | | | Cash Severance Payment(1) | | | Accelerated Vesting of Long-Term Cash Awards(2) | | | Accelerated Vesting of DSUs, csDSUs and csRSUs(2) | | | Accelerated Vesting of PSUs(3) | | | Benefits(4) | | | Total Value Involuntary Termination Without “Cause” or Voluntary Termination for “Good Reason” (5) |
| Christopher J. Abate | | $ | 7,500,000 | | | $ | — | | | $ | 3,742,800 | | | $ | 6,970,492 | | | $ | 295,384 | | | $ | 18,508,676 | |
| Dashiell I. Robinson | | $ | 5,500,000 | | | $ | — | | | $ | 4,158,479 | | | $ | 4,288,740 | | | $ | 213,597 | | | $ | 14,160,816 | |
| Brooke E. Carillo | | $ | 4,558,125 | | | $ | — | | | $ | 6,990,694 | | | $ | 3,962,567 | | | $ | 184,452 | | | $ | 15,695,838 | |
| Andrew P. Stone | | $ | 2,000,000 | | | $ | — | | | $ | 1,712,323 | | | $ | 1,743,533 | | | $ | 49,326 | | | $ | 5,505,182 | |
| Sasha G. Macomber | | $ | 2,000,000 | | | $ | — | | | $ | 1,712,323 | | | $ | 1,743,533 | | | $ | 147,547 | | | $ | 5,603,403 | |
(1)Excludes actual annual or pro-rated performance-based bonus amounts attributable to service and performance during periods ending immediately prior to “change in control.” The cash severance payments following a “change of control” are capped for Mr. Abate, Mr. Robinson, Ms. Carillo, Mr. Stone and Ms. Macomber at $7.5 million, $5.5 million, $5 million, $2 million and $2 million, respectively.
(2)None of the NEOs had a long-term cash award outstanding at December 31, 2024. The value of acceleration of deferred stock units, cash-settled deferred stock units and cash-settled restricted stock units assumes a “change in control” price of $6.53 per share (the closing price of Redwood’s common stock on the NYSE on December 31, 2024).
(3)The number of performance stock units eligible for accelerated vesting is determined by reference to the attainment of the related performance goals through December 31, 2024, assuming a “change in control” price of $6.53 per share (the closing price of Redwood’s common stock on the NYSE on December 31, 2024). The value of outstanding performance stock units granted in 2021 at a change in control price of $6.53 per share is based on estimated performance-based vesting of 27.5% of target units. The value of outstanding performance stock units granted in 2022, 2023 and 2024 at a change in control price of $6.53 per share is based on estimated performance-based vesting of 100% of target units. Further details regarding the terms of performance stock units awarded in 2024 are provided on pages 66-68 of this Proxy Statement under the heading “Compensation Discussion and Analysis – 2024 Long-Term Equity-Based Incentive Awards – Performance-Based Vesting – PSUs Granted in December 2024”; and further details regarding the terms of performance stock units granted in 2022 and 2023 are provided in the Company’s 2023 and 2024 annual proxy statements.
(4)Each of Mr. Abate, Mr. Robinson, Ms. Carillo, Mr. Stone, and Ms. Macomber is entitled to a continuation of health insurance, life insurance, and long-term disability insurance for the period specified in their employment agreement (ranging from 12 to 24 months depending on the executive) following a termination without “cause” or for “good reason.”
(5)In accordance with their employment agreement terms, if any payments made to Mr. Abate, Mr. Robinson, Ms. Carillo, Mr. Stone, or Ms. Macomber in connection with a “change in control” would otherwise be subject to an excise tax under Section 4999 of the Code by reason of the “golden parachute” rules contained in Section 280G of the Code, such payments would be reduced if and to the extent that doing so would result in net after-tax payments and benefits for the executive officer that are more favorable than the net after-tax payments and benefits payable to the executive officer in the absence of such a reduction after the imposition of the excise tax. The figures reported in this table do not reflect any such reductions as a result of Code Section 280G limits. No executive officer is entitled to any tax gross-up payment in connection with change in control payments (or otherwise).
Termination (Death or Disability)
If any of Mr. Abate, Mr. Robinson, Ms. Carillo, Mr. Stone, or Ms. Macomber had his or her employment terminated as of December 31, 2024 as a result of death or disability, the approximate value of the severance benefits payable to him or her would have been as follows, as calculated in accordance with the terms of the respective agreements in place on December 31, 2024.
| | | | | | | | | | | | | | | | | | | | | | | | | | | | | | | | | | | | | | |
| NEO | | | Cash
Severance
Payment | | | Accelerated Vesting of Long-Term Cash Awards(1) | | | Accelerated
Vesting of
DSUs, csDSUs & csRSUs(1) | | | Total Value
Termination
“Death or Disability” |
| Christopher J. Abate | | $ | 1,900,000 | | | $ | — | | | $ | 3,742,800 | | | $ | 5,642,800 | |
| Dashiell I. Robinson | | $ | 1,706,250 | | | $ | — | | | $ | 4,158,479 | | | $ | 5,864,729 | |
| Brooke E. Carillo | | $ | 1,567,500 | | | $ | — | | | $ | 6,990,694 | | | $ | 8,558,194 | |
| Andrew P. Stone | | $ | 875,000 | | | $ | — | | | $ | 1,712,323 | | | $ | 2,587,323 | |
| Sasha G. Macomber | | $ | 875,000 | | | $ | — | | | $ | 1,712,323 | | | $ | 2,587,323 | |
(1)None of the NEOs had a long-term cash award outstanding at December 31, 2024. The value of acceleration of deferred stock units, cash-settled deferred stock units and cash-settled restricted stock units assumes a common stock price of $6.53 per share (the closing price of Redwood’s common stock on the NYSE on December 31, 2024). Although unvested performance stock units are not forfeited following death or disability, no value for unvested performance stock units was included due to the fact that under the applicable award agreements the performance stock units would vest, if at all, only at the end of the performance period and only to the extent the performance vesting threshold is met at the end of the performance period.
Compensation Risks
As noted above, the Compensation Committee reviews risks that may arise from Redwood’s compensation policies and practices. In particular, during the fourth quarter of 2024, management, in consultation with Semler Brossy and the Compensation Committee, prepared a framework for performing a compensation risk assessment, which framework provided for assessment of risks relating to, among other things, components of compensation, performance metrics, performance-based compensation leverage, the timing of compensation delivery, equity-based incentive compensation, stock ownership requirements, stock trading policies, methods for assessing performance, and leadership culture. Subsequently, the framework was utilized to prepare a compensation risk assessment for review and consideration by the Compensation Committee and the Audit Committee. Following the review and discussion of this assessment by those committees, as well as other reviews and discussions relating to risks that may arise from Redwood’s compensation policies and practices, the Compensation Committee determined, after consultation with Semler Brossy, that it does not currently believe that Redwood’s compensation policies and practices are reasonably likely to have a material adverse effect on Redwood.
CEO Pay Ratio
As required by Section 953(b) of the Dodd-Frank Wall Street Reform and Consumer Protection Act, and Item 402(u) of the SEC’s Regulation S-K, the following information is being provided regarding the ratio of the total compensation of Redwood’s median compensated employee to the total compensation of Redwood’s CEO during 2024.
For 2024, Redwood’s most recently completed fiscal year:
•Median Total Compensation – 2024. The annual total compensation of the employee who represents Redwood’s median compensated employee (excluding our CEO) was $137,984; and
•CEO’s Total Annual Compensation – 2024. The annual total compensation of Redwood’s CEO was $6,968,607.
CEO Pay Ratio of 51 to 1. Based on this information, for 2024, the estimated ratio of (x) the annual total compensation of Redwood’s CEO, to (y) the annual total compensation of Redwood’s median compensated employee, was 51 to 1.
Determining the Median Compensated Employee
•Employee Population
As of December 31, 2024, Redwood’s employee workforce consisted of 283 full-time employees. However, for purposes of determining the median compensated employee, the Chief Executive Officer and one employee on permanent leave of absence were excluded. As a result, 281 of the 283 employees were included in the CEO Pay Ratio calculation.
•Methodology for Determining Redwood’s Median Compensated Employee
To identify the median compensated employee from Redwood’s employee population, a review of the annual total compensation of each of Redwood’s employees was conducted. For purposes of measuring the annual total compensation of each employee, Redwood selected base salary, overtime pay and bonus as the most appropriate measure of compensation, which was consistently applied to the 281 included employees. In identifying the median compensated employee, the compensation of permanent employees who were new hires in 2024 was annualized.
•Compensation Measure and Annual Total Compensation of Median Compensated Employee
With respect to the annual total compensation of the median compensated employee, Redwood calculated the elements of such employee’s compensation for 2024 in accordance with the requirements of Item 402(c)(2)(x) of Regulation S-K, resulting in annual total compensation of $137,984.
•Annual Total Compensation of CEO
With respect to the annual total compensation of Redwood’s CEO, Redwood used the annual total compensation amount as reported in the “Summary Compensation Table” in this proxy statement.
Pay vs. Performance Comparison
As described within the Compensation Discussion and Analysis section of this Proxy Statement, Redwood maintains a performance-based compensation philosophy and program for its executive officers that seeks to provide incentives to achieve business goals and sustainable stockholder returns, align the interests of executive officers with those of long-term stockholders in achieving strong stockholder returns, and enable it to hire and retain talented individuals in a competitive marketplace. Accordingly, under Redwood’s executive compensation program, base salary and standard benefits are generally the only fixed elements of compensation, while performance-based components of compensation and long-term incentive awards represent the predominant forms of compensation for the CEO and other executive officers. A fulsome discussion of how the Compensation Committee has structured executive compensation at Redwood to be consistent with the Company’s performance-based compensation philosophy is included in the Compensation Discussion and Analysis section of this Proxy Statement beginning on page 47 above.
The following table, the related footnotes, and the other disclosures set forth below in this “Pay vs. Performance Comparison” section of this Proxy Statement, have all been prepared in accordance with Section 953(a) of the Dodd-Frank Wall Street Reform and Consumer Protection Act and Item 402(v) of the SEC’s Regulation S-K, which were enacted and promulgated to, among other things, require the disclosure of information about the relationship between: (i) “Compensation Actually Paid” (as defined in Item 402(v) of Regulation S-K) to executives by a company over a specified period, and (ii) certain measures of the financial performance of the company over that period.
During 2024 and early 2025, when the Compensation Committee made certain executive compensation determinations related to 2024 and 2025, the Compensation Committee did not directly consider the table, the related footnotes, and the other disclosures set forth below in this “Pay vs. Performance Comparison” section. Amounts designated as “Compensation Actually Paid” in the table, the related footnotes, and the other disclosures set forth below are calculated in accordance with Item 402(v) of Regulation S-K and do not necessarily represent amounts actually earned or realized by Redwood’s CEO or other executive officers in the periods presented or in any other period. In accordance with SEC regulations, within this “Pay vs. Performance Comparison” section the term “NEOs” refers to Redwood’s five Named Executive Officers.
Pay vs. Performance Table
| | | | | | | | | | | | | | | | | | | | | | | | | | | | | | | | | | | | | | | | | | | | | | | | | | | | | | | | |
| | | | | | | | | | | Value of Initial Fixed $100 Investment Based on: | | | | |
| Year | | Summary Compensation Table Total for PEO(1) | | Compensation Actually Paid to PEO(1)(3) | | Average Summary Compensation Table Total for Non-PEO NEOs(2) | | Average Compensation Actually Paid to Non-PEO NEOs(2)(3) | | Total Shareholder Return(4) | | Peer Group Total Shareholder Return(5) | | Net Income (Loss) (in millions) | | Adjusted ROE(6) | |
| 2024 | | $ | 6,968,607 | | | $ | 5,798,938 | | | $ | 4,301,468 | | | $ | 3,921,884 | | | $ | 63 | | | $ | 80 | | | $ | 54 | | | 4.5 | % | |
| 2023 | | $ | 7,021,779 | | | $ | 7,052,048 | | | $ | 6,580,351 | | | $ | 6,728,959 | | | $ | 65 | | | $ | 80 | | | $ | (2) | | | 0.1 | % | |
| 2022 | | $ | 5,404,993 | | | $ | (2,530,287) | | | $ | 3,215,636 | | | $ | 310,195 | | | $ | 53 | | | $ | 69 | | | $ | (164) | | | -11.4 | % | |
| 2021 | | $ | 13,598,971 | | | $ | 17,746,852 | | | $ | 6,713,889 | | | $ | 7,987,344 | | | $ | 92 | | | $ | 94 | | | $ | 320 | | | 26.3 | % | |
| 2020 | | $ | 5,552,321 | | | $ | 165,376 | | | $ | 2,191,888 | | | $ | 280,033 | | | $ | 57 | | | $ | 81 | | | $ | (582) | | | -49.2 | % | |
(1) PEO for 2024, 2023, 2022, 2021 and 2020 was Christopher J. Abate
(2) The non-PEO named executive officers (NEOs) reflects the following individuals in each year:
2024: Dashiell I. Robinson, Brooke E. Carillo, Andrew P. Stone, Sasha G. Macomber
2023: Dashiell I. Robinson, Brooke E. Carillo, Fred J. Matera, Andrew P. Stone
2022: Dashiell I. Robinson, Brooke E. Carillo, Andrew P. Stone, Sasha G. Macomber
2021: Dashiell I. Robinson, Collin L. Cochrane, Andrew P. Stone, Sasha G. Macomber
2020: Dashiell I. Robinson, Collin L. Cochrane, Andrew P. Stone, Sasha G. Macomber, Shoshone ("Bo") Stern
(3) The dollar amounts reported as “Compensation Actually Paid” represent the amount of “compensation actually paid”, as computed in accordance with Item 402(v) of Regulation S-K. The dollar amounts do not reflect the actual amount of compensation earned or paid during the applicable year. In accordance with the requirement of Item 402(v) of Regulation S-K, “Compensation Actually Paid” for 2024 is calculated by making the following adjustments from the Summary Compensation Table totals as follows:
| | | | | | | | | | | | | | | | | | | | | | | | | | | | | | | | |
| Item and Value Added (Deducted) | | | 2024 |
| For PEO: | | | | | | | | |
| Summary Compensation Table Total | | $ | 6,968,607 | |
| - | SCT “Stock Awards” column value | | $ | (4,349,994) | |
| + | year-end fair value of outstanding equity awards granted in Covered Year that remain unvested(*) | | $ | 4,343,773 | |
| + | / - | change in fair value of outstanding and unvested equity awards granted in prior years(*)(†) | | $ | (1,650,554) | |
| + | / - | change in fair value of prior-year equity awards vested in Covered Year(*)(†) | | $ | (54,717) | |
| + | dividends paid on equity awards in the Covered Year prior to vesting date not otherwise included in total compensation for covered year | | $ | 541,823 | |
Compensation Actually Paid(©) | | $ | 5,798,938 | |
| For Non-PEO Named Executive Officers (Average) | | | |
| Summary Compensation Table Total | | $ | 4,301,468 | |
| - | SCT “Stock Awards” column value | | $ | (2,524,990) | |
| + | year-end fair value of outstanding equity awards granted in Covered Year that remain unvested(*) | | $ | 2,517,904 | |
| + | / - | change in fair value of outstanding and unvested equity awards granted in prior years(*)(†) | | $ | (753,657) | |
| + | / - | change in fair value of prior-year equity awards vested in Covered Year(*)(†) | | $ | (53,152) | |
| + | dividends paid on equity awards in the Covered Year prior to vesting date not otherwise included in total compensation for covered year | | $ | 434,311 | |
Compensation Actually Paid(©) | | $ | 3,921,884 | |
(*) Fair value of outstanding and unvested equity awards subject to financial performance-based vesting conditions (e.g., performance stock units), were determined using valuation assumptions, methodologies and market condition inputs (including, for example, risk-free interest rates and the following metrics related to Redwood common stock: market value, volatility, and dividend yield) that are generally consistent with those used to estimate fair value at grant date in accordance with ASC Topic 718. The fair values of these awards reflect an estimate of the probable outcome of the financial performance-based vesting conditions updated as of each measurement date.
Fair value of the other equity and cash-settled awards is determined based on the closing market price of common stock on the applicable vesting date or as of December 31, 2024. The value of equity awards at vesting is determined by the closing market price of the number of shares of common stock that vest on the applicable vesting date.
See “Equity Compensation Plans” in Note 21 to Consolidated Financial Statements contained in the Company’s Annual Report on Form 10-K for 2024, for further details on these equity and cash-settled awards and the assumptions made in valuing awards subject to financial performance-based vesting conditions at grant date and at measurement dates subsequent to grant date during the corresponding vesting periods.
(†) Amounts represent changes in value from beginning of year to end of year or vesting date of individual awards.
(©) Table does not include reconciling line items for (i) changes in pension benefits, (ii) awards that were granted and vested in the same year, or (iii) awards granted during a prior period that were forfeited during the Covered Year, as these items were not applicable for Redwood in 2024.
(4) For the relevant fiscal year, represents the cumulative TSR of Redwood for the measurement periods ending on December 31 of each of 2024, 2023, 2022, 2021 and 2020, respectively, and in each case beginning on January 1, 2020. Cumulative TSR is calculated by dividing the sum of the cumulative amount of dividends for the measurement period, assuming dividend reinvestment, and the difference between the company’s share price at the end and the beginning of the measurement period by the company’s share price at the beginning of the measurement period.
(5) For the relevant fiscal year, represents the cumulative TSR of the FTSE NAREIT Mortgage REIT Index (for purposes of this Pay vs. Performance Table, and in accordance with Item 402(v) of Regulation S-K, “Peer Group TSR”) for the measurement periods ending on December 31 of each of 2024, 2023, 2022, 2021 and 2020, respectively, and in each case beginning on January 1, 2020.
(6) Adjusted ROE represents the “Company Selected Measure” as determined in accordance with Item 402(v) of Regulation S-K, and is a non-GAAP financial performance metric. Non-GAAP Adjusted ROE is further described on pages 58-59 within the Compensation Discussion and Analysis section of this Proxy Statement and within Annex B to this Proxy Statement.
Analysis of Information Presented in the Pay vs. Performance Table
The graphs below describe and illustrate the relationships between (i) the “Compensation Actually Paid” (CAP) to the PEO and the other NEOs, as set forth in the Pay vs. Performance table above, and (ii) Net Income (Loss), Adjusted ROE, and TSR (including TSR of the FTSE NAREIT Mortgage REIT Index).
| | | | | | | | |
| | |
| Relationship of CAP to Net Income (Loss) | |
| | |
| |
| |
| |
| |
| |
| |
| |
| |
| | |
| | | | | | | | |
| | |
| Relationship of CAP to Adjusted Return on Equity (Adjusted ROE) | |
| | |
| |
| |
| |
| |
| |
| |
| |
| |
| | |
| | | | | | | | |
| | |
| Relationship of CAP to Total Stockholder Return (TSR)** | |
| | |
| |
| |
| |
| |
| |
| |
| |
| |
| * As set forth in this graph, “Peer TSR” represents the annual TSR of the FTSE NAREIT Mortgage REIT Index for each of the years presented.
** For each year presented within this graph, Redwood TSR and Peer TSR represent annual TSR as measured from January 1st of such year to December 31st of each such year, based on an initial fixed $100 investment on each such January 1st. | |
| | |
Financial Performance Measures
Disclosed below are the most important financial measures used by the Company to link (i) “Compensation Actually Paid” to the Company’s Named Executive Officers for 2024 (the Company’s most recently completed fiscal year) to (ii) the Company’s performance:
| | | | | | | | | | | | | | |
Most Important Performance Measures: |
| Adjusted Return on Equity (Adjusted ROE) |
| Adjusted Earnings Available for Distribution ROE (Adjusted EAD ROE) |
| Book Value Total Shareholder Return (bvTSR) |
| Total Shareholder Return (TSR) |
| Relative Total Shareholder Return (rTSR) |
As discussed within the Compensation Discussion and Analysis section of this Proxy Statement, Redwood’s business model and internally-managed REIT structure inform the Compensation Committee’s selection of performance metrics used in Redwood’s performance-based executive compensation program. As described in the Compensation Discussion and Analysis section of this Proxy Statement, in addition to total stockholder return and relative total stockholder return, which is Redwood’s total stockholder return measured on a relative basis against the TSR of a comparator group of companies or the group of companies that comprise a stock index, the Compensation Committee believes that return-on-equity based measures, including Adjusted ROE, Adjusted EAD ROE, and book value total stockholder return, are highly relevant metrics for determining annual bonuses and measuring Redwood’s longer-term performance because, among other things, these financial performance measures should correlate with Redwood’s ability to increase book value and pay attractive levels of sustainable and growing dividends and, over the long-term, strong results under these performance measures should correlate with strong TSR.
A described within the Compensation Discussion and Analysis section of this Proxy Statement, Adjusted ROE and Adjusted EAD ROE are each non-GAAP performance measures that are defined and described on pages 58-62 within this CD&A under the heading “2024 Performance-Based Annual Bonus Compensation.” Adjusted ROE and Adjusted EAD ROE should not be considered as alternatives to GAAP net income, GAAP ROE or other measurements of results of operations computed in accordance with GAAP or for federal income tax purposes. See Annex B to this Proxy Statement for additional discussion, disclosure and details regarding these non-GAAP financial performance metrics.
SECURITIES AUTHORIZED FOR ISSUANCE UNDER EQUITY COMPENSATION PLANS
The following table provides information, as of December 31, 2024, with respect to compensation plans under which equity securities of the registrant are authorized for issuance.
| | | | | | | | | | | | | | | | | | | | | | | | | | | | | | | | | | | | | | | | | |
| Plan Category | | Plan Name | | (a)
Number of
Securities to Be
Issued Upon
Exercise of
Outstanding
Options,
Warrants and
Rights | | (b)
Weighted-
Average
Exercise
Price of
Outstanding
Options,
Warrants and
Rights | | (c)
Number of
Securities
Remaining
Available for
Future Issuance
under Equity
Compensation
Plans (excluding
securities
reflected in
column (a)) |
| Equity compensation plans approved by security holders: | | 2014 Incentive
Award Plan | | 9,972,476 | | (1)(2) | | — | | (3) | | 7,027,251 | |
| | 2002 Employee
Stock Purchase Plan | | — | | | | — | | | | 254,852 (4) |
| Equity compensation plan not approved by security holders: | | Director Stock-in-lieu-of-Cash Plan(4) | | 418,377 | | (5) | | — | | (3) | | 82,395 | |
| Total | | | | 10,390,853 | | | | — | | | | 7,109,646 | |
| | | | | | | | | | | | | |
(1)As of December 31, 2024, 9,972,476 shares of common stock may be issued pursuant to outstanding awards under the 2014 Incentive Award Plan, consisting of (i) 6,315,638 outstanding deferred stock units (DSUs) and restricted stock units (RSUs), and (ii) 3,656,838 outstanding performance stock units (PSUs) based on target number of shares awarded. For additional information regarding each category of equity award, please refer to Note 2 below.
(2)As of December 31, 2024, 6,315,638 outstanding DSUs and RSUs were issuable under the 2014 Incentive Award Plan, consisting of 2,080,493 vested DSUs and 4,235,145 unvested DSUs and RSUs. As of December 31, 2024, there were no outstanding stock options under the 2014 Plan. As of December 31, 2024, all 3,656,838 PSUs were unearned and outstanding (based on the target number of shares to be awarded upon the contingent vesting of PSUs). PSUs are performance-based equity awards under which the number of shares of common stock that may be issued at the time of vesting will generally range from 0% to 250% of the number of PSUs granted based on the level of satisfaction of the applicable performance-based vesting condition over the vesting period, with the number of PSUs granted being adjusted at the time of vesting to reflect the value of any dividends paid on shares of common stock during the vesting period.
(3)As of December 31, 2024, there were no outstanding stock options and under our equity compensation plans no exercise price is applicable to DSUs, RSUs and PSUs.
(4)The maximum number of shares of common stock subject to issuance pursuant to our ESPP offering period outstanding as of December 31, 2024 was 254,852.
(5)As of December 31, 2024, 418,377 shares of common stock may be issued pursuant to the Director Stock-in-lieu-of-Cash Plan provisions of Redwood’s Amended and Restated Executive Deferred Compensation Plan. Through this Director Stock-in-lieu-of-Cash Plan, non-employee directors may elect to defer receipt of cash compensation and/or dividend equivalent rights, and instead acquire fully vested DSUs. The Director Stock-in-lieu-of-Cash Plan is a “value-neutral” plan, which means that with respect to cash amounts electively deferred by non-employee directors who participate in the Plan, there is no additional premium or matching contribution provided to the participant with regards to deferred amounts, and any vested DSUs acquired under the Plan are acquired at market value in accordance with the terms of the Plan. For additional information, please refer to the Amended and Restated Executive Deferred Compensation Plan, as amended, in Exhibits 10.21, 10.22, 10.23, 10.24, and 10.25 to Redwood’s Annual Report on Form-K for the year-ended December 31, 2024 filed on March 3, 2025.
ADDITIONAL INFORMATION ABOUT DIRECTORS AND EXECUTIVE OFFICERS
Delinquent Section 16(a) Reports
Section 16(a) of the Securities Exchange Act of 1934, as amended, requires our directors and executive officers, and persons who own more than 10% of our common stock, to file reports of ownership of, and transactions in, our common stock with the SEC within certain time periods following events giving rise to such filing requirements. Their initial report must be filed using the SEC’s Form 3 and subsequent stock purchases, sales, option exercises and other changes must be reported on the SEC’s Form 4, which must be filed within two business days of most transactions. In some cases, such as changes in ownership arising from gifts and inheritances, the SEC allows delayed reporting at year-end on the SEC’s Form 5. Based solely on a review of the copies of such reports, we believe that all Section 16(a) filing requirements applicable to our directors, executive officers, and stockholders were complied with during 2024.
Absence of Compensation Committee Interlocks and No Insider Participation on Compensation Committee
Our Compensation Committee currently consists of Ms. Proctor (the Chair), Ms. Damon, Ms. Horvath, and Mr. Kubicek. No member of our Compensation Committee has served as an officer or employee of Redwood at any time. None of our executive officers serves as a member of the compensation committee of any other company that has an executive officer serving as a member of our Board of Directors. None of our executive officers serve as a member of the board of directors of any other company that has an executive officer serving as a member of our Compensation Committee.
Certain Relationships and Related Transactions
Our Board of Directors monitors and reviews issues involving potential conflicts of interest and related party transactions. In this regard, the Board of Directors applies Redwood’s Code of Ethics, which provides that directors, officers, and all other employees are prohibited from taking actions, having interests, or having relationships that would cause a conflict of interest, and our directors, officers, and all other employees are expected to refrain from taking actions, having interests, or having relationships that would appear to cause a conflict of interest. There were no relationships or related party transactions between Redwood and any affiliated parties that are required to be reported in this Proxy Statement.
AUDIT COMMITTEE MATTERS
Audit Committee Report
The Audit Committee of the Board of Directors reports to and acts on behalf of the Board of Directors in providing oversight of the financial and risk management, independent registered public accounting firm, and financial reporting procedures of Redwood. Redwood’s management is responsible for internal controls and for preparing Redwood’s financial statements. The independent registered public accounting firm is responsible for performing an independent audit of Redwood’s consolidated financial statements in accordance with the Public Company Accounting Oversight Board (“PCAOB”) standards and issuing a report thereon. The Audit Committee is responsible for overseeing the conduct of these activities by Redwood’s management and the independent registered public accounting firm, including responsibility for the appointment, compensation and oversight of the independent registered public accounting firm.
In this context, the Audit Committee met and held discussions during 2024 and 2025 with management and the independent registered public accounting firm (including private sessions with the independent registered public accounting firm and Redwood’s head of internal audit). During these meetings, the Audit Committee, among other things, reviewed and discussed with both management and the independent registered public accounting firm the quarterly and audited year-end financial statements and reports prior to their issuance. These meetings also included an overview of the preparation and review of these financial statements and a discussion of any significant accounting issues. Management and the independent registered public accounting firm advised the Audit Committee that these financial statements were prepared under generally accepted accounting principles in all material respects. The Audit Committee also discussed the quality, not just the acceptability, of the accounting principles used in preparing the financial statements, the reasonableness of significant accounting judgments and estimates, and the clarity of disclosures in the financial statements. During these meetings, the Audit Committee also discussed with the independent registered public accounting firm the matters required to be discussed by the PCAOB Auditing Standard No. 1301 “Communications with Audit Committees.”
In addition, the Audit Committee received from the independent registered public accounting firm the written disclosures and the letter regarding the firm’s independence as required by Independence Standards Board Standard No. 1, Independence Discussions with Audit Committees. The independent registered public accounting firm provided certain other services in 2024. These disclosures and other matters relating to the firm’s independence, including any provision of non-audit services and the fees billed for professional services by the independent registered public accounting firm, were reviewed by the Audit Committee and discussed with the independent registered public accounting firm.
The independent registered public accounting firm discussed the scope of its audit with the Audit Committee prior to the audit. The Audit Committee discussed the results of the audit with management and the independent registered public accounting firm. The Audit Committee also discussed with management and the independent registered public accounting firm the adequacy of Redwood’s internal controls, policies, and systems, and the overall quality of Redwood’s financial reporting.
The Audit Committee also considered the reappointment of the independent registered public accounting firm, including based on an assessment of the service provided by the independent registered public accounting firm and the effectiveness of the external audit process. The Audit Committee considered, among other factors, the independence and integrity of the independent registered public accounting firm and its controls and procedures; the performance and qualifications of the independent registered public accounting firm, including expertise related to Redwood’s business and operations; the quality and effectiveness of the independent registered public accounting firm's personnel and communications; and the appropriateness of fees for professional services.
Based on its review of the financial statements, and in reliance on its review and discussions with management and the independent registered public accounting firm, the results of internal and external audit examinations, evaluations by the independent registered public accounting firm of Redwood’s internal controls, and the quality of Redwood’s financial reporting, the Audit Committee recommended to the Board of Directors that Redwood’s audited financial statements be included in Redwood’s Annual Report on Form 10-K for the fiscal year ended December 31, 2024 for filing with the Securities and Exchange Commission.
Audit Committee:
Debora D. Horvath, Chair
Armando Falcon
Georganne C. Proctor
Faith A. Schwartz
Fees to Independent Registered Public Accounting Firm for 2024 and 2023
Grant Thornton LLP audited Redwood’s financial statements and otherwise acted as Redwood’s independent registered public accounting firm with respect to the fiscal years ended December 31, 2024 and 2023. The following is a summary of the fees billed to Redwood by Grant Thornton LLP for professional services rendered for 2024 and 2023:
| | | | | | | | | | | | | | |
| | 2024 | | 2023 |
| Audit Fees | | $ | 2,377,835 | | | $ | 2,053,040 | |
| Audit-Related Fees | | 212,930 | | | 42,800 | |
| All Other Fees | | $ | — | | | $ | 320,000 | |
| Total Fees | | $ | 2,590,765 | | | $ | 2,415,840 | |
Audit Fees were for the audits of our annual consolidated financial statements included in our Annual Report on Form 10-K, review of the consolidated financial statements included in our Quarterly Reports on Form 10-Q, audits of our internal controls over financial reporting as required by Sarbanes-Oxley, audits of annual financial statements of certain of our subsidiaries, provision of comfort letters, as well as other services in connection with statutory and regulatory filings or engagements.
Audit-Related Fees reflect fees for attestation services related to certain of our subsidiaries.
All Other Fees reflects fees for agreed-upon procedures related to certain of our securitization transactions.
Policy on Audit Committee Pre-Approval of Audit and Permissible Non-Audit Services of Independent Registered Public Accounting Firm
It is the Audit Committee’s policy to review and pre-approve the scope, terms, and related fees of all auditing services and permitted non-audit services provided by the Independent Registered Accounting Firm, subject to de minimis exceptions for non-audit services which are approved by the Audit Committee prior to the completion of the audit.
ITEM 2 — RATIFICATION OF APPOINTMENT OF
THE INDEPENDENT REGISTERED PUBLIC ACCOUNTING FIRM
The Audit Committee has selected Grant Thornton LLP as the independent registered public accounting firm to audit the books of Redwood and its subsidiaries for the year ending December 31, 2025, to report on the consolidated financial statements of Redwood and its subsidiaries, and to perform such other appropriate accounting services as may be required by our Board of Directors. The Board of Directors recommends that the stockholders vote in favor of ratifying the appointment of Grant Thornton LLP for the purposes set forth above. If the stockholders do not ratify the appointment of Grant Thornton LLP, the Audit Committee will consider a change in auditors for the next year. Even if the selection is ratified, the Audit Committee in its discretion may direct the appointment of a different independent registered public accounting firm at any time during the year if the Audit Committee determines that such a change would be in the best interests of Redwood.
Grant Thornton LLP has advised the Audit Committee that they are independent accountants with respect to Redwood, within the meaning of standards established by the American Institute of Certified Public Accountants, the PCAOB, and the Independence Standards Board and federal securities laws administered by the SEC. A representative of Grant Thornton LLP will be present at the Annual Meeting, will have the opportunity to make a statement if so desired, and will be available to respond to appropriate questions.
Vote Required
If a quorum is present, the affirmative vote of a majority of the votes cast at the Annual Meeting is required for ratification of the appointment of Grant Thornton LLP as our independent registered public accounting firm for the year ending December 31, 2025. Abstentions and broker non-votes, if any, will not be counted as votes cast and will have no effect on the results of the vote in ratifying the appointment of Grant Thornton LLP.
THE BOARD OF DIRECTORS UNANIMOUSLY RECOMMENDS A VOTE FOR THE RATIFICATION OF THE APPOINTMENT OF GRANT THORNTON LLP AS REDWOOD’S INDEPENDENT REGISTERED PUBLIC ACCOUNTING FIRM FOR 2025.
ITEM 3 — VOTE ON AN ADVISORY RESOLUTION TO
APPROVE NAMED EXECUTIVE OFFICER COMPENSATION
Each year, Redwood’s stockholders have an opportunity to vote on a resolution to approve, on an advisory (non-binding) basis, the compensation of Redwood’s Named Executive Officers as disclosed in this Proxy Statement in the “Compensation Discussion and Analysis” section and the related executive compensation tables and narrative discussion. This proposal, commonly known as a “Say-on-Pay” proposal, gives Redwood’s stockholders the opportunity to express their views on the compensation of Redwood’s Named Executive Officers. This vote is not intended to address any specific item of compensation, but rather the overall compensation of Redwood’s Named Executive Officers and the executive compensation philosophy, objectives, programs, plans, policies, and practices described in this Proxy Statement.
Redwood’s Named Executive Officers in this Proxy Statement are:
•Christopher J. Abate, Chief Executive Officer
•Dashiell I. Robinson, President
•Brooke E. Carillo, Chief Financial Officer
•Sasha G. Macomber, Chief Human Resources Officer
•Andrew P. Stone, Executive Vice President, Chief Legal Officer, and Secretary
The Compensation Committee of Redwood’s Board of Directors acts on behalf of the Board of Directors in administering Redwood’s executive compensation plans and programs. As described in detail within the “Compensation Discussion and Analysis” section of this Proxy Statement, Redwood has a performance-based executive compensation philosophy and program that incentivizes attainment of business goals and sustainable stockholder returns, aligns the interests of executive officers with those of long-term stockholders, and enables Redwood to hire and retain talented individuals in a competitive marketplace.
The Compensation Committee is committed to providing disclosure within the “Compensation Discussion and Analysis” section of this Proxy Statement that gives insight into the process by which it arrives at determinations relating to executive compensation and the underlying rationales. Among other things, the Compensation Discussion and Analysis describes:
•The Compensation Committee’s process for reviewing and determining the elements of the CEO’s compensation and that of the other Named Executive Officers.
•The rationale for the different elements of the Named Executive Officers’ compensation and Redwood’s compensation philosophy, objectives, and methodology for peer comparisons.
•The metrics and goals used for performance-based compensation and factors taken into account in the Compensation Committee’s determination of whether those metrics and goals were satisfied.
•The severance and change of control payments that Named Executive Officers may become entitled to receive under certain circumstances.
•The role of the Compensation Committee’s independent compensation consultant.
Each year the Compensation Committee reviews Redwood’s compensation philosophy and its executive compensation plans and programs. After taking into account various factors and analyses, input from its independent compensation consultant, feedback from stockholders obtained during ongoing outreach efforts, and the outcome of recent stockholder advisory votes on executive compensation (commonly referred to as “Say-on-Pay” votes), the Committee makes compensation determinations it believes are appropriate in light of its executive compensation objectives.
Please read the “Executive Summary of Compensation Discussion and Analysis” and “Compensation Discussion and Analysis” sections of this Proxy Statement, which begin on pages 32 and 47, respectively, and the related executive compensation tables, which begin on page 79, for more information about the compensation of Redwood’s Named Executive Officers for 2024. The Board of Directors and the Compensation Committee believe these disclosures should be taken into consideration by stockholders in exercising their advisory vote on executive compensation.
At this Annual Meeting, stockholders are being asked to indicate their support for the compensation of Redwood’s Named Executive Officers as disclosed in this Proxy Statement. As noted above, this vote is not intended to address any specific item of compensation, but rather the overall compensation of Redwood’s Named Executive Officers and the executive compensation philosophy, objectives, programs, plans, policies, and practices described in this Proxy Statement.
Accordingly, Redwood’s stockholders are asked to vote “FOR” the following “Say-on-Pay” advisory resolution at the Annual Meeting:
“RESOLVED, that the compensation of the Named Executive Officers, as disclosed in the Annual Proxy Statement for the 2025 Annual Meeting of Stockholders pursuant to the compensation disclosure rules of the Securities and Exchange Commission, including the Compensation Discussion and Analysis, the Summary Compensation Table, and the related tables and narrative disclosure, is hereby approved.”
This “Say-on-Pay” vote is a non-binding advisory vote. The approval or disapproval of this resolution by stockholders will not require the Board of Directors or the Compensation Committee to take any action regarding Redwood’s executive compensation practices. The final decision on the compensation and benefits of Redwood’s Named Executive Officers and on whether, and if so, how, to address stockholder disapproval of this resolution remains with the Board of Directors and the Compensation Committee.
In 2011, again in 2017, and again in 2023, the Board of Directors determined to hold an advisory “Say-on-Pay” vote every year. Unless the Board of Directors modifies its determination of the frequency of future “Say-on-Pay” advisory votes, the next “Say-on-Pay” advisory vote (following the 2025 Annual Meeting) will be held at Redwood’s 2026 annual meeting of stockholders.
Vote Required
If a quorum is present, the affirmative vote of a majority of the votes cast at the Annual Meeting is required to approve, on an advisory basis, the resolution approving the compensation of Redwood’s Named Executive Officers. Abstentions and broker non-votes will not be counted as votes cast and will have no effect on the result of the vote.
THE BOARD OF DIRECTORS UNANIMOUSLY RECOMMENDS A VOTE FOR THE APPROVAL OF THE NON-BINDING RESOLUTION APPROVING THE COMPENSATION OF THE NAMED EXECUTIVE OFFICERS.
STOCKHOLDER PROPOSALS FOR THE 2026 ANNUAL MEETING
Pursuant to Rule 14a-8 under the Securities Exchange Act of 1934, as amended (the Exchange Act), stockholders may present proper proposals for inclusion in Redwood’s 2026 annual proxy statement and for consideration at Redwood’s 2026 annual meeting of stockholders. To be eligible for inclusion in Redwood’s 2026 annual proxy statement, a stockholder proposal must be received in writing not less than 120 calendar days before the first anniversary of the date Redwood released its proxy statement for the preceding year’s annual meeting and must otherwise comply with Rule 14a-8 under the Exchange Act. Accordingly, a stockholder nomination for director or proposal of business intended to be considered at the 2026 annual meeting of stockholders must be received by Redwood’s Secretary not later than December 12, 2025 to be eligible for inclusion in Redwood’s 2026 annual proxy statement. While the Board of Directors will consider stockholder proposals, Redwood reserves the right to omit from its annual proxy statement stockholder proposals that it is not required to include under the Exchange Act and Redwood’s Bylaws, including as a result of Rule 14a-8 under the Exchange Act.
In addition, Redwood’s current Bylaws contain advance notice provisions with respect to matters to be brought before an annual meeting of stockholders, including nominations for election to the Board of Directors. Redwood’s Bylaws currently provide that in order for a stockholder to nominate a candidate for election as a director at an annual meeting of stockholders or propose business for consideration at an annual meeting, written notice containing the information required by the Bylaws must be delivered to the Secretary at Redwood’s principal executive office not earlier than the 150th calendar day nor later than 5:00 p.m., Pacific Time, on the 120th calendar day prior to the first anniversary of the date we released the proxy statement for the preceding year’s annual meeting. Accordingly, under Redwood's current Bylaws, a stockholder nomination for director or proposal of business intended to be considered at the 2026 annual meeting of stockholders must be received by the Secretary not earlier than November 12, 2025, and not later than 5:00 p.m., Pacific Time, on December 12, 2025. Proposals should be mailed to Redwood Trust, Inc., Attention: Secretary, One Belvedere Place, Suite 300, Mill Valley, CA 94941.
A copy of the Bylaws may be obtained from Redwood’s Secretary by written request to the same address.
INFORMATION INCORPORATED BY REFERENCE
This Proxy Statement incorporates by reference the information set forth in Redwood’s Annual Report on Form 10-K for the year ended December 31, 2024 (the 2024 Annual Report) under the following headings: Item 7. Management’s Discussion and Analysis of Financial Condition and Results of Operations; Item 7A. Quantitative and Qualitative Disclosures about Market Risk; Item 8. Financial Statements and Supplementary Data; and Item 9. Changes in and Disagreements with Accountants on Accounting and Financial Disclosure.
Copies of our 2024 Annual Report on Form 10-K are available upon request without charge. Requests may be oral or written and should be directed to the attention of the Secretary of Redwood at (866) 269-4976 or at the principal executive offices of Redwood at the address set forth above under “Stockholder Proposals for the 2026 Annual Meeting.” In addition, within the Investor Relations section of Redwood’s website located at www.redwoodtrust.com, you can obtain, without charge, a copy of Redwood’s 2024 Annual Report on Form 10-K. Please note that the information on Redwood’s website is not part of this Proxy Statement.
BY ORDER OF THE BOARD OF DIRECTORS
March 31, 2025 /s/ Andrew P. Stone
Mill Valley, California Secretary
Reconciliation of
2024 Non-GAAP EAD ROE
to
2024 Return on Equity Based on GAAP Financial Results
Reconciliation of:
2024 GAAP Return on Equity (GAAP ROE)
to
2024 EAD Return on Equity (EAD ROE)
($ in thousands)
| | | | | | | | | | | | | | | | | | | | | | | |
| Calculation of: |
| | GAAP ROE | | | EAD ROE |
| 2024 GAAP net income available to common shares | $ | 46,989 | | $ | 46,989 |
| Adjustments: | | | | | | | |
Investment fair value changes, net (1) | $ | — | | | $ | 14,759 |
Realized (gains)/losses, net (2) | | | — | | | | | (306) |
Acquisition related expenses (3) | | | — | | | | | 9,412 |
Organizational restructuring charges (4) | | | — | | | | | 2,814 |
Tax effect of adjustments (5) | | | — | | | | (437) |
| 2024 Net Income available to/non-GAAP Earnings Available for Distribution to common stockholders | $ | 46,989 | | $ | 73,231 |
| 2024 Average GAAP common equity | $ | 1,141,598 | | $ | 1,141,598 |
| | | | | | | |
| Calculation: Divide 2024 Net Income available to/non-GAAP Earnings Available for Distribution to common stockholders by 2024 Average common equity | | 4.1 | % | | | 6.4 | % |
| | | | | |
| (1) | Investment fair value changes, net includes all amounts within that same line item on our consolidated statements of income, which primarily represents both realized and unrealized gains and losses on our investments (excluding HEI investments) and associated hedges. Realized and unrealized gains and losses on our HEI investments are reflected in a line item on our consolidated income statements titled "HEI income, net". |
| (2) | Realized (gains)/losses, net includes all amounts within that line item on our consolidated statements of income. |
| (3) | Acquisition related expenses include transaction costs paid to third parties, as applicable, and the ongoing amortization of intangible assets related to the Riverbend, CoreVest and 5Arches acquisitions. |
| (4) | Organizational restructuring charges represent costs associated with employee severance and transition expenses. |
| (5) | Tax effect of adjustments represents the hypothetical income taxes associated with all adjustments used to calculate EAD ROE. |
Non-GAAP Earnings Available for Distribution (“EAD”) and EAD Return on Equity (“EAD ROE”)
EAD and EAD ROE are non-GAAP measures derived from GAAP Net income (loss) available (related) to common stockholders and GAAP return on common equity (“GAAP ROE”), respectively.
EAD is defined as: GAAP net income (loss) available (related) to common stockholders adjusted to: (i) exclude investment fair value changes; (ii) exclude realized gains and losses; (iii) exclude acquisition related expenses; (iv) exclude certain organization restructuring charges; and (v) adjust for the hypothetical income taxes associated with these adjustments.
EAD ROE is defined as: EAD divided by average common equity.
Management believes EAD and EAD ROE provide supplemental information to assist it and investors in analyzing the Company’s results of operations and help facilitate comparisons to industry peers. Management also believes that EAD and EAD ROE are metrics that can supplement its analysis of the Company’s ability to pay dividends, by providing an indication of the current income generating capacity of the Company's business operations as of the period being presented. EAD and EAD ROE should not be utilized in isolation, nor should they be considered as an alternative to GAAP net income (loss) available (related) to common stockholders, GAAP ROE or other measurements of results of operations computed in accordance with GAAP or for federal income tax purposes.
Annex B
Additional Disclosure Regarding
Non-GAAP Adjusted ROE
and
Non-GAAP Adjusted EAD ROE
Additional Disclosure Regarding
Non-GAAP Adjusted ROE and Non-GAAP Adjusted EAD ROE
and
the Use of These Non-GAAP Metrics in
Determining Realization of Performance-Based Annual Bonuses
As described in the Compensation Discussion and Analysis section of this Proxy Statement, two different non-GAAP financial performance metrics were used in 2024 within the Compensation Committee’s methodology for determining realization of each NEO’s performance-based annual bonus for 2024. In particular, for 2024, the Committee determined that 50% of the target amount of the financial performance component of annual bonuses would be realized based on 2024 Adjusted ROE and the other 50% of the target amount of the financial performance component of annual bonuses would be realized based on 2024 Adjusted EAD ROE.
Set forth within this Annex B is a detailed description of each of these non-GAAP financial performance metrics, as well as a review of the Compensation Committee’s methodology for determining annual bonus realization based on these metrics. Note: Adjusted ROE and Adjusted EAD ROE should not be considered as alternatives to GAAP net income, GAAP ROE or other measurements of results of operations computed in accordance with GAAP or for federal income tax purposes.
Adjusted ROE – Description. Adjusted ROE is a non-GAAP financial performance metric, which has historically been very closely correlated to Redwood’s ROE based on GAAP financial results, but differs in certain respects. Adjusted ROE generally reflects adjusted earnings on average common equity capital adjusted to exclude certain unrealized mark-to-market gains and losses.
Because Adjusted ROE is a ratio of earnings to equity capital, the adjustment to exclude certain unrealized mark-to-market gains and losses from equity is made to enable the calculation of an “apples-to-apples” non-GAAP ratio of earnings to common equity capital for purposes of evaluating financial performance. For example, under GAAP, an unrealized loss recognized in equity capital but not recognized in earnings has the impact, all other factors being equal, of increasing the ratio of earnings to equity capital. Adjusted ROE addresses this by increasing equity capital by the amount of the unrealized loss, allowing for a non-GAAP calculation of a ratio using internally consistent earnings and equity capital amounts. Conversely, under GAAP, an unrealized gain recognized in equity capital but not recognized in earnings has the impact, all other factors being equal, of decreasing the ratio of earnings to equity capital. Adjusted ROE addresses this by decreasing equity capital by the amount of the unrealized gain, allowing for a non-GAAP calculation of a ratio using internally consistent earnings and equity capital amounts.
Adjusted ROE is determined by: (i) making the following adjustments to GAAP net income (loss) available (related) to common stockholders adjusted to: (A) exclude certain acquisition-related expenses (e.g., excludes amortization expense related to intangible assets acquired in acquisitions); (B) exclude any valuation allowance, if any, on long-lived deferred tax assets in excess of specified levels; (C) exclude the impact, if any, of any variance in the consolidation treatment of specified entities under GAAP from a designated consolidation treatment of such specified entities; and (D) adjust for the hypothetical income taxes associated with these adjustments; and (ii) dividing adjusted net income (loss) available (related) to common stockholders by average common equity capital adjusted to exclude certain unrealized mark-to-market gains and losses. In addition, to the extent any adjustment in determining Adjusted ROE is applicable under either of the preceding clauses (B) or (C), a corresponding adjustment, if applicable, would also be made to average common equity capital for purposes of calculating Adjusted ROE.
Adjusted ROE – Methodology for Determining Annual Bonus Realization. As noted above, for 2024, the Committee determined that 50% of the target amount of the financial performance component of annual bonuses would be realized based on 2024 Adjusted ROE relative to a 11.5% target level of Adjusted ROE performance established by the Committee in the first quarter of 2024.
•Target-Level Performance: If 2024 Adjusted ROE equaled 11.5%, then 100% of the target amount of annual bonus for this sub-component of annual bonus would be realized by each NEO.
•Below Target-Level Performance: If 2024 Adjusted ROE was between 2.875% and 11.5%, then between 25% and 100% of the target amount of annual bonus for this sub-component of annual bonus would be realized by each NEO (based on a straight-line, mathematical interpolation).
•Above Target-Level Performance: If 2024 Adjusted ROE was above 11.5%, then above-target bonus for this sub-component of annual bonus would be realized by each NEO based on the following (using straight-line, mathematical interpolation): for each incremental percentage point of Adjusted ROE performance above 11.5%, an additional 27.75% of target bonus for this sub-component of annual bonus would be realized.
•Maximum Annual Bonus. As described in CD&A section of this Proxy Statement, each NEO was subject to a maximum annual bonus cap for 2024, such that the sum of the individual performance component of annual bonus, together with the realization of the company financial performance component of annual bonus (which is realized based on an equal weighting of Adjusted ROE and Adjusted EAD ROE performance), could not exceed 3.0x of such NEO’s target annual bonus.
Adjusted EAD ROE – Description. Adjusted EAD ROE is a non-GAAP financial performance metric derived from Redwood’s ROE based on GAAP financial results, but which differs in key respects. Adjusted EAD ROE is calculated by first deriving non-GAAP Adjusted Earnings Available for Distribution (“Adjusted EAD”) from GAAP net income (loss) available (related) to common stockholders and then dividing Adjusted EAD by average common equity capital adjusted to exclude certain unrealized mark-to-market gains and losses.
Because Adjusted EAD ROE is a ratio of earnings to equity capital, the adjustment to exclude certain unrealized mark-to-market gains and losses from equity is made to enable the calculation of an “apples-to-apples” non-GAAP ratio of earnings to common equity capital for purposes of evaluating financial performance. For example, under GAAP, an unrealized loss recognized in equity capital but not recognized in earnings has the impact, all other factors being equal, of increasing the ratio of earnings to equity capital. Adjusted EAD ROE addresses this by increasing equity capital by the amount of the unrealized loss, allowing for a non-GAAP calculation of a ratio using internally consistent earnings and equity capital amounts. Conversely, under GAAP, an unrealized gain recognized in equity capital but not recognized in earnings has the impact, all other factors being equal, of decreasing the ratio of earnings to equity capital. Adjusted EAD ROE addresses this by decreasing equity capital by the amount of the unrealized gain, allowing for a non-GAAP calculation of a ratio using internally consistent earnings and equity capital amounts.
Adjusted EAD is defined as: GAAP net income (loss) available (related) to common stockholders adjusted to: (i) exclude investment fair value changes, net; (ii) exclude realized gains and losses; (iii) exclude certain acquisition-related expenses (e.g., excludes amortization expense related to intangible assets acquired in acquisitions); (iv) exclude certain organizational restructuring charges; (v) exclude any valuation allowance, if any, on long-lived deferred tax assets in excess of specified levels; (vi) exclude the impact, if any, of any variance in the consolidation treatment of specified entities under GAAP from a designated consolidation treatment of such specified entities; and (vii) adjust for the hypothetical income taxes associated with these adjustments. In addition, to the extent any adjustment in determining Adjusted EAD is applicable under either of the preceding clauses (v) or (vi), a corresponding adjustment, if applicable, would also be made to average common equity capital for purposes of calculating Adjusted EAD ROE.
It should be noted that Adjusted EAD and Adjusted EAD ROE, which are utilized within the Compensation Committee’s methodology for determining realization of each NEO’s performance-based annual bonus for 2024, differ from the non-GAAP Earnings Available for Distribution (“EAD”) and non-GAAP EAD ROE financial reporting metrics that the Company published in connection with reporting its fourth quarter 2024 earnings. Redwood’s 2024 non-GAAP EAD ROE is reported within the CD&A section of this proxy statement and is further
discussed and reconciled to return on equity determined in accordance with GAAP within Annex A to this Proxy Statement.
Adjusted EAD ROE – Methodology for Determining Annual Bonus Realization. As noted above, for 2024, the Committee determined that 50% of the target amount of the financial performance component of annual bonuses would be realized based on 2024 Adjusted EAD ROE relative to a 6.5% target level of Adjusted EAD ROE performance established by the Committee in the first quarter of 2024.
•Target-Level Performance: If 2024 Adjusted EAD ROE equaled 6.5%, then 100% of the target amount of annual bonus for this sub-component of annual bonus would be realized by each NEO.
•Below Target-Level Performance: If 2024 Adjusted EAD ROE was between 1.625% and 6.5%, then between 25% and 100% of the target amount of annual bonus for this sub-component of annual bonus would be realized by each NEO (based on a straight-line, mathematical interpolation).
•Above Target-Level Performance: If 2024 Adjusted EAD ROE was above 6.5%, then above-target bonus for this sub-component of annual bonus would be realized by each NEO based on the following (using straight-line, mathematical interpolation): for each incremental percentage point of Adjusted EAD ROE performance above 6.5%, an additional 27.75% of target bonus for this sub-component of annual bonus would be realized.
•Maximum Annual Bonus. As described in CD&A section of this Proxy Statement, each NEO was subject to a maximum annual bonus cap for 2024, such that the sum of the individual performance component of annual bonus, together with the realization of the company financial performance component of annual bonus (which is realized based on an equal weighting of Adjusted EAD ROE and Adjusted ROE performance), could not exceed 3.0x of such NEO’s target annual bonus.


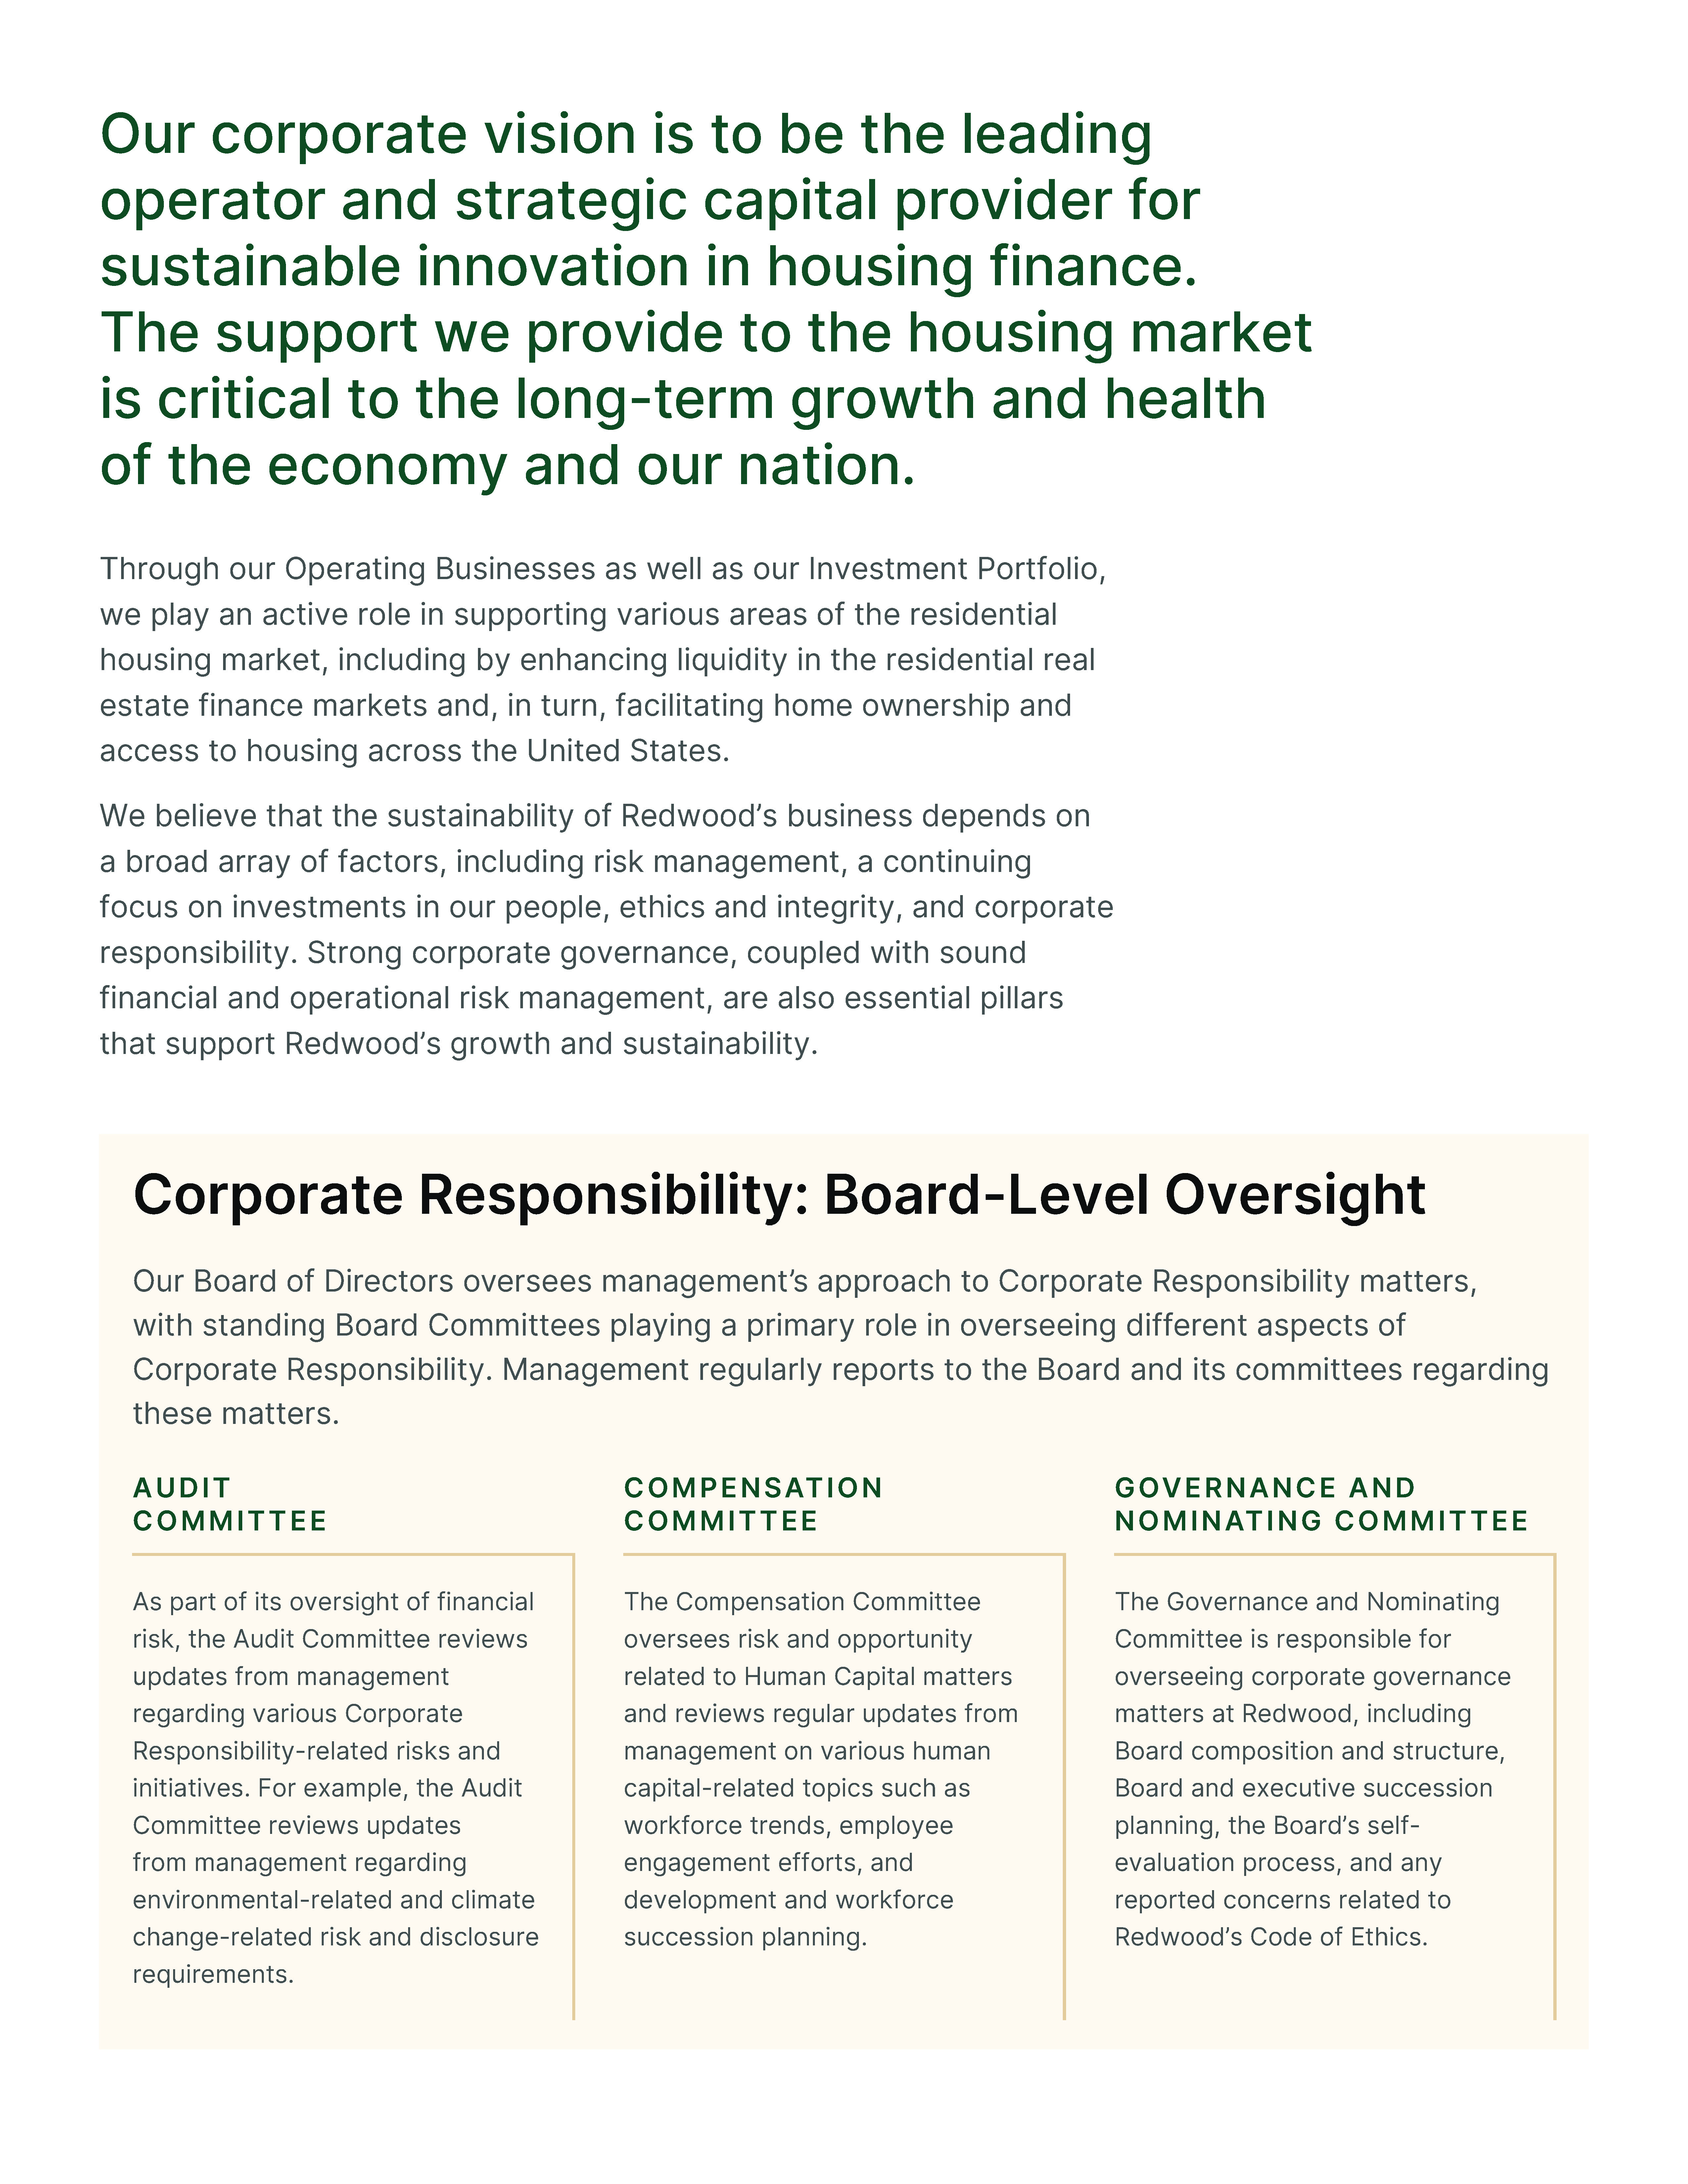
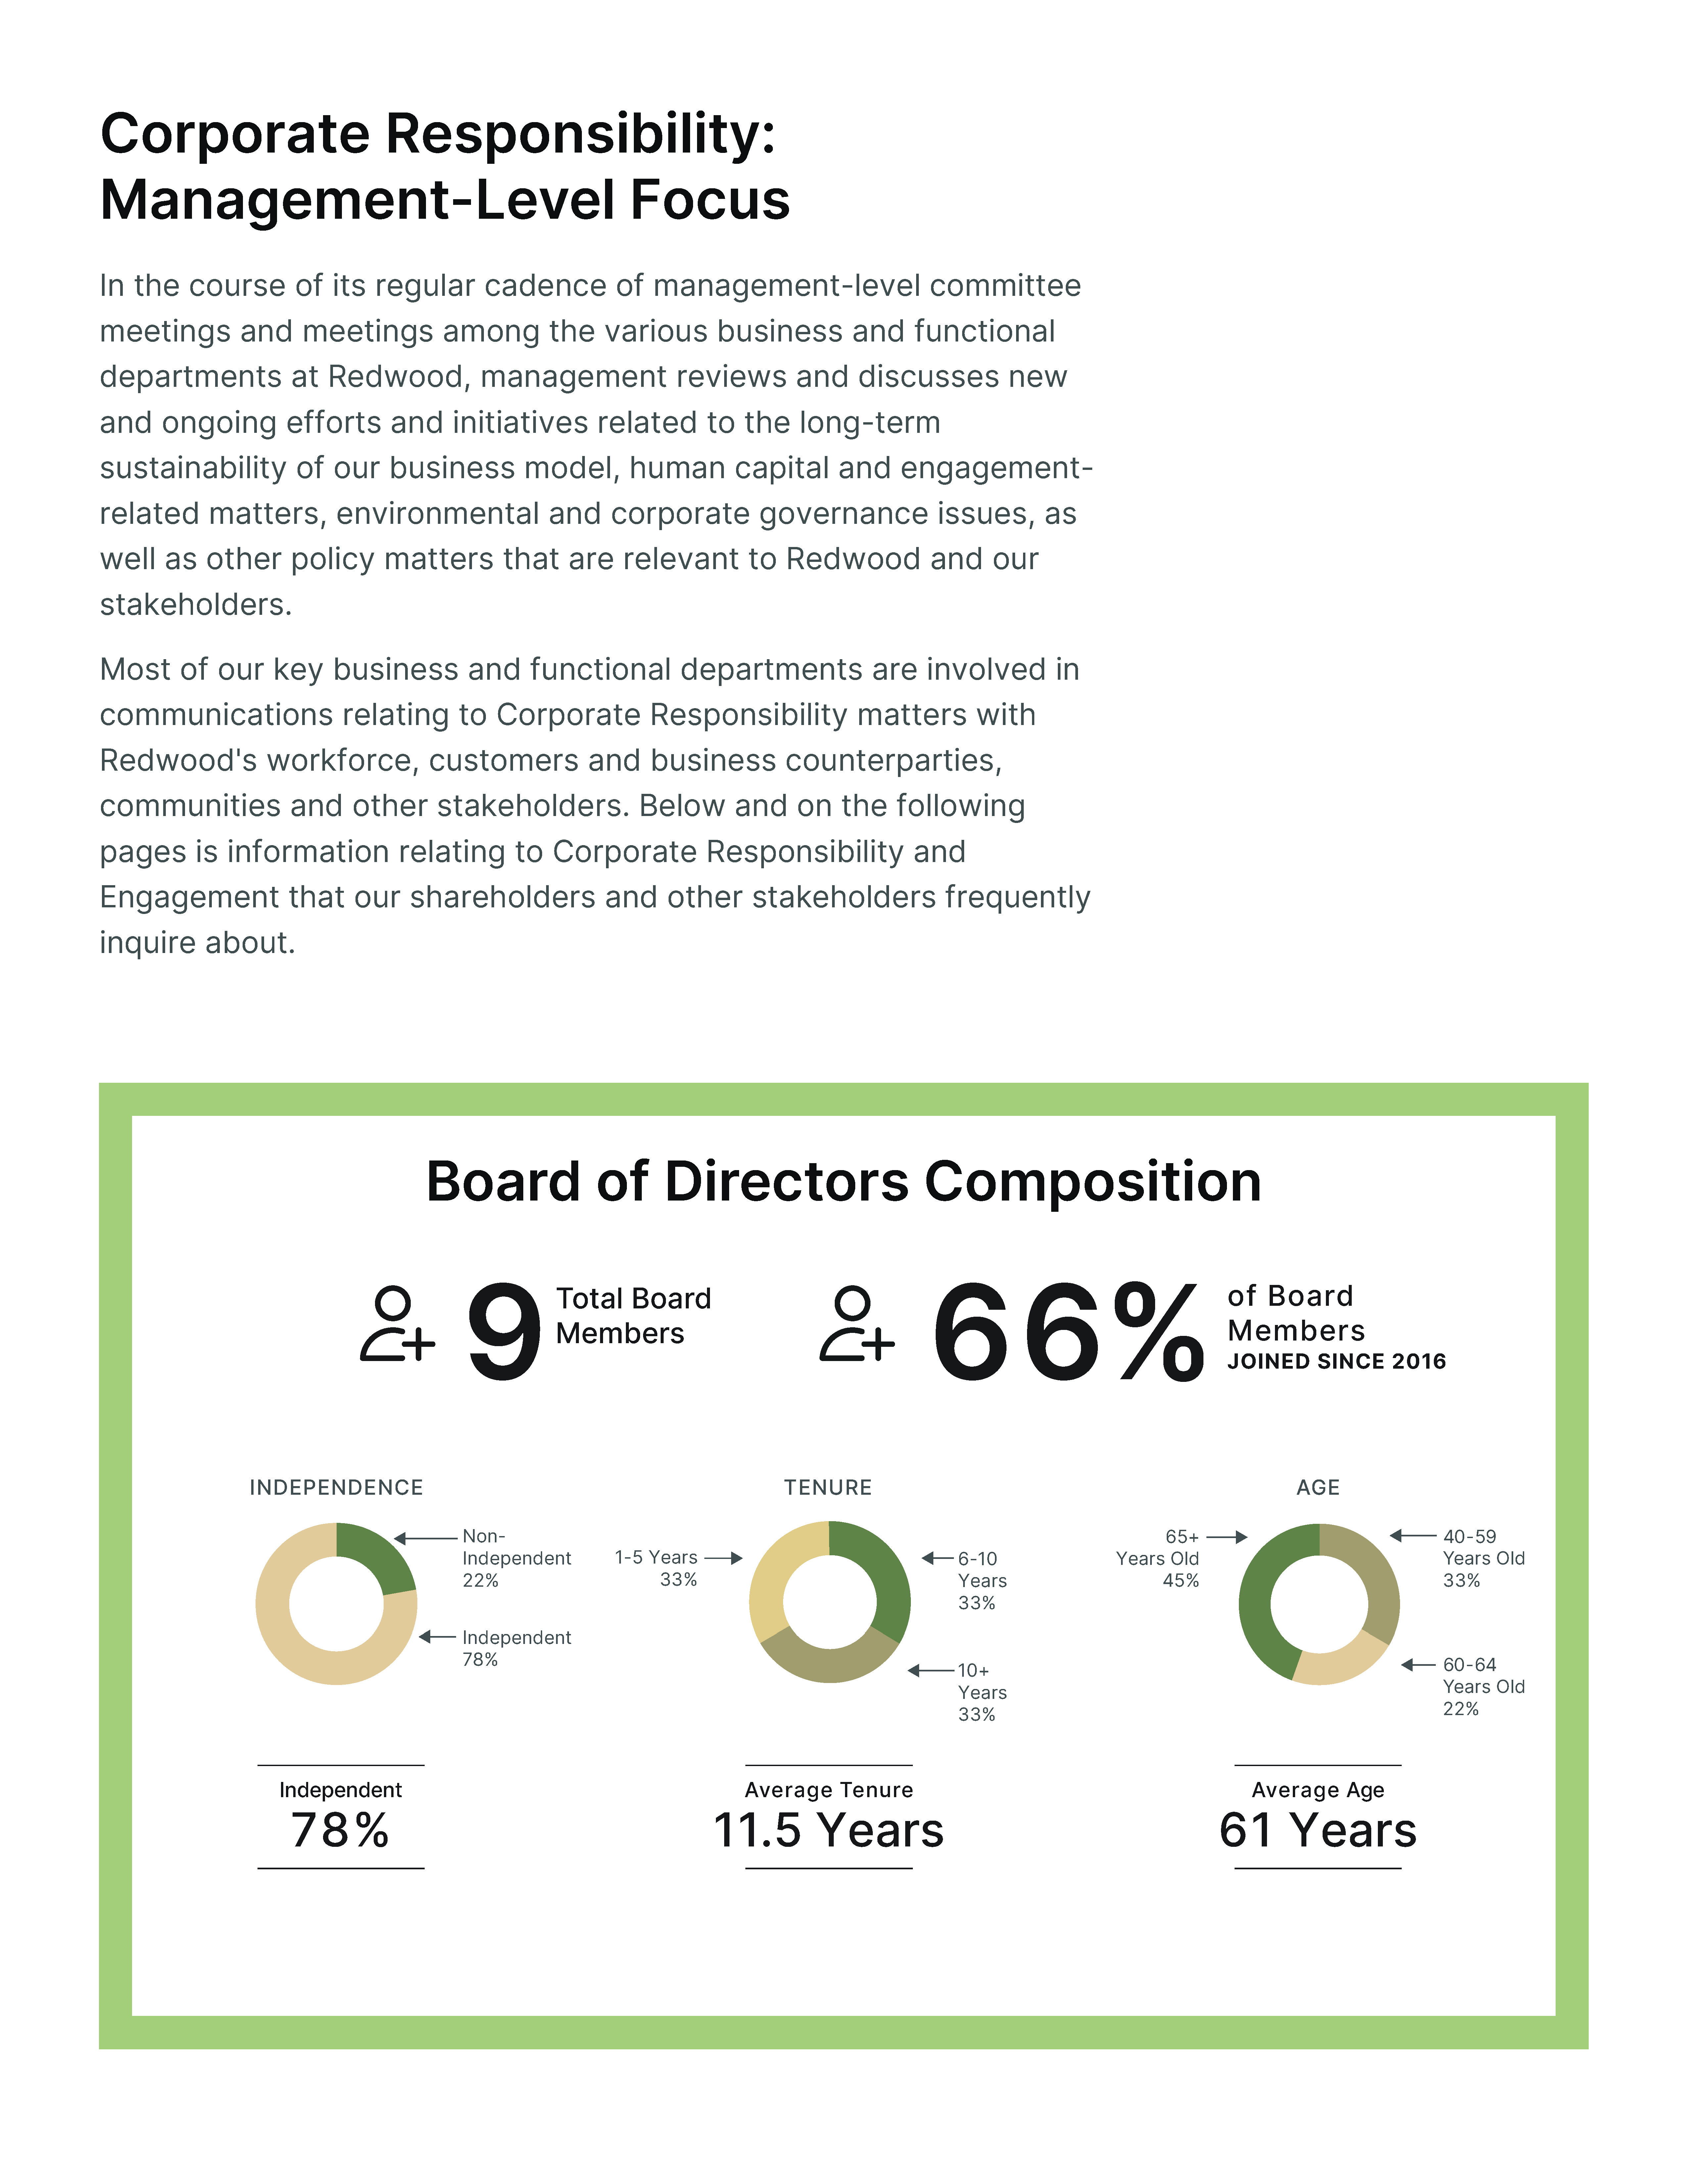
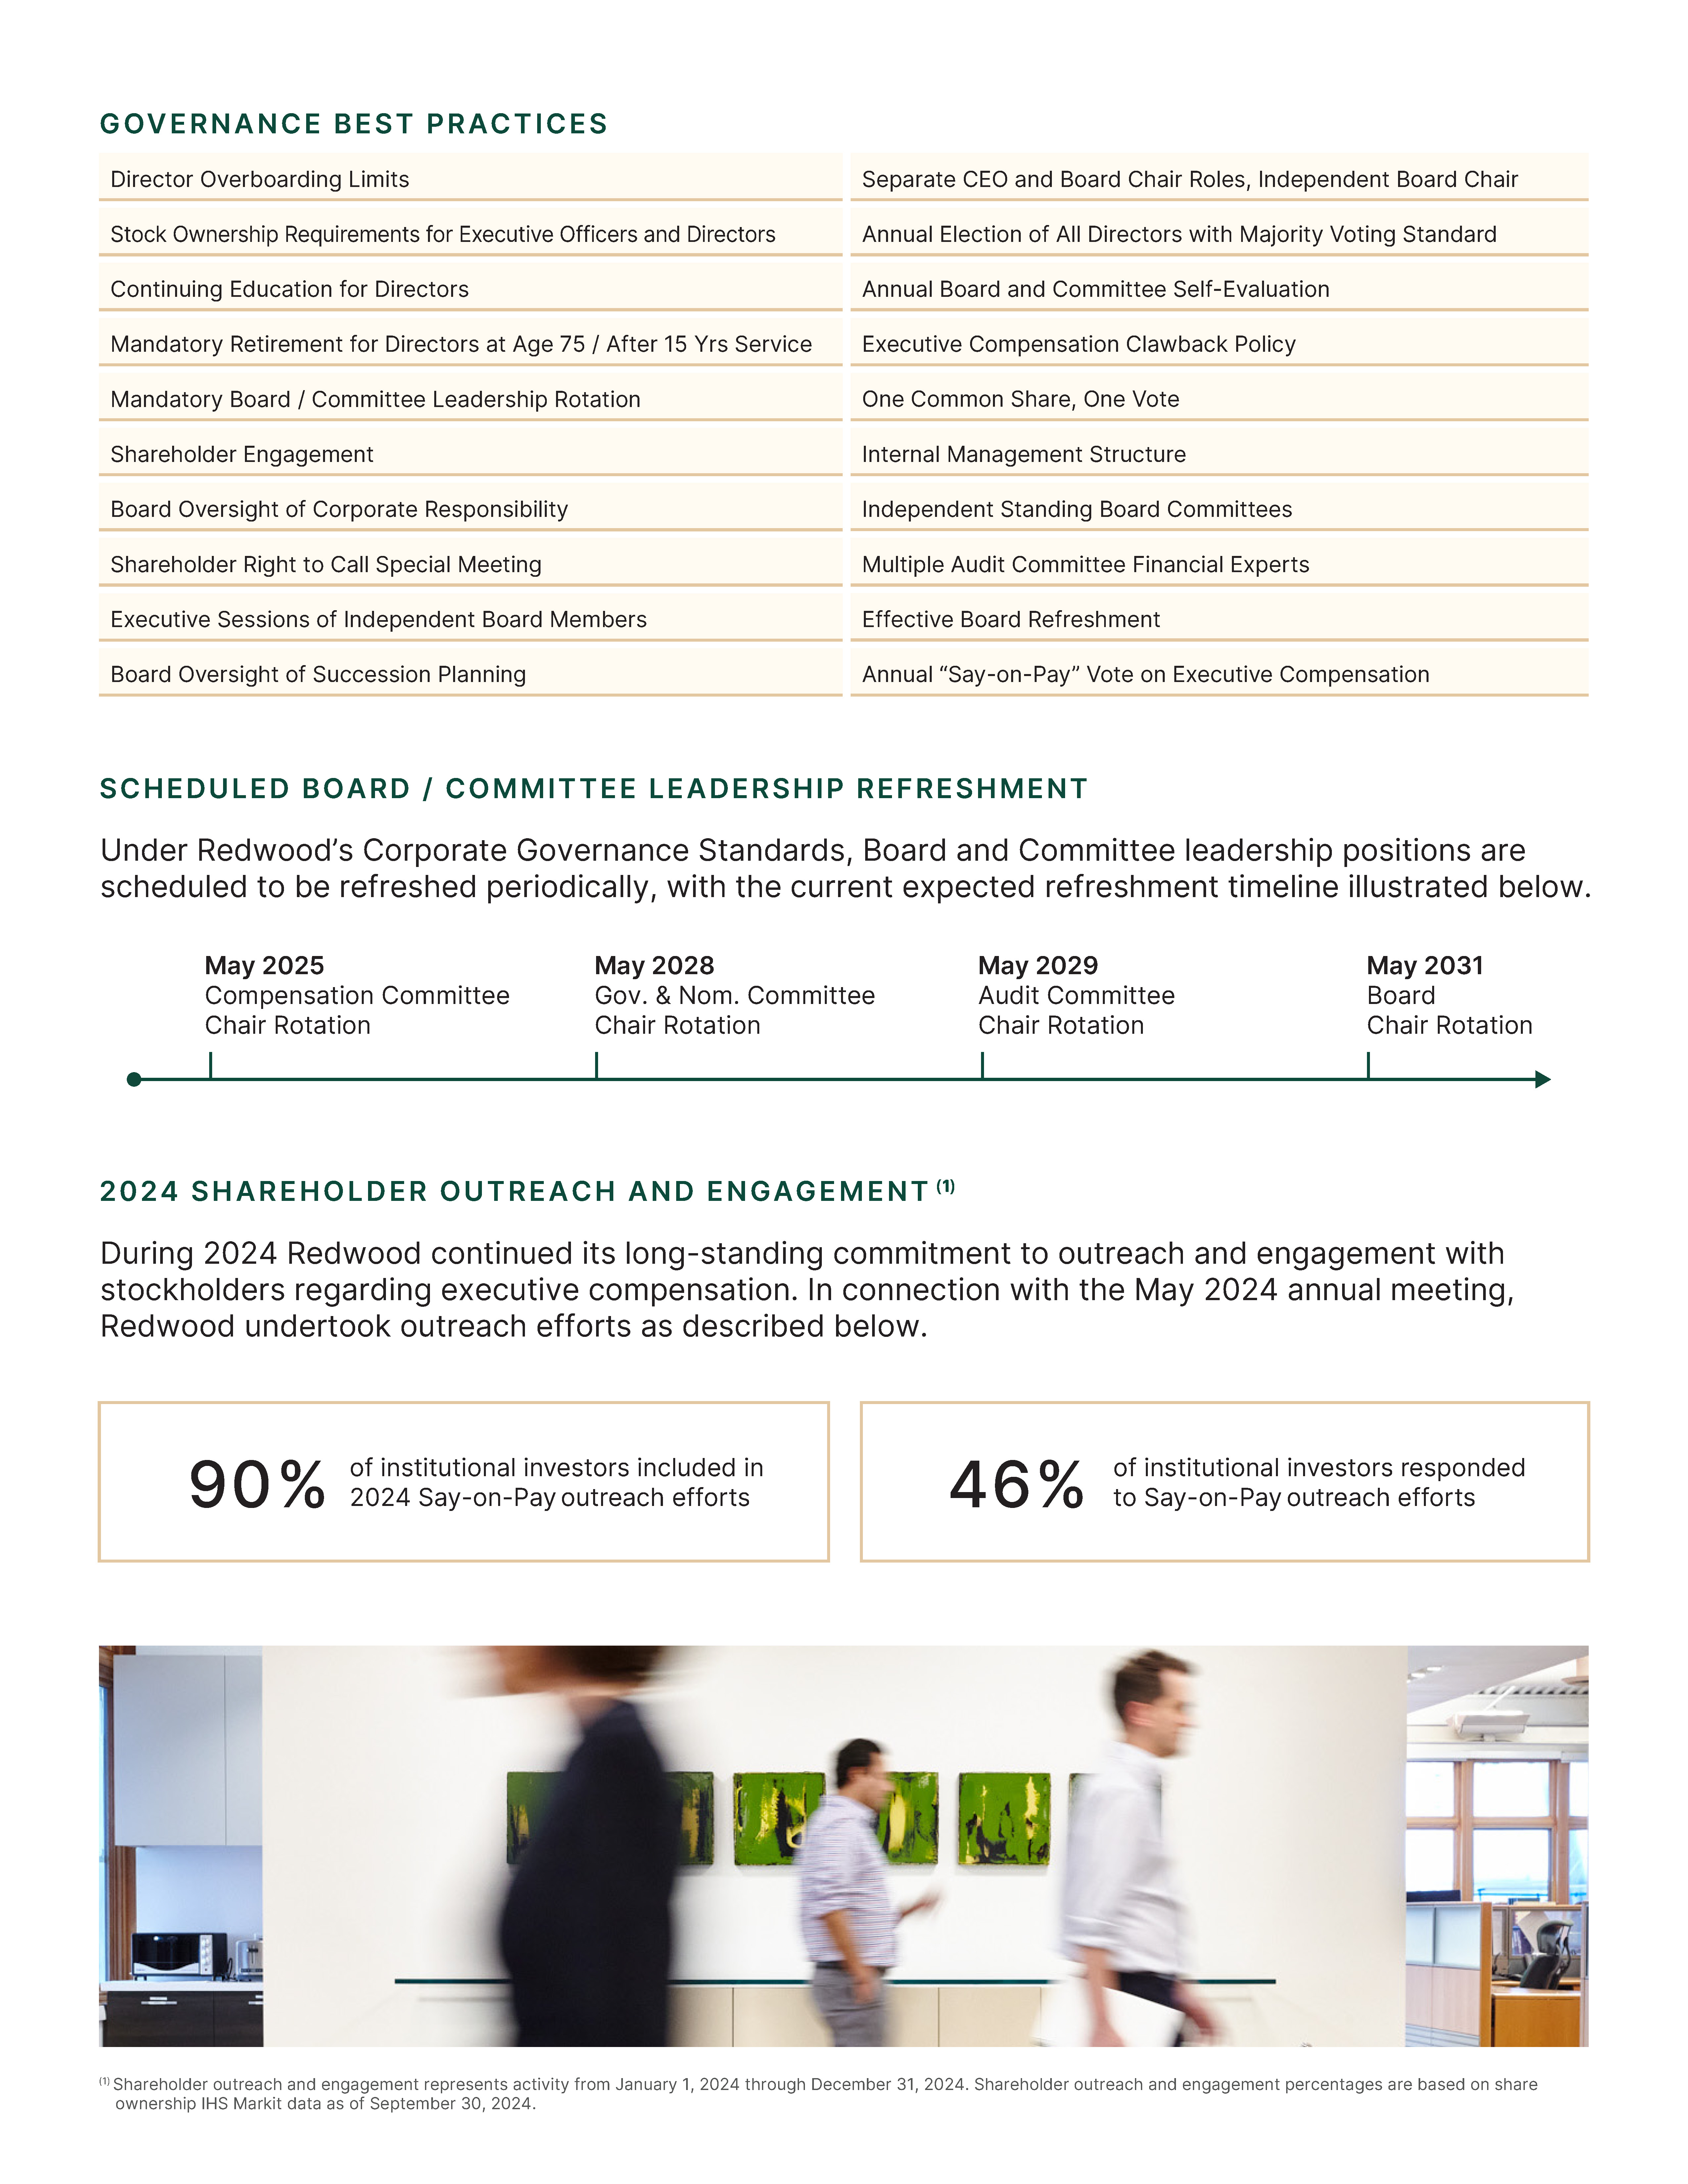

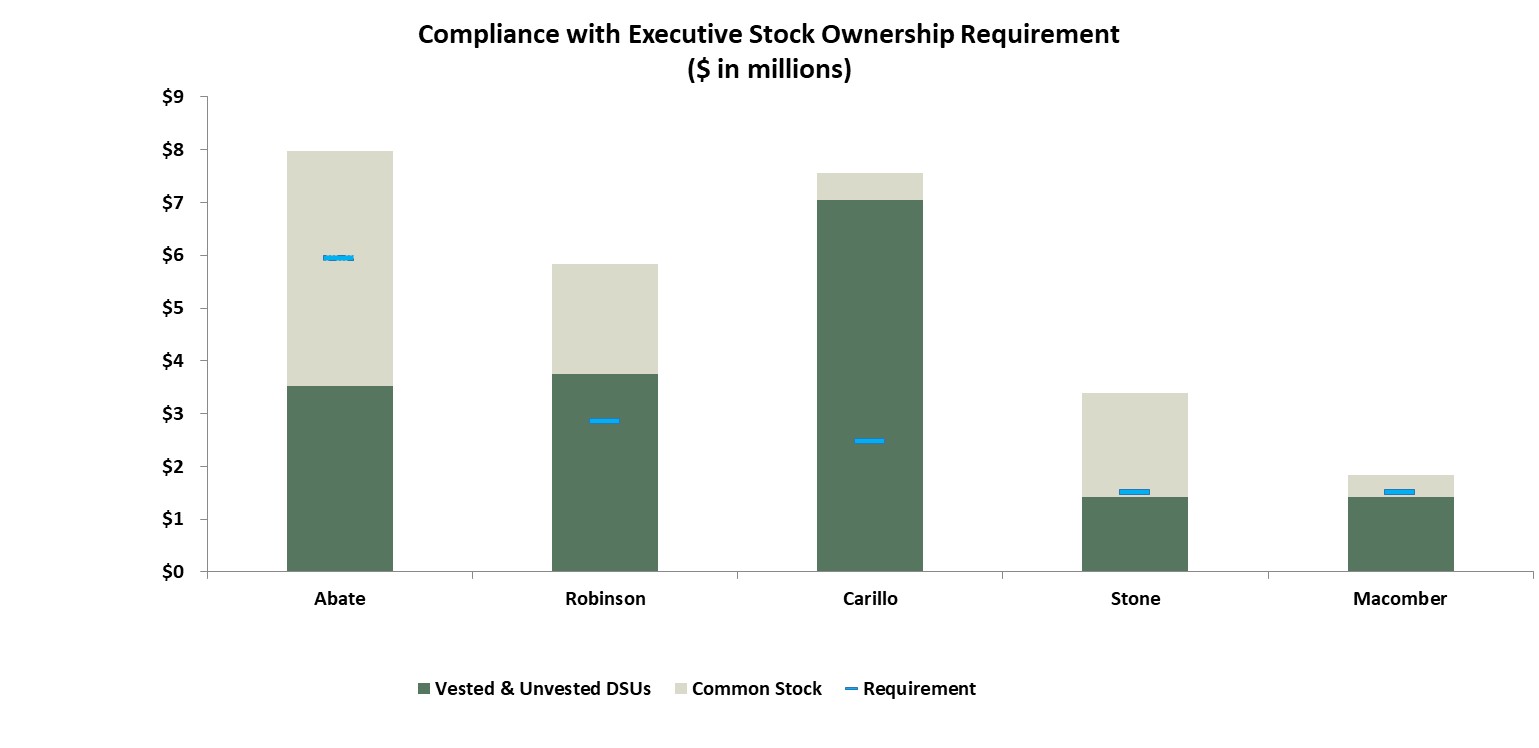
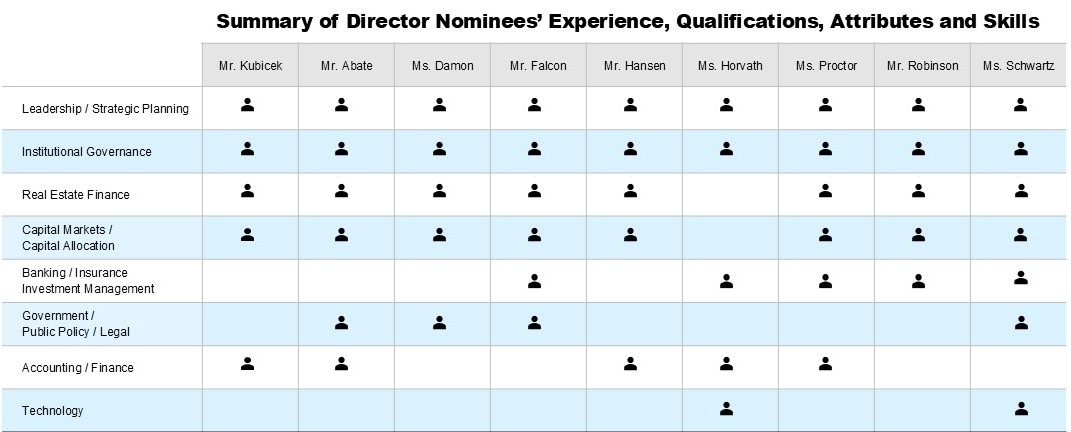


![1.20.2020.Faith Schwartz Headshot (1)].jpg](rwt-20250331_g19.jpg)