| INTRODUCTION | 2 | |||
| SHAREHOLDER LETTER | 3 | |||
| ABOUT REDWOOD TRUST | 6 | |||
| BUSINESS GROUP DISCUSSION | ||||
| » | Residential Group | 10 | ||
| » | Commercial Group | 13 | ||
| » | CDO Group | 15 | ||
| FINANCIAL REVIEW | ||||
| » | Finance Group Overview | 17 | ||
| » | GAAP Earnings | 21 | ||
| » | Core Earnings | 22 | ||
| » | Taxable Income | 23 | ||
| » | Book Value per Share | 26 | ||
| » | Return on Equity | 28 | ||
| » | Credit Reserves | 30 | ||
| » | Dividends | 32 | ||
| APPENDIX | ||||
| » | Glossary | 35 | ||
| » | Financial Tables | 41 | ||

We file quarterly reports on Form 10-Q and annual reports on Form 10-K with the Securities and Exchange Commission. Those filings and our quarterly earnings press releases provide information about our financial results from the perspective of Generally Accepted Accounting Principles (GAAP). These documents are available on our web site, www.redwoodtrust.com. We urge you to study them, as there is much to learn about Redwood Trust there.
In the Redwood Review, you have the opportunity to learn more about Redwood Trust through a discussion of GAAP results and also a discussion of tax results and other non-GAAP measures. You will first find a quarterly letter to our shareholders, and then a background section on Redwood Trust that highlights the key aspects of our business. Following that is a discussion of current trends within each of the business groups that comprise Redwood Trust, a review of various financial indicators for our business, a glossary explaining some of the specialized terms we use, and then tables that provide supplementary financial data.
On a basic level, our primary business - assuming the credit risk of securitized residential and commercial real estate loans - is not that difficult to understand. The details and business metrics, however, can get complicated. We hope that the Redwood Review provides some insight and serves as a useful tool for better understanding your investment in Redwood Trust.
We expect that the form and content of the Redwood Review will evolve over time. We welcome your input during this process.
CAUTIONARY STATEMENT: This Redwood Review contains forward-looking statements within the safe harbor provisions of the Private Securities Litigation Reform Act of 1995. Statements that are not historical in nature, including the words "anticipated," "estimated," "should," "expect," "believe," "intend," and similar expressions, are intended to identify forward-looking statements. These forward-looking statements are subject to risks and uncertainties, including, among other things, those described in our 2005 Annual Report on Form 10-K under Item 1A "Risk Factors." Other risks, uncertainties, and factors that could cause actual results to differ materially from those projected are detailed from time to time in reports filed by us with the Securities and Exchange Commission, including Forms 10-K, 10-Q, and 8-K. Important factors that may impact our actual results include changes in interest rates and market values; changes in prepayment rates; general economic conditions, particularly as they affect the price of earning assets and the credit status of borrowers; the level of liquidity in the capital markets as it affects our ability to finance our real estate asset portfolio; and other factors not presently identified. In light of these risks, uncertainties, and assumptions, the forward-looking events mentioned in, discussed in, or incorporated by reference into this Review might not occur. Accordingly, our actual results may differ from our current expectations, estimates, and projections. We undertake no obligation to publicly update or revise any forward-looking statements, whether as a result of new information, future events, or otherwise.


Dear Shareholders:
This is an interesting time in the real estate markets. Despite a higher level of uncertainty than we have faced in several years, we feel very good about our opportunities as we move forward. We have taken steps to build what we believe is a strong balance sheet, which should allow us to both absorb and also to take advantage of a serious real estate downturn should that occur.
While events in various real estate sectors unfold, we continue to grow our business along planned lines. We are increasing our permanent asset base at a modest annual rate of 10% to 15% this year. We are being cautious in our residential real estate credit-enhancement business, with only a small amount of net growth in equity utilization planned for 2006. The bulk of our 2006 net growth is coming from investments in commercial real estate credit-enhancement securities.
The commercial real estate markets have been showing signs of health for some time, with decreases in vacancy rates in many areas, increased income generation, rising property prices, and low loan delinquencies and defaults. Prices of commercial properties are high relative to current income levels, but they are not so high relative to replacement costs.
Although commercial real estate is strong, we are taking a cautious investment approach because commercial real estate loan underwriting standards remain aggressive. We are picking our spots in this sector and only credit-enhancing commercial real estate securitizations when we feel comfortable with underwriting standards. We do not feel pressure to do a deal. We would prefer to do no deals at all than to compromise on either the overall quality of the proposed pool or our ability to kick out or modify the weaker loan credits within a pool.
Our CDO group continues to create attractive assets for our permanent asset portfolio. We sponsored one CDO securitization in the first half of 2006 and we expect to sponsor one or two additional transactions in the second half. We called an Acacia CDO securitization in the first half of 2006 and expect to call another this year. In a call of a CDO transaction, we repurchase all the outstanding Acacia CDO securities at their par value, giving us control of the underlying collateral that we then sell or resecuritize. This reduces investment in CDO equity securities but typically creates a gain on sale that helps earnings and dividends.
We believe the CDO equity securities we have created and invest in for our portfolio are likely to produce attractive returns for our shareholders. Our CDO investment returns are somewhat insulated from direct credit risk, since the securities owned by Acacia are not the first-loss securities that stand first in line to absorb the credit risk of the underlying real estate loans. Most of Acacia's collateral securities are in the third, fourth, or fifth loss position, meaning that credit losses would have to exceed the principal value of the first and second loss securities before Acacia's assets would incur a credit loss. As a result, we expect to earn reliable cash flows from the investments we have made in Acacia's CDO equity securities.
We are acquiring new residential real estate credit-enhancement assets at a restrained pace. Due to ample liquidity in the capital markets and the tightening of credit spreads, pricing for buyers of these assets is not as attractive as it was in years past. However, if pricing for credit-sensitive residential real estate securities were to remain at current levels in future years, we would still expect to acquire these securities and to grow our residential CES business. We believe acquisitions at these prices will generate attractive earnings and dividends for our shareholders, barring a serious residential real estate recession.


Residential real estate credit conditions are softening in general, and are poor in some sub-markets. We expect residential real estate to weaken further as higher interest rates reduce speculation, leverage, aggressive underwriting, and overall exuberance. We view this correction as a normal part of the housing cycle, and as a positive step for the long-term development of residential real estate markets.
The extraordinarily favorable conditions that have existed in the residential real estate markets over the past several years are quickly ending. It is likely that participants in residential markets, including Redwood, will begin to suffer increased losses in the next few years. It seems to us that a likely scenario is that housing, consumer, and mortgage markets will muddle through as excesses are slowly wrung out over time. If this does occur, losses would certainly increase, but the impact would not cause serious harm. Just as likely, in our opinion, is a serious correction in housing and consumer credit that causes stress and material losses. We believe we are prepared for either possibility. We anticipate that events will unfold slowly, and that it will be several years before anyone will be able to characterize the length or depth of this residential real estate slowdown with any certainty.
So how have we prepared for this uncertain environment? Most of the residential loans we credit-enhance are high quality loans, with an average loan-to-value ratio (LTV) of 68% at origination. We benefit from mortgage insurance or other credit protection on the few loans we credit-enhance that have a LTV over 80%. The borrowers have high credit scores (average FICO scores of 730) and the loans have many other indications of quality.
In addition, many of the loans we credit-enhance have now seasoned. Average seasoning is 24 months, and nearly 70% of capital we have invested to credit-enhance residential loans is backed by loans that were originated in 2004 or earlier. Home prices have risen since origination by 15% or more for many of these loans. This gives us an extra layer of protection from losses.
We believe that the specific residential loans that we credit-enhance are unlikely to be the loans that are most vulnerable to credit losses. Nevertheless, we do expect our delinquencies and losses to increase. Realized credit losses will immediately reduce our taxable earnings and our dividend distribution requirements, because tax laws do not allow us to set aside credit reserves for taxable income calculation purposes. Our GAAP earnings will be impacted significantly less due to previously established credit reserves.
In a worst-case scenario, our potential losses are generally limited to the amount we have paid for the investments we currently own. Redwood's current credit exposure from residential credit-enhancement securities is $358 million, or 36% of our equity capital base of $1 billion. Only $114 million of this exposure, representing 11% of our total equity capital, is backed by residential loans originated after 2004.
We expect that even a relatively modest amount of housing market dislocation could cause significant stress within the capital markets related to housing. If this occurs, we should be able to take advantage of attractive investment opportunities in an environment of decreased competition. This is one reason we are maintaining unutilized cash balances - so we can make new investments if asset prices decline. In such an environment, we would expect to acquire prime-quality assets at a more rapid pace. We also would likely acquire more investments in residential real estate securities backed by loans with riskier characteristics (Alt-A and sub-prime quality) than


we have previously have done. This would particularly be true if housing market stress dramatically improved the risk/reward dynamics of investing in these lower-quality assets.
Our excess capital position is reducing near-term earnings, but also reduces overall risk and increases the likelihood we will have funds available to buy attractive assets in the future.
We believe our seasoned assets are somewhat protected from credit losses, and thus our earnings from these assets could provide some tailwind for our overall earnings and dividends over the next several years, even if the housing market comes under increasing stress. Furthermore, we believe that the new assets we are creating and acquiring are creating additional potential upside for the future.
At Redwood Trust, we are completely focused on real estate investing, and we believe we have developed the right business model to accomplish our objectives in this market. We expect to continue to create attractive investments for shareholders by maintaining a value-investing discipline, a highly efficient balance sheet, professional operations, strong market positions, and an entrepreneurial culture.
We thank you for your continued confidence in us.
Yours truly,


1. We are an entrepreneurial specialty finance company.
Our vision when we started Redwood Trust in 1994 was to create a company that is more efficient than banks, thrifts, and other financial institutions at investing in real estate assets.
In addition, we are building a variety of related and integrated specialty finance businesses in areas where we believe we can develop a competitive advantage.
For tax purposes, we are structured as a real estate investment trust (REIT). We also conduct business in taxable subsidiaries.
2. Our primary business is credit-enhancing securitized residential and commercial real estate loans.
Historically, money lent to homeowners and property owners came from bank deposits. Today, a growing percentage of money sourced to fund loans comes from capital markets investors who buy mortgage-asset-backed securities (MBS) - fixed income securities backed by pools of residential real estate loans (RMBS) or commercial real estate loans (CMBS).
Most of these investors want to buy AAA-rated or other investment-grade MBS that do not have a significant risk of credit loss if an underlying real estate loan defaults. In order for these securities to be marketed, someone else has to assume this risk of credit losses. Redwood Trust is a specialist in evaluating and managing real estate loan credit and our core business is assuming the risk of credit losses for securitized loans. Because Redwood Trust partially credit-enhances (or "guarantees") these securitized loans, the risk of credit loss is reduced for other capital markets investors in mortgage-asset-backed securities. As a credit-enhancer, we are exposed to real estate credit risk on many loans, but we also have the ability to produce strong financial results if the real estate loans we credit-enhance perform well.
3. We credit-enhance loans primarily by acquiring and owning first- and second-loss credit-enhancement securities.
In most securitizations of real estate loans, a variety of types of MBS are created, each with different characteristics with respect to average life, credit risk, prepayment risk, interest rate risk, and other variables.
One security is designated as the "first-loss" bond. If there are credit losses within the pool of securitized real estate loans, the principal value of the first-loss bond is reduced. If the entire principal value of the first-loss bond is eliminated due to credit losses within the securitized loan pool, then further credit losses reduce the principal value of the "second-loss" bond. Only when the entire principal value of the second-loss bond is eliminated do the other bonds issued from that securitization risk incurring credit losses. The first- and second-loss bonds are credit-enhancement securities, improving the creditworthiness of the other securities (more senior bonds) and protecting them from initial credit losses.
We typically acquire first-loss bonds at 25% to 35% of their principal value and second-loss bonds at 50% to 70% of their principal value. These bonds are acquired at a substantial discount to their principal value as future credit losses could reduce or totally eliminate the principal value of these bonds. Our return on these investments is based on how much principal and interest we receive, and how quickly it comes in.


We receive interest on the full principal value of bonds, so the interest earned on our cost basis is higher than the underlying coupon rate. For instance, on a bond with a principal value of $1 million - for which we may have paid only $300,000 - we receive interest based on the full principal value, thus providing a strong cash-on-cash return.
We typically do not receive principal payments until a few years into a deal, since the principal payments from the underlying loans are first used to pay down the most senior bonds. The amount of principal we ultimately receive is dependent on the amount of credit losses incurred before the deal is called, or when it matures.
Both the timing of principal payments received and the timing of the realization of losses are important to our investment returns. The faster we collect principal and the longer it takes to realize credit losses, the better it is for our investment returns. In an ideal environment, we would experience fast prepayments and low credit losses. We encountered this environment in 2003, 2004, and 2005. Conversely, our least favorable environment would be slow prepayments and high credit losses. If losses are high, we might never receive a principal payment. In this case, our investment return could still be positive if losses are delayed long enough for us to receive sufficient interest payments.
4. Our primary focus is on credit-enhancing high-quality loans.
Most of the real estate loans we credit-enhance are above average in terms of loan quality as compared to other securitized real estate loans. As a result, our delinquency and loss rates have been significantly lower than the national average. When market conditions are favorable, we plan to expand our credit-enhancement activities to include more loans that have average or below-average quality characteristics. Nevertheless, it is likely that the bulk of the real estate loans we credit-enhance will continue to be of above-average quality. The majority of the loans we credit-enhance have balances in excess of the lending limits (currently $417,000) set by Fannie Mae (FNMA) and Freddie Mac (FHCMC). These loans are typically referred to as jumbo loans.
Typically, 40% to 50% of the residential loans we credit-enhance are on homes located in California, which roughly equals the percentage of all jumbo loans that are located in California. We consider California to be one of the more attractive states for the residential credit-enhancement business.
5. As an integral part of our business, we also sponsor securitizations.
Our residential loan securitization business (our "conduit") acquires residential whole loans from originators, accumulates loans over a period of weeks or months, and then sells the loans to newly-created securitization entities (under the brand name "Sequoia") that we sponsor. These entities then create and sell securities backed by these loans to investors. (Occasionally we also sell loans via bulk whole loan sales.) We create economic gains on sale when the proceeds from the sale of securities exceed the purchase cost of the loans plus expenses. In our role as credit-enhancers, Redwood generally acquires the first- and second-loss bonds created by these Sequoia securitization entities as permanent investments, leaving the AAA-rated and investment grade securities to be acquired by other capital market investors. We may also acquire some of the interest-only (IO) securities (prepayment rate sensitive securities) from these securitizations.
Our CDO group also sponsors securitizations. Over a period of several months, we acquire and aggregate a pool of diverse investment-grade and non-investment grade residential and


commercial real estate securities and similar assets. We then sell this pool of assets to a newly formed securitization entity (under our brand name "Acacia") that creates and sells asset-backed securities to the capital markets. We create economic gains on sale from these activities and earn ongoing management fees from outstanding Acacia transactions. Redwood typically acquires all or a portion of the CDO equity securities (which function as credit-enhanced securities) from these CDO transactions as permanent assets.
6. We are one of the leaders in our market segments.
The securitized residential real estate loan market can be divided into three segments. The first segment consists of "conforming" lower-balance loans, usually of average or better quality. Most of these loans are credit-enhanced by FNMA or FHCMC. The second segment consists of lower-quality loans that are credit-enhanced primarily by sub-prime mortgage origination companies. The third segment consists of private-label securitizations containing primarily jumbo loans of above-average or average quality (prime and Alt-A loans). Redwood is one of the largest credit-enhancers in this segment. Redwood credit-enhances $223 billion of loans that have been securitized in private-label securitizations, representing approximately 20% of the outstanding securitized loans in this segment.
Additionally, we have been developing a credit-enhancement business for commercial real estate loans since 1998. We currently credit-enhance $29 billion of commercial loans, representing approximately 5% of the outstanding commercial real estate loan balances that have been securitized.
The Acacia CDO program has completed 11 CDO resecuritizations, making it one of the leading issuers of real estate CDOs.
7. We have some interesting competitive advantages.
As a non-regulated specialty finance company, we have greater freedom to operate in the capital markets and securitization markets than do financial institutions such as banks and insurance companies. We also enjoy lower operating costs.
As a public company with permanent capital, we have an advantage in investing in illiquid assets compared to investment companies, partnerships, and hedge funds. In an environment of declining liquidity, some of our competitors may suffer investor withdrawals, forcing them to sell assets at a time when prices are low and asset acquisition opportunities are attractive.
As a REIT, we have tax advantages relative to corporations that have to pay corporate income taxes, typically one of the largest costs of doing business.
With $1 billion of equity capital focused on one integrated business, we have size advantages that bring economies of scale as well as marketing and operating advantages.
As a company with a small number of employees (90 as of June 30, 2006), we have a strong culture that is entrepreneurial, innovative, focused, and disciplined.
8. We maintain a strong balance sheet.
Compared to most financial institutions, we use very little debt financing. At June 30, 2006, we had $1.0 billion in equity capital and $0.5 billion of debt. We may utilize more debt in the future, depending on which businesses we develop over time. Nevertheless, we expect to maintain a strong balance sheet.


We currently utilize only equity capital to fund the credit-enhancement securities and other assets we hold as permanent assets for investment purposes. We use a combination of debt and equity to fund our inventory assets - assets that are acquired by our conduit and our CDO group on a temporary basis for re-sale to a securitization entity.
Our balance sheet is also strong because our maximum exposure to losses caused by credit risk is limited to our investment in credit-enhancement securities. In other words, our maximum loss within our credit-enhancement business is less than our equity capital base.
9. We pay a regular dividend and may pay a special dividend.
As a REIT, we are required to distribute to shareholders as dividends at least 90% of our REIT taxable income, which is our income as calculated for tax purposes (exclusive of income earned in taxable subsidiaries). In order to meet our dividend distribution requirements, we have been paying both a regular quarterly dividend and a year-end special dividend.
We set our regular quarterly dividend at a rate that we believe is reasonably likely to be sustainable over time under most market conditions. Our regular dividend rate is currently $0.70 per share per quarter, and our Board of Directors has indicated its intention is to maintain this quarterly regular dividend rate throughout 2006. Based on a share price of $47.58 as of July 31, 2006, the indicated yield to shareholders at the regular dividend rate is 5.9% ..
If we earn more REIT taxable income than is required to fund the regular dividend, we will likely pay a special dividend. We expect our special dividend amount will be highly variable, and we may not pay a special dividend every year. We are currently forecasting that we will pay a special dividend in December 2006, although we believe the size of this special dividend is likely to be less than the $3.00 per share special dividend we paid in December 2005. Our dividend policies, distribution practices, and outlook may change over time.
10. We are a growth company.
The amount of real estate loans outstanding and the percentages of these loans that are securitized have grown rapidly over the past several years. This is a long-term trend that we expect will continue, although there could be a cyclical slowing in the short-run. With our competitive advantages in a growing market, we expect over time to have the opportunity to increase the size of our credit-enhancement and related businesses while also improving our book value per share, producing an attractive return on equity, and maintaining our regular dividend rate. The biggest risk to this outlook would be a serious and prolonged real estate recession.

Description
Redwood's residential group credit-enhances securitized residential real estate loans by acquiring and owning first-loss, second-loss, and other credit-enhancement securities. The residential group also invests in other residential assets, including interest-only securities. The residential group assists Redwood's CDO group in the selection and management of the residential real estate assets owned by the Acacia CDO securitization entities that Redwood has sponsored.
In addition, the residential group operates as a conduit, acquiring residential real estate loans from mortgage origination companies and selling them via whole loan sales or via securitization under the Sequoia brand name.
Discussion
We are in the initial phases of a changing housing and mortgage market. It is still too early to accurately assess the potential level and severity of future credit losses. So far, overall credit performance of our CES remains excellent. In addition, we continue to benefit from fast prepayment rates, especially on our ARM and Neg Am ARM CES investments.
In total, at June 30, 2006, we owned $358 million of residential CES held as permanent investments (including CES acquired from Sequoia). These investments credit-enhance $223 billion of underlying loans. The potential upside return from these assets is considerable if credit losses remain low, as the amount of purchase discount that we are not currently amortizing for these assets (as we have set it aside as a credit reserve) was $426 million, or $17 per share, at June 30, 2006. Total credit losses in this portfolio for the second quarter of 2006 were $2 million.
Even though our CES investments appear well positioned, our residential group remains intensely focused on scrutinizing credit performance data on a portfolio level (by vintage, geographic region, and originator), on a bond level, and on a loan level. The data assists us in managing our existing investments by reducing losses through active loss mitigation and targeted sales. In July 2006, we sold $16 million CES (primarily second-loss securities) generating a GAAP gain of approximately $2 million.
From an acquisition standpoint, we remain active, but cautious. In the second quarter, we acquired $38 million residential CES. In the third quarter through July 2006, we have acquired or committed to acquire $5 million residential CES. We are temporarily restraining our CES investment growth until the real estate picture becomes clearer. We are maintaining excess cash balances so we can take advantage of opportunities should stress in the housing markets, or stress in the capital markets, cause prices of credit-sensitive residential assets to decline. While we will be closely watching the prime markets, we believe additional attractive opportunities may arise in non-investment grade securities backed by Alt-A and sub-prime loans.
We have been preparing to take advantage of potential opportunities in the non-prime sectors of the residential markets by building our Alt-A and sub-prime loan capacity, deepening our credit expertise, and expanding our surveillance and loss mitigation capabilities. We view investing in Alt-A and sub-prime credit securities at the right point in the cycle as a natural extension of (but not a replacement for) our prime CES business. Furthermore, we have been
an active investor for many years in investment-grade securities backed by medium and lower quality loans through our Acacia program. At June 30, 2006, Acacia owned $316 million investment-grade Alt-A residential securities and $407 million investment-grade sub-prime residential securities. To date, the performance of these securities has been excellent.
The vast majority of Redwood's credit exposure will remain with prime loans. However, over time, we expect that we may have an attractive opportunity to allocate an increased portion of our capital to investments in credit securities backed by Alt-A and sub-prime loans. Until these markets become more attractive, our investments in lower-quality CES will be small and selective. Year to date through July 2006, we have acquired or committed to acquire $12 million Alt-A non-investment grade CES and $3 million sub-prime non-investment-grade CES. These investments are permanent assets funded with equity capital.
Activity in our residential conduit increased in the second quarter. From the beginning of the second quarter through July, we acquired or committed to acquire $1.2 billion of residential whole loans. These are prime-quality hybrid and ARM loans. We expect to sell these loans to Sequoia for securitization. Our goal was to break-even on these transactions while building our customer base and expanding our product menu beyond our traditional one- and six-month LIBOR loan product. However, for these loans recently acquired, we currently expect to realize a small loss upon securitization (or whole loan sale) due to spread widening and other factors. Market volatility will always be an issue in the securitization business. We have generally made gains from market volatility in the past, and we expect to generate gains in the future as we expand our conduit business and further develop flow opportunities.
Some of the recent headlines about rising mortgage delinquencies (and other signs of weakness in the housing markets) could cause alarm. While rising delinquencies are clearly an important and troubling early warning sign, the risk of loss is ultimately dependent on the mortgage loan balance relative to the foreclosure value of the home. In assessing credit risk, the first layer of protection is the initial LTV or equity cushion at the time of origination. Redwood's CES investments are backed by loans that started with an average weighted average LTV of 68%. Additionally, as approximately 70% of our capital we have invested to credit-enhance residential loans is backed by the loans that were originated prior to 2005, we have an extra level of protection as a result of strong home price appreciation since that time.
Another important credit consideration is geographic concentration, as housing weakness is likely to vary significantly from market to market. The largest geographic concentration of loans underling our CES portfolio is California, where 47% of the current loan balances are located, followed by Florida (6%), New York (5%), and Virginia (4%). Serious delinquencies as a percentage of original balance of the loan pools we credit-enhance are 0.13% for California, 0.18% for New York, and 0.08% for Virginia. Of our most important states, only Florida, with delinquencies at 0.46%, has shown recent weakness.
Chart 1: CES Permanent Asset Activity ($ millions)
Chart 2: Residential CES Portfolio by Vintage (by Market Value)
Chart 3: Seriously Delinquent Loan %
Chart 4: Actual Credit Losses ($ millions)
Description
The commercial group credit-enhances securitized commercial real estate loans by acquiring and owning first-loss and other commercial CES. We also invest in other commercial real estate assets.
We work together with Redwood's CDO group to acquire and manage CMBS and other commercial real estate assets for the Acacia CDO resecuritization transactions that Redwood sponsors.
Discussion
Commercial real estate fundamentals remain strong, although commercial loan underwriting standards are aggressive.
At Redwood, we have a commercial real estate team that has a number of competitive advantages. Our experience in commercial credit analysis helps us identify those commercial real estate securities that meet our underwriting standards. As the buyer of the first-loss security of CMBS transactions, we can influence the loan quality for the transactions we credit-enhance because we can negotiate to "kick out" loans we do not like and we can re-price or restructure loans that would otherwise be too risky. In this way, we shape the risk/reward characteristics of the investments we choose to make.
To date, we have invested in the first-loss securities from 16 CMBS transactions. Our total investment in these permanent assets was $76 million at June 30, 2006. We fund these investments with equity. Permanent equity capital commitments to CMBS CES in the first half of 2006 totaled $16 million. For 2006 as a whole, we currently expect to match our total CMBS CES investment activity from the prior year of $43 million.
The $29 billion of securitized commercial real estate loans underlying our CMBS credit-enhancement portfolio continue to perform well. As of June 30, 2006, serious delinquencies were $24 million, or 0.08% of the current balance of total underlying loans. While delinquencies are up from the prior quarter, they remain low relative to historical CMBS delinquency levels. We incurred no credit losses on the underlying loans in the first half of 2006. Our other commercial real estate assets continue to perform as expected.
Our vision is to be an ongoing leader in credit-enhancing securitized commercial real estate loans while being an active sponsor of commercial real estate CDOs. We also expect to expand our investments over time into other types of commercial real estate assets. To this end, one of our goals for 2006 is to increase the productivity of our underwriting, due diligence, surveillance, and loss mitigation efforts through the application of process improvements and the implementation of new technologies. This has been a successful effort so far, and has greatly improved our ability to acquire and manage first-loss CMBS assets.
Chart 5: Commercial CES Geographic Distribution
Chart 6: Commercial Property Type Distribution
Chart 7: Outstanding Domestic Total Commercial Mortgages and CMBS ($ billions)
Chart 8: RWT's Commercial CES ($ millions)
Description
The Redwood CDO group sponsors resecuritizations of diverse pools of residential and commercial real estate securities and other related assets. Newly created CDO securities are issued under the Acacia brand name.
Redwood typically acquires as a permanent investment all or a portion of the CDO equity securities issued by the Acacia securitization entities. These CDO equity securities absorb initial credit losses from the underlying pool of assets owned by Acacia, and thus act as the credit-enhancement for the other (more senior) CDO securities issued by Acacia.
The primary determinant of the returns we earn from our Acacia CDO equity investments is the credit performance of the securities Acacia has purchased and the performance of the real estate loans underlying those securities.
Discussion
Redwood's $124 million portfolio of CDO equity securities continues to produce strong economic returns that exceed our 14% hurdle rate by a healthy margin. We anticipate that economic performance will remain healthy.
The securities owned by the Acacia entities have performed well, with 56 upgrades and one downgrade by the rating agencies during 2006. In addition, Standard & Poor's recently upgraded two classes of securities issued by Acacia 3.
Early in the third quarter of 2006, Acacia 10 issued CDO securities. This was the first CDO transaction sponsored by Redwood that had a significant amount of B-rated residential and commercial real estate bonds as part of its collateral pool. If we continue to sponsor transactions of this type, it will benefit Redwood's residential and commercial groups by allowing them to allocate an increasing amount of capital to first-loss securities that have the potential to provide more upside to shareholders.
In another development, Acacia 10 sold a portion of its CDO equity securities to investors other than Redwood. We believe it is important for Acacia to develop a diverse investor base for its CDO equity. This will improve Redwood's ability to grow and develop its CDO business over time. Additionally, as the sponsor and manager of the Acacia entities, Redwood earns asset management fees from Acacia to the extent that CDO equity securities are sold to investors other than Redwood.
In the second quarter, we purchased (called) the CDO securities issued by Acacia 2 at their principal value. We thereby gained control of Acacia 2's assets, many of which we sold at a gain. This call enhanced Redwood's returns as the owner of Acacia 2's CDO equity securities.
We expect to sponsor several additional Acacia CDO transactions in the next twelve months. We anticipate Redwood will acquire the majority of the equity securities created by these transactions, with other institutional investors acquiring the remainder. Given Redwood's asset sourcing capabilities and management expertise, we believe that the Acacia program will be able to continue to create attractive CDO equity investments, and a growing stream of asset management fees, for Redwood.
Chart 9: Acacia Assets under Management ($ billions)
Chart 10: Acacia Ratings Distribution
Chart 11: Acacia Collateral Rating History
Description
Redwood's finance group is responsible for financial reporting, tax, treasury, balance sheet management, and information technology.
Discussion
For the second quarter of 2006, GAAP earnings were $1.20 per share and total taxable income was $1.90 per share. Core earnings were $0.97 per share and core taxable income was $1.71 per share.
For the first half of 2006, GAAP earnings were $2.29 per share and total taxable income was $3.34 per share. Core earnings were $2.13 per share and core taxable income was $3.17 per share.
Adjusted return on equity was 14% for the second quarter, a decent result in our view.
Please see the following pages for definitions of core taxable income, core earnings, adjusted return on equity, and other non-GAAP measures, and for reconciliations of these measures to the most comparable GAAP measures.
Our core earnings have declined relative to last year. This has largely been driven by lower interest income from interest-only securities acquired from Sequoia securitizations. The flat yield curve has led to accelerated prepayments on existing Sequoia ARM loans. Faster prepayments reduce Sequoia loan balances and increase premium amortization, both of which reduce income from this source. Faster prepayments should eventually lead to higher income from the residential credit-enhancement securities we own. However, we will not recognize an increase in income from faster prepayments for some time, and we will only recognize increased income from CES if credit results remain favorable.
Higher levels of unutilized cash have also reduced our current core earnings. Additionally, total operating expenses, excluding due diligence and certain other expenses, increased by 18% from the second quarter of 2005 to 2006 due to investments in systems and infrastructure and increases in the scale, complexity, and diversity of our operations. Due diligence expenses, although higher in the second quarter than we would usually expect, are generally rising due to our broader scope of investment operations (especially with respect to commercial real estate).
On the positive side, the vast majority of our permanent investments are credit-enhancement securities and CDO equity securities that continue to benefit from strong credit performance and faster prepayments. The yields and total net interest income contribution from our residential and commercial CES and our other permanent investments continue to improve.
Looking forward over the next few years, we continue to see the potential for a generally stable to rising trend in our annual results (although quarterly and annual results could be volatile). One potential source of increased earnings in the next few years is increased utilization of our excess capital.
The most significant factor influencing our GAAP and tax earnings and dividends over time will continue to be the level of credit losses.
At June 30, 2006, we credit-enhanced $223 billion of residential real estate loans and $29 billion commercial real estate loans. We acquire and own our credit sensitive residential and
commercial real estate assets at values that are significantly lower than their par (principal) value. We set aside, and do not currently amortize into income, a portion of this purchase discount equaling the amount of credit losses we expect over the life of these loans. At June 30, 2006, this credit reserve was $426 million ($16.58 per share) for residential real estate assets and was $158 million ($6.15 per share) for commercial real estate assets. Over the next ten years, we will amortize into income the remaining balance of this $584 million ($22.73 per share) credit reserve after reductions for actual credit losses incurred. To the extent that we do realize this income, it will be in addition to the income we are currently recognizing from these assets, and we will realize it more quickly if prepayments are rapid.
We also have established a credit reserve of $19 million ($0.76 per share) for residential loans owned by Sequoia that are consolidated on our balance sheet. If future credit results are favorable and this reserve is not diminished by actual losses, the reversal of the remaining reserve could be an additional source of income.
Our credit loss rate for the first half of 2006 averaged less than one basis point per year (<0.01%) of current loan balances. Total credit losses for the first half were $5 million. Due to normal seasoning trends within our portfolio and a weaker housing market, we expect losses to increase. However, we do not currently expect that losses will increase to levels that would cause economic investment returns from our assets to be unattractive.
Our business grew at an annual rate of 12% in the first half, consistent with our plan to grow by 10% to 15% for the year. We generally measure business growth with reference to the total market value of our permanent assets - -- those assets that we are holding for the long term and are funding with equity. Total permanent assets increased from $568 million to $601 million in the first half of 2006 as a result of $92 million of acquisitions, $52 million of sales and calls, $32 million of pay downs, and $25 million of positive market value appreciation. Gross permanent asset acquisitions of $47 million for the second quarter were slightly greater than our first quarter total of $45 million. We are expecting that the second half will be a relatively strong one for acquisitions.
Redwood Trust Permanent Assets
As a REIT, we are required to distribute as dividends over time at least 90% of taxable earnings earned at the REIT level. (Income generated by our taxable subsidiaries is exempt from this requirement.) We entered 2006 with approximately $2.04 per share of undistributed taxable REIT income. Our estimated REIT taxable income was $3.14 per share for the first six months of 2006. It is difficult to predict with precision our REIT taxable earnings for the second half of 2006 due to volatility that can be caused by complex tax regulations governing the timing of income and expense recognition. We are expecting to pay a special dividend this year. The 2006 special dividend will most likely be less than the $3.00 per share special dividend we paid last year unless we decide to sell a significant amount of appreciated assets in the second half.
Our excess capital (cash) position increased during the second quarter from $170 million to $191 million because of asset sales and the call and sale of the assets of Acacia 2. In the third quarter, we sold B-rated portfolio assets to Acacia 10, the first CDO we have sponsored that has a meaningful amount of B-rated collateral. These third quarter sales of portfolio assets are an additional source of excess cash. Other potential sales, calls, and resecuritizations could generate cash. Even factoring in a relatively strong expected acquisition activity level for the second half of 2006, we believe we are likely to end 2006 with $100 million to $140 million of excess cash. This should be sufficient to fund continued 10% to 15% growth through 2007.
We will likely choose to continue to maintain some excess cash balances for several years because of the increased risks and opportunities that should come with a weakening housing market. As acquisitions reduce our excess cash balances over time, we may seek to issue additional equity shares.
We typically use Redwood debt to fund the accumulation of assets prior to sale to ABS securitization entities (Sequoia and Acacia). Our debt levels vary based on the timing of our

asset acquisition and securitization activities and our levels of excess capital. At June 30, 2006, we had $529 million Redwood debt outstanding, an increase from $170 million at December 31, 2005. At the end of the first quarter of 2006, we had no debt outstanding.
Our assets and liabilities are currently well matched, as the net present value of our expected cash flows does not vary significantly for different future interest rate and prepayment rate scenarios. However, if we continue to acquire adjustable-rate residential CES, and our IO securities continue to pay down faster than they are replaced, over the next year or two we will increasingly be set up to benefit from higher prepayment rates and higher short-term interest rates. In order to remain well-balanced from an asset/liability perspective, we are considering adding investment-grade securities and/or whole loans funded with Redwood debt to our balance sheet as an ongoing investment. We would manage these assets and liabilities so that in combination they would benefit from slower prepayment rates and falling short-term interest rates. While this would add debt to our balance sheet, this debt would be used to fund assets that are relatively liquid and that do not have material or concentrated credit risks. This spread lending strategy could utilize some of our excess cash while not adding to our credit risk levels. It could add to profits and dividends per share while also balancing our overall balance sheet interest rate and prepayment risks.

What Is This?
Income calculated under Generally Accepted Accounting Principles in the United States.
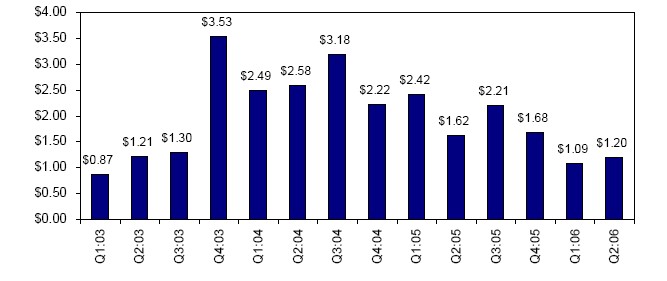
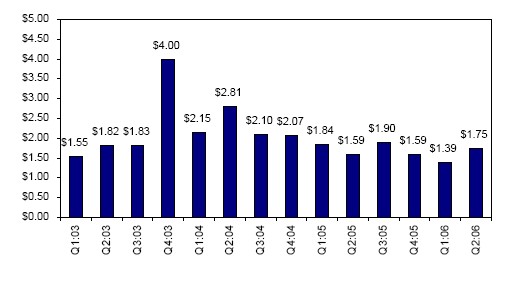
a) Graph
GAAP Earnings per Share
b) Quarterly Update
» Our GAAP earnings were $31 million, or $1.20 per share, for the second quarter of 2006. In the second quarter of 2005, GAAP earnings were $41 million, or $1.62 per share.
» The reduction in our net income of $10 million from the second quarter of 2005 resulted from a decrease in net interest income of $9 million, an increase in operating expenses of $2 million, and an increase in due diligence expenses of $3 million. The impact of these items was offset by higher recognized gains and valuation adjustments of $3 million and lower provision for taxes of $1 million.
» Net interest income decreased primarily due to lower balances of earning assets as the result of prepayments and higher balances of excess capital.
» Our yield on our credit-enhancement securities increased as a result of strong credit performance and favorable prepayment behavior on residential adjustable-rate loans.
» Operating expenses increased as the result of additions to our infrastructure and staff as we prepare for future growth, and as the result of higher due diligence expenses in 2006 related to the acquisition of credit-enhancement securities and loans.
» Net recognized gains and valuation adjustments increased primarily as a result of gains recognized from assets sold in connection with the call of Acacia CDO 2.


What Is This?
Core earnings is a profitability measure that highlights earnings that are more likely to be ongoing in nature. In calculating core earnings, we start with GAAP earnings and then exclude gains and losses on calls and sales, mark-to-market adjustments, and one-time items that are unlikely to be repeated. Table 2 in the Appendix shows a reconciliation of core to GAAP earnings.
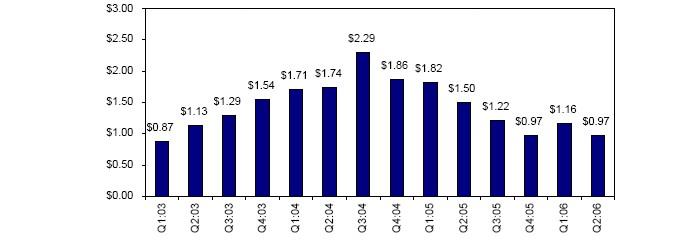
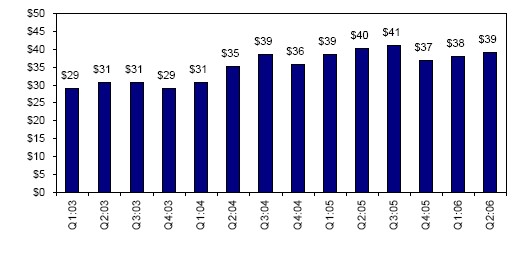
a) Graph
Core Earnings per Share
b) Quarterly Update
» Core earnings were $25 million, or $0.97 per share, for the second quarter of 2006. In the second quarter of 2005, core earnings were $38 million, or $1.50 per share.
» Some of the volatility in our core earnings is a function of the accounting for certain assets, including the accounting for premium amortization on Sequoia's loans. The amount of premium we amortize in any one quarter will depend on both prepayments and interest rates; as a result, the level of premium amortization going forward could vary significantly from quarter to quarter.
» We still have a substantial amount of unutilized capital, and it is likely that our core earnings will not begin a sustainable trend upwards until we choose to more fully invest our capital.
» On a quarter-to-quarter basis, earnings could be volatile.


What Is This?
Total taxable income is a measure of our profitability. It is our pre-tax income as calculated for tax purposes. It includes pre-tax income earned at our parent company and qualified subsidiaries (REIT taxable income) as well as pre-tax income earned in our taxable qualified subsidiaries. Total taxable income can differ materially from GAAP earnings. Table 3 in the Appendix reconciles these two profitability measures.
Core taxable income is a profitability measure that highlights that portion of taxable income that is more likely to be ongoing in nature. In calculating core taxable income, we start with total taxable income and then exclude gains on sale, tax deductions created by the exercise of stock options, and one-time items that are unlikely to be repeated. Table 4 in the Appendix reconciles core taxable income and total taxable income to GAAP income.
REIT taxable income is the primary determinant of the minimum amount of dividends we need to distribute in order to maintain our tax status as a real estate investment trust (REIT). REIT taxable income is pre-tax profit, as calculated for tax purposes, at Redwood Trust and its REIT subsidiaries. It does not include taxable income earned at its taxable subsidiaries. Over time, we must distribute at least 90% of our REIT taxable income as dividends. A reconciliation of GAAP income to REIT taxable income appears in Table 3 of the Appendix.
a) Graphs
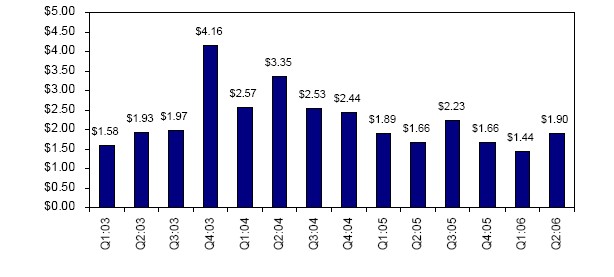
Total Taxable Income per Share


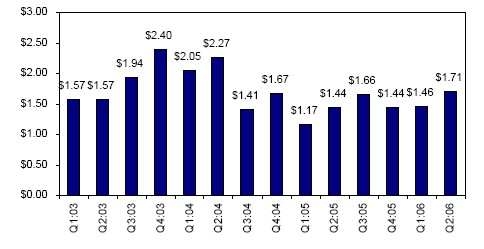
Core Taxable Income per Share
REIT Taxable Income per Share


b) Quarterly Update
» Each of our three measures of taxable income increased on a per share basis in the second quarter of 2006 compared to the first quarter of 2006 and compared to the second quarter of 2005. The primary drivers of higher taxable income are:
o Higher yields recognized for tax purposes on residential CES due to faster prepayments on those CES securities backed by ARMs and Neg Am ARMs.
o Gains realized on the sale of securities and hedges in conjunction with the call of Acacia 2.
» Our taxable income is higher than our GAAP income primarily because our credit losses in current periods continue to be lower than the longer term assumptions we make about losses when determining GAAP credit reserves, credit provisions, and income. We are not allowed to establish credit reserves for tax.
» Our REIT taxable income per share continues to exceed our regular quarterly dividend rate by a comfortable margin.
» For a variety of reasons, our taxable income results can be volatile.


What Is This?
Book value per share is the amount of equity capital we have per share of common stock outstanding. There are many different ways that equity capital can be measured. We usually focus on three measures, each of which we believe is useful for a different purpose.
GAAP book value is our common equity as calculated for GAAP purposes. It includes a mark-to-market valuation adjustment of our assets (i.e., those whose changes in market valuations are reported on our balance sheet and not our income statement.)
Core book value is GAAP book value excluding those mark-to-market adjustments of our assets reflected on our balance sheets. Core book value more closely reflects historical amortized costs rather than current market values.
Adjusted core book value is core book value less REIT taxable income that we have earned but not yet distributed as dividends to our stockholders. Adjusted core book value is a measure that provides one estimate of the amount of equity capital we have available to reinvest in new long-term assets and to generate future earnings.
A reconciliation of GAAP book value to core book value and adjusted core book value appears in Table 8 of the Appendix.
a) Graph
GAAP Book Value per Share


b) Quarterly Update
» For the second quarter of 2006, after including the effect of declaring $0.70 per share of regular dividends, GAAP book value per share increased by 3% from $38.11 per share to $39.13 per share.
» Over time, our GAAP book value per share has been increasing as a result of retention of a portion of our income, increases in the market value of our assets, and issuance of stock at prices in excess of book value.
» At June 30, 2006, core book value was $35.58 per share and adjusted core book value was $32.16 per share.
» At the end of our first quarter of operations in September 1994, GAAP book value was $11.67 per share. Since that time, we have paid $36.03 per share of dividends while also increasing GAAP book value by $27.46 per share.
» Book value per share growth is not a direct indicator of our market value or an indicator of the returns available to our shareholders. If you had acquired Redwood stock at our initial public offering in August 1995, and had reinvested all dividends back into Redwood stock, your annualized compounded return as a shareholder through the second quarter of 2006 would have been 21% through July 31, 2006. Future results may vary.


What Is This?
We believe return on equity (ROE) is one of the more useful measures of the profitability of our business. ROE is the amount of profit we generate each year per dollar of equity capital. There are numerous ways we calculate returns on equity for Redwood since we monitor a number of different profit measures as well as a number of different measures of equity capital.
GAAP ROE is GAAP earnings divided by GAAP equity.
One interesting aspect to consider about GAAP ROE is that it will decline (all other things being equal) if our assets increase in market value. Many of our assets are marked-to-market through our balance sheet but not our income statement. An increase in asset market value will therefore increase GAAP equity but not our GAAP earnings, thus lowering GAAP ROE. Similarly, a decrease in asset market values will increase our GAAP ROE.
An alternative measure of ROE that may also be useful is Adjusted ROE, by which we mean GAAP income divided by core equity. Core equity excludes those balance sheet mark-to-market adjustments that are not included in our income statement. Only those asset market value changes that are included in our income statement will affect Adjusted ROE.
A reconciliation of GAAP ROE to Adjusted ROE, and of GAAP equity to core equity, appears in Table 8 of the Appendix.
a) Graph
Adjusted ROE (Annualized)


b) Quarterly Update
» GAAP ROE was 13% for the second quarter of 2006 as compared to 17% in the second quarter of 2005.
» Adjusted ROE was 14% for the second quarter of 2006 and 19% for the second quarter of 2005. Adjusted ROE is greater than GAAP ROE due to the appreciation of the market values of assets that are marked-to-market through our GAAP balance sheet. This increases our GAAP equity and thus lowers GAAP ROE.
» Over the very long term, we expect to generate an average adjusted return on equity between 11% and 18%.


What Is This?
One of our goals is to provide substantial earnings upside for shareholders if real estate credit losses in the loans we credit-enhance are low.
Our potential GAAP earnings upside from good credit performance can be estimated by referencing the size of our credit reserves. In the event we had no future credit losses, over the next ten years our GAAP earnings would be increased by the amount of our credit reserves. Our current earnings incorporate these loss estimates, so income from reversal of credit reserves would add to our current GAAP earnings run rate (all other factors being equal).
Taxable income (which determines our dividends) can be reduced only by actual, not estimated, losses. There are no credit reserves for tax. The upside for our taxable income run rate in a no credit loss scenario can be estimated (all other factors being equal) by taking current taxable income and adding back current losses.
Our investments incorporate a high degree of credit risk, so high credit loss rates would reduce GAAP earnings, taxable income, and dividends.

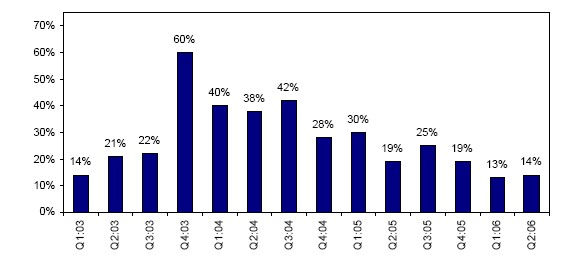
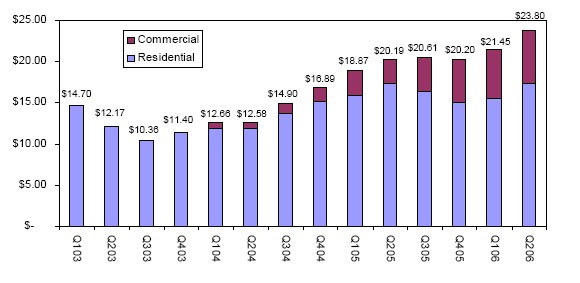
a) Graph
GAAP Credit Reserve per Share
b) Quarterly Update
» Our GAAP credit reserves at June 30, 2006 were $611 million, or $23.80 per share.
» At June 30, 2006, our residential credit reserves consist of $426 million ($16.58 per share) for third party CES and $19 million ($0.76 per share) for our Sequoia loans. Actual credit losses underlying our residential loans and securities were $2 million for the second quarter of 2006 and $7 million for the last twelve months.
» At June 30, 2006, our commercial credit reserves consisted of $158 million ($6.15 per share) for third party CES and $8 million ($0.31 per share) for our commercial loans. We incurred no commercial credit losses in the second quarter of 2006. Losses for the last twelve months were $2 million.
» The tax deduction for realized credit losses in the second quarter of 2006 was $0.7 million, or $0.03 per share. This deduction is less than the losses incurred on the underlying loans as we own most of our credit-sensitive assets at a tax basis that is substantially less than par (principal) value.


What Is This?
As a REIT, we are required to distribute at least 90% of our REIT taxable income each year as dividends. We have established a regular dividend rate level that we believe is reasonably likely to be sustainable. To the extent the REIT taxable income we are required or choose to distribute is greater than our regular dividend distributions, we typically make a special dividend distribution towards year-end.
a) Graphs
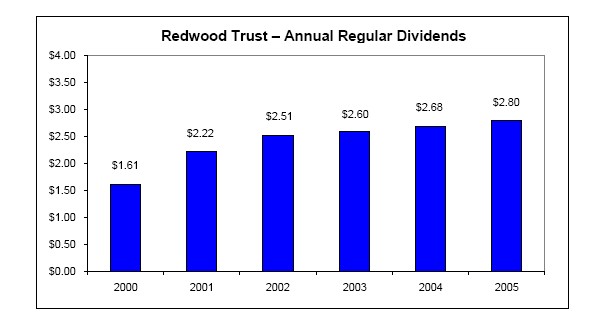
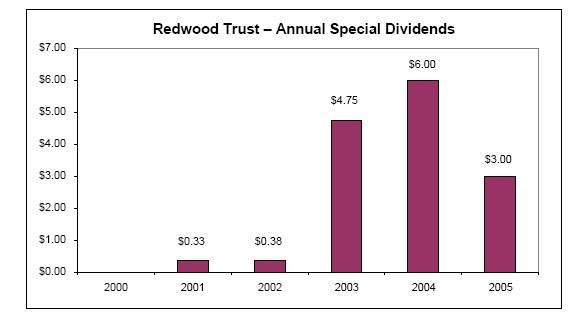
b) Quarterly Update


» We declared a regular quarterly dividend of $0.70 per share in the second quarter of 2006.
» We plan to permanently retain approximately 10% of the ordinary REIT taxable income we earn during 2006, and to retain 100% of the taxable income we earn at our taxable subsidiaries in 2006 (after taxes). By retaining a portion of our income, we seek to build book value per share, and thus potential earnings and dividends per share, over time.
» We also plan to defer distribution of a portion of this year's taxable income into the following year. Based on our estimates of REIT taxable income during 2005 and the first quarter of 2006, we entered the third quarter of 2006 with $88 million ($3.42 per share) of undistributed REIT taxable income.
» As a result of the above plans and results, we expect to distribute a special dividend towards the end of 2006. We currently expect the amount of this special dividend will most likely be less than the $3.00 per share special dividend we paid in the fourth quarter of 2005, unless we decide to sell a significant amount of appreciated assets.

[This Page Intentionally Left Blank]


All companies and analysts do not calculate non-GAAP measures in the same fashion. As a result, certain measures as calculated by Redwood Trust may not be comparable to similarly titled measures reported by other companies.
ASSET-BACKED SECURITIES (ABS)
Securities backed by financial assets that generate cash flows. Each security issued from an asset-backed securitization entity has a unique priority with respect to receiving principal and interest cash flows from the assets owned by the entity.
ACACIA
Acacia is the brand name for the collateralized debt obligation (CDO) securitizations Redwood sponsors. The underlying pool of assets for these CDO securitizations consists primarily of investment-grade and non-investment-grade rated securities backed by residential prime, residential sub-prime, and commercial real estate loans. Acacia also owns related assets such as CDO securities issued by other real estate oriented CDOs, corporate debt issued by equity REITs, commercial real estate loans, and synthetic assets derived from commercial real estate assets. Redwood typically acquires the CDO equity securities issued by Acacia; these are the securities that are in the first-loss (highest risk) position with respect to absorbing any credit losses that may occur within the assets owned by the Acacia entities.
ADJUSTED CORE EQUITY (ADJUSTED BOOK VALUE)
Adjusted core equity (adjusted book value) is not a measure calculated in accordance with GAAP. Adjusted core equity is core equity less undistributed REIT taxable income that is still undeclared but that will need to be paid out. We have minimum dividend distribution requirements as a REIT. As we earn income (as calculated for tax and minimum distribution requirements) we are creating future dividend payment obligations. These obligations are not recognized for GAAP accounting, however, until dividends are declared. Cash that we have earned but that we must pay out as dividends in the near future is not cash that will be available to us to acquire long-term assets and build our business. So when we try to answer questions such as "how much equity per share do we have available to build our business and to generate dividends in the long-term?" we use adjusted core equity per share. A reconciliation of adjusted core equity to GAAP equity appears in the Appendix in Table 8.
ADJUSTABLE RATE MORTGAGES (ARMs)
Adjustable rate mortgages are loans that have coupons that adjust at least once per year. We make a distinction between ARMs (loans with a rate adjustment at least annually) and hybrids (loans that have a fixed rate period of 2 to 10 years and then become adjustable rate).
BOOK VALUE
Book value is our common equity amount. It can be calculated in a number of ways, one of which is appropriate for GAAP.
COLLATERALIZED DEBT OBLIGATIONS (CDO)
A resecuritization of a diverse pool of securities. See "Acacia".
CDO EQUITY SECURITIES
CDO equity securities are securities that bear the initial credit losses of the assets owned by securitization entities. Their function is similar to that of first-loss credit-enhancement securities issued by residential and commercial real estate loan securitizations.


CONDUIT
A group that acquires closed loans from originators, accumulates loans over a period of time, and sells these loans, seeking to generate a gain on sale. Sales are usually made via securitization, but also can be done through bulk whole loan sales.
CORE EARNINGS
Core earnings is not a measure of earnings in accordance with GAAP. We attempt to strip some of the elements out of GAAP earnings that are temporary, one-time, or non-economic in nature, or that relate to the past rather than the future. We are trying to show what the trend of underlying ongoing earnings may be. We exclude realized gains (and losses) resulting from asset sales and calls from GAAP income. We sell assets from time to time as part of our ongoing portfolio management activities. These sales can produce material gains and losses that could obscure the underlying trend of our long-term portfolio earnings, so we exclude them from core earnings. Similarly, we exclude gains from calls of residential credit-enhancement securities, as these are essentially sales of assets that produce a highly variable stream of income that may obscure some underlying income generation trends. GAAP earnings also include mark-to-market income and expenses for certain of our assets and interest rate agreements. These are unrealized market value fluctuations, and we exclude them from core earnings.
Management believes that core earnings provide relevant and useful information regarding results from operations. This information can be used in conjunction with and in addition to GAAP measures of performance. Core earnings can be useful, in part, because market valuation adjustments on only a portion of our assets and stock options and none of our liabilities are recognized through the income statement under GAAP. Thus, GAAP valuation adjustments may not be fully indicative of changes in market values on the balance sheet as a whole and may not be a reliable guide to current operating performance. Furthermore, gains or losses realized upon sales of assets vary based on portfolio management decisions; a sale of an asset for a gain or a loss may or may not affect ongoing earnings from operations. A reconciliation of core earnings to GAAP income appears in Table 2 of the Appendix.
CORE EQUITY (CORE BOOK VALUE)
Core equity is not a measure calculated in accordance with GAAP. Core equity is GAAP equity with mark-to-market gains and losses ("accumulated other comprehensive income") excluded. GAAP equity includes mark-to-market adjustments for certain of our assets and interest rate agreements. Core equity approximates what our equity value would be if we used historical amortized cost accounting exclusively. A reconciliation of core equity to GAAP equity appears in Table 8 of the Appendix.
CORE REIT TAXABLE INCOME
Core REIT taxable income is REIT taxable income before gains and losses on asset sales and calls and before certain other expenses such as tax deductions for stock option exercises. It represents that portion of our REIT taxable income that may be more ongoing in nature. A reconciliation of core REIT taxable income to GAAP income appears in Tables 3 and 4 of the Appendix.
CORE TAXABLE INCOME
Core taxable income is total taxable income before gains and losses on asset sales and calls and before certain other expenses such as tax deductions for stock option exercises. It represents that portion of our total taxable income that may be more ongoing in nature. A reconciliation of core taxable income to GAAP income is covered in Tables 3 and 4 of the Appendix.


CPR
Constant (or Conditional) Prepayment Rate (CPR) is an industry-standard measure of the speed at which mortgage loans prepay. It approximates the annual percentage rate at which a pool of loans is paying down due to prepayments.
CREDIT-ENHANCEMENT SECURITIES (CES)
CES absorb the initial credit losses generated by a pool of securitized assets. As a result, the more senior securities issued from that securitization are credit-enhanced (have less credit risk). These securities are also referred to as subordinated securities and B-pieces. Our permanent asset portfolio contains residential and commercial first-loss (usually non-rated) and residential second-loss (usually with a credit rating of single-B) CES securities or their equivalents. The first-loss security takes the initial risk. If losses exceed the principal value of the first-loss security, the second-loss security is at risk. The CDO equity securities we acquire from the Acacia CDO securitization transactions we sponsor effectively function as CES for those transactions. On our GAAP balance sheet, our securities portfolio includes both permanent assets and also second- and third-loss (usually rated BB) and higher-rated securities that are owned by Acacia and are consolidated on our balance sheet.
GAAP
Generally Accepted Accounting Principles in the United States.
INTEREST-ONLY SECURITIES (IOs)
IOs are specialized securities that are backed by real estate loans. They receive interest payments calculated by a formula that typically varies as a function of interest payments generated by the underlying loans within a securitization or as a function of the spread between the yield on the loans owned by a securitization entity and the cost of funds of the securities (ABS) issued by that entity. Typically, IO securities do not have a principal balance and they will not receive principal payments. Interest payments to IO securities usually equal the IO interest rate formula multiplied by a "notional" principal balance. The notional principal balance for an IO is typically reduced over time as the actual principal balance of the underlying pool of real estate loans pays down, thus reducing IO cash flows over time. IO cash flows are typically reduced more quickly if loan prepayments accelerate. The IO securities that Redwood has acquired in the past from some Sequoia residential securitizations typically earn an interest amount that varies as a function of the remaining principal balance of Sequoia loans and the spread between the yield on the residential loans owned by Sequoia and the cost of the asset-backed securities issued by Sequoia.
INVENTORY ASSETS
Inventory assets are assets that we acquire to hold for several weeks or months that we then sell to a securitization entity or as part of a whole-loan sale. We use a combination of debt and equity to fund inventory assets.
LEVERAGE RATIOS
We currently only use debt to finance on a temporary basis the accumulation of inventory assets prior to sale to a securitization entity. Thus, we do not typically have a significant amount of financial leverage. However, because of the consolidation of independent securitization entities, it appears from our GAAP consolidated financial statements that Redwood is highly leveraged, with total liabilities significantly greater than equity. These securitization structures are non-recourse to Redwood. Therefore, although included in our consolidated balance sheets, they do not represent financial leverage for Redwood. Our investment returns from the assets we own are highly dependent on the credit performance (and, to a lesser degree, interest rate and prepayment performance) of much larger balances of loans within the associated securitizations. We do take "structural leverage" in this sense, but that does not necessarily mean we are taking financial leverage.


NEGATIVE AMORTIZATION ARMS (NEG AM ARMS, OPTION ARMS, OR MTA ARMS)
Negative amortization ARMs (neg Am ARMs, option ARMs, pay option ARMs, or MTA ARMs) are monthly adjustable rate mortgages where the borrower can choose between different payment options. One of these options allows the borrower to make a minimum payment. This minimum payment is less than the interest accrued on the mortgage during that period and, in this instance, the borrower's loan balance will increase (causing negative amortization of the loan balance), in some cases in excess of the original loan balance.
PERMANENT ASSETS
We seek to invest in assets that have the potential to provide high cash flow returns over a long period of time to help support our goal of maintaining steady dividends. We typically fund long-term investment assets entirely with equity capital and not debt. We refer to the assets that meet this criteria as permanent assets. Our permanent asset portfolio primarily includes residential and commercial credit-enhancement securities, residential interest-only securities, commercial real estate loans, and CDO equity securities.
PRIME RESIDENTIAL REAL ESTATE LOANS
Prime loans are higher-quality residential loans issued to borrowers with high FICO credit scores, lower loan-to-value ratios, lower debt-to-income ratios, greater reserves, more full documentation, and other characteristics of quality loans.
PROFITABILITY RATIOS
Many financial institution analysts use asset-based profitability ratios such as interest rate spread and interest rate margin in their work analyzing financial institutions. These are asset-based measures. Because we consolidate the assets and liabilities of securitization entities for GAAP purposes, our total GAAP assets and liabilities may vary strongly over time, and may not be comparable in economic reality to assets typically used in these calculations for other financial institutions. As a result, we believe equity-based profitability ratios may be more appropriate than asset-based measures for some analyses of Redwood's operations. We believe, for example, that net interest income as a percentage of equity is a useful measure of profitability. For operating expenses, we believe useful measures are operating efficiency ratio (operating expenses as a percentage of net interest income) and operating expenses as a percentage of equity.
REIT SUBSIDIARY
A REIT subsidiary is a subsidiary of a REIT in which the assets and income are included in the parent REIT's financials.
REDWOOD DEBT
All of Redwood's debt is short-term debt. We are only using debt to fund the acquisition of our inventory assets. We obtain this debt from a variety of Wall Street firms, banks, and other institutions. In addition, we have a commercial paper facility that will allow us to issue short-term debt to finance the acquisition of residential loans as inventory prior to securitization.
REDWOOD EARNING ASSETS
Redwood earning assets is not a measure calculated in accordance with GAAP. Redwood earning assets are our permanent assets, including securities we acquired from securitizations we sponsored. All of the assets and asset-backed securities liabilities of the securitization entities we have sponsored are shown on our GAAP consolidated balance sheet, even though we do not own these assets and we are not responsible for the payment of these liabilities. For some analytical tasks (such as determining how much financial leverage Redwood carries on its balance sheet) we believe it makes more sense to consider the assets Redwood actually owns and the debt Redwood actually owes rather than including all GAAP assets and liabilities consolidated from securitization entities that are independent of Redwood. A reconciliation of Redwood earning assets to GAAP assets appears in Table 6 of the Appendix.


REAL ESTATE INVESTMENT TRUST (REIT)
An entity that makes a tax election to be taxed as a REIT, invests in real estate assets, and that meets certain qualifications. By meeting certain tests, including the distribution as dividends of at least 90% of REIT taxable income, profits are not taxed at the corporate level for a REIT to the extent that these profits are distributed as dividends to stockholders. This provides an operating cost savings as most profits are not taxed at the entity level. On the other hand, the requirement to pay out as dividends most of the REIT profits means it can be harder for a REIT to grow if using only internally-generated funds (as opposed to issuing new stock).
REIT RETAINED TAXABLE INCOME
REIT retained taxable income is not a measure calculated in accordance with GAAP. REIT retained taxable income is the taxable income earned at the REIT after dividend distributions to our shareholders, less corporate income taxes and excise taxes paid at the REIT level. A reconciliation of REIT retained taxable income to GAAP income appears in Tables 3 and 4 of the Appendix.
REIT TAXABLE INCOME
REIT taxable income is not a measure calculated in accordance with GAAP. REIT taxable income is pre-tax income calculated for tax purposes at Redwood including only its qualified REIT subsidiaries (excluding its taxable subsidiaries). REIT taxable income is an important measure as it is the basis of our dividend distributions to shareholders. We must distribute at least 90% of REIT taxable income as dividends to shareholders over time. As a REIT, we are not subject to corporate income taxes on the REIT taxable income we distribute. We pay income tax on the REIT taxable income we retain (we can retain up to 10% of the total). A reconciliation of REIT taxable income to GAAP income appears in Table 3 of the Appendix.
RETURN ON EQUITY (ROE) AND ADJUSTED RETURN ON EQUITY
ROE is the amount of profit we generate each year per dollar of equity capital. Adjusted ROE is GAAP income divided by core equity. Core equity excludes those balance sheet mark-to-market adjustments that are not included in our income statement. Thus, only those asset market value changes that are included in our income statement will affect adjusted ROE. A reconciliation of GAAP ROE to adjusted ROE appears in Table 8 of the Appendix.
SEQUOIA
Sequoia is the brand name for most of the securitizations of residential real estate loans we have sponsored.
TAXABLE SUBSIDIARY
A taxable subsidiary is a subsidiary of a REIT that pays taxes on its income. A taxable subsidiary is not limited to investing in real estate and it can choose to retain all of its after-tax profits.
TOTAL RETAINED TAXABLE INCOME
Total retained taxable income is not a measure calculated in accordance with GAAP. Total retained taxable income is the taxable income earned at the REIT after dividend distributions to our shareholders, plus all of the taxable income earned at our taxable subsidiaries, less corporate income taxes and excise taxes paid. A reconciliation of total retained taxable income to GAAP income appears in Tables 3 and 4 of the Appendix.
TOTAL TAXABLE INCOME
Total taxable income is not a measure calculated in accordance with GAAP. Total taxable income is pre-tax income for Redwood and all its subsidiaries as calculated for tax purposes. Taxable income calculations differ significantly from GAAP income calculations. The remainder of our total taxable income is income we earn in taxable subsidiaries. We pay income tax on this income and we generally retain the after-tax income at the subsidiary level. A reconciliation of total taxable income to GAAP income appears in Table 3 of the Appendix.


[This Page Intentionally Left Blank]

FINANCIAL TABLES

Table 1: GAAP Earnings (in thousands, except per share data) | |||||||||||||
|
|
|
|
|
|
|
|
|
|
| Six Months | Six Months | |
|
| Q2:2006 | Q1:2006 | Q4:2005 | Q3:2005 | Q2:2005 | Q1:2005 | Q4:2004 | Q3:2004 | Q2:2004 | Q2:2006 | Q2:2005 | |
|
|
|
|
|
|
|
|
|
|
|
|
| |
Redwood and consolidated entities interest income |
| $214,544 | $224,795 | $234,531 | $246,810 | $248,786 | $237,714 | $205,125 | $174,072 | $145,384 | $439,339 | $486,499 | |
Discount amortization income |
| 14,381 | 14,661 | 11,936 | 12,714 | 8,395 | 9,316 | 9,146 | 9,012 | 9,077 | 29,042 | 17,711 | |
Premium amortization expense |
| (13,193) | (13,398) | (14,451) | (15,698) | (10,203) | (8,082) | (7,105) | 802 | (14,463) | (26,591) | (18,285) | |
Provision for credit losses |
| 2,506 | (176) | (877) | 805 | 1,527 | (1,025) | (1,697) | (1,528) | (1,500) | 2,330 | 502 | |
Total GAAP interest income |
| 218,238 | 225,882 | 231,139 | 244,631 | 248,505 | 237,923 | 205,469 | 182,358 | 138,498 | 444,120 | 486,427 | |
|
|
|
|
|
|
|
|
|
|
|
|
| |
Interest expense on Redwood debt |
| (1,822) | (2,072) | (3,520) | (3,789) | (1,789) | (2,694) | (2,527) | (2,299) | (2,400) | (3,894) | (4,483) | |
|
|
|
|
|
|
|
|
|
|
|
|
| |
ABS expenses consolidated from trusts |
| (171,659) | (178,182) | (186,433) | (190,996) | (191,966) | (173,146) | (143,024) | (108,249) | (78,636) | (349,841) | (365,112) | |
ABS issuance expense amortization |
| (6,079) | (5,907) | (6,069) | (5,162) | (5,386) | (5,273) | (4,783) | (4,197) | (4,305) | (11,986) | (10,659) | |
ABS interest agreement expense |
| 3,678 | 2,980 | 3,573 | 623 | 876 | 1,469 | 606 | (2,888) | (5,988) | 6,658 | 2,345 | |
ABS issuance premium amortization income |
| 2,363 | 2,526 | 2,793 | 2,733 | 3,140 | 3,747 | 2,644 | 2,823 | 1,233 | 4,889 | 6,887 | |
Total consolidated ABS expense |
| (171,697) | (178,583) | (186,136) | (192,802) | (193,336) | (173,203) | (144,557) | (112,511) | (87,696) | (350,280) | (366,539) | |
|
|
|
|
|
|
|
|
|
|
|
|
| |
GAAP net interest income |
| 44,719 | 45,227 | 41,483 | 48,040 | 53,380 | 62,026 | 58,384 | 67,547 | 48,402 | 89,946 | 115,405 | |
|
|
|
|
|
|
|
|
|
|
|
|
| |
Fixed compensation expense |
| (3,309) | (3,437) | (2,879) | (2,802) | (2,623) | (2,778) | (2,009) | (1,959) | (1,842) | (6,746) | (5,401) | |
Variable compensation expense |
| (1,900) | (1,514) | (3,689) | (4,009) | (4,200) | (4,018) | (2,811) | (3,432) | (4,709) | (3,414) | (8,218) | |
Equity compensation expense |
| (2,991) | (2,694) | (1,341) | (248) | (972) | (631) | (396) | (144) | (560) | (5,685) | (1,603) | |
Other operating expense |
| (4,855) | (4,210) | (4,303) | (3,961) | (3,234) | (3,392) | (2,652) | (2,512) | (2,044) | (9,065) | (6,626) | |
Operating expenses |
| (13,055) | (11,855) | (12,212) | (11,020) | (11,029) | (10,819) | (7,868) | (8,047) | (9,155) | (24,910) | (21,848) | |
|
|
|
|
|
|
|
|
|
|
|
|
| |
Excise taxes |
| (295) | (295) | (280) | (285) | (308) | (307) | 165 | (301) | (190) | (590) | (615) | |
Due diligence expenses |
| (2,687) | (432) | (298) | (1,075) | (117) | (757) | (291) | (2,268) | (519) | (3,119) | (873) | |
Variable stock option market value change |
| - | - | 25 | 16 | (2) | 84 | 3 | (213) | 621 | - | 82 | |
Total GAAP operating expenses |
| (16,037) | (12,582) | (12,765) | (12,364) | (11,456) | (11,799) | (7,991) | (10,829) | (9,243) | (28,619) | (23,254) | |
|
|
|
|
|
|
|
|
|
|
|
|
| |
Realized gains on calls |
| - | - | 4,266 | 2,914 | 4,421 | 7,548 | 11,205 | 20,472 | 15,246 | - | 11,969 | |
Realized gains on sales |
| 2,788 | 1,059 | 11,654 | 23,053 | 516 | 8,347 | - | 488 | 971 | 3,847 | 8,863 | |
Valuation write-downs |
| (2,305) | (3,226) | (1,111) | (1,158) | (1,710) | (391) | (1,573) | (421) | (3,846) | (5,531) | (2,101) | |
Interest rate agreements valuation adjustments |
| 5,510 | 297 | 3,066 | 107 | (182) | (492) | (411) | 47 | (113) | 5,807 | (674) | |
Valuation adjustments on real estate loans |
| - | - | - | - | - | - | (375) | - | - | - | - | |
Net gains and valuation adjustments |
| 5,993 | (1,870) | 17,875 | 24,916 | 3,045 | 15,012 | 8,846 | 20,586 | 12,258 | 4,123 | 18,057 | |
|
|
|
|
|
|
|
|
|
|
|
|
| |
Deferred tax benefit |
| - | - | - | - | - | - | - | - | 5,180 | - | - | |
Provision for income taxes |
| (3,265) | (2,760) | (4,097) | (4,693) | (4,054) | (4,677) | (4,826) | (4,962) | (1,509) | (6,025) | (8,731) | |
GAAP net income |
| $31,410 | $28,015 | $42,496 | $55,899 | $40,915 | $60,562 | $54,414 | $72,342 | $55,087 | $59,425 | $101,477 | |
|
|
|
|
|
|
|
|
|
|
|
|
| |
Diluted average shares |
| 26,109 | 25,703 | 25,311 | 25,314 | 25,196 | 25,021 | 24,491 | 22,728 | 21,325 | 25,910 | 25,109 | |
GAAP earnings per share |
| $1.20 | $1.09 | $1.68 | $2.21 | $1.62 | $2.42 | $2.22 | $3.18 | $2.58 | $2.29 | $4.04 | |
Table 2: Core Earnings (in thousands, except per share data) | |||||||||||||
|
|
|
|
|
|
|
|
|
|
| Six Months | Six Months | |
|
| Q2:2006 | Q1:2006 | Q4:2005 | Q3:2005 | Q2:2005 | Q1:2005 | Q4:2004 | Q3:2004 | Q2:2004 | Q2:2006 | Q2:2005 | |
|
|
|
|
|
|
|
|
|
|
|
|
| |
GAAP net income |
| $31,410 | $28,015 | $42,496 | $55,899 | $40,915 | $60,562 | $54,414 | $72,342 | $55,087 | $59,425 | $101,477 | |
|
|
|
|
|
|
|
|
|
|
|
|
| |
GAAP income items not included in core earnings |
|
|
|
|
|
|
|
|
|
|
|
| |
Variable stock option market value change |
| $- | $- | $25 | $16 | ($2) | $84 | $3 | ($213) | $621 | $- | $82 | |
Realized gains on calls |
| - | - | 4,266 | 2,914 | 4,421 | 7,548 | 11,205 | 20,472 | 15,246 | - | 11,969 | |
Realized gains on sales |
| 2,788 | 1,059 | 11,654 | 23,053 | 516 | 8,347 | (76) | 489 | 971 | 3,847 | 8,863 | |
Valuation write-downs |
| (2,305) | (3,226) | (1,111) | (1,158) | (1,710) | (391) | (1,572) | (422) | (3,846) | (5,531) | (2,101) | |
Interest rate agreements valuation adjustments |
| 5,510 | 297 | 3,066 | 107 | (182) | (492) | (411) | 47 | (113) | 5,807 | (674) | |
Valuation adjustments on real estate loans |
| - | - | - |
| - | - | (300) | - | - | - | - | |
Deferred tax benefit |
| - | - | - | - | - | - | - | - | 5,180 | - | - | |
Total GAAP / Core earnings differences |
| 5,993 | (1,870) | 17,900 | 24,932 | 3,043 | 15,096 | 8,849 | 20,373 | 18,059 | 4,123 | 18,139 | |
|
|
|
|
|
|
|
|
|
|
|
|
| |
Core earnings |
| $25,417 | $29,885 | $24,596 | $30,967 | $37,872 | $45,466 | $45,565 | $51,969 | $37,028 | $55,302 | $83,338 | |
|
|
|
|
|
|
|
|
|
|
|
|
| |
Per share analysis |
|
|
|
|
|
|
|
|
|
|
|
| |
GAAP earnings per share |
| $1.20 | $1.09 | $1.68 | $2.21 | $1.62 | $2.42 | $2.22 | $3.18 | $2.58 | $2.29 | $4.04 | |
|
|
|
|
|
|
|
|
|
|
|
|
| |
GAAP income items not included in core earnings |
|
|
|
|
|
|
|
|
|
|
|
| |
Variable stock option market value change |
| $0.00 | $0.00 | $0.00 | $0.00 | ($0.00) | $0.00 | $0.00 | ($0.01) | $0.03 | $0.00 | $0.00 | |
Realized gains on calls |
| - | - | 0.17 | 0.12 | 0.18 | 0.30 | 0.46 | 0.90 | 0.71 | - | 0.48 | |
Realized gains on sales |
| 0.11 | 0.04 | 0.46 | 0.91 | 0.02 | 0.33 | - | 0.02 | 0.05 | 0.15 | 0.35 | |
Valuation write-downs |
| (0.09) | (0.13) | (0.04) | (0.05) | (0.07) | (0.02) | (0.06) | (0.02) | (0.18) | (0.21) | (0.08) | |
Interest rate agreements valuation adjustments |
| 0.21 | 0.02 | 0.12 | 0.00 | (0.01) | (0.02) | (0.02) | 0.00 | - | 0.22 | (0.03) | |
Valuation adjustments on real estate loans |
| - | - | - | - | - | - | (0.02) | - | (0.01) | - | - | |
Deferred tax benefit |
| - | - | - | - | - | - | - | - | 0.24 | - | - | |
GAAP / Core earnings differences per share |
| 0.23 | (0.07) | 0.71 | 0.98 | 0.12 | 0.60 | 0.36 | 0.90 | 0.84 | 0.16 | 0.72 | |
|
|
|
|
|
|
|
|
|
|
|
|
| |
Core earnings per share |
| $0.97 | $1.16 | $0.97 | $1.22 | $1.50 | $1.82 | $1.86 | $2.29 | $1.74 | $2.13 | $3.32 | |
|
|
|
|
|
|
|
|
|
|
|
|
| |
Table 3: GAAP / TAX Differences (in thousands, except per share data) | |||||||||||||
|
|
|
|
|
|
|
|
|
|
| Estimated | Estimated | |
|
| Estimated |
| Estimated | Actual | Six Months | Six Months | ||||||
|
| Q2:2006 | Q1:2006 | Q4:2005 | Q3:2005 | Q2:2005 | Q1:2005 | Q4:2004 | Q3:2004 | Q2:2004 | Q2:2006 | Q2:2005 | |
|
|
|
|
|
|
|
|
|
|
|
|
| |
GAAP net income |
| $31,410 | $28,015 | $42,496 | $55,899 | $40,915 | $60,562 | $54,414 | $72,342 | $55,088 | $59,425 | $101,477 | |
GAAP/Tax differences: |
|
|
|
|
|
|
|
|
|
|
|
| |
Interest income and expense |
| 15,048 | 6,216 | (1,573) | 1,353 | (4,868) | (20,091) | (7,519) | (23,527) | 5,208 | 21,264 | (24,959) | |
Provision for credit losses |
| (2,506) | 176 | 876 | (805) | (1,527) | 1,025 | 1,697 | 1,528 | 1,500 | (2,330) | (502) | |
Deductions for realized credit losses |
| (686) | (1,002) | 34 | (562) | (737) | (438) | (247) | (127) | (506) | (1,688) | (1,175) | |
Long-term compensation |
| (165) | 2,520 | 1,051 | 2,892 | 2,138 | 1,969 | (1,775) | 402 | 2,428 | 2,355 | 4,107 | |
Stock option exercise deduction |
| (7) | (1,126) | (202) | (2,944) | (143) | (477) | (3,094) | (745) | (109) | (1,133) | (620) | |
Depreciation of fixed assets |
| 14 | 176 | 168 | 60 | 166 | 151 | (176) | (589) | 46 | 190 | 317 | |
Other operating expenses |
| (425) | (261) | (781) | 283 | (31) | 69 | (2,495) | (34) | 5 | (686) | 38 | |
Sale of assets to third parties |
| (1,189) | (798) | (4,612) | (8,041) | (2,476) | (967) | 1,428 | (576) | (536) | (1,987) | (3,443) | |
Call income of residential CES |
| - | 204 | (1,505) | (319) | 120 | (2,324) | (2,872) | (3,961) | (2,157) | 204 | (2,204) | |
(Loss)/gain on securitizations |
| - | - | - | (392) | 808 | 2,558 | 10,749 | 11,153 | 10,303 | - | 3,366 | |
(Loss)/gain on intercompany sales and transfers |
| 490 | (19) | (473) | 170 | 2,371 | 3,260 | 3,256 | 28 | (71) | 471 | 5,631 | |
Market valuation write downs |
| 2,305 | 3,226 | 1,110 | 2,048 | 820 | 391 | 1,572 | 422 | 3,846 | 5,531 | 1,211 | |
Interest rate agreements |
| 923 | (451) | 707 | 216 | 53 | 202 | (688) | (278) | 502 | 472 | 255 | |
Provision for excise tax |
| 295 | 295 | 280 | 285 | 308 | 307 | (165) | 301 | 190 | 590 | 615 | |
Provision for income tax |
| 3,265 | (703) | 4,096 | 5,013 | 3,035 | 134 | 4,827 | 2,834 | (3,672) | 2,562 | 3,169 | |
Total differences |
| 17,362 | 8,453 | (824) | (743) | 37 | (14,231) | 4,498 | (13,169) | 16,977 | 25,815 | (14,194) | |
|
|
|
|
|
|
|
|
|
|
|
|
| |
Total taxable income (pre-tax) |
| $48,772 | $36,468 | $41,672 | $55,156 | $40,952 | $46,331 | $58,912 | $59,173 | $72,065 | $85,240 | $87,283 | |
|
|
|
|
|
|
|
|
|
|
|
|
| |
Shares outstanding at period end |
| 25,668 | 25,382 | 25,133 | 24,764 | 24,647 | 24,514 | 24,154 | 23,346 | 21,511 | 25,668 | 24,647 | |
|
|
|
|
|
|
|
|
|
|
|
|
| |
Total taxable income per share |
| $1.90 | $1.44 | $1.66 | $2.23 | $1.66 | $1.89 | $2.44 | $2.53 | $3.35 | $3.34 | $3.55 | |
|
|
|
|
|
|
|
|
|
|
|
|
| |
Table 4: Taxable Income Estimates (in thousands, except per share data) | |||||||||||||
|
|
|
|
|
|
|
|
|
|
| Estimated | Estimated | |
|
| Estimated |
| Estimated | Actual | Six Months | Six Months | ||||||
|
| Q2:2006 | Q1:2006 | Q4:2005 | Q3:2005 | Q2:2005 | Q1:2005 | Q4:2004 | Q3:2004 | Q2:2004 | Q2: 2006 | Q2: 2005 | |
|
|
|
|
|
|
|
|
|
|
|
|
| |
Total taxable income (pre-tax) |
| $48,772 | $36,468 | $41,672 | $55,156 | $40,952 | $46,331 | $58,912 | $59,173 | $72,065 | $85,240 | $87,283 | |
Less: net gains (losses) from calls, sales and stock option exercises |
| 4,826 | (630) | 5,447 | 14,160 | 5,365 | 17,586 | 18,553 | 26,176 | 23,284 | 4,196 | 22,951 | |
Total core taxable income |
| $43,946 | $37,098 | $36,225 | $40,996 | $35,587 | $28,745 | $40,359 | $32,997 | $48,781 | $81,044 | $110,234 | |
|
|
|
|
|
|
|
|
|
|
|
|
| |
Total taxable income (pre-tax) |
| $48,772 | $36,468 | $41,672 | $55,156 | $40,952 | $46,331 | $58,912 | $59,173 | $72,065 | $85,240 | $87,283 | |
Less: REIT taxable income (pre-tax) |
| 45,040 | 35,382 | 39,969 | 47,118 | 39,237 | 45,161 | 50,009 | 49,030 | 60,344 | 80,422 | 84,398 | |
Taxable income in taxable subs (pre-tax) |
| $3,732 | $1,086 | $1,703 | $8,038 | $1,715 | $1,170 | $8,903 | $10,143 | $11,721 | $4,818 | $2,885 | |
|
|
|
|
|
|
|
|
|
|
|
|
| |
Core REIT taxable income |
| $40,504 | $36,011 | $36,660 | $33,065 | $36,198 | $30,741 | $42,544 | $34,272 | $47,040 | $76,515 | $66,939 | |
Other ordinary REIT taxable income (expense) |
| 4,370 | (1,069) | 865 | (2,160) | 3,166 | (565) | (3,094) | (745) | (109) | 3,301 | 2,601 | |
Ordinary REIT taxable income |
| 44,874 | 34,942 | 37,525 | 30,905 | 39,364 | 30,176 | 39,450 | 33,527 | 46,931 | 79,816 | $69,540 | |
Net long-term capital gains |
| 166 | 439 | 2,444 | 16,213 | (127) | 14,985 | 10,559 | 15,503 | 13,413 | 605 | 14,858 | |
REIT taxable income (pre-tax) |
| 45,040 | 35,382 | $39,969 | $47,118 | $39,237 | $45,161 | $50,009 | $49,030 | $60,344 | 80,422 | 84,398 | |
|
|
|
|
|
|
|
|
|
|
|
|
| |
REIT taxable income (pre-tax) |
| $45,040 | 35,382 | $39,969 | $47,118 | $39,237 | $45,161 | $50,009 | $49,030 | $60,344 | $80,422 | $84,398 | |
Excise taxes |
| (295) | (295) | (280) | (285) | (308) | (307) | 293 | (301) | (190) | (590) | (615) | |
Income taxes |
| (1,802) | (1,712) | (1,230) | (1,641) | (1,830) | (1,450) | 14 | (1,537) | (2,151) | (3,514) | (3,280) | |
REIT taxable income available for distribution |
| $42,943 | $33,375 | $38,460 | $45,192 | $37,099 | $43,404 | $50,316 | $47,192 | $58,003 | $76,318 | $80,503 | |
|
|
|
|
|
|
|
|
|
|
|
|
| |
Core income (loss) in taxable subs (pre-tax) |
| $3,442 | $1,086 | ($436) | $7,931 | ($611) | ($1,996) | ($2,185) | ($1,275) | $1,741 | $4,528 | ($2,607) | |
Income from calls and sales in taxable subs (pre-tax) |
| 290 | - | 2,139 | 107 | 2,326 | 3,166 | 11,088 | 11,418 | 9,980 | 290 | 5,492 | |
Taxable income in taxable subs (pre-tax) |
| 3,732 | 1,086 | 1,703 | 8,038 | 1,715 | 1,170 | 8,903 | 10,143 | 11,721 | 4,818 | $2,885 | |
Income tax for taxable subs (actual tax due) |
| (1,700) | (530) | (572) | (3,652) | (870) | (830) | (5,773) | (4,574) | (1,600) | (2,230) | (1,700) | |
After-tax income in taxable subs |
| $2,032 | $556 | $1,131 | $4,386 | $845 | $340 | $3,130 | $5,569 | $10,121 | 2,588 | $1,185 | |
|
|
|
|
|
|
|
|
|
|
|
|
| |
REIT taxable income available for distribution |
| 42,943 | $33,375 | $38,460 | $45,192 | $37,099 | $43,404 | $50,316 | $47,192 | $58,003 | $76,318 | $80,503 | |
After-tax income in taxable subs |
| 2,032 | 556 | 1,131 | 4,386 | 845 | 340 | 3,130 | 5,569 | 10,121 | 2,588 | 1,185 | |
Total taxable income (after-tax) |
| $44,975 | $33,931 | $39,591 | $49,578 | $37,944 | $43,744 | $53,446 | $52,761 | $68,124 | $78,906 | $81,688 | |
|
|
|
|
|
|
|
|
|
|
|
|
| |
Taxable income (after-tax) retained in tax subs |
| $2,032 | $556 | $1,131 | $4,386 | $845 | $340 | $3,130 | $5,569 | $10,121 | $2,588 | $1,185 | |
REIT retained taxable income (after-tax) (1) |
| 2,166 | 1,312 | 1,553 | 1,165 | 1,798 | 1,261 | 4,252 | 1,515 | 2,352 | 3,479 | 3,059 | |
Total retained taxable earnings (after-tax) |
| $4,198 | $1,868 | $2,684 | $5,551 | $2,643 | $1,601 | $7,382 | $7,084 | $12,473 | $6,067 | $4,244 | |
|
|
|
|
|
|
|
|
|
|
|
|
| |
Shares outstanding at period end (000) |
| 25,668 | 25,382 | 25,133 | 24,764 | 24,647 | 24,514 | 24,154 | 23,346 | 21,511 | 25,668 | 24,647 | |
|
|
|
|
|
|
|
|
|
|
|
|
| |
Per share outstanding at quarter end |
|
|
|
|
|
|
|
|
|
|
|
| |
Total taxable income (pre-tax) |
| $1.90 | $1.44 | $1.66 | $2.23 | $1.66 | $1.89 | $2.44 | $2.53 | $3.35 | $3.34 | $3.55 | |
Core taxable income (pre-tax) |
| $1.71 | $1.46 | $1.44 | $1.66 | $1.44 | $1.17 | $1.67 | $1.41 | $2.27 | $3.17 | $2.61 | |
REIT taxable income (pre-tax) |
| $1.75 | $1.39 | $1.59 | $1.90 | $1.59 | $1.84 | $2.07 | $2.10 | $2.81 | $3.14 | $3.43 | |
Taxable income at taxable subsidiaries |
| $0.16 | $0.04 | $0.07 | $0.32 | $0.07 | $0.05 | $0.37 | $0.43 | $0.54 | $0.20 | $0.12 | |
Total retained taxable earnings (after-tax) |
| $0.16 | $0.07 | $0.11 | $0.22 | $0.11 | $0.07 | $0.31 | $0.30 | $0.58 | $0.23 | $0.18 | |
|
|
|
|
|
|
|
|
|
|
|
|
| |
(1) REIT retained taxable income equals 10% of ordinary REIT taxable income less income taxes and excise taxes. |
|
|
|
|
|
|
|
|
|
|
|
| |
Table 5: Retention and Distribution of Taxable Income (in thousands, except per share data) | |||||||||||||
|
|
|
|
|
|
|
|
|
|
|
|
| |
|
| Estimated |
| Estimated | Actual | Six Months | Six Months | ||||||
|
| Q2:2006 | Q1:2006 | Q4:2005 | Q3:2005 | Q2:2005 | Q1:2005 | Q4:2004 | Q3:2004 | Q2:2004 | Q2:2006 | Q2:2005 | |
Dividends declared |
| $17,967 | $17,767 | $92,150 | $17,335 | $17,253 | $17,160 | $146,707 | $15,642 | $14,412 | $35,734 | $34,413 | |
Dividend deduction on stock issued through DRIP |
| 239 | 176 | 263 | 128 | 112 | 56 | 1,048 | 844 | 712 | 415 | 168 | |
Total dividend deductions |
| $18,206 | $17,943 | $92,413 | $17,463 | $17,365 | $17,216 | $147,755 | $16,486 | $15,124 | $36,149 | $34,581 | |
|
|
|
|
|
|
|
|
|
|
|
|
| |
Regular dividend per share |
| $0.70 | $0.70 | $0.70 | $0.70 | $0.70 | $0.70 | $0.67 | $0.67 | $0.67 | $1.40 | $1.40 | |
Special dividend per share |
| - | - | 3.00 | - | - | - | 5.50 | - | - | - | - | |
Total dividends per share |
| $0.70 | $0.70 | $3.70 | $0.70 | $0.70 | $0.70 | $6.17 | $0.67 | $0.67 | $1.40 | $1.40 | |
|
|
|
|
|
|
|
|
|
|
|
|
| |
Undistributed beginning of period REIT taxable income (pre-tax): |
| $65,332 | $51,213 | $106,719 | $80,166 | $62,218 | $37,291 | $138,981 | $109,790 | $69,263 | $51,213 | $37,291 | |
REIT taxable income (pre-tax) |
| 45,040 | 35,382 | 39,970 | 47,118 | 39,237 | 45,161 | 50,009 | 49,030 | 60,344 | 80,422 | 84,398 | |
Permanently retained (pre-tax) |
| (4,263) | (3,320) | (3,063) | (3,102) | (3,924) | (3,018) | (3,944) | (3,353) | (4,693) | (7,583) | (6,942) | |
Dividend of 2003 income |
| - | - | - | - | - | - | - | (14,413) | (15,124) | - | - | |
Dividend of 2004 income |
| - | - | - | (2,710) | (17,365) | (17,216) | (147,755) | (2,073) | - | - | (34,581) | |
Dividend of 2005 income |
| (18,206) | (17,943) | (92,413) | (14,753) | - | - | - | - | - | (36,149) | - | |
Undistributed REIT taxable income at end of period: |
| $87,903 | $65,332 | $51,213 | $106,719 | $80,166 | $62,218 | $37,291 | $138,981 | $109,790 | $87,903 | $80,166 | |
|
|
|
|
|
|
|
|
|
|
|
|
| |
Undistributed REIT taxable income (pre-tax) |
|
|
|
|
|
|
|
|
|
|
|
| |
From 2003's income |
| $- | $- | $- | $- | $- | $- | $- | $- | $14,413 | $- | $- | |
From 2004's income |
| - | - | - | - | 2,710 | 20,075 | 37,291 | 138,981 | 95,377 | - | 2,710 | |
From 2005's income |
| 15,064 | 33,270 | 51,213 | 106,716 | 77,456 | 42,143 | - | - | - | 15,064 | 77,456 | |
From 2006's income |
| 72,839 | 32,062 | - | - | - | - | - | - | - | 72,839 | - | |
Total |
| $87,903 | $65,332 | $51,213 | $106,716 | $80,166 | $62,218 | $37,291 | $138,981 | $109,790 | $87,903 | $80,166 | |
|
|
|
|
|
|
|
|
|
|
|
|
| |
Shares outstanding at period end |
| 25,668 | 25,382 | 25,133 | 24,764 | 24,647 | 24,514 | 24,154 | 23,346 | 21,511 | 25,668 | 24,647 | |
Undistributed REIT taxable income (pre-tax) |
|
|
|
|
|
|
|
|
|
|
|
| |
per share outstanding |
| $3.42 | $2.57 | $2.04 | $4.31 | $3.25 | $2.54 | $1.54 | $5.95 | $5.10 | $3.42 | $3.25 | |
| ||||||||||||
Table 6: Assets (all $ in millions) | ||||||||||||
|
|
|
|
|
|
|
|
|
|
|
| |
|
| Q2:2006 | Q1:2006 | Q4:2005 | Q3:2005 | Q2:2005 | Q1:2005 | Q4:2004 | Q3:2004 | Q2:2004 | Q1:2004 | |
|
|
|
|
|
|
|
|
|
|
|
| |
Residential loans owned by Redwood |
| $351 | $87 | $45 | $17 | $300 | $256 | $193 | $259 | $161 | $97 | |
Residential loans consolidated from entities |
| 9,962 | 11,741 | 13,649 | 16,324 | 19,083 | 21,237 | 22,015 | 21,299 | 19,755 | 17,989 | |
Total GAAP residential loans |
| 10,313 | 11,828 | 13,694 | 16,341 | 19,383 | 21,493 | 22,208 | 21,558 | 19,916 | 18,086 | |
|
|
|
|
|
|
|
|
|
|
|
| |
HELOC loans owned by Redwood |
| - | - | - | - | - | - | - | - | - | - | |
HELOC loans consolidated from entities |
| 140 | 162 | 181 | 215 | 247 | 279 | 296 | 317 | 327 | - | |
Total GAAP HELOC loans |
| 140 | 162 | 181 | 215 | 247 | 279 | 296 | 317 | 327 | - | |
|
|
|
|
|
|
|
|
|
|
|
| |
Commercial loans owned by Redwood |
| 2 | 2 | 7 | 21 | 16 | 22 | 32 | 21 | 25 | 14 | |
Commercial loans consolidated from entities |
| 36 | 53 | 53 | 35 | 26 | 35 | 22 | 12 | 8 | 8 | |
Total GAAP commercial loans |
| 38 | 55 | 60 | 56 | 42 | 57 | 54 | 33 | 33 | 22 | |
|
|
|
|
|
|
|
|
|
|
|
| |
Residential CES owned by Redwood |
| 409 | 305 | 311 | 338 | 469 | 373 | 351 | 327 | 312 | 256 | |
Residential CES consolidated from entities |
| 306 | 339 | 302 | 326 | 237 | 238 | 211 | 170 | 131 | 119 | |
Total GAAP residential CES |
| 715 | 644 | 613 | 664 | 706 | 611 | 562 | 497 | 443 | 375 | |
|
|
|
|
|
|
|
|
|
|
|
| |
Commercial CES owned by Redwood |
| 76 | 67 | 58 | 44 | 29 | 29 | 14 | 9 | 2 | 2 | |
Commercial CES consolidated from entities |
| - | - | - | - | - | - | - | - | - | - | |
Total GAAP Commercial CES |
| 76 | 67 | 58 | 44 | 29 | 29 | 14 | 9 | 2 | 2 | |
|
|
|
|
|
|
|
|
|
|
|
| |
Other securities owned by Redwood |
| 240 | 53 | 167 | 234 | 208 | 70 | 115 | 161 | 213 | 237 | |
Other securities consolidated from entities |
| 1,630 | 1,765 | 1,582 | 1,549 | 1,441 | 1,435 | 1,266 | 1,069 | 881 | 698 | |
Total GAAP other securities |
| 1,870 | 1,818 | 1,749 | 1,783 | 1,649 | 1,505 | 1,381 | 1,230 | 1,094 | 935 | |
|
|
|
|
|
|
|
|
|
|
|
| |
Cash owned by Redwood |
| 106 | 85 | 176 | 163 | 72 | 65 | 57 | 76 | 38 | 58 | |
Restricted cash consolidated from entities |
| 86 | 131 | 72 | 59 | 48 | 58 | 36 | 45 | 20 | 14 | |
Accrued interest receivable |
| 67 | 73 | 76 | 80 | 85 | 82 | 72 | 62 | 49 | 44 | |
Principal receivable |
| 1 | 2 | - | 2 | - | - | 3 | 1 | 12 | - | |
Interest rate agreements |
| 54 | 48 | 31 | 25 | 13 | 29 | 16 | 10 | 17 | 1 | |
Deferred tax asset |
| 5 | 5 | 5 | 8 | 7 | 8 | 11 | 9 | 5 | - | |
Deferred asset-backed security issuance costs |
| 46 | 52 | 54 | 56 | 59 | 63 | 61 | 58 | 53 | 47 | |
Other assets |
| 13 | 10 | 8 | 9 | 6 | 6 | 7 | 7 | 7 | 6 | |
Total GAAP assets |
| $13,530 | 14,979 | $16,777 | $19,505 | $22,346 | $24,285 | $24,778 | $23,912 | $22,016 | $19,590 | |
|
|
|
|
|
|
|
|
|
|
|
| |
Residential loans owned by Redwood |
| $351 | $87 | $45 | $17 | $300 | $256 | $193 | $259 | $161 | $97 | |
HELOC loans owned by Redwood |
| - | - | - | - | - | - | - | - | - | - | |
Commercial loans owned by Redwood |
| 2 | 2 | 7 | 21 | 16 | 22 | 32 | 21 | 25 | 14 | |
Residential CES owned by Redwood |
| 409 | 305 | 311 | 338 | 469 | 373 | 351 | 327 | 312 | 256 | |
Commercial CES owned by Redwood |
| 76 | 67 | 58 | 44 | 29 | 29 | 14 | 9 | 2 | 2 | |
Other securities owned by Redwood |
| 240 | 53 | 167 | 234 | 208 | 70 | 129 | 170 | 215 | 239 | |
Cash owned by Redwood |
| 106 | 85 | 176 | 163 | 72 | 65 | 57 | 76 | 38 | 58 | |
Assets of securitizations for GAAP |
| 12,074 | 14,060 | 15,767 | 18,449 | 21,034 | 23,224 | 23,810 | 22,867 | 21,102 | 18,814 | |
ABS liabilities of entities for GAAP |
| (11,898) | (13,930) | (15,585) | (18,238) | (20,815) | (23,057) | (23,630) | (22,680) | (20,923) | (18,630) | |
Redwood earning assets - GAAP basis |
| $1,360 | $729 | $946 | $1,028 | $1,313 | $982 | $956 | $1,049 | $932 | $850 | |
|
|
|
|
|
|
|
|
|
|
|
| |
Table 7: Liabilities and Equity (in millions) | |||||||||||
|
|
|
|
|
|
|
|
|
|
| |
|
| Q2:2006 | Q1:2006 | Q4:2005 | Q3:2005 | Q2:2005 | Q1:2005 | Q4:2004 | Q3:2004 | Q2:2004 | |
|
|
|
|
|
|
|
|
|
|
| |
Redwood debt: short-term |
| $529 | $- | $170 | $162 | $453 | $199 | $203 | $246 | $270 | |
Redwood debt: long-term |
| - | - | - | - | - | - | - | - | - | |
Total Redwood debt |
| 529 | - | 170 | 162 | 453 | 199 | 203 | 246 | 270 | |
|
|
|
|
|
|
|
|
|
|
| |
ABS issued, consolidated from entities |
| 11,775 | 13,788 | 15,422 | 18,049 | 20,598 | 22,821 | 23,383 | 22,449 | 20,724 | |
Unamortized IO issuance premium |
| 106 | 124 | 143 | 163 | 186 | 202 | 210 | 185 | 161 | |
Unamortized ABS issuance premium |
| 17 | 18 | 20 | 25 | 31 | 34 | 37 | 46 | 38 | |
ABS obligations of entities |
| 11,898 | 13,930 | 15,585 | 18,237 | 20,815 | 23,057 | 23,630 | 22,680 | 20,923 | |
|
|
|
|
|
|
|
|
|
|
| |
Accrued interest payable |
| 47 | 43 | 41 | 42 | 43 | 38 | 35 | 29 | 22 | |
Interest rate agreements |
| 4 | 0 | 1 | 1 | 3 | 0 | 1 | 7 | 1 | |
Accrued expenses and other liabilities |
| 29 | 21 | 28 | 30 | 23 | 26 | 29 | 32 | 28 | |
Dividends payable |
| 18 | 18 | 17 | 17 | 17 | 17 | 16 | 16 | 14 | |
Total GAAP liabilities |
| 12,525 | 14,012 | 15,842 | 18,489 | 21,354 | 23,337 | 23,914 | 23,010 | 21,258 | |
|
|
|
|
|
|
|
|
|
|
| |
|
|
|
|
|
|
|
|
|
|
| |
Common stock and paid-in capital |
| 854 | 839 | 825 | 808 | 803 | 795 | 773 | 727 | 625 | |
Accumulated other comprehensive income |
| 91 | 82 | 74 | 117 | 137 | 125 | 105 | 97 | 111 | |
Cumulative GAAP earnings |
| 740 | 709 | 681 | 639 | 583 | 542 | 482 | 427 | 355 | |
Cumulative distributions to shareholders |
| (681) | (663) | (645) | (548) | (531) | (514) | (496) | (349) | (333) | |
GAAP stockholders' equity |
| 1,004 | 967 | 935 | 1,016 | 992 | 948 | 864 | 902 | 758 | |
|
|
|
|
|
|
|
|
|
|
| |
Total GAAP liabilities and equity |
| $13,530 | $14,979 | $16,777 | $19,505 | $22,346 | $24,285 | $24,778 | $23,912 | $22,016 | |
|
|
|
|
|
|
|
|
|
|
| |
|
|
|
|
|
|
|
|
|
|
| |
Total Redwood debt |
| $529 | $0 | $170 | $162 | $453 | $199 | $203 | $246 | $270 | |
GAAP stockholders' equity |
| 1,004 | 967 | 935 | 1016 | 992 | 948 | 864 | 902 | 758 | |
Redwood total capital |
| $1,533 | $967 | $1,105 | $1,178 | $1,445 | $1,147 | $1,067 | $1,148 | $1,028 | |
|
|
|
|
|
|
|
|
|
|
| |
Redwood debt to equity |
| 53% | 0% | 18% | 16% | 46% | 21% | 23% | 27% | 36% | |
Debt to capital |
|
35% |
0% |
15% | 14% | 31% | 17% | 19% | 21% | 26% | |
|
|
|
|
|
|
|
|
|
|
| |
Redwood earning assets |
| $1,360 | $729 | $946 | $1,028 | $1,313 | $982 | $956 | $1,049 | $932 | |
Redwood debt |
| 529 | 0 | 170 | 162 | 453 | 199 | 203 | 246 | 270 | |
Redwood net earning assets (GAAP basis) |
| 831 | 729 | 776 | 866 | 860 | 783 | 739 | 794 | 660 | |
Working capital and other |
| 173 | 238 | 159 | 150 | 132 | 165 | 125 | 108 | 98 | |
GAAP stockholders' equity |
| $1,004 | $967 | $935 | $1,016 | $992 | $948 | $864 | $902 | $758 | |
|
|
|
|
|
|
|
|
|
|
| |
Equity to earning assets |
| 74% | 113% | 99% | 99% | 76% | 97% | 92% | 87% | 82% | |
|
|
|
|
|
|
|
|
|
|
| |
Table 8: Book Value and Profitability (in thousands, except per share data) | |||||||||||||
|
|
|
|
|
|
|
|
|
|
| Six Months | Six Months | |
|
| Q2:2006 | Q1:2006 | Q4:2005 | Q3:2005 | Q2:2005 | Q1:2005 | Q4:2004 | Q3:2004 | Q2:2004 | Q2:2006 | Q2:2005 | |
|
|
|
|
|
|
|
|
|
|
|
|
| |
GAAP stockholders equity |
| $1,004,265 | $967,333 | $934,960 | $1,016,065 | $991,757 | $948,001 | $864,156 | $901,841 | $757,940 | $1,004,265 | $991,757 | |
Balance sheet mark-to-market adjustments |
| 90,937 | 81,591 | 73,731 | 117,043 | 137,380 | 124,784 | 105,357 | 96,452 | 111,221 | 90,937 | 137,380 | |
Core equity |
| $913,328 | $885,742 | $861,229 | $899,022 | $854,377 | $823,217 | $758,799 | $805,389 | $646,719 | $913,328 | $854,377 | |
|
|
|
|
|
|
|
|
|
|
|
|
| |
Core equity |
| $913,328 | $885,742 | $861,229 | $899,022 | $854,377 | $823,217 | $758,799 | $805,389 | $646,719 | $913,328 | $854,377 | |
REIT taxable income yet to be distributed as dividends |
| 87,903 | 65,332.2 | 51,213.2 | 106,716 | 80,166 | 62,218 | 37,291 | 138,981.7 | 109,790.20071 | 87,903 | 80,166 | |
Adjusted core equity |
| $825,425 | $820,410 | $810,016 | $792,306 | $774,211 | $760,999 | $721,508 | $666,407 | $536,929 | $825,425 | $774,211 | |
|
|
|
|
|
|
|
|
|
|
|
|
| |
Shares outstanding at quarter end |
| 25,668 | 25,382 | 25,133 | 24,764 | 24,647 | 24,514 | 24,154 | 23,346 | 21,511 | 25,668 | 24,647 | |
|
|
|
|
|
|
|
|
|
|
|
|
| |
GAAP equity per share |
| $39.13 | $38.11 | $37.20 | $41.03 | $40.24 | $38.67 | $35.78 | $38.63 | $35.24 | $39.13 | $40.24 | |
Core equity per share |
| $35.58 | $34.90 | $34.27 | $36.30 | $34.66 | $33.58 | $31.42 | $34.50 | $30.06 | $35.58 | $34.66 | |
Adjusted core equity per share |
| $32.16 | $32.32 | $32.23 | $31.99 | $31.41 | $31.04 | $29.87 | $28.55 | $24.96 | $32.16 | $31.41 | |
|
|
|
|
|
|
|
|
|
|
|
|
| |
|
|
|
|
|
|
|
|
|
|
|
|
| |
|
|
|
|
|
|
|
|
|
|
|
|
| |
Net interest income (NII) |
| $44,719 | $45,227 | $41,483 | $48,040 | $53,380 | $62,026 | $58,384 | $67,547 | $48,402 | $89,946 | $115,405 | |
Net interest income / average core equity |
| 20% | 21% | 19% | 22% | 25% | 31% | 30% | 39% | 33% | 20% | 28% | |
|
|
|
|
|
|
|
|
|
|
|
|
| |
Operating expenses (before due diligence fees, excise tax, and VSOE) |
| $13,055 | $11,855 | $12,212 | $11,020 | $11,029 | $10,819 | $7,868 | $8,047 | $9,155 | $24,910 | $21,848 | |
Op exp (before due dilligence fees, excise tax, and VSOE)/NII |
| 29% | 26% | 29% | 23% | 21% | 17% | 13% | 12% | 19% | 28% | 19% | |
|
|
|
|
|
|
|
|
|
|
|
|
| |
GAAP net income |
| $31,410 | $28,015 | $42,496 | $55,899 | $40,915 | $60,562 | $54,414 | $72,342 | $55,087 | $59,425 | $101,477 | |
GAAP net income/average core equity (adjusted ROE) |
| 0.14% | 13% | 19% | 25% | 19% | 30% | 28% | 42% | 38% | 13% | 25% | |
|
|
|
|
|
|
|
|
|
|
|
|
| |
Core earnings |
| $25,417 | $29,885 | $24,596 | $30,967 | $37,872 | $45,466 | $45,565 | $51,969 | $37,028 | $55,302 | $83,338 | |
Core earnings/average core equity |
| 11% | 14% | 11% | 14% | 18% | 23% | 23% | 30% | 25% | 12% | 20% | |
Table 9: Average Balance Sheet (in thousands) | |||||||||||||
|
|
|
|
|
|
|
|
|
|
| Six Months | Six Months | |
|
| Q2:2006 | Q1:2006 | Q4:2005 | Q3:2005 | Q2:2005 | Q1:2005 | Q4:2004 | Q3:2004 | Q2:2004 | Q2:2006 | Q2:2005 | |
|
|
|
|
|
|
|
|
|
|
|
|
| |
Average real estate loans |
| $10,832,187 | $12,599,296 | $14,880,636 | $17,645,610 | $20,357,699 | $21,981,723 | $22,059,853 | $20,840,848 | $18,904,382 | $11,710,861 | $21,165,225 | |
Average real estate securities |
| 2,502,926 | 2,386,493 | 2,322,337 | 2,305,361 | 2,123,630 | 1,936,154 | 1,703,407 | 1,517,715 | 1,297,324 | 2,445,031 | 2,030,409 | |
Average cash and cash equivalents |
| 246,597 | 244,002 | 339,379 | 134,422 | 124,707 | 124,685 | 126,556 | 101,937 | 81,450 | 245,306 | 124,697 | |
Average earning assets |
| 13,581,710 | 15,229,791 | 17,542,352 | 20,085,393 | 22,606,036 | 24,042,562 | 23,889,816 | 22,460,500 | 20,283,156 | 14,401,198 | 23,320,331 | |
Average other assets |
| 587,045 | 609,692 | 806,329 | 905,906 | 759,517 | 520,622 | 430,219 | 416,736 | 327,205 | 598,306 | 640,793 | |
Average total assets |
| $14,168,755 | $15,839,483 | $18,348,681 | $20,991,299 | $23,365,553 | $24,563,184 | $24,320,035 | $22,877,236 | $20,610,361 | $14,999,504 | $23,961,124 | |
|
|
|
|
|
|
|
|
|
|
|
|
| |
|
|
|
|
|
|
|
|
|
|
|
|
| |
Average Redwood debt |
| $85,616 | $137,181 | $253,302 | $297,788 | $216,639 | $277,423 | $348,177 | $404,589 | $539,231 | $111,256 | $246,863 | |
Average asset-backed securities issued |
| 12,969,801 | 14,663,134 | 16,941,243 | 19,542,413 | 22,067,276 | 23,324,111 | 22,956,247 | 21,606,164 | 19,350,833 | 13,811,790 | 22,692,221 | |
Average total obligations |
| 13,055,417 | 14,800,315 | 17,194,545 | 19,840,201 | 22,283,915 | 23,601,534 | 23,304,424 | 22,010,753 | 19,890,064 | 13,923,046 | 22,939,084 | |
Average other liabilities |
| 132,936 | 86,938 | 154,823 | 136,769 | 111,294 | 66,188 | 145,752 | 64,916 | 56,424 | 110,064 | 88,930 | |
Average total liabilities |
| 13,188,353 | 14,887,253 | 17,349,368 | 19,976,970 | 22,395,209 | 23,667,722 | 23,450,176 | 22,075,669 | 19,946,488 | 14,033,110 | 23,028,014 | |
|
|
|
|
|
|
|
|
|
|
|
|
| |
Average core equity |
| 898,409 | 877,212 | 880,329 | 880,482 | 840,098 | 794,866 | 776,833 | 695,488 | 583,875 | 887,870 | 817,650 | |
Average balance sheet mark-to-market adjustments |
| 81,993 | 75,018 | 118,984 | 133,847 | 130,246 | 100,596 | 93,026 | 106,079 | 79,998 | 78,524 | 115,460 | |
Average total equity |
| 980,402 | 952,230 | 999,313 | 1,014,329 | 970,344 | 895,462 | 869,859 | 801,567 | 663,873 | 966,394 | 933,110 | |
Average total liabilities and equity |
| $14,168,755 | $15,839,483 | $18,348,681 | $20,991,299 | $23,365,553 | $24,563,184 | $24,320,035 | $22,877,236 | $20,610,361 | $14,999,504 | $23,961,124 | |
Table 10: Balances & Yields (all $ in thousands) | ||||||||||||
|
|
|
|
|
|
|
|
|
|
|
| |
|
|
| At period end |
| For period ended | |||||||
|
|
|
|
|
|
|
|
|
|
|
| |
|
|
| Current Face | Unamortized Premium/ (Discount) | Credit Protection | UnrealizedGain / (Loss) | Net Book Value |
| Average Balance | Interest Income | Yield | |
|
|
|
|
|
|
|
|
|
|
|
| |
Total Earning Assets (GAAP) |
| Q2: 2004 | $21,975,772 | $57,582 | ($272,698) | $91,454 | $21,852,110 |
| $20,283,156 | $138,498 | 2.73% | |
| Q3: 2004 | 23,883,198 | 102,744 | (356,371) | 90,818 | 23,720,389 |
| 22,460,501 | 182,358 | 3.25% | ||
| Q4: 2004 | 24,794,021 | 104,063 | (420,757) | 95,396 | 24,572,723 |
| 23,889,816 | 205,469 | 3.44% | ||
| 2004 | 24,794,021 | 104,063 | (420,757) | 95,396 | 24,572,723 |
| 21,208,757 | 651,618 | 3.07% | ||
| Q1: 2005 | 24,301,644 | 122,952 | (487,952) | 102,711 | 24,039,355 |
| 24,042,562 | 237,923 | 3.96% | ||
| Q2: 2005 | 22,414,482 | 103,779 | (522,490) | 133,210 | 22,128,981 |
| 22,606,036 | 248,505 | 4.40% | ||
| Q3: 2005 | 19,625,979 | 94,058 | (551,562) | 98,874 | 19,267,349 |
| 20,085,393 | 244,631 | 4.87% | ||
| Q4: 2005 | 16,986,581 | 13,376 | (527,213) | 56,542 | 16,529,286 |
| 17,542,352 | 231,082 | 5.27% | ||
| 2005 | 16,986,581 | 13,376 | (527,213) | 56,542 | 16,529,286 |
| 21,048,582 | 962,140 | 4.57% | ||
| Q1: 2006 | 15,168,319 | 12,215 | (572,066) | 50,480 | 14,658,948 |
| 15,229,791 | 225,882 | 5.93% | ||
| Q2: 2006 | 13,865,565 | (18,160) | (645,303) | 56,652 | 13,258,755 |
| 13,581,710 | 218,239 | 6.43% | ||
|
|
|
|
|
|
|
|
|
|
|
| |
Residential Real Estate Loans |
| Q2: 2004 | 19,766,481 | 169,174 | (20,080) | - | 19,915,575 |
| 18,754,200 | 110,399 | 2.35% | |
| Q3: 2004 | 21,381,784 | 197,472 | (21,344) | - | 21,557,912 |
| 20,484,287 | 150,242 | 2.93% | ||
| Q4: 2004 | 22,023,888 | 207,607 | (23,078) | - | 22,208,417 |
| 21,716,898 | 169,122 | 3.12% | ||
| 2004 | 22,023,888 | 207,607 | (23,078) | - | 22,208,417 |
| 19,476,842 | 529,045 | 2.72% | ||
| Q1: 2005 | 21,307,080 | 210,375 | (24,231) | - | 21,493,224 |
| 21,640,501 | 195,143 | 3.61% | ||
| Q2: 2005 | 19,202,109 | 203,480 | (22,396) | - | 19,383,193 |
| 20,054,970 | 203,796 | 4.06% | ||
| Q3: 2005 | 16,176,357 | 185,814 | (20,991) | - | 16,341,180 |
| 17,373,023 | 191,925 | 4.42% | ||
| Q4: 2005 | 13,541,402 | 173,299 | (20,868) | - | 13,693,833 |
| 14,627,880 | 175,124 | 4.79% | ||
| 2005 | 13,541,402 | 173,299 | (20,868) | - | 13,693,833 |
| 18,402,001 | 765,988 | 4.16% | ||
| Q1: 2006 | 11,686,976 | 161,827 | (21,014) | - | 11,827,789 |
| 12,374,811 | 163,228 | 5.28% | ||
| Q2: 2006 | 10,181,280 | 151,346 | (18,212) | - | 10,314,414 |
| 10,642,160 | 152,023 | 5.71% | ||
|
|
|
|
|
|
|
|
|
|
|
| |
Home Equity Lines of Credit |
| Q2: 2004 | 317,045 | 10,043 | (267) | - | 326,821 |
| 124,053 | 536 | 1.73% | |
| Q3: 2004 | 308,697 | 9,029 | (531) | - | 317,195 |
| 323,100 | 1,618 | 2.00% | ||
| Q4: 2004 | 288,954 | 8,087 | (693) | - | 296,348 |
| 303,119 | 2,177 | 2.87% | ||
| 2004 | 288,954 | 8,087 | (693) | - | 296,348 |
| 188,254 | 4,331 | 2.30% | ||
| Q1: 2005 | 272,591 | 7,477 | (596) | - | 279,472 |
| 285,142 | 2,558 | 3.59% | ||
| Q2: 2005 | 241,278 | 6,657 | (563) | - | 247,372 |
| 257,515 | 2,467 | 3.83% | ||
| Q3: 2005 | 210,476 | 5,699 | (1,038) | - | 215,137 |
| 224,884 | 1,696 | 3.02% | ||
| Q4: 2005 | 177,840 | 4,907 | (1,788) | - | 180,959 |
| 193,707 | 1,475 | 3.05% | ||
| 2005 | 177,840 | 4,907 | (1,788) | - | 180,959 |
| 240,019 | 8,196 | 3.41% | ||
| Q1: 2006 | 159,478 | 4,307 | (1,358) | - | 162,427 |
| 167,708 | 2,437 | 5.81% | ||
| Q2: 2006 | 137,361 | 3,755 | (1,238) | - | 139,878 |
| 147,115 | 2,137 | 5.81% | ||
|
|
|
|
|
|
|
|
|
|
|
| |
Commercial Real Estate Loans |
| Q2: 2004 | 43,448 | (1,261) | (8,641) | - | 33,546 |
| 26,129 | 868 | 13.29% | |
| Q3: 2004 | 43,410 | (1,380) | (8,641) | - | 33,389 |
| 33,461 | 1,038 | 12.41% | ||
| Q4: 2004 | 65,598 | (2,478) | (8,641) | - | 54,479 |
| 39,836 | 1,162 | 11.67% | ||
| 2004 | 65,598 | (2,478) | (8,641) | - | 54,479 |
| 30,469 | 3,769 | 12.37% | ||
| Q1: 2005 | 67,365 | (2,305) | (8,456) | - | 56,604 |
| 56,080 | 1,587 | 11.32% | ||
| Q2: 2005 | 51,778 | (1,843) | (8,141) | - | 41,794 |
| 45,214 | 1,208 | 10.69% | ||
| Q3: 2005 | 66,348 | (2,105) | (8,141) | - | 56,102 |
| 47,703 | 1,209 | 10.14% | ||
| Q4: 2005 | 70,091 | (2,258) | (8,141) | - | 59,692 |
| 59,049 | 1,281 | 8.68% | ||
| 2005 | 70,091 | (2,258) | (8,141) | - | 59,692 |
| 52,008 | 5,285 | 10.16% | ||
| Q1: 2006 | 65,508 | (2,200) | (8,141) | - | 55,167 |
| 56,777 | 1,238 | 8.72% | ||
| Q2: 2006 | 46,959 | (2,096) | (8,141) | - | 36,722 |
| 42,912 | 812 | 7.57% | ||
|
|
|
|
|
|
|
|
|
|
|
| |
|
|
|
|
|
|
|
|
|
|
|
| |
Residential Credit Enhanced Portfolio |
| Q2: 2004 | 712,908 | (121,808) | (235,535) | 86,674 | 442,239 |
| 317,235 | 16,077 | 20.27% | |
| Q3: 2004 | 830,524 | (109,367) | (298,925) | 74,577 | 496,809 |
| 368,887 | 16,007 | 17.36% | ||
| Q4: 2004 | 933,772 | (108,141) | (342,706) | 78,733 | 561,658 |
| 424,879 | 16,985 | 15.99% | ||
| 2004 | 933,772 | (108,141) | (342,706) | 78,733 | 561,658 |
| 349,779 | 64,602 | 18.47% | ||
| Q1: 2005 | 978,878 | (89,405) | (365,998) | 87,919 | 611,394 |
| 493,412 | 19,624 | 15.91% | ||
| Q2: 2005 | 1,103,737 | (96,488) | (404,180) | 103,126 | 706,195 |
| 550,460 | 19,439 | 14.13% | ||
| Q3: 2005 | 1,052,813 | (89,429) | (382,862) | 84,279 | 664,801 |
| 585,663 | 24,368 | 16.64% | ||
| Q4: 2005 | 1,035,874 | (126,811) | (354,610) | 58,196 | 612,649 |
| 534,420 | 23,133 | 17.31% | ||
| 2005 | 1,035,874 | (126,811) | (354,610) | 58,196 | 612,649 |
| 541,224 | 86,564 | 15.99% | ||
| Q1: 2006 | 1,087,135 | (118,990) | (373,781) | 49,459 | 643,823 |
| 560,191 | 27,748 | 19.81% | ||
| Q2: 2006 | 1,210,437 | (125,274) | (425,578) | 55,775 | 715,360 |
| 610,046 | 29,449 | 19.31% | ||
|
|
|
|
|
|
|
|
|
|
|
| |
Securities Portfolio |
| Q2: 2004 | 1,089,254 | (650) | - | 4,770 | 1,093,374 |
| 978,014 | 10,484 | 4.29% | |
| Q3: 2004 | 1,215,847 | (1,466) | - | 15,555 | 1,229,936 |
| 1,141,456 | 12,932 | 4.53% | ||
| Q4: 2004 | 1,378,924 | (13,895) | - | 15,048 | 1,380,077 |
| 1,267,692 | 15,282 | 4.82% | ||
| 2004 | 1,378,924 | (13,895) | - | 15,048 | 1,380,077 |
| 1,062,901 | 48,274 | 4.54% | ||
| Q1: 2005 | 1,522,345 | (28,534) | - | 11,566 | 1,505,377 |
| 1,423,487 | 18,074 | 5.08% | ||
| Q2: 2005 | 1,656,177 | (32,874) | - | 25,535 | 1,648,838 |
| 1,548,085 | 19,910 | 5.14% | ||
| Q3: 2005 | 1,818,295 | (47,048) | - | 12,182 | 1,783,429 |
| 1,687,506 | 23,990 | 5.69% | ||
| Q4: 2005 | 1,810,146 | (55,235) | - | (6,330) | 1,748,581 |
| 1,743,808 | 26,316 | 6.04% | ||
| 2005 | 1,810,146 | (55,235) | - | (6,330) | 1,748,581 |
| 1,601,837 | 88,290 | 5.51% | ||
| Q1: 2006 | 1,885,075 | (60,429) | - | (7,018) | 1,817,628 |
| 1,769,502 | 27,765 | 6.28% | ||
| Q2: 2006 | 1,960,878 | (80,256) | - | (10,621) | 1,870,001 |
| 1,827,690 | 29,298 | 6.41% | ||
|
|
|
|
|
|
|
|
|
|
|
| |
Commercial Loan Credit-Enhancement Securities |
| Q2: 2004 | 8,175 | 2,084 | (8,175) | 10 | 2,094 |
| 2,075 | 61 | 11.76% | |
| Q3: 2004 | 26,930 | 8,456 | (26,930) | 686 | 9,142 |
| 7,372 | 346 | 18.77% | ||
| Q4: 2004 | 45,639 | 12,883 | (45,639) | 1,615 | 14,498 |
| 10,836 | 233 | 8.60% | ||
| 2004 | 45,639 | 12,883 | (45,639) | 1,615 | 14,498 |
| 5,261 | 675 | 12.83% | ||
| Q1: 2005 | 88,671 | 25,344 | (88,671) | 3,226 | 28,570 |
| 19,255 | 356 | 7.40% | ||
| Q2: 2005 | 87,210 | 24,847 | (87,210) | 4,549 | 29,396 |
| 25,085 | 881 | 14.05% | ||
| Q3: 2005 | 138,530 | 41,127 | (138,530) | 2,413 | 43,540 |
| 32,192 | 453 | 5.63% | ||
| Q4: 2005 | 175,343 | 19,474 | (141,806) | 4,676 | 57,687 |
| 44,109 | 923 | 8.37% | ||
| 2005 | 175,343 | 19,474 | (141,806) | 4,676 | 57,687 |
| 30,234 | 2,613 | 8.64% | ||
| Q1: 2006 | 198,681 | 27,700 | (167,772) | 8,039 | 66,648 |
| 56,800 | 989 | 5.34% | ||
| Q2: 2006 | 222,160 | 34,365 | (192,134) | 11,498 | 75,889 |
| 65,190 | 1,648 | 10.11% | ||
|
|
|
|
|
|
|
|
|
|
|
| |
Cash & Equivalents |
| Q2: 2004 | 38,461 | - | - | - | 38,461 |
| 81,450 | 73 |
| |
| Q3: 2004 | 76,006 | - | - | - | 76,006 |
| 101,938 | 175 |
| ||
| Q4: 2004 | 57,246 | - | - | - | 57,246 |
| 126,556 | 508 |
| ||
| 2004 | 57,246 | - | - | - | 57,246 |
| 95,251 | 922 |
| ||
| Q1: 2005 | 64,714 | - | - | - | 64,714 |
| 124,685 | 580 |
| ||
| Q2: 2005 | 72,193 | - | - | - | 72,193 |
| 124,707 | 804 |
| ||
| Q3: 2005 | 163,160 | - | - | - | 163,160 |
| 134,422 | 990 |
| ||
| Q4: 2005 | 175,885 | - | - | - | 175,885 |
| 339,379 | 2,830 |
| ||
| 2005 | 175,885 | - | - | - | 175,885 |
| 181,259 | 5,204 |
| ||
| Q1: 2006 | 85,466 | - | - | - | 85,466 |
| 244,002 | 2,477 |
| ||
| Q2: 2006 | 106,491 | - | - | - | 106,491 |
| 246,597 | 2,871 |
| ||
Table 11: Portfolio Activity (all $ in thousands) | |||||||||||
|
|
|
|
|
|
|
|
|
|
| |
|
|
| Acquisitions | Sales to Third Parties | Principal Payments | Discount / (Premium) Amortization | Credit Provision | Net Charge-offs / (Recoveries) | Net Mark-to-Market Adjustment | Net Increase / (Decrease) | |
|
|
|
|
|
|
|
|
|
|
| |
Residential Real Estate Loans (GAAP) |
| Q2: 2004 | $2,703,443 | $- | ($859,148) | ($13,992) | ($1,233) | $- | $- | $1,829,070 | |
| Q3: 2004 | 2,898,165 | (112,811) | (1,144,320) | 2,078 | (1,264) | - | 489 | 1,642,337 | ||
| Q4: 2004 | 1,791,951 | (865) | (1,132,854) | (5,993) | (1,535) | 176 | (375) | 650,505 | ||
| 2004 | 9,715,265 | (113,676) | (3,596,656) | (29,423) | (6,543) | 176 | 114 | 5,969,257 | ||
| Q1: 2005 | 832,383 | - | (1,539,387) | (7,036) | (1,307) | 154 | - | (715,193) | ||
| Q2: 2005 | 426,806 | (3,378) | (2,526,236) | (8,937) | 1,494 | (34) | 254 | (2,110,031) | ||
| Q3: 2005 | 332,049 | (263,079) | (3,098,691) | (13,479) | 1,315 | 90 | (218) | (3,042,013) | ||
| Q4: 2005 | 271,742 | (240,987) | (2,665,727) | (12,544) | (128) | 250 | 48 | (2,647,346) | ||
| 2005 | 1,862,980 | (507,444) | (9,830,041) | (41,996) | 1,374 | 460 | 84 | (8,514,583) | ||
| Q1: 2006 | 52,691 | - | (1,907,114) | (11,475) | (463) | 317 | - | (1,866,044) | ||
| Q2: 2006 | 272,627 | - | (1,777,284) | (11,521) | 2,379 | 423 | - | (1,513,376) | ||
|
|
|
|
|
|
|
|
|
|
| |
Home Equity Line of Credit |
| Q2: 2004 | 335,044 | - | (7,706) | (250) | (267) | - | - | 326,821 | |
| Q3: 2004 | - | - | (8,290) | (1,072) | (264) | - | - | (9,626) | ||
| Q4: 2004 | - | - | (19,743) | (942) | (162) | - | - | (20,847) | ||
| 2004 | 335,044 | - | (35,739) | (2,264) | (693) | - | - | 296,348 | ||
| Q1: 2005 | - | - | (16,365) | (608) | 97 | - | - | (16,876) | ||
| Q2: 2005 | 127 | - | (31,439) | (821) | 33 | - | - | (32,100) | ||
| Q3: 2005 | - | - | (30,801) | (959) | (510) | 35 | - | (32,235) | ||
| Q4: 2005 | 133 | - | (32,773) | (790) | (749) | - | - | (34,179) | ||
| 2005 | 260 | - | (111,378) | (3,178) | (1,129) | 35 | - | (115,390) | ||
| Q1: 2006 | - | - | (18,361) | (600) | 322 | 108 | - | (18,531) | ||
| Q2: 2006 | - | - | (22,117) | (552) | 128 | (8) | - | (22,549) | ||
|
|
|
|
|
|
|
|
|
|
| |
Commercial Real Estate Loans |
| Q2: 2004 | 17,066 | (2,339) | (3,233) | (102) | - | - | (23) | 11,369 | |
| Q3: 2004 | - | - | (29) | (128) | - | - | - | (157) | ||
| Q4: 2004 | 21,305 | - | (83) | (132) | - | - | - | 21,090 | ||
| 2004 | 38,371 | (2,339) | (3,390) | (484) | - | - | (98) | 32,060 | ||
| Q1: 2005 | 6,732 | - | (5,267) | (30) | 185 | - | 505 | 2,125 | ||
| Q2: 2005 | - | (11,192) | (3,769) | (99) | - | - | 250 | (14,810) | ||
| Q3: 2005 | 14,219 | (17) | 158 | (69) | - | - | 17 | 14,308 | ||
| Q4: 2005 | 4,248 | - | (506) | (152) | - | - | - | 3,590 | ||
| 2005 | 25,199 | (11,209) | (9,384) | (350) | 185 | - | 772 | 5,213 | ||
| Q1: 2006 | - | - | (4,583) | 93 | (35) | - | - | (4,525) | ||
| Q2: 2006 | - | (8,408) | (10,049) | 27 | - | - | (14) | (18,445) | ||
|
|
|
|
|
|
|
|
|
|
| |
Residential Credit Enhanced Portfolio |
| Q2: 2004 | 75,027 | - | (46,997) | 8,847 | - | - | 30,746 | 67,623 | |
| Q3: 2004 | 82,918 | - | (44,822) | 8,181 | - | - | 8,293 | 54,570 | ||
| Q4: 2004 | 72,976 | - | (30,900) | 8,443 | - | - | 14,330 | 64,849 | ||
| 2004 | 268,529 | (22,416) | (157,359) | 34,108 | - | - | 60,069 | 182,931 | ||
| Q1: 2005 | 67,809 | (27,293) | (23,932) | 8,727 | - | - | 24,425 | 49,736 | ||
| Q2: 2005 | 87,849 | - | (20,400) | 7,775 | - | - | 19,577 | 94,801 | ||
| Q3: 2005 | 57,481 | (98,775) | (18,403) | 11,193 | - | - | 7,110 | (41,394) | ||
| Q4: 2005 | 54,664 | (81,292) | (22,468) | 10,456 | - | - | (13,512) | (52,152) | ||
| 2005 | 267,803 | (207,360) | (85,203) | 38,151 | - | - | 37,600 | 50,991 | ||
| Q1: 2006 | 52,822 | (9,650) | (17,469) | 13,155 | - | - | (7,684) | 31,174 | ||
| Q2: 2006 | 89,217 | (10,317) | (28,102) | 12,410 | - | - | 8,329 | 71,537 | ||
|
|
|
|
|
|
|
|
|
|
| |
Securities Portfolio |
| Q2: 2004 | 192,626 | (8,333) | (10,069) | (663) | - | - | (14,686) | 158,875 | |
| Q3: 2004 | 144,753 | - | (18,489) | (146) | - | - | 10,444 | 136,562 | ||
| Q4: 2004 | 176,341 | - | (25,189) | 39 | - | - | (1,050) | 150,141 | ||
| 2004 | 597,945 | (8,475) | (63,554) | (1,254) | - | - | 10,701 | 535,363 | ||
| Q1: 2005 | 168,337 | (12,362) | (27,070) | 115 | - | - | (3,720) | 125,300 | ||
| Q2: 2005 | 156,182 | (3,012) | (22,333) | 151 | - | - | 12,472 | 143,460 | ||
| Q3: 2005 | 190,160 | - | (41,618) | 566 | - | - | (14,517) | 134,591 | ||
| Q4: 2005 | 169,736 | (151,620) | (38,005) | 907 | - | - | (15,865) | (34,847) | ||
| 2005 | 684,415 | (166,994) | (129,026) | 1,739 | - | - | (21,630) | 368,504 | ||
| Q1: 2006 | 103,866 | (3,984) | (27,614) | 650 | - | - | (3,871) | 69,047 | ||
| Q2: 2006 | 235,881 | (152,481) | (28,618) | 1,471 | - | - | (3,880) | 52,373 | ||
|
|
|
|
|
|
|
|
|
|
| |
Commercial Loan Credit-Enhancement Securities |
| Q2: 2004 | 74 | - | - | (42) | - | - | (85) | (53) | |
| Q3: 2004 | 6,311 | - | - | 60 | - | - | 677 | 7,048 | ||
| Q4: 2004 | 4,770 | - | - | (343) | - | - | 929 | 5,356 | ||
| 2004 | 11,155 | - | - | (325) | - | - | 1,521 | 12,351 | ||
| Q1: 2005 | 12,870 | - | - | (409) | - | - | 1,611 | 14,072 | ||
| Q2: 2005 | - | - | - | (346) | - | - | 1,173 | 827 | ||
| Q3: 2005 | 17,182 | - | - | (902) | - | - | (2,136) | 14,144 | ||
| Q4: 2005 | 13,028 | - | - | (904) | - | - | 2,022 | 14,146 | ||
| 2005 | 43,080 | - | - | (2,561) | - | - | 2,670 | 43,189 | ||
| Q1: 2006 | 6,911 | - | - | (1,276) | - | - | 3,326 | 8,961 | ||
| Q2: 2006 | 8,125 | - | - | (1,091) | - | - | 2,207 | 9,241 | ||
Table 12: Residential Credit Results (in thousands) | ||||||||||||||
|
|
|
|
|
|
|
|
|
|
|
|
|
| |
|
|
| Underlying Loans | Internally-Designated Credit Reserve | External Credit Enhancement | Total Credit Protection (1) | Total Credit Protection as % of Loans | Seriously Delinquent Loans | Seriously Delinquent Loan % | Total Credit Losses | Losses To Securities Junior to Redwood's Interest | Redwood's Share of Net Charge-offs/(Recoveries) | Total Credit Losses As % of Loans (Annualized) | |
|
|
|
|
|
|
|
|
|
|
|
|
|
| |
Total Managed |
| Q2: 2004 | $116,871,703 | $255,615 | $70,460 | $326,075 | 0.28% | $136,654 | 0.12% | $1,781 | $75 | $1,706 | <0.01% | |
Resi Portfolio |
| Q3: 2004 | 142,967,137 | 320,269 | 69,244 | 389,513 | 0.27% | 185,023 | 0.13% | 730 | 196 | 534 | <0.01% | |
|
| Q4: 2004 | 148,510,685 | 365,784 | 67,650 | 433,434 | 0.29% | 163,554 | 0.11% | 689 | - | 689 | <0.01% | |
|
| 2004 | 148,510,685 | 365,784 | 67,650 | 433,434 | 0.29% | 163,554 | 0.11% | 3,303 | 271 | 3,032 | <0.01% | |
|
| Q1: 2005 | 151,434,189 | 390,229 | 92,467 | 482,696 | 0.32% | 217,159 | 0.14% | 1,377 | - | 1,377 | <0.01% | |
|
| Q2: 2005 | 183,248,239 | 426,576 | 141,970 | 568,546 | 0.31% | 245,399 | 0.13% | 740 | 196 | 544 | <0.01% | |
|
| Q3: 2005 | 195,243,546 | 403,853 | 134,967 | 538,820 | 0.28% | 282,850 | 0.14% | 1,812 | 220 | 1,592 | <0.01% | |
|
| Q4: 2005 | 183,727,043 | 375,478 | 140,907 | 516,385 | 0.28% | 368,521 | 0.20% | 1,175 | - | 1,175 | <0.01% | |
|
| 2005 | 183,727,043 | 375,478 | 140,907 | 516,385 | 0.28% | 368,521 | 0.20% | 5,104 | 416 | 4,688 | <0.01% | |
|
| Q1: 2006 | 192,386,213 | 394,795 | 128,015 | 522,810 | 0.27% | 474,871 | 0.25% | 3,002 | - | 3,002 | <0.01% | |
|
| Q2: 2006 | 222,869,550 | 443,790 | 127,372 | 571,161 | 0.26% | 466,898 | 0.21% | 1,464 | - | 1,464 | <0.01% | |
|
|
|
|
|
|
|
|
|
|
|
|
|
| |
Residential Real |
| Q2: 2004 | 19,766,481 | 20,080 | - | 20,080 | 0.10% | 5,362 | 0.03% | - | - | - | 0.00% | |
Estate Loans |
| Q3: 2004 | 21,381,784 | 21,344 | - | 21,344 | 0.10% | 10,785 | 0.05% | - | - | - | 0.00% | |
|
| Q4: 2004 | 22,023,888 | 23,078 | - | 23,078 | 0.10% | 13,338 | 0.06% | 176 | - | 176 | <0.01% | |
|
| 2004 | 22,023,888 | 23,078 | - | 23,078 | 0.10% | 13,338 | 0.06% | 176 | - | 176 | <0.01% | |
|
| Q1: 2005 | 21,307,080 | 24,231 | - | 24,231 | 0.11% | 16,066 | 0.08% | 154 | - | 154 | <0.01% | |
|
| Q2: 2005 | 19,202,109 | 22,396 | - | 22,396 | 0.12% | 16,514 | 0.09% | (34) | - | (34) | 0.00% | |
|
| Q3: 2005 | 16,176,357 | 20,991 | - | 20,991 | 0.13% | 22,956 | 0.14% | 90 | - | 90 | <0.01% | |
|
| Q4: 2005 | 13,541,402 | 20,868 | - | 20,868 | 0.15% | 37,335 | 0.28% | 251 | - | 251 | <0.01% | |
|
| 2005 | 13,541,402 | 20,868 | - | 20,868 | 0.15% | 37,335 | 0.28% | 461 | - | 461 | <0.01% | |
|
| Q1: 2006 | 11,686,976 | 21,014 | - | 21,014 | 0.18% | 48,677 | 0.42% | 425 | - | 425 | <0.01% | |
|
| Q2: 2006 | 10,181,280 | 18,212 | - | 18,212 | 0.18% | 47,162 | 0.46% | 423 | - | 423 | <0.01% | |
|
|
|
|
|
|
|
|
|
|
|
|
|
| |
Residential Loan |
| Q2: 2004 | 97,105,222 | 235,535 | 70,460 | 305,995 | 0.32% | 131,292 | 0.14% | 1,781 | 75 | 1,706 | <0.01% | |
CES |
| Q3: 2004 | 121,585,353 | 298,925 | 69,244 | 368,169 | 0.30% | 174,238 | 0.14% | 730 | 196 | 534 | <0.01% | |
|
| Q4: 2004 | 126,486,797 | 342,706 | 67,650 | 410,356 | 0.32% | 150,216 | 0.12% | 513 | - | 513 | <0.01% | |
|
| 2004 | 126,486,797 | 342,706 | 67,650 | 410,356 | 0.32% | 150,216 | 0.12% | 3,127 | 271 | 2,856 | <0.01% | |
|
| Q1: 2005 | 130,127,109 | 365,998 | 92,467 | 458,465 | 0.35% | 201,093 | 0.15% | 1,223 | - | 1,223 | <0.01% | |
|
| Q2: 2005 | 164,046,130 | 404,180 | 141,970 | 546,150 | 0.33% | 228,885 | 0.14% | 774 | 196 | 578 | <0.01% | |
|
| Q3: 2005 | 179,067,189 | 382,862 | 134,967 | 517,829 | 0.29% | 259,894 | 0.15% | 1,722 | 220 | 1,502 | <0.01% | |
|
| Q4: 2005 | 170,185,641 | 354,610 | 140,907 | 495,517 | 0.29% | 331,186 | 0.19% | 924 | - | 924 | <0.01% | |
|
| 2005 | 170,185,641 | 354,610 | 140,907 | 495,517 | 0.29% | 331,186 | 0.19% | 4,643 | 416 | 4,227 | <0.01% | |
|
| Q1: 2006 | 180,699,237 | 373,781 | 128,015 | 501,796 | 0.28% | 426,194 | 0.24% | 2,577 | - | 2,577 | <0.01% | |
|
| Q2: 2006 | 212,688,271 | 425,578 | 127,372 | 552,949 | 0.26% | 419,736 | 0.20% | 1,041 | - | 1,041 | <0.01% | |
|
|
|
|
|
|
|
|
|
|
|
|
|
| |
|
|
|
|
|
|
|
|
|
|
|
|
|
| |
|
|
|
|
|
|
|
|
|
|
|
|
|
| |
|
|
|
|
|
|
|
|
|
|
|
|
|
| |
|
Table
13: Residential Real Estate Loan & Credit Enhanced Securities
Characteristics (at period end, in
thousands)
|
|
|
|
|
|
|
|
|
|
|
|
|||||||||||||||||||
|
|
Jun.
2006
|
Mar.
2006
|
Dec.
2005
|
Sept.
2005
|
Jun.
2005
|
Mar.
2005
|
Dec.
2004
|
Sep.
2004
|
Jun.
2004
|
|||||||||||||||||||
|
Residential
Loans
|
$
|
222,869,550
|
$
|
192,386,213
|
$
|
183,727,043
|
$
|
195,243,546
|
$
|
183,248,239
|
$
|
151,434,189
|
$
|
148,510,685
|
$
|
142,967,137
|
$
|
116,871,703
|
||||||||||
|
Number
of loans
|
629,575
|
551,910
|
542,333
|
575,626
|
549,166
|
405,987
|
395,367
|
342,403
|
278,404
|
|||||||||||||||||||
|
Average
loan size
|
354
|
349
|
$
|
339
|
$
|
339
|
$
|
334
|
$
|
373
|
$
|
376
|
$
|
418
|
$
|
420
|
||||||||||||
|
|
||||||||||||||||||||||||||||
|
Adjustable
%
|
8
|
%
|
11
|
%
|
13
|
%
|
15
|
%
|
17
|
%
|
22
|
%
|
22
|
%
|
22
|
%
|
24
|
%
|
||||||||||
|
Negatively
Amortizing %
|
23
|
%
|
22
|
%
|
22
|
%
|
17
|
%
|
16
|
%
|
15
|
%
|
14
|
%
|
12
|
%
|
10
|
%
|
||||||||||
|
Hybrid
%
|
36
|
%
|
33
|
%
|
30
|
%
|
29
|
%
|
26
|
%
|
24
|
%
|
24
|
%
|
25
|
%
|
27
|
%
|
||||||||||
|
Fixed
%
|
33
|
%
|
34
|
%
|
36
|
%
|
39
|
%
|
40
|
%
|
39
|
%
|
39
|
%
|
42
|
%
|
39
|
%
|
||||||||||
|
|
||||||||||||||||||||||||||||
|
Interest
Only %
|
28
|
%
|
26
|
%
|
30
|
%
|
30
|
%
|
31
|
%
|
35
|
%
|
35
|
%
|
35
|
%
|
37
|
%
|
||||||||||
|
|
||||||||||||||||||||||||||||
|
Southern
California
|
25
|
%
|
24
|
%
|
24
|
%
|
23
|
%
|
23
|
%
|
21
|
%
|
21
|
%
|
22
|
%
|
21
|
%
|
||||||||||
|
Northern
California
|
22
|
%
|
22
|
%
|
20
|
%
|
19
|
%
|
19
|
%
|
19
|
%
|
18
|
%
|
20
|
%
|
20
|
%
|
||||||||||
|
Florida
|
6
|
%
|
6
|
%
|
6
|
%
|
6
|
%
|
6
|
%
|
6
|
%
|
7
|
%
|
6
|
%
|
6
|
%
|
||||||||||
|
New
York
|
5
|
%
|
5
|
%
|
5
|
%
|
5
|
%
|
5
|
%
|
5
|
%
|
5
|
%
|
5
|
%
|
5
|
%
|
||||||||||
|
Virginia
|
4
|
%
|
4
|
%
|
4
|
%
|
4
|
%
|
4
|
%
|
4
|
%
|
4
|
%
|
4
|
%
|
4
|
%
|
||||||||||
|
New
Jersey
|
3
|
%
|
3
|
%
|
3
|
%
|
4
|
%
|
4
|
%
|
4
|
%
|
4
|
%
|
4
|
%
|
4
|
%
|
||||||||||
|
Texas
|
3
|
%
|
3
|
%
|
3
|
%
|
3
|
%
|
3
|
%
|
3
|
%
|
3
|
%
|
3
|
%
|
3
|
%
|
||||||||||
|
Illinois
|
3
|
%
|
3
|
%
|
3
|
%
|
3
|
%
|
3
|
%
|
3
|
%
|
3
|
%
|
3
|
%
|
2
|
%
|
||||||||||
|
Other
states (none greater than 3%)
|
30
|
%
|
29
|
%
|
31
|
%
|
33
|
%
|
34
|
%
|
35
|
%
|
36
|
%
|
34
|
%
|
34
|
%
|
||||||||||
|
|
||||||||||||||||||||||||||||
|
Year
2006 origination
|
9
|
%
|
1
|
%
|
0
|
%
|
0
|
%
|
0
|
%
|
0
|
%
|
0
|
%
|
0
|
%
|
0
|
%
|
||||||||||
|
Year
2005 origination
|
27
|
%
|
27
|
%
|
23
|
%
|
14
|
%
|
13
|
%
|
6
|
%
|
0
|
%
|
0
|
%
|
0
|
%
|
||||||||||
|
Year
2004 origination
|
26
|
%
|
29
|
%
|
35
|
%
|
41
|
%
|
49
|
%
|
52
|
%
|
52
|
%
|
48
|
%
|
36
|
%
|
||||||||||
|
Year
2003 origination
|
27
|
%
|
31
|
%
|
33
|
%
|
35
|
%
|
28
|
%
|
31
|
%
|
33
|
%
|
37
|
%
|
45
|
%
|
||||||||||
|
Year
2002 origination
|
6
|
%
|
7
|
%
|
7
|
%
|
7
|
%
|
6
|
%
|
7
|
%
|
8
|
%
|
9
|
%
|
11
|
%
|
||||||||||
|
Year
2001 origination or earlier
|
5
|
%
|
5
|
%
|
3
|
%
|
3
|
%
|
4
|
%
|
5
|
%
|
6
|
%
|
6
|
%
|
7
|
%
|
||||||||||
|
|
||||||||||||||||||||||||||||
|
Wtg
Avg Original LTV
|
||||||||||||||||||||||||||||
|
Original
LTV: 0% - 20%
|
1
|
%
|
1
|
%
|
1
|
%
|
1
|
%
|
0
|
%
|
0
|
%
|
0
|
%
|
0
|
%
|
0
|
%
|
||||||||||
|
Original
LTV: 20% - 30%
|
2
|
%
|
2
|
%
|
2
|
%
|
2
|
%
|
2
|
%
|
2
|
%
|
2
|
%
|
2
|
%
|
2
|
%
|
||||||||||
|
Original
LTV: 30% - 40%
|
3
|
%
|
3
|
%
|
3
|
%
|
3
|
%
|
3
|
%
|
3
|
%
|
3
|
%
|
3
|
%
|
3
|
%
|
||||||||||
|
Original
LTV: 40% - 50%
|
7
|
%
|
7
|
%
|
8
|
%
|
8
|
%
|
8
|
%
|
8
|
%
|
8
|
%
|
8
|
%
|
8
|
%
|
||||||||||
|
Original
LTV: 50% - 60%
|
12
|
%
|
12
|
%
|
12
|
%
|
12
|
%
|
12
|
%
|
12
|
%
|
12
|
%
|
13
|
%
|
13
|
%
|
||||||||||
|
Original
LTV: 60% - 70%
|
22
|
%
|
22
|
%
|
22
|
%
|
22
|
%
|
23
|
%
|
23
|
%
|
23
|
%
|
23
|
%
|
23
|
%
|
||||||||||
|
Original
LTV: 70% - 75%
|
15
|
%
|
15
|
%
|
15
|
%
|
15
|
%
|
15
|
%
|
15
|
%
|
15
|
%
|
15
|
%
|
15
|
%
|
||||||||||
|
Original
LTV: 75% - 80%
|
34
|
%
|
33
|
%
|
34
|
%
|
34
|
%
|
33
|
%
|
33
|
%
|
33
|
%
|
33
|
%
|
32
|
%
|
||||||||||
|
Original
LTV: 80% - 90%
|
3
|
%
|
3
|
%
|
2
|
%
|
2
|
%
|
3
|
%
|
3
|
%
|
3
|
%
|
2
|
%
|
2
|
%
|
||||||||||
|
Original
LTV: 90% - 100%
|
1
|
%
|
2
|
%
|
1
|
%
|
1
|
%
|
2
|
%
|
2
|
%
|
2
|
%
|
2
|
%
|
2
|
%
|
||||||||||
|
|
||||||||||||||||||||||||||||
|
Wtg
Avg FICO
|
||||||||||||||||||||||||||||
|
FICO:
<= 600
|
1
|
%
|
1
|
%
|
0
|
%
|
0
|
%
|
0
|
%
|
0
|
%
|
0
|
%
|
0
|
%
|
0
|
%
|
||||||||||
|
FICO:
601 -620
|
1
|
%
|
1
|
%
|
1
|
%
|
0
|
%
|
0
|
%
|
0
|
%
|
0
|
%
|
0
|
%
|
0
|
%
|
||||||||||
|
FICO:
621 - 640
|
2
|
%
|
2
|
%
|
2
|
%
|
2
|
%
|
2
|
%
|
2
|
%
|
2
|
%
|
2
|
%
|
2
|
%
|
||||||||||
|
FICO:
641 -660
|
4
|
%
|
4
|
%
|
4
|
%
|
4
|
%
|
4
|
%
|
4
|
%
|
4
|
%
|
4
|
%
|
3
|
%
|
||||||||||
|
FICO:
661 - 680
|
7
|
%
|
7
|
%
|
7
|
%
|
7
|
%
|
7
|
%
|
7
|
%
|
7
|
%
|
7
|
%
|
7
|
%
|
||||||||||
|
FICO:
681 - 700
|
11
|
%
|
11
|
%
|
11
|
%
|
11
|
%
|
11
|
%
|
11
|
%
|
11
|
%
|
11
|
%
|
11
|
%
|
||||||||||
|
FICO:
701 - 720
|
13
|
%
|
13
|
%
|
13
|
%
|
13
|
%
|
13
|
%
|
13
|
%
|
13
|
%
|
13
|
%
|
13
|
%
|
||||||||||
|
FICO:
721 - 740
|
13
|
%
|
14
|
%
|
13
|
%
|
14
|
%
|
14
|
%
|
14
|
%
|
14
|
%
|
14
|
%
|
14
|
%
|
||||||||||
|
FICO:
741 - 760
|
15
|
%
|
15
|
%
|
15
|
%
|
15
|
%
|
15
|
%
|
16
|
%
|
16
|
%
|
16
|
%
|
16
|
%
|
||||||||||
|
FICO:
761 - 780
|
16
|
%
|
16
|
%
|
17
|
%
|
17
|
%
|
17
|
%
|
17
|
%
|
17
|
%
|
18
|
%
|
17
|
%
|
||||||||||
|
FICO:
781 - 800
|
12
|
%
|
12
|
%
|
12
|
%
|
12
|
%
|
12
|
%
|
11
|
%
|
11
|
%
|
11
|
%
|
11
|
%
|
||||||||||
|
FICO:
>= 801
|
3
|
%
|
3
|
%
|
3
|
%
|
3
|
%
|
3
|
%
|
2
|
%
|
2
|
%
|
2
|
%
|
2
|
%
|
||||||||||
|
Unknown
|
3
|
%
|
3
|
%
|
2
|
%
|
2
|
%
|
1
|
%
|
2
|
%
|
2
|
%
|
2
|
%
|
2
|
%
|
||||||||||
|
|
||||||||||||||||||||||||||||
|
Conforming
at Origination %
|
35
|
%
|
26
|
%
|
26
|
%
|
24
|
%
|
24
|
%
|
22
|
%
|
20
|
%
|
18
|
%
|
20
|
%
|
||||||||||
|
%
balance in loans > $1mm per loan
|
9
|
%
|
8
|
%
|
8
|
%
|
7
|
%
|
7
|
%
|
7
|
%
|
6
|
%
|
7
|
%
|
8
|
%
|
||||||||||
|
|
||||||||||||||||||||||||||||
|
2nd
Home %
|
6
|
%
|
6
|
%
|
6
|
%
|
6
|
%
|
6
|
%
|
6
|
%
|
6
|
%
|
6
|
%
|
7
|
%
|
||||||||||
|
Investment
Home %
|
3
|
%
|
3
|
%
|
3
|
%
|
2
|
%
|
3
|
%
|
2
|
%
|
2
|
%
|
2
|
%
|
2
|
%
|
||||||||||
|
|
||||||||||||||||||||||||||||
|
Purchase
|
39
|
%
|
36
|
%
|
36
|
%
|
36
|
%
|
35
|
%
|
35
|
%
|
34
|
%
|
33
|
%
|
32
|
%
|
||||||||||
|
Cash
Out Refi
|
30
|
%
|
29
|
%
|
30
|
%
|
28
|
%
|
27
|
%
|
27
|
%
|
27
|
%
|
25
|
%
|
25
|
%
|
||||||||||
|
Rate-Term
Refi
|
31
|
%
|
34
|
%
|
34
|
%
|
36
|
%
|
37
|
%
|
37
|
%
|
38
|
%
|
42
|
%
|
42
|
%
|
||||||||||
|
Construction
|
0
|
%
|
0
|
%
|
0
|
%
|
0
|
%
|
0
|
%
|
0
|
%
|
0
|
%
|
0
|
%
|
0
|
%
|
||||||||||
|
Other
|
0
|
%
|
0
|
%
|
0
|
%
|
0
|
%
|
1
|
%
|
0
|
%
|
0
|
%
|
0
|
%
|
1
|
%
|
||||||||||
|
|
||||||||||||||||||||||||||||
|
This
table includes residential real estate loans and these are primarily
the
loans securitized by Sequoia securitization entities sponsored by
Redwood
as well as loans underlying residential credit-enhancement securities
by
Redwood.
|
Table 14: Commercial Real Estate Loans -- Characteristics (in thousands) | |||||||||||
|
|
|
|
|
|
|
|
|
|
| |
|
| Q2:2006 | Q1:2006 | Q4:2005 | Q3:2005 | Q2:2005 | Q1:2005 | Q4:2004 | Q3:2004 | Q2:2004 | |
Commercial mortgage loans |
| $36,722 | $55,167 | $59,692 | $56,102 | $41,794 | $56,604 | $54,479 | $33,389 | $33,546 | |
Number of loans |
| 9 | 12 | 13 | 12 | 9 | 12 | 9 | 7 | 6 | |
Average loan size |
| $4,080 | $4,597 | $4,592 | $4,675 | $4,644 | $4,717 | $6,053 | $4,770 | $5,591 | |
Seriously delinquent loans |
| - | - | - | - | - | - | - | - | - | |
Realized credit losses |
| - | - | - | - | - | - | - | - | - | |
California % |
| 6% | 19% | 25% | 28% | 37% | 42% | 44% | 72% | 72% | |
|
|
|
|
|
|
|
|
|
|
| |
Table 15: Commercial Real Estate Loan Credit Results (all $ in thousands) | ||||||||||||||
|
|
|
|
|
|
|
|
|
|
|
|
|
| |
|
|
| Underlying Loans (1) | Internally-Designated Credit Securities | External Credit Enhancement | Total Credit Protection (2) | Total Credit Protection as % of Loans | Seriously Delinquent Loans | Seriously Delinquent Loan % | Total Credit Losses | Losses To Securities Junior to Redwood's Interest | Redwood's Share of Net Charge-offs/ (Recoveries) | Total Credit Losses As % of Loans (Annualized) | |
|
|
|
|
|
|
|
|
|
|
|
|
|
| |
|
|
|
|
|
|
|
|
|
|
|
|
|
| |
Total Managed Commercial Portfolio |
| Q2: 2004 | $1,365,536 | $16,816 | $- | $16,816 | 1.23% | $- | 0.00% | $- | $- | $- | 0.00% | |
| Q3: 2004 | 22,285,400 | 35,571 | 1,655,482 | 1,691,053 | 7.59% | 389,611 | 1.75% | 1,351 | 1,351 | - | 0.02% | ||
| Q4: 2004 | 26,139,083 | 54,280 | 1,633,055 | 1,687,335 | 6.46% | 362,956 | 1.39% | 5,135 | 4,959 | 176 | 0.08% | ||
| 2004 | 26,139,083 | 54,280 | 1,633,055 | 1,687,335 | 6.46% | 362,956 | 1.39% | 6,486 | 6,310 | 176 | 0.02% | ||
| Q1: 2005 | 30,996,417 | 97,127 | 1,610,628 | 1,707,755 | 5.51% | 288,580 | 0.93% | 45,808 | 45,493 | 315 | 0.59% | ||
| Q2: 2005 | 31,293,511 | 95,351 | 1,588,200 | 1,683,551 | 5.38% | 254,503 | 0.81% | 19,651 | 18,221 | 1,430 | 0.25% | ||
| Q3: 2005 | 39,368,505 | 146,671 | 1,565,773 | 1,712,444 | 4.35% | 233,170 | 0.59% | 5,961 | 5,958 | 3 | 0.06% | ||
| Q4: 2005 | 43,018,611 | 149,947 | 1,603,266 | 1,753,213 | 4.08% | 245,598 | 0.57% | 14,450 | 14,482 | (32) | 0.13% | ||
| 2005 | 43,018,611 | 149,947 | 1,603,266 | 1,753,213 | 4.08% | 245,598 | 0.57% | 85,870 | 84,154 | 1,716 | 0.20% | ||
| Q1: 2006 | 44,638,810 | 175,913 | 1,573,585 | 1,749,498 | 3.92% | 242,667 | 0.54% | 5,082 | 5,045 | 37 | 0.05% | ||
| Q2: 2006 | 45,117,374 | 200,275 | 1,583,675 | 1,770,410 | 3.92% | 312,126 | 0.69% | 8,931 | 9,069 | (138) | 0.08% | ||
|
|
|
|
|
|
|
|
|
|
|
|
|
| |
Commercial Real Estate Loans |
| Q2: 2004 | 43,448 | 8,641 | - | 8,641 | 19.89% | - | 0.00% | - | - | - | 0.00% | |
| Q3: 2004 | 43,410 | 8,641 | - | 8,641 | 19.91% | - | 0.00% | - | - | - | 0.00% | ||
| Q4: 2004 | 65,598 | 8,641 | - | 8,641 | 13.17% | - | 0.00% | 176 | - | 176 | 1.07% | ||
| 2004 | 65,598 | 8,641 | - | 8,641 | 13.17% | - | 0.00% | 176 | - | 176 | 0.27% | ||
| Q1: 2005 | 67,365 | 8,456 | - | 8,456 | 12.55% | - | 0.00% | 315 | - | 315 | 1.87% | ||
| Q2: 2005 | 51,778 | 8,141 | - | 8,141 | 15.72% | - | 0.00% | - | - | - | 0.00% | ||
| Q3: 2005 | 66,348 | 8,141 | - | 8,141 | 12.27% | - | 0.00% | - | - | - | 0.00% | ||
| Q4: 2005 | 70,091 | 8,141 | - | 8,141 | 11.61% | - | 0.00% | - | - | - | 0.00% | ||
| 2005 | 70,091 | 8,141 | - | 8,141 | 11.61% | - | 0.00% | 315 | - | 315 | 0.45% | ||
| Q1: 2006 | 65,508 | 8,141 | - | 8,141 | 12.43% | - | 0.00% | 35 | - | 35 | 0.21% | ||
| Q2: 2006 | 46,959 | 8,141 | - | 8,141 | 17.34% | - | 0.00% | - | - | - | 0.00% | ||
|
|
|
|
|
|
|
|
|
|
|
|
|
| |
Commercial Loan Credit-Enhancement Securities (Investment in non-rated securities) |
| Q2: 2004 | 1,322,088 | 8,175 | - | 8,175 | 0.62% | - | 0.00% | - | - | - | 0.00% | |
| Q3: 2004 | 1,319,931 | 8,175 | - | 8,175 | 0.62% | - | 0.00% | - | - | - | 0.00% | ||
| Q4: 2004 | 5,859,585 | 26,884 | - | 26,884 | 0.46% | - | 0.00% | - | - | - | 0.00% | ||
| 2004 | 5,859,585 | 26,884 | - | 26,884 | 0.46% | - | 0.00% | - | - | - | 0.00% | ||
| Q1: 2005 | 11,498,141 | 69,916 | - | 69,916 | 0.61% | 4,937 | 0.04% | - | - | - | 0.00% | ||
| Q2: 2005 | 12,492,337 | 69,916 | - | 69,916 | 0.56% | - | 0.00% | - | - | - | 0.00% | ||
| Q3: 2005 | 20,906,898 | 121,240 | - | 121,240 | 0.58% | 13,109 | 0.06% | - | - | - | 0.00% | ||
| Q4: 2005 | 25,881,564 | 128,266 | - | 128,266 | 0.50% | 17,342 | 0.07% | - | - | - | 0.00% | ||
| 2005 | 25,881,564 | 128,266 | - | 128,266 | 0.50% | 17,342 | 0.07% | - | - | - | 0.00% | ||
| Q1: 2006 | 27,999,540 | 154,232 | - | 154,232 | 0.55% | 22,606 | 0.08% | - | - | - | 0.00% | ||
| Q2: 2006 | 28,876,341 | 178,594 | - | 178,594 | 0.62% | 23,521 | 0.08% | - | - | - | 0.00% | ||
|
|
|
|
|
|
|
|
|
|
|
|
| ||
|
|
|
|
|
|
|
|
|
|
|
|
|
| |
Commercial Loan Credit-Enhancement Securities (Investment in re-REMIC) |
| Q2: 2004 | - | - | - | - | 0.00% | - | 0.00% | - | - | - | 0.00% | |
| Q3: 2004 | 20,922,059 | 18,755 | 1,655,482 | 1,674,237 | 8.00% | 389,611 | 1.86% | 1,351 | 1,351 | - | 0.03% | ||
| Q4: 2004 | 20,213,900 | 18,755 | 1,633,055 | 1,651,810 | 8.17% | 362,956 | 1.80% | 4,959 | 4,959 | - | 0.10% | ||
| 2004 | 20,213,900 | 18,755 | 1,633,055 | 1,651,810 | 8.17% | 362,956 | 1.80% | 6,310 | 6,310 | - | 0.03% | ||
| Q1: 2005 | 19,430,911 | 18,755 | 1,610,628 | 1,629,383 | 8.39% | 283,643 | 1.46% | 45,493 | 45,493 | - | 0.94% | ||
| Q2: 2005 | 18,749,396 | 17,294 | 1,588,200 | 1,605,494 | 8.56% | 254,503 | 1.36% | 19,651 | 18,221 | 1,430 | 0.42% | ||
| Q3: 2005 | 18,395,259 | 17,290 | 1,565,773 | 1,583,063 | 8.61% | 220,061 | 1.20% | 5,961 | 5,958 | 3 | 0.13% | ||
| Q4: 2005 | 17,066,956 | 13,540 | 1,603,266 | 1,616,806 | 9.47% | 228,256 | 1.34% | 14,450 | 14,482 | (32) | 0.34% | ||
| 2005 | 17,066,956 | 13,540 | 1,603,266 | 1,616,806 | 9.47% | 228,256 | 1.34% | 85,555 | 84,154 | 1,401 | 0.50% | ||
| Q1: 2006 | 16,573,762 | 13,540 | 1,573,585 | 1,587,125 | 9.58% | 220,061 | 1.33% | 5,047 | 5,045 | 2 | 0.12% | ||
| Q2: 2006 | 16,194,075 | 13,540 | 1,583,675 | 1,583,675 | 9.78% | 288,605 | 1.78% | 8,931 | 9,069 | (138) | 0.22% | ||
|
|
|
|
|
|
|
|
|
|
|
|
| ||
|
|
|
|
|
|
|
|
|
|
|
|
|
| |
(1) At June 30, 2006, we credit-enhanced $45 billion of commercial loans through our investments in commercial loan credit-enhancement securities. This includes $16 billion of commercial real estate loans credit enhanced through our interests in a CMBS | ||||||||||||||
(2) The credit reserve on commercial real estate loans owned is only available to absorb losses on the commercial real estate loan portfolio. The internally-designated credit reserves on commercial loans credit enhanced and the external credit enhanceme | ||||||||||||||
|
Table
16: Commercial Credit-Enhancement Securities - Underlying Collateral
Characteristics (all $ in
thousands)
|
|
|
Jun.
2006
|
Mar.
2006
|
Dec.
2005
|
Sep.
2005
|
Jun.
2005
|
Mar.
2005
|
Dec.
2004
|
Sep.
2004
|
Jun.
2004
|
|||||||||||||||||||
|
Underlying
Commercial Real Estate Loans
|
$
|
28,876,341
|
$
|
27,999,540
|
$
|
25,881,564
|
$
|
20,906,898
|
$
|
12,492,337
|
$
|
11,498,141
|
$
|
5,859,585
|
$
|
1,319,931
|
$
|
1,322,088
|
||||||||||
|
Number
of credit-enhanced loans
|
2,097
|
1,977
|
1,857
|
1,428
|
801
|
717
|
392
|
93
|
93
|
|||||||||||||||||||
|
Average
loan size
|
$
|
13,770
|
$
|
14,163
|
$
|
13,937
|
$
|
14,640
|
$
|
15,595
|
$
|
16,036
|
$
|
14,948
|
$
|
14,193
|
$
|
14,216
|
||||||||||
|
|
||||||||||||||||||||||||||||
|
|
||||||||||||||||||||||||||||
|
State
Distribution
|
||||||||||||||||||||||||||||
|
CA
|
16
|
%
|
17
|
%
|
16
|
%
|
17
|
%
|
17
|
%
|
17
|
%
|
18
|
%
|
18
|
%
|
18
|
%
|
||||||||||
|
NY
|
14
|
%
|
14
|
%
|
14
|
%
|
14
|
%
|
15
|
%
|
14
|
%
|
10
|
%
|
0
|
%
|
0
|
%
|
||||||||||
|
TX
|
8
|
%
|
8
|
%
|
8
|
%
|
8
|
%
|
10
|
%
|
9
|
%
|
8
|
%
|
6
|
%
|
6
|
%
|
||||||||||
|
FL
|
7
|
%
|
7
|
%
|
7
|
%
|
3
|
%
|
2
|
%
|
2
|
%
|
2
|
%
|
5
|
%
|
5
|
%
|
||||||||||
|
VA
|
4
|
%
|
5
|
%
|
5
|
%
|
4
|
%
|
1
|
%
|
1
|
%
|
2
|
%
|
6
|
%
|
6
|
%
|
||||||||||
|
Other
|
51
|
%
|
49
|
%
|
50
|
%
|
54
|
%
|
55
|
%
|
57
|
%
|
60
|
%
|
65
|
%
|
65
|
%
|
||||||||||
|
|
||||||||||||||||||||||||||||
|
Property
Type Distribution
|
||||||||||||||||||||||||||||
|
Office
|
37
|
%
|
37
|
%
|
37
|
%
|
40
|
%
|
45
|
%
|
44
|
%
|
42
|
%
|
28
|
%
|
28
|
%
|
||||||||||
|
Retail
|
30
|
%
|
30
|
%
|
31
|
%
|
32
|
%
|
34
|
%
|
33
|
%
|
31
|
%
|
41
|
%
|
41
|
%
|
||||||||||
|
Multi-Family
|
13
|
%
|
15
|
%
|
13
|
%
|
11
|
%
|
9
|
%
|
10
|
%
|
12
|
%
|
11
|
%
|
11
|
%
|
||||||||||
|
Hotel
|
7
|
%
|
7
|
%
|
7
|
%
|
6
|
%
|
6
|
%
|
8
|
%
|
6
|
%
|
4
|
%
|
4
|
%
|
||||||||||
|
Self-Storage
|
4
|
%
|
4
|
%
|
4
|
%
|
3
|
%
|
2
|
%
|
2
|
%
|
2
|
%
|
3
|
%
|
3
|
%
|
||||||||||
|
Industrial
|
2
|
%
|
3
|
%
|
2
|
%
|
3
|
%
|
2
|
%
|
1
|
%
|
2
|
%
|
4
|
%
|
4
|
%
|
||||||||||
|
Other
|
6
|
%
|
4
|
%
|
6
|
%
|
5
|
%
|
2
|
%
|
3
|
%
|
4
|
%
|
10
|
%
|
10
|
%
|
||||||||||
|
|
||||||||||||||||||||||||||||
|
Weighted
Average Current LTV
|
69
|
%
|
69
|
%
|
68
|
%
|
69
|
%
|
67
|
%
|
68
|
%
|
67
|
%
|
68
|
%
|
68
|
%
|
||||||||||
|
|
||||||||||||||||||||||||||||
|
Weighted
Average Debt Service Coverage Ratio
|
1.63
|
1.63
|
1.66
|
1.67
|
1.73
|
1.71
|
1.79
|
1.89
|
1.89
|
|||||||||||||||||||
|
|
||||||||||||||||||||||||||||
|
The
information presented above represents collateral information on
our
non-rated commercial CES portfolio, and excludes loans underlying
a
non-rated CES investment in a re-REMIC interest.
|
|
|
|
|
|
|
|
|
|
|
|
|
| Table 17: Securities Portfolio at June 30, 2006 - Characteristics (in thousands) |
| |||||||||
|
|
|
|
|
|
|
|
|
|
|
|
|
|
|
|
|
| RATING |
|
|
|
|
|
|
|
| Total | AAA | AA | A | BBB | BB | B | Unrated |
|
| Commercial Real Estate |
| $401 | $6 | $2 | $18 | $101 | $159 | $39 | $76 |
|
| Residential Prime Real Estate |
| 1,567 | 72 | 251 | 259 | 270 | 379 | 169 | 167 |
|
| Residential Sub-Prime Real Estate |
| 407 | 5 | 86 | 237 | 79 | - | - | - |
|
| Residential Second Lien Real Estate |
| 93 | 3 | 46 | 38 | 6 | - | - | - |
|
| REIT Corporate Debt |
| 9 | - | - | - | 1 | 8 | - | - |
|
| Real Estate CDOs |
| 184 | 44 | 28 | 37 | 60 | 14 | - | 1 |
|
| Total securities portfolio |
| $2,661 | $130 | $413 | $589 | $517 | $560 | $208 | $244 |
|
|
|
|
|
|
|
|
|
|
|
|
|
| Includes a portion of Redwood's permanent investment portfolio, plus securities consolidated from Acacia CDO securitization entities sponsored by Redwood, plus securities held by Redwood temporarily prior to sale to Acacia. Does not include Redwood's permanent investments acquired from securitization entities sponsored by Redwood, as those securities are eliminated in the GAAP consolidation of the underlying entities. |
| |||||||||
|
|
|
|
|
|
|
|
|
|
|
|
| Table 17: Securities Portfolio at December 31, 2005 - Characteristics (in thousands) |
| |||||||||
|
|
|
|
|
|
|
|
|
|
|
|
|
|
|
|
|
| RATING |
|
|
|
|
|
|
|
| Total | AAA | AA | A | BBB | BB | B | Unrated |
|
| Commercial Real Estate |
| $380 | $11 | $2 | $20 | $129 | $130 | $30 | $58 |
|
| Residential Prime Real Estate |
| 1,302 | 29 | 243 | 196 | 232 | 331 | 116 | 155 |
|
| Residential Sub-prime Real Estate |
| 442 | 5 | 86 | 292 | 59 | - | - | - |
|
| Residential Second Lien Real Estate |
| 108 | - | 49 | 54 | 5 | - | - | - |
|
| REIT Corporate Debt |
| 32 | - | - | - | 24 | 8 | - | - |
|
| Real Estate CDOs |
| 155 | 37 | 25 | 37 | 44 | 11 | - | 1 |
|
| Total securities portfolio |
| $2,419 | $82 | $405 | $599 | $493 | $480 | $146 | $214 |
|
|
|
|
|
|
|
|
|
|
|
|
|
| Includes a portion of Redwood's permanent investment portfolio, plus securities consolidated from Acacia CDO securitization entities sponsored by Redwood, plus securities held by Redwood temporarily prior to sale to Acacia. Does not include Redwood's permanent investments acquired from securitization entities sponsored by Redwood, as those securities are eliminated in the GAAP consolidation of the underlying entities. |
| |||||||||
|
|
|
|
|
|
|
|
|
|
|
|
Table 18: ABS Issued Characteristics - | |||||||
Residential Mortgage Loans (Sequoia) (all $ in thousands) | |||||||
|
|
|
|
|
|
| |
|
|
|
|
|
| Principal | |
|
|
| Original |
| Estimated | Outstanding At | |
Sequoia |
| Issue | Issue | Stated | Callable | June 30, | |
ABS Issued (1) |
| Date | Amount | Maturity | Date | 2006 | |
Sequoia 1 |
| 07/29/97 | $534,347 | 2028 | Called | $- | |
Sequoia 2 |
| 11/06/97 | 749,160 | 2029 | Called | - | |
Sequoia 3 |
| 06/26/98 | 635,288 | 2028 | Called | - | |
Sequoia 1A |
| 05/04/99 | 157,266 | 2028 | Called | - | |
Sequoia 4 |
| 03/21/00 | 377,119 | 2024 | 2007 | 90,890 | |
Sequoia 5 |
| 10/29/01 | 510,047 | 2026 | 2006 | 134,350 | |
Sequoia 6 |
| 04/26/02 | 506,142 | 2027 | 2007 | 160,064 | |
Sequoia 7 |
| 05/29/02 | 572,000 | 2032 | 2006 | 125,502 | |
Sequoia 8 |
| 07/30/02 | 642,998 | 2032 | 2006 | 156,812 | |
Sequoia 9 |
| 08/28/02 | 558,266 | 2032 | 2008 | 141,453 | |
Sequoia 10 |
| 09/26/02 | 1,041,600 | 2027 | 2008 | 339,000 | |
Sequoia 11 |
| 10/30/02 | 704,936 | 2032 | 2007 | 193,260 | |
Sequoia 12 |
| 12/19/02 | 1,096,891 | 2033 | 2006 | 289,191 | |
Sequoia 2003-1 |
| 02/27/03 | 1,012,321 | 2033 | 2007 | 297,723 | |
Sequoia 2003-2 |
| 04/29/03 | 815,080 | 2022 | 2007 | 248,356 | |
Sequoia 2003-3 |
| 06/26/03 | 538,452 | 2023 | 2007 | 154,391 | |
MLCC 2003-C |
| 06/26/03 | 984,349 | 2023 | 2008 | 308,512 | |
MLCC 2003-D |
| 07/29/03 | 1,003,591 | 2028 | 2008 | 341,006 | |
Sequoia 2003-4 |
| 07/29/03 | 504,273 | 2033 | 2007 | 216,551 | |
Sequoia 2003-5 |
| 08/27/03 | 840,248 | 2033 | 2007 | 240,567 | |
Sequoia 2003-6 |
| 10/29/03 | 649,999 | 2033 | 2007 | 182,937 | |
Sequoia 2003-7 |
| 11/25/03 | 811,707 | 2034 | 2007 | 237,205 | |
Sequoia 2003-8 |
| 12/23/03 | 964,238 | 2034 | 2007 | 335,080 | |
MLCC 2003-E |
| 08/28/03 | 983,852 | 2028 | 2008 | 336,548 | |
MLCC 2003-F |
| 09/25/03 | 1,297,913 | 2028 | 2008 | 452,632 | |
MLCC 2003-H |
| 12/22/03 | 739,196 | 2029 | 2008 | 259,857 | |
Sequoia 2004-1 |
| 01/28/04 | 616,562 | 2034 | 2007 | 193,954 | |
Sequoia 2004-2 |
| 02/25/04 | 690,548 | 2034 | 2007 | 233,736 | |
Sequoia 2004-3 |
| 03/30/04 | 917,673 | 2034 | 2006 | 284,713 | |
Sequoia 2004-4 |
| 04/29/04 | 808,933 | 2010 | 2007 | 258,874 | |
Sequoia 2004-5 |
| 05/27/04 | 831,540 | 2012 | 2008 | 270,558 | |
Sequoia 2004-6 |
| 06/29/04 | 910,662 | 2012 | 2008 | 313,834 | |
SEMHT 2004-01 |
| 06/29/04 | 317,044 | 2014 | 2008 | 133,139 | |
Sequoia 2004-7 |
| 07/29/04 | 1,032,685 | 2034 | 2008 | 310,394 | |
Sequoia 2004-8 |
| 08/27/04 | 807,699 | 2034 | 2008 | 310,988 | |
Sequoia 2004-9 |
| 09/29/04 | 772,831 | 2034 | 2008 | 325,421 | |
Sequoia 2004-10 |
| 10/28/04 | 673,356 | 2034 | 2009 | 282,597 | |
Sequoia 2004-11 |
| 11/23/04 | 705,746 | 2034 | 2008 | 342,476 | |
Sequoia 2004-12 |
| 12/22/04 | 821,955 | 2035 | 2009 | 332,722 | |
Sequoia 2005-1 |
| 01/27/05 | 409,071 | 2035 | 2008 | 189,983 | |
Sequoia 2005-2 |
| 02/24/05 | 338,481 | 2035 | 2008 | 140,246 | |
Sequoia 2005-3 |
| 04/28/05 | 359,182 | 2035 | 2009 | 196,304 | |
Madrona 2005-A |
| 08/25/05 | 5,400 | 2008 | 2008 | 5,400 | |
Sequoia 2005-4 |
| 09/29/05 | 324,576 | 2035 | 2012 | 250,253 | |
Total Sequoia ABS Issuance |
|
| $30,575,223 |
|
| $9,617,479 | |
|
|
|
|
|
|
| |
ABS Resecuritizations |
|
|
|
|
|
| |
SMFC 2002A |
| 04/30/02 | $80,622 | 2029 | Called | $- | |
SMFC 2002B |
| 12/19/02 | 161,605 | 2039 | Called | - | |
Total ABS Resecuritizations |
|
| $242,227 |
|
| $- | |
|
|
|
|
|
|
| |
Table 19: ABS Issued Characteristics - IO's from Residential Real Estate Loans | |||||||
(Sequoia Interest-Only Certificates Issued) (all $ in thousands) | |||||||
|
|
|
|
|
|
| |
|
|
|
|
|
| Adjusted Issue | |
|
|
| Original |
| Estimated | Amount At | |
Sequoia ABS |
| Issue | Issue | Stated | Callable | June 30, | |
IO's Issued (1) |
| Date | Amount | Maturity | Date | 2006 | |
MLCC 2003-C X-A-2 |
| 06/26/03 | $12,662 | 2007 | 2008 | $919 | |
MLCC 2003-D X-A-1 |
| 07/29/03 | 22,371 | 2007 | 2008 | 2,083 | |
MLCC 2003-E X-A-1 |
| 08/28/03 | 16,550 | 2007 | 2008 | 2,253 | |
MLCC 2003-F X-A-1 |
| 09/25/03 | 18,666 | 2007 | 2008 | 2,499 | |
Sequoia 2003-6 X-1 |
| 10/29/03 | 8,220 | 2007 | 2007 | 935 | |
SMFC 2003A AX1 |
| 10/31/03 | 70,568 | 2007 | 2007 | 5,647 | |
Sequoia 2003-7 X-1 |
| 11/25/03 | 10,345 | 2007 | 2007 | 1,313 | |
Sequoia 2003-8 X-1 |
| 12/23/03 | 12,256 | 2007 | 2007 | 1,753 | |
Sequoia 2004-1 X-1 |
| 01/28/04 | 7,801 | 2007 | 2007 | 1,243 | |
Sequoia 2004-2 X-1 |
| 02/25/04 | 8,776 | 2007 | 2007 | 1,529 | |
SMFC 2004A AX1 |
| 02/26/04 | 10,626 | 2007 | 2007 | 1,826 | |
MLCC 2003-H X-A-1 |
| 12/22/03 | 10,430 | 2007 | 2008 | 1,975 | |
Sequoia 2004-4 X-1 |
| 05/28/04 | 9,789 | 2010 | 2007 | 2,166 | |
Sequoia 2004-5 X-1 |
| 05/27/04 | 3,371 | 2012 | 2008 | 769 | |
Sequoia 2004-6 X-A |
| 06/29/04 | 10,884 | 2012 | 2008 | 5,474 | |
Sequoia 2004-7 X-A |
| 07/29/04 | 12,145 | 2034 | 2008 | 6,246 | |
Sequoia 2004-8 X-A |
| 08/27/04 | 18,270 | 2034 | 2008 | 9,741 | |
Sequoia 2004-9 X-A |
| 09/29/04 | 16,951 | 2034 | 2008 | 9,316 | |
Sequoia 2004-10 X-A |
| 10/28/04 | 14,735 | 2034 | 2009 | 8,276 | |
Sequoia 2004-11 X-A-1 |
| 11/23/04 | 12,603 | 2034 | 2008 | 7,548 | |
Sequoia 2004-11 X-A-2 |
| 11/23/04 | 4,697 | 2034 | 2008 | 2,860 | |
Sequoia 2004-12 X-A-1 |
| 12/22/04 | 14,453 | 2035 | 2009 | 8,599 | |
Sequoia 2004-12 X-A-2 |
| 12/22/04 | 4,619 | 2035 | 2009 | 5,081 | |
Sequoia 2005-1 X-A |
| 01/27/05 | 9,669 | 2035 | 2008 | 5,977 | |
Sequoia 2005-2 X-A |
| 02/24/05 | 7,484 | 2035 | 2008 | 4,636 | |
Sequoia 2005-3 X-A |
| 04/28/05 | 8,183 | 2035 | 2009 | 5,556 | |
Total Sequoia Issuance |
|
| $357,124 |
|
| $106,220 | |
|
|
|
|
|
|
| |
(1) Does not include Sequoia IO's acquired by Redwood or Acacia | |||||||
|
|
|
|
|
|
| |
Table 20: ABS Characteristics - Commercial Real Estate Loans (all $ in thousands) | |||||||
|
|
|
|
|
|
| |
|
|
|
|
|
| Principal | |
|
|
| Original |
| Estimated | Outstanding At | |
Commercial |
| Issue | Issue | Stated | Callable | June 30, | |
ABS Issued |
| Date | Amount | Maturity | Date | 2006 | |
Commercial 1 |
| 03/30/01 | $9,010 | 2002 | Paid Off | $- | |
Commercial 2 |
| 03/30/01 | 8,320 | 2003 | Paid Off | - | |
Commercial 3 |
| 03/01/02 | 8,318 | 2003 | Paid Off | - | |
Commercial 4 |
| 08/18/03 | 5,595 | 2009 | Paid Off | - | |
Commercial 5 |
| 12/10/04 | 4,030 | 2005 | Paid Off | - | |
Commercial 6 |
| 02/07/05 | 4,250 | 2009 | Paid Off | - | |
Total Commercial Issuance |
|
| $39,523 |
|
| $- | |
|
|
|
|
|
|
| |
Table 21: Acacia CDO ABS Issued Characteristics | ||||||||
(all $ in thousands) | ||||||||
|
|
|
|
|
|
|
| |
|
|
|
|
|
|
| Principal | |
|
|
|
| Original |
| Estimated | Outstanding At | |
|
|
| Issue | Issue | Stated | Callable | June 30, | |
CDO Issuance (1) |
|
| Date | Amount | Maturity | Date | 2006 | |
Acacia CDO 1 |
|
| 12/10/02 | $285,000 | 2023 | Called | $- | |
Acacia CDO 2 |
|
| 05/13/03 | 283,875 | 2023 | Called | - | |
Acacia CDO 3 |
|
| 11/04/03 | 284,250 | 2038 | 2006 | 237,173 | |
Acacia CDO 4 |
|
| 04/08/04 | 293,400 | 2039 | 2007 | 285,682 | |
Acacia CDO 5 |
|
| 07/14/04 | 282,125 | 2039 | 2012 | 281,849 | |
Acacia CDO 6 |
|
| 11/09/04 | 282,000 | 2040 | 2012 | 281,306 | |
Acacia CDO 7 |
|
| 03/10/05 | 282,000 | 2045 | 2013 | 281,139 | |
Acacia CDO 8 |
|
| 07/14/05 | 252,000 | 2045 | 2013 | 251,745 | |
Acacia CRE1 |
|
| 12/14/05 | 261,750 | 2045 | 2013 | 261,750 | |
Acacia CDO 9 |
|
| 03/09/06 | 277,800 | 2046 | 2013 | 277,800 | |
Total CDO Issuance |
|
|
| $2,784,200 |
|
| $2,158,444 | |
|
|
|
|
|
|
|
| |
(1) Does not include ABS acquired by Redwood or Acacia | ||||||||
|
|
|
|
|
|
|
| |
Redwood Trust Corporate Information
| Executive Officers: | Directors: | |
| George E. Bull, III | George E. Bull, III | |
| Chairman of the Board and | Chairman of the Board and | |
| Chief Executive Officer | Chief Executive Officer | |
| Douglas B. Hansen | Douglas B. Hansen | |
| President | President | |
| Martin S. Hughes | Richard D. Baum | |
| Vice President | Chief Deputy Insurance | |
| Commissioner for the | ||
| Harold F. Zagunis | State of California | |
| Chief Financial Officer | ||
| Thomas C. Brown | ||
| Brett D. Nicholas | CEO, Urban Bay Properties, Inc. | |
| Vice President | ||
| Mariann Byerwalter | ||
| Loren R. Picard | Chairman, JDN Corporate | |
| Vice President | Advisory, LLC | |
| Andrew I. Sirkis | Greg H. Kubicek | |
| Vice President | President, The Holt Group, Inc. | |
| Georganne C. Proctor | ||
| Executive Vice President and | ||
| Chief Financial Officer, TIAA-CREF | ||
| Charles J. Toeniskoetter | ||
| Chairman, Toeniskoetter & Breeding, Inc. | ||
| David L. Tyler | ||
| Private Investor | ||
Stock Listing:
The Company's common stock is traded on the
New York Stock Exchange under the symbol RWT.
Corporate Office:
One Belvedere Place, Suite 300
Mill Valley, California 94941
Telephone: 415-389-7373
Investor Relations:
Nicole Klock
IR Hotline: 866-269-4976
Telephone: 415-380-2321
Email: [email protected]
Transfer Agent:
Computershare
2 North LaSalle Street
Chicago, IL 60602
Telephone: 888-472-1955
For more information about our company, please visit our website at:
www.redwoodtrust.com