|
The
Redwood Review
3rd
Quarter 2006
|
|
The
Redwood Review
3rd
Quarter 2006
|
| CONTENTS |
|
INTRODUCTION
|
2
|
|
|
SHAREHOLDER
LETTER
|
3
|
|
|
ABOUT
REDWOOD TRUST
|
7
|
|
|
BUSINESS
GROUP DISCUSSION
|
|
|
|
►
|
Residential
Group
|
12
|
|
►
|
Commercial
Group
|
17
|
|
►
|
CDO
Group
|
21
|
|
FINANCIAL
REVIEW
|
|
|
|
►
|
Finance
Group
Overview
|
24
|
|
►
|
GAAP
Earnings
|
28
|
|
►
|
Core
Earnings
|
29
|
|
►
|
Taxable
Income
|
30
|
|
►
|
Book
Value
per Share
|
34
|
|
►
|
Return
on
Equity
|
36
|
|
►
|
Residential
Credit Results
|
38
|
|
►
|
Credit
Reserves
|
42
|
|
►
|
Dividends
|
44
|
|
APPENDIX
|
|
|
|
►
|
Glossary
|
46
|
|
►
|
Financial
Tables
|
53
|
| INTRODUCTION |
| SHAREHOLDER LETTER |
| SHAREHOLDER LETTER |
| SHAREHOLDER LETTER |
| SHAREHOLDER LETTER |
 |
 |
|
George
E.
Bull, III
|
Douglas
B.
Hansen
|
|
Chairman
and CEO
|
President
|
| ABOUT REDWOOD TRUST |
| 1. |
We
are an entrepreneurial specialty finance
company.
|
|
2.
|
Our
primary business is credit-enhancing securitized residential
and
commercial real estate
loans.
|
|
3.
|
We
credit-enhance loans by acquiring and owning credit-enhancement
securities.
|
| ABOUT REDWOOD TRUST |
| 4. |
Our
primary focus is on credit-enhancing high-quality real
estate
assets.
|
| 5. |
We
use securitization to finance most of our
assets.
|
| ABOUT REDWOOD TRUST |
| 6. |
We
maintain a strong balance
sheet.
|
| 7. |
We
are leaders in our market
segments.
|
| ABOUT REDWOOD TRUST |
| 8. |
We
have some interesting competitive
advantages.
|
| 9. |
We
pay a regular dividend and we may pay a special
dividend.
|
| 10. |
We
are a growth company.
|
| ABOUT REDWOOD TRUST |
| BUSINESS GROUP DISCUSSION |
| BUSINESS GROUP DISCUSSION |
| BUSINESS GROUP DISCUSSION |
| BUSINESS GROUP DISCUSSION |
|
Chart
1: Total Residential CES
|
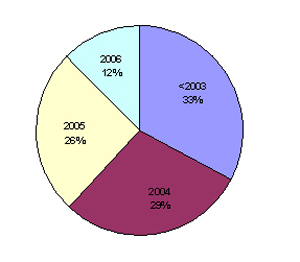
Chart 2: Residential 1st Loss CES Portfolio by Vintage | |||
 |
 |
|||
| Source: Redwood Trust |
Source:
Redwood Trust
|
|||
| Ø |
Our
residential CES assets are growing at a measured
|
Ø |
Our
residential first-loss portfolio remains very
|
|
| pace. | seasoned,with 62% of assets originated prior | |||
|
to
2005.
|
||||
| Ø | Measured by market value. | |||
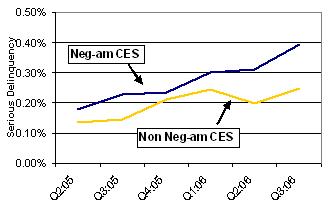
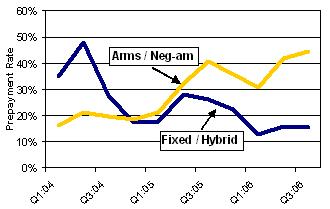
| Chart 3: Seriously Delinquent Trends for Neg-Am Residential CES | Chart 4: Prepayments Trends for Residential CES | |||
 |
 |
|||
| Source: Redwood Trust |
Source:
Redwood Trust
|
|||
| Ø |
Neg-am and non neg-am
CES
delinquencies remain low
|
Ø |
We continue to benefit
from
higher than expected
|
|
|
on an absolute
basis.
|
prepayment rates
on our ARM
and neg-am CES.
|
|||
| Ø |
Neg-am CES delinquencies
are
performing well relative to
|
|||
|
our higher expected
loss
assumptions.
|
||||
| Ø |
Delinquencies are
measured as
a percentage of current
|
|||
|
pool
balances.
|
||||
| BUSINESS GROUP DISCUSSION |
| BUSINESS GROUP DISCUSSION |
| BUSINESS GROUP DISCUSSION |
| BUSINESS GROUP DISCUSSION |
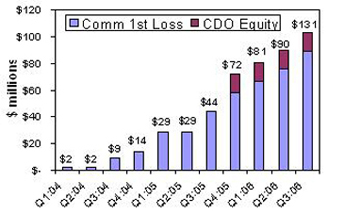
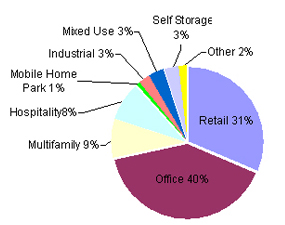
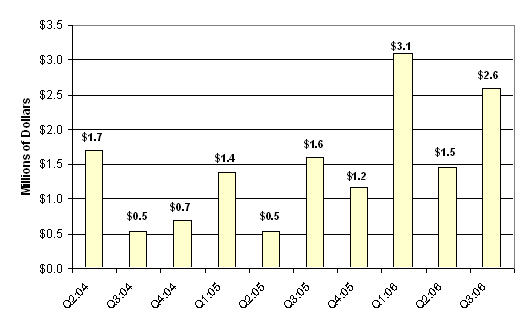
| Chart 5: Redwood’s First-Loss Commercial CES and CRE CDO Equity | Chart 6: Commercial Property Type Distribution | |||
 |
 |
|||
| Source: Redwood Trust |
Source:
September 2006 Remittance Reports
|
|||
| Ø | Our first-loss CES portfolio continues to grow at a steady | Ø | Given the potential outlook for slower GDP growth and the | |
| pace. | slowdown in the residential housing market, we are paying | |||
| Ø | In 2007, we expect to match our current pace. |
particular attention
to the
retail exposure we are taking on.
|
||
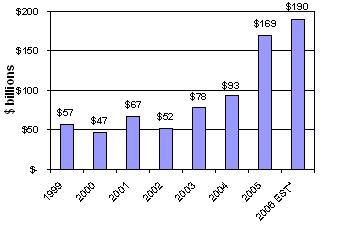
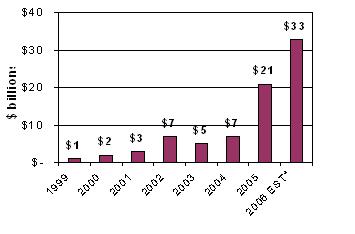
| Chart 7: Domestic CMBS Historical Issuance | Chart 8: CRE CDO Historical Issuance | |||
 |
 |
|||
|
Source:
Commercial Mortgage Alert 10/6/05*
Redwood
Trust estimate
|
Source:
CRE CDO 201 CMSA Investor Conference
9/28/06. *
Redwood
Trust estimate
|
|||
| Ø | The last few years have seen tremendous growth in CMBS | Ø |
CRE CDO issuance
is growing
rapidly and we expect this
|
|
| issuance. | trend to continue through 2007. | |||
| Ø | Though issuance may slow down in coming years, we | Ø |
We
expect to
issue more CRE CDOs to
|
|
| expect it to stay above the $150 billion level. |
fund
our
growing commercial assets.
|
|||
| BUSINESS GROUP DISCUSSION |
| BUSINESS GROUP DISCUSSION |
| BUSINESS GROUP DISCUSSION |
| BUSINESS GROUP DISCUSSION |
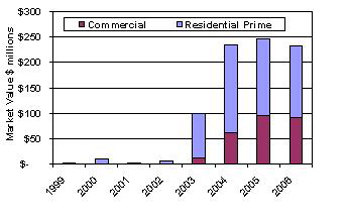
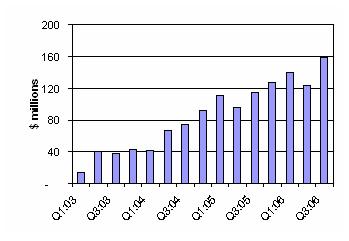
| Chart 9: Acacia’s Non-Investment Grade Assets by Vintage | Chart 10: Acacia Equity Invested | |||
 |
 |
|||
| Source: Redwood Trust |
Source:
Redwood Trust
|
|||
| Ø | Commercial assets are 1/3 and Prime residential assets | Ø | Acacia equity is a significant part of Redwood’s | |
| are 2/3 of the total non-investment grade portfolio. | investments. | |||
| Ø | Returns to date have exceeded our hurdle rate. | |||
| Ø | Returns are expected to remain above our hurdle rate. | |||
| Ø | The market value of Acacia equity has grown since we | |||
| initially invested. | ||||
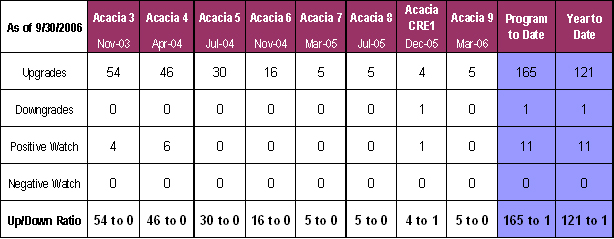
| Chart 11: Acacia Collateral Rating History | ||||
 |
||||
| Source: Redwood Trust | ||||
| Ø Upgrades of securities owned by Acacia are a sign that Acacia CDO equity may continue to perform well. | ||||
| FINANCIAL REVIEW |
| FINANCIAL REVIEW |
| FINANCIAL REVIEW |
| FINANCIAL REVIEW |
| FINANCIAL REVIEW |
| a) |
Graph
|
| b) |
Quarterly
Update
|
|
Ø
|
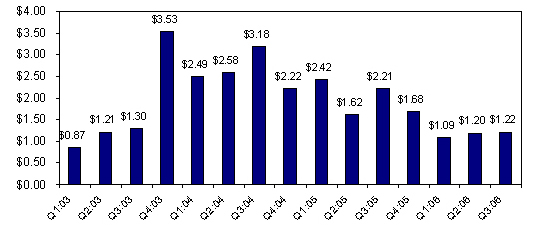
Our
GAAP
earnings were $32 million, or $1.22 per share, for the third
quarter of
2006. This was a slight increase over the previous quarter. In
the third
quarter of 2005, GAAP earnings were $56 million, or $2.21 per
share.
|
|
Ø
|
The
reduction
in net income of $24 million from the third quarter of 2005 resulted
substantially from a reduced amount of gains generated from selling
assets
and asset calls.
|
|
Ø
|
Net
interest
income was $49 million in the current quarter, an increase of
$4 million
from the previous quarter and an increase of $1 million from
the third
quarter of last year. This reflects rising yields from our residential
credit-enhancement portfolio resulting from strong credit performance
and
rapid prepayments.
|
|
Ø
|
The
yield on
our residential credit-enhancement securities improved from 17%
in the
third quarter of 2005 to 19% in the second quarter of 2006, to
22% in the
third quarter of 2006. The performance of yields generated by
our
credit-enhancement investments in neg-am loans have been particularly
favorable.
|
| FINANCIAL REVIEW |
|
a)
|
Graph
|
|
b)
|
Quarterly
Update
|
|
Ø
|
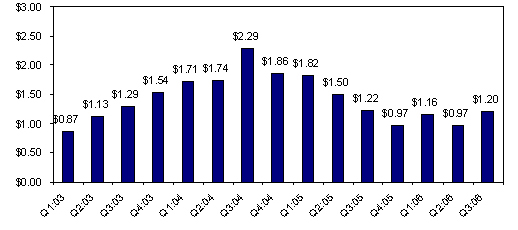
Core
earnings
were $32 million, or $1.20 per share, for the third quarter of
2006. This
is the highest level of core earnings since the third quarter
of
2005.
|
|
Ø
|
An
additional
boost in core earnings could come as we invest our excess capital.
Other
factors, of course, could cause
volatility.
|
| FINANCIAL REVIEW |
|
a)
|
Graphs
|
| FINANCIAL REVIEW |
| FINANCIAL REVIEW |
|
b)
|
Quarterly
Update
|
|
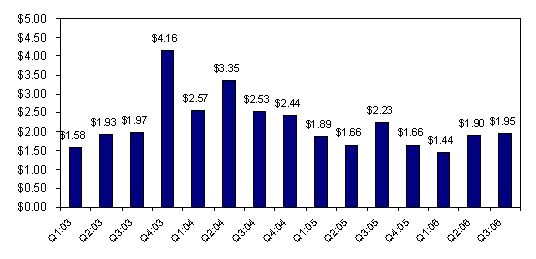
Ø
|
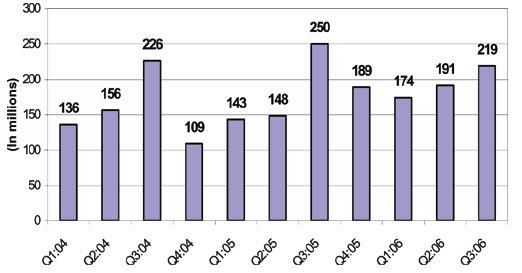
Taxable
income results continue to be favorable. Total taxable income
was $51
million, or $1.95 per share, in the third quarter of
2006.
|
|
Ø
|
Our
REIT
taxable income per share continues to exceed our regular
quarterly
dividend rate of $0.70 per share by quarter by a comfortable
margin.
|
|
Ø
|
Taxable
income exceeds GAAP for a variety of reasons, the largest
of which is that
we are not able to establish credit reserves for tax. Currently,
our
actual credit losses are minimal. Taxable income was reduced
by $1.1
million ($0.04 per share) in the third quarter as a result
of deductions
for actual credit losses. This deduction is less than the
losses incurred
on the underlying loans, as we own most of our credit-sensitive
assets at
a tax basis that is substantially less than par (principal)
value.
Increased credit losses would reduce taxable income and our
dividend
distributions.
|
|
Ø
|
For
a variety
of reasons, including but not limited to stock option exercises
and
distributions from deferred compensation plans, our taxable
income results
can be volatile on a quarter-to-quarter
basis.
|
| FINANCIAL REVIEW |
| FINANCIAL REVIEW |
| a) |
Graph
|
| FINANCIAL REVIEW |
|
Ø
|
For
the third
quarter of 2006, after including the effect of declaring $0.70
per share
of regular dividends, GAAP book value per share increased by
2% from
$39.13 per share to $40.02 per
share.
|
|
Ø
|
Over
time,
our GAAP book value per share has been increasing because of
retention of
a portion of our income, increases in the market value of our
assets, and
issuance of stock at prices in excess of book
value.
|
|
Ø
|
At
September
30, 2006, core book value was $36.38 per share and adjusted
core book
value was $32.11 per share.
|
|
Ø
|
At
the end of
our first quarter of operations in September 1994, GAAP book
value was
$11.67 per share. Since that time, we have paid $36.73 per
share of
dividends while also increasing GAAP book value by $28.35 per
share.
|
|
Ø
|
Book
value
per share growth is not a direct indicator of our market value
or an
indicator of the returns available to our shareholders. If
you had
acquired Redwood stock at our initial public offering in August
1995, and
had reinvested all dividends back into Redwood stock, your
annualized
compounded return as a shareholder through the third quarter
of 2006 would
have been 21% through October 31, 2006. Future results may
vary.
|
| FINANCIAL REVIEW |
| a) |
Graph
|
| FINANCIAL REVIEW |
|
Ø
|
GAAP
ROE was
13% for the third quarter of 2006 as compared to 22% in the third
quarter
of 2005.
|
|
Ø
|
Adjusted
ROE
was 14% for the third quarter of 2006 and 25% for the third quarter
of
2005. Adjusted ROE is greater than GAAP ROE due to the appreciation
of the
market values of assets that are marked-to-market through our
GAAP balance
sheet. This increases our GAAP equity and thus lowers GAAP
ROE.
|
|
Ø
|
Over
the very
long term, we expect to generate an average adjusted annual return
on
equity between 11% and 18%.
|
| FINANCIAL REVIEW |
| a) |
Graphs
|
| FINANCIAL REVIEW |
| FINANCIAL REVIEW |
| FINANCIAL REVIEW |
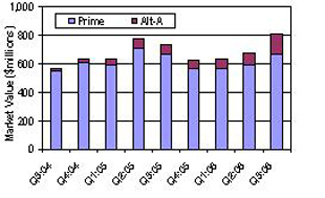
| Ø |
At
September
30, 2006, through ownership of credit-enhancement securities
and whole
loans, we were exposed to credit risk on $235 billion in
residential real
estate loans (excluding loans underlying investment-grade
rated
securities). Of this total, prime-quality loans were $210
billion.
|
| Ø |
For
the third
quarter of 2006, realized credit losses within these loan
pools were $2.6
million of principal value, a rate that is less than one
basis point
(0.01%) on an annualized basis of the current balance of
loans. Principal
value losses were $2.4 million for loans in prime pools and
$0.2 million
for Alt-A. There were no sub-prime losses, as these loans
are
new.
|
| Ø |
Realized
credit losses for residential assets for tax purposes were
$1.1 million
for the third quarter. This deduction is less than the principal
value
losses incurred on the underlying loans, as we own most of
our
credit-sensitive assets at a tax basis that is substantially
less than par
(principal) value.
|
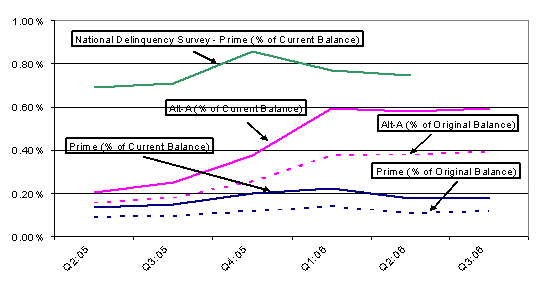
| Ø |
Serious
delinquencies at September 30, 2006 were 0.23% of current
balances and
0.14% of original balances. For loans in prime pools, delinquencies
were
0.19% of current balance and 0.12% of original balance. Alt-A
pools had
delinquencies of 0.60% of current balance and 0.40% of original
balance.
Although delinquency ratios were generally stable for the
quarter, total
serious residential delinquencies increased from $467 million
to $528
million.
|
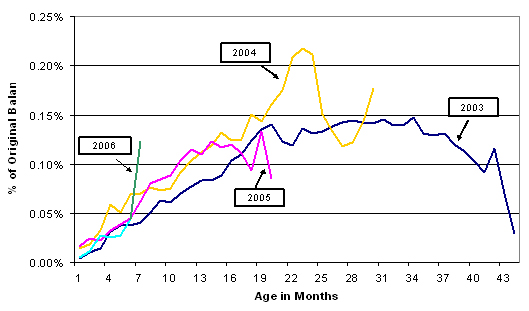
| Ø |
For
prime
loans, the delinquency performance as a percentage of original
balance of
the 2005 and 2006 vintages has been generally similar (as
measured at
similar months since origination) to earlier vintages. The
latest month
jumped up slightly, but the last several months of data on
vintage charts
needs to be interpreted with caution—this portion of vintage data is
volatile as it is based on a very small sample set. It is
too early to
conclude that the increase in the delinquency ratio for 6-month-old
loans
originated in 2006 is indicative of a real trend.
|
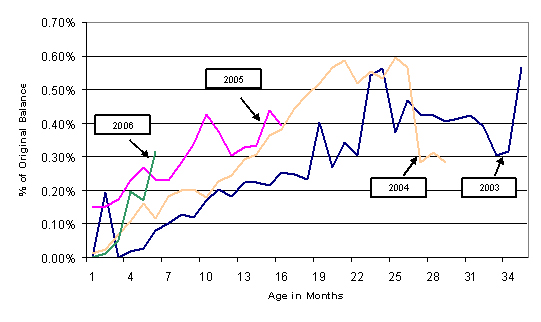
| Ø |
For
Alt-A
loans, delinquency results appear to be deteriorating slightly
with each
subsequent vintage, although it is too early to draw definitive
conclusions.
|
| Ø |
We
closely
monitor early payment defaults, defined as loans that become
seriously
delinquent within three months of loan origination, for the
673,000
residential loans we credit-enhance or own. Early payment
defaults remain
very low. We have averaged 14 new early payment defaults
per month in
2006, compared to 10 per month in
2005.
|
| FINANCIAL REVIEW |
| FINANCIAL REVIEW |
| a) |
Graph
|
| b) |
Quarterly
Update
|
|
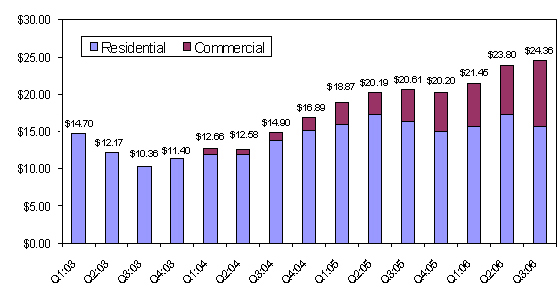
Ø
|
Our
GAAP
credit reserves at September 30, 2006 were $635 million, or $24.36
per
share.
|
|
Ø
|
At
September
30, 2006, our residential real estate credit reserves were $384
million
($14.76 per share) for CES and $19 million ($0.74 per share) for
residential whole loans. The principal value of actual credit losses
underlying our residential loans and securities were $3 million
for the
third quarter of 2006 and $8 million for the last 12 months. Third
quarter
residential credit losses reduced taxable income by $1
million.
|
|
Ø
|
At
September
30, 2006, our commercial real estate credit reserves were $223
million
($8.55 per share) for CES and $8 million ($0.31 per share) for
commercial
whole loans. We incurred principal value commercial credit losses
of $0.5
million ($0.1 million tax losses) in the third quarter of 2006
and for the
last 12 months.
|
| FINANCIAL REVIEW |
|
a)
|
Graphs
|
| FINANCIAL REVIEW |
| b) |
Quarterly
Update
|
|
Ø
|
We
declared a
regular quarterly dividend of $0.70 per share in the third quarter
of
2006.
|
|
Ø
|
Based
on the
Redwood stock price of $54.97 on October 31, 2006, the dividend
yield on
Redwood stock based regular dividends distributed over the last
12 months
of $2.80 per share was 5%. The dividend yield based on the $5.80
per share
of total dividends (including the special dividend) distributed
over the
last 12 months was 11%.
|
|
Ø
|
We
plan to
permanently retain approximately 10% of the ordinary REIT taxable
income
we earn during 2006, and to retain 100% of the after-tax taxable
income we
earn at our taxable subsidiaries. By retaining a portion of our
income, we
seek to build book value per share, and thus potential earnings
and
dividends per share, over time.
|
|
Ø
|
We
also plan
to defer distribution of a portion of this year’s taxable income into the
following year.
|
|
Ø
|
Based
on our
estimates of REIT taxable income during 2005 and the first three
quarters
of 2006, we entered the fourth quarter of 2006 with $111 million
($4.28
per share) of undistributed REIT taxable
income.
|
|
Ø
|
We
expect to
distribute a special dividend in the fourth quarter of 2006.
Our special
dividend declaration will depend on our evolving projection of
fourth
quarter REIT taxable income performance. Although subject to
change, it
currently appears that the special dividend this year will exceed
$2.50
per share and could be close to the $3.00 per share special dividend
we
paid in December 2005.
|
| APPENDIX |
| APPENDIX |
| APPENDIX |
| APPENDIX |
| APPENDIX |
| APPENDIX |
| · |
More
than 60%
of loans with FICO < 680
|
| · |
Weighted
average LTV over 85%
|
| · |
More
than 70%
of loans with LTV over 75%
|
| · |
Loans
with
LTV over 80% with no mortgage
insurance
|
| APPENDIX |
| APPENDIX |
| APPENDIX |
|
Table
1: GAAP Earnings (in thousands, except per share
data)
|
||||||||||||||||||||||||||||||||||
|
Nine
Months
|
Nine
Months
|
|||||||||||||||||||||||||||||||||
|
Q3:2006
|
Q2:2006
|
Q1:2006
|
Q4:2005
|
Q3:2005
|
Q2:2005
|
Q1:2005
|
Q4:2004
|
Q3:2004
|
Q3:2006
|
Q3:2005
|
||||||||||||||||||||||||
|
Interest
income
|
$
|
217,504
|
$
|
214,544
|
$
|
224,795
|
$
|
234,531
|
$
|
246,810
|
$
|
248,786
|
$
|
237,714
|
$
|
205,125
|
$
|
174,072
|
$
|
656,843
|
$
|
733,309
|
||||||||||||
|
Discount
amortization income
|
19,530
|
14,381
|
14,661
|
11,936
|
12,714
|
8,395
|
9,316
|
9,146
|
9,012
|
48,572
|
30,425
|
|||||||||||||||||||||||
|
Premium
amortization expense
|
(12,920
|
)
|
(13,193
|
)
|
(13,398
|
)
|
(14,451
|
)
|
(15,698
|
)
|
(10,203
|
)
|
(8,082
|
)
|
(7,105
|
)
|
802
|
(39,511
|
)
|
(33,983
|
)
|
|||||||||||||
|
Provision
for
(reversal of) credit reserve
|
(465
|
)
|
2,506
|
(176
|
)
|
(877
|
)
|
805
|
1,527
|
(1,025
|
)
|
(1,697
|
)
|
(1,528
|
)
|
1,865
|
1,307
|
|||||||||||||||||
|
Total
GAAP
interest income
|
223,649
|
218,238
|
225,882
|
231,139
|
244,631
|
248,505
|
237,923
|
205,469
|
182,358
|
667,769
|
731,058
|
|||||||||||||||||||||||
|
Interest
expense on Redwood debt
|
(9,422
|
)
|
(1,822
|
)
|
(2,072
|
)
|
(3,520
|
)
|
(3,789
|
)
|
(1,789
|
)
|
(2,694
|
)
|
(2,527
|
)
|
(2,299
|
)
|
(13,316
|
)
|
(8,272
|
)
|
||||||||||||
|
ABS
expenses
consolidated from trusts
|
(165,177
|
)
|
(171,659
|
)
|
(178,182
|
)
|
(186,433
|
)
|
(190,996
|
)
|
(191,966
|
)
|
(173,146
|
)
|
(143,024
|
)
|
(108,249
|
)
|
(515,018
|
)
|
(556,108
|
)
|
||||||||||||
|
ABS
issuance
expense amortization
|
(5,786
|
)
|
(6,079
|
)
|
(5,907
|
)
|
(6,069
|
)
|
(5,162
|
)
|
(5,386
|
)
|
(5,273
|
)
|
(4,783
|
)
|
(4,197
|
)
|
(17,772
|
)
|
(15,821
|
)
|
||||||||||||
|
ABS
interest
agreement expense
|
3,317
|
3,678
|
2,980
|
3,573
|
623
|
876
|
1,469
|
606
|
(2,888
|
)
|
9,975
|
2,968
|
||||||||||||||||||||||
|
ABS
issuance
premium amortization income
|
2,395
|
2,363
|
2,526
|
2,793
|
2,733
|
3,140
|
3,747
|
2,644
|
2,823
|
7,284
|
9,620
|
|||||||||||||||||||||||
|
Total
consolidated ABS expense
|
(165,251
|
)
|
(171,697
|
)
|
(178,583
|
)
|
(186,136
|
)
|
(192,802
|
)
|
(193,336
|
)
|
(173,203
|
)
|
(144,557
|
)
|
(112,511
|
)
|
(515,531
|
)
|
(559,341
|
)
|
||||||||||||
|
GAAP
net
interest income
|
48,976
|
44,719
|
45,227
|
41,483
|
48,040
|
53,380
|
62,026
|
58,385
|
67,547
|
138,922
|
163,445
|
|||||||||||||||||||||||
|
Fixed
compensation expense
|
(3,437
|
)
|
(3,309
|
)
|
(3,437
|
)
|
(2,879
|
)
|
(2,802
|
)
|
(2,623
|
)
|
(2,778
|
)
|
(2,009
|
)
|
(1,959
|
)
|
(10,183
|
)
|
(8,203
|
)
|
||||||||||||
|
Variable
compensation expense
|
(5,209
|
)
|
(4,891
|
)
|
(4,208
|
)
|
(5,005
|
)
|
(4,241
|
)
|
(5,174
|
)
|
(4,565
|
)
|
(3,204
|
)
|
(3,789
|
)
|
(14,308
|
)
|
(13,980
|
)
|
||||||||||||
|
Other
operating expense
|
(4,425
|
)
|
(5,150
|
)
|
(4,505
|
)
|
(4,583
|
)
|
(4,246
|
)
|
(3,542
|
)
|
(3,698
|
)
|
(2,487
|
)
|
(2,813
|
)
|
(14,080
|
)
|
(11,486
|
)
|
||||||||||||
|
Due
diligence
expenses
|
(384
|
)
|
(2,687
|
)
|
(432
|
)
|
(298
|
)
|
(1,075
|
)
|
(117
|
)
|
(757
|
)
|
(291
|
)
|
(2,268
|
)
|
(3,503
|
)
|
(1,949
|
)
|
||||||||||||
|
Total
GAAP
operating expenses
|
(13,455
|
)
|
(16,037
|
)
|
(12,582
|
)
|
(12,765
|
)
|
(12,364
|
)
|
(11,456
|
)
|
(11,798
|
)
|
(7,991
|
)
|
(10,829
|
)
|
(42,074
|
)
|
(35,618
|
)
|
||||||||||||
|
Realized
gains
on calls
|
723
|
747
|
-
|
4,266
|
2,914
|
4,421
|
7,548
|
11,205
|
20,472
|
1,470
|
14,883
|
|||||||||||||||||||||||
|
Realized
gains
on sales
|
4,967
|
2,027
|
1,059
|
11,654
|
23,053
|
516
|
8,347
|
-
|
488
|
8,053
|
31,916
|
|||||||||||||||||||||||
|
Securities
and
loans valuation adjustments
|
(484
|
)
|
(2,305
|
)
|
(3,226
|
)
|
(1,111
|
)
|
(1,158
|
)
|
(1,710
|
)
|
(391
|
)
|
(1,948
|
)
|
(421
|
)
|
(6,015
|
)
|
(3,259
|
)
|
||||||||||||
|
Derivatives
valuation adjustments
|
(4,773
|
)
|
5,524
|
297
|
3,066
|
107
|
(182
|
)
|
(492
|
)
|
(411
|
)
|
47
|
1,048
|
(567
|
)
|
||||||||||||||||||
|
Net
gains and
valuation adjustments
|
433
|
5,993
|
(1,870
|
)
|
17,875
|
24,916
|
3,045
|
15,012
|
8,846
|
20,586
|
4,556
|
42,973
|
||||||||||||||||||||||
|
Deferred
tax
benefit
|
-
|
-
|
-
|
-
|
-
|
-
|
-
|
-
|
-
|
-
|
-
|
|||||||||||||||||||||||
|
Provision
for
income taxes
|
(3,538
|
)
|
(3,265
|
)
|
(2,760
|
)
|
(4,097
|
)
|
(4,693
|
)
|
(4,054
|
)
|
(4,677
|
)
|
(4,826
|
)
|
(4,962
|
)
|
(9,563
|
)
|
(13,424
|
)
|
||||||||||||
|
GAAP
net
income
|
$
|
32,416
|
$
|
31,410
|
$
|
28,015
|
$
|
42,496
|
$
|
55,899
|
$
|
40,915
|
$
|
60,563
|
$
|
54,414
|
$
|
72,342
|
$
|
91,841
|
$
|
157,376
|
||||||||||||
|
Diluted
average shares
|
26,625
|
26,109
|
25,703
|
25,311
|
25,314
|
25,196
|
25,021
|
24,491
|
22,728
|
26,132
|
25,160
|
|||||||||||||||||||||||
|
GAAP
earnings
per share
|
$
|
1.22
|
$
|
1.20
|
$
|
1.09
|
$
|
1.68
|
$
|
2.21
|
$
|
1.62
|
$
|
2.42
|
$
|
2.22
|
$
|
3.18
|
$
|
3.51
|
$
|
6.26
|
||||||||||||
|
Table
2: Core Earnings (in thousands, except per share
data)
|
||||||||||||||||||||||||||||||||||
|
Nine
Months
|
Nine
Months
|
|||||||||||||||||||||||||||||||||
|
Q3:2006
|
Q2:2006
|
Q1:2006
|
Q4:2005
|
Q3:2005
|
Q2:2005
|
Q1:2005
|
Q4:2004
|
Q3:2004
|
Q3:2006
|
Q3:2005
|
||||||||||||||||||||||||
|
GAAP
net
income
|
$
|
32,416
|
$
|
31,410
|
$
|
28,015
|
$
|
42,496
|
$
|
55,899
|
$
|
40,915
|
$
|
60,563
|
$
|
54,414
|
$
|
72,342
|
$
|
91,841
|
$
|
157,377
|
||||||||||||
|
GAAP
income
items not included in core earnings
|
||||||||||||||||||||||||||||||||||
|
Realized
gains
on calls
|
$
|
723
|
$
|
747
|
$
|
-
|
$
|
4,266
|
$
|
2,914
|
$
|
4,421
|
$
|
7,548
|
$
|
11,205
|
$
|
20,472
|
$
|
1,470
|
$
|
14,883
|
||||||||||||
|
Realized
gains
on sales
|
4,967
|
2,027
|
1,059
|
11,654
|
23,053
|
516
|
8,347
|
-
|
488
|
8,053
|
31,916
|
|||||||||||||||||||||||
|
Securities
and
loans valuation adjustments
|
(484
|
)
|
(2,305
|
)
|
(3,226
|
)
|
(1,111
|
)
|
(1,158
|
)
|
(1,710
|
)
|
(391
|
)
|
(1,948
|
)
|
(421
|
)
|
(6,015
|
)
|
(3,259
|
)
|
||||||||||||
|
Derivatives
valuation adjustments
|
(4,773
|
)
|
5,524
|
297
|
3,066
|
107
|
(182
|
)
|
(492
|
)
|
(411
|
)
|
47
|
1,048
|
(567
|
)
|
||||||||||||||||||
|
Variable
stock
option market value change
|
-
|
-
|
-
|
25
|
16
|
(2
|
)
|
84
|
3
|
(213
|
)
|
-
|
98
|
|||||||||||||||||||||
|
Total
GAAP /
Core earnings differences
|
433
|
5,993
|
(1,870
|
)
|
17,900
|
24,932
|
3,043
|
15,096
|
8,849
|
20,373
|
4,556
|
43,071
|
||||||||||||||||||||||
|
Core
earnings
|
$
|
31,983
|
$
|
25,417
|
$
|
29,885
|
$
|
24,596
|
$
|
30,967
|
$
|
37,872
|
$
|
45,467
|
$
|
45,565
|
$
|
51,969
|
$
|
87,285
|
$
|
114,306
|
||||||||||||
| Per share analysis | ||||||||||||||||||||||||||||||||||
|
GAAP
earnings
per share
|
$
|
1.22
|
$
|
1.20
|
$
|
1.09
|
$
|
1.68
|
$
|
2.21
|
$
|
1.62
|
$
|
2.42
|
$
|
2.22
|
$
|
3.18
|
$
|
3.51
|
$
|
6.26
|
||||||||||||
|
GAAP
income
items not included in core earnings
|
||||||||||||||||||||||||||||||||||
|
Realized
gains
on calls
|
$
|
0.03
|
$
|
0.03
|
$
|
0.00
|
$
|
0.17
|
$
|
0.12
|
$
|
0.18
|
$
|
0.30
|
$
|
0.46
|
$
|
0.90
|
$
|
0.06
|
$
|
0.60
|
||||||||||||
|
Realized
gains
on sales
|
0.19
|
0.08
|
0.04
|
0.46
|
0.92
|
0.02
|
0.34
|
-
|
0.02
|
0.30
|
1.27
|
|||||||||||||||||||||||
|
Securities
and
loans valuation adjustments
|
(0.02
|
)
|
(0.09
|
)
|
(0.12
|
)
|
(0.04
|
)
|
(0.05
|
)
|
(0.07
|
)
|
(0.02
|
)
|
(0.08
|
)
|
(0.02
|
)
|
(0.23
|
)
|
(0.13
|
)
|
||||||||||||
|
Derivatives
valuation adjustments
|
(0.18
|
)
|
0.21
|
0.01
|
0.12
|
-
|
(0.01
|
)
|
(0.02
|
)
|
(0.02
|
)
|
-
|
0.04
|
(0.02
|
)
|
||||||||||||||||||
|
Variable
stock
option market value change
|
-
|
-
|
-
|
0.00
|
-
|
-
|
-
|
-
|
(0.01
|
)
|
-
|
0.00
|
||||||||||||||||||||||
|
GAAP
/ Core
earnings differences per share
|
0.02
|
0.23
|
(0.07
|
)
|
0.71
|
0.99
|
0.12
|
0.60
|
0.36
|
0.89
|
0.17
|
1.72
|
||||||||||||||||||||||
|
Core
earnings
per share
|
$
|
1.20
|
$
|
0.97
|
$
|
1.16
|
$
|
0.97
|
$
|
1.22
|
$
|
1.50
|
$
|
1.82
|
$
|
1.86
|
$
|
2.29
|
$
|
3.34
|
$
|
4.53
|
||||||||||||
|
Table
3: GAAP / TAX Differences (in thousands, except per share
data)
|
||||||||||||||||||||||||||||||||||
|
Estimated
|
Actual
|
|||||||||||||||||||||||||||||||||
|
Estimated
|
Actual
|
Actual
|
Nine
Months
|
Nine
Months
|
||||||||||||||||||||||||||||||
|
Q3:2006
|
Q2:2006
|
Q1:2006
|
Q4:2005
|
Q3:2005
|
Q2:2005
|
Q1:2005
|
Q4:2004
|
Q3:2004
|
Q3:2006
|
Q3:2005
|
||||||||||||||||||||||||
|
GAAP
net
income
|
$
|
32,416
|
$
|
31,410
|
$
|
28,015
|
$
|
42,496
|
$
|
55,899
|
$
|
40,915
|
$
|
60,563
|
$
|
54,414
|
$
|
72,342
|
$
|
91,841
|
$
|
157,377
|
||||||||||||
| GAAP/Tax differences: | ||||||||||||||||||||||||||||||||||
|
Interest
income and expense
|
11,062
|
15,048
|
6,216
|
(1,590
|
)
|
1,353
|
(4,868
|
)
|
(20,091
|
)
|
(7,519
|
)
|
(23,527
|
)
|
32,326
|
(23,606
|
)
|
|||||||||||||||||
|
Provision
for
credit losses
|
465
|
(2,506
|
)
|
176
|
876
|
(805
|
)
|
(1,527
|
)
|
1,025
|
1,697
|
1,528
|
(1,865
|
)
|
(1,307
|
)
|
||||||||||||||||||
|
Deductions
for
realized credit losses
|
(1,100
|
)
|
(686
|
)
|
(1,002
|
)
|
34
|
(562
|
)
|
(737
|
)
|
(438
|
)
|
(247
|
)
|
(127
|
)
|
(2,788
|
)
|
(1,737
|
)
|
|||||||||||||
|
Long-term
compensation
|
2,137
|
(165
|
)
|
2,520
|
944
|
2,892
|
2,138
|
1,969
|
(1,775
|
)
|
402
|
4,492
|
6,999
|
|||||||||||||||||||||
|
Stock
option
exercise deduction
|
(92
|
)
|
(7
|
)
|
(1,126
|
)
|
(202
|
)
|
(2,944
|
)
|
(143
|
)
|
(477
|
)
|
(3,094
|
)
|
(745
|
)
|
(1,225
|
)
|
(3,564
|
)
|
||||||||||||
|
Depreciation
of fixed assets
|
98
|
14
|
176
|
154
|
60
|
166
|
151
|
(176
|
)
|
(589
|
)
|
288
|
377
|
|||||||||||||||||||||
|
Other
operating expenses
|
75
|
(425
|
)
|
(261
|
)
|
(780
|
)
|
283
|
(31
|
)
|
69
|
(2,495
|
)
|
(34
|
)
|
(611
|
)
|
321
|
||||||||||||||||
|
Sale
of assets
to third parties
|
(5,362
|
)
|
(1,189
|
)
|
(798
|
)
|
(4,615
|
)
|
(8,041
|
)
|
(2,476
|
)
|
(967
|
)
|
1,428
|
(576
|
)
|
(7,349
|
)
|
(11,484
|
)
|
|||||||||||||
|
Call
income of
residential CES
|
-
|
-
|
204
|
(1,505
|
)
|
(319
|
)
|
120
|
(2,324
|
)
|
(2,872
|
)
|
(3,961
|
)
|
204
|
(2,523
|
)
|
|||||||||||||||||
|
(Loss)/gain
on
securitizations
|
2,266
|
-
|
-
|
-
|
(392
|
)
|
808
|
2,558
|
10,749
|
11,153
|
2,266
|
2,974
|
||||||||||||||||||||||
|
(Loss)/gain
on
intercompany sales and transfers
|
1,955
|
490
|
(19
|
)
|
(446
|
)
|
170
|
2,371
|
3,260
|
3,256
|
28
|
2,426
|
5,801
|
|||||||||||||||||||||
|
Market
valuation write downs
|
484
|
2,305
|
3,226
|
1,110
|
2,048
|
820
|
391
|
1,572
|
422
|
6,015
|
3,259
|
|||||||||||||||||||||||
|
Interest
rate
agreements
|
2,131
|
923
|
(451
|
)
|
799
|
216
|
53
|
202
|
(688
|
)
|
(278
|
)
|
2,603
|
471
|
||||||||||||||||||||
|
Provision
for
excise tax
|
327
|
295
|
295
|
280
|
285
|
308
|
307
|
(165
|
)
|
301
|
917
|
900
|
||||||||||||||||||||||
|
Provision
for
income tax
|
4,123
|
3,265
|
(703
|
)
|
4,096
|
5,013
|
3,035
|
134
|
4,827
|
2,834
|
6,685
|
8,182
|
||||||||||||||||||||||
|
Total
differences
|
18,569
|
17,362
|
8,453
|
(845
|
)
|
(743
|
)
|
37
|
(14,231
|
)
|
4,498
|
(13,169
|
)
|
44,384
|
(14,937
|
)
|
||||||||||||||||||
|
Total
taxable
income (pre-tax)
|
$
|
50,985
|
$
|
48,772
|
$
|
36,468
|
$
|
41,651
|
$
|
55,156
|
$
|
40,952
|
$
|
46,332
|
$
|
58,912
|
$
|
59,173
|
$
|
136,225
|
$
|
142,440
|
||||||||||||
|
Shares
outstanding at period end
|
26,053
|
25,668
|
25,382
|
25,133
|
24,764
|
24,647
|
24,514
|
24,154
|
23,346
|
26,053
|
24,764
|
|||||||||||||||||||||||
|
Total
taxable
income per share
|
$
|
1.95
|
$
|
1.90
|
$
|
1.44
|
$
|
1.66
|
$
|
2.23
|
$
|
1.66
|
$
|
1.89
|
$
|
2.44
|
$
|
2.53
|
$
|
5.29
|
$
|
5.78
|
||||||||||||
|
Table
4: Taxable Income (in thousands, except per share
data)
|
||||||||||||||||||||||||||||||||||
|
Estimated
|
Actual
|
|||||||||||||||||||||||||||||||||
|
Estimated
|
Actual
|
Actual
|
Nine
Months
|
Nine
Months
|
||||||||||||||||||||||||||||||
|
Q3:2006
|
Q2:2006
|
Q1:2006
|
Q4:2005
|
Q3:2005
|
Q2:2005
|
Q1:2005
|
Q4:2004
|
Q3:2004
|
Q3:2006
|
Q3:2005
|
||||||||||||||||||||||||
|
Total
taxable
income (pre-tax)
|
$
|
50,985
|
$
|
48,772
|
$
|
36,468
|
$
|
41,651
|
$
|
55,156
|
$
|
40,952
|
$
|
46,331
|
$
|
58,912
|
$
|
59,173
|
$
|
136,225
|
$
|
142,439
|
||||||||||||
|
Less:
net
gains (losses) from calls, sales and stock option
exercises
|
1,659
|
4,826
|
(630
|
)
|
6,863
|
14,160
|
5,365
|
17,586
|
18,553
|
26,176
|
5,855
|
37,111
|
||||||||||||||||||||||
|
Total
core
taxable income
|
$
|
49,326
|
$
|
43,946
|
$
|
37,098
|
$
|
34,788
|
$
|
40,996
|
$
|
35,587
|
$
|
28,745
|
$
|
40,359
|
$
|
32,997
|
$
|
130,370
|
$
|
179,550
|
||||||||||||
|
Total
taxable
income (pre-tax)
|
$
|
50,985
|
$
|
48,772
|
$
|
36,468
|
$
|
41,651
|
$
|
55,156
|
$
|
40,952
|
$
|
46,331
|
$
|
58,912
|
$
|
59,173
|
$
|
136,225
|
$
|
142,439
|
||||||||||||
|
Less:
REIT
taxable income (pre-tax)
|
45,751
|
45,040
|
35,382
|
39,957
|
47,118
|
39,237
|
45,161
|
50,009
|
49,030
|
126,173
|
131,516
|
|||||||||||||||||||||||
|
Taxable
income
in taxable subs (pre-tax)
|
$
|
5,234
|
$
|
3,732
|
$
|
1,086
|
$
|
1,694
|
$
|
8,038
|
$
|
1,715
|
$
|
1,170
|
$
|
8,903
|
$
|
10,143
|
$
|
10,052
|
$
|
10,923
|
||||||||||||
|
|
||||||||||||||||||||||||||||||||||
|
Core
REIT
taxable income
|
$
|
44,795
|
$
|
40,504
|
$
|
36,011
|
$
|
35,234
|
$
|
33,065
|
$
|
36,198
|
$
|
30,741
|
$
|
42,544
|
$
|
34,272
|
$
|
121,310
|
$
|
100,004
|
||||||||||||
|
Other
ordinary
REIT taxable income (expense)
|
1,054
|
4,370
|
(1,068
|
)
|
2,232
|
(2,160
|
)
|
3,166
|
(565
|
)
|
(3,094
|
)
|
(745
|
)
|
4,356
|
441
|
||||||||||||||||||
|
Ordinary
REIT
taxable income
|
45,849
|
44,874
|
34,943
|
37,466
|
30,905
|
39,364
|
30,176
|
39,450
|
33,527
|
125,666
|
100,445
|
|||||||||||||||||||||||
|
Net
long-term
capital gains
|
(98
|
)
|
166
|
439
|
2,491
|
16,213
|
(127
|
)
|
14,985
|
10,559
|
15,503
|
507
|
31,071
|
|||||||||||||||||||||
|
REIT
taxable
income (pre-tax)
|
$
|
45,751
|
$
|
45,040
|
$
|
35,382
|
$
|
39,957
|
$
|
47,118
|
$
|
39,237
|
$
|
45,161
|
$
|
50,009
|
$
|
49,030
|
$
|
126,173
|
$
|
131,516
|
||||||||||||
|
|
||||||||||||||||||||||||||||||||||
|
REIT
taxable
income (pre-tax)
|
$
|
45,751
|
$
|
45,040
|
$
|
35,382
|
$
|
39,957
|
$
|
47,118
|
$
|
39,237
|
$
|
45,161
|
$
|
50,009
|
$
|
49,030
|
$
|
126,173
|
$
|
131,516
|
||||||||||||
|
Excise
taxes
|
(327
|
)
|
(295
|
)
|
(295
|
)
|
(280
|
)
|
(285
|
)
|
(308
|
)
|
(307
|
)
|
293
|
(301
|
)
|
(917
|
)
|
(900
|
)
|
|||||||||||||
|
Income
taxes
|
(1,529
|
)
|
(1,802
|
)
|
(1,712
|
)
|
(867
|
)
|
(1,641
|
)
|
(1,830
|
)
|
(1,450
|
)
|
14
|
(1,537
|
)
|
(5,043
|
)
|
(4,921
|
)
|
|||||||||||||
|
REIT
taxable
income available for distribution
|
$
|
43,895
|
$
|
42,943
|
$
|
33,375
|
$
|
38,810
|
$
|
45,192
|
$
|
37,099
|
$
|
43,404
|
$
|
50,316
|
$
|
47,192
|
$
|
120,213
|
$
|
125,695
|
||||||||||||
|
Core
income
(loss) in taxable subs (pre-tax)
|
$
|
4,531
|
$
|
3,442
|
$
|
1,086
|
($445
|
)
|
$
|
7,931
|
($611
|
)
|
($1,996
|
)
|
($2,185
|
)
|
($1,275
|
)
|
$
|
9,059
|
$
|
5,324
|
||||||||||||
|
Income
from
calls and sales in taxable subs (pre-tax)
|
703
|
290
|
-
|
2,139
|
107
|
2,326
|
3,166
|
11,088
|
11,418
|
993
|
5,599
|
|||||||||||||||||||||||
|
Taxable
income
in taxable subs (pre-tax)
|
5,234
|
3,732
|
1,086
|
1,694
|
8,038
|
1,715
|
1,170
|
8,903
|
10,143
|
10,052
|
$
|
10,923
|
||||||||||||||||||||||
|
Income
tax for
taxable subs (actual tax due)
|
(2,078
|
)
|
(1,700
|
)
|
(530
|
)
|
(456
|
)
|
(3,652
|
)
|
(870
|
)
|
(830
|
)
|
(5,773
|
)
|
(4,574
|
)
|
(4,308
|
)
|
(5,352
|
)
|
||||||||||||
|
After-tax
income in taxable subs
|
$
|
3,156
|
$
|
2,032
|
$
|
556
|
$
|
1,238
|
$
|
4,386
|
$
|
845
|
$
|
340
|
$
|
3,130
|
$
|
5,569
|
$
|
5,744
|
$
|
5,571
|
||||||||||||
|
|
||||||||||||||||||||||||||||||||||
|
REIT
taxable
income available for distribution
|
$
|
43,895
|
$
|
42,943
|
$
|
33,375
|
$
|
38,810
|
$
|
45,192
|
$
|
37,099
|
$
|
43,404
|
$
|
50,316
|
$
|
47,192
|
$
|
120,213
|
$
|
125,695
|
||||||||||||
|
After-tax
income in taxable subs
|
3,156
|
2,032
|
556
|
1,238
|
4,386
|
845
|
340
|
3,130
|
5,569
|
5,744
|
5,571
|
|||||||||||||||||||||||
|
Total
taxable
income (after-tax)
|
$
|
47,051
|
$
|
44,975
|
$
|
33,931
|
$
|
40,048
|
$
|
49,578
|
$
|
37,944
|
$
|
43,744
|
$
|
53,446
|
$
|
52,761
|
$
|
125,957
|
$
|
131,266
|
||||||||||||
|
|
||||||||||||||||||||||||||||||||||
|
Taxable
income
(after-tax) retained in tax subs
|
$
|
3,156
|
$
|
2,032
|
$
|
556
|
$
|
1,238
|
$
|
4,386
|
$
|
845
|
$
|
340
|
$
|
3,130
|
$
|
5,569
|
$
|
5,744
|
$
|
5,571
|
||||||||||||
|
REIT
retained
taxable income (after-tax) (1)
|
2,500
|
2,166
|
1,313
|
1,910
|
1,164
|
1,798
|
1,261
|
4,252
|
1,515
|
5,978
|
4,223
|
|||||||||||||||||||||||
|
Total
retained
taxable earnings (after-tax)
|
$
|
5,656
|
$
|
4,198
|
$
|
1,869
|
$
|
3,148
|
$
|
5,551
|
$
|
2,643
|
$
|
1,601
|
$
|
7,382
|
$
|
7,084
|
$
|
11,722
|
$
|
9,794
|
||||||||||||
|
|
||||||||||||||||||||||||||||||||||
|
Shares
outstanding at period end (000)
|
26,053
|
25,668
|
25,382
|
25,133
|
24,764
|
24,647
|
24,514
|
24,154
|
23,346
|
26,053
|
24,764
|
|||||||||||||||||||||||
|
|
||||||||||||||||||||||||||||||||||
|
Per
share outstanding at quarter end
|
||||||||||||||||||||||||||||||||||
|
Total
taxable
income (pre-tax)
|
$
|
1.95
|
$
|
1.90
|
$
|
1.44
|
$
|
1.66
|
$
|
2.23
|
$
|
1.66
|
$
|
1.89
|
$
|
2.44
|
$
|
2.53
|
$
|
5.29
|
$
|
5.78
|
||||||||||||
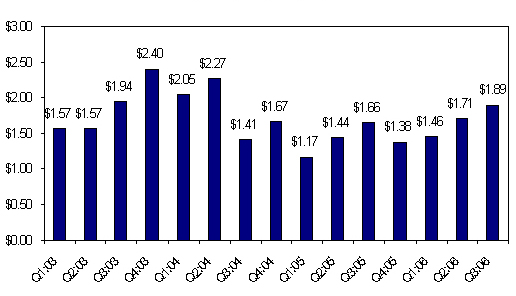
|
Core
taxable
income (pre-tax)
|
$
|
1.89
|
$
|
1.71
|
$
|
1.46
|
$
|
1.38
|
$
|
1.66
|
$
|
1.44
|
$
|
1.17
|
$
|
1.67
|
$
|
1.41
|
$
|
5.06
|
$
|
4.27
|
||||||||||||
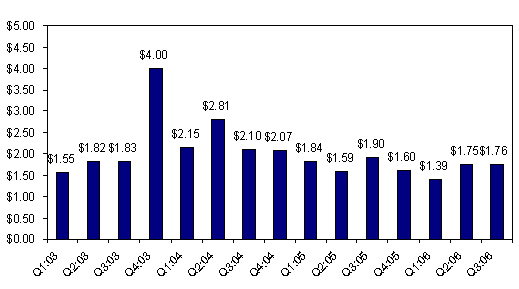
|
REIT
taxable
income (pre-tax)
|
$
|
1.76
|
$
|
1.75
|
$
|
1.39
|
$
|
1.60
|
$
|
1.90
|
$
|
1.59
|
$
|
1.84
|
$
|
2.07
|
$
|
2.10
|
$
|
4.90
|
$
|
5.33
|
||||||||||||
|
Taxable
income
at taxable subsidiaries
|
$
|
0.20
|
$
|
0.16
|
$
|
0.04
|
$
|
0.07
|
$
|
0.32
|
$
|
0.07
|
$
|
0.05
|
$
|
0.37
|
$
|
0.43
|
$
|
0.40
|
$
|
0.44
|
||||||||||||
|
Total
retained
taxable earnings (after-tax)
|
$
|
0.22
|
$
|
0.16
|
$
|
0.07
|
$
|
0.13
|
$
|
0.22
|
$
|
0.11
|
$
|
0.07
|
$
|
0.31
|
$
|
0.30
|
$
|
0.45
|
$
|
0.40
|
||||||||||||
|
Table
5: Retention and Distribution of Taxable Income (in thousands,
except per
share data)
|
||||||||||||||||||||||||||||||||||
|
Estimated
|
Actual
|
|||||||||||||||||||||||||||||||||
|
Estimated
|
Actual
|
Actual
|
Nine
Months
|
Nine
Months
|
||||||||||||||||||||||||||||||
|
Q3:2006
|
Q2:2006
|
Q1:2006
|
Q4:2005
|
Q3:2005
|
Q2:2005
|
Q1:2005
|
Q4:2004
|
Q3:2004
|
Q3:2006
|
Q3:2005
|
||||||||||||||||||||||||
|
Dividends
declared
|
$
|
18,237
|
$
|
17,967
|
$
|
17,767
|
$
|
92,150
|
$
|
17,335
|
$
|
17,253
|
$
|
17,160
|
$
|
146,707
|
$
|
15,642
|
$
|
53,971
|
$
|
51,748
|
||||||||||||
|
Dividend
deduction on stock issued through DRIP
|
177
|
239
|
176
|
263
|
128
|
112
|
56
|
1,048
|
844
|
592
|
296
|
|||||||||||||||||||||||
|
Total
dividend
deductions
|
$
|
18,414
|
$
|
18,206
|
$
|
17,943
|
$
|
92,413
|
$
|
17,463
|
$
|
17,365
|
$
|
17,216
|
$
|
147,755
|
$
|
16,486
|
$
|
54,563
|
$
|
52,044
|
||||||||||||
|
|
||||||||||||||||||||||||||||||||||
|
Regular
dividend per share
|
$
|
0.70
|
$
|
0.70
|
$
|
0.70
|
$
|
0.70
|
$
|
0.70
|
$
|
0.70
|
$
|
0.70
|
$
|
0.67
|
$
|
0.67
|
$
|
2.10
|
$
|
2.10
|
||||||||||||
|
Special
dividend per share
|
-
|
-
|
3.00
|
-
|
-
|
-
|
5.50
|
-
|
-
|
-
|
||||||||||||||||||||||||
|
Total
dividends per share
|
$
|
0.70
|
$
|
0.70
|
$
|
0.70
|
$
|
3.70
|
$
|
0.70
|
$
|
0.70
|
$
|
0.70
|
$
|
6.17
|
$
|
0.67
|
$
|
2.10
|
$
|
2.10
|
||||||||||||
|
|
||||||||||||||||||||||||||||||||||
|
Undistributed
REIT taxable income at beginning of period (pre-tax):
|
$
|
88,422
|
$
|
65,851
|
$
|
51,732
|
$
|
106,719
|
$
|
80,166
|
$
|
62,218
|
$
|
37,291
|
$
|
138,981
|
$
|
109,790
|
$
|
51,732
|
$
|
37,291
|
||||||||||||
|
REIT
taxable
income (pre-tax)
|
45,751
|
45,040
|
35,382
|
39,957
|
47,118
|
39,237
|
45,161
|
50,009
|
49,030
|
126,173
|
131,516
|
|||||||||||||||||||||||
|
Permanently
retained (pre-tax)
|
(4,356
|
)
|
(4,263
|
)
|
(3,320
|
)
|
(2,531
|
)
|
(3,102
|
)
|
(3,924
|
)
|
(3,018
|
)
|
(3,944
|
)
|
(3,353
|
)
|
(11,939
|
)
|
(10,044
|
)
|
||||||||||||
|
Dividend
of
2003 income
|
-
|
-
|
-
|
-
|
-
|
-
|
-
|
-
|
(14,413
|
)
|
-
|
-
|
||||||||||||||||||||||
|
Dividend
of
2004 income
|
-
|
-
|
-
|
-
|
(2,710
|
)
|
(17,365
|
)
|
(17,216
|
)
|
(147,755
|
)
|
(2,073
|
)
|
-
|
(37,291
|
)
|
|||||||||||||||||
|
Dividend
of
2005 income
|
(15,582
|
)
|
(18,206
|
)
|
(17,943
|
)
|
(92,413
|
)
|
(14,753
|
)
|
-
|
-
|
-
|
-
|
(51,731
|
)
|
(14,753
|
)
|
||||||||||||||||
|
Dividend
of
2006 income
|
(2,832
|
)
|
-
|
-
|
-
|
-
|
-
|
-
|
-
|
-
|
(2,832
|
)
|
-
|
|||||||||||||||||||||
|
Undistributed
REIT taxable income at end of period (pre-tax):
|
$
|
111,403
|
$
|
88,422
|
$
|
65,851
|
$
|
51,732
|
$
|
106,719
|
$
|
80,166
|
$
|
62,218
|
$
|
37,291
|
$
|
138,981
|
$
|
111,403
|
$
|
106,719
|
||||||||||||
|
Undistributed
REIT taxable income (pre-tax)
|
||||||||||||||||||||||||||||||||||
|
From
2003's
income
|
$
|
-
|
$
|
-
|
$
|
-
|
$
|
-
|
$
|
-
|
$
|
-
|
$
|
-
|
$
|
-
|
$
|
-
|
$
|
-
|
$
|
-
|
||||||||||||
|
From
2004's
income
|
-
|
-
|
-
|
-
|
-
|
2,710
|
20,075
|
37,291
|
138,981
|
-
|
-
|
|||||||||||||||||||||||
|
From
2005's
income
|
-
|
15,583
|
33,789
|
51,732
|
106,719
|
77,456
|
42,143
|
-
|
-
|
-
|
106,719
|
|||||||||||||||||||||||
|
From
2006's
income
|
111,403
|
72,839
|
32,062
|
-
|
-
|
-
|
-
|
-
|
-
|
111,403
|
-
|
|||||||||||||||||||||||
|
Total
|
$
|
111,403
|
$
|
88,422
|
$
|
65,851
|
$ |
51,732
|
$
|
106,719
|
$
|
80,166
|
$
|
62,218
|
$
|
37,291
|
$
|
138,981
|
$
|
111,403
|
$
|
106,719
|
||||||||||||
|
Table
6: Assets (in millions)
|
||||||||||||||||||||||||||||
|
Q3:2006
|
Q2:2006
|
Q1:2006
|
Q4:2005
|
Q3:2005
|
Q2:2005
|
Q1:2005
|
Q4:2004
|
Q3:2004
|
||||||||||||||||||||
|
Residential
loans owned by Redwood
|
$
|
520
|
$
|
351
|
$
|
87
|
$
|
45
|
$
|
17
|
$
|
300
|
$
|
256
|
$
|
193
|
$
|
259
|
||||||||||
|
Residential
loans consolidated from entities
|
9,205
|
9,962
|
11,741
|
13,649
|
16,324
|
19,083
|
21,237
|
22,015
|
21,299
|
|||||||||||||||||||
|
Total
GAAP
residential loans
|
9,725
|
10,313
|
11,828
|
13,694
|
16,341
|
19,383
|
21,493
|
22,208
|
21,558
|
|||||||||||||||||||
|
HELOC
loans
owned by Redwood
|
-
|
-
|
-
|
-
|
-
|
-
|
-
|
-
|
-
|
|||||||||||||||||||
|
HELOC
loans
consolidated from entities
|
118
|
140
|
162
|
181
|
215
|
247
|
279
|
296
|
317
|
|||||||||||||||||||
|
Total
GAAP
HELOC loans
|
118
|
140
|
162
|
181
|
215
|
247
|
279
|
296
|
317
|
|||||||||||||||||||
|
Commercial
loans owned by Redwood
|
2
|
2
|
2
|
7
|
21
|
16
|
22
|
32
|
21
|
|||||||||||||||||||
|
Commercial
loans consolidated from entities
|
30
|
36
|
53
|
53
|
35
|
26
|
35
|
22
|
12
|
|||||||||||||||||||
|
Total
GAAP
commercial loans
|
32
|
38
|
55
|
60
|
56
|
42
|
57
|
54
|
33
|
|||||||||||||||||||
|
Residential
CES owned by Redwood
|
291
|
409
|
305
|
311
|
338
|
469
|
373
|
351
|
327
|
|||||||||||||||||||
|
Residential
CES consolidated from entities
|
451
|
306
|
339
|
302
|
326
|
237
|
238
|
211
|
170
|
|||||||||||||||||||
|
Total
GAAP
residential CES
|
742
|
715
|
644
|
613
|
664
|
706
|
611
|
562
|
497
|
|||||||||||||||||||
|
Commercial
first-loss CES owned by Redwood
|
117
|
76
|
67
|
58
|
44
|
29
|
29
|
14
|
9
|
|||||||||||||||||||
|
Commercial
first-loss CES consolidated from entities
|
-
|
-
|
-
|
-
|
-
|
-
|
-
|
-
|
-
|
|||||||||||||||||||
|
Total
GAAP
Commercial First Loss CES
|
117
|
76
|
67
|
58
|
44
|
29
|
29
|
14
|
9
|
|||||||||||||||||||
|
Other
securities owned by Redwood
|
156
|
240
|
53
|
167
|
234
|
208
|
70
|
115
|
161
|
|||||||||||||||||||
|
Other
securities consolidated from entities
|
1,897
|
1,630
|
1,765
|
1,582
|
1,549
|
1,441
|
1,435
|
1,266
|
1,069
|
|||||||||||||||||||
|
Total
GAAP
other securities
|
2,053
|
1,870
|
1,818
|
1,749
|
1,783
|
1,649
|
1,505
|
1,381
|
1,230
|
|||||||||||||||||||
|
Cash
owned by
Redwood
|
113
|
106
|
85
|
176
|
163
|
72
|
65
|
57
|
76
|
|||||||||||||||||||
|
Restricted
cash consolidated from entities
|
139
|
86
|
131
|
72
|
59
|
48
|
58
|
36
|
45
|
|||||||||||||||||||
|
Accrued
interest receivable
|
67
|
67
|
73
|
76
|
80
|
85
|
82
|
72
|
62
|
|||||||||||||||||||
|
Principal
receivable
|
1
|
1
|
2
|
-
|
2
|
-
|
-
|
3
|
1
|
|||||||||||||||||||
|
Interest
rate
agreements
|
30
|
54
|
48
|
31
|
25
|
13
|
29
|
16
|
10
|
|||||||||||||||||||
|
Deferred
tax
asset
|
3
|
5
|
5
|
5
|
8
|
7
|
8
|
11
|
9
|
|||||||||||||||||||
|
Deferred
asset-backed security issuance costs
|
47
|
46
|
52
|
54
|
56
|
59
|
63
|
61
|
58
|
|||||||||||||||||||
|
Other
assets
|
13
|
13
|
10
|
8
|
9
|
6
|
6
|
7
|
7
|
|||||||||||||||||||
|
Total
GAAP
assets
|
$
|
13,200
|
$
|
13,530
|
$
|
14,979
|
$
|
16,777
|
$
|
19,505
|
$
|
22,346
|
$
|
24,285
|
$
|
24,778
|
$
|
23,912
|
||||||||||
|
Residential
loans owned by Redwood
|
$
|
520
|
$
|
351
|
$
|
87
|
$
|
45
|
$
|
17
|
$
|
300
|
$
|
256
|
$
|
193
|
$
|
259
|
||||||||||
|
HELOC
loans
owned by Redwood
|
-
|
-
|
-
|
-
|
-
|
-
|
-
|
-
|
-
|
|||||||||||||||||||
|
Commercial
loans owned by Redwood
|
2
|
2
|
2
|
7
|
21
|
16
|
22
|
32
|
21
|
|||||||||||||||||||
|
Residential
CES owned by Redwood
|
291
|
409
|
305
|
311
|
338
|
469
|
373
|
351
|
327
|
|||||||||||||||||||
|
Commercial
CES
owned by Redwood
|
117
|
76
|
67
|
58
|
44
|
29
|
29
|
14
|
9
|
|||||||||||||||||||
|
Other
securities owned by Redwood
|
156
|
240
|
53
|
167
|
234
|
208
|
70
|
129
|
170
|
|||||||||||||||||||
|
Cash
owned by
Redwood
|
113
|
106
|
85
|
176
|
163
|
72
|
65
|
57
|
76
|
|||||||||||||||||||
|
Assets
of
securitizations for GAAP
|
11,701
|
12,074
|
14,060
|
15,767
|
18,449
|
21,034
|
23,224
|
23,810
|
22,867
|
|||||||||||||||||||
|
ABS
liabilities of entities for GAAP
|
(11,554
|
)
|
(11,898
|
)
|
(13,930
|
)
|
(15,585
|
)
|
(18,238
|
)
|
(20,815
|
)
|
(23,057
|
)
|
(23,630
|
)
|
(22,680
|
)
|
||||||||||
|
Redwood
earning assets - GAAP basis
|
$
|
1,346
|
$
|
1,360
|
$
|
729
|
$
|
946
|
$
|
1,028
|
$
|
1,313
|
$
|
982
|
$
|
956
|
$
|
1,049
|
||||||||||
|
Table
7: Liabilities and Equity (all $ in millions)
|
||||||||||||||||||||||||||||
|
Q3:2006
|
Q2:2006
|
Q1:2006
|
Q4:2005
|
Q3:2005
|
Q2:2005
|
Q1:2005
|
Q4:2004
|
Q3:2004
|
||||||||||||||||||||
|
Redwood
debt:
short-term
|
$
|
510
|
$
|
529
|
$
|
-
|
$
|
170
|
$
|
162
|
$
|
453
|
$
|
199
|
$
|
203
|
$
|
246
|
||||||||||
|
Redwood
debt:
long-term
|
-
|
-
|
-
|
-
|
-
|
-
|
-
|
-
|
-
|
|||||||||||||||||||
|
Redwood
debt
|
510
|
529
|
-
|
170
|
162
|
453
|
199
|
203
|
246
|
|||||||||||||||||||
|
ABS
issued,
consolidated from entities
|
11,466
|
11,775
|
13,788
|
15,422
|
18,049
|
20,598
|
22,821
|
23,383
|
22,449
|
|||||||||||||||||||
|
Unamortized
IO
issuance premium
|
90
|
106
|
124
|
143
|
163
|
186
|
202
|
210
|
185
|
|||||||||||||||||||
|
Unamortized
ABS issuance premium
|
(2
|
)
|
17
|
18
|
20
|
25
|
31
|
34
|
37
|
46
|
||||||||||||||||||
|
ABS
obligations of entities
|
11,554
|
11,898
|
13,930
|
15,585
|
18,237
|
20,815
|
23,057
|
23,630
|
22,680
|
|||||||||||||||||||
|
Accrued
interest payable
|
51
|
47
|
43
|
41
|
42
|
43
|
38
|
35
|
29
|
|||||||||||||||||||
|
Interest
rate
agreements
|
6
|
4
|
-
|
1
|
1
|
3
|
-
|
1
|
7
|
|||||||||||||||||||
|
Accrued
expenses and other liabilities
|
18
|
29
|
21
|
28
|
30
|
23
|
26
|
29
|
32
|
|||||||||||||||||||
|
Dividends
payable
|
18
|
18
|
18
|
17
|
17
|
17
|
17
|
16
|
16
|
|||||||||||||||||||
|
Total
GAAP
liabilities
|
12,157
|
12,525
|
14,012
|
15,842
|
18,489
|
21,354
|
23,337
|
23,914
|
23,010
|
|||||||||||||||||||
|
Common
stock
and paid-in capital
|
875
|
854
|
839
|
825
|
808
|
803
|
795
|
773
|
727
|
|||||||||||||||||||
|
Accumulated
other comprehensive income
|
95
|
91
|
82
|
74
|
117
|
137
|
125
|
105
|
97
|
|||||||||||||||||||
|
Cumulative
GAAP earnings
|
773
|
740
|
709
|
681
|
639
|
583
|
542
|
482
|
427
|
|||||||||||||||||||
|
Cumulative
distributions to shareholders
|
(700
|
)
|
(681
|
)
|
(663
|
)
|
(645
|
)
|
(548
|
)
|
(531
|
)
|
(514
|
)
|
(496
|
)
|
(349
|
)
|
||||||||||
|
GAAP
stockholders' equity
|
1,043
|
1,004
|
967
|
935
|
1,016
|
992
|
948
|
864
|
902
|
|||||||||||||||||||
|
Total
GAAP
liabilities and equity
|
$
|
13,200
|
$
|
13,530
|
$
|
14,979
|
$
|
16,777
|
$
|
19,505
|
$
|
22,346
|
$
|
24,285
|
$
|
24,778
|
$
|
23,912
|
||||||||||
|
Redwood
debt
|
$
|
510
|
$
|
529
|
$
|
-
|
$
|
170
|
$
|
162
|
$
|
453
|
$
|
199
|
$
|
203
|
$
|
246
|
||||||||||
|
GAAP
stockholders' equity
|
1,043
|
1,004
|
967
|
935
|
1016
|
992
|
948
|
864
|
902
|
|||||||||||||||||||
|
Redwood
total
capital
|
$
|
1,553
|
$
|
1,533
|
$
|
967
|
$
|
1,105
|
$
|
1,178
|
$
|
1,445
|
$
|
1,147
|
$
|
1,067
|
$
|
1,148
|
||||||||||
|
Redwood
debt
to stockholders' equity
|
49
|
%
|
53
|
%
|
0
|
%
|
18
|
%
|
16
|
%
|
46
|
%
|
21
|
%
|
23
|
%
|
27
|
%
|
||||||||||
|
Redwood
debt
to capital
|
33
|
%
|
35
|
%
|
0
|
%
|
15
|
%
|
14
|
%
|
31
|
%
|
17
|
%
|
19
|
%
|
21
|
%
|
||||||||||
|
Redwood
earning assets
|
$
|
1,346
|
$
|
1,360
|
$
|
729
|
$
|
946
|
$
|
1,028
|
$
|
1,313
|
$
|
982
|
$
|
956
|
$
|
1,049
|
||||||||||
|
Redwood
debt
|
510
|
529
|
-
|
170
|
162
|
453
|
199
|
203
|
246
|
|||||||||||||||||||
|
Redwood
net
earning assets (GAAP basis)
|
836
|
831
|
729
|
776
|
866
|
860
|
783
|
739
|
794
|
|||||||||||||||||||
|
Working
capital and other
|
207
|
173
|
238
|
159
|
150
|
132
|
165
|
125
|
108
|
|||||||||||||||||||
|
GAAP
stockholders' equity
|
$
|
1,043
|
$
|
1,004
|
$
|
967
|
$
|
935
|
$
|
1,016
|
$
|
992
|
$
|
948
|
$
|
864
|
$
|
902
|
||||||||||
|
Equity
to
earning assets
|
77
|
%
|
74
|
%
|
133
|
%
|
99
|
%
|
99
|
%
|
76
|
%
|
97
|
%
|
92
|
%
|
87
|
%
|
||||||||||
|
Table
8: Book Value and Profitability Ratios (all $ in thousands, except
per
share data)
|
||||||||||||||||||||||||||||||||||
|
Nine
Months
|
Nine
Months
|
|||||||||||||||||||||||||||||||||
|
Q3:2006
|
Q2:2006
|
Q1:2006
|
Q4:2005
|
Q3:2005
|
|
Q2:2005
|
Q1:2005
|
Q4:2004
|
Q3:2004
|
Q3:2006
|
Q3:2005
|
|||||||||||||||||||||||
|
|
||||||||||||||||||||||||||||||||||
|
GAAP
stockholders' equity
|
$
|
1,042,661
|
$
|
1,004,265
|
$
|
967,333
|
$
|
934,960
|
$
|
1,016,065
|
$
|
991,757
|
$
|
948,001
|
$
|
864,156
|
$
|
901,841
|
$
|
1,042,661
|
$
|
1,016,065
|
||||||||||||
|
Balance
sheet
mark-to-market adjustments
|
94,780
|
90,937
|
81,591
|
73,731
|
117,043
|
137,380
|
124,784
|
105,357
|
96,452
|
94,780
|
117,043
|
|||||||||||||||||||||||
|
Core
equity
|
$
|
947,881
|
$
|
913,328
|
$
|
885,742
|
$
|
861,229
|
$
|
899,022
|
$
|
854,377
|
$
|
823,217
|
$
|
758,799
|
$
|
805,389
|
$
|
947,881
|
$
|
899,022
|
||||||||||||
|
Core
equity
|
$
|
947,881
|
$
|
913,328
|
$
|
885,742
|
$
|
861,229
|
$
|
899,022
|
$
|
854,377
|
$
|
823,217
|
$
|
758,799
|
$
|
805,389
|
$
|
947,881
|
$
|
899,022
|
||||||||||||
|
REIT
taxable
income yet to be distributed as dividends
|
111,403
|
88,421
|
65,851
|
51,732
|
106,719
|
80,166
|
62,218
|
37,291
|
138,982
|
111,403
|
106,719
|
|||||||||||||||||||||||
|
Adjusted
core
equity
|
$
|
836,478
|
$
|
824,907
|
$
|
819,891
|
$
|
809,497
|
$
|
792,303
|
$
|
774,211
|
$
|
760,999
|
$
|
721,508
|
$
|
666,407
|
$
|
836,478
|
$
|
792,303
|
||||||||||||
|
Shares
outstanding at quarter end
|
26,053
|
25,668
|
25,382
|
25,133
|
24,764
|
24,647
|
24,514
|
24,154
|
23,346
|
26,053
|
24,764
|
|||||||||||||||||||||||
|
GAAP
equity
per share
|
$
|
40.02
|
$
|
39.13
|
$
|
38.11
|
$
|
37.20
|
$
|
41.03
|
$
|
40.24
|
$
|
38.67
|
$
|
35.78
|
$
|
38.63
|
$
|
40.02
|
$
|
41.03
|
||||||||||||
|
Core
equity
per share
|
$
|
36.38
|
$
|
35.58
|
$
|
34.90
|
$
|
34.27
|
$
|
36.30
|
$
|
34.66
|
$
|
33.58
|
$
|
31.42
|
$
|
34.50
|
$
|
36.38
|
$
|
36.30
|
||||||||||||
|
Adjusted
core
equity per share
|
$
|
32.11
|
$
|
32.14
|
$
|
32.30
|
$
|
32.21
|
$
|
31.99
|
$
|
31.41
|
$
|
31.04
|
$
|
29.87
|
$
|
28.55
|
$
|
32.11
|
$
|
31.99
|
||||||||||||
|
Net
interest
income (NII)
|
$
|
48,976
|
$
|
44,719
|
$
|
45,227
|
$
|
41,483
|
$
|
48,040
|
$
|
53,380
|
$
|
62,026
|
$
|
58,385
|
$
|
67,547
|
$
|
138,922
|
$
|
163,445
|
||||||||||||
|
Net
interest
income / average core equity
|
21
|
%
|
20
|
%
|
21
|
%
|
19
|
%
|
22
|
%
|
25
|
%
|
31
|
%
|
30
|
%
|
39
|
%
|
22
|
%
|
28
|
%
|
||||||||||||
|
Operating
expenses
|
$
|
13,455
|
$
|
16,037
|
$
|
12,582
|
$
|
12,765
|
$
|
12,364
|
$
|
11,456
|
$
|
11,798
|
$
|
7,991
|
$
|
10,829
|
$
|
42,074
|
$
|
35,618
|
||||||||||||
|
Operating
expenses / Net interest income (NII)
|
27
|
%
|
36
|
%
|
28
|
%
|
31
|
%
|
26
|
%
|
21
|
%
|
19
|
%
|
14
|
%
|
16
|
%
|
30
|
%
|
22
|
%
|
||||||||||||
|
GAAP
net
income
|
$
|
32,416
|
$
|
31,410
|
$
|
28,015
|
$
|
42,496
|
$
|
55,899
|
$
|
40,915
|
$
|
60,563
|
$
|
54,414
|
$
|
72,342
|
$
|
91,841
|
$
|
157,376
|
||||||||||||
|
GAAP
net
income/average core equity (adjusted ROE)
|
14
|
%
|
14
|
%
|
13
|
%
|
19
|
%
|
25
|
%
|
19
|
%
|
30
|
%
|
28
|
%
|
42
|
%
|
14
|
%
|
25
|
%
|
||||||||||||
|
Core
earnings
|
$
|
31,983
|
$
|
25,417
|
$
|
29,885
|
$
|
24,596
|
$
|
30,967
|
$
|
37,872
|
$
|
45,467
|
$
|
45,565
|
$
|
51,969
|
$
|
87,285
|
$
|
114,306
|
||||||||||||
|
Core
earnings/average core equity
|
14
|
%
|
11
|
%
|
14
|
%
|
11
|
%
|
14
|
%
|
18
|
%
|
23
|
%
|
23
|
%
|
30
|
%
|
13
|
%
|
18
|
%
|
||||||||||||
|
Table
9: Average Balance Sheet (in thousands)
|
||||||||||||||||||||||||||||||||||
|
Nine
Months
|
Nine
Months
|
|||||||||||||||||||||||||||||||||
|
Q3:2006
|
Q2:2006
|
Q1:2006
|
Q4:2005
|
Q3:2005
|
Q2:2005
|
Q1:2005
|
Q4:2004
|
Q3:2004
|
Q3:2006
|
Q3:2005
|
||||||||||||||||||||||||
|
Average
real
estate loans
|
$
|
9,979,261
|
$
|
10,832,187
|
$
|
12,599,296
|
$
|
14,880,636
|
$
|
17,645,610
|
$
|
20,357,699
|
$
|
21,981,723
|
$
|
22,059,853
|
$
|
20,840,848
|
$
|
11,127,318
|
$
|
19,979,127
|
||||||||||||
|
Average
real
estate securities
|
2,697,903
|
2,502,926
|
2,386,493
|
2,322,337
|
2,305,361
|
2,123,630
|
1,936,154
|
1,703,407
|
1,517,715
|
2,530,248
|
2,123,067
|
|||||||||||||||||||||||
|
Average
cash
and cash equivalents
|
183,323
|
246,597
|
244,002
|
339,379
|
134,422
|
124,707
|
124,685
|
126,556
|
101,937
|
224,418
|
127,974
|
|||||||||||||||||||||||
|
Average
earning assets
|
12,860,487
|
13,581,710
|
15,229,791
|
17,542,352
|
20,085,393
|
22,606,036
|
24,042,562
|
23,889,816
|
22,460,500
|
13,881,984
|
22,230,168
|
|||||||||||||||||||||||
|
Average
other
assets
|
619,874
|
587,045
|
609,692
|
806,329
|
905,906
|
759,517
|
520,622
|
430,219
|
416,736
|
605,574
|
730,136
|
|||||||||||||||||||||||
|
Average
total
assets
|
$
|
13,480,361
|
$
|
14,168,755
|
$
|
15,839,483
|
$
|
18,348,681
|
$
|
20,991,299
|
$
|
23,365,553
|
$
|
24,563,184
|
$
|
24,320,035
|
$
|
22,877,236
|
$
|
14,487,558
|
$
|
22,960,304
|
||||||||||||
|
Average
Redwood debt
|
$
|
647,978
|
$
|
85,616
|
$
|
137,181
|
$
|
253,302
|
$
|
297,788
|
$
|
216,639
|
$
|
277,423
|
$
|
348,177
|
$
|
404,589
|
$
|
292,129
|
$
|
264,024
|
||||||||||||
|
Average
asset-backed securities issued
|
11,684,412
|
12,969,801
|
14,663,134
|
16,941,243
|
19,542,413
|
22,067,276
|
23,324,111
|
22,956,247
|
21,606,164
|
13,094,871
|
21,630,747
|
|||||||||||||||||||||||
|
Average
total
obligations
|
12,332,390
|
13,055,417
|
14,800,315
|
17,194,545
|
19,840,201
|
22,283,915
|
23,601,534
|
23,304,424
|
22,010,753
|
13,387,000
|
21,894,771
|
|||||||||||||||||||||||
|
Average
other
liabilities
|
136,362
|
132,936
|
86,938
|
154,823
|
136,769
|
111,294
|
66,188
|
145,752
|
64,916
|
118,926
|
105,053
|
|||||||||||||||||||||||
|
Average
total
liabilities
|
12,468,752
|
13,188,353
|
14,887,253
|
17,349,368
|
19,976,970
|
22,395,209
|
23,667,722
|
23,450,176
|
22,075,669
|
13,505,926
|
21,999,824
|
|||||||||||||||||||||||
|
Average
core
equity
|
932,030
|
898,409
|
877,212
|
880,329
|
880,482
|
840,098
|
794,866
|
776,833
|
695,488
|
902,752
|
838,824
|
|||||||||||||||||||||||
|
Average
balance sheet mark-to-market adjustments
|
79,579
|
81,993
|
75,018
|
118,984
|
133,847
|
130,246
|
100,596
|
93,026
|
106,079
|
78,880
|
121,656
|
|||||||||||||||||||||||
|
Average
total
equity
|
1,011,609
|
980,402
|
952,230
|
999,313
|
1,014,329
|
970,344
|
895,462
|
869,859
|
801,567
|
981,632
|
960,480
|
|||||||||||||||||||||||
|
Average
total
liabilities and equity
|
$
|
13,480,361
|
$
|
14,168,755
|
$
|
15,839,483
|
$
|
18,348,681
|
$
|
20,991,299
|
$
|
23,365,553
|
$
|
24,563,184
|
$
|
24,320,035
|
$
|
22,877,236
|
$
|
14,487,558
|
$
|
22,960,304
|
||||||||||||
|
Table
10: Balances & Yields (all $ in thousands)
|
||||||||||||||||||||||||||||
|
At
period end
|
For
period ended
|
|||||||||||||||||||||||||||
|
Current
Face
|
Unamortized
Premium/ (Discount)
|
Credit
Protection
|
UnrealizedGain
/ (Loss)
|
Net
Book Value
|
Average
Balance
|
Interest
Income
|
Yield
|
|||||||||||||||||||||
|
Total
Earning Assets (GAAP)
|
Q3:
2004
|
$
|
23,883,198
|
$
|
102,744
|
($356,371
|
)
|
$
|
90,818
|
$
|
23,720,389
|
$
|
22,460,501
|
$
|
182,358
|
3.25
|
%
|
|||||||||||
|
|
Q4:
2004
|
24,794,021
|
104,063
|
(420,757
|
)
|
95,396
|
24,572,723
|
23,889,816
|
205,469
|
3.44
|
%
|
|||||||||||||||||
|
2004
|
24,794,021
|
101,480
|
(418,174
|
)
|
95,396
|
24,572,723
|
21,208,757
|
651,618
|
3.07
|
%
|
||||||||||||||||||
|
|
Q1:
2005
|
24,301,644
|
122,952
|
(487,952
|
)
|
102,711
|
24,039,355
|
24,042,562
|
237,922
|
3.96
|
%
|
|||||||||||||||||
|
|
Q2:
2005
|
22,414,482
|
103,779
|
(522,490
|
)
|
133,210
|
22,128,981
|
22,606,036
|
248,505
|
4.40
|
%
|
|||||||||||||||||
|
|
Q3:
2005
|
19,625,979
|
94,058
|
(551,562
|
)
|
98,874
|
19,267,349
|
20,085,393
|
244,631
|
4.87
|
%
|
|||||||||||||||||
|
|
Q4:
2005
|
16,986,581
|
13,376
|
(527,213
|
)
|
56,542
|
16,529,286
|
17,542,352
|
231,082
|
5.27
|
%
|
|||||||||||||||||
|
2005
|
16,986,581
|
13,376
|
(527,213
|
)
|
56,542
|
16,529,286
|
21,048,582
|
962,140
|
4.57
|
%
|
||||||||||||||||||
|
|
Q1:
2006
|
15,168,319
|
12,215
|
(572,066
|
)
|
50,480
|
14,658,948
|
15,229,791
|
225,882
|
5.93
|
%
|
|||||||||||||||||
|
|
Q2:
2006
|
13,865,565
|
(18,160
|
)
|
(645,303
|
)
|
56,652
|
13,258,755
|
13,581,710
|
218,238
|
6.43
|
%
|
||||||||||||||||
|
|
Q3:
2006
|
13,553,988
|
(72,430
|
)
|
(670,246
|
)
|
88,943
|
12,900,255
|
12,860,487
|
223,649
|
6.96
|
%
|
||||||||||||||||
|
Residential
Real Estate Loans
|
Q3:
2004
|
21,690,481
|
206,501
|
(21,875
|
)
|
-
|
21,875,107
|
20,807,387
|
151,860
|
2.92
|
%
|
|||||||||||||||||
|
|
Q4:
2004
|
22,312,842
|
215,694
|
(23,771
|
)
|
-
|
22,504,765
|
22,020,017
|
171,299
|
3.11
|
%
|
|||||||||||||||||
|
2004
|
22,312,842
|
215,694
|
(23,771
|
)
|
-
|
22,504,765
|
19,665,096
|
533,376
|
2.71
|
%
|
||||||||||||||||||
|
|
Q1:
2005
|
21,579,671
|
217,852
|
(24,827
|
)
|
-
|
21,772,696
|
21,925,643
|
197,701
|
3.61
|
%
|
|||||||||||||||||
|
|
Q2:
2005
|
19,443,387
|
210,137
|
(22,959
|
)
|
-
|
19,630,565
|
20,312,485
|
206,263
|
4.06
|
%
|
|||||||||||||||||
|
|
Q3:
2005
|
16,386,833
|
191,513
|
(22,029
|
)
|
-
|
16,556,317
|
17,597,907
|
193,621
|
4.40
|
%
|
|||||||||||||||||
|
|
Q4:
2005
|
13,719,242
|
178,206
|
(22,656
|
)
|
-
|
13,874,792
|
14,821,587
|
176,599
|
4.77
|
%
|
|||||||||||||||||
|
2005
|
13,719,242
|
178,206
|
(22,656
|
)
|
-
|
13,874,792
|
18,642,020
|
774,184
|
4.15
|
%
|
||||||||||||||||||
|
|
Q1:
2006
|
11,846,454
|
166,134
|
(22,372
|
)
|
-
|
11,990,216
|
12,542,519
|
165,665
|
5.28
|
%
|
|||||||||||||||||
|
|
Q2:
2006
|
10,318,641
|
155,101
|
(19,450
|
)
|
-
|
10,454,292
|
10,789,275
|
154,160
|
5.72
|
%
|
|||||||||||||||||
|
|
Q3:
2006
|
9,718,985
|
143,135
|
(19,326
|
)
|
-
|
9,842,794
|
9,947,068
|
148,494
|
5.97
|
%
|
|||||||||||||||||
|
Commercial
Real Estate Loans
|
Q3:
2004
|
43,410
|
(1,380
|
)
|
(8,641
|
)
|
-
|
33,389
|
33,461
|
1,038
|
12.41
|
%
|
||||||||||||||||
|
|
Q4:
2004
|
65,598
|
(2,478
|
)
|
(8,641
|
)
|
-
|
54,479
|
39,836
|
1,162
|
11.67
|
%
|
||||||||||||||||
|
2004
|
65,598
|
(2,478
|
)
|
(8,641
|
)
|
-
|
54,479
|
30,469
|
3,769
|
12.37
|
%
|
|||||||||||||||||
|
|
Q1:
2005
|
67,365
|
(2,305
|
)
|
(8,456
|
)
|
-
|
56,604
|
56,080
|
1,587
|
11.32
|
%
|
||||||||||||||||
|
|
Q2:
2005
|
51,778
|
(1,843
|
)
|
(8,141
|
)
|
-
|
41,794
|
45,214
|
1,208
|
10.69
|
%
|
||||||||||||||||
|
|
Q3:
2005
|
66,348
|
(2,105
|
)
|
(8,141
|
)
|
-
|
56,102
|
47,703
|
1,209
|
10.14
|
%
|
||||||||||||||||
|
|
Q4:
2005
|
70,091
|
(2,258
|
)
|
(8,141
|
)
|
-
|
59,692
|
59,049
|
1,281
|
8.68
|
%
|
||||||||||||||||
|
2005
|
70,091
|
(2,258
|
)
|
(8,141
|
)
|
-
|
59,692
|
52,008
|
5,285
|
10.16
|
%
|
|||||||||||||||||
|
|
Q1:
2006
|
65,508
|
(2,200
|
)
|
(8,141
|
)
|
-
|
55,167
|
56,777
|
1,238
|
8.72
|
%
|
||||||||||||||||
|
|
Q2:
2006
|
46,959
|
(2,096
|
)
|
(8,141
|
)
|
-
|
36,722
|
42,912
|
812
|
7.57
|
%
|
||||||||||||||||
|
|
Q3:
2006
|
42,384
|
(2,073
|
)
|
(8,141
|
)
|
-
|
32,170
|
32,194
|
524
|
6.51
|
%
|
||||||||||||||||
|
|
||||||||||||||||||||||||||||
|
Residential
Credit Enhancement Securities
|
Q3:
2004
|
830,524
|
(109,367
|
)
|
(298,925
|
)
|
74,577
|
496,809
|
368,887
|
16,007
|
17.36
|
%
|
||||||||||||||||
|
|
Q4:
2004
|
933,772
|
(108,141
|
)
|
(342,706
|
)
|
78,733
|
561,658
|
424,879
|
16,985
|
15.99
|
%
|
||||||||||||||||
|
2004
|
933,772
|
(110,724
|
)
|
(340,123
|
)
|
78,733
|
561,658
|
349,779
|
64,602
|
18.47
|
%
|
|||||||||||||||||
|
|
Q1:
2005
|
978,878
|
(89,405
|
)
|
(365,998
|
)
|
87,919
|
611,394
|
493,412
|
19,624
|
15.91
|
%
|
||||||||||||||||
|
|
Q2:
2005
|
1,103,737
|
(96,488
|
)
|
(404,180
|
)
|
103,126
|
706,195
|
550,460
|
19,439
|
14.13
|
%
|
||||||||||||||||
|
|
Q3:
2005
|
1,052,813
|
(89,429
|
)
|
(382,862
|
)
|
84,279
|
664,801
|
585,663
|
24,368
|
16.64
|
%
|
||||||||||||||||
|
|
Q4:
2005
|
1,035,874
|
(126,811
|
)
|
(354,610
|
)
|
58,196
|
612,649
|
534,420
|
23,133
|
17.31
|
%
|
||||||||||||||||
|
2005
|
1,035,874
|
(126,811
|
)
|
(354,610
|
)
|
58,196
|
612,649
|
541,224
|
86,564
|
15.99
|
%
|
|||||||||||||||||
|
|
Q1:
2006
|
1,087,135
|
(118,990
|
)
|
(373,781
|
)
|
49,459
|
643,823
|
560,191
|
27,748
|
19.81
|
%
|
||||||||||||||||
|
|
Q2:
2006
|
1,210,437
|
(125,274
|
)
|
(425,578
|
)
|
55,775
|
715,360
|
610,046
|
29,449
|
19.31
|
%
|
||||||||||||||||
|
|
Q3:
2006
|
1,211,636
|
(147,037
|
)
|
(384,397
|
)
|
62,179
|
742,381
|
669,181
|
35,875
|
21.45
|
%
|
||||||||||||||||
|
Table
10: Balances & Yields (all $ in thousands)
|
||||||||||||||||||||||||||||
|
At
period end
|
For
period ended
|
|||||||||||||||||||||||||||
|
Current
Face
|
Unamortized
Premium/ (Discount)
|
Credit
Protection
|
UnrealizedGain
/ (Loss)
|
Net
Book Value
|
Average
Balance
|
Interest
Income
|
Yield
|
|||||||||||||||||||||
|
Securities
Portfolio
|
Q3:
2004
|
$
|
1,215,847
|
($1,466
|
)
|
$
|
-
|
$
|
15,555
|
$
|
1,229,936
|
$
|
1,141,456
|
$
|
12,932
|
4.53
|
%
|
|||||||||||
|
|
Q4:
2004
|
1,378,924
|
(13,895
|
)
|
-
|
15,048
|
1,380,077
|
1,267,692
|
15,282
|
4.82
|
%
|
|||||||||||||||||
|
2004
|
1,378,924
|
(13,895
|
)
|
-
|
15,048
|
1,380,077
|
1,062,901
|
48,274
|
4.54
|
%
|
||||||||||||||||||
|
|
Q1:
2005
|
1,522,345
|
(28,534
|
)
|
-
|
11,566
|
1,505,377
|
1,423,487
|
18,074
|
5.08
|
%
|
|||||||||||||||||
|
|
Q2:
2005
|
1,656,177
|
(32,874
|
)
|
-
|
25,535
|
1,648,838
|
1,548,085
|
19,910
|
5.14
|
%
|
|||||||||||||||||
|
|
Q3:
2005
|
1,818,295
|
(47,048
|
)
|
-
|
12,182
|
1,783,429
|
1,687,506
|
23,990
|
5.69
|
%
|
|||||||||||||||||
|
|
Q4:
2005
|
1,810,146
|
(55,235
|
)
|
-
|
(6,330
|
)
|
1,748,581
|
1,743,808
|
26,316
|
6.04
|
%
|
||||||||||||||||
|
2005
|
1,810,146
|
(55,235
|
)
|
-
|
(6,330
|
)
|
1,748,581
|
1,601,837
|
88,290
|
5.51
|
%
|
|||||||||||||||||
|
|
Q1:
2006
|
1,885,075
|
(60,429
|
)
|
-
|
(7,018
|
)
|
1,817,628
|
1,769,502
|
27,765
|
6.28
|
%
|
||||||||||||||||
|
|
Q2:
2006
|
1,960,878
|
(80,256
|
)
|
-
|
(10,621
|
)
|
1,870,001
|
1,827,690
|
29,298
|
6.41
|
%
|
||||||||||||||||
|
|
Q3:
2006
|
2,145,996
|
(102,080
|
)
|
-
|
9,327
|
2,053,243
|
1,940,042
|
34,747
|
7.16
|
%
|
|||||||||||||||||
|
|
||||||||||||||||||||||||||||
|
Commercial
First-Loss Credit Enhancement Securities
|
Q3:
2004
|
26,930
|
8,456
|
(26,930
|
)
|
686
|
9,142
|
7,372
|
346
|
18.77
|
%
|
|||||||||||||||||
|
|
Q4:
2004
|
45,639
|
12,883
|
(45,639
|
)
|
1,615
|
14,498
|
10,836
|
233
|
8.60
|
%
|
|||||||||||||||||
|
2004
|
45,639
|
12,883
|
(45,639
|
)
|
1,615
|
14,498
|
5,261
|
675
|
12.83
|
%
|
||||||||||||||||||
|
|
Q1:
2005
|
88,671
|
25,344
|
(88,671
|
)
|
3,226
|
28,570
|
19,255
|
356
|
7.40
|
%
|
|||||||||||||||||
|
|
Q2:
2005
|
87,210
|
24,847
|
(87,210
|
)
|
4,549
|
29,396
|
25,085
|
881
|
14.05
|
%
|
|||||||||||||||||
|
|
Q3:
2005
|
138,530
|
41,127
|
(138,530
|
)
|
2,413
|
43,540
|
32,192
|
453
|
5.63
|
%
|
|||||||||||||||||
|
|
Q4:
2005
|
175,343
|
19,474
|
(141,806
|
)
|
4,676
|
57,687
|
44,109
|
923
|
8.37
|
%
|
|||||||||||||||||
|
2005
|
175,343
|
19,474
|
(141,806
|
)
|
4,676
|
57,687
|
30,234
|
2,613
|
8.64
|
%
|
||||||||||||||||||
|
|
Q1:
2006
|
198,681
|
27,700
|
(167,772
|
)
|
8,039
|
66,648
|
56,800
|
989
|
5.34
|
%
|
|||||||||||||||||
|
|
Q2:
2006
|
222,160
|
34,365
|
(192,134
|
)
|
11,498
|
75,889
|
65,190
|
1,648
|
10.11
|
%
|
|||||||||||||||||
|
|
Q3:
2006
|
322,061
|
35,625
|
(258,382
|
)
|
17,437
|
116,741
|
88,681
|
2,137
|
9.64
|
%
|
|||||||||||||||||
|
|
||||||||||||||||||||||||||||
|
Cash
& Equivalents
|
Q3:
2004
|
76,006
|
-
|
-
|
-
|
76,006
|
101,938
|
175
|
||||||||||||||||||||
|
|
Q4:
2004
|
57,246
|
-
|
-
|
-
|
57,246
|
126,556
|
508
|
||||||||||||||||||||
|
2004
|
57,246
|
-
|
-
|
-
|
57,246
|
95,251
|
922
|
|||||||||||||||||||||
|
|
Q1:
2005
|
64,714
|
-
|
-
|
-
|
64,714
|
124,685
|
580
|
||||||||||||||||||||
|
|
Q2:
2005
|
72,193
|
-
|
-
|
-
|
72,193
|
124,707
|
804
|
||||||||||||||||||||
|
|
Q3:
2005
|
163,160
|
-
|
-
|
-
|
163,160
|
134,422
|
990
|
||||||||||||||||||||
|
|
Q4:
2005
|
175,885
|
-
|
-
|
-
|
175,885
|
339,379
|
2,830
|
||||||||||||||||||||
|
2005
|
175,885
|
-
|
-
|
-
|
175,885
|
181,259
|
5,204
|
|||||||||||||||||||||
|
|
Q1:
2006
|
85,466
|
-
|
-
|
-
|
85,466
|
244,002
|
2,477
|
||||||||||||||||||||
|
|
Q2:
2006
|
106,491
|
-
|
-
|
-
|
106,491
|
246,597
|
2,871
|
||||||||||||||||||||
|
|
Q3:
2006
|
112,926
|
112,926
|
183,323
|
1,872
|
|||||||||||||||||||||||
|
Table
11: Portfolio Activity (in
thousands)
|
|
|
|
|
|
Acquisitions
|
|
Sales
to Third Parties
|
|
Principal
Payments
|
|
Discount
/ (Premium) Amortization
|
|
Credit
Provision
|
|
Net
Charge-offs / (Recoveries)
|
|
Net
Mark-to-Market Adjustment
|
|
Net
Increase / (Decrease)
|
|
|||||||||
|
|
|
|
|
|
|
|
|
|
|
|
|
|
|
|
|
|
|
|
|
|||||||||
|
Residential
Real Estate Loans
|
|
|
Q3:
2004
|
|
$
|
2,898,165
|
|
|
($112,811
|
)
|
|
($1,152,610
|
)
|
$
|
1,006
|
|
|
($1,528
|
)
|
$
|
-
|
|
$
|
489
|
|
$
|
1,632,711
|
|
|
|
|
Q4:
2004
|
|
|
1,791,951
|
|
|
(865
|
)
|
|
(1,152,597
|
)
|
|
(6,935
|
)
|
|
(1,697
|
)
|
|
176
|
|
|
(375
|
)
|
|
629,658
|
|
|
|
|
|
|
2004
|
|
|
10,050,309
|
|
|
(113,676
|
)
|
|
(3,632,395
|
)
|
|
(31,687
|
)
|
|
(7,236
|
)
|
|
176
|
|
|
114
|
|
|
6,265,605
|
|
|
|
|
|
Q1:
2005
|
|
|
832,383
|
|
|
-
|
|
|
(1,555,752
|
)
|
|
(7,644
|
)
|
|
(1,210
|
)
|
|
154
|
|
|
-
|
|
|
(732,069
|
)
|
|
|
|
|
Q2:
2005
|
|
|
426,933
|
|
|
(3,378
|
)
|
|
(2,557,675
|
)
|
|
(9,758
|
)
|
|
1,527
|
|
|
(34
|
)
|
|
254
|
|
|
(2,142,131
|
)
|
|
|
|
|
Q3:
2005
|
|
|
332,049
|
|
|
(263,079
|
)
|
|
(3,129,492
|
)
|
|
(14,438
|
)
|
|
805
|
|
|
125
|
|
|
(218
|
)
|
|
(3,074,248
|
)
|
|
|
|
Q4:
2005
|
|
|
271,875
|
|
|
(240,987
|
)
|
|
(2,698,500
|
)
|
|
(13,334
|
)
|
|
(877
|
)
|
|
250
|
|
|
48
|
|
|
(2,681,525
|
)
|
|
|
|
|
2005
|
|
|
1,863,240
|
|
|
(507,444
|
)
|
|
(9,941,419
|
)
|
|
(45,174
|
)
|
|
245
|
|
|
495
|
|
|
84
|
|
|
(8,629,973
|
)
|
|
|
|
|
Q1:
2006
|
|
|
52,691
|
|
|
-
|
|
|
(1,925,475
|
)
|
|
(12,075
|
)
|
|
(141
|
)
|
|
425
|
|
|
-
|
|
|
(1,884,575
|
)
|
|
|
|
|
Q2:
2006
|
|
|
272,627
|
|
|
-
|
|
|
(1,799,401
|
)
|
|
(12,073
|
)
|
|
2,507
|
|
|
415
|
|
|
-
|
|
|
(1,535,925
|
)
|
|
|
|
|
|
Q3:
2006
|
|
|
966,673
|
|
|
-
|
|
|
(1,567,041
|
)
|
|
(11,254
|
)
|
|
(465
|
)
|
|
589
|
|
|
-
|
|
|
(611,498
|
)
|
|
|
|
|
|
|
|
|
|
|
|
|
|
|
|
|
|
|
|
|
|
|
|
|
|
|
|
|
|
|
|
Commercial
Real Estate Loans
|
|
|
Q3:
2004
|
|
|
-
|
|
|
-
|
|
|
(29
|
)
|
|
(128
|
)
|
|
-
|
|
|
-
|
|
|
-
|
|
|
(157
|
)
|
|
|
|
|
Q4:
2004
|
|
|
21,305
|
|
|
-
|
|
|
(83
|
)
|
|
(132
|
)
|
|
-
|
|
|
-
|
|
|
-
|
|
|
21,090
|
|
|
|
|
|
2004
|
|
|
38,371
|
|
|
(2,339
|
)
|
|
(3,390
|
)
|
|
(484
|
)
|
|
-
|
|
|
-
|
|
|
(98
|
)
|
|
32,060
|
|
|
|
|
|
Q1:
2005
|
|
|
6,732
|
|
|
-
|
|
|
(5,267
|
)
|
|
(30
|
)
|
|
185
|
|
|
-
|
|
|
505
|
|
|
2,125
|
|
|
|
|
|
Q2:
2005
|
|
|
-
|
|
|
(11,192
|
)
|
|
(3,769
|
)
|
|
(99
|
)
|
|
-
|
|
|
-
|
|
|
250
|
|
|
(14,810
|
)
|
|
|
|
|
Q3:
2005
|
|
|
14,219
|
|
|
(17
|
)
|
|
158
|
|
|
(69
|
)
|
|
-
|
|
|
-
|
|
|
17
|
|
|
14,308
|
|
|
|
|
Q4:
2005
|
|
|
4,248
|
|
|
-
|
|
|
(506
|
)
|
|
(152
|
)
|
|
-
|
|
|
-
|
|
|
-
|
|
|
3,590
|
|
|
|
|
|
|
2005
|
|
|
25,199
|
|
|
(11,209
|
)
|
|
(9,384
|
)
|
|
(350
|
)
|
|
185
|
|
|
-
|
|
|
772
|
|
|
5,213
|
|
|
|
|
|
Q1:
2006
|
|
|
-
|
|
|
-
|
|
|
(4,583
|
)
|
|
93
|
|
|
(35
|
)
|
|
-
|
|
|
-
|
|
|
(4,525
|
)
|
|
|
|
|
Q2:
2006
|
|
|
-
|
|
|
(8,408
|
)
|
|
(10,049
|
)
|
|
27
|
|
|
-
|
|
|
-
|
|
|
(14
|
)
|
|
(18,445
|
)
|
|
|
|
|
Q3:
2006
|
|
|
-
|
|
|
-
|
|
|
(4,574
|
)
|
|
22
|
|
|
-
|
|
|
-
|
|
|
-
|
|
|
(4,552
|
)
|
|
|
|
|
|
|
|
|
|
|
|
|
|
|
|
|
|
|
|
|
|
|
|
|
|
|
|
|
|
|
|
Residential
Credit Enhancement Securities
|
|
|
Q3:
2004
|
|
|
82,918
|
|
|
-
|
|
|
(44,822
|
)
|
|
8,181
|
|
|
-
|
|
|
-
|
|
|
8,293
|
|
|
54,570
|
|
|
|
|
|
Q4:
2004
|
|
|
72,976
|
|
|
-
|
|
|
(30,900
|
)
|
|
8,443
|
|
|
-
|
|
|
-
|
|
|
14,330
|
|
|
64,849
|
|
|
|
|
|
2004
|
|
|
268,529
|
|
|
(22,416
|
)
|
|
(157,359
|
)
|
|
34,108
|
|
|
-
|
|
|
-
|
|
|
60,069
|
|
|
182,931
|
|
|
|
|
|
Q1:
2005
|
|
|
67,809
|
|
|
(27,293
|
)
|
|
(23,932
|
)
|
|
8,727
|
|
|
-
|
|
|
-
|
|
|
24,425
|
|
|
49,736
|
|
|
|
|
|
Q2:
2005
|
|
|
87,849
|
|
|
-
|
|
|
(20,400
|
)
|
|
7,775
|
|
|
-
|
|
|
-
|
|
|
19,577
|
|
|
94,801
|
|
|
|
|
|
Q3:
2005
|
|
|
57,481
|
|
|
(98,775
|
)
|
|
(18,403
|
)
|
|
11,193
|
|
|
-
|
|
|
-
|
|
|
7,110
|
|
|
(41,394
|
)
|
|
|
|
Q4:
2005
|
|
|
54,664
|
|
|
(81,292
|
)
|
|
(22,468
|
)
|
|
10,456
|
|
|
-
|
|
|
-
|
|
|
(13,512
|
)
|
|
(52,152
|
)
|
|
|
|
|
|
2005
|
|
|
267,803
|
|
|
(207,360
|
)
|
|
(85,203
|
)
|
|
38,151
|
|
|
-
|
|
|
-
|
|
|
37,600
|
|
|
50,991
|
|
|
|
|
|
Q1:
2006
|
|
|
52,822
|
|
|
(9,650
|
)
|
|
(17,469
|
)
|
|
13,155
|
|
|
-
|
|
|
-
|
|
|
(7,684
|
)
|
|
31,174
|
|
|
|
|
|
Q2:
2006
|
|
|
89,217
|
|
|
(10,317
|
)
|
|
(28,102
|
)
|
|
12,410
|
|
|
-
|
|
|
-
|
|
|
8,329
|
|
|
71,537
|
|
|
|
|
|
Q3:
2006
|
|
|
78,887
|
|
|
(47,585
|
)
|
|
(32,338
|
)
|
|
16,616
|
|
|
-
|
|
|
-
|
|
|
11,441
|
|
|
27,021
|
|
|
Table
11: Portfolio Activity (in
thousands)
|
|
|
|
|
|
Acquisitions
|
|
Sales
to Third Parties
|
|
Principal
Payments
|
|
Discount
/ (Premium) Amortization
|
|
Credit
Provision
|
|
Net
Charge-offs / (Recoveries)
|
|
Net
Mark-to-Market Adjustment
|
|
Net
Increase / (Decrease)
|
|
|||||||||
|
|
|
|
|
|
|
|
|
|
|
|
|
|
|
|
|
|
|
|
|
|||||||||
|
Securities
Portfolio
|
|
|
Q3:
2004
|
|
$
|
144,753
|
|
$
|
-
|
|
|
($18,489
|
)
|
|
($146
|
)
|
$
|
-
|
|
$
|
-
|
|
$
|
10,444
|
|
$
|
136,562
|
|
|
|
|
|
Q4:
2004
|
|
|
176,341
|
|
|
-
|
|
|
(25,189
|
)
|
|
39
|
|
|
-
|
|
|
-
|
|
|
(1,050
|
)
|
|
150,141
|
|
|
|
|
|
2004
|
|
|
597,945
|
|
|
(8,475
|
)
|
|
(63,554
|
)
|
|
(1,254
|
)
|
|
-
|
|
|
-
|
|
|
10,701
|
|
|
535,363
|
|
|
|
|
|
Q1:
2005
|
|
|
168,337
|
|
|
(12,362
|
)
|
|
(27,070
|
)
|
|
115
|
|
|
-
|
|
|
-
|
|
|
(3,720
|
)
|
|
125,300
|
|
|
|
|
|
Q2:
2005
|
|
|
156,182
|
|
|
(3,012
|
)
|
|
(22,333
|
)
|
|
151
|
|
|
-
|
|
|
-
|
|
|
12,472
|
|
|
143,460
|
|
|
|
|
|
Q3:
2005
|
|
|
190,160
|
|
|
-
|
|
|
(41,833
|
)
|
|
566
|
|
|
-
|
|
|
-
|
|
|
(14,302
|
)
|
|
134,591
|
|
|
|
|
Q4:
2005
|
|
|
169,736
|
|
|
(151,620
|
)
|
|
(38,006
|
)
|
|
907
|
|
|
-
|
|
|
-
|
|
|
(15,865
|
)
|
|
(34,848
|
)
|
|
|
|
|
2005
|
|
|
684,415
|
|
|
(166,994
|
)
|
|
(129,242
|
)
|
|
1,739
|
|
|
-
|
|
|
-
|
|
|
(21,415
|
)
|
|
368,503
|
|
|
|
|
|
|
Q1:
2006
|
|
|
103,866
|
|
|
(3,984
|
)
|
|
(27,614
|
)
|
|
650
|
|
|
-
|
|
|
-
|
|
|
(3,871
|
)
|
|
69,047
|
|
|
|
|
|
Q2:
2006
|
|
|
235,881
|
|
|
(152,481
|
)
|
|
(28,618
|
)
|
|
1,471
|
|
|
-
|
|
|
-
|
|
|
(3,880
|
)
|
|
52,373
|
|
|
|
|
|
Q3:
2006
|
|
|
205,652
|
|
|
(17,607
|
)
|
|
(27,649
|
)
|
|
2,454
|
|
|
-
|
|
|
-
|
|
|
20,392
|
|
|
183,242
|
|
|
|
|
|
|
|
|
|
|
|
|
|
|
|
|
|
|
|
|
|
|
|
|
|
|
|
|
|
|
|
|
Commercial
First Loss Credit-Enhancement Securities
|
|
|
Q3:
2004
|
|
|
6,311
|
|
|
-
|
|
|
-
|
|
|
60
|
|
|
-
|
|
|
-
|
|
|
677
|
|
|
7,048
|
|
|
|
|
|
Q4:
2004
|
|
|
4,770
|
|
|
-
|
|
|
-
|
|
|
(343
|
)
|
|
-
|
|
|
-
|
|
|
929
|
|
|
5,356
|
|
|
|
|
|
2004
|
|
|
11,081
|
|
|
-
|
|
|
-
|
|
|
(283
|
)
|
|
-
|
|
|
-
|
|
|
1,606
|
|
|
12,404
|
|
|
|
|
|
Q1:
2005
|
|
|
12,870
|
|
|
-
|
|
|
-
|
|
|
(409
|
)
|
|
-
|
|
|
-
|
|
|
1,611
|
|
|
14,072
|
|
|
|
|
|
Q2:
2005
|
|
|
0
|
|
|
-
|
|
|
-
|
|
|
(346
|
)
|
|
-
|
|
|
-
|
|
|
1,173
|
|
|
827
|
|
|
|
|
|
Q3:
2005
|
|
|
17,182
|
|
|
-
|
|
|
-
|
|
|
(902
|
)
|
|
-
|
|
|
-
|
|
|
(2,137
|
)
|
|
14,143
|
|
|
|
|
Q4:
2005
|
|
|
13,028
|
|
|
-
|
|
|
-
|
|
|
(904
|
)
|
|
-
|
|
|
-
|
|
|
2,023
|
|
|
14,147
|
|
|
|
|
|
2005
|
|
|
43,080
|
|
|
-
|
|
|
-
|
|
|
(2,561
|
)
|
|
-
|
|
|
-
|
|
|
2,670
|
|
|
43,189
|
|
|
|
|
|
|
Q1:
2006
|
|
|
6,911
|
|
|
-
|
|
|
-
|
|
|
(1,276
|
)
|
|
-
|
|
|
-
|
|
|
3,326
|
|
|
8,961
|
|
|
|
|
|
Q2:
2006
|
|
|
8,125
|
|
|
-
|
|
|
-
|
|
|
(1,091
|
)
|
|
-
|
|
|
-
|
|
|
2,207
|
|
|
9,241
|
|
|
|
|
Q3:
2006
|
|
|
36,858
|
|
|
-
|
|
|
-
|
|
|
(1,670
|
)
|
|
-
|
|
|
-
|
|
|
5,664
|
|
|
40,852
|
|
|
|
Table
12: Residential Loans Credit Performance (in
thousands)
|
|||||||||||||||||||||||||||||||||||||
|
Underlying
Loans
|
|
Internally-Designated
Credit Reserve
|
|
External
Credit Enhancement
|
|
Total
Credit Protection (1)
|
|
Total
Credit Protection as % of Loans
|
|
Seriously
Delinquent Loans
|
|
Seriously
Delinquent Loan %
|
|
Total
Credit Losses
|
|
Losses
To Securities Junior to Redwood's Interest
|
|
Redwood's
Share of Net Charge-offs/(Recoveries)
|
|
Total
Credit Losses As % of Loans (Annualized)
|
|||||||||||||||||
|
Total
Managed
|
Q3:
2004
|
$
|
143,275,834
|
$
|
320,800
|
$
|
69,244
|
$
|
389,513
|
0.27
|
%
|
$
|
185,023
|
0.13
|
%
|
$
|
730
|
$
|
196
|
$
|
534
|
<0.01
|
%
|
||||||||||||||
|
Residential
|
Q4:
2004
|
148,799,639
|
366,477
|
67,650
|
433,434
|
0.29
|
%
|
163,554
|
0.11
|
%
|
689
|
-
|
689
|
<0.01
|
%
|
||||||||||||||||||||||
|
Portfolio
|
2004
|
148,799,639
|
366,477
|
67,650
|
433,434
|
0.29
|
%
|
163,554
|
0.11
|
%
|
3,303
|
271
|
3,032
|
<0.01
|
%
|
||||||||||||||||||||||
|
Q1:
2005
|
151,706,780
|
390,825
|
92,467
|
482,696
|
0.32
|
%
|
217,159
|
0.14
|
%
|
1,377
|
-
|
1,377
|
<0.01
|
%
|
|||||||||||||||||||||||
|
Q2:
2005
|
183,489,517
|
427,139
|
141,970
|
568,546
|
0.31
|
%
|
245,399
|
0.13
|
%
|
740
|
196
|
544
|
<0.01
|
%
|
|||||||||||||||||||||||
|
Q3:
2005
|
195,454,022
|
404,891
|
134,967
|
539,858
|
0.28
|
%
|
282,850
|
0.14
|
%
|
1,812
|
220
|
1,592
|
<0.01
|
%
|
|||||||||||||||||||||||
|
Q4:
2005
|
183,904,883
|
377,266
|
140,907
|
518,173
|
0.28
|
%
|
368,521
|
0.20
|
%
|
1,175
|
-
|
1,175
|
<0.01
|
%
|
|||||||||||||||||||||||
|
2005
|
183,904,883
|
377,266
|
140,907
|
518,173
|
0.28
|
%
|
368,521
|
0.20
|
%
|
5,104
|
416
|
4,688
|
<0.01
|
%
|
|||||||||||||||||||||||
|
Q1:
2006
|
192,545,691
|
396,153
|
128,015
|
524,168
|
0.27
|
%
|
474,871
|
0.25
|
%
|
3,002
|
-
|
3,002
|
<0.01
|
%
|
|||||||||||||||||||||||
|
Q2:
2006
|
223,006,911
|
445,028
|
127,372
|
572,399
|
0.26
|
%
|
466,898
|
0.21
|
%
|
1,464
|
-
|
1,464
|
<0.01
|
%
|
|||||||||||||||||||||||
|
Q3:
2006
|
234,492,256
|
403,723
|
216,076
|
619,799
|
0.26
|
%
|
527,704
|
0.23
|
%
|
2,748
|
155
|
2,593
|
<0.01
|
%
|
|||||||||||||||||||||||
|
Residential
Real
|
Q3:
2004
|
21,690,481
|
21,875
|
-
|
21,344
|
0.10
|
%
|
10,785
|
0.05
|
%
|
-
|
-
|
-
|
0.00
|
%
|
||||||||||||||||||||||
|
Estate
Loans
|
Q4:
2004
|
22,312,842
|
23,771
|
-
|
23,078
|
0.10
|
%
|
13,338
|
0.06
|
%
|
176
|
-
|
176
|
<0.01
|
%
|
||||||||||||||||||||||
|
2004
|
22,312,842
|
23,771
|
-
|
23,078
|
0.10
|
%
|
13,338
|
0.06
|
%
|
176
|
-
|
176
|
<0.01
|
%
|
|||||||||||||||||||||||
|
Q1:
2005
|
21,579,671
|
24,827
|
-
|
24,231
|
0.11
|
%
|
16,066
|
0.07
|
%
|
154
|
-
|
154
|
<0.01
|
%
|
|||||||||||||||||||||||
|
Q2:
2005
|
19,443,387
|
22,959
|
-
|
22,396
|
0.12
|
%
|
16,514
|
0.08
|
%
|
(34
|
)
|
-
|
(34
|
)
|
0.00
|
%
|
|||||||||||||||||||||
|
Q3:
2005
|
16,386,833
|
22,029
|
-
|
22,029
|
0.13
|
%
|
22,956
|
0.14
|
%
|
90
|
-
|
90
|
<0.01
|
%
|
|||||||||||||||||||||||
|
Q4:
2005
|
13,719,242
|
22,656
|
-
|
22,656
|
0.17
|
%
|
37,335
|
0.27
|
%
|
251
|
-
|
251
|
<0.01
|
%
|
|||||||||||||||||||||||
|
2005
|
13,719,242
|
22,656
|
-
|
22,656
|
0.17
|
%
|
37,335
|
0.27
|
%
|
461
|
-
|
461
|
<0.01
|
%
|
|||||||||||||||||||||||
|
Q1:
2006
|
11,846,454
|
22,372
|
-
|
22,372
|
0.19
|
%
|
48,677
|
0.41
|
%
|
425
|
-
|
425
|
<0.01
|
%
|
|||||||||||||||||||||||
|
Q2:
2006
|
10,318,641
|
19,450
|
-
|
19,450
|
0.19
|
%
|
47,162
|
0.46
|
%
|
423
|
-
|
423
|
<0.01
|
%
|
|||||||||||||||||||||||
|
Q3:
2006
|
9,718,985
|
19,326
|
-
|
19,326
|
0.20
|
%
|
61,447
|
0.63
|
%
|
589
|
-
|
589
|
<0.01
|
%
|
|||||||||||||||||||||||
|
Residential
Credit Enhancement Securities
|
Q3:
2004
|
121,585,353
|
298,925
|
69,244
|
368,169
|
0.30
|
%
|
174,238
|
0.14
|
%
|
730
|
196
|
534
|
<0.01
|
%
|
||||||||||||||||||||||
|
Q4:
2004
|
126,486,797
|
342,706
|
67,650
|
410,356
|
0.32
|
%
|
150,216
|
0.12
|
%
|
513
|
-
|
513
|
<0.01
|
%
|
|||||||||||||||||||||||
|
2004
|
126,486,797
|
342,706
|
67,650
|
410,356
|
0.32
|
%
|
150,216
|
0.12
|
%
|
3,127
|
271
|
2,856
|
<0.01
|
%
|
|||||||||||||||||||||||
|
Q1:
2005
|
130,127,109
|
365,998
|
92,467
|
458,465
|
0.35
|
%
|
201,093
|
0.15
|
%
|
1,223
|
-
|
1,223
|
<0.01
|
%
|
|||||||||||||||||||||||
|
Q2:
2005
|
164,046,130
|
404,180
|
141,970
|
546,150
|
0.33
|
%
|
228,885
|
0.14
|
%
|
774
|
196
|
578
|
<0.01
|
%
|
|||||||||||||||||||||||
|
Q3:
2005
|
179,067,189
|
382,862
|
134,967
|
517,829
|
0.29
|
%
|
259,894
|
0.15
|
%
|
1,722
|
220
|
1,502
|
<0.01
|
%
|
|||||||||||||||||||||||
|
Q4:
2005
|
170,185,641
|
354,610
|
140,907
|
495,517
|
0.29
|
%
|
331,186
|
0.19
|
%
|
924
|
-
|
924
|
<0.01
|
%
|
|||||||||||||||||||||||
|
2005
|
170,185,641
|
354,610
|
140,907
|
495,517
|
0.29
|
%
|
331,186
|
0.19
|
%
|
4,643
|
416
|
4,227
|
<0.01
|
%
|
|||||||||||||||||||||||
|
Q1:
2006
|
180,699,237
|
373,781
|
128,015
|
501,796
|
0.28
|
%
|
426,194
|
0.24
|
%
|
2,577
|
-
|
2,577
|
<0.01
|
%
|
|||||||||||||||||||||||
|
Q2:
2006
|
212,688,271
|
425,578
|
127,372
|
552,949
|
0.26
|
%
|
419,736
|
0.20
|
%
|
1,041
|
-
|
1,041
|
<0.01
|
%
|
|||||||||||||||||||||||
|
Q3:
2006
|
224,773,271
|
384,397
|
216,076
|
600,473
|
0.27
|
%
|
466,257
|
0.21
|
%
|
2,159
|
155
|
2,004
|
<0.01
|
%
|
|||||||||||||||||||||||
|
(1)
The credit
reserve on residential real estate loans owned is
only available to absorb
losses on the residential real estate loan portfolio.
The
internally-designated credit reserves on loans credit
enhanced and the
external credit enhancement on loans credit enhanced
are only available to
absorb losses on the residential credit-enhancement
portfolio.
|
|||||||||||||||||||||||||||||||||||||
|
Table
13: Residential Real Estate Loans & Credit Enhancement Securities
Characteristics (all $ in
thousands)
|
|
|
|
Sep.
2006
|
|
Jun.
2006
|
|
Mar.
2006
|
|
Dec.
2005
|
|
Sept.
2005
|
|
Jun.
2005
|
|
Mar.
2005
|
|
Dec.
2004
|
|
Sep.
2004
|
||||||||||
|
Residential
Loans Managed
|
$
|
234,492,256
|
$
|
223,006,911
|
$
|
192,545,691
|
$
|
183,904,883
|
$
|
195,454,022
|
$
|
183,489,517
|
$
|
151,706,780
|
$
|
148,799,639
|
$
|
142,275,834
|
||||||||||
|
Number
of
loans
|
673,062
|
629,963
|
552,368
|
542,858
|
576,246
|
549,889
|
406,718
|
396,136
|
340,747
|
|||||||||||||||||||
|
Average
loan
size
|
$
|
348
|
$
|
354
|
$
|
349
|
$
|
339
|
$
|
339
|
$
|
334
|
$
|
373
|
$
|
376
|
$
|
418
|
||||||||||
|
Adjustable
%
|
6
|
%
|
8
|
%
|
11
|
%
|
13
|
%
|
15
|
%
|
17
|
%
|
22
|
%
|
22
|
%
|
22
|
%
|
||||||||||
|
Negatively
Amortizing %
|
23
|
%
|
23
|
%
|
22
|
%
|
22
|
%
|
17
|
%
|
16
|
%
|
15
|
%
|
14
|
%
|
12
|
%
|
||||||||||
|
Hybrid
%
|
39
|
%
|
36
|
%
|
33
|
%
|
30
|
%
|
29
|
%
|
26
|
%
|
24
|
%
|
24
|
%
|
25
|
%
|
||||||||||
|
Fixed
%
|
32
|
%
|
33
|
%
|
34
|
%
|
36
|
%
|
39
|
%
|
40
|
%
|
39
|
%
|
39
|
%
|
42
|
%
|
||||||||||
|
Interest
Only
%
|
29
|
%
|
28
|
%
|
26
|
%
|
30
|
%
|
30
|
%
|
31
|
%
|
35
|
%
|
35
|
%
|
35
|
%
|
||||||||||
|
Southern
California
|
25
|
%
|
25
|
%
|
24
|
%
|
24
|
%
|
23
|
%
|
23
|
%
|
21
|
%
|
21
|
%
|
22
|
%
|
||||||||||
|
Northern
California
|
22
|
%
|
22
|
%
|
22
|
%
|
20
|
%
|
19
|
%
|
19
|
%
|
19
|
%
|
18
|
%
|
20
|
%
|
||||||||||
|
Florida
|
6
|
%
|
6
|
%
|
6
|
%
|
6
|
%
|
6
|
%
|
6
|
%
|
6
|
%
|
7
|
%
|
6
|
%
|
||||||||||
|
New
York
|
5
|
%
|
5
|
%
|
5
|
%
|
5
|
%
|
5
|
%
|
5
|
%
|
5
|
%
|
5
|
%
|
5
|
%
|
||||||||||
|
Virginia
|
4
|
%
|
4
|
%
|
4
|
%
|
4
|
%
|
4
|
%
|
4
|
%
|
4
|
%
|
4
|
%
|
4
|
%
|
||||||||||
|
New
Jersey
|
3
|
%
|
3
|
%
|
3
|
%
|
3
|
%
|
4
|
%
|
4
|
%
|
4
|
%
|
4
|
%
|
4
|
%
|
||||||||||
|
Texas
|
3
|
%
|
3
|
%
|
3
|
%
|
3
|
%
|
3
|
%
|
3
|
%
|
3
|
%
|
3
|
%
|
3
|
%
|
||||||||||
|
Illinois
|
3
|
%
|
3
|
%
|
3
|
%
|
3
|
%
|
3
|
%
|
3
|
%
|
3
|
%
|
3
|
%
|
3
|
%
|
||||||||||
|
Other
states
(none greater than 3%)
|
30
|
%
|
30
|
%
|
29
|
%
|
31
|
%
|
33
|
%
|
34
|
%
|
35
|
%
|
36
|
%
|
34
|
%
|
||||||||||
|
Year
2006
origination
|
15
|
%
|
9
|
%
|
1
|
%
|
0
|
%
|
0
|
%
|
0
|
%
|
0
|
%
|
0
|
%
|
0
|
%
|
||||||||||
|
Year
2005
origination
|
28
|
%
|
27
|
%
|
27
|
%
|
23
|
%
|
14
|
%
|
13
|
%
|
6
|
%
|
0
|
%
|
0
|
%
|
||||||||||
|
Year
2004
origination
|
23
|
%
|
26
|
%
|
29
|
%
|
35
|
%
|
41
|
%
|
49
|
%
|
52
|
%
|
52
|
%
|
48
|
%
|
||||||||||
|
Year
2003
origination
|
24
|
%
|
27
|
%
|
31
|
%
|
33
|
%
|
35
|
%
|
28
|
%
|
31
|
%
|
33
|
%
|
37
|
%
|
||||||||||
|
Year
2002
origination
|
5
|
%
|
6
|
%
|
7
|
%
|
7
|
%
|
7
|
%
|
6
|
%
|
7
|
%
|
8
|
%
|
9
|
%
|
||||||||||
|
Year
2001
origination or earlier
|
5
|
%
|
5
|
%
|
5
|
%
|
3
|
%
|
3
|
%
|
4
|
%
|
5
|
%
|
6
|
%
|
6
|
%
|
||||||||||
|
Table
13: Residential Real Estate Loans & Credit Enhancement Securities
Characteristics (all $ in
thousands)
|
|
|
|
Sep.
2006
|
|
Jun.
2006
|
|
Mar.
2006
|
|
Dec.
2005
|
|
Sept.
2005
|
|
Jun.
2005
|
|
Mar.
2005
|
|
Dec.
2004
|
|
Sep.
2004
|
||||||||||
|
Wtg
Avg
Original LTV
|
69
|
%
|
68
|
%
|
68
|
%
|
68
|
%
|
68
|
%
|
68
|
%
|
68
|
%
|
68
|
%
|
68
|
%
|
||||||||||
|
Original
LTV:
0% - 20%
|
1
|
%
|
1
|
%
|
1
|
%
|
1
|
%
|
1
|
%
|
0
|
%
|
0
|
%
|
0
|
%
|
0
|
%
|
||||||||||
|
Original
LTV:
20% - 30%
|
2
|
%
|
2
|
%
|
2
|
%
|
2
|
%
|
2
|
%
|
2
|
%
|
2
|
%
|
2
|
%
|
2
|
%
|
||||||||||
|
Original
LTV:
30% - 40%
|
3
|
%
|
3
|
%
|
3
|
%
|
3
|
%
|
3
|
%
|
3
|
%
|
3
|
%
|
3
|
%
|
3
|
%
|
||||||||||
|
Original
LTV:
40% - 50%
|
7
|
%
|
7
|
%
|
7
|
%
|
8
|
%
|
8
|
%
|
8
|
%
|
8
|
%
|
8
|
%
|
8
|
%
|
||||||||||
|
Original
LTV:
50% - 60%
|
11
|
%
|
12
|
%
|
12
|
%
|
12
|
%
|
12
|
%
|
12
|
%
|
12
|
%
|
12
|
%
|
13
|
%
|
||||||||||
|
Original
LTV:
60% - 70%
|
21
|
%
|
22
|
%
|
22
|
%
|
22
|
%
|
22
|
%
|
23
|
%
|
23
|
%
|
23
|
%
|
23
|
%
|
||||||||||
|
Original
LTV:
70% - 75%
|
15
|
%
|
15
|
%
|
15
|
%
|
15
|
%
|
15
|
%
|
15
|
%
|
15
|
%
|
15
|
%
|
15
|
%
|
||||||||||
|
Original
LTV:
75% - 80%
|
36
|
%
|
34
|
%
|
33
|
%
|
34
|
%
|
34
|
%
|
33
|
%
|
33
|
%
|
33
|
%
|
33
|
%
|
||||||||||
|
Original
LTV:
80% - 90%
|
3
|
%
|
3
|
%
|
3
|
%
|
2
|
%
|
2
|
%
|
3
|
%
|
3
|
%
|
3
|
%
|
2
|
%
|
||||||||||
|
Original
LTV:
90% - 100%
|
2
|
%
|
1
|
%
|
2
|
%
|
1
|
%
|
1
|
%
|
2
|
%
|
2
|
%
|
2
|
%
|
2
|
%
|
||||||||||
|
Wtg
Avg FICO
|
731
|
730
|
730
|
731
|
731
|
731
|
731
|
731
|
730
|
|||||||||||||||||||
|
FICO:
<=
600
|
1
|
%
|
1
|
%
|
1
|
%
|
0
|
%
|
0
|
%
|
0
|
%
|
0
|
%
|
0
|
%
|
0
|
%
|
||||||||||
|
FICO:
601 -620
|
1
|
%
|
1
|
%
|
1
|
%
|
1
|
%
|
0
|
%
|
0
|
%
|
0
|
%
|
0
|
%
|
0
|
%
|
||||||||||
|
FICO:
621 -
640
|
2
|
%
|
2
|
%
|
2
|
%
|
2
|
%
|
2
|
%
|
2
|
%
|
2
|
%
|
2
|
%
|
2
|
%
|
||||||||||
|
FICO:
641 -660
|
4
|
%
|
4
|
%
|
4
|
%
|
4
|
%
|
4
|
%
|
4
|
%
|
4
|
%
|
4
|
%
|
4
|
%
|
||||||||||
|
FICO:
661 -
680
|
7
|
%
|
7
|
%
|
7
|
%
|
7
|
%
|
7
|
%
|
7
|
%
|
7
|
%
|
7
|
%
|
7
|
%
|
||||||||||
|
FICO:
681 -
700
|
11
|
%
|
11
|
%
|
11
|
%
|
11
|
%
|
11
|
%
|
11
|
%
|
11
|
%
|
11
|
%
|
11
|
%
|
||||||||||
|
FICO:
701 -
720
|
13
|
%
|
13
|
%
|
13
|
%
|
13
|
%
|
13
|
%
|
13
|
%
|
13
|
%
|
13
|
%
|
13
|
%
|
||||||||||
|
FICO:
721 -
740
|
13
|
%
|
13
|
%
|
14
|
%
|
13
|
%
|
14
|
%
|
14
|
%
|
14
|
%
|
14
|
%
|
14
|
%
|
||||||||||
|
FICO:
741 -
760
|
14
|
%
|
15
|
%
|
15
|
%
|
15
|
%
|
15
|
%
|
15
|
%
|
16
|
%
|
16
|
%
|
16
|
%
|
||||||||||
|
FICO:
761 -
780
|
16
|
%
|
16
|
%
|
16
|
%
|
17
|
%
|
17
|
%
|
17
|
%
|
17
|
%
|
17
|
%
|
18
|
%
|
||||||||||
|
FICO:
781 -
800
|
12
|
%
|
12
|
%
|
12
|
%
|
12
|
%
|
12
|
%
|
12
|
%
|
11
|
%
|
11
|
%
|
11
|
%
|
||||||||||
|
FICO:
>=
801
|
4
|
%
|
3
|
%
|
3
|
%
|
3
|
%
|
3
|
%
|
3
|
%
|
2
|
%
|
2
|
%
|
2
|
%
|
||||||||||
|
Unknown
|
2
|
%
|
3
|
%
|
3
|
%
|
2
|
%
|
2
|
%
|
1
|
%
|
2
|
%
|
2
|
%
|
2
|
%
|
||||||||||
|
Conforming
at
Origination %
|
37
|
%
|
35
|
%
|
26
|
%
|
26
|
%
|
24
|
%
|
24
|
%
|
22
|
%
|
20
|
%
|
18
|
%
|
||||||||||
|
%
balance in
loans > $1mm per loan
|
9
|
%
|
9
|
%
|
8
|
%
|
8
|
%
|
7
|
%
|
7
|
%
|
7
|
%
|
6
|
%
|
7
|
%
|
||||||||||
|
2nd
Home %
|
6
|
%
|
6
|
%
|
6
|
%
|
6
|
%
|
6
|
%
|
6
|
%
|
6
|
%
|
6
|
%
|
6
|
%
|
||||||||||
|
Investment
Home %
|
3
|
%
|
3
|
%
|
3
|
%
|
3
|
%
|
2
|
%
|
3
|
%
|
2
|
%
|
2
|
%
|
2
|
%
|
||||||||||
|
Purchase
|
40
|
%
|
39
|
%
|
36
|
%
|
36
|
%
|
36
|
%
|
35
|
%
|
35
|
%
|
34
|
%
|
33
|
%
|
||||||||||
|
Cash
Out Refi
|
30
|
%
|
30
|
%
|
29
|
%
|
30
|
%
|
28
|
%
|
27
|
%
|
27
|
%
|
27
|
%
|
25
|
%
|
||||||||||
|
Rate-Term
Refi
|
30
|
%
|
31
|
%
|
34
|
%
|
34
|
%
|
36
|
%
|
37
|
%
|
37
|
%
|
38
|
%
|
42
|
%
|
||||||||||
|
Construction
|
0
|
%
|
0
|
%
|
0
|
%
|
0
|
%
|
0
|
%
|
0
|
%
|
0
|
%
|
0
|
%
|
0
|
%
|
||||||||||
|
Other
|
0
|
%
|
0
|
%
|
0
|
%
|
0
|
%
|
0
|
%
|
1
|
%
|
0
|
%
|
0
|
%
|
0
|
%
|
||||||||||
|
This
table
includes residential real estate loans and these
are primarily the loans
securitized by Sequoia securitization entities
sponsored by Redwood as
well as loans underlying residential credit-enhancement
securities by
Redwood.
|
|
Table
14: Commercial Real Estate Loans - Characteristics
(all $ in
thousands)
|
|
|
|
Q3:2006
|
|
Q2:2006
|
|
Q1:2006
|
|
Q4:2005
|
|
Q3:2005
|
|
Q2:2005
|
|
Q1:2005
|
|
Q4:2004
|
|
Q3:2004
|
||||||||||
|
Commercial
mortgage loans
|
$
|
32,170
|
$
|
36,722
|
$
|
55,167
|
$
|
59,692
|
$
|
56,102
|
$
|
41,794
|
$
|
56,604
|
$
|
54,479
|
$
|
33,389
|
||||||||||
|
Number
of
loans
|
8
|
9
|
12
|
13
|
12
|
9
|
12
|
9
|
7
|
|||||||||||||||||||
|
Average
loan
size
|
$
|
4,021
|
$
|
4,080
|
$
|
4,597
|
$
|
4,592
|
$
|
4,675
|
$
|
4,644
|
$
|
4,717
|
$
|
6,053
|
$
|
4,770
|
||||||||||
|
Seriously
delinquent loans
|
-
|
-
|
-
|
-
|
-
|
-
|
-
|
-
|
-
|
|||||||||||||||||||
|
Realized
credit losses
|
-
|
-
|
-
|
-
|
-
|
-
|
-
|
-
|
-
|
|||||||||||||||||||
|
California
%
|
7
|
%
|
6
|
%
|
19
|
%
|
25
|
%
|
28
|
%
|
37
|
%
|
42
|
%
|
44
|
%
|
72
|
%
|
||||||||||
|
Table
15: Commercial Real Estate Loans Credit Performance
(all $ in
thousands)
|
|
|
|
Underlying
Loans
|
Internally-Designated
Credit Reserve
|
External
Credit Enhancement
|
Total
Credit Protection (1)
|
Total
Credit Protection as % of Loans
|
Seriously
Delinquent Loans
|
Seriously
Delinquent Loan %
|
Total
Credit Losses
|
Third
Parties' Share of Net Charge-offs/ (Recoveries)
|
Redwood's
Share of Net Charge-offs/ (Recoveries)
|
Total
Credit Losses As % of Loans (Annualized)
|
|||||||||||||||||||||||||
|
Total
Managed Commercial Portfolio
|
Q3:
2004
|
$
|
1,363,341
|
$
|
16,816
|
$
|
-
|
$
|
16,816
|
1.23
|
%
|
$
|
-
|
0.00
|
%
|
$
|
-
|
$
|
-
|
$
|
-
|
0.00
|
%
|
||||||||||||||
|
Q4:
2004
|
5,925,183
|
35,525
|
-
|
35,525
|
0.60
|
%
|
-
|
0.00
|
%
|
176
|
-
|
176
|
0.01
|
%
|
|||||||||||||||||||||||
|
2004
|
5,925,183
|
35,525
|
-
|
35,525
|
0.60
|
%
|
-
|
1.39
|
%
|
176
|
-
|
176
|
0.00
|
%
|
|||||||||||||||||||||||
|
Q1:
2005
|
11,565,506
|
78,372
|
-
|
78,372
|
0.68
|
%
|
4,937
|
0.04
|
%
|
315
|
-
|
315
|
0.01
|
%
|
|||||||||||||||||||||||
|
Q2:
2005
|
12,544,115
|
78,057
|
-
|
78,057
|
0.62
|
%
|
-
|
0.00
|
%
|
-
|
-
|
-
|
0.00
|
%
|
|||||||||||||||||||||||
|
Q3:
2005
|
20,973,246
|
129,381
|
-
|
129,381
|
0.62
|
%
|
13,109
|
0.06
|
%
|
-
|
-
|
-
|
0.00
|
%
|
|||||||||||||||||||||||
|
Q4:
2005
|
25,951,655
|
136,407
|
-
|
136,407
|
0.53
|
%
|
17,342
|
0.07
|
%
|
-
|
-
|
-
|
0.00
|
%
|
|||||||||||||||||||||||
|
2005
|
25,951,655
|
136,407
|
-
|
136,407
|
0.53
|
%
|
17,342
|
0.07
|
%
|
315
|
-
|
315
|
0.00
|
%
|
|||||||||||||||||||||||
|
Q1:
2006
|
28,065,048
|
162,373
|
-
|
162,373
|
0.58
|
%
|
22,606
|
0.08
|
%
|
35
|
-
|
35
|
0.00
|
%
|
|||||||||||||||||||||||
|
Q2:
2006
|
28,923,299
|
186,735
|
-
|
186,735
|
0.65
|
%
|
23,521
|
0.08
|
%
|
-
|
-
|
-
|
0.00
|
%
|
|||||||||||||||||||||||
|
Q3:
2006
|
35,993,610
|
266,523
|
-
|
266,523
|
0.74
|
%
|
54,972
|
0.15
|
%
|
1,044
|
582
|
462
|
0.01
|
%
|
|||||||||||||||||||||||
|
|
|||||||||||||||||||||||||||||||||||||
|
Commercial
Real Estate Loans
|
Q3:
2004
|
43,410
|
8,641
|
-
|
8,641
|
19.91
|
%
|
-
|
0.00
|
%
|
-
|
-
|
-
|
0.00
|
%
|
||||||||||||||||||||||
|
Q4:
2004
|
65,598
|
8,641
|
-
|
8,641
|
13.17
|
%
|
-
|
0.00
|
%
|
176
|
-
|
176
|
1.07
|
%
|
|||||||||||||||||||||||
|
2004
|
65,598
|
8,641
|
-
|
8,641
|
13.17
|
%
|
-
|
0.00
|
%
|
176
|
-
|
176
|
0.27
|
%
|
|||||||||||||||||||||||
|
Q1:
2005
|
67,365
|
8,456
|
-
|
8,456
|
12.55
|
%
|
-
|
0.00
|
%
|
315
|
-
|
315
|
1.87
|
%
|
|||||||||||||||||||||||
|
Q2:
2005
|
51,778
|
8,141
|
-
|
8,141
|
15.72
|
%
|
-
|
0.00
|
%
|
-
|
-
|
-
|
0.00
|
%
|
|||||||||||||||||||||||
|
Q3:
2005
|
66,348
|
8,141
|
-
|
8,141
|
12.27
|
%
|
-
|
0.00
|
%
|
-
|
-
|
-
|
0.00
|
%
|
|||||||||||||||||||||||
|
Q4:
2005
|
70,091
|
8,141
|
-
|
8,141
|
11.61
|
%
|
-
|
0.00
|
%
|
-
|
-
|
-
|
0.00
|
%
|
|||||||||||||||||||||||
|
2005
|
70,091
|
8,141
|
-
|
8,141
|
11.61
|
%
|
-
|
0.00
|
%
|
315
|
-
|
315
|
0.45
|
%
|
|||||||||||||||||||||||
|
Q1:
2006
|
65,508
|
8,141
|
-
|
8,141
|
12.43
|
%
|
-
|
0.00
|
%
|
35
|
-
|
35
|
0.21
|
%
|
|||||||||||||||||||||||
|
Q2:
2006
|
46,959
|
8,141
|
-
|
8,141
|
17.34
|
%
|
-
|
0.00
|
%
|
-
|
-
|
-
|
0.00
|
%
|
|||||||||||||||||||||||
|
Q3:
2006
|
42,384
|
8,141
|
-
|
8,141
|
19.21
|
%
|
-
|
0.00
|
%
|
-
|
-
|
-
|
0.00
|
%
|
|||||||||||||||||||||||
|
Commercial
First-Loss Credit Enhancement Securities
|
Q3:
2004
|
1,319,931
|
8,175
|
-
|
8,175
|
0.62
|
%
|
-
|
0.00
|
%
|
-
|
-
|
-
|
0.00
|
%
|
||||||||||||||||||||||
|
Q4:
2004
|
5,859,585
|
26,884
|
-
|
26,884
|
0.46
|
%
|
-
|
0.00
|
%
|
-
|
-
|
-
|
0.00
|
%
|
|||||||||||||||||||||||
|
2004
|
5,859,585
|
26,884
|
-
|
26,884
|
0.46
|
%
|
-
|
0.00
|
%
|
-
|
-
|
-
|
0.00
|
%
|
|||||||||||||||||||||||
|
Q1:
2005
|
11,498,141
|
69,916
|
-
|
69,916
|
0.61
|
%
|
4,937
|
0.04
|
%
|
-
|
-
|
-
|
0.00
|
%
|
|||||||||||||||||||||||
|
Q2:
2005
|
12,492,337
|
69,916
|
-
|
69,916
|
0.56
|
%
|
-
|
0.00
|
%
|
-
|
-
|
-
|
0.00
|
%
|
|||||||||||||||||||||||
|
Q3:
2005
|
20,906,898
|
121,240
|
-
|
121,240
|
0.58
|
%
|
13,109
|
0.06
|
%
|
-
|
-
|
-
|
0.00
|
%
|
|||||||||||||||||||||||
|
Q4:
2005
|
25,881,564
|
128,266
|
-
|
128,266
|
0.50
|
%
|
17,342
|
0.07
|
%
|
-
|
-
|
-
|
0.00
|
%
|
|||||||||||||||||||||||
|
2005
|
25,881,564
|
128,266
|
-
|
128,266
|
0.50
|
%
|
17,342
|
0.07
|
%
|
-
|
-
|
-
|
0.00
|
%
|
|||||||||||||||||||||||
|
Q1:
2006
|
27,999,540
|
154,232
|
-
|
154,232
|
0.55
|
%
|
22,606
|
0.08
|
%
|
-
|
-
|
-
|
0.00
|
%
|
|||||||||||||||||||||||
|
Q2:
2006
|
28,876,341
|
178,594
|
-
|
178,594
|
0.62
|
%
|
23,521
|
0.08
|
%
|
-
|
-
|
-
|
0.00
|
%
|
|||||||||||||||||||||||
|
Q3:
2006
|
35,951,226
|
258,382
|
-
|
258,382
|
0.72
|
%
|
54,972
|
0.15
|
%
|
1,044
|
582
|
462
|
0.01
|
%
|
|||||||||||||||||||||||
|
(1)
The credit reserve on commercial real estate loans
owned is only available
to absorb losses on the commercial real estate
loan portfolio. The
internally-designated credit reserves on commercial
first-loss credit
enhancement securities is only available to absorb
losses on the
commercial first-loss credit enhancement
portfolio.
|
|
Table
16: Commercial Loans and First-Loss Credit Enhancement
Securities -
Characteristics (all $ in thousands)
|
||||||||||||||||||||||||||||
|
Sep.
2006
|
Jun.
2006
|
Mar.
2006
|
Dec.
2005
|
Sep.
2005
|
Jun.
2005
|
Mar.
2005
|
Dec.
2004
|
Sep.
2004
|
||||||||||||||||||||
|
Underlying
Commercial
Real
Estate
Loans
|
$
|
35,993,610
|
$
|
28,923,299
|
$
|
28,065,048
|
$
|
25,951,655
|
$
|
20,973,246
|
$
|
12,544,115
|
$
|
11,565,506
|
$
|
5,925,183
|
$
|
1,363,341
|
||||||||||
|
Number
of
credit-enhanced loans
|
2,329
|
2,097
|
1,977
|
1,857
|
1,428
|
801
|
717
|
392
|
93
|
|||||||||||||||||||
|
Average
loan
size
|
$
|
15,455
|
$
|
13,793
|
$
|
14,196
|
$
|
13,975
|
$
|
14,687
|
$
|
15,661
|
$
|
16,130
|
$
|
15,115
|
$
|
14,660
|
||||||||||
|
State
Distribution
|
||||||||||||||||||||||||||||
|
CA
|
16
|
%
|
16
|
%
|
17
|
%
|
16
|
%
|
17
|
%
|
17
|
%
|
17
|
%
|
18
|
%
|
18
|
%
|
||||||||||
|
NY
|
14
|
%
|
14
|
%
|
14
|
%
|
14
|
%
|
14
|
%
|
15
|
%
|
14
|
%
|
10
|
%
|
0
|
%
|
||||||||||
|
TX
|
9
|
%
|
8
|
%
|
8
|
%
|
8
|
%
|
8
|
%
|
10
|
%
|
9
|
%
|
8
|
%
|
6
|
%
|
||||||||||
|
FL
|
7
|
%
|
7
|
%
|
7
|
%
|
7
|
%
|
3
|
%
|
2
|
%
|
2
|
%
|
2
|
%
|
5
|
%
|
||||||||||
|
VA
|
5
|
%
|
4
|
%
|
5
|
%
|
5
|
%
|
4
|
%
|
1
|
%
|
1
|
%
|
2
|
%
|
6
|
%
|
||||||||||
|
Other
|
49
|
%
|
51
|
%
|
49
|
%
|
50
|
%
|
54
|
%
|
55
|
%
|
57
|
%
|
60
|
%
|
65
|
%
|
||||||||||
|
Property
Type Distribution
|
||||||||||||||||||||||||||||
|
Office
|
40
|
%
|
37
|
%
|
37
|
%
|
37
|
%
|
40
|
%
|
45
|
%
|
44
|
%
|
42
|
%
|
28
|
%
|
||||||||||
|
Retail
|
31
|
%
|
30
|
%
|
30
|
%
|
31
|
%
|
32
|
%
|
34
|
%
|
33
|
%
|
31
|
%
|
41
|
%
|
||||||||||
|
Multi-Family
|
9
|
%
|
13
|
%
|
15
|
%
|
13
|
%
|
11
|
%
|
9
|
%
|
10
|
%
|
12
|
%
|
11
|
%
|
||||||||||
|
Hospitality
|
8
|
%
|
7
|
%
|
7
|
%
|
7
|
%
|
6
|
%
|
6
|
%
|
8
|
%
|
6
|
%
|
4
|
%
|
||||||||||
|
Self-Storage
|
3
|
%
|
4
|
%
|
4
|
%
|
4
|
%
|
3
|
%
|
2
|
%
|
2
|
%
|
2
|
%
|
3
|
%
|
||||||||||
|
Industrial
|
3
|
%
|
2
|
%
|
3
|
%
|
2
|
%
|
3
|
%
|
2
|
%
|
1
|
%
|
2
|
%
|
4
|
%
|
||||||||||
|
Other
|
6
|
%
|
6
|
%
|
4
|
%
|
6
|
%
|
5
|
%
|
2
|
%
|
3
|
%
|
4
|
%
|
10
|
%
|
||||||||||
|
Weighted
Average
Current
LTV
|
69
|
%
|
69
|
%
|
69
|
%
|
68
|
%
|
69
|
%
|
67
|
%
|
68
|
%
|
67
|
%
|
68
|
%
|
||||||||||
|
Weighted
Average Debt
Service
Coverage Ratio
|
1.69
|
1.63
|
1.63
|
1.66
|
1.67
|
1.73
|
1.71
|
1.79
|
1.89
|
|||||||||||||||||||
|
Table
17: Securities Portfolio - Characteristics (in
millions)
|
|||||||||||||||||||||||||
|
RATING
|
|||||||||||||||||||||||||
|
At
September 30, 2006:
|
|||||||||||||||||||||||||
|
Total
|
AAA
|
AA
|
A
|
BBB
|
BB
|
B
|
Unrated
|
||||||||||||||||||
|
Commercial
real estate
|
$
|
513
|
$
|
5
|
$
|
2
|
$
|
18
|
$
|
105
|
$
|
195
|
$
|
71
|
$
|
117
|
|||||||||
|
Residential
prime real estate
|
1,378
|
20
|
201
|
265
|
294
|
339
|
131
|
128
|
|||||||||||||||||
|
Residential
Alt-A real estate
|
283
|
81
|
39
|
8
|
16
|
86
|
20
|
33
|
|||||||||||||||||
|
Residential
sub-prime real estate
|
428
|
5
|
90
|
227
|
102
|
2
|
-
|
3
|
|||||||||||||||||
|
Residential
HELOCs
|
101
|
3
|
50
|
37
|
7
|
4
|
-
|
-
|
|||||||||||||||||
|
REIT
corporate
debt
|
9
|
-
|
-
|
-
|
1
|
8
|
-
|
-
|
|||||||||||||||||
|
Real
estate
CDOs
|
200
|
44
|
28
|
37
|
72
|
14
|
-
|
4
|
|||||||||||||||||
|
Total
securities portfolio
|
$
|
2,912
|
$
|
158
|
$
|
410
|
$
|
592
|
$
|
597
|
$
|
648
|
$
|
222
|
$
|
285
|
|||||||||
|
|
RATING
|
||||||||||||||||||||||||
|
At
December 31, 2006:
|
|||||||||||||||||||||||||
|
|
Total
|
AAA
|
AA
|
A
|
BBB
|
BB
|
B
|
Unrated
|
|||||||||||||||||
|
Commercial
real estate
|
$
|
380
|
$
|
11
|
$
|
2
|
$
|
20
|
$
|
129
|
$
|
130
|
$
|
30
|
$
|
58
|
|||||||||
|
Residential
prime real estate
|
1,185
|
29
|
197
|
195
|
232
|
281
|
113
|
138
|
|||||||||||||||||
|
Residential
Alt-A real estate
|
117
|
-
|
46
|
1
|
-
|
50
|
3
|
17
|
|||||||||||||||||
|
Residential
sub-prime real estate
|
442
|
5
|
86
|
292
|
59
|
-
|
-
|
-
|
|||||||||||||||||
|
Residential
HELOCs
|
108
|
-
|
49
|
54
|
5
|
-
|
-
|
-
|
|||||||||||||||||
|
REIT
corporate
debt
|
32
|
-
|
-
|
-
|
24
|
8
|
-
|
-
|
|||||||||||||||||
|
Real
estate
CDOs
|
155
|
37
|
25
|
37
|
44
|
11
|
-
|
1
|
|||||||||||||||||
|
Total
securities portfolio
|
$
|
2,419
|
$
|
82
|
$
|
405
|
$
|
599
|
$
|
493
|
$
|
480
|
$
|
146
|
$
|
214
|
|||||||||
|
Includes
a
portion of Redwood's permanent investment portfolio,
plus securities
consolidated from Acacia CDO securitization entities
sponsored by Redwood,
plus securities held by Redwood temporarily prior
to sale to Acacia. Does
not include Redwood's permanent investments acquired
from securitization
entities sponsored by Redwood, as those securities
are eliminated in the
GAAP consolidation of the underlying entities.
|
|||||||||||||||||||||||||
|
Table
18: Sequoia ABS Issued - Characteristics (all
$ in
thousands)
|
||||||||||||||||
|
Principal
|
||||||||||||||||
|
Original
|
Estimated
|
Outstanding
At
|
||||||||||||||
|
Sequoia
|
Issue
|
Issue
|
Stated
|
Callable
|
September
30,
|
|||||||||||
|
ABS
Issued (1)
|
Date
|
Amount
|
Maturity
|
Date
|
2006
|
|||||||||||
|
Sequoia
1
|
07/29/97
|
$
|
534,347
|
2028
|
Called
|
$
|
-
|
|||||||||
|
Sequoia
2
|
11/06/97
|
749,160
|
2029
|
Called
|
-
|
|||||||||||
|
Sequoia
3
|
06/26/98
|
635,288
|
2028
|
Called
|
-
|
|||||||||||
|
Sequoia
1A
|
05/04/99
|
157,266
|
2028
|
Called
|
-
|
|||||||||||
|
Sequoia
4
|
03/21/00
|
377,119
|
2024
|
2006
|
79,728
|
|||||||||||
|
Sequoia
5
|
10/29/01
|
510,047
|
2026
|
2007
|
117,528
|
|||||||||||
|
Sequoia
6
|
04/26/02
|
506,142
|
2027
|
2007
|
135,908
|
|||||||||||
|
Sequoia
7
|
05/29/02
|
572,000
|
2032
|
2006
|
107,473
|
|||||||||||
|
Sequoia
8
|
07/30/02
|
642,998
|
2032
|
2006
|
122,255
|
|||||||||||
|
Sequoia
9
|
08/28/02
|
558,266
|
2032
|
2007
|
118,399
|
|||||||||||
|
Sequoia
10
|
09/26/02
|
1,041,600
|
2027
|
2008
|
298,546
|
|||||||||||
|
Sequoia
11
|
10/30/02
|
704,936
|
2032
|
2007
|
160,251
|
|||||||||||
|
Sequoia
12
|
12/19/02
|
1,096,891
|
2033
|
2006
|
249,800
|
|||||||||||
|
Sequoia
2003-1
|
02/27/03
|
1,012,321
|
2033
|
2007
|
248,204
|
|||||||||||
|
Sequoia
2003-2
|
04/29/03
|
815,080
|
2022
|
2007
|
207,986
|
|||||||||||
|
Sequoia
2003-3
|
06/26/03
|
538,452
|
2023
|
2007
|
128,722
|
|||||||||||
|
MLCC
2003-C
|
06/26/03
|
984,349
|
2023
|
2008
|
262,209
|
|||||||||||
|
MLCC
2003-D
|
07/29/03
|
1,003,591
|
2028
|
2008
|
280,970
|
|||||||||||
|
Sequoia
2003-4
|
07/29/03
|
504,273
|
2033
|
2007
|
196,450
|
|||||||||||
|
Sequoia
2003-5
|
08/27/03
|
840,248
|
2033
|
2007
|
186,426
|
|||||||||||
|
Sequoia
2003-6
|
10/29/03
|
649,999
|
2033
|
2007
|
151,703
|
|||||||||||
|
Sequoia
2003-7
|
11/25/03
|
811,707
|
2034
|
2007
|
204,482
|
|||||||||||
|
Sequoia
2003-8
|
12/23/03
|
964,238
|
2034
|
2007
|
282,143
|
|||||||||||
|
MLCC
2003-E
|
08/28/03
|
983,852
|
2028
|
2008
|
288,289
|
|||||||||||
|
MLCC
2003-F
|
09/25/03
|
1,297,913
|
2028
|
2007
|
389,286
|
|||||||||||
|
MLCC
2003-H
|
12/22/03
|
739,196
|
2029
|
2008
|
215,020
|
|||||||||||
|
Table
18: Sequoia ABS Issued - Characteristics (all
$ in
thousands)
|
||||||||||||||||
|
Principal
|
||||||||||||||||
|
Original
|
Estimated
|
Outstanding
At
|
||||||||||||||
| Sequoia |
Issue
|
Issue
|
Stated
|
Callable
|
September
30,
|
|||||||||||
| ABS Issued (1) |
Date
|
Amount
|
Maturity
|
Date
|
2006
|
|||||||||||
|
Sequoia
2004-1
|
01/28/04
|
$
|
616,562
|
2034
|
2007
|
$
|
163,212
|
|||||||||
|
Sequoia
2004-2
|
02/25/04
|
690,548
|
2034
|
2007
|
196,458
|
|||||||||||
|
Sequoia
2004-3
|
03/30/04
|
917,673
|
2034
|
2006
|
241,272
|
|||||||||||
|
Sequoia
2004-4
|
04/29/04
|
808,933
|
2010
|
2007
|
218,661
|
|||||||||||
|
Sequoia
2004-5
|
05/27/04
|
831,540
|
2012
|
2008
|
235,576
|
|||||||||||
|
Sequoia
2004-6
|
06/29/04
|
910,662
|
2012
|
2008
|
261,098
|
|||||||||||
|
SEMHT
2004-01
|
06/29/04
|
317,044
|
2014
|
2008
|
111,125
|
|||||||||||
|
Sequoia
2004-7
|
07/29/04
|
1,032,685
|
2034
|
2008
|
256,634
|
|||||||||||
|
Sequoia
2004-8
|
08/27/04
|
807,699
|
2034
|
2008
|
261,883
|
|||||||||||
|
Sequoia
2004-9
|
09/29/04
|
772,831
|
2034
|
2008
|
278,815
|
|||||||||||
|
Sequoia
2004-10
|
10/28/04
|
673,356
|
2034
|
2008
|
235,181
|
|||||||||||
|
Sequoia
2004-11
|
11/23/04
|
705,746
|
2034
|
2008
|
303,900
|
|||||||||||
|
Sequoia
2004-12
|
12/22/04
|
821,955
|
2035
|
2008
|
283,738
|
|||||||||||
|
Sequoia
2005-1
|
01/27/05
|
409,071
|
2035
|
2008
|
162,844
|
|||||||||||
|
Sequoia
2005-2
|
02/24/05
|
338,481
|
2035
|
2008
|
123,099
|
|||||||||||
|
Sequoia
2005-3
|
04/28/05
|
359,182
|
2035
|
2008
|
156,099
|
|||||||||||
|
Madrona
2005-A
|
08/25/05
|
5,400
|
2008
|
2008
|
5,400
|
|||||||||||
|
Sequoia
2005-4
|
09/29/05
|
324,576
|
2035
|
2009
|
235,913
|
|||||||||||
|
Sequoia
2006-1
|
08/30/06
|
742,507
|
2046
|
2011
|
727,440
|
|||||||||||
|
Total
Sequoia ABS Issuance
|
$
|
31,317,730
|
$
|
8,890,126
|
||||||||||||
|
ABS
Resecuritizations
|
||||||||||||||||
|
SMFC
2002A
|
04/30/02
|
$
|
80,622
|
2029
|
Called
|
$
|
-
|
|||||||||
|
SMFC
2002B
|
12/19/02
|
161,605
|
2039
|
Called
|
-
|
|||||||||||
|
Total
ABS Resecuritizations
|
$
|
242,227
|
$
|
-
|
||||||||||||
|
(1)
Does not include ABS acquired by Redwood or
Acacia
|
||||||||||||||||
|
Table
19: Sequoia IO ABS Issued - Characteristics (all
$ in
thousands)
|
||||||||||||||||
|
Adjusted
Issue
|
||||||||||||||||
|
Original
|
Estimated
|
Amount
At
|
||||||||||||||
|
Sequoia
ABS
|
Issue
|
Issue
|
Stated
|
Callable
|
September
30,
|
|||||||||||
|
IO's
Issued(1)
|
Date
|
Amount
|
Maturity
|
Date
|
2006
|
|||||||||||
|
MLCC
2003-C
X-A-2
|
06/26/03
|
$
|
12,662
|
2007
|
2007
|
$
|
635
|
|||||||||
|
MLCC
2003-D
X-A-1
|
07/29/03
|
22,371
|
2007
|
2007
|
1,482
|
|||||||||||
|
MLCC
2003-E
X-A-1
|
08/28/03
|
16,550
|
2007
|
2007
|
1,644
|
|||||||||||
|
MLCC
2003-F
X-A-1
|
09/25/03
|
18,666
|
2007
|
2007
|
1,778
|
|||||||||||
|
Sequoia
2003-6 X-1
|
10/29/03
|
8,220
|
2007
|
2007
|
591
|
|||||||||||
|
SMFC
2003A
AX1
|
10/31/03
|
70,568
|
2007
|
2007
|
3,255
|
|||||||||||
|
Sequoia
2003-7 X-1
|
11/25/03
|
10,345
|
2007
|
2007
|
871
|
|||||||||||
|
Sequoia
2003-8 X-1
|
12/23/03
|
12,256
|
2007
|
2007
|
1,208
|
|||||||||||
|
Sequoia
2004-1 X-1
|
01/28/04
|
7,801
|
2007
|
2007
|
883
|
|||||||||||
|
Sequoia
2004-2 X-1
|
02/25/04
|
8,776
|
2007
|
2007
|
1,112
|
|||||||||||
|
SMFC
2004A
AX1
|
02/26/04
|
10,626
|
2007
|
2007
|
1,096
|
|||||||||||
|
MLCC
2003-H
X-A-1
|
12/22/03
|
10,430
|
2007
|
2007
|
1,538
|
|||||||||||
|
Sequoia
2004-4 X-1
|
05/28/04
|
9,789
|
2010
|
2007
|
1,656
|
|||||||||||
|
Sequoia
2004-5 X-1
|
05/27/04
|
3,371
|
2012
|
2008
|
590
|
|||||||||||
|
Sequoia
2004-6 X-A
|
06/29/04
|
10,884
|
2012
|
2008
|
4,811
|
|||||||||||
|
Sequoia
2004-7 X-A
|
07/29/04
|
12,145
|
2034
|
2008
|
5,577
|
|||||||||||
|
Sequoia
2004-8 X-A
|
08/27/04
|
18,270
|
2034
|
2008
|
8,669
|
|||||||||||
|
Sequoia
2004-9 X-A
|
09/29/04
|
16,951
|
2034
|
2008
|
8,385
|
|||||||||||
|
Sequoia
2004-10 X-A
|
10/28/04
|
14,735
|
2034
|
2008
|
7,424
|
|||||||||||
|
Sequoia
2004-11 X-A-1
|
11/23/04
|
12,603
|
2034
|
2008
|
6,828
|
|||||||||||
|
Sequoia
2004-11 X-A-2
|
11/23/04
|
4,697
|
2034
|
2008
|
2,637
|
|||||||||||
|
Sequoia
2004-12 X-A-1
|
12/22/04
|
14,453
|
2035
|
2008
|
7,738
|
|||||||||||
|
Sequoia
2004-12 X-A-2
|
12/22/04
|
4,619
|
2035
|
2008
|
5,078
|
|||||||||||
|
Sequoia
2005-1 X-A
|
01/27/05
|
9,669
|
2035
|
2008
|
5,406
|
|||||||||||
|
Sequoia
2005-2 X-A
|
02/24/05
|
7,484
|
2035
|
2008
|
4,177
|
|||||||||||
|
Sequoia
2005-3 X-A
|
04/28/05
|
8,183
|
2035
|
2008
|
5,045
|
|||||||||||
|
Total
Sequoia Issuance
|
$
|
357,124
|
$
|
90,114
|
||||||||||||
|
(1)
Does not include Sequoia IO's acquired by Redwood
or
Acacia
|
||||||||||||||||
|
Table
20: Acacia CDO - ABS Issued - Characteristics
(all $ in
thousands)
|
||||||||||||||||
|
Principal
|
||||||||||||||||
|
Original
|
Estimated
|
Outstanding
At
|
||||||||||||||
|
Issue
|
Issue
|
Stated
|
Callable
|
September
30,
|
||||||||||||
|
CDO
Issuance (1)
|
Date
|
Amount
|
Maturity
|
Date
|
2006
|
|||||||||||
|
Acacia
CDO 1
|
12/10/02
|
$
|
285,000
|
2023
|
Called
|
$
|
-
|
|||||||||
|
Acacia
CDO 2
|
05/13/03
|
283,875
|
2023
|
Called
|
-
|
|||||||||||
|
Acacia
CDO 3
|
11/04/03
|
284,250
|
2038
|
2006
|
221,830
|
|||||||||||
|
Acacia
CDO 4
|
04/08/04
|
293,400
|
2039
|
2007
|
282,333
|
|||||||||||
|
Acacia
CDO 5
|
07/14/04
|
282,125
|
2039
|
2007
|
281,808
|
|||||||||||
|
Acacia
CDO 6
|
11/09/04
|
282,000
|
2040
|
2007
|
281,187
|
|||||||||||
|
Acacia
CDO 7
|
03/10/05
|
282,000
|
2045
|
2008
|
281,128
|
|||||||||||
|
Acacia
CDO 8
|
07/14/05
|
252,000
|
2045
|
2008
|
251,704
|
|||||||||||
|
Acacia
CRE1
|
12/14/05
|
261,750
|
2045
|
2010
|
261,543
|
|||||||||||
|
Acacia
CDO 9
|
03/09/06
|
277,800
|
2046
|
2009
|
277,800
|
|||||||||||
|
Acacia
CDO 10
|
08/02/06
|
436,500
|
2046
|
2009
|
436,500
|
|||||||||||
|
Total
CDO Issuance
|
$
|
3,220,700
|
$
|
2,575,833
|
||||||||||||
|
(1)
Does not include ABS acquired by Redwood
|
||||||||||||||||
|
Executive
Officers:
|
Directors:
|
|
George
E. Bull, III
|
George
E. Bull, III
|
|
Chairman
of
the Board and
|
Chairman
of
the Board and
|
|
Chief
Executive Officer
|
Chief
Executive Officer
|
|
Douglas
B. Hansen
|
Douglas
B. Hansen
|
|
President
|
President
|
|
Martin
S. Hughes
|
Richard
D. Baum
|
|
Chief
Financial Officer
|
Chief
Deputy
Insurance
|
|
Commissioner
for the
|
|
|
Harold
F. Zagunis
|
State
of
California
|
|
Vice
President
|
|
|
Thomas
C. Brown
|
|
|
Brett
D. Nicholas
|
CEO,
Urban
Bay Properties, Inc.
|
|
Vice
President
|
|
|
Mariann
Byerwalter
|
|
|
Loren
R.
Picard
|
Chairman,
JDN
Corporate
|
|
Vice
President
|
Advisory,
LLC
|
|
Andrew
I. Sirkis
|
Greg
H. Kubicek
|
|
Vice
President
|
President,
The Holt Group, Inc.
|
|
Georganne
C. Proctor
|
|
|
Executive
Vice President and
|
|
|
Chief
Financial Officer, TIAA-CREF
|
|
|
Charles
J. Toeniskoetter
|
|
|
Chairman,
Toeniskoetter & Breeding, Inc.
|
|
|
|
David
L. Tyler
|
|
Private
Investor
|