
|
INTRODUCTION
|
2
|
|
|
|
||
|
SHAREHOLDER
LETTER
|
3
|
|
|
|
||
|
REDWOOD
BUSINESS AND STRATEGY
|
7
|
|
|
|
||
|
FINANCIAL
MODULES
|
|
|
|
|
||
|
►
|
GAAP
Earnings and Core Earnings
|
14
|
|
|
||
|
►
|
Taxable
Income
|
16
|
|
►
|
Book
Value Per Share
|
18
|
|
|
||
|
►
|
Return
on Equity
|
20
|
|
|
||
|
►
|
Dividends
|
22
|
|
|
||
|
►
|
Residential
CES
|
24
|
|
|
||
|
►
|
Residential
Loans
|
28
|
|
|
||
|
►
|
Residential
IGS
|
32
|
|
|
||
|
►
|
Commercial
CES
|
34
|
|
|
||
|
►
|
Commercial
Loans
|
38
|
|
|
||
|
►
|
Commercial
IGS
|
40
|
|
|
||
|
►
|
CDO
CES
|
42
|
|
|
||
|
►
|
CDO
IGS
|
44
|
|
|
||
|
►
|
Capital
|
46
|
|
|
||
|
►
|
Redwood
Debt
|
48
|
|
|
||
|
►
|
Acacia
CDO ABS Issued
|
50
|
|
|
||
|
►
|
Sequoia
ABS Issued
|
52
|
|
|
||
|
APPENDIX
|
|
|
|
|
||
|
►
|
Glossary
|
54
|
|
|
||
|
►
|
Financial
Tables
|
61
|
 |
 |
||
|
George
E. Bull, III
|
Douglas
B. Hansen
|
||
|
Chairman
and CEO
|
President
|
| Ø |
Our
GAAP earnings were
$36 million, or $1.32
per share, for the
fourth quarter
of 2006. In the fourth
quarter of 2005, GAAP
earnings were $42 million,
or
$1.68 per share.
|
| Ø |
Core
earnings were $30 million,
or $1.12 per share,
for the fourth quarter
of
2006. This is an increase
from $25 million, or
$0.97 per share core
earnings in the fourth
quarter of 2005.
|
| Ø |
Our
GAAP earnings in the
fourth quarter were
$6 million lower than
fourth
quarter 2005. The largest
factor was a $12 million
decline from gains
generated from sales
and calls of assets.
Gains were $7 million
in the
fourth quarter of 2006
compared to $19 million
in the fourth quarter
of
2005. This decline
was partially offset
by a $4 million increase
in net
interest income, which
was $45 million in
the fourth quarter
of 2006
compared to $41 million
in the fourth quarter
of 2005. This increase
reflects rising yields
from our credit-enhancement
portfolio being driven
by strong credit performance
and rapid prepayments.
|
| Ø |
Operating
expenses were $13 million
in the fourth quarter
of 2006, the same
as the fourth quarter
a year ago.
|
| Ø |
Income
taxes were negligible
in the fourth quarter
of this year, compared
to a $4
million expense in
the fourth quarter
of last year. This
decreased expense
reflects the reduction
in our loan securitization
activities over the
past
few years.
|
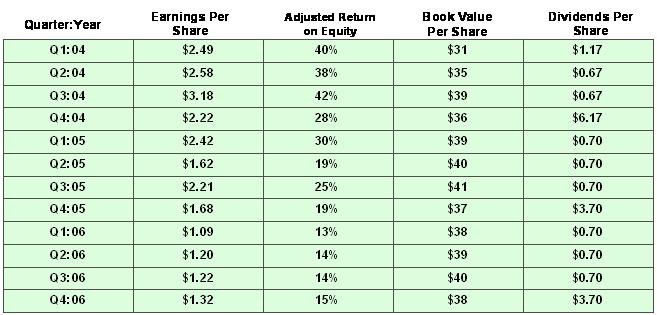
| Ø |
Total
taxable
income
was $38
million,
or $1.43
per share,
in the
fourth
quarter
of 2006.
This was
a decrease
from the
total taxable
income
per share
we
generated
in recent
quarters.
This decrease
was primarily
due to
stock
option
exercises,
a non-cash
expense
that is
deductible
for
tax.
|
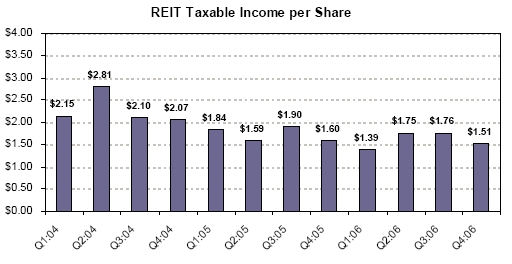
| Ø |
For
the same
reason,
our REIT
taxable
income
decreased
to $1.51
per share
in
the fourth
quarter
of 2006
from $1.60
per share
in the
fourth
quarter
of
2005.
|
| Ø |
Our
taxable
income
was higher
than our
GAAP income
in the
fourth
quarter
of
2006, and
for the
full year.
The primary
reason
is that
we are
not allowed
to establish
a credit
reserve
for our
CES for
tax accounting
purposes.
Thus, we
amortize
more discount
into income
and recognize
a higher
yield
for tax
purposes
until credit
losses
occur.
The cumulative
difference
in
the discount
amortization
between
tax and
GAAP for
residential,
commercial,
and CDO
CES was
$95 million
at year
end.
|
| Ø |
Total
taxable
income
and REIT
taxable
income
were reduced
by $1.9
million
($0.07
per share)
in the
fourth
quarter
as a result
of deductions
for actual
credit
losses.
This deduction
is less
than the
losses
incurred
on the
underlying
loans,
as we own
most of
our credit-sensitive
assets
at a tax
basis that
is substantially
less than
par (principal)
value.
Increased
credit
losses
would reduce
taxable
income
and our
dividend
distribution
requirements.
|
| Ø |
We
currently
expect
our REIT
taxable
income
per share
to continue
to exceed
our regular
quarterly
dividend
rate by
a comfortable
margin.
|
| Ø |
For
a variety
of reasons,
our total
taxable
income
and REIT
taxable
income
will
continue
to be
volatile
on a
quarter-to-quarter
basis.
|
| Ø |
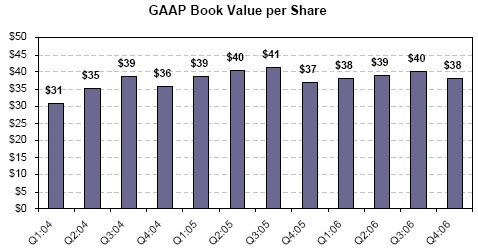
In
the
fourth
quarter
of
2006,
after
including
the
effect
of
declaring
$0.70
per
share
of
regular
dividends
and
$3.00
per
share
of
special
dividends,
GAAP
book
value
per
share
decreased
by
6%
from
$40.02
per
share
to
$37.51
per
share.
For
2006,
GAAP
book
value
increased
by
1%
from
$37.20
per
share.
|
| Ø |
At
December
31,
2006,
core
book
value
was
$34.02
per
share.
Core
book
value
decreased
by
1%
during
2006,
from
$34.27
per
share
at
the
beginning
of
the
year.
|
| Ø |
At
the
end
of
our
first
quarter
of
operations
in
September
1994,
GAAP
book
value
was
$11.67
per
share.
Since
that
time,
we
have
paid
$40.43
per
share
of
dividends
while
also
increasing
GAAP
book
value
by
$25.84
per
share.
|
| Ø |
Book
value
per
share
growth
is
generally
not
a
direct
indicator
of
our
market
value
or
an
indicator
of
the
returns
available
to
our
shareholders.
If
you
had
acquired
Redwood
stock
at
our
initial
public
offering
in
August
1995,
and
had
reinvested
all
dividends
back
into
Redwood
stock,
your
compounded
return
as
a
shareholder
would
have
been
23%
per
year
through
December
31,
2006.
Future
results
may
vary.
|
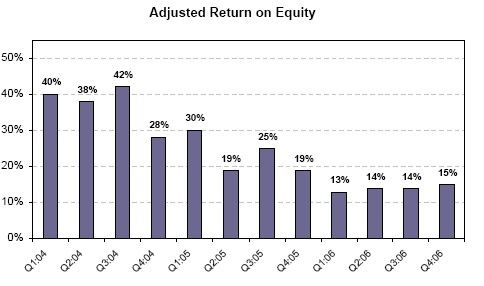
| Ø |
GAAP
ROE
was
14%
for
the
fourth
quarter
of
2006
as
compared
to
12%
for
the
previous
quarter
and
18%
in
the fourth
quarter
of
2005.
|
| Ø |
Adjusted
ROE
was
15%
for
the
fourth
quarter
of
2006
as
compared
to
14%
for
the
previous
quarter
and
19%
for
the
fourth
quarter
of
2005.
|
| Ø |
Adjusted
ROE
is
higher
than
GAAP
ROE
for
these
periods
as
we
have
unrealized
market
value
gains
on
our
assets.
This
has
the
effect
of
increasing
our
GAAP
equity
and
thus
reducing
our
GAAP
ROE
relative
to
our
adjusted
ROE.
|
| Ø |
Over
the
last
four
years,
our
adjusted
return
on
equity
has
ranged
from
14%
to
36%.
Over
the
long
term,
we
expect
to
be
able
to
generate
annual
adjusted
returns
on
equity
between
11%
and
18%.
|
| Ø |
Return
on
equity
exceeded
our
target
range
in
2003,
2004,
and
2005.
We
were
able
to
acquire
CES
assets
at
attractive
prices
following
the
1998
capital
markets/liquidity
crisis.
In
the
following
years,
excellent
credit
results,
combined
with
rapid
prepayments,
produced
extraordinary
profits.
|
| Ø |
We
declared a regular quarterly dividend of $0.70 per share in the
fourth
quarter of 2006.
|
| Ø |
The
Board of Directors has declared its intent to raise the quarterly
dividend
rate to $0.75 per share in 2007.
|
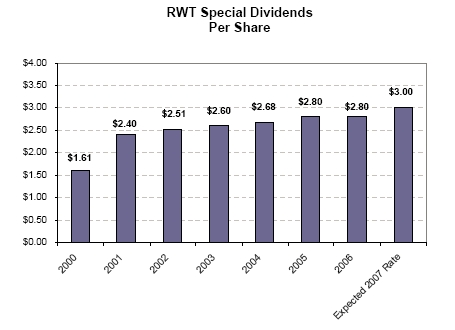
| Ø |
We
paid a special dividend of $3.00 per share in the fourth quarter
of 2006.
The annual special dividend, if any, is likely to vary from year
to
year.
|
| Ø |
Total
2006 dividend distributions were $5.80 per share. Assuming a
Redwood stock
price of $62, the indicated dividend yield would be 9.4% based
on the last
twelve months of dividends and 4.8% based on expected regular
dividends of
$3.00 per share for 2007.
|
| Ø |
Based
on our estimates of REIT taxable income during 2006, we entered
2007 with
$50 million ($1.85 per share) of undistributed REIT taxable
income that we
will distribute in 2007. This should be sufficient to fund
at least the
first two regular quarterly dividends in
2007.
|
| Ø |
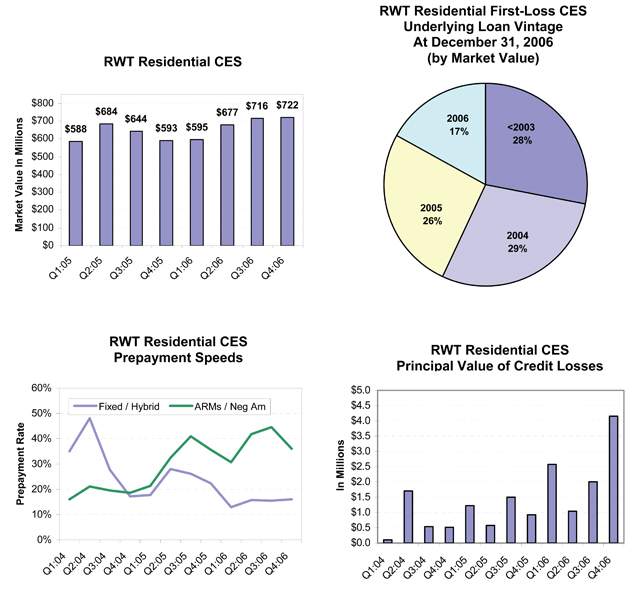
Our
residential CES portfolio grew in the fourth
quarter of 2006 by $6 million
(or 1%) to $722 million as a result of
acquisitions of $21 million, market
value adjustment increases of $1 million,
sales of $1 million, calls of $1
million, discount amortization of $18 million,
and principal pay downs of
$32 million.
|
| Ø |
For
2006, our residential CES portfolio increased
22% from $593 million to
$722 million.
|
| Ø |
Interest
income generated by residential CES was
$36 million for the fourth
quarter. The yield for the fourth quarter
was 22%, the same as the
previous quarter. Yields are high due to
fast prepayment speeds and
continued good credit performance for underlying
loans. The residential
CES yield for 2006 was 21%.
|
| Ø |
At
December 31, 2006, $716 million of our
residential CES were structured to
benefit from faster mortgage prepayment
rates, as they are discount bonds
purchased from senior/subordinated securitizations,
and $6 million were
structured in the form of residuals where
slower prepayment rates are
generally beneficial.
|
| Ø |
Prepayments
on loans underlying CES averaged 27% CPR
for the quarter and 24% CPR for
2006. Many of these CES will become callable
by the issuer when the loan
balance pays down to 10% of the original
balance. If credit results remain
strong, we may realize income gains if
these CES are called. At current
prepayment rates, we expect few calls in
2007 or 2008. Approximately 25%
of these CES will become callable by 2009
and an additional 50% by 2014.
On average in the past, CES have been called
within 6 months following the
month in which they first become
callable.
|
| Ø |
The
balance of residential loans underlying
these CES decreased from $225
billion to $210 billion during the fourth
quarter as a result of
relatively rapid mortgage prepayment rates
as well as a slower rate of net
acquisitions.
|
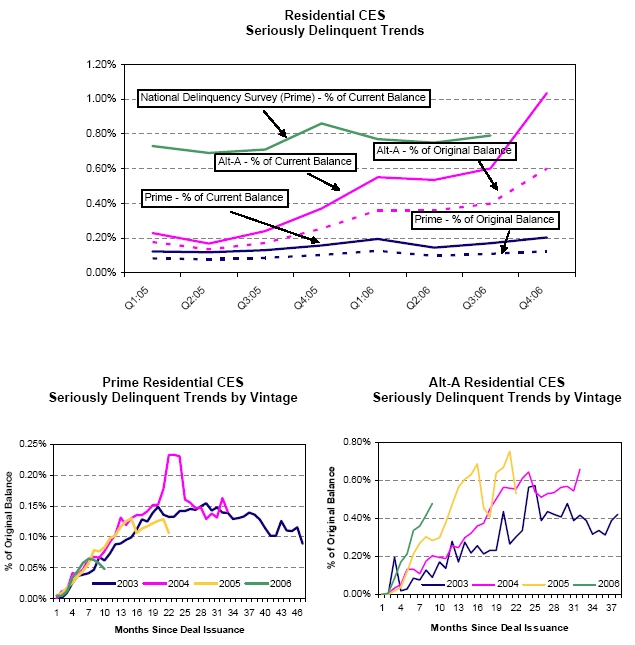
| Ø |
By
market value, 77% of our CES were backed
by pools of primarily prime
quality loans, 22% of our CES were backed
by pools of primarily alt-a
quality loans, and 1% of our CES were backed
by pools of primarily
subprime quality loans. The manner in which
alt-a and subprime CES are
structured and priced allows for the potential
for attractive economic
returns even if losses and delinquencies
in the underlying loans are many
times those of prime CES. For the market
as a whole, subprime loans
originated in 2006 are demonstrating very
poor initial credit performance.
Within our CES portfolio, our exposure
to 2006 vintage subprime is $10
million market value of CES.
|
| Ø |
Statistics
for loans underlying CES by dollar balance
at December 31, 2006: $331,181
average loan size; 63% jumbo, 37% conforming
balance at origination; 47%
located in California, 6% Florida, 5% New
York, 4% Virginia; 59%
originated in 2004 or earlier, 28% originated
in 2005, 13% originated in
2006; 69% average loan-to-property-value
at origination, 5% loans with
loan-to-value over 80% (many of which have
mortgage insurance or
additional pledged assets); 730 average
FICO credit score, 15% FICO under
680; 91% owner-occupied, 6% second home,
3% investor properties; 38% fixed
rate, 39% hybrid rate, 23% adjustable-rate;
57% fully-amortizing
principal, 24% interest-only, 19% negative
amortization
option.
|
| Ø |
Principal
value credit losses for the loans underlying
residential CES were $4.2
million for the fourth quarter, a loss
rate of less than one basis point
(0.01%) per year. As assets
season, we expect losses to increase.
Losses remain lower than our
original
expectations.
|
| Ø |
Our
GAAP credit reserves for residential CES were $372 million
($13.92 per
share) at December 31, 2006, a decrease of $18 million
for the quarter. At
year-end, credit reserves for CES (plus external credit
enhancement we
benefit from) were 0.32% of underlying loan balances.
As a result of
strong credit performance during the year, we transferred
$73 million
residential CES credit reserves to unamortized discount
that will be
amortized into income over time. Unamortized discount
balances for
residential CES were $145 million at
year-end.
|
| Ø |
For
tax purposes, realized credit losses were $1.6 million
for the fourth
quarter. This deduction is less than the principal value
losses incurred
on the underlying loans, as we own most of our credit-sensitive
assets at
a tax basis that is substantially less than par (principal)
value.
|
| Ø |
For
the $187 billion of our CES loans in pools consisting
primarily of prime
quality loans, at December 31, 2006 serious delinquencies
were $381
million, a 13% increase from the third quarter balance
of $337 million and
a 50% increase from the beginning 2006 balance of $254
million. At
December 31, 2006, serious delinquencies for prime CES
pools were 0.12% of
original balances and 0.20% of current balances. Principal
value credit
losses for the fourth quarter were $2.8 million.
|
| Ø |
For
the $18 billion of our CES loans in pools consisting
primarily
of alt-a quality loans, at December 31, 2006 serious
delinquencies were
$187 million, a 41% increase from the third quarter balance
of $133
million and a 224% increase from the beginning of 2006
balance of $58
million. At December 31, 2006, serious delinquencies
for alt-a CES pools
were 0.60% of original balances and 1.03% of current
balances. Principal
value credit losses for the fourth quarter were $1.3
million.
|
| Ø |
For
the $5 billion of our CES loans in pools consisting primarily
of
subprime quality loans, at December 31, 2006 serious
delinquencies were
$210 million, a 65% increase from the third quarter balance
of $127
million. Prior to the third quarter of 2006, the residential
CES portfolio
did not contain any subprime assets. At December 31,
2006, serious
delinquencies for subprime CES pools were 2.78% of original
balances and
3.87% of current balances. There were no credit losses
for the fourth
quarter.
|
| Ø |
At
December 31, 2006, $230 million of residential CES was
financed with
equity and $492 million was financed through our Acacia
CDO securitization
program.
|
| Ø |
Additional
information on our residential CES can be found in
Tables 9, 10, 11, and
12 of the Appendix.
|
| Ø |
In
the fourth quarter, our residential
loan portfolio declined from $9.8
billion to $9.3 billion. We acquired
$0.7 billion loans and had no sales.
Principal pay downs were $1.2
billion.
|
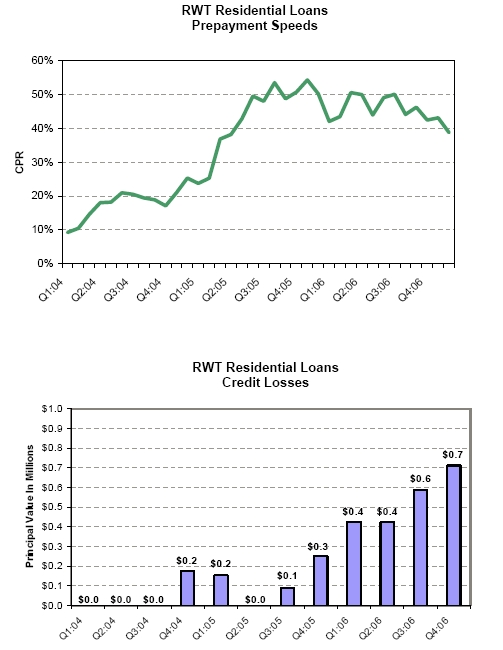
| Ø |
For
2006, our residential loan portfolio
decreased by $4.6 billion, or 33%,
as
prepayments exceeded acquisitions.
The average annual prepayment rate
(CPR) was 41% for the fourth quarter
and 43% for 2006. Most of these loans
are adjustable-rate loans that tend
to prepay rapidly when the yield
curve
is flat or inverted. Acquisitions
for 2006 were $2.0
billion.
|
| Ø |
Interest
income was $138 million in the fourth
quarter, a decrease from $149
million in the previous quarter.
This portfolio yielded 5.97%, similar
to
the yield of 5.97% in the previous
quarter. The yield for 2006 for
residential loans was 5.71%.
|
| Ø |
Premium
amortization expenses, a
component of interest income, were
$15 million for the fourth quarter
and
$48 million for 2006. We started
2006 with $13.9 billion principal
value
of loans and a loan premium balance
of $178 million for an average basis
of 101.30% of principal value. We
finished 2006 with $9 billion principal
value of loans and a premium balance
of $132 million for an average basis
of 101.43% of principal value. For
various technical accounting reasons,
for several years we have not been
able to amortize premium expense
balances as quickly as the loans
prepaid. If short-term interest rates
decline, under these accounting rules
we would expect premium amortization
expenses to increase significantly.
Largely because premium amortization
expenses have not kept pace with
prepayments in the past, we estimate
the
book value of residential loans exceeded
their market value by $83 million
at year-end.
|
| Ø |
Statistics
for residential loans by dollar balance
at December 31, 2006: 100% prime
quality loans; $332,624 average loan
size; 62% jumbo, 38% conforming
balance at origination; 23% located
in California, 12% Florida, 6% New
York, 3% Virginia; 78% originated
in 2004 or earlier, 17% originated
in
2006; 68% average loan-to-property-value
at origination, 8% loans with
loan-to-value over 80% (many of which
have other pledged assets); 733
average FICO credit score, 14% FICO
under 680; 86% owner-occupied, 11%
second home, 3% investor properties; 15% hybrid rate, 85%
adjustable-rate; 3% fully-amortizing,
97%
interest-only.
|
| Ø |
Realized
credit losses were $0.7
million for the fourth quarter, an
annual loss rate of three basis points
(0.03%) for the quarter. Losses for
2006 were $2.1 million, an annual
loss
rate of 0.02%. The loss for tax purposes
was $0.2 million for the fourth
quarter and $0.5 million for the
year. Cumulative losses have been
far
lower than our original expectations.
We expect losses to continue to
increase as these loans season. Credit
reserves for this portfolio were
$20 million at year-end.
|
| Ø |
The
balance of seriously
delinquent loans increased from $61 million to
$73 million during the
quarter, an increase from 0.21% to 0.24% of original
balances and from
0.63% to 0.79% of current balances. During 2006,
serious residential loan
delinquencies increased from $37 million to $73
million and REO (a
component of serious delinquencies) increased from
$3 million to $9
million. We believe delinquencies are increasing
both as a result of a
weaker housing market and the seasoning of the
portfolio. Loans originated
in 2004 or earlier were 78% of the portfolio at
December 31, 2006, and
seasoned loans generally have higher delinquency
rates.
|
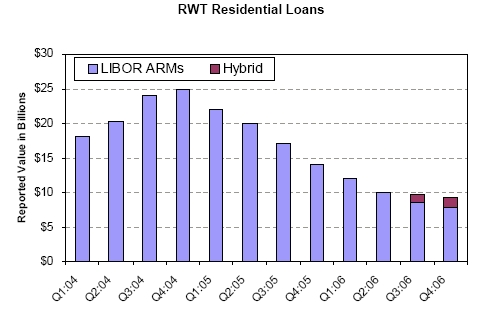
| Ø |
At
year-end, $8
billion residential loans were financed via securitization
(“Sequoia”) and
$1.3 billion were financed with Redwood debt. The
remainder were funded
with capital.
|
| Ø |
Additional
information on our residential loans can be found
in Tables 9, 10, 11, and
13 of the Appendix.
|
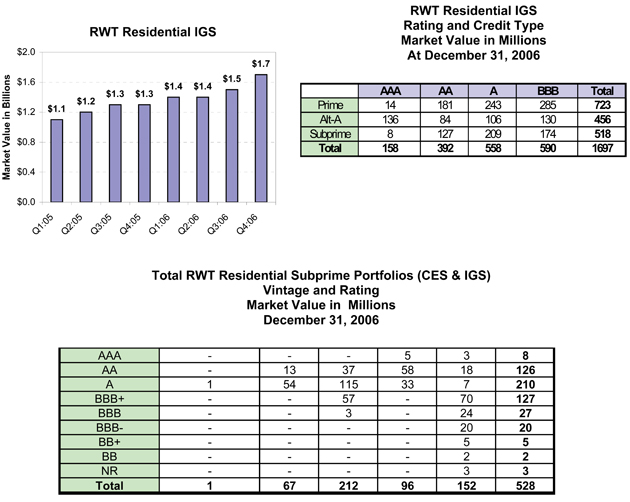
| Ø |
Our
residential IGS portfolio increased by 15%
in the fourth quarter from $1.5
billion to $1.7 billion. Acquisitions were
$352 million, market value
declined $2 million, EITF 99-20 market value
write-downs were $1 million,
sales were $97 million, calls were $6 million,
and principal pay downs
were $25 million.
|
| Ø |
For
2006, growth of our residential IGS portfolio
was 35%, from $1.3 billion
to $1.7 billion.
|
| Ø |
Interest
income generated by residential IGS was $26
million for the fourth
quarter. The yield for the fourth quarter was
6.77%, a decline from 7.11%
the previous quarter as we purchased higher
rated securities with lower
yields. The residential IGS yield for 2006
was
6.67%.
|
| Ø |
Net
discount amortization income (which is included
in interest income) for
the fourth quarter was $1 million. At year-end,
our net discount balance
for these assets was $16 million giving us
an average income statement
basis of 99.04% of principal value.
|
| Ø |
We
have never incurred a principal loss on a residential IGS security.
We do not have credit reserves for these assets.
There were no credit
rating upgrades or downgrades of IGS for the
fourth quarter of
2006.
|
| Ø |
At
year-end, residential IGS backed by subprime
loans totaled $518 million,
or 31% of the residential IGS portfolio. IGS
backed by subprime loans that
were originated in 2006 and that had BBB credit
ratings totaled $114
million at year-end. We sold $24 million of
these in January 2007 at a
slight loss. After these sales, we owned $90
million 2006 vintage subprime
BBBs, including $15 million bonds rated BBB-,
$19 million bonds rated BBB,
and $56 million bonds rated BBB+. The performance
of the loans underlying
these bonds has been satisfactory to date,
but we are monitoring them
closely as the industry-wide performance of subprime loans originated
in 2006 has generally been poor so far.
|
| Ø |
At
December 31, 2006, $1.4 billion of residential
IGS were financed via
securitization in our Acacia CDO program and
$0.3 billion were financed
with Redwood debt and capital. At December
31, 2006, the interest rate
characteristics of residential IGS were 60%
adjustable-rate, 23% hybrid,
and 17% fixed rate. We use interest rate agreements
to generally match the
interest rate characteristics of these assets
to their corresponding
funding sources.
|
| Ø |
Additional
information on our residential IGS can be found
in Tables 9 and 10 of the
Appendix.
|
| Ø |
Our
commercial CES portfolio increased
by $68 million (or 18%) in the fourth
quarter as a result of $76 million
acquisitions, $2 million market value
appreciation, and sales of $10 million.
|
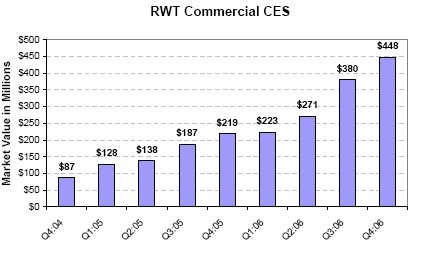
| Ø |
Our
commercial CES portfolio grew by 105%
during 2006, from $219 million to
$448 million.
|
| Ø |
Interest
income generated by commercial CES
was $8 million for the fourth quarter.
The yield for the quarter was 8.97%,
a small decrease from 9.00% in the
previous quarter. The yield for 2006
was 8.73%. The level of current yield
we recognize on these assets is largely
a function of our future credit
loss assumptions.
|
| Ø |
For
the fourth quarter of 2006, we generated
$0.4 million income from sales
and calls of commercial CES. Market
value appreciation on our commercial
CES portfolio was $2 million; all of
this unrealized appreciation was
recognized on our balance sheet but
none through our income
statement.
|
| Ø |
The
balance of commercial real estate loans
underlying these CES remained at
$58 billion during the fourth quarter.
We acquired $76 million CES from
two CMBS transactions with underlying
loans of $5 billion and sold $10
million CES from two CMBS transactions
with underlying loans of $5.2
billion.
|
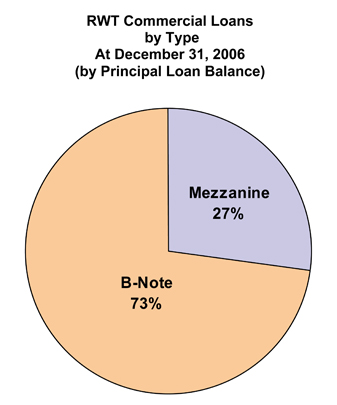
| Ø |
We
do not own all the first-loss CES issued
from the securitizations in which
we are currently in a first-loss position.
We own 40-49% of the first-loss
CES issued from transactions completed
prior to the first quarter of 2006.
For transactions completed after that
date, we own 50-100% of the issued
first-loss CES.
|
| Ø |
On
a principal value basis, for all the
transactions in which we have
invested, commercial first-loss CES
have averaged 1.35% of the underlying
loan balances at origination.
|
| Ø |
Statistics
for the loans underlying commercial
CES by dollar balance at December 31,
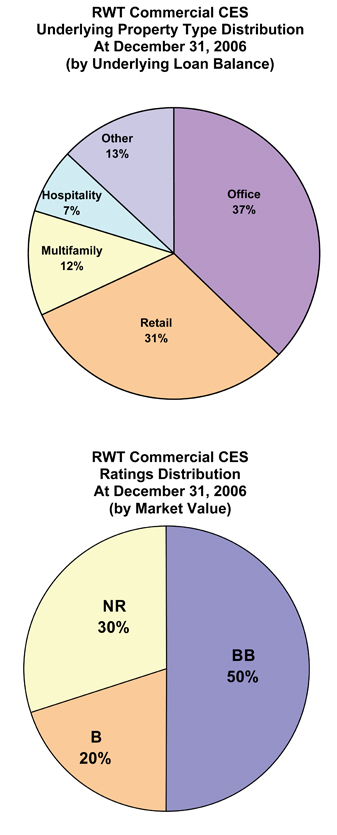
2006: 37% office, 31% retail, 12% multifamily,
7% hospitality, 13% other;
17% located in California, 13% in New
York, 8% in Texas, 4% in Virginia;
33% originated in 2006, 36% originated
in 2005, 31% originated in 2004 or
earlier.
|
| Ø |
There
were $0.5 million principal value of
credit losses for loans underlying
our commercial CES in the fourth quarter,
the first such credit losses
during 2006. The 2006 annual credit
loss rate was less than one basis
point (0.01%).
|
| Ø |
Our
GAAP credit reserves for commercial
CES were $295 million ($11.05 per
share) at December 31, 2006, an increase
of $66 million for the quarter.
At year-end, GAAP credit reserves were
0.51% of underlying loan balances.
|
| Ø |
For
tax purposes, realized credit losses
were $0.14 million for 2006. This
deduction is less than the principal
value losses incurred on the
underlying loans, as we own most of
our commercial CES at a tax basis that
is substantially less than par (principal)
value. In addition, we shared
these loan losses with other CES
investors.
|
| Ø |
For
loans underlying CES, serious delinquencies at December 31, 2006
were $64
million, remaining flat for the quarter. These delinquencies
were 0.11% of
current balances at year-end.
|
| Ø |
At
December 31, 2006, $224 million commercial CES were funded with
capital
and $224 million were financed through our Acacia CDO securitization
program.
|
| Ø |
Additional
information on our commercial CES can be found in Tables 9, 10,
14, and 15
of the Appendix.
|
| Ø |
Our
commercial loan portfolio at December
31, 2006 was $28 million. To date,
these loans are performing well.
|
| Ø |
We
successfully originated commercial
whole loans from 1998 to 2003. We
shut
down this production largely because
we were not able to develop a secure
source of financing for these assets.
|
| Ø |
Since
then, CDO securitization technology
has evolved so that some types of
commercial real estate whole loans
can be securitized and funded via
CDOs.
|
| Ø |
Although
our immediate focus is on further
developing our commercial CES business,
in the longer-run we will be evaluating
the possibility of rebuilding our
commercial whole loan business using
CDO securitization for funding. We
could buy loans, originate them,
or both.
|
| Ø |
Additional
information on our commercial loans
can be found in Tables 9, 10, 14,
and
16 of the Appendix.
|
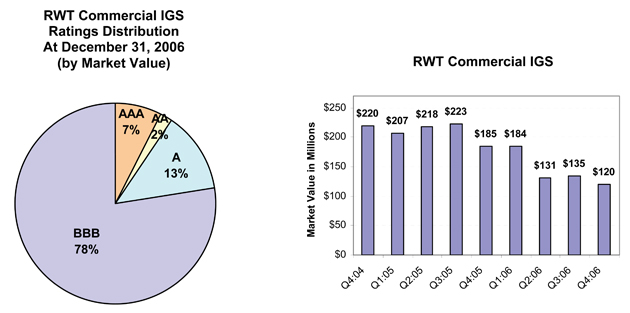
| Ø |
Our
commercial IGS portfolio
decreased by 11% in the fourth
quarter, from $135
million to $120 million.
Acquisitions were $9 million,
sales were $24
million, principal pay downs
were $0.7 million, and market
value
appreciation was $0.7 million.
Sales were the result of
our call of Acacia
3 and subsequent sale of
most of Acacia 3’s
assets.
|
| Ø |
For
2006, our commercial IGS
portfolio declined by 35%
from $185 million to
$120 million, largely as
a result of sales subsequent
to CDO calls. We
intend to acquire additional
commercial IGS in
2007.
|
| Ø |
Interest
income generated by commercial
IGS was $2 million for the
fourth quarter.
The yield on the fourth quarter
was 8.77%, an increase from
7.30% in the
previous quarter. Yields
increased as a result of
rising interest rates.
The commercial IGS yield
for 2006 was
7.01%.
|
| Ø |
At
year-end, our income statement
basis for commercial IGS
assets was 97.35%
of principal value, with
a total unamortized discount
of $3 million. Net
discount amortization income
(which is included in interest
income) was
$0.1 million for the fourth
quarter.
|
| Ø |
Market
value gains recognized in
the income statement during
the fourth quarter
were $1 million on sales
of $24 million.
|
| Ø |
We
have never incurred a principal loss on a commercial
IGS security and
we do not have credit reserves
for these assets. Credit
rating upgrades
for the quarter were $4 million
and there were no
downgrades.
|
| Ø |
At
December 31, 2006, all of
our commercial IGS were financed
via Acacia CDO
securitization. The interest
rate characteristics of commercial
CDO IGS
were 78% fixed rate and 22% floating rate. We
use interest rate
agreements to reduce any
interest rate mismatches
that may occur between
assets and their associated
liabilities.
|
| Ø |
Additional
information on our commercial
IGS can be found in Tables
9 and 10 of the
Appendix.
|
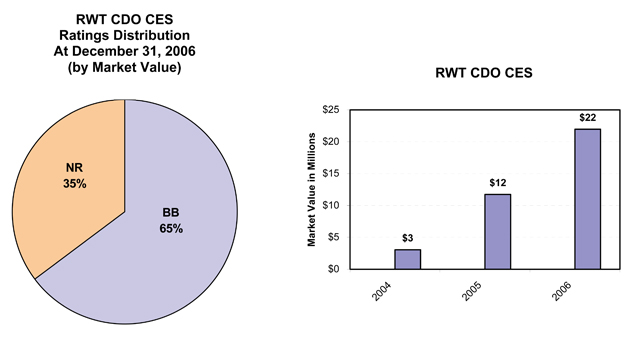
| Ø |
Our
CDO CES portfolio remained constant in
size in the fourth quarter at $22
million.
|
| Ø |
For
2006, growth of our CDO CES portfolio
was 97%, an increase from $11
million to $22 million.
|
| Ø |
Interest
income generated by CDO CES was $0.6
million for the fourth quarter. The
yield for the fourth quarter was 11.67%.
The CDO CES yield for 2006 was
10.75%. The increase in yield during
the fourth quarter was the result of
rising LIBOR rates and continued good
performance of the underlying
securities.
|
| Ø |
We
did not incur credit losses on CDO CES
in 2006, and we have no credit
reserves for these assets.
|
| Ø |
At
December 31, 2006, $13 million of CDO
CES was financed via securitization
in our Acacia CDO program and $9 million
was financed with
capital.
|
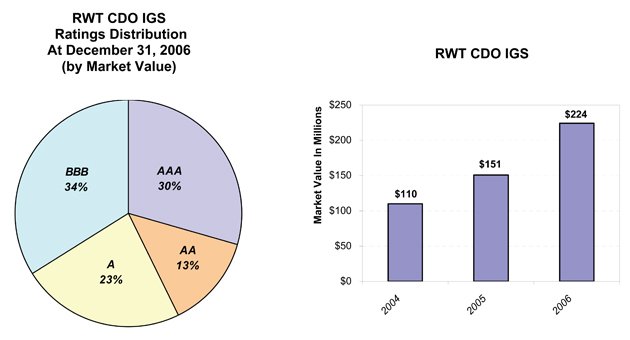
| Ø |
Our
CDO IGS portfolio increased by
21%, from $185 million to $224
million, in
the fourth quarter of 2006. This
increase was the result of acquisitions
of $45 million which were offset
by principal paydowns, mark-to-market
adjustments, and sales of assets
to third parties of $5.3
million.
|
| Ø |
For
2006, growth of our CDO IGS portfolio
was 48%, from $151 million to
$224
million.
|
| Ø |
Interest
income generated by the CDO IGS
portfolio during the fourth quarter
was
$3.3 million, an increase of
14% over the $2.9 million generated
in the
third quarter. The yield for
the fourth quarter was 7.20%.
The CDO IGS
yield for 2006 was 6.16%. The
yield has been increasing as
a result of
rising LIBOR rates. Substantially
all of these assets earn a floating
rate
of interest based on the LIBOR
interest rate.
|
| Ø |
We
own these assets at a cost basis
near par
value.
|
| Ø |
At
December 31, 2006, CDO IGS assets
backed primarily by residential
real
estate collateral were $152 million
and those backed primarily by
commercial real estate collateral
were $72 million. Most
of the underlying collateral
securities have investment-grade
credit
ratings.
|
| Ø |
We
have never incurred a principal loss on a CDO IGS security
and we do
not currently have credit reserves
for these
assets.
|
| Ø |
At
December 31, 2006, $210 million
of CDO IGS were financed via
securitization in our Acacia
CDO securitization program. We
funded $14
million of CDO IGS assets with
capital. We use interest rate
agreements to
reduce any mismatch of interest
rate characteristics between
the
fixed-rate CDO IGS we own and
the floating-rate CDO securities
issued by
Acacia to finance these assets.
|
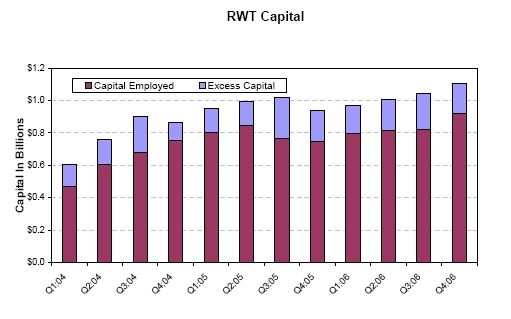
| Ø |
Our
capital
base
increased
by
$60
million
during
the
fourth
quarter
to
$1.1
billion.
We
issued
$100
million
junior
subordinated
notes
(in
the
form
of
trust
preferred
certificates),
issued
680,444
shares
of
common
stock
raising
$29
million,
and
earned
$36
million
profits.
Market
values
for
assets
marked-to-market
through
the
balance
sheet
declined
by
$2
million.
Our
capital
base
was
reduced
by
the
declaration
of
$103
million
regular
and
special
dividends.
|
| Ø |
Capital
employed
at
year-end
was
$914
million,
a
net
increase
of
11%
($90
million)
for
the
fourth
quarter.
We
closed
on
a
large
commercial
CES
transaction
in
the
fourth
quarter
and
acquired
new
assets
in
most
of
our
other
portfolios.
In
addition,
by
calling
two
Sequoia
securitizations,
we
replaced
ABS
issued
with
Redwood
debt,
thus
using
more
capital.
|
| Ø |
For
2006,
capital
employed
increased
by
23%
from
$746
million
to
$914
million.
|
| Ø |
We
ended
the
year
with
$182
million
of
excess
capital,
a
decrease
of
$37
million
from
the
beginning
of
the
quarter
and
$7
million
from
the
beginning
of
the
year.
|
| Ø |
We
issued
$100
million
unsecured
junior
subordinated
notes
in
December
2006.
These
notes
had
minimal
covenants
and
carried
an
interest
expense
of
2.25%
over
three
month
LIBOR.
At
year-end,
three
month
LIBOR
was
5.36%.
Maturity
is
in
30
years
(January
2037).
We
have
the
right
to
call
these
notes
without
any
prepayment
penalty
beginning
in
five
years
(January
2012).
|
| Ø |
We
currently
anticipate
that
growth
of
our
business
will
absorb
$200
million
to
$400
million
net
capital
in
2007.
Since
this
exceeds
our
year-end
excess
capital
of
$182
million,
we
anticipate
seeking
to
raise
additional
capital
in
2007.
We
will
issue
new
common
shares
through
our
direct
stock
purchase
plan
which
allows
new
or
existing
shareholders
to
acquire
shares
from
us
(as
a
new
investment
or
to
reinvest
their
dividends).
We
may
also
do
a
public
or
private
offering
of
shares
or
issue
long-term
junior
debt
that
we
would
consider
capital.
|
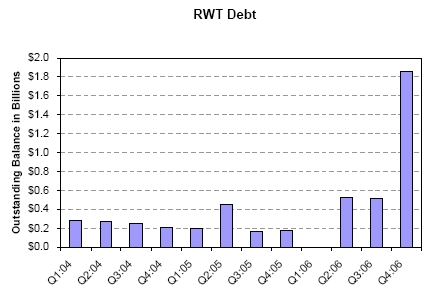
| Ø |
Redwood
debt
balances
increased
in
the
fourth
quarter
from
$0.5
billion
to
$1.9
billion
as
we
increasingly
used
debt
to
fund
residential
whole
loans
that
we
intend
to
own
on
an
ongoing
basis.
|
| Ø |
The
cost
of
funds
for
Redwood’s
debt
has
been
rising
with
short-term
interest
rates
-
it
was
6.06%
for
the
fourth
quarter
and
5.82%
in
the
third
quarter.
Interest
expense
for
Redwood
debt
was
$17
million
for
the
fourth
quarter
and
$30
million
for
2006.
|
| Ø |
At
December
31,
2006,
all
Redwood
debt
was
short-term
debt
collateralized
by
the
pledge
of
assets.
Maturities
are
generally
one
year
or
less,
and
the
interest
rate
usually
adjusts
to
market
levels
each
month.
|
| Ø |
In
the
fourth
quarter,
we
started
using
a
new
form
of
Redwood
debt
-
collateralized
commercial
paper
(CP)
issued
from
our
Madrona
CP
facility.
Madrona
CP
outstanding
at
year-end
was
$300
million.
Borrowings
under
our
Madrona
program
are
rated
the
highest
CP
rating
of
A1+/P1
and
represent
our
lowest
cost
borrowings.
At
year-end,
CP
collateral
was
limited
to
whole
loans.
In
2007,
we
expect
to
expand
our
Madrona
program
to
allow
for
funding
of
securities.
|
| Ø |
At
December
31,
2006,
Redwood
debt
funded
$1.3
billion
residential
whole
loans
and
$0.6
billion
securities.
|
| Ø |
When
we
fund
fixed-rate
or
hybrid-rate
assets
with
Redwood
debt,
we
generally
use
interest
rate
agreements
to
reduce
the
interest
rate
mismatch
between
the
asset
and
the
liability.
|
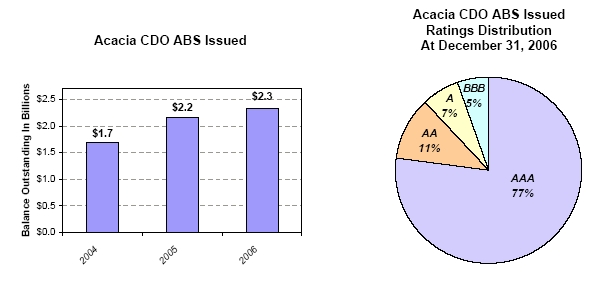
| Ø |
Acacia
CDO ABS outstanding
decreased from
$2.6 billion to
$2.3 billion during
the
fourth quarter,
a decrease of 12%.
Acacia did not
issue new CDO ABS
during
the quarter. We
exercised our call
rights with respect
to Acacia 3,
purchasing and
retiring $0.3 billion
CDO ABS and regaining
control of the
underlying collateral
assets. Pay downs
of Acacia CDO securities
were
negligible for
the quarter.
|
| Ø |
In
2006, Acacia issued
$700 million CDO
ABS securities
in two transactions.
Net of calls, Acacia
CDO bonds outstanding
grew by 5% in 2006,
from $2.2
billion to $2.3
billion. Acacia
issued $450 million
additional CDO
ABS in
February 2007 (via
Acacia 11), most
of which were rated
AAA. The Acacia
11
AAA-rated CDO ABS
were issued with
a coupon of three-month
LIBOR plus
0.30%.
|
| Ø |
At
December 31, 2006,
99% of Acacia bonds
outstanding were
floating rate
bonds with coupons
adjusting as a
function of the
LIBOR interest
rate.
|
| Ø |
The
cost of funds of
issued Acacia CDO
ABS was 6.08% in
the fourth quarter
of
2006 and 5.85%
for the full year
2006. The cost
of funds has been
rising
in conjunction
with short-term
interest rates.
Interest expense,
net of
interest rate agreements,
for Acacia ABS
issued was $39
million for the
fourth quarter
and $139 million
for 2006.
|
| Ø |
At
December 31, 2006,
the credit ratings
for Acacia bonds
outstanding were
$1.9 billion AAA,
$303 million AA,
$156 million A,
and $135 million
BBB.
In addition, Acacia
has sold a portion
of its unrated
CDO CES to third
parties, of which
$15 million was
outstanding at
December 31,
2006.
|
| Ø |
The
collateral underlying
each Acacia transaction
is typically rated
BBB on
average, with 7-15%
of assets rated
below
investment-grade.
|
| Ø |
The
Acacia CDO CES
Redwood has acquired
from Acacia had
a market value
of $127
million at December
31, 2006. Redwood’s economic risk
with respect to
Acacia’s assets and liabilities
is generally limited
to this amount.
For
accounting purposes,
we account for
Acacia transactions
as financings,
so
the assets owned
by Acacia are consolidated
with our assets
and the CDO
bonds issued by
Acacia are consolidated
with our liabilities.
As a result,
the Acacia CDO
CES assets we acquire
do not appear on
our GAAP balance
sheet, but rather
are implicitly
represented as
the excess of consolidated
Acacia assets over
consolidated Acacia
liabilities.
|
| Ø |
For
managing the outstanding
Acacia transactions,
Redwood’s asset management
(taxable) subsidiaries
earned $1.0 million
asset management
fees in the
fourth quarter
of 2006 and $3.2
million asset management
fees in 2006.
This income was
sourced from the
assets owned by
Acacia for GAAP,
and
these assets are
consolidated on
our GAAP balance
sheet, so we include
this asset management
income as part
of the interest
income generated
by
those assets.
|
| Ø |
Additional
information about
Acacia CDO ABS
issued can be
found in Table
20 of the
Appendix.
|
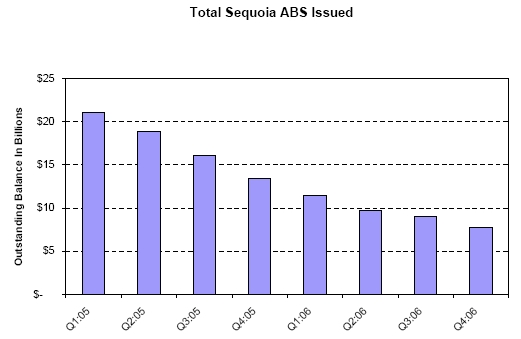
| Ø |
Sequoia
ABS
outstanding
decreased
from
$9.0
billion
to
$7.5
billion
in
the
fourth
quarter,
a
decline
of
17%.
There
was
no
new
issuance
for
the
quarter.
For
2006,
total
issuance
was
$0.7
billion.
During
2006,
Sequoia
ABS
outstanding
decreased
by
44%,
from
$13.4
billion
to
$7.5
billion.
Outstanding
amounts
are
reduced
as
the
underlying
loans
pay
down
and
also
as
a
result
of
calls.
We
called
$0.2
billion
Sequoia
ABS
in
2006.
|
| Ø |
Most
of
Sequoia’s
ABS
outstanding
are
rated
AAA.
For
Sequoia’s
last
issuance
in
August,
the
AAA-rated
ABS
issued
were
96%
of
the
total
issued.
These
AAA-rated
ABS
carry
a
coupon
of
5.98%.
|
| Ø |
The
cost
of
funds
of
issued
Sequoia
ABS
was
5.72%
in
the
fourth
quarter
of
2006
and
5.26%
for
the
full
year
2006.
The
cost
has
been
rising
in
conjunction
with
short-term
interest
rates.
Interest
expense
for
Sequoia
ABS
issued
was
$118
million
for
the
fourth
quarter
and
$533
million
for
2006.
|
| Ø |
Redwood’s
economic
risk
with
respect
to
Sequoia’s
assets
and
liabilities
is
generally
limited
to
the
value
of
Sequoia
ABS
we
have
acquired,
which
included
$26
million
market
value
IO
securities
rated
AAA,
$108
million
CES,
and
$154
million
investment-grade
securities
at
December
31,
2006.
For
GAAP
accounting
purposes,
we
account
for
Sequoia
transactions
as
financings,
so
the
assets
owned
by
Sequoia
are
consolidated
with
our
assets
and
the
ABS
bonds
issued
by
Sequoia
are
consolidated
with
our
liabilities.
As
a
result,
the
Sequoia
ABS
we
acquire
do
not
appear
on
our
GAAP
balance
sheet,
but
rather
are
implicitly
represented
as
the
excess
of
consolidated
Sequoia
assets
over
consolidated
Sequoia
liabilities.
|
| Ø |
Total
ABS
Issued
on
our
December
31,
2006
balance
sheet
included
$7.5
billion
Sequoia
ABS,
$2.3
billion
Acacia
CDO
ABS,
and
$5
million
ABS
issued
by
our
Madrona
CP
issuance
facility.
|
| Ø |
Additional
information
about
Sequoia
ABS
issued
can
be
found
in
Tables
18
and
19
of
the
Appendix.
|
|
Table
1: GAAP Earnings (in thousands, except per share
data)
|
||||||||||||||||||||||||||||||||||
|
Q4:2006
|
Q3:2006
|
Q2:2006
|
Q1:2006
|
Q4:2005
|
Q3:2005
|
Q2:2005
|
Q1:2005
|
Full
Year 2006 |
Full
year 2005 |
Full
year 2004 |
||||||||||||||||||||||||
|
Interest
income
|
$
|
213,504
|
$
|
217,504
|
$
|
214,544
|
$
|
224,795
|
$
|
234,531
|
$
|
246,810
|
$
|
248,786
|
$
|
237,714
|
$
|
870,347
|
$
|
967,840
|
$
|
655,195
|
||||||||||||
|
Discount
amortization income
|
20,323
|
19,530
|
14,381
|
14,661
|
11,936
|
12,714
|
8,395
|
9,316
|
68,895
|
42,361
|
36,071
|
|||||||||||||||||||||||
|
Premium
amortization expense
|
(14,930
|
)
|
(12,920
|
)
|
(13,193
|
)
|
(13,398
|
)
|
(14,451
|
)
|
(15,698
|
)
|
(10,203
|
)
|
(8,082
|
)
|
(54,441
|
)
|
(48,434
|
)
|
(32,412
|
)
|
||||||||||||
|
Provision
for (reversal of) credit reserve
|
(1,506
|
)
|
(465
|
)
|
2,506
|
(176
|
)
|
(877
|
)
|
805
|
1,527
|
(1,025
|
)
|
359
|
430
|
(7,236
|
)
|
|||||||||||||||||
|
Total
GAAP interest income
|
217,391
|
223,649
|
218,238
|
225,882
|
231,139
|
244,631
|
248,505
|
237,923
|
885,160
|
962,197
|
651,618
|
|||||||||||||||||||||||
|
Interest
expense on Redwood debt
|
(16,520
|
)
|
(9,422
|
)
|
(1,822
|
)
|
(2,072
|
)
|
(3,521
|
)
|
(3,789
|
)
|
(1,789
|
)
|
(2,694
|
)
|
(29,836
|
)
|
(11,793
|
)
|
(9,764
|
)
|
||||||||||||
|
ABS
interest expense consolidated from trusts
|
(152,043
|
)
|
(165,177
|
)
|
(171,659
|
)
|
(178,182
|
)
|
(186,433
|
)
|
(190,996
|
)
|
(191,966
|
)
|
(173,146
|
)
|
(667,061
|
)
|
(742,541
|
)
|
(398,865
|
)
|
||||||||||||
|
ABS
issuance expense amortization
|
(7,898
|
)
|
(5,786
|
)
|
(6,079
|
)
|
(5,907
|
)
|
(6,069
|
)
|
(5,162
|
)
|
(5,386
|
)
|
(5,273
|
)
|
(25,670
|
)
|
(21,890
|
)
|
(16,829
|
)
|
||||||||||||
|
ABS
interest agreement expense
|
2,497
|
3,317
|
3,678
|
2,980
|
3,573
|
623
|
876
|
1,469
|
12,472
|
6,541
|
(13,235
|
)
|
||||||||||||||||||||||
|
ABS
issuance premium amortization income
|
1,530
|
2,395
|
2,363
|
2,526
|
2,793
|
2,733
|
3,140
|
3,747
|
8,814
|
|
12,413
|
7,272
|
||||||||||||||||||||||
|
Total
consolidated ABS expense
|
(155,914
|
)
|
(165,251
|
)
|
(171,697
|
)
|
(178,583
|
)
|
(186,136
|
)
|
(192,802
|
)
|
(193,336
|
)
|
(173,203
|
)
|
(671,445
|
)
|
(745,477
|
)
|
(421,657
|
)
|
||||||||||||
|
Junior
subordinated notes
|
(423
|
)
|
-
|
-
|
-
|
-
|
-
|
-
|
-
|
(423
|
)
|
-
|
-
|
|||||||||||||||||||||
|
GAAP
net interest income
|
44,534
|
48,976
|
44,719
|
45,227
|
41,481
|
48,040
|
53,380
|
62,026
|
183,456
|
204,927
|
220,197
|
|||||||||||||||||||||||
|
Fixed
compensation expense
|
(3,688
|
)
|
(3,437
|
)
|
(3,309
|
)
|
(3,437
|
)
|
(2,879
|
)
|
(2,802
|
)
|
(2,623
|
)
|
(2,778
|
)
|
(13,871
|
)
|
(11,082
|
)
|
(8,040
|
)
|
||||||||||||
|
Variable
compensation expense
|
(4,899
|
)
|
(5,209
|
)
|
(4,891
|
)
|
(4,208
|
)
|
(5,005
|
)
|
(4,241
|
)
|
(5,174
|
)
|
(4,565
|
)
|
(19,207
|
)
|
(18,985
|
)
|
(16,794
|
)
|
||||||||||||
|
Other
operating expense
|
(4,732
|
)
|
(4,425
|
)
|
(5,150
|
)
|
(4,505
|
)
|
(4,583
|
)
|
(4,246
|
)
|
(3,542
|
)
|
(3,698
|
)
|
(18,812
|
)
|
(16,069
|
)
|
(10,324
|
)
|
||||||||||||
|
Due
diligence expenses
|
(532
|
)
|
(384
|
)
|
(2,687
|
)
|
(432
|
)
|
(298
|
)
|
(1,075
|
)
|
(117
|
)
|
(757
|
)
|
(4,035
|
)
|
(2,246
|
)
|
(3,534
|
)
|
||||||||||||
|
Total
GAAP operating expenses
|
(13,851
|
)
|
(13,455
|
)
|
(16,037
|
)
|
(12,582
|
)
|
(12,765
|
)
|
(12,364
|
)
|
(11,456
|
)
|
(11,798
|
)
|
(55,925
|
)
|
(48,382
|
)
|
(38,692
|
)
|
||||||||||||
|
Realized
gains on sales
|
5,308
|
4,968
|
8,239
|
1,062
|
14,815
|
23,053
|
516
|
8,346
|
19,577
|
|
46,730
|
7,639
|
||||||||||||||||||||||
|
Realized
gains on calls
|
1,511
|
722
|
747
|
-
|
4,265
|
2,914
|
4,421
|
7,548
|
2,980
|
19,149
|
58,739
|
|||||||||||||||||||||||
|
Valuation
adjustments
|
(1,404
|
)
|
(5,257
|
)
|
(2,993
|
)
|
(2,932
|
)
|
(1,205
|
)
|
(1,051
|
)
|
(1,892
|
)
|
(883
|
)
|
(12,586
|
)
|
(5,031
|
)
|
(7,251
|
)
|
||||||||||||
|
Net
gains and valuation adjustments
|
5,415
|
433
|
5,993
|
(1,870
|
)
|
17,875
|
24,916
|
3,045
|
15,011
|
9,971
|
60,848
|
59,127
|
||||||||||||||||||||||
|
Provision
for income taxes
|
(407
|
)
|
(3,538
|
)
|
(3,265
|
)
|
(2,760
|
)
|
(4,097
|
)
|
(4,693
|
)
|
(4,054
|
)
|
(4,677
|
)
|
(9,970
|
)
|
(17,521
|
)
|
(7,997
|
)
|
||||||||||||
|
GAAP
net income
|
$
|
35,691
|
$
|
32,416
|
$
|
31,410
|
$
|
28,015
|
$
|
42,495
|
$
|
55,899
|
$
|
40,915
|
$
|
60,563
|
$
|
127,532
|
$
|
199,872
|
$
|
232,635
|
||||||||||||
|
Diluted
average shares
|
27,122
|
26,625
|
26,109
|
25,703
|
25,311
|
25,314
|
25,196
|
25,021
|
26,314
|
25,121
|
22,229
|
|||||||||||||||||||||||
|
GAAP
earnings per share
|
$
|
1.32
|
$
|
1.22
|
$
|
1.20
|
$
|
1.09
|
$
|
1.68
|
$
|
2.21
|
$
|
1.62
|
$
|
2.42
|
$
|
4.85
|
$
|
7.96
|
$
|
10.47
|
||||||||||||
|
Table
2: Core Earnings (in thousands, except per share
data)
|
||||||||||||||||||||||||||||||||||
|
Q4:2006
|
Q3:2006
|
Q2:2006
|
Q1:2006
|
Q4:2005
|
Q3:2005
|
Q2:2005
|
Q1:2005
|
Full
Year 2006 |
Full
Year 2005 |
Full
Year 2004 |
||||||||||||||||||||||||
|
GAAP
net income
|
$
|
35,691
|
$
|
32,416
|
$
|
31,410
|
$
|
28,015
|
$
|
42,495
|
$
|
55,899
|
$
|
40,915
|
$
|
60,563
|
$
|
127,532
|
$
|
199,872
|
$
|
232,635
|
||||||||||||
|
GAAP
income items not included in core earnings
|
||||||||||||||||||||||||||||||||||
|
Realized
gains on sales
|
5,308
|
4,968
|
8,239
|
1,062
|
14,815
|
23,053
|
516
|
8,346
|
19,577
|
46,730
|
7,639
|
|||||||||||||||||||||||
|
Realized
gains on calls
|
1,511
|
722
|
747
|
-
|
4,265
|
2,914
|
4,421
|
7,548
|
2,980
|
19,149
|
58,739
|
|||||||||||||||||||||||
|
Valuation
adjustments
|
(1,404
|
)
|
(5,257
|
)
|
(2,993
|
)
|
(2,932
|
)
|
(1,205
|
)
|
(1,051
|
)
|
(1,892
|
)
|
(883
|
)
|
(12,586
|
)
|
(5,031
|
)
|
(7,251
|
)
|
||||||||||||
|
Variable
stock option market value change
|
-
|
-
|
-
|
-
|
25
|
16
|
(2
|
)
|
84
|
-
|
123
|
98
|
||||||||||||||||||||||
|
Total
GAAP / core earnings differences
|
5,415
|
433
|
5,993
|
(1,870
|
)
|
17,900
|
24,932
|
3,043
|
15,095
|
9,971
|
60,971
|
59,225
|
||||||||||||||||||||||
|
|
||||||||||||||||||||||||||||||||||
|
Core
earnings
|
$
|
30,276
|
$
|
31,983
|
$
|
25,417
|
$
|
29,885
|
$
|
24,594
|
$
|
30,967
|
$
|
37,872
|
$
|
45,468
|
$
|
117,561
|
$
|
138,901
|
$
|
173,410
|
||||||||||||
|
Per
share analysis
|
||||||||||||||||||||||||||||||||||
|
GAAP
earnings per share
|
$
|
1.32
|
$
|
1.22
|
$
|
1.20
|
$
|
1.09
|
$
|
1.68
|
$
|
2.21
|
$
|
1.62
|
$
|
2.42
|
$
|
4.85
|
$
|
7.96
|
$
|
10.47
|
||||||||||||
|
GAAP
income items not included in core earnings
|
||||||||||||||||||||||||||||||||||
|
Realized
gains on sales
|
$
|
0.20
|
$
|
0.19
|
$
|
0.32
|
$
|
0.04
|
$
|
0.59
|
$
|
0.91
|
$
|
0.02
|
$
|
0.33
|
$
|
0.74
|
$
|
1.86
|
$
|
0.34
|
||||||||||||
|
Realized
gains on calls
|
0.06
|
0.03
|
0.03
|
-
|
0.17
|
0.12
|
0.18
|
0.30
|
0.11
|
0.76
|
2.64
|
|||||||||||||||||||||||
|
Valuation
adjustments
|
(0.05
|
)
|
(0.20
|
)
|
(0.11
|
)
|
(0.11
|
)
|
(0.05
|
)
|
(0.04
|
)
|
(0.08
|
)
|
(0.04
|
)
|
(0.48
|
)
|
(0.20
|
)
|
(0.33
|
)
|
||||||||||||
|
Variable
stock option market value change
|
-
|
-
|
-
|
-
|
0.00
|
0.00
|
(0.00
|
)
|
0.00
|
-
|
0.00
|
0.00
|
||||||||||||||||||||||
|
GAAP
/ Core earnings differences per share
|
$
|
0.20
|
$
|
0.02
|
$
|
0.23
|
($0.07
|
)
|
$
|
0.71
|
$
|
0.98
|
$
|
0.12
|
$
|
0.60
|
$
|
0.38
|
$
|
2.43
|
$
|
2.66
|
||||||||||||
|
Core
earnings per share
|
$
|
1.12
|
$
|
1.20
|
$
|
0.97
|
$
|
1.16
|
$
|
0.97
|
$
|
1.22
|
$
|
1.50
|
$
|
1.82
|
$
|
4.47
|
$
|
5.53
|
$
|
7.80
|
||||||||||||
|
Table
3: GAAP / TAX Differences (in thousands, except per share
data)
|
||||||||||||||||||||||||||||
|
2006
|
2005
|
2004
|
||||||||||||||||||||||||||
|
|
GAAP
|
|
Difference
|
Estimate
Tax
|
GAAP
|
Difference
|
Actual Tax |
GAAP
|
|
Difference
|
Actual Tax |
|||||||||||||||||
|
Interest
income
|
$
|
885,160
|
($516,673
|
)
|
$
|
368,487
|
$
|
962,197
|
($749,388
|
)
|
$
|
212,809
|
$
|
651,618
|
($394,571
|
)
|
$
|
257,047
|
||||||||||
|
Interest
expense
|
(701,281
|
)
|
573,331
|
(127,950
|
)
|
(757,270
|
)
|
721,895
|
(35,375
|
)
|
(431,421
|
)
|
373,935
|
(57,486
|
)
|
|||||||||||||
|
Junior
subordinated notes
|
(423
|
)
|
-
|
(423
|
)
|
-
|
-
|
-
|
-
|
-
|
-
|
|||||||||||||||||
|
Net
interest income
|
183,456
|
56,658
|
240,114
|
204,927
|
(27,493
|
)
|
177,434
|
220,197
|
(20,636
|
)
|
199,561
|
|||||||||||||||||
|
Total
operating expenses
|
(55,925
|
)
|
(8,734
|
)
|
(64,659
|
)
|
(48,382
|
)
|
5,429
|
(42,953
|
)
|
(38,692
|
)
|
(14,701
|
)
|
(53,393
|
)
|
|||||||||||
|
Realized
gains on sales and calls
|
22,557
|
(20,609
|
)
|
1,948
|
65,879
|
(11,191
|
)
|
54,688
|
66,378
|
30,558
|
96,936
|
|||||||||||||||||
|
Valuation
adjustments
|
(12,586
|
)
|
12,586
|
0
|
(5,031
|
)
|
5,031
|
0
|
(7,251
|
)
|
7,251
|
0
|
||||||||||||||||
|
Provision
for income taxes
|
(9,970
|
)
|
7,090
|
(2,880
|
)
|
(17,521
|
)
|
12,278
|
(5,243
|
)
|
(7,997
|
)
|
5,870
|
(2,127
|
)
|
|||||||||||||
|
Net
income
|
$
|
127,532
|
$
|
46,991
|
$
|
174,523
|
$
|
199,872
|
($15,946
|
)
|
$
|
183,926
|
$
|
232,635
|
$
|
8,342
|
$
|
240,977
|
||||||||||
|
Shares
used for EPS calculation
|
26,314
|
25,971
|
25,121
|
24,754
|
22,229
|
22,135
|
||||||||||||||||||||||
|
Earnings
per share
|
$
|
4.85
|
$
|
6.72
|
$
|
7.96
|
$
|
7.43
|
$
|
10.47
|
$
|
10.89
|
||||||||||||||||
|
Taxable
Income (in thousands, except per share data)
|
||||||||||||||||||||||||||||
|
REIT
taxable income
|
$
|
167,002
|
$
|
171,309
|
$
|
201,873
|
||||||||||||||||||||||
|
Taxable
income in taxable subsidiaries
|
7,521
|
12,617
|
39,104
|
|||||||||||||||||||||||||
|
Total
taxable income
|
174,523
|
183,926
|
240,977
|
|||||||||||||||||||||||||
|
Retained
REIT taxable income (after-tax)
|
6,652
|
6,118
|
9,315
|
|||||||||||||||||||||||||
|
Retained
taxable income in taxable subsidaries (after-tax)
|
4,791
|
6,809
|
26,007
|
|||||||||||||||||||||||||
|
Total
retained taxable income (after-tax)
|
$
|
11,443
|
$
|
12,927
|
$
|
35,322
|
||||||||||||||||||||||
|
Shares
used for taxable EPS calculation
|
25,971
|
24,754
|
22,135
|
|||||||||||||||||||||||||
|
REIT
taxable income per share
|
$
|
6.43
|
$
|
6.92
|
$
|
9.12
|
||||||||||||||||||||||
|
Taxable
income in taxable subsidiaries per share
|
$
|
0.29
|
$
|
0.51
|
$
|
1.77
|
||||||||||||||||||||||
|
Total
taxable income per share
|
$
|
6.72
|
$
|
7.43
|
$
|
10.89
|
||||||||||||||||||||||
|
Total
retained taxable income (after-tax)
|
$
|
0.44
|
$
|
0.52
|
$
|
1.60
|
||||||||||||||||||||||
|
Table
4: Retention and Distribution of Taxable Income (in thousands, except
per
share data)
|
||||||||||||||||||||||||||||||||||
|
Estimated
|
Actual
|
Actual
|
||||||||||||||||||||||||||||||||
|
Estimated
|
Actual
|
Full
Year
|
Full
Year
|
Full
Year
|
||||||||||||||||||||||||||||||
|
Q4:2006
|
|
Q3:2006
|
Q2:2006
|
Q1:2006
|
Q4:2005
|
Q3:2005
|
Q2:2005
|
Q1:2005
|
2006
|
2005
|
|
2004
|
||||||||||||||||||||||
|
Dividends
declared
|
$
|
98,476
|
$
|
18,237
|
$
|
17,967
|
$
|
17,767
|
$
|
92,150
|
$
|
17,335
|
$
|
17,253
|
$
|
17,160
|
$
|
152,447
|
$
|
143,898
|
$
|
199,923
|
||||||||||||
|
Dividend
deduction on stock issued through DRIP
|
-
|
177
|
239
|
176
|
263
|
128
|
112
|
56
|
592
|
559
|
3,259
|
|||||||||||||||||||||||
|
Total
dividend deductions
|
$
|
98,476
|
$
|
18,414
|
$
|
18,206
|
$
|
17,943
|
$
|
92,413
|
$
|
17,463
|
$
|
17,365
|
$
|
17,216
|
$
|
153,039
|
$
|
144,457
|
$
|
203,182
|
||||||||||||
|
Regular
dividend per share
|
$
|
0.70
|
$
|
0.70
|
$
|
0.70
|
$
|
0.70
|
$
|
0.70
|
$
|
0.70
|
$
|
0.70
|
$
|
0.70
|
$
|
2.80
|
$
|
2.80
|
$
|
2.68
|
||||||||||||
|
Special
dividend per share
|
3.00
|
-
|
-
|
-
|
3.00
|
-
|
-
|
-
|
3.00
|
3.00
|
6.00
|
|||||||||||||||||||||||
|
Total
dividends per share
|
$
|
3.70
|
$
|
0.70
|
$
|
0.70
|
$
|
0.70
|
$
|
3.70
|
$
|
0.70
|
$
|
0.70
|
$
|
0.70
|
$
|
5.80
|
$
|
5.80
|
$
|
8.68
|
||||||||||||
|
Undistributed
REIT taxable income at beginning of period (pre-tax):
|
$
|
111,421
|
$
|
88,257
|
$
|
65,687
|
$
|
51,568
|
$
|
106,719
|
$
|
80,166
|
$
|
62,218
|
$
|
37,291
|
$
|
51,568
|
$
|
37,291
|
$
|
53,354
|
||||||||||||
|
REIT
taxable income (pre-tax)
|
40,408
|
45,934
|
45,040
|
35,382
|
39,793
|
47,118
|
39,237
|
45,161
|
166,764
|
171,309
|
201,873
|
|||||||||||||||||||||||
|
Permanently
retained (pre-tax)
|
(3,839
|
)
|
(4,356
|
)
|
(4,263
|
)
|
(3,320
|
)
|
(2,531
|
)
|
(3,102
|
)
|
(3,924
|
)
|
(3,018
|
)
|
(15,778
|
)
|
(12,575
|
)
|
(14,754
|
)
|
||||||||||||
|
Dividend
of 2004 income
|
-
|
-
|
-
|
-
|
-
|
(2,710
|
)
|
(17,365
|
)
|
(17,216
|
)
|
-
|
(37,291
|
)
|
(53,354
|
)
|
||||||||||||||||||
|
Dividend
of 2005 income
|
-
|
(15,418
|
)
|
(18,207
|
)
|
(17,943
|
)
|
(92,413
|
)
|
(14,753
|
)
|
-
|
-
|
(51,568
|
)
|
(107,166
|
)
|
(149,828
|
)
|
|||||||||||||||
|
Dividend
of 2006 income
|
(98,476
|
)
|
(2,996
|
)
|
-
|
-
|
-
|
-
|
-
|
-
|
(101,472
|
)
|
-
|
-
|
||||||||||||||||||||
|
Undistributed
REIT taxable income at end of period (pre-tax):
|
$
|
49,514
|
$
|
111,421
|
$
|
88,257
|
$
|
65,687
|
$
|
51,568
|
$
|
106,719
|
$
|
80,166
|
$
|
62,218
|
$
|
49,514
|
$
|
51,568
|
$
|
37,291
|
||||||||||||
|
Undistributed
REIT taxable income (pre-tax)
|
||||||||||||||||||||||||||||||||||
|
From
2004's income
|
$
|
-
|
$
|
-
|
$
|
-
|
$
|
-
|
$
|
-
|
$
|
-
|
$
|
2,710
|
$
|
20,075
|
$
|
-
|
$
|
-
|
$
|
37,291
|
||||||||||||
|
From
2005's income
|
-
|
-
|
15,418
|
33,625
|
51,568
|
106,719
|
77,456
|
42,143
|
-
|
51,568
|
-
|
|||||||||||||||||||||||
|
From
2006's income
|
49,514
|
111,421
|
72,839
|
32,062
|
-
|
-
|
-
|
-
|
49,514
|
-
|
-
|
|||||||||||||||||||||||
|
Total
|
$
|
49,514
|
$
|
111,421
|
$
|
88,257
|
$
|
65,687
|
$
|
51,568
|
$
|
106,719
|
$
|
80,166
|
$
|
62,218
|
$
|
49,514
|
$
|
51,568
|
$
|
37,291
|
||||||||||||
|
Shares
outstanding at period end
|
26,733
|
26,053
|
25,668
|
25,382
|
25,133
|
24,764
|
24,647
|
24,514
|
26,733
|
25,133
|
24,154
|
|||||||||||||||||||||||
|
Undistributed
REIT taxable income (pre-tax) per share outstanding
|
$
|
1.85
|
$
|
4.28
|
$
|
3.44
|
$
|
2.59
|
$
|
2.04
|
$
|
4.31
|
$
|
3.25
|
$
|
2.54
|
$
|
1.85
|
$
|
2.05
|
$
|
1.54
|
||||||||||||
|
Table
5: Assets (in millions)
|
||||||||||||||||||||||||||||
|
Q4:2006
|
Q3:2006
|
Q2:2006
|
Q1:2006
|
Q4:2005
|
Q3:2005
|
Q2:2005
|
Q1:2005
|
Q4:2004
|
||||||||||||||||||||
|
Residential
CES owned by Redwood
|
$
|
230
|
$
|
291
|
$
|
403
|
$
|
303
|
$
|
309
|
$
|
338
|
$
|
469
|
$
|
374
|
$
|
351
|
||||||||||
|
Residential
CES consolidated from Acacia
|
492
|
424
|
274
|
292
|
284
|
305
|
215
|
214
|
211
|
|||||||||||||||||||
|
Total
GAAP residential CES
|
$
|
722
|
$
|
715
|
$
|
677
|
$
|
595
|
$
|
593
|
$
|
643
|
$
|
684
|
$
|
588
|
$
|
562
|
||||||||||
|
Residential
loans owned by Redwood
|
$
|
1,339
|
$
|
520
|
$
|
351
|
$
|
87
|
$
|
45
|
$
|
17
|
$
|
300
|
$
|
256
|
$
|
193
|
||||||||||
|
Residential
loans consolidated from Sequoia
|
7,985
|
9,323
|
10,102
|
11,903
|
13,830
|
16,539
|
19,330
|
21,516
|
22,311
|
|||||||||||||||||||
|
Total
GAAP residential loans
|
$
|
9,324
|
$
|
9,843
|
$
|
10,453
|
$
|
11,990
|
$
|
13,875
|
$
|
16,556
|
$
|
19,630
|
$
|
21,772
|
$
|
22,504
|
||||||||||
|
Residential
IGS owned by Redwood
|
$
|
318
|
$
|
105
|
$
|
206
|
$
|
42
|
$
|
151
|
$
|
139
|
$
|
140
|
$
|
22
|
$
|
59
|
||||||||||
|
Residential
IGS consolidated from Acacia
|
1,379
|
1,369
|
1,184
|
1,305
|
1,109
|
1,140
|
1,053
|
1,066
|
915
|
|||||||||||||||||||
|
Total
GAAP residential IGS
|
$
|
1,697
|
$
|
1,474
|
$
|
1,390
|
$
|
1,347
|
$
|
1,260
|
$
|
1,279
|
$
|
1,193
|
$
|
1,088
|
$
|
974
|
||||||||||
|
Commercial
CES owned by Redwood
|
$
|
224
|
$
|
156
|
$
|
93
|
$
|
68
|
$
|
59
|
$
|
98
|
$
|
79
|
$
|
73
|
$
|
39
|
||||||||||
|
Commercial
CES consolidated from Acacia
|
224
|
224
|
178
|
156
|
160
|
89
|
59
|
55
|
48
|
|||||||||||||||||||
|
Total
GAAP commercial CES
|
$
|
448
|
$
|
380
|
$
|
271
|
$
|
224
|
$
|
219
|
$
|
187
|
$
|
138
|
$
|
128
|
$
|
87
|
||||||||||
|
Commercial
loans owned by Redwood
|
$
|
2
|
$
|
2
|
$
|
2
|
$
|
2
|
$
|
7
|
$
|
21
|
$
|
16
|
$
|
22
|
$
|
32
|
||||||||||
|
Commercial
loans consolidated from securitization
|
26
|
30
|
36
|
53
|
53
|
35
|
26
|
35
|
22
|
|||||||||||||||||||
|
Total
GAAP commercial loans
|
$
|
28
|
$
|
32
|
$
|
38
|
$
|
55
|
$
|
60
|
$
|
56
|
$
|
42
|
$
|
57
|
$
|
54
|
||||||||||
|
Commercial
IGS owned by Redwood
|
$
|
0
|
$
|
0
|
$
|
1
|
$
|
3
|
$
|
6
|
$
|
23
|
$
|
10
|
$
|
1
|
$
|
7
|
||||||||||
|
Commercial
IGS consolidated from Acacia
|
120
|
135
|
130
|
182
|
179
|
200
|
208
|
205
|
214
|
|||||||||||||||||||
|
Total
GAAP commercial IGS
|
$
|
120
|
$
|
135
|
$
|
131
|
$
|
185
|
$
|
185
|
$
|
223
|
$
|
218
|
$
|
206
|
$
|
221
|
||||||||||
|
CDO
CES owned by Redwood
|
$
|
9
|
$
|
10
|
$
|
5
|
$
|
5
|
$
|
5
|
$
|
12
|
$
|
2
|
$
|
2
|
$
|
3
|
||||||||||
|
CDO
CES consolidated from Acacia
|
13
|
13
|
10
|
9
|
7
|
-
|
-
|
-
|
-
|
|||||||||||||||||||
|
Total
GAAP CDO CES
|
$
|
22
|
$
|
23
|
$
|
15
|
$
|
14
|
$
|
12
|
$
|
12
|
$
|
2
|
$
|
2
|
$
|
3
|
||||||||||
|
CDO
IGS owned by Redwood
|
$
|
14
|
$
|
2
|
$
|
17
|
$
|
4
|
$
|
6
|
$
|
5
|
$
|
6
|
$
|
0
|
$
|
0
|
||||||||||
|
CDO
IGS consolidated from Acacia
|
210
|
183
|
160
|
160
|
145
|
141
|
143
|
133
|
110
|
|||||||||||||||||||
|
Total
GAAP CDO IGS
|
$
|
224
|
$
|
185
|
$
|
177
|
$
|
164
|
$
|
151
|
$
|
146
|
$
|
149
|
$
|
133
|
$
|
110
|
||||||||||
|
Cash
owned by Redwood
|
$
|
168
|
$
|
113
|
$
|
106
|
$
|
85
|
$
|
176
|
$
|
163
|
$
|
72
|
$
|
65
|
$
|
57
|
||||||||||
|
Restricted
cash consolidated from entities
|
112
|
139
|
86
|
131
|
72
|
59
|
48
|
58
|
36
|
|||||||||||||||||||
|
Accrued
interest receivable
|
71
|
67
|
67
|
73
|
76
|
80
|
85
|
82
|
72
|
|||||||||||||||||||
|
Principal
receivable
|
4
|
1
|
1
|
2
|
-
|
2
|
-
|
-
|
3
|
|||||||||||||||||||
|
Interest
rate agreements
|
27
|
30
|
54
|
48
|
31
|
25
|
13
|
29
|
16
|
|||||||||||||||||||
|
Deferred
tax asset
|
5
|
3
|
5
|
5
|
5
|
8
|
7
|
8
|
11
|
|||||||||||||||||||
|
Deferred
asset-backed security issuance costs
|
42
|
47
|
46
|
52
|
54
|
56
|
59
|
63
|
61
|
|||||||||||||||||||
|
Other
assets
|
16
|
13
|
13
|
10
|
8
|
10
|
6
|
6
|
7
|
|||||||||||||||||||
|
Total
GAAP assets
|
$
|
13,030
|
$
|
13,200
|
$
|
13,530
|
$
|
14,979
|
$
|
16,777
|
$
|
19,505
|
$
|
22,346
|
$
|
24,285
|
$
|
24,778
|
||||||||||
|
Residential
CES owned by Redwood
|
$
|
230
|
$
|
291
|
$
|
403
|
$
|
303
|
$
|
309
|
$
|
338
|
$
|
469
|
$
|
374
|
$
|
351
|
||||||||||
|
Residential
loans owned by Redwood
|
1,339
|
520
|
351
|
87
|
45
|
17
|
300
|
256
|
193
|
|||||||||||||||||||
|
Residential
IGS owned by Redwood
|
318
|
105
|
206
|
42
|
151
|
139
|
140
|
22
|
59
|
|||||||||||||||||||
|
Commercial
CES owned by Redwood
|
224
|
156
|
93
|
68
|
59
|
98
|
79
|
73
|
39
|
|||||||||||||||||||
|
Commercial
loans owned by Redwood
|
2
|
2
|
2
|
2
|
7
|
21
|
16
|
22
|
32
|
|||||||||||||||||||
|
Commercial
IGS owned by Redwood
|
-
|
-
|
1
|
3
|
6
|
23
|
10
|
1
|
7
|
|||||||||||||||||||
|
CDO
CES owned by Redwood
|
9
|
10
|
5
|
5
|
5
|
12
|
2
|
2
|
3
|
|||||||||||||||||||
|
CDO
IGS owned by Redwood
|
14
|
2
|
17
|
4
|
6
|
5
|
6
|
-
|
-
|
|||||||||||||||||||
|
Cash
owned by Redwood
|
168
|
113
|
106
|
85
|
176
|
163
|
72
|
65
|
57
|
|||||||||||||||||||
|
Assets
net of securitizations
|
2,304
|
1,199
|
1,184
|
599
|
764
|
816
|
1,094
|
815
|
741
|
|||||||||||||||||||
|
Assets
of securitizations for GAAP
|
10,449
|
11,701
|
12,074
|
14,060
|
15,767
|
18,449
|
21,034
|
23,224
|
23,831
|
|||||||||||||||||||
|
ABS
liabilities of entities for GAAP
|
(9,979
|
)
|
(11,554
|
)
|
(11,898
|
)
|
(13,930
|
)
|
(15,585
|
)
|
(18,237
|
)
|
(20,815
|
)
|
(23,057
|
)
|
(23,630
|
)
|
||||||||||
|
Redwood
earning assets - GAAP basis
|
$
|
2,774
|
$
|
1,346
|
$
|
1,360
|
$
|
729
|
$
|
946
|
$
|
1,028
|
$
|
1,313
|
$
|
982
|
$
|
942
|
||||||||||
|
Table
6: Liabilities and Equity (all $ in millions)
|
||||||||||||||||||||||||||||
|
Q4:2006
|
Q3:2006
|
Q2:2006
|
Q1:2006
|
Q4:2005
|
|
Q3:2005
|
Q2:2005
|
|
Q1:2005
|
|
Q4:2004
|
|||||||||||||||||
|
Redwood
debt
|
$
|
1,556
|
$
|
510
|
$
|
529
|
$
|
-
|
$
|
170
|
$
|
162
|
$
|
453
|
$
|
199
|
$
|
203
|
||||||||||
|
Madrona
commercial paper
|
300
|
-
|
-
|
-
|
-
|
-
|
-
|
-
|
-
|
|||||||||||||||||||
|
Total
Redwood debt
|
1,856
|
510
|
529
|
-
|
170
|
162
|
453
|
199
|
203
|
|||||||||||||||||||
|
ABS
issued, consolidated from entities
|
9,907
|
11,466
|
11,775
|
13,788
|
15,422
|
18,049
|
20,598
|
22,821
|
23,383
|
|||||||||||||||||||
|
Unamortized
IO issuance premium
|
75
|
90
|
106
|
124
|
143
|
163
|
186
|
202
|
210
|
|||||||||||||||||||
|
Unamortized
ABS issuance premium
|
(3
|
)
|
(2
|
)
|
17
|
18
|
20
|
25
|
31
|
34
|
37
|
|||||||||||||||||
|
ABS
obligations of entities
|
9,979
|
11,554
|
11,898
|
13,930
|
15,585
|
18,237
|
20,815
|
23,057
|
23,630
|
|||||||||||||||||||
|
Junior
subordinated notes
|
100
|
-
|
-
|
-
|
-
|
-
|
-
|
-
|
-
|
|||||||||||||||||||
|
Accrued
interest payable
|
50
|
51
|
47
|
43
|
41
|
42
|
43
|
38
|
35
|
|||||||||||||||||||
|
Interest
rate agreements
|
6
|
6
|
4
|
-
|
1
|
1
|
3
|
-
|
1
|
|||||||||||||||||||
|
Accrued
expenses and other liabilities
|
17
|
18
|
29
|
21
|
28
|
30
|
23
|
26
|
29
|
|||||||||||||||||||
|
Dividends
payable
|
19
|
18
|
18
|
18
|
17
|
17
|
17
|
17
|
16
|
|||||||||||||||||||
|
Total
GAAP liabilities
|
12,027
|
12,157
|
12,525
|
14,012
|
15,842
|
18,489
|
21,354
|
23,337
|
23,914
|
|||||||||||||||||||
|
Common
stock and paid-in capital
|
904
|
875
|
854
|
839
|
825
|
808
|
803
|
795
|
773
|
|||||||||||||||||||
|
Accumulated
other comprehensive income
|
93
|
95
|
91
|
82
|
74
|
117
|
137
|
125
|
105
|
|||||||||||||||||||
|
Cumulative
GAAP earnings
|
809
|
773
|
740
|
709
|
681
|
639
|
583
|
542
|
482
|
|||||||||||||||||||
|
Cumulative
distributions to shareholders
|
(803
|
)
|
(700
|
)
|
(681
|
)
|
(663
|
)
|
(645
|
)
|
(548
|
)
|
(531
|
)
|
(514
|
)
|
(496
|
)
|
||||||||||
|
GAAP
stockholders' equity
|
1,003
|
1,043
|
1,004
|
967
|
935
|
1,016
|
992
|
948
|
864
|
|||||||||||||||||||
|
Total
GAAP liabilities and equity
|
$
|
13,030
|
$
|
13,200
|
$
|
13,530
|
$
|
14,979
|
$
|
16,777
|
$
|
19,505
|
$
|
22,346
|
$
|
24,285
|
$
|
24,778
|
||||||||||
|
Total
Redwood debt
|
$
|
1,856
|
$
|
510
|
$
|
529
|
$
|
0
|
$
|
170
|
$
|
162
|
$
|
453
|
$
|
199
|
$
|
203
|
||||||||||
|
Junior
subordinated notes
|
100
|
-
|
-
|
-
|
-
|
-
|
-
|
-
|
-
|
|||||||||||||||||||
|
Redwood
obligations
|
$
|
1,956
|
$ |
510
|
$ |
529
|
$ |
-
|
$ |
170
|
$ |
162
|
$ |
453
|
$ |
199
|
$ |
203
|
||||||||||
|
GAAP
stockholders' equity
|
$ |
1,003
|
$ |
1,043
|
$ |
1,004
|
$ |
967
|
$ |
935
|
$ |
1016
|
$ |
992
|
$ |
948
|
$ |
864
|
||||||||||
|
Redwood
obligations to equity
|
2.0
|
0.5
|
0.5
|
-
|
0.2
|
0.2
|
0.5
|
0.2
|
0.2
|
|||||||||||||||||||
|
Redwood
obligations to (equity + Redwood obligations)
|
66
|
%
|
33
|
%
|
35
|
%
|
0
|
%
|
15
|
%
|
14
|
%
|
31
|
%
|
17
|
%
|
19
|
%
|
||||||||||
|
Redwood
obligations
|
$ |
1,956
|
$ |
510
|
$ |
529
|
$ |
0
|
$ |
170
|
$ |
162
|
$ |
453
|
$ |
199
|
$ |
203
|
||||||||||
|
ABS
obligations of entities
|
9,979
|
11,554
|
11,898
|
13,930
|
15,585
|
18,237
|
20,815
|
23,057
|
23,630
|
|||||||||||||||||||
|
GAAP
debt
|
$
|
11,935
|
$
|
12,064
|
$
|
12,427
|
$
|
13,930
|
$
|
15,755
|
$
|
18,399
|
$
|
21,268
|
$
|
23,256
|
$
|
23,833
|
||||||||||
|
GAAP
debt to equity
|
11.9
|
11.6
|
12.4
|
14.4
|
16.9
|
18.1
|
21.4
|
24.5
|
27.6
|
|||||||||||||||||||
|
GAAP
debt to (equity + GAAP debt)
|
92
|
%
|
92
|
%
|
93
|
%
|
94
|
%
|
94
|
%
|
95
|
%
|
96
|
%
|
96
|
%
|
97
|
%
|
||||||||||
|
Q4:2006
|
Q3:2006
|
Q2:2006
|
Q1:2006
|
Q4:2005
|
Q3:2005
|
Q2:2005
|
Q1:2005
|
Full
Year
2006
|
Full
year
2005
|
Full
year
2004
|
||||||||||||||||||||||||
|
GAAP
stockholders' equity
|
$
|
1,002,690
|
$
|
1,042,661
|
$
|
1,004,265
|
$
|
967,333
|
$
|
934,960
|
$
|
1,016,065
|
$
|
991,757
|
$
|
948,001
|
$
|
1,002,690
|
$
|
934,960
|
$
|
864,156
|
||||||||||||
|
Balance
sheet mark-to-market adjustments
|
93,158
|
94,780
|
90,937
|
81,591
|
73,731
|
117,043
|
137,380
|
124,784
|
93,158
|
73,731
|
105,357
|
|||||||||||||||||||||||
|
Core
equity
|
$
|
909,532
|
$
|
947,881
|
$
|
913,328
|
$
|
885,742
|
$
|
861,229
|
$
|
899,022
|
$
|
854,377
|
$
|
823,217
|
$
|
909,532
|
$
|
861,229
|
$
|
758,799
|
||||||||||||
|
Shares
outstanding at quarter end
|
26,733
|
26,053
|
25,668
|
25,382
|
25,133
|
24,764
|
24,647
|
24,514
|
26,733
|
25,133
|
24,154
|
|||||||||||||||||||||||
|
GAAP
equity per share
|
$
|
37.51
|
$
|
40.02
|
$
|
39.13
|
$
|
38.11
|
$
|
37.20
|
$
|
41.03
|
$
|
40.24
|
$
|
38.67
|
$
|
37.51
|
$
|
37.20
|
$
|
35.78
|
||||||||||||
|
Core
equity per share
|
$
|
34.02
|
$
|
36.38
|
$
|
35.58
|
$
|
34.90
|
$
|
34.27
|
$
|
36.30
|
$
|
34.66
|
$
|
33.58
|
$
|
34.02
|
$
|
34.27
|
$
|
31.42
|
||||||||||||
|
Net
interest income (NII)
|
$
|
44,534
|
$
|
48,976
|
$
|
44,719
|
$
|
45,227
|
$
|
41,481
|
$
|
48,040
|
$
|
53,380
|
$
|
62,026
|
$
|
183,456
|
$
|
204,927
|
$
|
220,197
|
||||||||||||
|
Net
interest income / average core equity
|
19
|
%
|
21
|
%
|
20
|
%
|
21
|
%
|
19
|
%
|
22
|
%
|
25
|
%
|
31
|
%
|
20
|
%
|
24
|
%
|
34
|
%
|
||||||||||||
|
Operating
expenses
|
$
|
13,851
|
$
|
13,455
|
$
|
16,037
|
$
|
12,582
|
$
|
12,765
|
$
|
12,364
|
$
|
11,456
|
$
|
11,798
|
$
|
55,925
|
$
|
48,382
|
$
|
38,692
|
||||||||||||
|
Average
total assets
|
$
|
13,041,794
|
$
|
13,480,361
|
$
|
14,168,755
|
$
|
15,839,483
|
$
|
18,348,681
|
$
|
20,991,299
|
$
|
23,365,553
|
$
|
24,563,184
|
$
|
14,123,149
|
$
|
21,797,922
|
$
|
21,559,604
|
||||||||||||
|
Average
total equity
|
$
|
1,008,863
|
$
|
1,011,609
|
$
|
980,402
|
$
|
952,230
|
$
|
999,313
|
$
|
1,014,329
|
$
|
970,344
|
$
|
895,462
|
$
|
988,495
|
$
|
970,268
|
$
|
730,499
|
||||||||||||
|
Operating
expenses / net interest income (NII)
|
31
|
%
|
27
|
%
|
36
|
%
|
28
|
%
|
31
|
%
|
26
|
%
|
21
|
%
|
19
|
%
|
30
|
%
|
24
|
%
|
18
|
%
|
||||||||||||
|
Operating
expenses / average total assets
|
0.42
|
%
|
0.40
|
%
|
0.45
|
%
|
0.32
|
%
|
0.28
|
%
|
0.24
|
%
|
0.20
|
%
|
0.19
|
%
|
0.40
|
%
|
0.22
|
%
|
0.18
|
%
|
||||||||||||
|
Operating
expenses / average total equity
|
5
|
%
|
5
|
%
|
7
|
%
|
5
|
%
|
5
|
%
|
5
|
%
|
5
|
%
|
5
|
%
|
6
|
%
|
5
|
%
|
5
|
%
|
||||||||||||
|
GAAP
net income
|
$
|
35,691
|
$
|
32,416
|
$
|
31,410
|
$
|
28,015
|
$
|
42,495
|
$
|
55,899
|
$
|
40,915
|
$
|
60,563
|
$
|
127,532
|
$
|
199,872
|
$
|
232,635
|
||||||||||||
|
GAAP
net income / average equity (GAAP ROE)
|
14
|
%
|
12
|
%
|
13
|
%
|
12
|
%
|
18
|
%
|
22
|
%
|
17
|
%
|
26
|
%
|
13
|
%
|
21
|
%
|
27
|
%
|
||||||||||||
|
GAAP
net income / average core equity (adjusted ROE)
|
15
|
%
|
14
|
%
|
14
|
%
|
13
|
%
|
19
|
%
|
25
|
%
|
19
|
%
|
30
|
%
|
14
|
%
|
24
|
%
|
36
|
%
|
||||||||||||
|
Interest
income
|
$
|
217,391
|
$
|
223,649
|
$
|
218,238
|
$
|
225,882
|
$
|
231,139
|
$
|
244,631
|
$
|
248,505
|
$
|
237,923
|
$
|
885,160
|
$
|
962,197
|
$
|
651,618
|
||||||||||||
|
Average
consolidated earning assets
|
$
|
12,498,889
|
$
|
12,860,488
|
$
|
13,581,710
|
$
|
15,229,790
|
$
|
17,542,352
|
$
|
20,085,392
|
$
|
22,606,037
|
$
|
24,042,561
|
$
|
13,533,367
|
$
|
21,048,582
|
$
|
21,208,757
|
||||||||||||
|
Asset
yield
|
6.96
|
%
|
6.96
|
%
|
6.43
|
%
|
5.93
|
%
|
5.27
|
%
|
4.87
|
%
|
4.40
|
%
|
3.96
|
%
|
6.54
|
%
|
4.57
|
%
|
3.07
|
%
|
||||||||||||
|
Interest
expense
|
($172,434
|
)
|
($174,673
|
)
|
($173,519
|
)
|
($180,655
|
)
|
($189,657
|
)
|
($196,591
|
)
|
($195,125
|
)
|
($175,897
|
)
|
($701,281
|
)
|
($757,270
|
)
|
($431,421
|
)
|
||||||||||||
|
Average
consolidated interest-bearing liablities
|
$
|
11,815,316
|
$
|
12,332,390
|
$
|
13,055,417
|
$
|
14,800,315
|
$
|
17,194,545
|
$
|
19,840,201
|
$
|
22,283,915
|
$
|
23,601,534
|
$
|
12,990,908
|
$
|
20,710,057
|
$
|
20,748,657
|
||||||||||||
|
Cost
of funds
|
5.84
|
%
|
5.67
|
%
|
5.32
|
%
|
4.88
|
%
|
4.41
|
%
|
3.96
|
%
|
3.50
|
%
|
2.98
|
%
|
5.40
|
%
|
3.66
|
%
|
2.08
|
%
|
||||||||||||
|
Asset
yield
|
6.96
|
%
|
6.96
|
%
|
6.43
|
%
|
5.93
|
%
|
5.27
|
%
|
4.87
|
%
|
4.40
|
%
|
3.96
|
%
|
6.54
|
%
|
4.57
|
%
|
3.07
|
%
|
||||||||||||
|
Cost
of funds
|
-5.84
|
%
|
-5.67
|
%
|
-5.32
|
%
|
-4.88
|
%
|
-4.41
|
%
|
-3.96
|
%
|
-3.50
|
%
|
-2.98
|
%
|
-5.40
|
%
|
-3.66
|
%
|
-2.08
|
%
|
||||||||||||
|
Interest
rate spread
|
1.12
|
%
|
1.29
|
%
|
1.11
|
%
|
1.05
|
%
|
0.86
|
%
|
0.91
|
%
|
0.89
|
%
|
0.98
|
%
|
1.14
|
%
|
0.91
|
%
|
0.99
|
%
|
||||||||||||
|
Net
interest income
|
$
|
44,534
|
$
|
48,976
|
$
|
44,719
|
$
|
45,227
|
$
|
41,481
|
$
|
48,040
|
$
|
53,380
|
$
|
62,026
|
$
|
183,456
|
$
|
204,927
|
$
|
220,197
|
||||||||||||
|
Average
consolidated earning assets
|
$
|
12,498,889
|
$
|
12,860,488
|
$
|
13,581,710
|
$
|
15,229,790
|
$
|
17,542,352
|
$
|
20,085,392
|
$
|
22,606,037
|
$
|
24,042,561
|
$
|
13,533,367
|
$
|
21,048,582
|
$
|
21,208,757
|
||||||||||||
|
Net
interest margin
|
1.43
|
%
|
1.52
|
%
|
1.32
|
%
|
1.19
|
%
|
0.95
|
%
|
0.96
|
%
|
0.94
|
%
|
1.03
|
%
|
1.36
|
%
|
0.97
|
%
|
1.04
|
%
|
||||||||||||
|
Table
8: Average Balance Sheet (in thousands)
|
||||||||||||||||||||||||||||||||||
|
Q4:2006
|
Q3:2006
|
Q2:2006
|
Q1:2006
|
Q4:2005
|
Q3:2005
|
Q2:2005
|
Q1:2005
|
Full
Year
2006
|
Full
year
2005
|
Full
year
2004
|
||||||||||||||||||||||||
|
Average
GAAP balances
|
||||||||||||||||||||||||||||||||||
|
Residential
CES
|
$
|
654,909
|
$
|
641,694
|
$
|
573,253
|
$
|
516,962
|
$
|
517,138
|
$
|
567,689
|
$
|
531,456
|
$
|
473,562
|
$
|
597,206
|
$
|
522,704
|
$
|
349,779
|
||||||||||||
|
Residential
loans
|
9,212,346
|
9,947,068
|
10,789,275
|
12,542,519
|
14,821,587
|
17,597,906
|
20,312,485
|
21,925,643
|
10,611,827
|
18,642,020
|
19,665,096
|
|||||||||||||||||||||||
|
Residential
IGS
|
1,513,794
|
1,404,281
|
1,358,453
|
1,299,933
|
1,263,277
|
1,219,034
|
1,122,945
|
1,030,406
|
1,393,736
|
1,158,785
|
771,543
|
|||||||||||||||||||||||
|
Commercial
CES
|
364,405
|
328,211
|
253,429
|
215,769
|
191,586
|
152,641
|
123,390
|
102,699
|
290,964
|
142,850
|
40,622
|
|||||||||||||||||||||||
|
Commercial
loans
|
29,571
|
32,194
|
42,912
|
56,777
|
59,049
|
47,703
|
45,214
|
56,080
|
40,267
|
52,008
|
30,469
|
|||||||||||||||||||||||
|
Commercial
IGS
|
106,902
|
128,355
|
132,154
|
181,549
|
188,445
|
215,109
|
204,247
|
198,437
|
138,425
|
202,594
|
168,137
|
|||||||||||||||||||||||
|
CDO
CES
|
19,539
|
20,999
|
13,950
|
14,709
|
12,231
|
11,892
|
2,816
|
6,302
|
17,245
|
8,155
|
4,668
|
|||||||||||||||||||||||
|
CDO
IGS
|
198,749
|
174,363
|
171,687
|
157,570
|
149,660
|
138,996
|
138,777
|
124,747
|
175,358
|
138,207
|
83,193
|
|||||||||||||||||||||||
|
Cash
and cash equivalents
|
398,674
|
183,323
|
246,597
|
244,002
|
339,379
|
134,422
|
124,707
|
124,685
|
268,340
|
181,259
|
95,251
|
|||||||||||||||||||||||
|
Earning
assets
|
12,498,889
|
12,860,488
|
13,581,710
|
15,229,790
|
17,542,352
|
20,085,392
|
22,606,037
|
24,042,561
|
13,533,367
|
21,048,582
|
21,208,757
|
|||||||||||||||||||||||
|
Other
assets
|
542,905
|
619,873
|
587,045
|
609,693
|
806,329
|
905,907
|
759,516
|
520,623
|
589,784
|
749,342
|
350,847
|
|||||||||||||||||||||||
|
Total
assets
|
$
|
13,041,794
|
$
|
13,480,361
|
$
|
14,168,755
|
$
|
15,839,483
|
$
|
18,348,681
|
$
|
20,991,299
|
$
|
23,365,553
|
$
|
24,563,184
|
$
|
14,123,151
|
$
|
21,797,922
|
$
|
21,559,604
|
||||||||||||
|
Redwood
debt
|
$
|
1,090,480
|
$
|
647,978
|
$
|
85,616
|
$
|
137,181
|
$
|
253,302
|
$
|
297,788
|
$
|
216,639
|
$
|
277,423
|
$
|
493,357
|
$
|
261,322
|
$
|
434,662
|
||||||||||||
|
Junior
subordinated notes
|
21,401
|
-
|
-
|
-
|
-
|
-
|
-
|
-
|
5,336
|
-
|
-
|
|||||||||||||||||||||||
|
ABS
obligations of entities
|
10,724,851
|
11,684,412
|
12,969,801
|
14,663,134
|
16,941,243
|
19,542,413
|
22,067,276
|
23,324,111
|
12,497,551
|
20,448,735
|
20,313,995
|
|||||||||||||||||||||||
|
Other
liabilities
|
196,214
|
136,362
|
132,936
|
86,938
|
154,823
|
136,769
|
111,294
|
66,188
|
138,409
|
117,597
|
80,448
|
|||||||||||||||||||||||
|
Total
liabilities
|
12,032,931
|
12,468,752
|
13,188,353
|
14,887,253
|
17,349,368
|
19,976,970
|
22,395,209
|
23,667,722
|
13,134,653
|
20,827,654
|
20,829,105
|
|||||||||||||||||||||||
|
Core
equity
|
923,856
|
932,030
|
898,409
|
877,212
|
880,329
|
880,482
|
840,098
|
794,866
|
908,071
|
849,257
|
641,182
|
|||||||||||||||||||||||
|
Balance
sheet mark-to-market adjustments
|
85,007
|
79,579
|
81,993
|
75,018
|
118,984
|
133,847
|
130,246
|
100,596
|
80,424
|
121,011
|
89,317
|
|||||||||||||||||||||||
|
Total
equity
|
1,008,863
|
1,011,609
|
980,402
|
952,230
|
999,313
|
1,014,329
|
970,344
|
895,462
|
988,495
|
970,268
|
730,499
|
|||||||||||||||||||||||
|
Total
liabilities and equity
|
$
|
13,041,794
|
$
|
13,480,361
|
$
|
14,168,755
|
$
|
15,839,483
|
$
|
18,348,681
|
$
|
20,991,299
|
$
|
23,365,553
|
$
|
24,563,184
|
$
|
14,123,149
|
$
|
21,797,922
|
$
|
21,559,604
|
||||||||||||
|
Table
9: Balances & Yields (all $ in thousands)
|
||||||||||||||||||||||||||||
|
At
period end
|
For
period ended
|
|||||||||||||||||||||||||||
|
Current
Face
|
Unamortized
Premium/ (Discount)
|
Credit
Protection
|
Unrealized
Market Value Gains
|
Net
Book Value
|
Average
Balance
|
Interest
Income
|
Yield
|
|||||||||||||||||||||
|
Total
Earning Assets (GAAP)
|
2004
|
$
|
24,794,021
|
$
|
101,481
|
($418,174
|
)
|
$
|
95,396
|
$
|
24,572,724
|
$
|
21,208,757
|
$
|
651,618
|
3.07
|
%
|
|||||||||||
|
|
Q1:
2005
|
24,301,643
|
122,952
|
(487,952
|
)
|
102,712
|
24,039,355
|
24,042,561
|
237,922
|
3.96
|
%
|
|||||||||||||||||
|
|
Q2:
2005
|
22,414,484
|
103,778
|
(522,490
|
)
|
133,207
|
22,128,979
|
22,606,037
|
248,505
|
4.40
|
%
|
|||||||||||||||||
|
|
Q3:
2005
|
19,625,979
|
94,058
|
(551,562
|
)
|
98,873
|
19,267,348
|
20,085,392
|
244,631
|
4.87
|
%
|
|||||||||||||||||
|
|
Q4:
2005
|
16,986,581
|
13,375
|
(527,213
|
)
|
56,541
|
16,529,284
|
17,542,352
|
231,139
|
5.27
|
%
|
|||||||||||||||||
|
2005
|
16,986,581
|
13,375
|
(527,213
|
)
|
56,541
|
16,529,284
|
21,048,582
|
962,197
|
4.57
|
%
|
||||||||||||||||||
|
|
Q1:
2006
|
15,168,319
|
12,214
|
(572,066
|
)
|
50,479
|
14,658,946
|
15,229,790
|
225,882
|
5.93
|
%
|
|||||||||||||||||
|
|
Q2:
2006
|
|
13,865,566
|
(18,161
|
)
|
(645,303
|
)
|
56,653
|
13,258,755
|
13,581,710
|
218,238
|
6.43
|
%
|
|||||||||||||||
|
|
Q3:
2006
|
|
13,553,988
|
(72,430
|
)
|
(670,246
|
)
|
88,943
|
12,900,255
|
12,860,488
|
223,649
|
6.96
|
%
|
|||||||||||||||
|
|
Q4:
2006
|
|
13,475,346
|
(113,138
|
)
|
(695,846
|
)
|
86,527
|
12,752,890
|
12,498,889
|
217,391
|
6.96
|
%
|
|||||||||||||||
|
2006
|
|
$
|
13,475,346
|
($113,138
|
)
|
($695,846
|
)
|
$
|
86,527
|
$
|
12,752,890
|
$
|
13,533,367
|
$
|
885,160
|
6.54
|
%
|
|||||||||||
|
|
||||||||||||||||||||||||||||
|
Residential
CES
|
2004
|
$
|
933,772
|
($110,724
|
)
|
($340,123
|
)
|
$
|
78,733
|
$
|
561,658
|
$
|
349,779
|
$
|
64,602
|
18.47
|
%
|
|||||||||||
|
|
Q1:
2005
|
952,925
|
(83,263
|
)
|
(365,998
|
)
|
84,096
|
587,760
|
473,562
|
18,850
|
15.92
|
%
|
||||||||||||||||
|
|
Q2:
2005
|
1,079,323
|
(90,716
|
)
|
(404,180
|
)
|
99,380
|
683,807
|
531,456
|
18,778
|
14.13
|
%
|
||||||||||||||||
|
|
Q3:
2005
|
1,029,786
|
(84,084
|
)
|
(382,862
|
)
|
80,867
|
643,707
|
567,689
|
23,640
|
16.66
|
%
|
||||||||||||||||
|
|
Q4:
2005
|
1,013,793
|
(121,824
|
)
|
(354,610
|
)
|
55,193
|
592,552
|
517,138
|
22,556
|
17.45
|
%
|
||||||||||||||||
|
2005
|
1,013,793
|
(121,824
|
)
|
(354,610
|
)
|
55,193
|
592,552
|
522,704
|
83,824
|
16.04
|
%
|
|||||||||||||||||
|
|
Q1:
2006
|
1,034,069
|
(108,371
|
)
|
(373,781
|
)
|
43,522
|
595,439
|
516,962
|
26,245
|
20.31
|
%
|
||||||||||||||||
|
|
Q2:
2006
|
1,168,602
|
(116,702
|
)
|
(425,578
|
)
|
50,854
|
677,176
|
573,253
|
28,059
|
19.58
|
%
|
||||||||||||||||
|
|
Q3:
2006
|
1,183,142
|
(140,585
|
)
|
(384,397
|
)
|
57,495
|
715,655
|
641,694
|
34,585
|
21.56
|
%
|
||||||||||||||||
|
|
Q4:
2006
|
1,180,605
|
(144,843
|
)
|
(372,246
|
)
|
58,015
|
721,531
|
654,909
|
35,650
|
21.77
|
%
|
||||||||||||||||
|
2006
|
$
|
1,180,605
|
($144,843
|
)
|
($372,246
|
)
|
$
|
58,015
|
$
|
721,531
|
$
|
597,206
|
$
|
124,539
|
20.85
|
%
|
||||||||||||
|
Residential
Real
Estate
Loans
|
2004
|
$
|
22,312,842
|
$
|
215,694
|
($23,771
|
)
|
$
|
0
|
$
|
22,504,765
|
$
|
19,665,096
|
$
|
533,376
|
2.71
|
%
|
|||||||||||
|
|
Q1:
2005
|
21,579,671
|
217,852
|
(24,827
|
)
|
0
|
21,772,696
|
21,925,643
|
197,701
|
3.61
|
%
|
|||||||||||||||||
|
|
Q2:
2005
|
19,443,387
|
210,137
|
(22,959
|
)
|
0
|
19,630,565
|
20,312,485
|
206,263
|
4.06
|
%
|
|||||||||||||||||
|
|
Q3:
2005
|
16,386,833
|
191,513
|
(22,029
|
)
|
0
|
16,556,317
|
17,597,906
|
193,621
|
4.40
|
%
|
|||||||||||||||||
|
|
Q4:
2005
|
13,719,242
|
178,206
|
(22,656
|
)
|
0
|
13,874,792
|
14,821,587
|
176,599
|
4.77
|
%
|
|||||||||||||||||
|
2005
|
13,719,242
|
178,206
|
(22,656
|
)
|
0
|
13,874,792
|
18,642,020
|
774,184
|
4.15
|
%
|
||||||||||||||||||
|
|
Q1:
2006
|
11,846,454
|
166,134
|
(22,372
|
)
|
0
|
11,990,216
|
12,542,519
|
165,665
|
5.28
|
%
|
|||||||||||||||||
|
|
Q2:
2006
|
10,318,641
|
155,101
|
(19,450
|
)
|
0
|
10,454,292
|
10,789,275
|
154,160
|
5.72
|
%
|
|||||||||||||||||
|
|
Q3:
2006
|
9,718,985
|
143,135
|
(19,326
|
)
|
0
|
9,842,794
|
9,947,068
|
148,494
|
5.97
|
%
|
|||||||||||||||||
|
|
Q4:
2006
|
9,212,002
|
132,052
|
(20,119
|
)
|
0
|
9,323,935
|
9,212,346
|
137,568
|
5.97
|
%
|
|||||||||||||||||
|
2006
|
$
|
9,212,002
|
$
|
132,052
|
($20,119
|
)
|
$
|
0
|
$
|
9,323,935
|
$
|
10,611,827
|
605,886
|
5.71
|
%
|
|||||||||||||
|
Table
9: Balances & Yields (all $ in thousands)
|
||||||||||||||||||||||||||||
|
At
period end
|
For
period ended
|
|||||||||||||||||||||||||||
|
Current
Face
|
Unamortized
Premium/ (Discount)
|
Credit
Protection
|
Unrealized
Market Value Gains
|
Net
Book Value
|
Average
Balance
|
Interest
Income
|
Yield
|
|||||||||||||||||||||
|
|
||||||||||||||||||||||||||||
|
Residential
IGS
|
2004
|
$
|
970,852 | ($2,922 |
)
|
$
|
0 |
$
|
5,955 |
$
|
973,885 |
$
|
771,543 |
$
|
30,842 | 4.00 |
%
|
|||||||||||
|
|
|
Q1:
2005
|
1,084,556
|
(9,054
|
)
|
0
|
11,895
|
1,087,397
|
1,030,406
|
12,865
|
4.99
|
%
|
||||||||||||||||
|
|
|
Q2:
2005
|
1,189,207
|
(12,165
|
)
|
0
|
16,252
|
1,193,294
|
1,122,945
|
13,909
|
4.95
|
%
|
||||||||||||||||
|
|
|
Q3:
2005
|
1,282,132
|
(13,970
|
)
|
0
|
11,082
|
1,279,244
|
1,219,034
|
16,942
|
5.56
|
%
|
||||||||||||||||
|
|
|
Q4:
2005
|
1,273,985
|
(11,595
|
)
|
0
|
(2,300
|
)
|
1,260,090
|
1,263,277
|
18,148
|
5.75
|
%
|
|||||||||||||||
|
|
2005
|
1,273,985
|
(11,595
|
)
|
0
|
(2,300
|
)
|
1,260,090
|
1,158,785
|
61,864
|
5.34
|
%
|
||||||||||||||||
|
|
|
Q1:
2006
|
1,361,245
|
(19,874
|
)
|
0
|
5,304
|
1,346,675
|
1,299,933
|
20,179
|
6.21
|
%
|
||||||||||||||||
|
|
|
Q2:
2006
|
1,406,195
|
(18,788
|
)
|
0
|
2,609
|
1,390,016
|
1,358,453
|
22,287
|
6.56
|
%
|
||||||||||||||||
|
|
Q3:
2006
|
1,484,095
|
(17,362
|
)
|
0
|
8,270
|
1,475,003
|
1,404,281
|
24,961
|
7.11
|
%
|
|||||||||||||||||
|
|
Q4:
2006
|
1,708,607
|
(16,382
|
)
|
0
|
5,025
|
1,697,250
|
1,513,794
|
25,626
|
6.77
|
%
|
|||||||||||||||||
|
2006
|
$
|
1,708,607
|
($16,382
|
)
|
$
|
0
|
$
|
5,025
|
$
|
1,697,250
|
$
|
1,393,736
|
$
|
93,053
|
6.68
|
%
|
||||||||||||
|
|
||||||||||||||||||||||||||||
|
Commercial
CES
|
2004
|
|
$
|
136,550
|
($6,563
|
)
|
($45,639
|
)
|
$
|
2,902
|
$
|
87,250
|
$
|
40,622
|
$
|
3,071
|
7.56
|
%
|
||||||||||
|
|
Q1:
2005
|
|
218,991
|
(7,241
|
)
|
(88,671
|
)
|
4,608
|
127,687
|
102,699
|
1,987
|
7.74
|
%
|
|||||||||||||||
|
|
Q2:
2005
|
|
222,522
|
(8,062
|
)
|
(87,210
|
)
|
10,779
|
138,029
|
123,390
|
2,811
|
9.11
|
%
|
|||||||||||||||
|
|
Q3:
2005
|
323,724
|
(2,428
|
)
|
(138,530
|
)
|
4,462
|
187,228
|
152,641
|
2,747
|
7.20
|
%
|
||||||||||||||||
|
|
Q4:
2005
|
383,334
|
(28,993
|
)
|
(141,806
|
)
|
6,321
|
218,856
|
191,586
|
3,927
|
8.20
|
%
|
||||||||||||||||
|
2005
|
383,334
|
(28,993
|
)
|
(141,806
|
)
|
6,321
|
218,856
|
142,850
|
11,472
|
8.03
|
%
|
|||||||||||||||||
|
|
Q1:
2006
|
407,466
|
(20,473
|
)
|
(167,772
|
)
|
4,081
|
223,302
|
215,769
|
4,268
|
7.91
|
%
|
||||||||||||||||
|
|
Q2:
2006
|
486,622
|
(28,184
|
)
|
(192,134
|
)
|
4,939
|
271,243
|
253,429
|
5,581
|
8.81
|
%
|
||||||||||||||||
|
|
Q3:
2006
|
667,512
|
(48,712
|
)
|
(258,382
|
)
|
19,449
|
379,867
|
328,211
|
7,381
|
9.00
|
%
|
||||||||||||||||
|
|
Q4:
2006
|
793,743
|
(71,424
|
)
|
(295,340
|
)
|
21,081
|
448,060
|
364,405
|
8,170
|
8.97
|
%
|
||||||||||||||||
|
2006
|
$
|
793,743
|
($71,424
|
)
|
($295,340
|
)
|
$
|
21,081
|
$
|
448,060
|
$
|
290,964
|
$
|
25,400
|
8.73
|
%
|
||||||||||||
|
|
||||||||||||||||||||||||||||
|
Commercial
Real Estate Loans
|
2004
|
|
$
|
65,598
|
($2,478
|
)
|
($8,641
|
)
|
$
|
0
|
$
|
54,479
|
$
|
30,469
|
$
|
3,769
|
12.37
|
%
|
||||||||||
|
|
Q1:
2005
|
67,365
|
(2,305
|
)
|
(8,456
|
)
|
0
|
56,604
|
56,080
|
1,587
|
11.32
|
%
|
||||||||||||||||
|
|
Q2:
2005
|
51,778
|
(1,843
|
)
|
(8,141
|
)
|
0
|
41,794
|
45,214
|
1,208
|
10.69
|
%
|
||||||||||||||||
|
|
Q3:
2005
|
66,348
|
(2,105
|
)
|
(8,141
|
)
|
0
|
56,102
|
47,703
|
1,209
|
10.14
|
%
|
||||||||||||||||
|
|
Q4:
2005
|
70,091
|
(2,258
|
)
|
(8,141
|
)
|
0
|
59,692
|
59,049
|
1,281
|
8.68
|
%
|
||||||||||||||||
|
2005
|
70,091
|
(2,258
|
)
|
(8,141
|
)
|
0
|
59,692
|
52,008
|
5,285
|
10.16
|
%
|
|||||||||||||||||
|
|
Q1:
2006
|
65,508
|
(2,200
|
)
|
(8,141
|
)
|
0
|
55,167
|
56,777
|
1,238
|
8.72
|
%
|
||||||||||||||||
|
|
Q2:
2006
|
46,959
|
(2,096
|
)
|
(8,141
|
)
|
0
|
36,722
|
42,912
|
812
|
7.57
|
%
|
||||||||||||||||
|
|
Q3:
2006
|
42,384
|
(2,073
|
)
|
(8,141
|
)
|
0
|
32,170
|
32,194
|
524
|
6.51
|
%
|
||||||||||||||||
|
|
Q4:
2006
|
38,360
|
(2,047
|
)
|
(8,141
|
)
|
0
|
28,172
|
29,571
|
409
|
5.53
|
%
|
||||||||||||||||
|
|
2006
|
$
|
38,360
|
($2,047
|
)
|
($8,141
|
)
|
$
|
0
|
$
|
28,172
|
$
|
40,267
|
$
|
2,982
|
7.41
|
%
|
|||||||||||
|
Table
9: Balances & Yields (all $ in thousands)
|
||||||||||||||||||||||||||||
|
At
period end
|
For
period ended
|
|||||||||||||||||||||||||||
|
Current
Face
|
Unamortized
Premium/ (Discount)
|
Credit
Protection
|
Unrealized
Market Value Gains
|
Net
Book Value
|
Average
Balance
|
Interest
Income
|
Yield
|
|||||||||||||||||||||
|
Commercial
IGS
|
2004
|
$
|
199,700
|
$
|
15,705
|
$
|
0
|
$
|
4,952
|
$
|
220,357
|
$
|
168,137
|
$
|
11,280
|
6.71
|
%
|
|||||||||||
|
|
Q1:
2005
|
192,551
|
14,561
|
0
|
(522
|
)
|
206,590
|
198,437
|
2,922
|
5.89
|
%
|
|||||||||||||||||
|
|
Q2:
2005
|
199,957
|
14,129
|
0
|
3,762
|
217,848
|
204,247
|
3,036
|
5.95
|
%
|
||||||||||||||||||
|
|
Q3:
2005
|
209,524
|
13,303
|
0
|
(44
|
)
|
222,783
|
215,109
|
3,398
|
6.32
|
%
|
|||||||||||||||||
|
|
Q4:
2005
|
180,213
|
8,100
|
0
|
(3,281
|
)
|
185,032
|
188,445
|
3,102
|
6.58
|
%
|
|||||||||||||||||
|
2005
|
180,213
|
8,100
|
0
|
(3,281
|
)
|
185,032
|
202,594
|
12,458
|
6.15
|
%
|
||||||||||||||||||
|
|
Q1:
2006
|
182,041
|
5,295
|
0
|
(2,936
|
)
|
184,400
|
181,549
|
2,880
|
6.35
|
%
|
|||||||||||||||||
|
|
Q2:
2006
|
134,244
|
727
|
0
|
(3,937
|
)
|
131,034
|
132,154
|
2,133
|
6.46
|
%
|
|||||||||||||||||
|
|
Q3:
2006
|
133,361
|
701
|
0
|
577
|
134,639
|
128,355
|
2,342
|
7.30
|
%
|
||||||||||||||||||
|
|
Q4:
2006
|
122,869
|
(3,367
|
)
|
0
|
111
|
119,613
|
106,902
|
2,344
|
8.77
|
%
|
|||||||||||||||||
|
2006
|
$
|
122,869
|
($3,367
|
)
|
$
|
0
|
$
|
111
|
$
|
119,613
|
$
|
138,425
|
$
|
9,699
|
7.01
|
%
|
||||||||||||
|
|
||||||||||||||||||||||||||||
|
CDO
CES
|
2004
|
|
$
|
7,282
|
($4,426
|
)
|
$
|
0
|
$
|
196
|
$
|
3,052
|
$
|
4,668
|
$
|
723
|
15.49
|
%
|
||||||||||
|
|
Q1:
2005
|
|
10,184
|
(7,113
|
)
|
0
|
(287
|
)
|
2,784
|
6,302
|
246
|
15.61
|
%
|
|||||||||||||||
|
|
Q2:
2005
|
|
10,184
|
(7,232
|
)
|
0
|
(187
|
)
|
2,765
|
2,816
|
127
|
18.04
|
%
|
|||||||||||||||
|
|
Q3:
2005
|
|
20,226
|
(7,907
|
)
|
0
|
144
|
12,463
|
11,892
|
131
|
4.41
|
%
|
||||||||||||||||
|
|
Q4:
2005
|
20,226
|
(8,004
|
)
|
0
|
(484
|
)
|
11,738
|
12,231
|
125
|
4.09
|
%
|
||||||||||||||||
|
2005
|
20,226
|
(8,004
|
)
|
0
|
(484
|
)
|
11,738
|
8,155
|
629
|
7.71
|
%
|
|||||||||||||||||
|
|
Q1:
2006
|
23,226
|
(8,048
|
)
|
0
|
(436
|
)
|
14,742
|
14,709
|
439
|
11.94
|
%
|
||||||||||||||||
|
|
Q2:
2006
|
22,226
|
(7,978
|
)
|
0
|
470
|
14,718
|
13,950
|
236
|
6.77
|
%
|
|||||||||||||||||
|
|
Q3:
2006
|
29,231
|
(7,298
|
)
|
0
|
326
|
22,259
|
20,999
|
609
|
11.60
|
%
|
|||||||||||||||||
|
|
Q4:
2006
|
28,731
|
(6,889
|
)
|
0
|
122
|
21,964
|
19,539
|
570
|
11.67
|
%
|
|||||||||||||||||
|
2006
|
$
|
28,731
|
($6,889
|
)
|
$
|
0
|
$
|
122
|
$
|
21,964
|
$
|
17,245
|
$
|
1,854
|
10.75
|
%
|
||||||||||||
|
|
||||||||||||||||||||||||||||
|
CDO
IGS
|
2004
|
|
$
|
110,179
|
($2,805
|
)
|
$
|
0
|
$
|
2,658
|
$
|
110,032
|
$
|
83,193
|
$
|
3,033
|
3.65
|
%
|
||||||||||
|
|
Q1:
2005
|
|
130,686
|
(485
|
)
|
0
|
2,922
|
133,123
|
124,747
|
1,184
|
3.80
|
%
|
||||||||||||||||
|
|
Q2:
2005
|
|
145,933
|
(470
|
)
|
0
|
3,221
|
148,684
|
138,777
|
1,569
|
4.52
|
%
|
||||||||||||||||
|
|
Q3:
2005
|
144,246
|
(264
|
)
|
0
|
2,362
|
146,344
|
138,996
|
1,953
|
5.62
|
%
|
|||||||||||||||||
|
|
Q4:
2005
|
149,812
|
(257
|
)
|
0
|
1,092
|
150,647
|
149,660
|
2,571
|
6.87
|
%
|
|||||||||||||||||
|
2005
|
149,812
|
(257
|
)
|
0
|
1,092
|
150,647
|
138,207
|
7,277
|
5.26
|
%
|
||||||||||||||||||
|
|
Q1:
2006
|
162,844
|
(249
|
)
|
0
|
944
|
163,539
|
157,570
|
2,491
|
6.32
|
%
|
|||||||||||||||||
|
|
Q2:
2006
|
175,586
|
(241
|
)
|
0
|
1,718
|
177,063
|
171,687
|
2,099
|
4.89
|
%
|
|||||||||||||||||
|
|
Q3:
2006
|
182,352
|
(236
|
)
|
0
|
2,826
|
184,942
|
174,363
|
2,881
|
6.61
|
%
|
|||||||||||||||||
|
|
Q4:
2006
|
222,413
|
(238
|
)
|
0
|
2,174
|
224,349
|
198,749
|
3,335
|
6.71
|
%
|
|||||||||||||||||
|
2006
|
$
|
222,413
|
($238
|
)
|
$
|
0
|
$
|
2,174
|
$
|
224,349
|
$
|
175,358
|
$
|
10,806
|
6.16
|
%
|
||||||||||||
|
|
||||||||||||||||||||||||||||
|
Cash
& Equivalents
|
2004
|
|
$
|
57,246
|
$
|
0
|
$
|
0
|
$
|
0
|
$
|
57,246
|
$
|
95,251
|
$
|
922
|
0.97
|
%
|
||||||||||
|
|
Q1:
2005
|
|
64,714
|
0
|
0
|
0
|
64,714
|
124,685
|
580
|
1.86
|
%
|
|||||||||||||||||
|
|
Q2:
2005
|
|
72,193
|
0
|
0
|
0
|
72,193
|
124,707
|
804
|
2.58
|
%
|
|||||||||||||||||
|
|
Q3:
2005
|
163,160
|
0
|
0
|
0
|
163,160
|
134,422
|
990
|
2.95
|
%
|
||||||||||||||||||
|
|
Q4:
2005
|
175,885
|
0
|
0
|
0
|
175,885
|
339,379
|
2,830
|
3.34
|
%
|
||||||||||||||||||
|
2005
|
175,885
|
0
|
0
|
0
|
175,885
|
181,259
|
5,204
|
2.87
|
%
|
|||||||||||||||||||
|
|
Q1:
2006
|
85,466
|
0
|
0
|
0
|
85,466
|
244,002
|
2,477
|
4.06
|
%
|
||||||||||||||||||
|
|
Q2:
2006
|
106,491
|
0
|
0
|
0
|
106,491
|
246,597
|
2,871
|
4.66
|
%
|
||||||||||||||||||
|
|
Q3:
2006
|
112,926
|
0
|
0
|
0
|
112,926
|
183,323
|
1,872
|
4.08
|
%
|
||||||||||||||||||
|
|
Q4:
2006
|
168,016
|
0
|
0
|
0
|
168,016
|
398,674
|
3,719
|
3.73
|
%
|
||||||||||||||||||
|
2006
|
$
|
168,016
|
$
|
0
|
$
|
0
|
$
|
0
|
$
|
168,016
|
$
|
268,340
|
$
|
10,939
|
4.08
|
%
|
||||||||||||
|
Table
10: Portfolio Activity (in thousands)
|
|||||||||||||||||||||||||||||||
|
Acquisitions
|
Upgrades
/ Downgrades
|
Sales
to Third Parties
|
|
Principal
Payments
|
|
Discount
/ (Premium) Amortization
|
|
Credit
Provision
|
|
Net
Charge-offs / (Recoveries)
|
Net
Mark-to-Market Adjustment
|
Net
Increase / (Decrease)
|
|||||||||||||||||||
|
Total
Earning
Assets
(GAAP)
|
|
Q1:
2005
|
$
|
1,096,034
|
$
|
0
|
($47,571
|
)
|
($1,612,020
|
)
|
$
|
714
|
($1,025
|
)
|
$
|
154
|
$
|
22,877
|
($540,837
|
)
|
|||||||||||
|
|
|
Q2:
2005
|
670,979
|
0
|
(17,582
|
)
|
(2,604,175
|
)
|
(2,281
|
)
|
1,527
|
(34
|
)
|
33,711
|
(1,917,855
|
)
|
|||||||||||||||
|
|
Q3:
2005
|
611,089
|
0
|
(361,871
|
)
|
(3,189,354
|
)
|
(3,619
|
)
|
805
|
125
|
(9,773
|
)
|
(2,952,598
|
)
|
||||||||||||||||
|
|
Q4:
2005
|
513,554
|
0
|
(473,899
|
)
|
(2,759,267
|
)
|
(3,012
|
)
|
(877
|
)
|
250
|
(27,538
|
)
|
(2,750,789
|
)
|
|||||||||||||||
|
2005
|
2,891,656
|
0
|
(900,923
|
)
|
(10,164,816
|
)
|
(8,198
|
)
|
430
|
495
|
19,227
|
(8,162,079
|
)
|
||||||||||||||||||
|
|
Q1:
2006
|
216,290
|
0
|
(13,634
|
)
|
(1,975,141
|
)
|
547
|
(176
|
)
|
425
|
(8,229
|
)
|
(1,779,919
|
)
|
||||||||||||||||
|
|
Q2:
2006
|
605,850
|
0
|
(171,206
|
)
|
(1,866,169
|
)
|
744
|
2,507
|
415
|
6,643
|
(1,421,216
|
)
|
||||||||||||||||||
|
|
Q3:
2006
|
1,288,070
|
0
|
(65,192
|
)
|
(1,631,603
|
)
|
6,168
|
(465
|
)
|
589
|
37,498
|
(364,935
|
)
|
|||||||||||||||||
|
|
Q4:
2006
|
1,229,739
|
0
|
(137,357
|
)
|
(1,300,463
|
)
|
4,934
|
(1,505
|
)
|
794
|
1,403
|
(202,455
|
)
|
|||||||||||||||||
|
2006
|
$
|
3,340,949
|
$
|
0
|
($387,389
|
)
|
($6,773,376
|
)
|
$
|
12,392
|
$
|
361
|
$
|
2,223
|
$
|
37,315
|
($3,768,525
|
)
|
|||||||||||||
|
|
|||||||||||||||||||||||||||||||
|
Residential
CES
|
Q1:
2005
|
|
$
|
67,796
|
($23,701
|
)
|
($27,293
|
)
|
($23,156
|
)
|
$
|
8,252
|
$
|
0
|
$
|
0
|
$
|
24,204
|
$
|
26,102
|
|||||||||||
|
|
Q2:
2005
|
|
87,864
|
0
|
0
|
(18,931
|
)
|
7,424
|
0
|
0
|
19,690
|
96,047
|
|||||||||||||||||||
|
|
Q3:
2005
|
|
57,479
|
0
|
(98,775
|
)
|
(17,013
|
)
|
10,766
|
0
|
0
|
7,443
|
(40,100
|
)
|
|||||||||||||||||
|
|
Q4:
2005
|
|
54,664
|
0
|
(81,292
|
)
|
(21,523
|
)
|
10,098
|
0
|
0
|
(13,102
|
)
|
(51,155
|
)
|
||||||||||||||||
|
2005
|
267,803
|
(23,701
|
)
|
(207,360
|
)
|
(80,623
|
)
|
36,540
|
0
|
0
|
38,235
|
30,894
|
|||||||||||||||||||
|
|
Q1:
2006
|
52,822
|
(30,667
|
)
|
(9,650
|
)
|
(14,110
|
)
|
12,391
|
0
|
0
|
(7,899
|
)
|
2,887
|
|||||||||||||||||
|
|
Q2:
2006
|
89,217
|
0
|
(4,035
|
)
|
(23,302
|
)
|
11,684
|
0
|
0
|
8,173
|
81,737
|
|||||||||||||||||||
|
|
Q3:
2006
|
87,305
|
0
|
(47,585
|
)
|
(28,835
|
)
|
15,917
|
0
|
0
|
11,677
|
38,479
|
|||||||||||||||||||
|
|
Q4:
2006
|
20,870
|
0
|
(962
|
)
|
(32,639
|
)
|
17,412
|
0
|
0
|
1,195
|
5,876
|
|||||||||||||||||||
|
2006
|
$
|
250,210
|
($30,667
|
)
|
($62,232
|
)
|
($98,886
|
)
|
$
|
57,404
|
$
|
0
|
$
|
0
|
$
|
13,146
|
$
|
128,979
|
|||||||||||||
|
|
|||||||||||||||||||||||||||||||
|
Residential
Real
Estate
Loans
|
Q1:
2005
|
|
$
|
832,383
|
$
|
0
|
$
|
0
|
($1,555,752
|
)
|
($7,644
|
)
|
($1,210
|
)
|
$
|
154
|
$
|
0
|
($732,069
|
)
|
|||||||||||
|
|
Q2:
2005
|
|
426,933
|
0
|
(3,378
|
)
|
(2,557,675
|
)
|
(9,758
|
)
|
1,527
|
(34
|
)
|
254
|
(2,142,131
|
)
|
|||||||||||||||
|
|
Q3:
2005
|
332,049
|
0
|
(263,079
|
)
|
(3,129,492
|
)
|
(14,438
|
)
|
805
|
125
|
(218
|
)
|
(3,074,248
|
)
|
||||||||||||||||
|
|
Q4:
2005
|
271,875
|
0
|
(240,987
|
)
|
(2,698,500
|
)
|
(13,334
|
)
|
(877
|
)
|
250
|
48
|
(2,681,525
|
)
|
||||||||||||||||
|
2005
|
1,863,240
|
0
|
(507,444
|
)
|
(9,941,419
|
)
|
(45,174
|
)
|
245
|
495
|
84
|
(8,629,973
|
)
|
||||||||||||||||||
|
|
Q1:
2006
|
52,691
|
0
|
0
|
(1,925,475
|
)
|
(12,075
|
)
|
(141
|
)
|
425
|
0
|
(1,884,575
|
)
|
|||||||||||||||||
|
|
Q2:
2006
|
272,627
|
0
|
0
|
(1,799,401
|
)
|
(12,073
|
)
|
2,507
|
416
|
0
|
(1,535,924
|
)
|
||||||||||||||||||
|
|
Q3:
2006
|
966,673
|
0
|
0
|
(1,567,041
|
)
|
(11,254
|
)
|
(465
|
)
|
589
|
0
|
(611,498
|
)
|
|||||||||||||||||
|
|
Q4:
2006
|
725,695
|
0
|
0
|
(1,230,545
|
)
|
(13,298
|
)
|
(1,505
|
)
|
794
|
0
|
(518,859
|
)
|
|||||||||||||||||
|
2006
|
$
|
2,017,775
|
$
|
0
|
$
|
0
|
($6,522,462
|
)
|
($48,709
|
)
|
$
|
396
|
$
|
2,141
|
$
|
0
|
($4,550,857
|
)
|
|||||||||||||
|
|
|||||||||||||||||||||||||||||||
|
Residential
IGS
|
Q1:
2005
|
$
|
120,709
|
$
|
23,701
|
($11,488
|
)
|
($22,345
|
)
|
$
|
547
|
$
|
0
|
$
|
0
|
$
|
2,388
|
$
|
113,512
|
||||||||||||
|
|
Q2:
2005
|
|
128,708
|
0
|
(3,012
|
)
|
(22,961
|
)
|
347
|
0
|
0
|
2,818
|
105,900
|
||||||||||||||||||
|
|
Q3:
2005
|
114,699
|
0
|
4,000
|
(27,627
|
)
|
761
|
0
|
0
|
(5,883
|
)
|
85,950
|
|||||||||||||||||||
|
|
Q4:
2005
|
116,987
|
0
|
(95,328
|
)
|
(29,834
|
)
|
790
|
0
|
0
|
(11,769
|
)
|
(19,154
|
)
|
|||||||||||||||||
|
2005
|
481,103
|
23,701
|
(105,828
|
)
|
(102,767
|
)
|
2,445
|
0
|
0
|
(12,449
|
)
|
286,205
|
|||||||||||||||||||
|
|
Q1:
2006
|
80,970
|
30,667
|
(3,984
|
)
|
(25,445
|
)
|
853
|
0
|
0
|
3,524
|
86,585
|
|||||||||||||||||||
|
|
Q2:
2006
|
179,115
|
0
|
(104,442
|
)
|
(31,136
|
)
|
1,446
|
0
|
0
|
(1,642
|
)
|
43,341
|
||||||||||||||||||
|
|
Q3:
2006
|
120,316
|
0
|
(12,669
|
)
|
(29,997
|
)
|
1,943
|
0
|
0
|
5,394
|
84,987
|
|||||||||||||||||||
|
|
Q4:
2006
|
352,291
|
0
|
(97,124
|
)
|
(31,398
|
)
|
1,023
|
0
|
0
|
(2,545
|
)
|
222,247
|
||||||||||||||||||
|
|
2006
|
$
|
732,692
|
$
|
30,667
|
($218,219
|
)
|
($117,976
|
)
|
$
|
5,265
|
$
|
0
|
$
|
0
|
$
|
4,731
|
$
|
437,160
|
||||||||||||
|
Table
10: Portfolio Activity (in thousands)
|
|||||||||||||||||||||||||||||||
|
|
Acquisitions
|
Upgrades
/ Downgrades
|
Sales
to Third Parties
|
Principal
Payments
|
Discount
/ (Premium) Amortization
|
Credit
Provision
|
Net
Charge-offs / (Recoveries)
|
Net Mark-to-Market Adjustment |
Net
Increase / (Decrease)
|
||||||||||||||||||||||
|
Commercial
CES
|
Q1:
2005
|
$
|
41,072
|
($2,192
|
)
|
$
|
0
|
($10
|
)
|
($174
|
)
|
$
|
0
|
$
|
0
|
$
|
1,741
|
$
|
40,437
|
||||||||||||
|
|
Q2:
2005
|
4,263
|
0
|
0
|
(8
|
)
|
68
|
0
|
0
|
6,019
|
10,342
|
||||||||||||||||||||
|
|
Q3:
2005
|
55,941
|
0
|
0
|
(8
|
)
|
(416
|
)
|
0
|
0
|
(6,318
|
)
|
49,199
|
||||||||||||||||||
|
|
Q4:
2005
|
30,293
|
0
|
0
|
(9
|
)
|
(276
|
)
|
0
|
0
|
1,620
|
31,628
|
|||||||||||||||||||
|
2005
|
131,569
|
(2,192
|
)
|
0
|
(35
|
)
|
(798
|
)
|
0
|
0
|
3,062
|
131,606
|
|||||||||||||||||||
|
|
Q1:
2006
|
11,130
|
(3,966
|
)
|
0
|
(10
|
)
|
(564
|
)
|
0
|
0
|
(2,144
|
)
|
4,446
|
|||||||||||||||||
|
|
Q2:
2006
|
51,978
|
0
|
(2,820
|
)
|
(9
|
)
|
(257
|
)
|
0
|
0
|
(951
|
)
|
47,941
|
|||||||||||||||||
|
|
Q3:
2006
|
99,065
|
0
|
(4,216
|
)
|
(9
|
)
|
(451
|
)
|
0
|
0
|
14,235
|
108,624
|
||||||||||||||||||
|
|
Q4:
2006
|
76,498
|
0
|
(9,914
|
)
|
(13
|
)
|
(289
|
)
|
0
|
0
|
1,913
|
68,193
|
||||||||||||||||||
|
2006
|
$
|
238,671
|
($3,966
|
)
|
($16,950
|
)
|
($41
|
)
|
($1,561
|
)
|
$
|
0
|
$
|
0
|
$
|
13,053
|
$
|
229,204
|
|||||||||||||
|
|
|||||||||||||||||||||||||||||||
|
Commercial
Real Estate Loans
|
Q1:
2005
|
|
$
|
6,732
|
$
|
0
|
$
|
0
|
($5,267
|
)
|
($30
|
)
|
$
|
185
|
$
|
0
|
$
|
505
|
$
|
2,125
|
|||||||||||
|
|
Q2:
2005
|
|
0
|
0
|
(11,192
|
)
|
(3,769
|
)
|
(99
|
)
|
0
|
0
|
250
|
(14,810
|
)
|
||||||||||||||||
|
|
Q3:
2005
|
|
14,219
|
0
|
(17
|
)
|
158
|
(69
|
)
|
0
|
0
|
17
|
14,308
|
||||||||||||||||||
|
|
Q4:
2005
|
|
4,248
|
0
|
0
|
(506
|
)
|
(152
|
)
|
0
|
0
|
0
|
3,590
|
||||||||||||||||||
|
2005
|
25,199
|
0
|
(11,209
|
)
|
(9,384
|
)
|
(350
|
)
|
185
|
0
|
772
|
5,213
|
|||||||||||||||||||
|
|
Q1:
2006
|
0
|
0
|
0
|
(4,583
|
)
|
93
|
(35
|
)
|
0
|
0
|
(4,525
|
)
|
||||||||||||||||||
|
|
Q2:
2006
|
0
|
0
|
(8,408
|
)
|
(10,049
|
)
|
27
|
0
|
0
|
(14
|
)
|
(18,445
|
)
|
|||||||||||||||||
|
|
Q3:
2006
|
0
|
0
|
0
|
(4,574
|
)
|
22
|
0
|
0
|
0
|
(4,552
|
)
|
|||||||||||||||||||
|
|
Q4:
2006
|
0
|
0
|
0
|
(4,024
|
)
|
26
|
0
|
0
|
0
|
(3,998
|
)
|
|||||||||||||||||||
|
2006
|
$
|
0
|
$
|
0
|
($8,408
|
)
|
($23,230
|
)
|
$
|
168
|
($35
|
)
|
$
|
0
|
($14
|
)
|
($31,520
|
)
|
|||||||||||||
|
|
|||||||||||||||||||||||||||||||
|
Commercial
IGS
|
Q1:
2005
|
|
$
|
3,500
|
$
|
2,192
|
($8,790
|
)
|
($5,298
|
)
|
($244
|
)
|
$
|
0
|
$
|
0
|
($5,127
|
)
|
($13,767
|
)
|
|||||||||||
|
|
Q2:
2005
|
|
7,845
|
0
|
0
|
(594
|
)
|
(281
|
)
|
0
|
0
|
4,288
|
11,258
|
||||||||||||||||||
|
|
Q3:
2005
|
|
17,179
|
0
|
(4,000
|
)
|
(4,174
|
)
|
(269
|
)
|
0
|
0
|
(3,801
|
)
|
4,935
|
||||||||||||||||
|
|
Q4:
2005
|
|
29,684
|
0
|
(56,292
|
)
|
(8,560
|
)
|
(145
|
)
|
0
|
0
|
(2,438
|
)
|
(37,751
|
)
|
|||||||||||||||
|
2005
|
|
58,208
|
2,192
|
(69,082
|
)
|
(18,626
|
)
|
(939
|
)
|
0
|
0
|
(7,078
|
)
|
(35,325
|
)
|
||||||||||||||||
|
|
Q1:
2006
|
2,177
|
3,966
|
0
|
(5,006
|
)
|
(159
|
)
|
0
|
0
|
(1,610
|
)
|
(632
|
)
|
|||||||||||||||||
|
|
Q2:
2006
|
0
|
0
|
(51,501
|
)
|
(998
|
)
|
(90
|
)
|
0
|
0
|
(777
|
)
|
(53,366
|
)
|
||||||||||||||||
|
|
Q3:
2006
|
(3
|
)
|
0
|
0
|
(883
|
)
|
(14
|
)
|
0
|
0
|
4,505
|
3,605
|
||||||||||||||||||
|
|
Q4:
2006
|
8,999
|
0
|
(24,007
|
)
|
(737
|
)
|
51
|
0
|
0
|
668
|
(15,026
|
)
|
||||||||||||||||||
|
2006
|
$
|
11,173
|
$
|
3,966
|
($75,508
|
)
|
($7,624
|
)
|
($212
|
)
|
$
|
0
|
$
|
0
|
$
|
2,786
|
($65,419
|
)
|
|||||||||||||
|
Table
10: Portfolio Activity (in thousands)
|
|||||||||||||||||||||||||||||||
|
Acquisitions
|
Upgrades
/ Downgrades
|
Sales
to Third Parties
|
Principal
Payments
|
Discount
/ (Premium) Amortization
|
Credit
Provision
|
Net
Charge-offs / (Recoveries)
|
Net Mark-to-Market Adjustment |
Net
Increase / (Decrease)
|
|||||||||||||||||||||||
|
CDO
CES
|
Q1:
2005
|
($71
|
)
|
$
|
430
|
$
|
0
|
$
|
35
|
$
|
48
|
$
|
0
|
$
|
0
|
($710
|
)
|
($268
|
)
|
||||||||||||
|
|
Q2:
2005
|
(119
|
)
|
0
|
0
|
0
|
0
|
0
|
0
|
100
|
(19
|
)
|
|||||||||||||||||||
|
|
Q3:
2005
|
9,970
|
0
|
0
|
42
|
36
|
0
|
0
|
(350
|
)
|
9,698
|
||||||||||||||||||||
|
|
Q4:
2005
|
(97
|
)
|
0
|
0
|
0
|
0
|
0
|
0
|
(628
|
)
|
(725
|
)
|
||||||||||||||||||
|
2005
|
9,683
|
430
|
0
|
77
|
84
|
0
|
0
|
(1,588
|
)
|
8,686
|
|||||||||||||||||||||
|
|
Q1:
2006
|
3,000
|
0
|
0
|
(44
|
)
|
0
|
0
|
0
|
48
|
3,004
|
||||||||||||||||||||
|
|
Q2:
2006
|
(87
|
)
|
0
|
0
|
(1,017
|
)
|
0
|
0
|
0
|
1,080
|
(24
|
)
|
||||||||||||||||||
|
|
Q3:
2006
|
7,714
|
0
|
(722
|
)
|
(29
|
)
|
0
|
0
|
0
|
578
|
7,541
|
|||||||||||||||||||
|
|
Q4:
2006
|
0
|
0
|
0
|
(769
|
)
|
0
|
0
|
0
|
474
|
(295
|
)
|
|||||||||||||||||||
|
2006
|
$
|
10,627
|
$
|
0
|
($722
|
)
|
($1,859
|
)
|
$
|
0
|
$
|
0
|
$
|
0
|
$
|
2,180
|
$
|
10,226
|
|||||||||||||
|
|
|||||||||||||||||||||||||||||||
|
CDO
IGS
|
Q1:
2005
|
|
$
|
23,913
|
($430
|
)
|
$
|
0
|
($227
|
)
|
($41
|
)
|
$
|
0
|
$
|
0
|
($124
|
)
|
$
|
23,091
|
|||||||||||
|
|
Q2:
2005
|
|
15,485
|
0
|
0
|
(237
|
)
|
18
|
0
|
0
|
295
|
15,561
|
|||||||||||||||||||
|
|
Q3:
2005
|
9,553
|
0
|
0
|
(11,240
|
)
|
10
|
0
|
0
|
(663
|
)
|
(2,340
|
)
|
||||||||||||||||||
|
|
Q4:
2005
|
5,900
|
0
|
0
|
(335
|
)
|
7
|
0
|
0
|
(1,269
|
)
|
4,303
|
|||||||||||||||||||
|
2005
|
54,851
|
(430
|
)
|
0
|
(12,039
|
)
|
(6
|
)
|
0
|
0
|
(1,761
|
)
|
40,615
|
||||||||||||||||||
|
|
Q1:
2006
|
13,500
|
0
|
0
|
(468
|
)
|
8
|
0
|
0
|
(148
|
)
|
12,892
|
|||||||||||||||||||
|
|
Q2:
2006
|
13,000
|
0
|
0
|
(257
|
)
|
7
|
0
|
0
|
774
|
13,524
|
||||||||||||||||||||
|
|
Q3:
2006
|
7,000
|
0
|
0
|
(235
|
)
|
5
|
0
|
0
|
1,109
|
7,879
|
||||||||||||||||||||
|
|
Q4:
2006
|
45,388
|
0
|
(5,350
|
)
|
(338
|
)
|
9
|
0
|
0
|
(302
|
)
|
39,407
|
||||||||||||||||||
|
2006
|
$
|
78,888
|
$
|
0
|
($5,350
|
)
|
($1,298
|
)
|
$
|
29
|
$
|
0
|
$
|
0
|
$
|
1,433
|
$
|
73,702
|
|||||||||||||
|
Table
11: Managed Residential Loans Credit Performance (in
thousands)
|
|||||||||||||||||||||||||||||||||||||
|
Managed
Loans
|
Internally-Designated
Credit Reserve
|
External
Credit Enhancement
|
Total
Credit Protection (1)
|
Total
Credit Protection as % of Loans
|
Seriously
Delinquent Loans
|
Seriously
Delinquent Loan % of Current Balance
|
Total
Credit Losses
|
Losses
To Securities Junior to Redwood's Interest
|
Redwood's
Share of Net Charge-offs/(Recoveries)
|
Total
Credit Losses As % of Loans (Annualized)
|
|||||||||||||||||||||||||||
|
Total
Managed
|
2004
|
$
|
166,658,801 |
$
|
363,894 |
$
|
67,650 |
$
|
431,544 |
0.26
|
% |
$
|
166,073 | 0.11 |
%
|
$
|
3,303 |
$
|
271 |
$
|
3,032 | <0.01 |
%
|
||||||||||||||
|
Resi
Portfolio
|
Q1:
2005
|
175,450,637
|
390,825
|
65,116
|
455,941
|
0.26
|
%
|
217,894
|
0.12
|
%
|
1,377
|
0
|
1,377
|
<0.01
|
%
|
||||||||||||||||||||||
|
|
Q2:
2005
|
192,291,401
|
427,139
|
139,847
|
566,986
|
0.29
|
%
|
230,538
|
0.12
|
%
|
740
|
196
|
544
|
<0.01
|
%
|
||||||||||||||||||||||
|
|
Q3:
2005
|
192,368,457
|
404,891
|
133,080
|
537,971
|
0.28
|
%
|
268,341
|
0.14
|
%
|
1,812
|
220
|
1,592
|
<0.01
|
%
|
||||||||||||||||||||||
|
|
Q4:
2005
|
190,570,193
|
377,266
|
139,129
|
516,395
|
0.27
|
%
|
349,068
|
0.18
|
%
|
1,175
|
0
|
1,175
|
<0.01
|
%
|
||||||||||||||||||||||
|
|
2005
|
190,570,193
|
377,266
|
139,129
|
516,395
|
0.27
|
%
|
349,068
|
0.18
|
%
|
5,104
|
416
|
4,688
|
<0.01
|
%
|
||||||||||||||||||||||
|
|
Q1:
2006
|
198,252,684
|
396,153
|
126,376
|
522,529
|
0.26
|
%
|
467,352
|
0.24
|
%
|
3,002
|
0
|
3,002
|
<0.01
|
%
|
||||||||||||||||||||||
|
|
Q2:
2006
|
227,928,505
|
445,028
|
126,264
|
571,292
|
0.25
|
%
|
441,430
|
0.19
|
%
|
1,464
|
0
|
1,464
|
<0.01
|
%
|
||||||||||||||||||||||
|
|
Q3:
2006
|
235,127,925
|
403,723
|
215,285
|
619,008
|
0.26
|
%
|
658,262
|
0.28
|
%
|
2,748
|
155
|
2,593
|
<0.01
|
%
|
||||||||||||||||||||||
|
|
Q4:
2006
|
219,178,838
|
392,365
|
302,072
|
694,437
|
0.32
|
%
|
850,761
|
0.39
|
%
|
5,058
|
196
|
4,862
|
<0.01
|
%
|
||||||||||||||||||||||
|
|
2006
|
$
|
219,178,838
|
$
|
392,365
|
$
|
302,072
|
$
|
694,437
|
0.32
|
%
|
$
|
850,761
|
0.39
|
%
|
$
|
12,272
|
$
|
351
|
$
|
11,921
|
<0.01
|
%
|
||||||||||||||
|
|
|||||||||||||||||||||||||||||||||||||
|
Residential
Real
|
2004
|
$
|
22,312,842
|
$
|
23,771
|
$
|
0
|
$
|
23,771
|
0.11
|
%
|
$
|
13,338
|
0.06
|
%
|
$
|
176
|
$
|
0
|
$
|
176
|
<0.01
|
%
|
||||||||||||||
|
Estate
Loans
|
Q1:
2005
|
21,579,671
|
24,827
|
0
|
24,827
|
0.12
|
%
|
16,066
|
0.07
|
%
|
154
|
0
|
154
|
<0.01
|
%
|
||||||||||||||||||||||
|
|
Q2:
2005
|
19,443,387
|
22,959
|
0
|
22,959
|
0.12
|
%
|
16,514
|
0.08
|
%
|
(34
|
)
|
0
|
(34
|
)
|
0.00
|
%
|
||||||||||||||||||||
|
|
Q3:
2005
|
16,386,833
|
22,029
|
0
|
22,029
|
0.13
|
%
|
22,956
|
0.14
|
%
|
90
|
0
|
90
|
<0.01
|
%
|
||||||||||||||||||||||
|
|
Q4:
2005
|
13,719,242
|
22,656
|
0
|
22,656
|
0.17
|
%
|
37,335
|
0.27
|
%
|
251
|
0
|
251
|
<0.01
|
%
|
||||||||||||||||||||||
|
|
2005
|
13,719,242
|
22,656
|
0
|
22,656
|
0.17
|
%
|
37,335
|
0.27
|
%
|
461
|
0
|
461
|
<0.01
|
%
|
||||||||||||||||||||||
|
|
Q1:
2006
|
11,846,454
|
22,372
|
0
|
22,372
|
0.19
|
%
|
48,677
|
0.41
|
%
|
425
|
0
|
425
|
<0.01
|
%
|
||||||||||||||||||||||
|
|
Q2:
2006
|
10,318,641
|
19,450
|
0
|
19,450
|
0.19
|
%
|
47,162
|
0.46
|
%
|
423
|
0
|
423
|
0.02
|
%
|
||||||||||||||||||||||
|
|
Q3:
2006
|
9,718,985
|
19,326
|
0
|
19,326
|
0.20
|
%
|
61,447
|
0.63
|
%
|
589
|
0
|
589
|
0.02
|
%
|
||||||||||||||||||||||
|
|
Q4:
2006
|
9,212,002
|
20,119
|
0
|
20,119
|
0.22
|
%
|
73,087
|
0.79
|
%
|
711
|
0
|
711
|
0.03
|
%
|
||||||||||||||||||||||
|
|
2006
|
$
|
9,212,002
|
$
|
20,119
|
$
|
0
|
$
|
20,119
|
0.22
|
%
|
$
|
73,087
|
0.79
|
%
|
$
|
2,148
|
$
|
0
|
$
|
2,148
|
0.02
|
%
|
||||||||||||||
|
|
|||||||||||||||||||||||||||||||||||||
|
Residential
CES
|
2004
|
$
|
144,345,959
|
$
|
340,123
|
$
|
67,650
|
$
|
407,773
|
0.28
|
%
|
$
|
152,735
|
0.12
|
%
|
$
|
3,127
|
$
|
271
|
$
|
2,856
|
<0.01
|
%
|
||||||||||||||
|
|
Q1:
2005
|
153,870,966
|
365,998
|
65,116
|
431,114
|
0.28
|
%
|
201,828
|
0.13
|
%
|
1,223
|
0
|
1,223
|
<0.01
|
%
|
||||||||||||||||||||||
|
|
Q2:
2005
|
172,848,014
|
404,180
|
139,847
|
544,027
|
0.31
|
%
|
214,024
|
0.12
|
%
|
774
|
196
|
578
|
<0.01
|
%
|
||||||||||||||||||||||
|
|
Q3:
2005
|
175,981,624
|
382,862
|
133,080
|
515,942
|
0.29
|
%
|
245,385
|
0.14
|
%
|
1,722
|
220
|
1,502
|
<0.01
|
%
|
||||||||||||||||||||||
|
|
Q4:
2005
|
176,850,951
|
354,610
|
139,129
|
493,739
|
0.28
|
%
|
311,733
|
0.18
|
%
|
924
|
0
|
924
|
<0.01
|
%
|
||||||||||||||||||||||
|
|
2005
|
176,850,951
|
354,610
|
139,129
|
493,739
|
0.28
|
%
|
311,733
|
0.18
|
%
|
4,643
|
416
|
4,227
|
<0.01
|
%
|
||||||||||||||||||||||
|
|
Q1:
2006
|
186,406,230
|
373,781
|
126,376
|
500,157
|
0.27
|
%
|
418,675
|
0.22
|
%
|
2,577
|
0
|
2,577
|
<0.01
|
%
|
||||||||||||||||||||||
|
|
Q2:
2006
|
217,609,864
|
425,578
|
126,264
|
551,842
|
0.25
|
%
|
394,268
|
0.18
|
%
|
1,041
|
0
|
1,041
|
<0.01
|
%
|
||||||||||||||||||||||
|
|
Q3:
2006
|
225,408,940
|
384,397
|
215,285
|
599,682
|
0.27
|
%
|
596,815
|
0.26
|
%
|
2,159
|
155
|
2,004
|
<0.01
|
%
|
||||||||||||||||||||||
|
|
Q4:
2006
|
209,966,836
|
372,246
|
302,072
|
674,318
|
0.32
|
%
|
777,675
|
0.37
|
%
|
4,347
|
196
|
4,151
|
<0.01
|
%
|
||||||||||||||||||||||
|
|
2006
|
$
|
209,966,836
|
$
|
372,246
|
$
|
302,072
|
$
|
674,318
|
0.32
|
%
|
$
|
777,675
|
0.37
|
%
|
$
|
10,124
|
$
|
351
|
$
|
9,773
|
<0.01
|
%
|
||||||||||||||
|
Table
12: Residential CES and Underlying Loan Characteristics (all $
in
thousands)
|
||||||||||||||||||||||||||||
|
Q4:2006
|
|
Q3:2006
|
|
Q2:2006
|
|
Q1:2006
|
|
Q4:2005
|
|
Q3:2005
|
|
Q2:2005
|
|
Q1:2005
|
|
Q4:2004
|
||||||||||||
|
First
loss position, principal value
|
$
|
519,423
|
$
|
521,955
|
$
|
543,789
|
$
|
487,935
|
$
|
471,079
|
$
|
433,557
|
$
|
425,081
|
$
|
379,145
|
$
|
352,752
|
||||||||||
|
Second
loss position, principal value
|
190,802
|
189,978
|
216,806
|
172,345
|
164,426
|
224,987
|
298,821
|
260,855
|
276,720
|
|||||||||||||||||||
|
Third
loss position, principal value
|
470,380
|
471,223
|
408,007
|
373,789
|
378,288
|
371,242
|
355,420
|
312,925
|
304,300
|
|||||||||||||||||||
|
Total
principal value
|
$
|
1,180,605
|
$
|
1,183,156
|
$
|
1,168,602
|
$
|
1,034,069
|
$
|
1,013,793
|
$
|
1,029,786
|
$
|
1,079,322
|
$
|
952,925
|
$
|
933,772
|
||||||||||
|
First
loss position, reported value
|
$
|
171,204
|
$
|
170,417
|
$
|
173,261
|
$
|
154,756
|
$
|
154,930
|
$
|
152,470
|
$
|
150,622
|
$
|
130,194
|
$
|
110,933
|
||||||||||
|
Second
loss position, reported value
|
141,697
|
139,180
|
155,531
|
121,951
|
115,060
|
165,402
|
222,282
|
188,310
|
195,536
|
|||||||||||||||||||
|
Third
loss position, reported value
|
408,630
|
406,071
|
348,384
|
318,732
|
322,562
|
325,835
|
310,905
|
269,257
|
255,189
|
|||||||||||||||||||
|
Total
reported value
|
$
|
721,531
|
$
|
715,668
|
$
|
677,176
|
$
|
595,439
|
$
|
592,552
|
$
|
643,707
|
$
|
683,809
|
$
|
587,761
|
$
|
561,658
|
||||||||||
|
Internal
designated credit reserves
|
$
|
372,246
|
$
|
384,397
|
$
|
425,578
|
$
|
373,781
|
$
|
354,610
|
$
|
382,862
|
$
|
404,180
|
$
|
365,998
|
$
|
340,123
|
||||||||||
|
External
credit enhancement
|
302,072
|
215,285
|
126,264
|
126,376
|
139,129
|
133,080
|
139,847
|
65,116
|
67,650
|
|||||||||||||||||||
|
Total
credit protection
|
$
|
674,318
|
$
|
599,682
|
$
|
551,842
|
$
|
500,157
|
$
|
493,739
|
$
|
515,942
|
$
|
544,027
|
$
|
431,114
|
$
|
407,773
|
||||||||||
|
As
%
of total portfolio
|
0.32
|
%
|
0.27
|
%
|
0.25
|
%
|
0.27
|
%
|
0.28
|
%
|
0.29
|
%
|
0.31
|
%
|
0.28
|
%
|
0.32
|
%
|
||||||||||
|
Underlying
residential real estate loans
|
$
|
209,966,836
|
$
|
225,408,940
|
$
|
217,609,864
|
$
|
186,406,230
|
$
|
176,850,951
|
$
|
175,981,624
|
$
|
172,848,014
|
$
|
153,870,966
|
$
|
144,345,959
|
||||||||||
|
Number
of credit-enhanced loans
|
633,993
|
665,412
|
620,257
|
558,254
|
519,720
|
507,621
|
549,733
|
406,547
|
378,861
|
|||||||||||||||||||
|
Average
loan size
|
$
|
331
|
$
|
339
|
$
|
351
|
$
|
334
|
$
|
340
|
$
|
347
|
$
|
314
|
$
|
378
|
$
|
381
|
||||||||||
|
Adjustable
%
|
23
|
%
|
29
|
%
|
31
|
%
|
25
|
%
|
29
|
%
|
25
|
%
|
26
|
%
|
26
|
%
|
26
|
%
|
||||||||||
|
Hybrid
%
|
39
|
%
|
36
|
%
|
35
|
%
|
36
|
%
|
32
|
%
|
32
|
%
|
29
|
%
|
28
|
%
|
28
|
%
|
||||||||||
|
Fixed
%
|
38
|
%
|
35
|
%
|
34
|
%
|
39
|
%
|
39
|
%
|
43
|
%
|
45
|
%
|
46
|
%
|
46
|
%
|
||||||||||
|
Amortizing
%
|
57
|
%
|
51
|
%
|
49
|
%
|
57
|
%
|
52
|
%
|
57
|
%
|
58
|
%
|
59
|
%
|
59
|
%
|
||||||||||
|
Interest-only
%
|
24
|
%
|
23
|
%
|
23
|
%
|
23
|
%
|
24
|
%
|
24
|
%
|
23
|
%
|
24
|
%
|
24
|
%
|
||||||||||
|
Negatively
amortizing %
|
19
|
%
|
26
|
%
|
28
|
%
|
20
|
%
|
24
|
%
|
18
|
%
|
18
|
%
|
18
|
%
|
17
|
%
|
||||||||||
|
Southern
California
|
25
|
%
|
25
|
%
|
26
|
%
|
27
|
%
|
25
|
%
|
24
|
%
|
24
|
%
|
23
|
%
|
22
|
%
|
||||||||||
|
Northern
California
|
22
|
%
|
22
|
%
|
22
|
%
|
24
|
%
|
21
|
%
|
20
|
%
|
20
|
%
|
20
|
%
|
19
|
%
|
||||||||||
|
Florida
|
6
|
%
|
6
|
%
|
6
|
%
|
5
|
%
|
6
|
%
|
5
|
%
|
5
|
%
|
5
|
%
|
6
|
%
|
||||||||||
|
New
York
|
5
|
%
|
5
|
%
|
5
|
%
|
5
|
%
|
5
|
%
|
5
|
%
|
5
|
%
|
5
|
%
|
5
|
%
|
||||||||||
|
Virginia
|
4
|
%
|
4
|
%
|
4
|
%
|
4
|
%
|
4
|
%
|
4
|
%
|
4
|
%
|
4
|
%
|
4
|
%
|
||||||||||
|
New
Jersey
|
3
|
%
|
3
|
%
|
3
|
%
|
3
|
%
|
3
|
%
|
4
|
%
|
4
|
%
|
4
|
%
|
4
|
%
|
||||||||||
|
Texas
|
3
|
%
|
3
|
%
|
2
|
%
|
3
|
%
|
3
|
%
|
3
|
%
|
3
|
%
|
3
|
%
|
3
|
%
|
||||||||||
|
Illinois
|
3
|
%
|
3
|
%
|
3
|
%
|
3
|
%
|
3
|
%
|
3
|
%
|
3
|
%
|
3
|
%
|
3
|
%
|
||||||||||
|
Other
states (none greater than 3%)
|
29
|
%
|
29
|
%
|
29
|
%
|
28
|
%
|
31
|
%
|
32
|
%
|
32
|
%
|
32
|
%
|
34
|
%
|
||||||||||
|
Table
12: Residential CES and Underlying Loan Characteristics (all
$ in
thousands)
|
||||||||||||||||||||||||||||
|
Q4:2006
|
Q3:2006
|
|
Q2:2006
|
|
Q1:2006
|
|
Q4:2005
|
|
Q3:2005
|
|
Q2:2005
|
|
Q1:2005
|
|
Q4:2004
|
|||||||||||||
|
Year
2006 origination
|
13
|
%
|
15
|
%
|
10
|
%
|
1
|
%
|
0
|
%
|
0
|
%
|
0
|
%
|
0
|
%
|
0
|
%
|
||||||||||
|
Year
2005 origination
|
28
|
%
|
28
|
%
|
31
|
%
|
32
|
%
|
24
|
%
|
15
|
%
|
14
|
%
|
6
|
%
|
0
|
%
|
||||||||||
|
Year
2004 origination
|
23
|
%
|
23
|
%
|
26
|
%
|
29
|
%
|
34
|
%
|
41
|
%
|
50
|
%
|
54
|
%
|
55
|
%
|
||||||||||
|
Year
2003 origination
|
26
|
%
|
24
|
%
|
25
|
%
|
30
|
%
|
33
|
%
|
35
|
%
|
26
|
%
|
29
|
%
|
32
|
%
|
||||||||||
|
Year
2002 origination
|
5
|
%
|
5
|
%
|
5
|
%
|
4
|
%
|
6
|
%
|
6
|
%
|
5
|
%
|
6
|
%
|
7
|
%
|
||||||||||
|
Year
2001 origination or earlier
|
5
|
%
|
5
|
%
|
3
|
%
|
4
|
%
|
3
|
%
|
3
|
%
|
5
|
%
|
5
|
%
|
6
|
%
|
||||||||||
|
Wtg
Avg Original LTV
|
69
|
%
|
69
|
%
|
69
|
%
|
68
|
%
|
68
|
%
|
68
|
%
|
68
|
%
|
68
|
%
|
67
|
%
|
||||||||||
|
Original
LTV: 0% - 20%
|
1
|
%
|
1
|
%
|
1
|
%
|
1
|
%
|
1
|
%
|
1
|
%
|
0
|
%
|
0
|
%
|
0
|
%
|
||||||||||
|
Original
LTV: 20% - 30%
|
2
|
%
|
1
|
%
|
1
|
%
|
2
|
%
|
2
|
%
|
2
|
%
|
2
|
%
|
1
|
%
|
2
|
%
|
||||||||||
|
Original
LTV: 30% - 40%
|
3
|
%
|
3
|
%
|
3
|
%
|
4
|
%
|
4
|
%
|
4
|
%
|
4
|
%
|
3
|
%
|
4
|
%
|
||||||||||
|
Original
LTV: 40% - 50%
|
7
|
%
|
7
|
%
|
7
|
%
|
7
|
%
|
7
|
%
|
8
|
%
|
8
|
%
|
7
|
%
|
8
|
%
|
||||||||||
|
Original
LTV: 50% - 60%
|
11
|
%
|
11
|
%
|
11
|
%
|
11
|
%
|
12
|
%
|
12
|
%
|
12
|
%
|
12
|
%
|
12
|
%
|
||||||||||
|
Original
LTV: 60% - 70%
|
21
|
%
|
21
|
%
|
22
|
%
|
21
|
%
|
22
|
%
|
22
|
%
|
22
|
%
|
23
|
%
|
23
|
%
|
||||||||||
|
Original
LTV: 70% - 75%
|
14
|
%
|
15
|
%
|
15
|
%
|
15
|
%
|
15
|
%
|
15
|
%
|
15
|
%
|
15
|
%
|
15
|
%
|
||||||||||
|
Original
LTV: 75% - 80%
|
36
|
%
|
36
|
%
|
35
|
%
|
35
|
%
|
34
|
%
|
34
|
%
|
33
|
%
|
34
|
%
|
33
|
%
|
||||||||||
|
Original
LTV: 80% - 90%
|
3
|
%
|
3
|
%
|
3
|
%
|
3
|
%
|
2
|
%
|
2
|
%
|
3
|
%
|
2
|
%
|
2
|
%
|
||||||||||
|
Original
LTV: 90% - 100%
|
2
|
%
|
2
|
%
|
2
|
%
|
1
|
%
|
1
|
%
|
1
|
%
|
1
|
%
|
1
|
%
|
1
|
%
|
||||||||||
|
Wtg
Avg FICO
|
730
|
729
|
731
|
732
|
732
|
732
|
731
|
731
|
730
|
|||||||||||||||||||
|
FICO:
<= 600
|
1
|
%
|
1
|
%
|
1
|
%
|
1
|
%
|
0
|
%
|
0
|
%
|
0
|
%
|
0
|
%
|
0
|
%
|
||||||||||
|
FICO:
601 -620
|
1
|
%
|
1
|
%
|
1
|
%
|
1
|
%
|
1
|
%
|
0
|
%
|
0
|
%
|
0
|
%
|
0
|
%
|
||||||||||
|
FICO:
621 - 640
|
2
|
%
|
2
|
%
|
2
|
%
|
2
|
%
|
2
|
%
|
2
|
%
|
2
|
%
|
2
|
%
|
2
|
%
|
||||||||||
|
FICO:
641 -660
|
4
|
%
|
4
|
%
|
4
|
%
|
4
|
%
|
4
|
%
|
4
|
%
|
4
|
%
|
4
|
%
|
4
|
%
|
||||||||||
|
FICO:
661 - 680
|
7
|
%
|
7
|
%
|
7
|
%
|
7
|
%
|
7
|
%
|
7
|
%
|
7
|
%
|
7
|
%
|
7
|
%
|
||||||||||
|
FICO:
681 - 700
|
10
|
%
|
11
|
%
|
11
|
%
|
10
|
%
|
11
|
%
|
11
|
%
|
11
|
%
|
11
|
%
|
11
|
%
|
||||||||||
|
FICO:
701 - 720
|
12
|
%
|
13
|
%
|
13
|
%
|
12
|
%
|
13
|
%
|
13
|
%
|
13
|
%
|
13
|
%
|
13
|
%
|
||||||||||
|
FICO:
721 - 740
|
13
|
%
|
13
|
%
|
13
|
%
|
13
|
%
|
13
|
%
|
14
|
%
|
14
|
%
|
14
|
%
|
14
|
%
|
||||||||||
|
FICO:
741 - 760
|
14
|
%
|
14
|
%
|
14
|
%
|
15
|
%
|
15
|
%
|
15
|
%
|
15
|
%
|
16
|
%
|
16
|
%
|
||||||||||
|
FICO:
761 - 780
|
16
|
%
|
16
|
%
|
16
|
%
|
17
|
%
|
17
|
%
|
17
|
%
|
17
|
%
|
17
|
%
|
17
|
%
|
||||||||||
|
FICO:
781 - 800
|
12
|
%
|
12
|
%
|
12
|
%
|
12
|
%
|
12
|
%
|
12
|
%
|
12
|
%
|
11
|
%
|
11
|
%
|
||||||||||
|
FICO:
>= 801
|
4
|
%
|
4
|
%
|
4
|
%
|
4
|
%
|
3
|
%
|
3
|
%
|
3
|
%
|
2
|
%
|
2
|
%
|
||||||||||
|
Unknown
|
4
|
%
|
2
|
%
|
3
|
%
|
3
|
%
|
1
|
%
|
2
|
%
|
2
|
%
|
2
|
%
|
2
|
%
|
||||||||||
|
Conforming
balance at origination %
|
37
|
%
|
37
|
%
|
35
|
%
|
37
|
%
|
25
|
%
|
23
|
%
|
22
|
%
|
20
|
%
|
17
|
%
|
||||||||||
|
%
balance in loans > $1mm per loan
|
8
|
%
|
9
|
%
|
9
|
%
|
7
|
%
|
8
|
%
|
6
|
%
|
6
|
%
|
6
|
%
|
5
|
%
|
||||||||||
|
2nd
home %
|
6
|
%
|
6
|
%
|
6
|
%
|
6
|
%
|
6
|
%
|
6
|
%
|
5
|
%
|
5
|
%
|
5
|
%
|
||||||||||
|
Investment
home %
|
3
|
%
|
3
|
%
|
3
|
%
|
2
|
%
|
3
|
%
|
2
|
%
|
3
|
%
|
2
|
%
|
2
|
%
|
||||||||||
|
Purchase
|
40
|
%
|
39
|
%
|
38
|
%
|
38
|
%
|
36
|
%
|
36
|
%
|
35
|
%
|
36
|
%
|
34
|
%
|
||||||||||
|
Cash
out refinance
|
29
|
%
|
30
|
%
|
31
|
%
|
29
|
%
|
29
|
%
|
27
|
%
|
26
|
%
|
26
|
%
|
26
|
%
|
||||||||||
|
Rate-term
refinance
|
30
|
%
|
30
|
%
|
30
|
%
|
32
|
%
|
34
|
%
|
36
|
%
|
38
|
%
|
38
|
%
|
40
|
%
|
||||||||||
|
Construction
|
0
|
%
|
0
|
%
|
0
|
%
|
0
|
%
|
0
|
%
|
0
|
%
|
0
|
%
|
0
|
%
|
0
|
%
|
||||||||||
|
Other
|
1
|
%
|
1
|
%
|
1
|
%
|
1
|
%
|
1
|
%
|
1
|
%
|
1
|
%
|
0
|
%
|
0
|
%
|
||||||||||
|
Table
13: Residential Real Estate Loan Characteristics (all $ in
thousands)
|
||||||||||||||||||||||||||||
|
Q4:2006
|
|
Q3:2006
|
|
Q2:2006
|
|
Q1:2006
|
|
Q4:2005
|
|
Q3:2005
|
|
Q2:2005
|
|
Q1:2005
|
|
Q4:2004
|
||||||||||||
|
Residential
Loans
|
$
|
9,212,002
|
$
|
9,718,985
|
$
|
10,318,641
|
$
|
11,846,454
|
$
|
13,719,242
|
$
|
16,386,833
|
$
|
19,443,387
|
$
|
21,579,671
|
$
|
22,312,842
|
||||||||||
|
Number
of loans
|
27,695
|
31,744
|
34,013
|
37,458
|
33,863
|
51,593
|
58,941
|
62,060
|
64,066
|
|||||||||||||||||||
|
Average
loan size
|
$
|
333
|
$
|
306
|
$
|
303
|
$
|
316
|
$
|
405
|
$
|
318
|
$
|
330
|
$
|
348
|
$
|
348
|
||||||||||
|
Adjustable
%
|
85
|
%
|
89
|
%
|
99
|
%
|
99
|
%
|
98
|
%
|
100
|
%
|
100
|
%
|
100
|
%
|
100
|
%
|
||||||||||
|
Hybrid
%
|
15
|
%
|
11
|
%
|
1
|
%
|
1
|
%
|
2
|
%
|
0
|
%
|
0
|
%
|
0
|
%
|
0
|
%
|
||||||||||
|
Fixed
%
|
0
|
%
|
0
|
%
|
0
|
%
|
0
|
%
|
0
|
%
|
0
|
%
|
0
|
%
|
0
|
%
|
0
|
%
|
||||||||||
|
Amortizing
%
|
3
|
%
|
3
|
%
|
1
|
%
|
1
|
%
|
1
|
%
|
0
|
%
|
0
|
%
|
0
|
%
|
0
|
%
|
||||||||||
|
Interest-only
%
|
97
|
%
|
97
|
%
|
99
|
%
|
99
|
%
|
99
|
%
|
100
|
%
|
100
|
%
|
100
|
%
|
100
|
%
|
||||||||||
|
Negatively
amortizing %
|
0
|
%
|
0
|
%
|
0
|
%
|
0
|
%
|
0
|
%
|
0
|
%
|
0
|
%
|
0
|
%
|
0
|
%
|
||||||||||
|
Southern
California
|
13
|
%
|
12
|
%
|
11
|
%
|
11
|
%
|
11
|
%
|
11
|
%
|
12
|
%
|
12
|
%
|
13
|
%
|
||||||||||
|
Northern
California
|
10
|
%
|
10
|
%
|
10
|
%
|
10
|
%
|
12
|
%
|
11
|
%
|
12
|
%
|
12
|
%
|
13
|
%
|
||||||||||
|
Florida
|
12
|
%
|
12
|
%
|
13
|
%
|
12
|
%
|
13
|
%
|
12
|
%
|
11
|
%
|
11
|
%
|
11
|
%
|
||||||||||
|
New
York
|
6
|
%
|
6
|
%
|
6
|
%
|
6
|
%
|
5
|
%
|
5
|
%
|
5
|
%
|
5
|
%
|
5
|
%
|
||||||||||
|
Georgia
|
5
|
%
|
5
|
%
|
5
|
%
|
5
|
%
|
5
|
%
|
5
|
%
|
5
|
%
|
5
|
%
|
5
|
%
|
||||||||||
|
New
Jersey
|
4
|
%
|
4
|
%
|
4
|
%
|
4
|
%
|
4
|
%
|
4
|
%
|
4
|
%
|
4
|
%
|
4
|
%
|
||||||||||
|
Texas
|
5
|
%
|
5
|
%
|
5
|
%
|
5
|
%
|
4
|
%
|
4
|
%
|
4
|
%
|
4
|
%
|
4
|
%
|
||||||||||
|
Arizona
|
4
|
%
|
4
|
%
|
4
|
%
|
4
|
%
|
4
|
%
|
4
|
%
|
4
|
%
|
4
|
%
|
4
|
%
|
||||||||||
|
Illinois
|
3
|
%
|
3
|
%
|
2
|
%
|
2
|
%
|
2
|
%
|
3
|
%
|
3
|
%
|
3
|
%
|
3
|
%
|
||||||||||
|
Colorado
|
4
|
%
|
4
|
%
|
4
|
%
|
4
|
%
|
4
|
%
|
4
|
%
|
4
|
%
|
4
|
%
|
4
|
%
|
||||||||||
|
Virginia
|
3
|
%
|
3
|
%
|
3
|
%
|
3
|
%
|
3
|
%
|
3
|
%
|
3
|
%
|
3
|
%
|
3
|
%
|
||||||||||
|
Other
states (none greater than 3%)
|
31
|
%
|
32
|
%
|
33
|
%
|
34
|
%
|
33
|
%
|
34
|
%
|
33
|
%
|
33
|
%
|
31
|
%
|
||||||||||
|
Year
2006 origination
|
17
|
%
|
10
|
%
|
0
|
%
|
0
|
%
|
0
|
%
|
0
|
%
|
0
|
%
|
0
|
%
|
0
|
%
|
||||||||||
|
Year
2005 origination
|
5
|
%
|
5
|
%
|
5
|
%
|
5
|
%
|
6
|
%
|
5
|
%
|
4
|
%
|
3
|
%
|
0
|
%
|
||||||||||
|
Year
2004 origination
|
30
|
%
|
32
|
%
|
36
|
%
|
36
|
%
|
45
|
%
|
37
|
%
|
37
|
%
|
38
|
%
|
38
|
%
|
||||||||||
|
Year
2003 origination
|
32
|
%
|
35
|
%
|
40
|
%
|
40
|
%
|
27
|
%
|
39
|
%
|
40
|
%
|
40
|
%
|
42
|
%
|
||||||||||
|
Year
2002 origination
|
12
|
%
|
13
|
%
|
15
|
%
|
15
|
%
|
18
|
%
|
15
|
%
|
15
|
%
|
16
|
%
|
16
|
%
|
||||||||||
|
Year
2001 origination or earlier
|
4
|
%
|
5
|
%
|
4
|
%
|
4
|
%
|
4
|
%
|
4
|
%
|
4
|
%
|
3
|
%
|
4
|
%
|
||||||||||
|
Wtg
Avg Original LTV
|
68
|
%
|
68
|
%
|
68
|
%
|
68
|
%
|
69
|
%
|
68
|
%
|
69
|
%
|
68
|
%
|
68
|
%
|
||||||||||
|
Original
LTV: 0% - 20%
|
1
|
%
|
1
|
%
|
1
|
%
|
1
|
%
|
1
|
%
|
1
|
%
|
1
|
%
|
1
|
%
|
1
|
%
|
||||||||||
|
Original
LTV: 20% - 30%
|
2
|
%
|
2
|
%
|
2
|
%
|
2
|
%
|
2
|
%
|
2
|
%
|
2
|
%
|
2
|
%
|
2
|
%
|
||||||||||
|
Original
LTV: 30% - 40%
|
4
|
%
|
4
|
%
|
4
|
%
|
4
|
%
|
4
|
%
|
4
|
%
|
4
|
%
|
4
|
%
|
4
|
%
|
||||||||||
|
Original
LTV: 40% - 50%
|
8
|
%
|
8
|
%
|
8
|
%
|
8
|
%
|
7
|
%
|
7
|
%
|
7
|
%
|
7
|
%
|
7
|
%
|
||||||||||
|
Original
LTV: 50% - 60%
|
12
|
%
|
12
|
%
|
12
|
%
|
12
|
%
|
11
|
%
|
11
|
%
|
11
|
%
|
11
|
%
|
12
|
%
|
||||||||||
|
Original
LTV: 60% - 70%
|
20
|
%
|
20
|
%
|
21
|
%
|
21
|
%
|
21
|
%
|
20
|
%
|
20
|
%
|
20
|
%
|
21
|
%
|
||||||||||
|
Original
LTV: 70% - 75%
|
13
|
%
|
14
|
%
|
14
|
%
|
14
|
%
|
14
|
%
|
14
|
%
|
14
|
%
|
15
|
%
|
15
|
%
|
||||||||||
|
Original
LTV: 75% - 80%
|
32
|
%
|
32
|
%
|
31
|
%
|
31
|
%
|
34
|
%
|
32
|
%
|
32
|
%
|
32
|
%
|
31
|
%
|
||||||||||
|
Original
LTV: 80% - 90%
|
2
|
%
|
2
|
%
|
2
|
%
|
2
|
%
|
2
|
%
|
2
|
%
|
2
|
%
|
2
|
%
|
2
|
%
|
||||||||||
|
Original
LTV: 90% - 100%
|
6
|
%
|
5
|
%
|
5
|
%
|
5
|
%
|
4
|
%
|
7
|
%
|
7
|
%
|
6
|
%
|
5
|
%
|
||||||||||
|
Wtg
Avg FICO
|
733
|
730
|
730
|
730
|
731
|
731
|
731
|
731
|
731
|
|||||||||||||||||||
|
FICO:
<= 600
|
1
|
%
|
1
|
%
|
1
|
%
|
1
|
%
|
1
|
%
|
1
|
%
|
1
|
%
|
1
|
%
|
1
|
%
|
||||||||||
|
FICO:
601 -620
|
1
|
%
|
1
|
%
|
1
|
%
|
1
|
%
|
1
|
%
|
1
|
%
|
1
|
%
|
1
|
%
|
1
|
%
|
||||||||||
|
FICO:
621 - 640
|
1
|
%
|
1
|
%
|
1
|
%
|
2
|
%
|
1
|
%
|
1
|
%
|
1
|
%
|
1
|
%
|
1
|
%
|
||||||||||
|
FICO:
641 -660
|
3
|
%
|
3
|
%
|
3
|
%
|
3
|
%
|
3
|
%
|
3
|
%
|
3
|
%
|
3
|
%
|
3
|
%
|
||||||||||
|
FICO:
661 - 680
|
8
|
%
|
8
|
%
|
8
|
%
|
8
|
%
|
8
|
%
|
8
|
%
|
8
|
%
|
8
|
%
|
8
|
%
|
||||||||||
|
FICO:
681 - 700
|
12
|
%
|
12
|
%
|
12
|
%
|
12
|
%
|
12
|
%
|
12
|
%
|
12
|
%
|
12
|
%
|
12
|
%
|
||||||||||
|
FICO:
701 - 720
|
14
|
%
|
14
|
%
|
14
|
%
|
14
|
%
|
15
|
%
|
14
|
%
|
14
|
%
|
14
|
%
|
14
|
%
|
||||||||||
|
FICO:
721 - 740
|
13
|
%
|
14
|
%
|
13
|
%
|
13
|
%
|
13
|
%
|
14
|
%
|
14
|
%
|
14
|
%
|
14
|
%
|
||||||||||
|
FICO:
741 - 760
|
15
|
%
|
15
|
%
|
15
|
%
|
15
|
%
|
15
|
%
|
15
|
%
|
15
|
%
|
16
|
%
|
16
|
%
|
||||||||||
|
FICO:
761 - 780
|
17
|
%
|
17
|
%
|
17
|
%
|
17
|
%
|
17
|
%
|
17
|
%
|
17
|
%
|
17
|
%
|
17
|
%
|
||||||||||
|
FICO:
781 - 800
|
12
|
%
|
12
|
%
|
12
|
%
|
11
|
%
|
11
|
%
|
11
|
%
|
11
|
%
|
11
|
%
|
11
|
%
|
||||||||||
|
FICO:
>= 801
|
3
|
%
|
2
|
%
|
3
|
%
|
3
|
%
|
3
|
%
|
3
|
%
|
3
|
%
|
2
|
%
|
2
|
%
|
||||||||||
|
Conforming
balance at origination %
|
38
|
%
|
41
|
%
|
45
|
%
|
37
|
%
|
38
|
%
|
37
|
%
|
37
|
%
|
36
|
%
|
36
|
%
|
||||||||||
|
%
balance in loans > $1mm per loan
|
18
|
%
|
14
|
%
|
14
|
%
|
14
|
%
|
13
|
%
|
14
|
%
|
13
|
%
|
13
|
%
|
14
|
%
|
||||||||||
|
2nd
home %
|
11
|
%
|
11
|
%
|
11
|
%
|
11
|
%
|
10
|
%
|
10
|
%
|
10
|
%
|
10
|
%
|
10
|
%
|
||||||||||
|
Investment
home %
|
3
|
%
|
3
|
%
|
3
|
%
|
3
|
%
|
2
|
%
|
2
|
%
|
2
|
%
|
2
|
%
|
2
|
%
|
||||||||||
|
Purchase
|
34
|
%
|
34
|
%
|
33
|
%
|
33
|
%
|
33
|
%
|
33
|
%
|
33
|
%
|
34
|
%
|
34
|
%
|
||||||||||
|
Cash
out refinance
|
32
|
%
|
32
|
%
|
32
|
%
|
34
|
%
|
34
|
%
|
34
|
%
|
34
|
%
|
34
|
%
|
34
|
%
|
||||||||||
|
Rate-term
refinance
|
32
|
%
|
32
|
%
|
34
|
%
|
32
|
%
|
32
|
%
|
32
|
%
|
32
|
%
|
31
|
%
|
31
|
%
|
||||||||||
|
Construction
|
0
|
%
|
0
|
%
|
0
|
%
|
0
|
%
|
0
|
%
|
0
|
%
|
0
|
%
|
0
|
%
|
0
|
%
|
||||||||||
|
Other
|
2
|
%
|
2
|
%
|
1
|
%
|
1
|
%
|
1
|
%
|
1
|
%
|
1
|
%
|
1
|
%
|
1
|
%
|
||||||||||
|
Table
14: Commercial Real Estate Loans Credit Performance (al6l $
in
thousands)
|
|||||||||||||||||||||||||||||||||||||
|
|
|||||||||||||||||||||||||||||||||||||
|
Managed
Loans
|
Internally-Designated
Credit Reserve
|
External
Credit Enhancement
|
Total
Credit Protection (1)
|
Total
Credit Protection as % of Loans
|
Seriously
Delinquent Loans
|
Seriously
Delinquent Loan % of Current Balance
|
Total
Credit Losses
|
Third
Parties' Share of Net Charge-offs/ (Recoveries)
|
Redwood's
Share of Net Charge-offs/ (Recoveries)
|
Total
Credit Losses As % of Loans (Annualized)
|
|||||||||||||||||||||||||||
|
Total
Managed Commercial
Portfolio
|
2004
|
$
|
20,952,491
|
$
|
54,280
|
$
|
557,842
|
$
|
612,122
|
2.92
|
%
|
$
|
0
|
1.39
|
%
|
$
|
176
|
$
|
0
|
$
|
176
|
0.00
|
%
|
||||||||||||||
|
Q1:
2005
|
27,830,707
|
97,127
|
557,480
|
654,607
|
2.35
|
%
|
15,305
|
0.05
|
%
|
315
|
-
|
315
|
0.00
|
%
|
|||||||||||||||||||||||
|
Q2:
2005
|
31,324,563
|
95,351
|
681,133
|
776,484
|
2.48
|
%
|
35,971
|
0.11
|
%
|
1,213
|
1,213
|
-
|
0.02
|
%
|
|||||||||||||||||||||||
|
Q3:
2005
|
40,081,879
|
146,671
|
706,532
|
853,203
|
2.13
|
%
|
20,690
|
0.05
|
%
|
59
|
59
|
-
|
0.00
|
%
|
|||||||||||||||||||||||
|
Q4:
2005
|
46,825,453
|
149,947
|
714,168
|
864,115
|
1.85
|
%
|
40,916
|
0.09
|
%
|
-
|
-
|
-
|
0.00
|
%
|
|||||||||||||||||||||||
|
2005
|
46,825,453
|
149,947
|
714,168
|
864,115
|
1.85
|
%
|
40,916
|
0.09
|
%
|
1,587
|
1,272
|
315
|
0.00
|
%
|
|||||||||||||||||||||||
|
Q1:
2006
|
48,366,213
|
175,913
|
645,675
|
821,588
|
1.70
|
%
|
38,124
|
0.08
|
%
|
90
|
55
|
35
|
0.00
|
%
|
|||||||||||||||||||||||
|
Q2:
2006
|
51,635,796
|
200,275
|
653,476
|
853,751
|
1.65
|
%
|
44,632
|
0.09
|
%
|
1,463
|
1,463
|
-
|
0.01
|
%
|
|||||||||||||||||||||||
|
Q3:
2006
|
58,106,355
|
266,523
|
678,489
|
945,012
|
1.63
|
%
|
70,586
|
0.12
|
%
|
2,167
|
1,705
|
462
|
0.01
|
%
|
|||||||||||||||||||||||
|
Q4:
2006
|
57,789,159
|
303,481
|
472,669
|
776,150
|
1.34
|
%
|
64,367
|
0.11
|
%
|
1,156
|
1,132
|
24
|
0.01
|
%
|
|||||||||||||||||||||||
|
2006
|
$
|
57,789,159
|
$
|
303,481
|
$
|
472,669
|
$
|
776,150
|
1.34
|
%
|
$
|
64,367
|
0.11
|
%
|
$
|
4,876
|
$
|
4,355
|
$
|
521
|
0.03
|
%
|
|||||||||||||||
|
Commercial
Real Estate
Loans
|
2004
|
$
|
65,598
|
$
|
8,641
|
$
|
0
|
$
|
8,641
|
13.17
|
%
|
$
|
0
|
0.00
|
%
|
$
|
176
|
$
|
0
|
$
|
176
|
0.27
|
%
|
||||||||||||||
|
Q1:
2005
|
67,365
|
8,456
|
-
|
8,456
|
12.55
|
%
|
-
|
0.00
|
%
|
315
|
-
|
315
|
1.87
|
%
|
|||||||||||||||||||||||
|
Q2:
2005
|
51,778
|
8,141
|
-
|
8,141
|
15.72
|
%
|
-
|
0.00
|
%
|
-
|
-
|
-
|
0.00
|
%
|
|||||||||||||||||||||||
|
Q3:
2005
|
66,348
|
8,141
|
-
|
8,141
|
12.27
|
%
|
-
|
0.00
|
%
|
-
|
-
|
-
|
0.00
|
%
|
|||||||||||||||||||||||
|
Q4:
2005
|
70,091
|
8,141
|
-
|
8,141
|
11.61
|
%
|
-
|
0.00
|
%
|
-
|
-
|
-
|
0.00
|
%
|
|||||||||||||||||||||||
|
2005
|
70,091
|
8,141
|
-
|
8,141
|
11.61
|
%
|
-
|
0.00
|
%
|
315
|
-
|
315
|
0.45
|
%
|
|||||||||||||||||||||||
|
Q1:
2006
|
65,508
|
8,141
|
-
|
8,141
|
12.43
|
%
|
-
|
0.00
|
%
|
35
|
-
|
35
|
0.21
|
%
|
|||||||||||||||||||||||
|
Q2:
2006
|
46,959
|
8,141
|
-
|
8,141
|
17.34
|
%
|
-
|
0.00
|
%
|
-
|
-
|
-
|
0.00
|
%
|
|||||||||||||||||||||||
|
Q3:
2006
|
42,384
|
8,141
|
-
|
8,141
|
19.21
|
%
|
-
|
0.00
|
%
|
-
|
-
|
-
|
0.00
|
%
|
|||||||||||||||||||||||
|
Q4:
2006
|
38,360
|
8,141
|
-
|
8,141
|
21.22
|
%
|
-
|
0.00
|
%
|
-
|
-
|
-
|
0.00
|
%
|
|||||||||||||||||||||||
|
2006
|
$
|
38,360
|
$
|
8,141
|
$
|
0
|
$
|
8,141
|
21.22
|
%
|
$
|
0
|
0.00
|
%
|
$
|
35
|
$
|
0
|
$
|
35
|
0.36
|
%
|
|||||||||||||||
|
Commercial
CES
|
2004
|
$
|
20,886,893
|
$
|
45,639
|
$
|
557,842
|
$
|
603,481
|
2.89
|
%
|
$
|
0
|
0.00
|
%
|
$
|
0
|
$
|
0
|
$
|
0
|
0.00
|
%
|
||||||||||||||
|
Q1:
2005
|
27,763,342
|
88,671
|
557,480
|
646,151
|
2.33
|
%
|
15,305
|
0.06
|
%
|
-
|
-
|
-
|
0.00
|
%
|
|||||||||||||||||||||||
|
Q2:
2005
|
31,272,785
|
87,210
|
681,133
|
768,343
|
2.46
|
%
|
35,971
|
0.12
|
%
|
1,213
|
1,213
|
-
|
0.02
|
%
|
|||||||||||||||||||||||
|
Q3:
2005
|
40,015,531
|
138,530
|
706,532
|
845,062
|
2.11
|
%
|
20,690
|
0.05
|
%
|
59
|
59
|
-
|
0.00
|
%
|
|||||||||||||||||||||||
|
Q4:
2005
|
46,755,362
|
141,806
|
714,168
|
855,974
|
1.83
|
%
|
40,916
|
0.09
|
%
|
-
|
-
|
-
|
0.00
|
%
|
|||||||||||||||||||||||
|
2005
|
46,755,362
|
141,806
|
714,168
|
855,974
|
1.83
|
%
|
40,916
|
0.09
|
%
|
1,272
|
1,272
|
-
|
0.00
|
%
|
|||||||||||||||||||||||
|
Q1:
2006
|
48,300,705
|
167,772
|
645,675
|
813,447
|
1.68
|
%
|
38,124
|
0.08
|
%
|
55
|
55
|
-
|
0.00
|
%
|
|||||||||||||||||||||||
|
Q2:
2006
|
51,588,837
|
192,134
|
653,476
|
845,610
|
1.64
|
%
|
44,632
|
0.09
|
%
|
1,463
|
1,463
|
-
|
0.01
|
%
|
|||||||||||||||||||||||
|
Q3:
2006
|
58,063,971
|
258,382
|
678,489
|
936,871
|
1.61
|
%
|
70,586
|
0.12
|
%
|
2,167
|
1,705
|
462
|
0.01
|
%
|
|||||||||||||||||||||||
|
Q4:
2006
|
57,750,799
|
295,340
|
472,669
|
768,009
|
1.33
|
%
|
64,367
|
0.11
|
%
|
1,156
|
1,132
|
24
|
0.01
|
%
|
|||||||||||||||||||||||
|
2006
|
$
|
57,750,799
|
$
|
295,340
|
$
|
472,669
|
$
|
768,009
|
1.33
|
%
|
$
|
64,367
|
0.11
|
%
|
$
|
4,841
|
$
|
4,355
|
$
|
486
|
0.01
|
%
|
|||||||||||||||
|
Table
15: Commercial CES Underlying Loan Characteristics (all $ in
thousands)
|
||||||||||||||||||||||||||||
|
Q4:2006
|
|
Q3:2006
|
|
Q2:2006
|
|
Q1:2006
|
|
Q4:2005
|
|
Q3:2005
|
|
Q2:2005
|
|
Q1:2005
|
|
Q4:2004
|
|
|||||||||||
|
Managed
Commercial Loans
|
$
|
57,750,799
|
$
|
58,063,971
|
$
|
51,588,837
|
$
|
48,300,705
|
$
|
46,755,362
|
$
|
40,015,531
|
$
|
31,272,785
|
$
|
27,763,342
|
$
|
20,886,893
|
||||||||||
|
Number
of loans
|
3,889
|
4,032
|
3,456
|
3,737
|
3,618
|
2,866
|
2,248
|
2,059
|
1,591
|
|||||||||||||||||||
|
Average
face value
|
$
|
14,850
|
$
|
14,401
|
$
|
14,927
|
$
|
12,925
|
$
|
12,923
|
$
|
13,962
|
$
|
13,911
|
$
|
13,484
|
$
|
13,128
|
||||||||||
|
State
Distribution
|
||||||||||||||||||||||||||||
|
CA
|
17
|
%
|
18
|
%
|
18
|
%
|
17
|
%
|
17
|
%
|
16
|
%
|
18
|
%
|
17
|
%
|
18
|
%
|
||||||||||
|
NY
|
13
|
%
|
11
|
%
|
12
|
%
|
12
|
%
|
13
|
%
|
13
|
%
|
14
|
%
|
16
|
%
|
15
|
%
|
||||||||||
|
TX
|
8
|
%
|
5
|
%
|
6
|
%
|
6
|
%
|
6
|
%
|
7
|
%
|
7
|
%
|
7
|
%
|
5
|
%
|
||||||||||
|
VA
|
4
|
%
|
2
|
%
|
2
|
%
|
2
|
%
|
2
|
%
|
3
|
%
|
1
|
%
|
1
|
%
|
1
|
%
|
||||||||||
|
FL
|
6
|
%
|
5
|
%
|
5
|
%
|
5
|
%
|
5
|
%
|
5
|
%
|
4
|
%
|
4
|
%
|
4
|
%
|
||||||||||
|
Other
|
52
|
%
|
60
|
%
|
57
|
%
|
57
|
%
|
56
|
%
|
57
|
%
|
56
|
%
|
56
|
%
|
56
|
%
|
||||||||||
|
Property
Type Distribution
|
||||||||||||||||||||||||||||
|
Office
|
37
|
%
|
30
|
%
|
36
|
%
|
32
|
%
|
37
|
%
|
39
|
%
|
40
|
%
|
40
|
%
|
38
|
%
|
||||||||||
|
Retail
|
31
|
%
|
32
|
%
|
32
|
%
|
33
|
%
|
33
|
%
|
34
|
%
|
34
|
%
|
34
|
%
|
34
|
%
|
||||||||||
|
Multi-family
|
12
|
%
|
11
|
%
|
11
|
%
|
16
|
%
|
12
|
%
|
10
|
%
|
10
|
%
|
12
|
%
|
14
|
%
|
||||||||||
|
Hospitality
|
7
|
%
|
6
|
%
|
5
|
%
|
7
|
%
|
3
|
%
|
5
|
%
|
4
|
%
|
3
|
%
|
2
|
%
|
||||||||||
|
Self-storage
|
3
|
%
|
0
|
%
|
0
|
%
|
0
|
%
|
0
|
%
|
0
|
%
|
0
|
%
|
0
|
%
|
0
|
%
|
||||||||||
|
Industrial
|
3
|
%
|
1
|
%
|
1
|
%
|
2
|
%
|
2
|
%
|
1
|
%
|
2
|
%
|
2
|
%
|
3
|
%
|
||||||||||
|
Other
|
7
|
%
|
20
|
%
|
14
|
%
|
11
|
%
|
14
|
%
|
11
|
%
|
9
|
%
|
9
|
%
|
10
|
%
|
||||||||||
|
Weighted
average LTV
|
69
|
%
|
69
|
%
|
69
|
%
|
68
|
%
|
68
|
%
|
68
|
%
|
67
|
%
|
68
|
%
|
68
|
%
|
||||||||||
|
Weighted
average debt service coverage ratio
|
1.60
|
1.72
|
1.75
|
1.99
|
2.05
|
1.88
|
1.79
|
1.86
|
1.88
|
|||||||||||||||||||
|
Table
16: Commercial Real Estate Loan Characteristics (all $ in
thousands)
|
||||||||||||||||||||||||||||
|
Q4:2006
|
|
Q3:2006
|
|
Q2:2006
|
|
Q1:2006
|
|
Q4:2005
|
|
Q3:2005
|
|
Q2:2005
|
|
Q1:2005
|
|
Q4:2004
|
||||||||||||
|
Commercial
mortgage loans, reported value
|
$
|
28,172
|
$
|
32,170
|
$
|
36,722
|
$
|
55,167
|
$
|
59,692
|
$
|
56,102
|
$
|
41,794
|
$
|
56,604
|
$
|
54,479
|
||||||||||
|
Number
of loans
|
7
|
8
|
9
|
12
|
13
|
12
|
9
|
12
|
9
|
|||||||||||||||||||
|
Average
loan size
|
$
|
4,025
|
$
|
4,021
|
$
|
4,080
|
$
|
4,597
|
$
|
4,592
|
$
|
4,675
|
$
|
4,644
|
$
|
4,717
|
$
|
6,053
|
||||||||||
|
Seriously
delinquent loans
|
-
|
-
|
-
|
-
|
-
|
-
|
-
|
-
|
-
|
|||||||||||||||||||
|
Realized
credit losses
|
-
|
-
|
-
|
-
|
-
|
-
|
-
|
-
|
-
|
|||||||||||||||||||
|
California
%
|
7
|
%
|
7
|
%
|
6
|
%
|
19
|
%
|
25
|
%
|
28
|
%
|
37
|
%
|
42
|
%
|
44
|
%
|
||||||||||
|
Table
17: Securities Portfolios Credit Rating and Collateral Type
(in
millions)
|
|||||||||||||||||||||||||
| RATING | |||||||||||||||||||||||||
|
At
December 31, 2006:
|
|||||||||||||||||||||||||
|
Total
|
|
AAA
|
|
AA
|
|
A
|
|
BBB
|
|
BB
|
|
B
|
|
Unrated
|
|||||||||||
|
Residential
prime
|
$
|
1,279
|
$
|
14
|
$
|
181
|
$
|
243
|
$
|
285
|
$
|
308
|
$
|
119
|
$
|
129
|
|||||||||
|
Residential
alt-a
|
613
|
136
|
84
|
106
|
130
|
94
|
23
|
40
|
|||||||||||||||||
|
Residential
sub-prime
|
528
|
8
|
127
|
209
|
174
|
7
|
-
|
3
|
|||||||||||||||||
|
Commercial
|
567
|
9
|
2
|
16
|
92
|
225
|
90
|
133
|
|||||||||||||||||
|
CDO
|
246
|
66
|
30
|
52
|
76
|
14
|
-
|
8
|
|||||||||||||||||
|
Total
securities portfolio market value
|
$
|
3,233
|
$
|
233
|
$
|
424
|
$
|
626
|
$
|
757
|
$
|
648
|
$
|
232
|
$
|
313
|
|||||||||
|
|
RATING
|
||||||||||||||||||||||||
|
At
December 31, 2005:
|
|||||||||||||||||||||||||
|
|
Total
|
|
|
AAA
|
|
|
AA
|
|
|
A
|
|
|
BBB
|
|
|
BB
|
|
|
B
|
|
|
Unrated
|
|||
|
Residential
prime
|
$
|
1,149
|
$
|
24
|
$
|
193
|
$
|
203
|
$
|
217
|
$
|
271
|
$
|
107
|
$
|
134
|
|||||||||
|
Residential
alt-a
|
197
|
6
|
70
|
11
|
30
|
51
|
8
|
21
|
|||||||||||||||||
|
Residential
sub-prime
|
507
|
5
|
114
|
324
|
64
|
-
|
-
|
-
|
|||||||||||||||||
|
Commercial
|
404
|
11
|
2
|
20
|
152
|
131
|
30
|
58
|
|||||||||||||||||
|
CDO
|
162
|
39
|
23
|
37
|
52
|
11
|
-
|
-
|
|||||||||||||||||
|
Total
securities portfolio market value
|
$
|
2,419
|
$
|
85
|
$
|
402
|
$
|
595
|
$
|
515
|
$
|
464
|
$
|
145
|
$
|
213
|
|||||||||
|
Note:
This table combines both CES and IGS securities in our residential,
commercial, and CDO portfolios.
|
|||||||||||||||||||||||||
|
Table
18: Sequoia ABS Issued
|
||||||||||||||||
|
(all
$ in thousands)
|
||||||||||||||||
|
Principal
|
||||||||||||||||
|
|
|
Original
|
|
|
|
Estimated
|
|
Outstanding
At
|
|
|||||||
|
Sequoia
|
|
Issue
|
|
Issue
|
|
Stated
|
|
Callable
|
|
December
31,
|
|
|||||
|
ABS
Issued
|
|
Date
|
|
Amount
|
|
Maturity
|
|
Date
|
|
2006
|
||||||
|
Sequoia
1
|
07/29/97
|
$
|
534,347
|
2028
|
Called
|
$
|
-
|
|||||||||
|
Sequoia
2
|
11/06/97
|
749,160
|
2029
|
Called
|
-
|
|||||||||||
|
Sequoia
3
|
06/26/98
|
635,288
|
2028
|
Called
|
-
|
|||||||||||
|
Sequoia
1A
|
05/04/99
|
157,266
|
2028
|
Called
|
-
|
|||||||||||
|
Sequoia
4
|
03/21/00
|
377,119
|
2024
|
2006
|
71,967
|
|||||||||||
|
Sequoia
5
|
10/29/01
|
510,047
|
2026
|
2007
|
105,939
|
|||||||||||
|
Sequoia
6
|
04/26/02
|
506,142
|
2027
|
2007
|
119,772
|
|||||||||||
|
Sequoia
7
|
05/29/02
|
572,000
|
2032
|
Called
|
-
|
|||||||||||
|
Sequoia
8
|
07/30/02
|
642,998
|
2032
|
Called
|
-
|
|||||||||||
|
Sequoia
9
|
08/28/02
|
558,266
|
2032
|
2007
|
104,452
|
|||||||||||
|
Sequoia
10
|
09/26/02
|
1,041,600
|
2027
|
2008
|
257,079
|
|||||||||||
|
Sequoia
11
|
10/30/02
|
704,936
|
2032
|
2007
|
136,797
|
|||||||||||
|
Sequoia
12
|
12/19/02
|
1,096,891
|
2033
|
2006
|
215,504
|
|||||||||||
|
Sequoia
2003-1
|
02/27/03
|
1,012,321
|
2033
|
2007
|
219,452
|
|||||||||||
|
Sequoia
2003-2
|
04/29/03
|
815,080
|
2022
|
2007
|
176,740
|
|||||||||||
|
Sequoia
2003-3
|
06/26/03
|
538,452
|
2023
|
2007
|
115,704
|
|||||||||||
|
MLCC
2003-C
|
06/26/03
|
984,349
|
2023
|
2008
|
233,177
|
|||||||||||
|
MLCC
2003-D
|
07/29/03
|
1,003,591
|
2028
|
2008
|
256,257
|
|||||||||||
|
Sequoia
2003-4
|
07/29/03
|
504,273
|
2033
|
2007
|
187,427
|
|||||||||||
|
Sequoia
2003-5
|
08/27/03
|
840,248
|
2033
|
2007
|
157,622
|
|||||||||||
|
Sequoia
2003-6
|
10/29/03
|
649,999
|
2033
|
2007
|
121,572
|
|||||||||||
|
Sequoia
2003-7
|
11/25/03
|
811,707
|
2034
|
2007
|
148,853
|
|||||||||||
|
Sequoia
2003-8
|
12/23/03
|
964,238
|
2034
|
2007
|
241,139
|
|||||||||||
|
MLCC
2003-E
|
08/28/03
|
983,852
|
2028
|
2008
|
255,413
|
|||||||||||
|
MLCC
2003-F
|
09/25/03
|
1,297,913
|
2028
|
2007
|
337,018
|
|||||||||||
|
MLCC
2003-H
|
12/22/03
|
739,196
|
2029
|
2008
|
181,909
|
|||||||||||
|
Table
18: Sequoia ABS Issued
|
||||||||||||||||
|
(all
$ in thousands)
|
||||||||||||||||
|
Principal
|
||||||||||||||||
|
|
|
|
|
Original
|
|
|
|
Estimated
|
|
Outstanding
At
|
|
|||||
|
Sequoia
|
|
Issue
|
|
Issue
|
|
Stated
|
|
Callable
|
|
December
31,
|
|
|||||
|
ABS
Issued
|
|
Date
|
|
Amount
|
|
Maturity
|
|
Date
|
|
2006
|
||||||
|
Sequoia
1
|
07/29/97
|
$534,347
|
2028
|
Called
|
$-
|
|||||||||||
|
Sequoia
2004-1
|
01/28/04
|
$
|
616,562
|
2034
|
2007
|
$
|
147,563
|
|||||||||
|
Sequoia
2004-2
|
02/25/04
|
690,548
|
2034
|
2007
|
172,283
|
|||||||||||
|
Sequoia
2004-3
|
03/30/04
|
917,673
|
2034
|
2006
|
200,716
|
|||||||||||
|
Sequoia
2004-4
|
04/29/04
|
808,933
|
2010
|
2007
|
191,748
|
|||||||||||
|
Sequoia
2004-5
|
05/27/04
|
831,540
|
2012
|
2008
|
200,806
|
|||||||||||
|
Sequoia
2004-6
|
06/29/04
|
910,662
|
2012
|
2008
|
228,521
|
|||||||||||
|
SEMHT
2004-01
|
06/29/04
|
317,044
|
2014
|
2008
|
94,067
|
|||||||||||
|
Sequoia
2004-7
|
07/29/04
|
1,032,685
|
2034
|
2008
|
226,567
|
|||||||||||
|
Sequoia
2004-8
|
08/27/04
|
807,699
|
2034
|
2008
|
219,923
|
|||||||||||
|
Sequoia
2004-9
|
09/29/04
|
772,831
|
2034
|
2008
|
240,533
|
|||||||||||
|
Sequoia
2004-10
|
10/28/04
|
673,356
|
2034
|
2008
|
204,770
|
|||||||||||
|
Sequoia
2004-11
|
11/23/04
|
705,746
|
2034
|
2008
|
273,684
|
|||||||||||
|
Sequoia
2004-12
|
12/22/04
|
821,955
|
2035
|
2008
|
241,415
|
|||||||||||
|
Sequoia
2005-1
|
01/27/05
|
409,071
|
2035
|
2008
|
145,578
|
|||||||||||
|
Sequoia
2005-2
|
02/24/05
|
338,481
|
2035
|
2008
|
105,689
|
|||||||||||
|
Sequoia
2005-3
|
04/28/05
|
359,182
|
2035
|
2008
|
130,013
|
|||||||||||
|
Madrona
2005-A
|
08/25/05
|
5,400
|
2008
|
2008
|
5,400
|
|||||||||||
|
Sequoia
2005-4
|
09/29/05
|
324,576
|
2035
|
2009
|
218,544
|
|||||||||||
|
Sequoia
2006-1
|
08/30/06
|
742,507
|
2046
|
2011
|
688,854
|
|||||||||||
|
Total
Sequoia ABS Issuance
|
$
|
31,317,730
|
$
|
7,580,467
|
||||||||||||
|
Table
19: Sequoia IO ABS Issued
|
||||||||||||||||
|
(all
$ in thousands)
|
||||||||||||||||
|
|
|
|
|
|
|
|
|
|
|
Adjusted
Issue
|
|
|||||
|
|
|
|
|
Original
|
|
|
|
Estimated
|
|
Amount
At
|
|
|||||
|
Sequoia
ABS
|
|
Issue
|
|
Issue
|
|
Stated
|
|
Callable
|
|
December
31,
|
|
|||||
|
IO's
Issued
|
|
Date
|
|
Amount
|
|
Maturity
|
|
Date
|
|
2006
|
||||||
|
MLCC
2003-C X-A-2
|
06/26/03
|
$
|
12,662
|
2007
|
2007
|
$
|
377
|
|||||||||
|
MLCC
2003-D X-A-1
|
07/29/03
|
22,371
|
2007
|
2007
|
939
|
|||||||||||
|
MLCC
2003-E X-A-1
|
08/28/03
|
16,550
|
2007
|
2007
|
1,092
|
|||||||||||
|
MLCC
2003-F X-A-1
|
09/25/03
|
18,666
|
2007
|
2007
|
1,126
|
|||||||||||
|
Sequoia
2003-6 X-1
|
10/29/03
|
8,220
|
2007
|
2007
|
-
|
|||||||||||
|
SMFC
2003A AX1
|
10/31/03
|
70,568
|
2007
|
2007
|
1,680
|
|||||||||||
|
Sequoia
2003-7 X-1
|
11/25/03
|
10,345
|
2007
|
2007
|
-
|
|||||||||||
|
Sequoia
2003-8 X-1
|
12/23/03
|
12,256
|
2007
|
2007
|
717
|
|||||||||||
|
Sequoia
2004-1 X-1
|
01/28/04
|
7,801
|
2007
|
2007
|
563
|
|||||||||||
|
Sequoia
2004-2 X-1
|
02/25/04
|
8,776
|
2007
|
2007
|
740
|
|||||||||||
|
SMFC
2004A AX1
|
02/26/04
|
10,626
|
2007
|
2007
|
692
|
|||||||||||
|
MLCC
2003-H X-A-1
|
12/22/03
|
10,430
|
2007
|
2007
|
1,145
|
|||||||||||
|
Sequoia
2004-4 X-1
|
05/28/04
|
9,789
|
2010
|
2007
|
1,179
|
|||||||||||
|
Sequoia
2004-5 X-1
|
05/27/04
|
3,371
|
2012
|
2008
|
428
|
|||||||||||
|
Sequoia
2004-6 X-A
|
06/29/04
|
10,884
|
2012
|
2008
|
4,136
|
|||||||||||
|
Sequoia
2004-7 X-A
|
07/29/04
|
12,145
|
2034
|
2008
|
4,887
|
|||||||||||
|
Sequoia
2004-8 X-A
|
08/27/04
|
18,270
|
2034
|
2008
|
7,490
|
|||||||||||
|
Sequoia
2004-9 X-A
|
09/29/04
|
16,951
|
2034
|
2008
|
7,401
|
|||||||||||
|
Sequoia
2004-10 X-A
|
10/28/04
|
14,735
|
2034
|
2008
|
6,526
|
|||||||||||
|
Sequoia
2004-11 X-A-1
|
11/23/04
|
12,603
|
2034
|
2008
|
6,111
|
|||||||||||
|
Sequoia
2004-11 X-A-2
|
11/23/04
|
4,697
|
2034
|
2008
|
2,415
|
|||||||||||
|
Sequoia
2004-12 X-A-1
|
12/22/04
|
14,453
|
2035
|
2008
|
6,798
|
|||||||||||
|
Sequoia
2004-12 X-A-2
|
12/22/04
|
4,619
|
2035
|
2008
|
5,081
|
|||||||||||
|
Sequoia
2005-1 X-A
|
01/27/05
|
9,669
|
2035
|
2008
|
4,827
|
|||||||||||
|
Sequoia
2005-2 X-A
|
02/24/05
|
7,484
|
2035
|
2008
|
3,690
|
|||||||||||
|
Sequoia
2005-3 X-A
|
04/28/05
|
8,183
|
2035
|
2008
|
4,509
|
|||||||||||
|
Total
Sequoia Issuance
|
$
|
357,124
|
$
|
74,549
|
||||||||||||
|
Table
20: Acacia CDO ABS Issued
|
||||||||||||||||
|
(all
$ in thousands)
|
||||||||||||||||
|
Principal
|
||||||||||||||||
|
|
|
Original
|
|
|
|
Estimated
|
|
Outstanding
At
|
|
|||||||
|
|
|
Issue
|
|
Issue
|
|
Stated
|
|
Callable
|
|
December
31,
|
||||||
|
CDO
Issuance
|
Date
|
Amount
|
|
Maturity
|
|
Date
|
|
2006
|
||||||||
|
Acacia
CDO 1
|
12/10/02
|
$
|
285,000
|
2023
|
Called
|
$
|
-
|
|||||||||
|
Acacia
CDO 2
|
05/13/03
|
283,875
|
2023
|
Called
|
-
|
|||||||||||
|
Acacia
CDO 3
|
11/04/03
|
284,250
|
2038
|
Called
|
-
|
|||||||||||
|
Acacia
CDO 4
|
04/08/04
|
293,400
|
2039
|
2007
|
264,348
|
|||||||||||
|
Acacia
CDO 5
|
07/14/04
|
282,125
|
2039
|
2007
|
273,533
|
|||||||||||
|
Acacia
CDO 6
|
11/09/04
|
282,000
|
2040
|
2007
|
281,061
|
|||||||||||
|
Acacia
CDO 7
|
03/10/05
|
282,000
|
2045
|
2008
|
281,128
|
|||||||||||
|
Acacia
CDO 8
|
07/14/05
|
252,000
|
2045
|
2008
|
251,605
|
|||||||||||
|
Acacia
CRE 1
|
12/14/05
|
261,750
|
2045
|
2010
|
261,543
|
|||||||||||
|
Acacia
CDO 9
|
03/09/06
|
277,800
|
2046
|
2009
|
277,788
|
|||||||||||
|
Acacia
CDO 10
|
08/02/06
|
436,500
|
2046
|
2009
|
436,500
|
|||||||||||
|
Total
CDO Issuance
|
$
|
3,220,700
|
$
|
2,327,506
|
||||||||||||
|
Executive
Officers:
|
Directors:
|
|
|
George
E. Bull, III
|
George
E. Bull, III
|
|
|
Chairman
of the Board and
|
Chairman
of the Board and
|
|
|
Chief
Executive Officer
|
Chief
Executive Officer
|
|
|
Douglas
B. Hansen
|
Douglas
B. Hansen
|
|
|
President
|
President
|
|
|
Martin
S. Hughes
|
Richard
D. Baum
|
|
|
Chief
Financial Officer
|
Chief
Deputy Insurance
|
|
|
Commissioner
for the
|
||
|
Brett
D. Nicholas
|
State
of California
|
|
|
Vice
President
|
||
|
Thomas
C. Brown
|
||
|
Andrew
I. Sirkis
|
CEO,
Urban Bay Properties, Inc.
|
|
|
Vice
President
|
||
|
Mariann
Byerwalter
|
||
|
Harold
F. Zagunis
|
Chairman,
JDN Corporate
|
|
|
Vice
President
|
Advisory,
LLC
|
|
|
Greg
H. Kubicek
|
||
|
President,
The Holt Group, Inc.
|
||
|
Georganne
C. Proctor
|
||
|
Executive
Vice President and
|
||
|
Chief
Financial Officer, TIAA-CREF
|
||
|
Charles
J. Toeniskoetter
|
||
|
Chairman,
Toeniskoetter & Breeding, Inc.
|
||
|
|
David
L. Tyler
|
|
|
Private
Investor
|
|
Investor
Relations:
|
||
|
Nicole
Klock
|
|
IR
Hotline:
|
866-269-4976
|
|
|
Telephone:
|
415-380-2321
|
|
|
Email:
|
|