
|
INTRODUCTION
|
2
|
|
|
SHAREHOLDER
LETTER
|
3
|
|
|
REDWOOD
BUSINESS AND STRATEGY
|
7
|
|
|
FINANCIAL
MODULES
|
|
|
|
►
|
Financial
|
14
|
|
►
|
Residential
|
28
|
|
►
|
Commercial
|
49
|
|
►
|
CDO
|
57
|
|
►
|
Capital
|
61
|
|
►
|
Debt
|
63
|
|
►
|
ABS
Issued
|
65
|
|
APPENDIX
|
|
|
|
►
|
Glossary
|
72
|
|
►
|
Financial
Tables
|
78
|
 |
 |
|||
| George E. Bull, III | Douglas B. Hansen | |||
| Chairman and CEO | President |
| · |
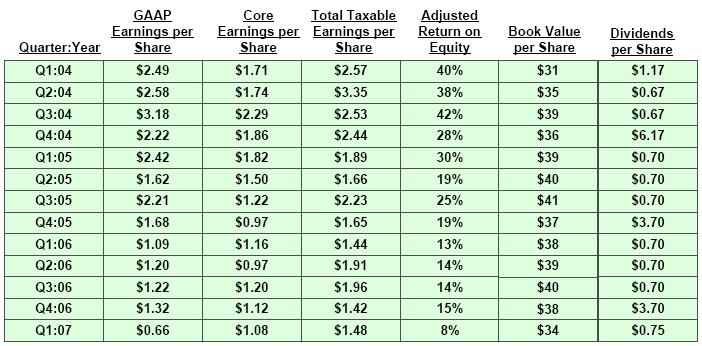
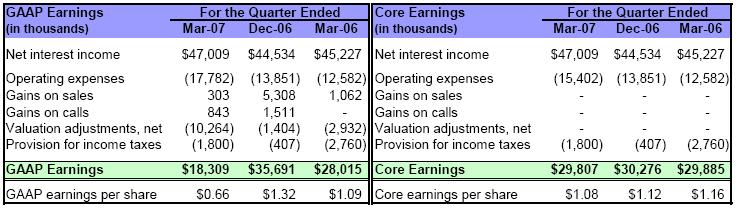
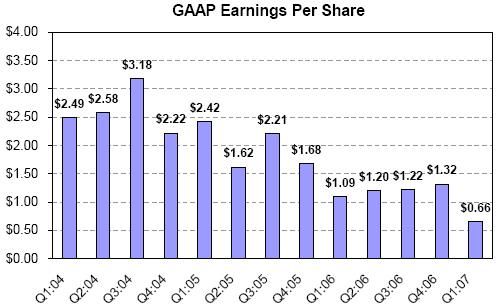
GAAP
earnings per share for the first quarter of $0.66 per share were
lower
than recent quarters primarily due to $10 million negative unrealized
mark-to-market
valuation adjustments, a $3 million charge against a commercial
real
estate loan, and $2 million severance costs. Net interest income
for the
first quarter was strong.
|
| · |
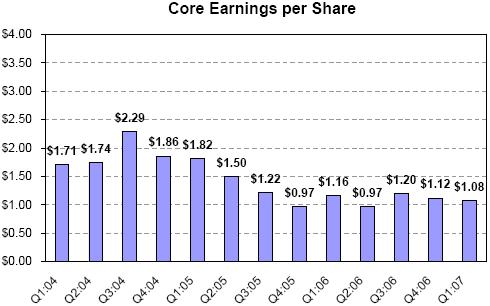
For
the past
year and a half, quarterly core earnings have ranged from $0.97
to $1.20
per share. Our first quarter core earnings of $1.08 per share were
near
the middle of this range.
|
| Ø |
Net
interest income
for
the first quarter of 2007 increased by $2 million over the fourth
quarter
of 2006 and $2 million over the first quarter of 2006. Higher net
interest
income earnings from our CES and IGS portfolios more than offset
a
decrease in net interest income from our residential loan portfolio
and a
$3 million charge related to a commercial real estate loan. The
average
balance of our residential loan portfolio continued to decline
due to high
prepayments on adjustable-rate residential loans acquired and securitized
under our Sequoia program.
|
| Ø |
Our
residential CES portfolio continues to benefit from strong credit
performance and rapid prepayments on those securities backed by
ARM loans.
The yield for this portfolio was 22% in the first quarter of 2007,
22% in
the fourth quarter of 2006, and 20% in the first quarter of
2006.
|
| Ø |
Operating
expenses for the first quarter include $2 million of severance
charges.
Excluding this item, operating expenses increased by $2 million
(or 11%)
over the fourth quarter of 2006 as we have increased the number
of our
employees and increased pay levels at
year-end.
|
| Ø |
The
largest factor causing a decline in our GAAP earnings was $10 million
of
negative unrealized mark-to-market valuation adjustments. These
adjustments were $9 million or $0.32 per share higher than the
fourth
quarter of 2006 and $7 million or $0.26 per share higher than the
first
quarter of 2006. The
decrease
in fair value reflects the overall market decline in prices for
real
estate securities (particularly, securities backed by subprime
and alt-a
loans) that occurred during the first quarter. Of the $10 million,
$9
million related to securities accounted for as trading securities,
for
which quarterly mark-to-markets are a factor in GAAP net income.
We had no
securities classified as trading in the first quarter or fourth
quarter of
2006.
|
| Ø |
As
we expect
to increase the amount of securities we classify as trading for
accounting
purposes, our quarterly GAAP earnings going forward will become
increasingly volatile. Only certain types of market value changes
are
reported in our net income, so earnings changes will not reflect
the net
overall market value changes of our assets and
liabilities.
|
| · |
Total
taxable income for the first quarter of 2007 was strong at $1.48
per
share, an increase from the prior quarter due to reduced tax deductions
from stock option exercises.
|
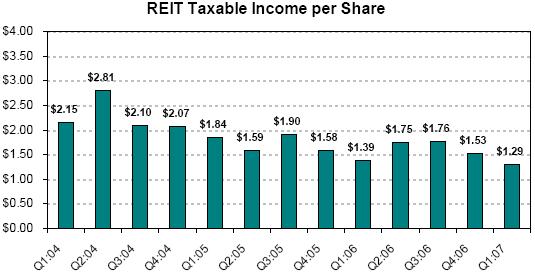
| · |
REIT
taxable income remained strong at $1.29 per share and continues
to exceed
our regular quarterly
dividend by a comfortable margin.
|
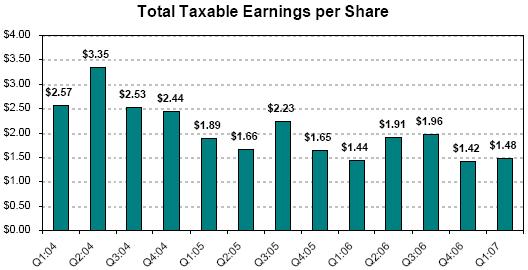
| Ø |
Total
taxable
income was $40 million, or $1.48 per share, in the first quarter
of 2007.
This was an increase from the total taxable income we generated
in the
prior quarter of $38 million or $1.42 per share. In the prior quarter,
we
had more tax deductions relating to stock option
exercises.
|
| Ø |
Our
REIT
taxable income was $1.29 per share in the first quarter of 2007.
This was
lower than the fourth quarter of 2006 of $1.53 due primarily to
the timing
of the reallocation of expenses between REIT and taxable subsidiaries.
We
are working to further develop this process so it does not cause
large
quarter-to-quarter variations.
|
| Ø |
Our
taxable
income continues to be higher than our GAAP income as we are not
permitted
to establish credit reserves for tax. As a result, we amortize
more of our
CES discount into income for tax and recognize a higher yield until
credit
losses occur. The cumulative difference at March 31, 2007 in the
discount
amortization between tax and GAAP for residential, commercial,
and CDO CES
was $99 million.
|
| Ø |
Another
reason for the difference between tax and GAAP income is that we
do not
recognize changes in market values of assets for tax until the
asset is
sold. Consequently, the negative $10 million of unrealized market
valuation adjustments included in our GAAP earnings this quarter
were not
included in our tax earnings.
|
| Ø |
Total
taxable
income and REIT taxable income were reduced by $2.2 million ($0.08
per
share) in the first quarter of 2007 as a result of deductions
for actual
credit losses. The components of the $2.2 million in losses were
$1.8
million on residential assets and $0.4 million on commercial
assets. These
deductions were less than the actual principal losses
incurred on the underlying loans of $5.9 million ($4.6 million
residential
and $1.3 million commercial), as we own most of our credit-sensitive
assets at a tax basis that is substantially less than par (principal)
value. We currently expect that realized credit losses will increase
substantially relative to our recent experience. We believe there
is a
reasonable chance that cumulative losses could remain less than
the
assumptions we have used for our pricing, GAAP reserve, and effective
yield calculations. All realized credit losses, after adjusting
for our
tax basis in the assets we own, will reduce our dividend distribution
requirements
|
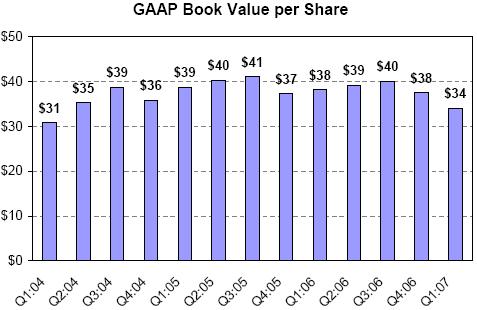
| · |
GAAP
book value declined by 9%, or $3.45 per share, during
the first quarter
from $37.51 per share to $34.06 per share as a result
of declining asset
values for those particular assets we own that are
marked-to-market for
balance sheet purposes.
|
| · |
Core
book value rose by 1% during the first quarter of 2007
from $34.02 per
share to $34.29 per share.
|
| · |
The
disruption in the capital markets also impacted liability
spreads. Under
GAAP, we are required to carry our real estate securities
on our balance
sheet at their current market value, but we are not
permitted to adjust
paired Acacia ABS issued liabilities or other liabilities
to market value.
We estimate that if we had reported our Acacia ABS
issued at fair value,
our book value at March 31, 2007 would have been higher
than reported by
$41
million
(or $1.51 per share).
|
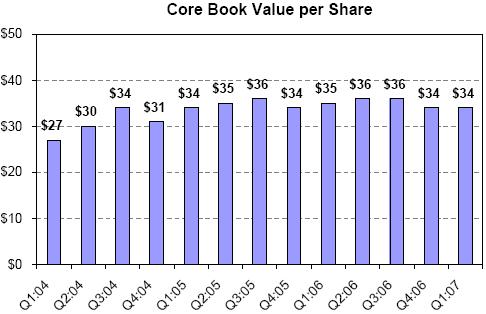
| Ø |
The
difference between core book value of $34.29 per share and GAAP
book value
of $34.06 per share at March 31, 2007 was cumulative mark-to-market
balance sheet adjustments for GAAP of negative $6 million at
quarter-end.
|
| Ø |
For
the $3.6
billion of assets that were marked-to-market for balance sheet
purposes at
March 31, 2007, market values declined by $93 million in the first
quarter
of 2007. This represents an average decline in value during the
quarter of
2% of principal value.
|
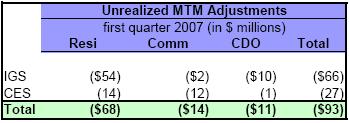
| Ø |
Market
spreads widened in March—the yields the market requires increased, so
asset values dropped. For some assets, value declines reflect a
decline in
economic value due to an increase in credit loss expectations.
For other
assets (including most of our assets), value declines reflect an
increase
in potential risks rather than a change in expected cash flows.
The table
below summarizes the change in unrealized mark-to-market
(MTM) adjustments during the first
quarter.
|
| Ø |
On
the
positive side, our consolidated liabilities increased in value
during the
quarter, meaning we could buy back the securities we issued at
a lower
price than their issuance price. The interest expense we are incurring
on
the securities we issued is less than the interest expense we would
have
to pay if we had issued these liabilities in the first quarter
of
2007.
|
| Ø |
Relative
to
the last few years, because asset prices are down, we earn more
income on
assets we buy today, but we also pay a higher interest expense
on the
securities we create and issue to finance our acquisitions. Overall,
as of
this writing, the resulting spread earning potential still appears
attractive. The markets are volatile, however, and the cost to
finance
future asset acquisitions through securitization cannot be known
until
each transaction is completed. The overall situation is characterized
by
uncertainty, which, on average, we believe should benefit us relative
to
our competitors.
|
| Ø |
Changes
in
market values for our existing assets and liabilities have had
little
effect on our operations or actual and expected cash flows. On
average, we
see the increase in spreads (lower asset prices, more expensive
liabilities) as a positive trend. Part of our business is being
paid to
assume credit risk, and it appears we are likely to be paid more
in the
future to take this risk than we have been in the recent
past.
|
| Ø |
At
the end of
our first quarter of operations in September 1994, GAAP book
value was
$11.67 per share. Since that time, we have paid $41.18 per share
of
dividends while also increasing GAAP book value by $22.39 per
share.
|
| Ø |
Book
value
per share growth generally is not a direct indicator of our market
value
or an indicator of the returns available to our shareholders.
If you had
acquired Redwood stock at our initial public offering in August
1995 and
had reinvested all dividends back into Redwood stock, your compounded
return as a shareholder would have been 21% per year through
March 31,
2007. Future results will vary.
|
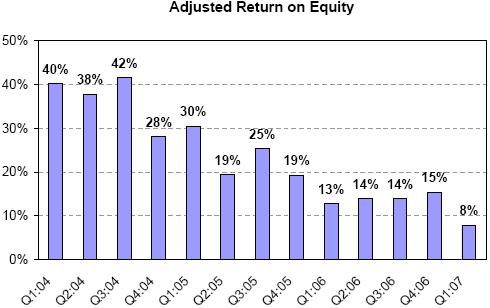
| · |
During
the first quarter of 2007, our adjusted return on equity dropped
to 8%
primarily due to the negative impact of unrealized market valuation
adjustments on our GAAP earnings.
|
| · |
Over
the long term, we expect to be able to generate annual adjusted
returns on
equity between 11% and 18%.
|
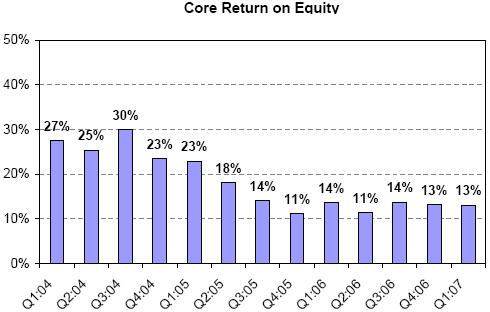
| · |
Core
return on equity (core earnings divided by core equity) was 13%
for the
quarter.
|
| · |
We
increased our regular quarterly dividend rate to $0.75 per share
in
2007.
|
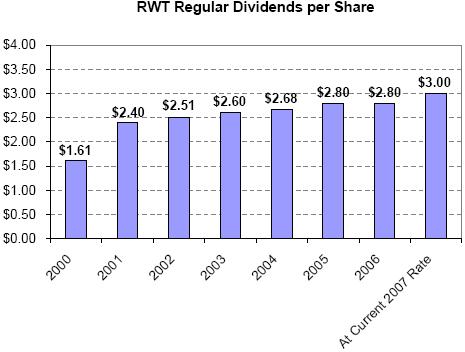
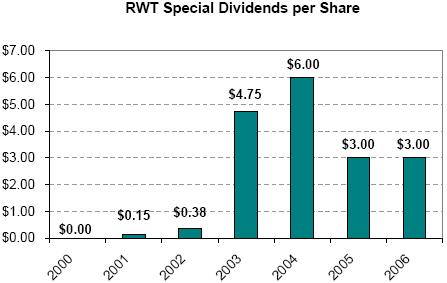
| Ø |
Total
dividend distributions over the last four quarters were $5.85 per
share.
Assuming the recent Redwood stock price of $51, the indicated dividend
yield would be 11.5% based on the last twelve months of dividends
and 5.9%
based on the current regular dividend rate of $3.00 per share for
2007.
|
| Ø |
Based
on our
estimates of REIT taxable income through the first quarter of 2007,
at
quarter end, we had $60 million ($2.20 per share) undistributed
REIT
taxable income that we anticipate distributing in 2007 through
our
regularly quarterly dividend and a special dividend.
|
| Ø |
We
generally
distribute 100% of REIT capital gains income and 90% of REIT ordinary
income, retaining 10% of the ordinary REIT income. We generally
retain
100% of the after-tax income we generate in taxable subsidiaries.
|
| · |
Total
residential
securities increased by 15% in the first quarter, from $2.4 billion
to
$2.8 billion, as a result of $609 million acquisitions, $20 million
discount amortization, $114 million sales, $4 million calls,
$63 million
principal pay downs, and $70 million market value declines. Our
primary
emphasis during the first quarter was acquiring investment-grade
rated
securities.
|
| · |
For
the most
part, we believe the trend towards lower market values is good
for us - it
allows us to buy new assets more cheaply while not affecting
our business
in a material way. We are much more concerned about the cash
flows our
assets will generate than we are about market value
fluctuations.
|
| · |
We
have had
increasing concerns about the credit performance of the loan
pools
underlying a small number of our residential securities. We have
sold most
of these securities. In the second quarter through May 4, we
sold $6
million residential securities generating a de minimis GAAP loss
in the
second quarter.
|
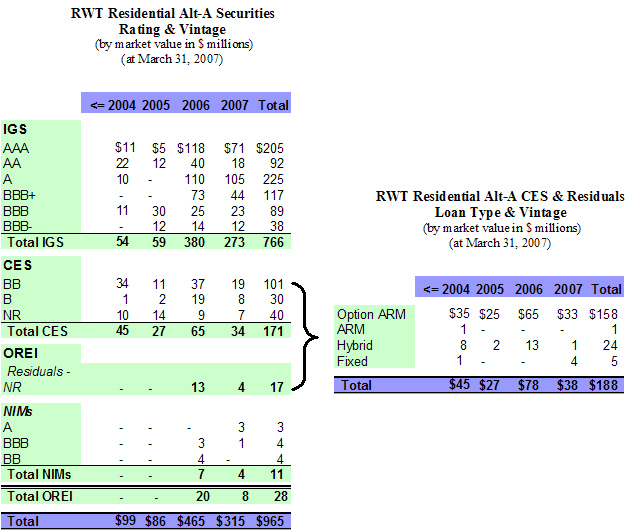
| · |
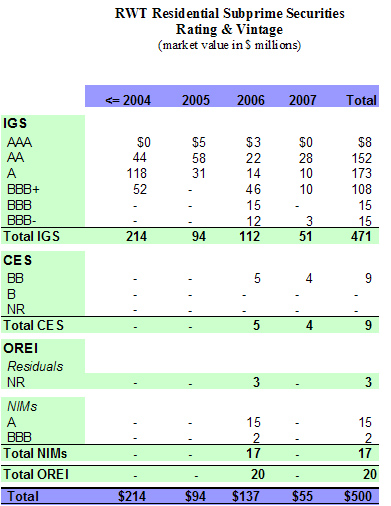
We
own some
assets that would appear to be higher risk assets in the current
environment. Using March 31, 2007 values and adjusting for subsequent
second quarter sales, we currently own $17 million subprime securities
of
the 2006 vintage rated BBB- or lower and $78 million alt-a securities
of
the 2006 vintage rated BB+ or lower. We bought some of these
assets at
very low prices, some have higher-than-average loan quality for
their
type, some have very short average lives, and others generate
returns
driven primarily by prepayment rates rather than credit losses.
Most of
these remaining higher-risk assets are currently performing better
than or
equal to our expectations. We expect that cash flow returns from
many of
these assets will be attractive relative to similar assets of
the same
vintage and rating. Although certainly not free from risk, for
the most
part they have the potential to generate reasonable investment
returns in
a housing environment even more difficult than currently appears
to be
indicated. The upside potential from some of these assets is
quite large
if the environment does not worsen. Market values will
fluctuate.
|
| · |
Our
credit
reserves for residential securities were $393 million, or $14.48
per
share, at March 31, 2007. Reserves associated with prime assets
were $264
million; reserves associated with alt-a assets were $129 million;
no
reserves were associated with our $9 million investment in subprime
BB-rated securities.
|
| · |
Of
the $2.8
billion residential securities we owned at March 31, 2007,
$1.8 billion
were financed through re-securitization via Acacia CDO transactions
and
$1.0 billion were financed with Redwood debt and
capital.
|
| · |
We
plan to continue to acquire new residential securities
of all types.
Although we expect to incur some credit losses, overall
we believe the
longer-term outlook for investing in residential securities
is
increasingly positive. We expect underwriting quality
to improve and we
expect pricing and spreads between assets and liabilities
to become
somewhat more attractive than they have been in the recent
past.
|
| · |
In
the
short-term, our biggest issue with respect to investing
in additional
residential IGS securities is that our CDO financing
costs are unknown
because the CDO issuance market is experiencing substantial
disruption.
Nevertheless, we priced an option ARM CDO transaction
in April at
attractive economic levels. We expect to price another
CDO transaction in
the second quarter; if we can achieve currently indicated
CDO pricing
levels, this will also be a profitable
transaction.
|
| · |
We
have
established and initiated the funding of a wholly-owned
qualified REIT
subsidiary - Cypress Trust, Inc. - to hold some of our
investments in
high-quality investment-grade residential securities
and high-quality
prime residential loans. These assets will be funded
initially with debt,
although Cypress will likely also utilize securitization
as a form of
financing in the future. We believe spread lending opportunities
with high
credit quality securities and loans are becoming increasingly
attractive.
In order to raise capital to accommodate growth in this
low credit risk
strategy, we may sell new shares in Cypress at some point.
Our asset
management subsidiary, Redwood Asset Management, Inc.,
would manage
Cypress as an external REIT.
|
| a) |
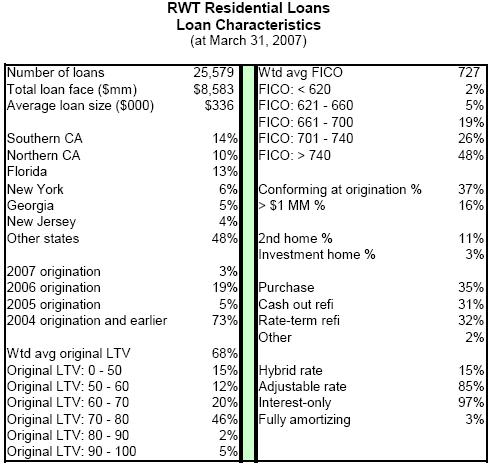
Residential
Investment-Grade Securities
|
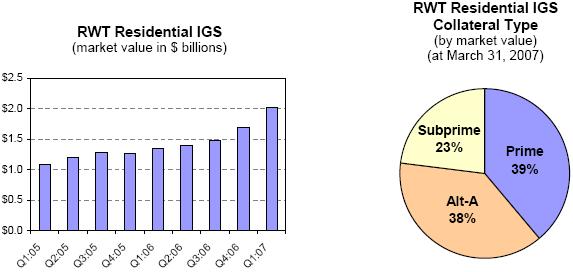
| Ø |
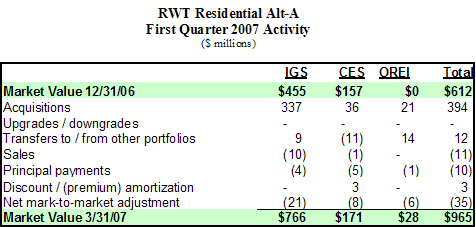
Our
residential IGS portfolio increased by 19% in the first quarter
from $1.7
billion to $2.0 billion as a result of acquisitions of $535 million,
market value declines of $54 million, sales of $108 million,
calls of $2
million, transfers to other portfolios of $14 million, and principal
pay
downs of $30 million.
|
| Ø |
The
majority
of our residential IGS acquisitions for the quarter were designated
investments for two upcoming Acacia securitizations. One of these
securitizations is predominately focused on option ARMs; the
other is our
more typical mezzanine CDO with a broader range of underlying
mortgage
collateral types.
|
| Ø |
During
the
first quarter, our residential IGS acquisitions were 25% prime,
63% alt-a,
and 12% subprime. By interest rate type, these acquisitions were
60%
option ARMs, 20% hybrids, and 20% fixed.
|
| Ø |
At
March 31,
2007, $1.3 billion residential IGS were financed via securitization
in our
Acacia CDO program and $0.7 billion were financed with Redwood
debt and
capital. We are holding most of these $0.7 billion of securities
in
anticipation of selling them to future Acacia
securitizations.
|
| Ø |
At
March 31,
2007, the interest rate characteristics of residential IGS were
46%
adjustable-rate, 35% hybrid, and 19% fixed rate. We use interest
rate
agreements to generally match the interest rate characteristics
of these
assets to their corresponding funding
sources.
|
| Ø |
We
have never
incurred a principal loss on residential IGS. We do not have
credit
reserves for these assets.
|
| Ø |
Interest
income generated by residential IGS was $29 million for the first
quarter.
The yield for the first quarter was 6.56%, a decline from 6.77%
the
previous quarter as we purchased higher-rated securities with lower
yields.
|
| Ø |
Net
discount
amortization income (which is included in interest income) for
the first
quarter was $1 million. At quarter-end, our net discount balance
for these
assets was $20 million, giving us an average amortized balance
sheet cost
basis for residential IGS of 99.06% of principal
value.
|
| Ø |
We
purchased
$33 million residential IGS in April at significantly higher expected
yields.
|
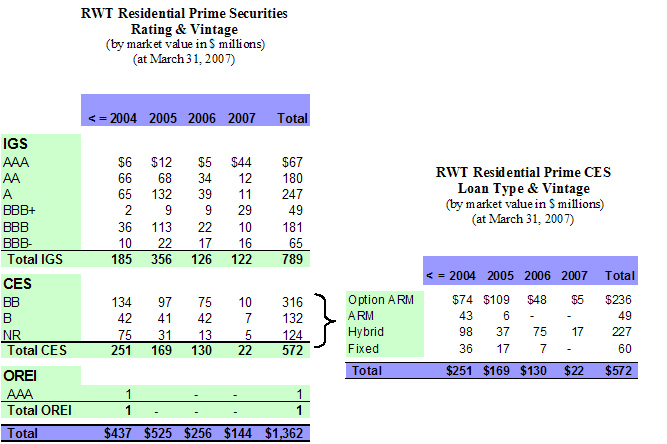
| Ø |
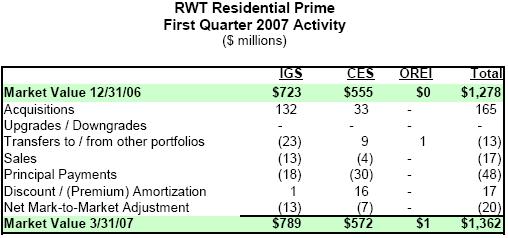
In
the first
quarter, our residential prime IGS portfolio grew by $66 million
(or 9%)
to $789 million. Our residential alt-a IGS portfolio grew by $311
million
(or 68%) to $766 million as we acquired collateral for an option
ARM
CDO.
|
| Ø |
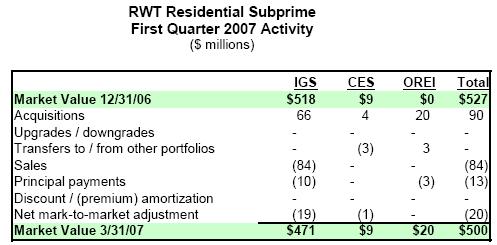
Our
subprime
IGS portfolio declined by $48 million (or 9%) to $471 million as
sales
exceeded new acquisitions of $66 million. We sold $84 million subprime
IGS
in the first quarter - $53 million of which was older subprime
IGS that we
reacquired through the call of Acacia 4. The remaining $31 million
were
credit risk sales of underperforming 2006 securities; sales of
these
securities generated a GAAP income statement loss of $1 million
in the
first quarter.
|
| Ø |
Additional
information on our residential IGS can be found in Tables 9, 10,
and 18 of
the Appendix.
|
| b) |
Residential
Credit-Enhancement Securities
|
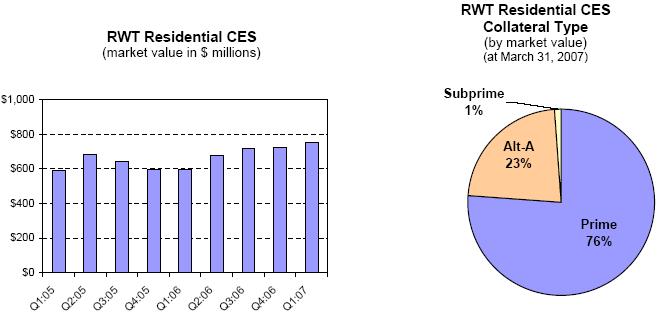
| Ø |
The
total
value of our residential CES portfolio increased by 4% from $722
million
to $752 million in the first quarter as a result of $74 million
acquisitions, $15 million market value declines, $2 million EITF
99-20
impairment write-downs, $5 million sales, $1 million calls, $19
million
discount amortization, $5 million transfers out to other portfolios,
and
$35 million principal pay downs.
|
| Ø |
The
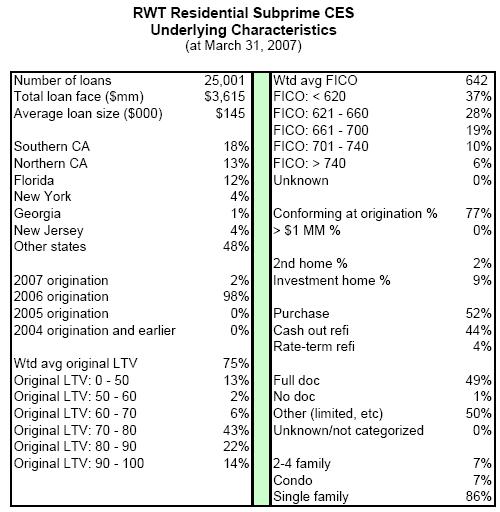
balance
of residential loans underlying our residential CES increased by
13% from
$210 billion to $237 billion during the first
quarter.
|
| Ø |
During
the
quarter, the loans underlying our residential CES acquisitions
were 45%
prime, 49% alt-a, and 6% subprime. By interest rate type, the loans
underlying these acquisitions were 58% option ARMs, 33% hybrids,
and 9%
fixed.
|
| Ø |
Interest
income generated by residential CES was $38 million for the first
quarter.
The yield for the first quarter was 22%, the same as the previous
quarter.
Yields for the first quarter were 24% for prime CES, 19% for alt-a
CES,
and 10% for subprime CES. Interest income was $30 million, $7 million,
and
$1 million for these sub-portfolios, respectively. CES yields remain
high
due to fast prepayment speeds and continued good credit performance
for
underlying loans.
|
| Ø |
Overall,
our
alt-a and prime CES portfolios are performing well from a credit
perspective. Our subprime CES portfolio has limited seasoning;
early
credit performance results are within our
expectations.
|
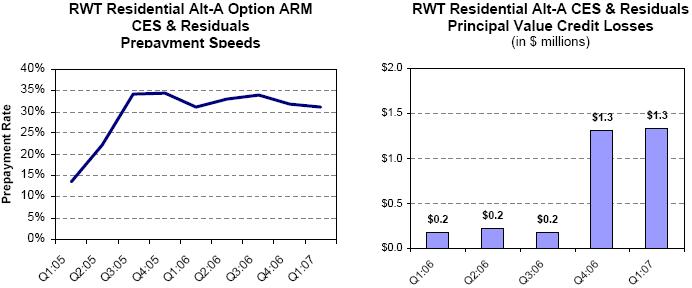
| Ø |
Principal
value credit losses for loans underlying CES were $3.8 million
for the
quarter, a decrease from $4.2 million in the previous quarter.
As assets
season, we expect losses to increase substantially in percentage
terms,
while perhaps remaining relatively low in absolute numbers. Cumulative
losses and the current loss rate remain lower than our original
pricing
expectations.
|
| Ø |
For
tax
purposes, realized credit losses were $1.5 million ($0.06 per share)
for
residential CES for the first quarter. This deduction is less than
the
principal value losses incurred on the underlying loans of $3.8
million,
as we own most of our credit-sensitive assets at a tax basis that
is
substantially less than par (principal)
value.
|
| Ø |
Our
GAAP
credit reserves for residential CES were $393 million ($14.48 per
share)
at March 31, 2007, an increase of $21 million for the quarter.
New
acquisitions increased this reserve by $48 million. As a result
of the
strong credit performance of underlying loans, we transferred $22
million
residential CES credit reserves to unamortized discount that will
be
amortized into income over time. Unamortized discount balances
for
residential CES were $159 million at
quarter-end.
|
| Ø |
At
March 31,
2007, $286 million residential CES were financed with equity and
Redwood
debt, and $466 million were financed through our Acacia CDO
program.
|
| Ø |
Our
total
residential prime CES portfolio increased by $16 million (3%) to
$571
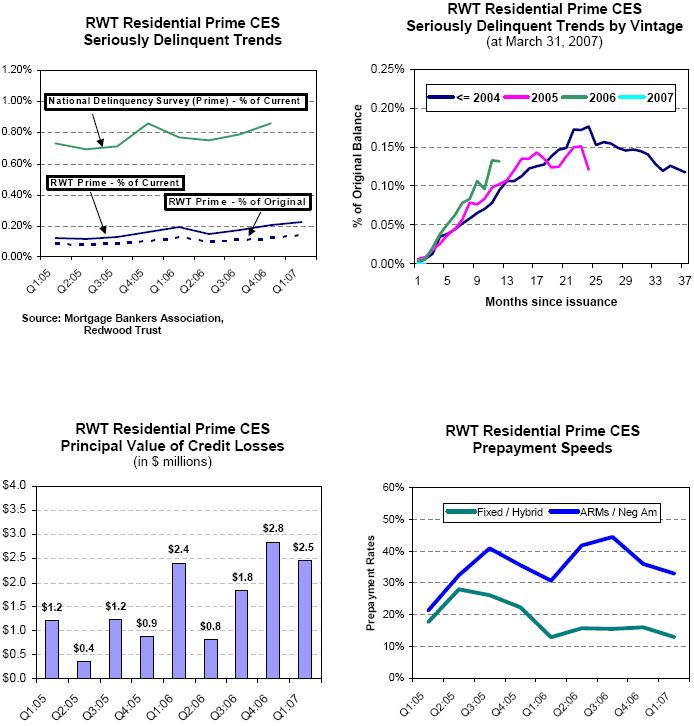
million during the first quarter. Overall,
our
prime CES portfolio is performing well from a credit perspective
and
continues to benefit from fast
prepayments.
|
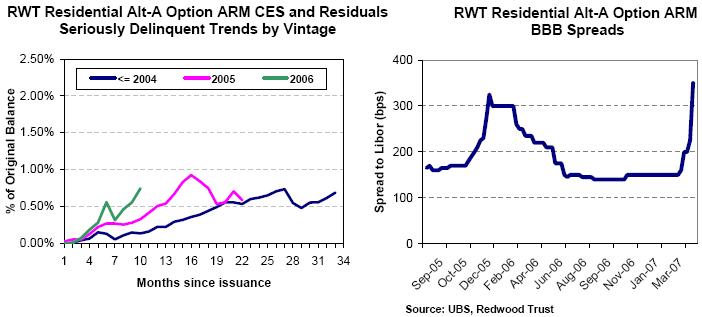
| Ø |
The
balance
of seriously delinquent loans underlying prime residential CES
increased
from $381 million to $485 million during the quarter, an increase
from
0.12% to 0.14% of original balances and 0.20% to 0.23% of current
balances. These increases remain in line with normal seasoning
and remain
well below our initial modeling
expectations.
|
| Ø |
Securities
backed by option ARM and traditional ARM loans continued to prepay
significantly faster than our original expectations at a weighted
average
CPR of 40%. These securities represent 50% of our prime CES, and
they are
priced and structured to benefit from fast prepayment speeds in
addition
to low losses.
|
| Ø |
The
principal
value of credit losses for loans underlying our prime CES was $2.5
million, which is less than one basis point (0.01%) per
year.
|
| Ø |
Fifty
percent
of our prime portfolio is composed of securities backed by hybrid
and
fixed-rate mortgages. The loans underlying these securities prepaid
at a
weighted average CPR of 13% in the first quarter. This is slower
than our
original expectations. Cumulatively over time, however, prepayment
rates
for these assets have been more rapid than we originally
assumed.
|
| Ø |
Our
residential alt-a CES portfolio increased by $15 million (10%)
to $172
million during the first quarter. Option ARM collateral makes
up 92% of
this portfolio. We sold $5 million underperforming alt-a CES
in April for
a minimal loss.
|
| Ø |
We
generally
acquire these alt-a securities backed by option ARMs with loss
expectations that are six times greater than we expect for our
prime
hybrid CES. To date, the performance of our CES backed by option
ARMs
continues to exceed our expectations.
|
| Ø |
The
balance
of seriously delinquent loans underlying alt-a residential CES
increased
from $187 million to $296 million during the quarter, an increase
from
0.60% to 0.82% of original balances and 1.03% to 1.51% of current
balances. These increases remain below our initial modeling
expectations.
|
| Ø |
Our
subprime
CES portfolio remained nearly flat for the quarter at $9 million,
with $4
million acquisitions and $3 million of transfers from other portfolios.
Our subprime CES portfolio has limited seasoning; however, the
early
credit performance continues to be within our
expectations.
|
| Ø |
In
April
2007, we purchased $21 million deep-discounted subprime BBB and
BBB-
securities.
|
| Ø |
We
continue
to search for subprime credit investment opportunities, and we
expect to
make additional investments in distressed assets as well as in
assets
backed by new loans as quality improves. In addition, we expect
to create
new assets by buying and securitizing loans. At this point, we
believe the
subprime sector is still far from recovery, so we currently expect
the
volume of our subprime CES and residual investments will remain
limited
for some time. We do not originate or service subprime loans,
nor at this
point, do we intend to.
|
| Ø |
The
subprime
markets are very large in terms of potential capital employed
and we
believe they offer ongoing opportunities for Redwood, potentially
on a
large scale. So as to not change the essential nature of Redwood
as an
investor in higher quality loans, we are considering raising
capital
though a separately managed vehicle in order to fund our future
growth in
the subprime markets.
|
| Ø |
Additional
information on our residential CES can be found in Tables 9,
10, 11, and
12 of the Appendix.
|
| c) |
Other
Residential Real Estate
Investments
|
| Ø |
Other
real
estate investments (OREI) are assets that we mark-to-market for
income
statement purposes, in many cases because they may otherwise
be deemed to
contain embedded derivatives for accounting purposes under FAS
155. We
expect to acquire additional OREI assets. Unrealized mark-to-market
fluctuations will affect GAAP income but will not directly affect
core or
taxable income.
|
| Ø |
OREI
are a
new reporting category we established in the first quarter of
2007. We
transferred $18 million of assets that were held in other portfolios
at
December 31, 2006 into this category. Total OREI at March 31,
2007 was $50
million. This included $19 million residuals, $29 million net
interest
margin securities (NIMs), and $2 million
IOs.
|
| Ø |
The
collateral type underlying our OREI was $2 million prime, $28
million
alt-a, and $20 million subprime at March 31,
2007.
|
| Ø |
Our
OREI
portfolio generated a 26 % yield for the first quarter, producing
$2
million interest income. Mark-to-market charges to income were
negative $5
million for the quarter, as a result of the substantial bid-ask
spread on
these new purchases plus the general decline in market values
towards
quarter-end.
|
| Ø |
Residuals
are
first-loss securities that are not rated by a rating agency.
The value of
residual securities can vary widely and is highly dependent on
prepayment
speeds. The value is also dependent on the level and timing of
credit
losses, but often is not as sensitive to losses as it is to prepayment
speeds. These securities perform poorly when prepayments are
fast and
losses are higher than expected.
|
| Ø |
Due
to early,
poor credit performance, we sold one residual security in April.
We sold
the security at the market value reflected in our first quarter
financial
statements.
|
| Ø |
Our
NIMs are
structured in such a way that they mature quickly (typically
less than two
years). The majority of the NIMs we have acquired have an investment-grade
rating.
|
| Ø |
OREI
at March
31, 2007 consisted of $8 million of investment-grade alt-a
NIMs with an
average life of 2.5 years.
|
| · |
Our
loan acquisition activity through our conduit is increasing. Our
primary
focus has been hybrids, as ARMs are out of favor in the current
yield
curve environment. We purchased $415 million residential hybrid
loans this
quarter. All our loans were prime-quality loans at
origination.
|
| · |
Seriously
delinquent loans and credit losses on residential loans are increasing
due
to normal seasoning, but remain well below our initial
expectations.
|
| · |
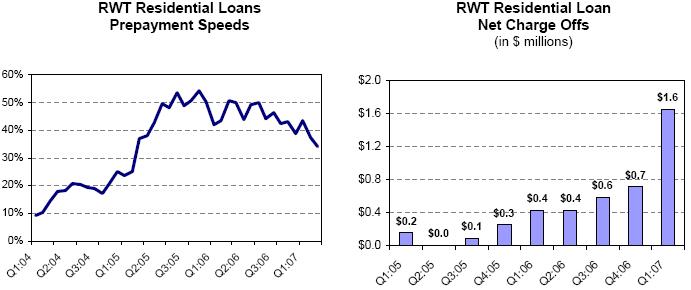
Prepayment
speeds on our loan portfolio, consisting mostly of ARM loans, continued
to
be fast, prepaying at a CPR of nearly 37% for the first quarter.
|
| · |
We
completed one securitization in the first quarter, financing $885
million
hybrid loans. In April, we priced another Sequoia securitization
that will
close in May. We called one older Sequoia securitization during
the first
quarter. The cost of financing loans has risen as market spreads
for ABS
have widened. Nevertheless, the two Sequoia transactions we have
priced in
2007 have been profitable.
|
| Ø |
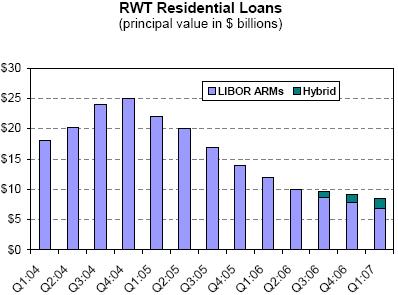
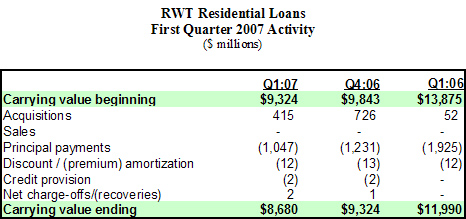
In
the first quarter, our residential loan portfolio declined
from
$9.3
billion to $8.7 billion. We acquired $415 million loans and
had no
sales. Principal pay downs were $1.0 billion.
The average
annual prepayment rate (CPR) was 37% for the first quarter
versus 34% for
all of 2006. Most of these loans are adjustable-rate loans
that tend to
prepay rapidly when the yield curve is flat or
inverted.
|
| Ø |
Interest
income was $129 million in the first quarter, a decrease from
$138 million
in the previous quarter. This portfolio yielded 5.93%. The
yield in the
previous two quarters was 5.97%.
|
| Ø |
Premium
amortization expenses, a component of interest income, were
$12 million
for the first quarter. We ended the first quarter with $8.6
billion
principal value of loans and a loan premium balance of $117
million for an
average basis of 101.37% of principal value. For various technical
accounting reasons, for several years we have not been able
to amortize
premium expense balances as quickly as the loans prepaid. If
short-term
interest rates decline, under these accounting rules we would
expect
premium amortization expenses to increase significantly. Largely
because
premium amortization expenses have not kept pace with prepayments
in the
past, we estimate the book value of residential loans exceeded
their
market value by $65 million at
quarter-end.
|
| Ø |
Realized
credit losses were $1.6 million for the first quarter, an annual
loss rate
of eight basis points (0.08%)
of
the reduced loan balances. The loss for tax purposes was $0.3
million.
Cumulative losses have been far lower than our original expectations.
We
expect losses to continue to increase as these loans season.
Credit
reserves for this portfolio were $20 million (or 0.23%) at
quarter-end.
|
| Ø |
The
balance
of seriously delinquent loans increased from $74 million to
$79 million
during the quarter, an increase from 0.24% to 0.26% of original
balances
and an increase from 0.81% to 0.92% of current balances.
|
| Ø |
At
the end of
the first quarter, $7.4 billion residential loans were financed
via
securitization (“Sequoia”) and $1.3 billion were financed with Redwood
debt and equity.
|
| Ø |
We
are
planning to acquire and securitize alt-a and subprime loans
in the future
in addition to our current business of acquiring and securitizing
prime-quality loans.
|
| Ø |
Additional
information on our residential loans can be found in Tables
9, 10,
11, and 14 of the Appendix.
|
| · |
Total
commercial securities declined
by
3% in the first quarter, from $568 million to $551 million,
as a result of
$6 million acquisitions, $6 million sales, $1 million principal
pay downs,
and $14 million negative market value changes. We did not acquire
or sell
any commercial loans.
|
| · |
Spreads
for
commercial securities widened (asset prices declined) somewhat
in the
first quarter as market participants became more risk-averse
and markets
became less liquid. Problems in subprime residential lending,
developing
problems in CDO markets, and record volumes of new CMBS issuance
were part
of the cause.
|
| · |
In
the first
quarter, we did not invest in any CMBS transactions as the
first-loss
buyer. We invested in a new transaction in the second quarter,
making a
new investment of $42 million in these commercial
CES.
|
| · |
For
2007, we
now expect to slow our pace of commercial CES acquisitions
relative to
last year. Although the commercial property market is healthy,
our
concerns for the longer-term are growing, given elevated property
prices
and increasingly aggressive underwriting. We are satisfied
with our
current assets, but we are not currently looking to add substantial
new
assets. Our current focus is primarily on building our surveillance
and
special servicing capabilities. Over time, we also expect to
expand our
capacity to acquire, originate, and finance commercial real
estate
loans.
|
| · |
We
are
committed to building a complete commercial real estate finance
business
with more fully developed capabilities and a broader product
line. We are
not in any hurry to do so, however. Given current market dynamics,
building slowly seems the prudent course of
action.
|
| a) |
Commercial
Investment-Grade
Securities
|
| Ø |
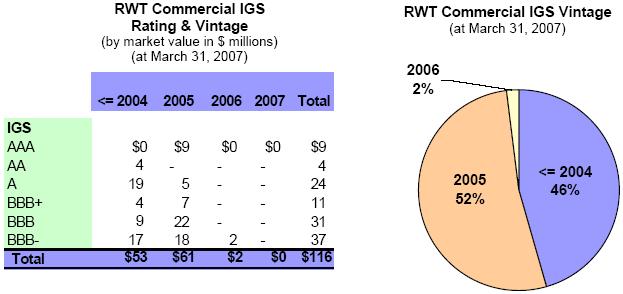
Our
commercial IGS declined
by
$4 million (or 3%) in the first quarter. Acquisitions were
$3 million,
sales were $6 million, principal pay downs were $1 million,
upgrades of
commercial CES securities to IGS were $4 million, and market
value
declines were $2 million. Sales were the result of our call
of Acacia 4
and the subsequent sale of some of Acacia 4’s assets. We recognized $0.1
million of gains from these sales of commercial
IGS.
|
| Ø |
Anticipating
spread widening, we have not been acquiring significant volumes
of
investment-grade CMBS for some time. We may seek to complete
our second
commercial real estate CDO (CRE CDO) in 2008, in which case
we may acquire
additional commercial IGS.
|
| Ø |
Interest
income generated by commercial IGS was $2 million for the first
quarter.
The yield for the quarter was 6.14%, a decrease from 8.77%
in the previous
quarter. The decrease in yield was primarily the result of
our sale of
higher-yielding commercial interest-only securities during
the fourth
quarter of 2006.
|
| Ø |
The
market
value decline of $2 million in commercial IGS was largely the
result of
credit spread widening in BBB-rated securities, reflecting
increased
supply of CMBS amidst credit concerns across all mortgage ABS
sectors.
|
| Ø |
The
credit
performance of our commercial IGS portfolio remains
strong.
|
| Ø |
We
have never
incurred a principal loss on a commercial IGS security and
we do not
currently maintain GAAP credit reserves against our commercial
IGS
securities, as we expect external credit enhancement (primarily
structural
credit subordination) will sufficiently protect our investments
from
principal losses.
|
| Ø |
The
interest
rate characteristics of commercial IGS
were 80%
fixed rate and 20% floating rate. We use interest rate agreements
to
reduce interest rate mismatches that may occur between assets
and their
associated liabilities.
|
| Ø |
At
March 31,
2007, 92% of our commercial IGS were financed via our Acacia
CDO program.
|
| Ø |
Additional
information on this portfolio can be found in Tables 9, 10,
and 18 of the
Appendix.
|
| b) |
Commercial
IGS Tables & Graphs
|
| c) |
Commercial
Credit-Enhancement Securities
|
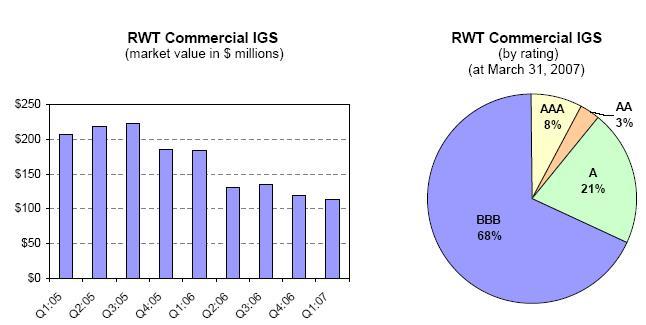
| Ø |
Our
commercial CES decreased
by
$13 million (or 3%) in the first quarter. Acquisitions were
$3 million,
commercial CES upgrades to IGS were $4 million, and market
value
depreciation was $12 million. There were no sales during the
quarter.
|
| Ø |
Interest
income generated by commercial CES was $10 million for the
first quarter.
The yield for the quarter was 9.52%, an increase from 8.97%
in the
previous quarter. The level of current yield we recognize on
these assets
is largely a function of the amount and timing of our future
credit loss
assumptions. All of our commercial CES pay fixed monthly coupon
rates of
interest.
|
| Ø |
For
the first
quarter of 2007, the market value of our commercial CES declined
by $12
million as market spreads widened. This decrease was recognized
on our
balance sheet and not through our income statement.
|
| Ø |
During
April
2007, Moody’s announced it was revising its credit rating standards on
commercial CES, effectively increasing capital required to
credit-enhance
future CMBS transactions through higher subordination levels.
The other
two rating agencies, S&P and Fitch, are also expected to increase
subordination levels somewhat for commercial securitizations.
The revised
credit standards address the perceived erosion of protection
to CMBS
investors due to aggressive underwriting on underlying commercial
mortgages. As a long-term investor in commercial CES, we expect
this
change will have a positive effect on our ability to invest
profitably in
future CMBS transactions. However, tougher ratings criteria
may reduce
market valuations on our existing investments.
|
| Ø |
Our
GAAP
credit reserves for commercial CES were $294 million ($10.85
per share) at
March 31, 2007, or 0.51% of underlying loan balances. Credit
reserves
decreased by $1 million upon realization of an anticipated
credit loss
that occurred during the quarter. The credit performance of
our commercial
CES securities remains strong. Credit losses on this portfolio
to date
total less than one basis point (0.1%).
|
| Ø |
Most
of our
commercial CES ($311 million or 71%) are in a second-loss or
more senior
position in the securitization and thus are protected from
initial credit
losses within the underlying loan pool. For the remaining $124
million of
securities that are in a direct first loss position, 44% share
losses with
other CES investors.
|
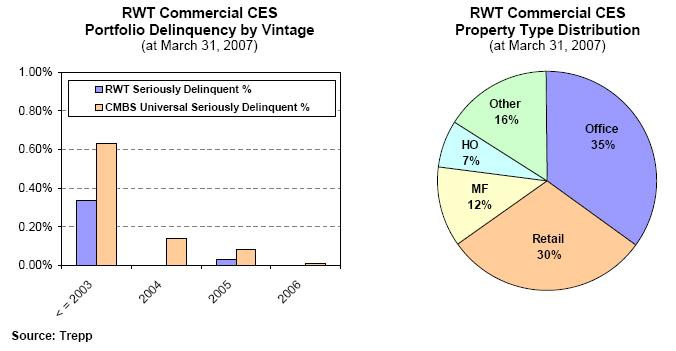
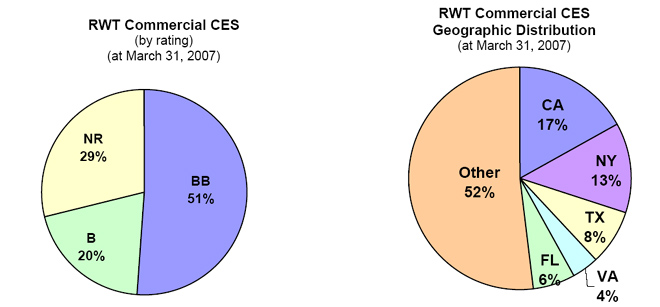
| Ø |
For
loans
underlying CES, serious delinquencies at March 31, 2007 were
$78 million,
an increase of $14 million from the previous quarter. These
delinquencies
were 0.14 % of current balances at quarter-end versus 0.24%
for the
industry. We expect that our delinquency rates will not stay
at such low
levels over time. Of the $78 million in serious delinquencies,
$57 million
are contained within one security that we deemed impaired during
a prior
period. We currently have a zero cost basis in this security,
with no risk
of future write downs affecting our income
statement.
|
| Ø |
For
tax
purposes, realized credit losses were $0.4 million. This
deduction is less
than the principal value losses incurred on the underlying
loans of $1.3
million, as we own most
of our
commercial CES at a tax basis that is substantially less
than par
(principal) value.
|
| Ø |
At
March 31, 2007, $196
million
(or 45%) commercial CES were funded with Redwood capital
and $239 million
(or 55%) were financed through our Acacia CDO program.
We are currently
planning to complete a CRE CDO transaction in 2008 to finance
many of the
commercial CES assets we are now funding with capital.
In the interim, we
are seeking financing facilities for our unsecuritized
commercial CES that
would allow us to recycle some of the Redwood capital currently
employed
by these assets.
|
| Ø |
Additional
information on commercial CES can be found in Tables 9, 10, 15,
16, and 18
of the Appendix.
|
| d) |
Commercial CES
Tables &
Graphs
|
| e) |
Commercial
Loans
|
| Ø |
Our
commercial loan portfolio decreased by $2 million (or 8%) to
$26 million
in the first quarter as a result of a write-down of a mezzanine
loan
investment. There were no acquisitions or sales during the
quarter. With
the write-off of this investment, all of our remaining commercial
loan
investments on our GAAP books are b-notes, which are the junior
portion of
a commercial loan that has been restructured to create a senior
and a
junior ownership investment in that loan.
|
| Ø |
Our
mezzanine
loan investment was part of the financing on a residential
condominium
conversion project. This loan accrued interest but did not
require payment
until completion of the project and subsequent sale of the
condominium
units. During the quarter, we fully reserved against the outstanding
principal balance of this loan based upon our updated cash
flow
assumptions. These assumptions reflect the softening residential
condominium market, cost increases required to complete the
project, and
our subordinate position in the principal repayment structure.
This
mezzanine loan investment was the remaining part of a broader
distressed
asset investment we made at a discounted price in 2003. The
other assets
we acquired at that time paid off profitably during prior
quarters.
|
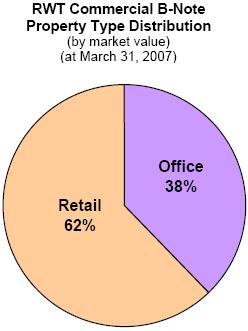
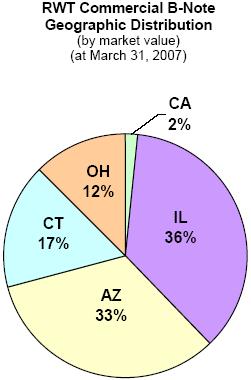
| Ø |
Commercial
b-note loan investments did not change during the quarter.
One b-note loan
was downgraded by a credit rating agency from BBB- to BB+ in
March 2007;
however, this loan is still current and is performing as
expected.
|
| Ø |
Of
our $26
million b-note investments, 99% are financed through Acacia
CDO
securitizations.
|
| Ø |
Additional
information on our commercial loans can be found in Tables
9, 10, 15, and
17 of the Appendix.
|
| f) |
Commercial
Loan Charts
|
| · |
Our
total investment in CDO securities increased 10% during the first
quarter,
from $246 million to $270 million as a result of $35 million
acquisitions
offset
by
principal pay downs of $0.4 million and market value decreases
totaling
$11 million.
|
| · |
Of
our total
investment in CDO assets of $270 million, $254 million (94%)
were
investment-grade rated securities and $16 million (6%) were below
investment-grade credit-enhancement securities (CDO
equity).
|
| · |
Recently,
spreads on CDO securities have widened dramatically, reducing
asset
prices. Many CDOs are backed by collateral pools containing high
concentrations of 2006-vintage subprime securities rated BBB
and BBB-. As
a result of expected poor subprime performance, many such CDO
securities
will likely experience credit rating downgrades and credit
losses.
|
| · |
Although
the
market value of our CDO assets has declined, we have generally
avoided
investing in transactions backed by heavy concentrations of the
types of
assets that now appear to be most at risk. Our CDO assets continue
to
perform well. We remain diligent in our monitoring of these assets
and we
will take action to sell underperforming assets where
appropriate.
|
| · |
The
CDO
markets are currently experiencing price dislocations and swelling
inventories of bonds and collateral. Liquidity is poor, as many
investors
have stopped buying CDO bonds. The volume of new issuance is
expected to
drop rapidly.
|
| · |
As
subprime
losses are realized, we expect that turmoil within the CDO markets
will
increase. We are directing additional resources towards evaluating
acquisitions of CDO assets, as we believe selected acquisition
opportunities are attractive now and may become more so in the
future.
|
| a) |
CDO
Investment-Grade Securities
|
| Ø |
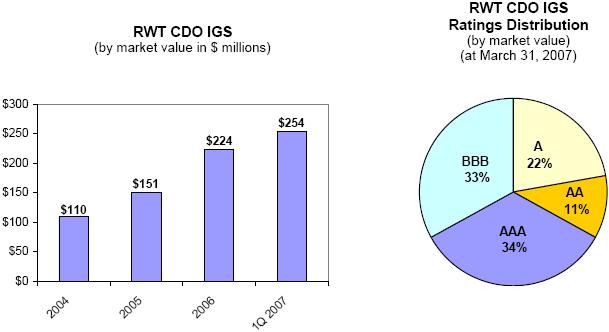
Our
CDO IGS portfolio increased
by
13%, from $224 million to $254 million, in the first quarter of 2007.
This
increase was the result of acquisitions of $35, offset by principal
pay
downs of $0.4 million and market value decreases of $10
million.
|
| Ø |
Interest
income generated by the CDO IGS portfolio during the first quarter
was
$3.9 million, an increase of 16% over the $3.3 million generated
in the
fourth quarter of 2006. The yield for the first quarter was 6.70%,
consistent with the previous quarter, as LIBOR rates have remained
relatively stable. Substantially all of these assets earn a floating
rate
of interest based on the LIBOR interest
rate.
|
| Ø |
We
have never
incurred a principal loss on a CDO IGS security and we do not currently
have credit reserves for these assets.
|
| Ø |
At
March 31,
2007, we had a total of $254 million CDO IGS. Of this amount, $191
million
was financed via securitization in our Acacia CDO program. We funded
$20
million CDO IGS assets with capital with the remaining $43 million
currently financed in warehouse facilities as they await future
re-securitization.
|
| Ø |
We
use
interest rate agreements to reduce mismatches of interest rate
characteristics between the fixed-rate CDO IGS we own and the
floating-rate CDO securities issued by Acacia to finance these
assets.
|
| b) |
CDO
IGS Tables & Graphs
|
| c) |
CDO
Credit-Enhancement
Securities
|
| Ø |
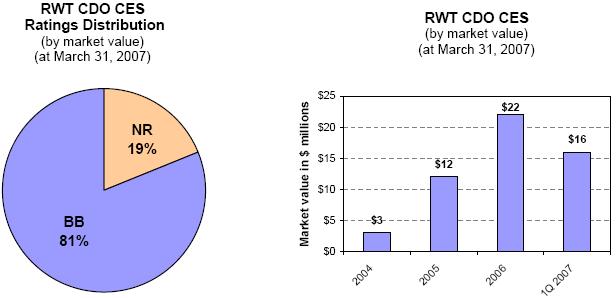
Our
CDO CES portfolio decreased during the first quarter by $6 million
or 26%
over the fourth quarter of 2006 to $16
million.
|
| Ø |
We
did not
acquire additional CDO CES in the quarter and the decrease of $6
million
was predominately due a $5 million bond being upgraded from BB to
BBB and
moving out of the CDO CES portfolio and into our CDO IGS portfolio.
An
additional $0.7 million decrease was due to mark-to-market adjustments
on
these securities based on spread widening for the
quarter.
|
| Ø |
Interest
income generated by CDO CES was $0.5 million for the first quarter.
The
yield for the quarter was 10.84%, a decline over the previous quarter‘s
yield of 11.67%. The underlying securities supporting our CES CDO
investments continue to perform well.
|
| Ø |
We
did not
incur credit losses on CDO CES in the first quarter and we have no
credit
reserves for these assets.
|
| Ø |
At
March 31,
2007, $12 million of CDO CES was financed via our Acacia CDO program
and
$4 million was financed with capital.
|
| d) |
CDO
CES Tables & Graphs
|
| · |
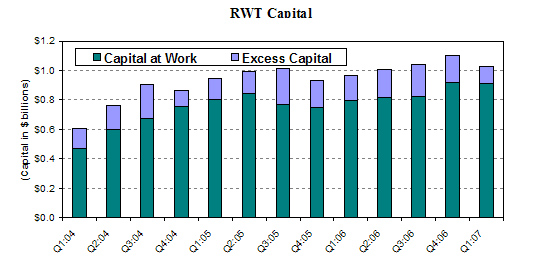
We
had $114
million
excess capital at March 31, 2007, a decrease from $182 million at
the
beginning of the quarter. We expect excess capital to increase to
approximately $140 million to $170 million by the end of May, in
part
because we expect to complete a Sequoia
securitization.
|
| · |
We
anticipated net capital absorption of $200 million to $400 million
for
2007. At this point, the outlook for capital absorption is uncertain
due
to market turmoil. Given our current acquisition plans, it is possible
that we will finish the year at the lower end of that
range.
|
| · |
Our
current
plan is to continue to invest in new assets but also to hold some
excess
capital in reserve to fund several quarters of future acquisitions.
To
accomplish both of these objectives to their full extent, we may
need to
raise additional capital (long-term debt or equity) in 2007 and may
also
take advantage of opportunities to recycle capital currently employed
on
our balance sheet through re-securitizations and other secure
financings.
|
| Ø |
Excess
capital declined by $68 million during the quarter. In the first
quarter,
uses of
capital
included new asset acquisitions ($182 million) and dividends ($21
million). Sources of capital included asset sales ($39 million),
principal
payments ($64 million), and equity issuance ($24 million). Other
elements,
including cash from earnings, the (relatively small) effect on excess
capital of market value declines, and changes in financings netted
to an
increase of $8 million of available capital for the
quarter.
|
| Ø |
Capital
employed decreased slightly in the first quarter from $914 million
to $910
million.
|
| Ø |
Some
of the
capital utilized during the quarter is currently used on a temporary
basis
in an inefficient manner to fund assets that would be more efficiently
financed with debt or via securitization or to fund delinquent loans
from
called Sequoia securitizations. Over time, we will employ this capital
more efficiently, freeing capital to support future
growth.
|
| Ø |
Market
declines did not have a large effect on excess capital, since, for
the
most part, asset value declines result in an equal reduction of both
total
capital and also of capital required under our internal risk-adjusted
capital guidelines.
|
| Ø |
Our
total
capital base decreased by $79 million during the quarter, from $1.1
billion to $1.0 billion, due to $99 million market value declines
for
assets and derivatives that were recorded for GAAP. We estimate that
if we
had reported our Acacia ABS issued at market value, our book value
at
March 31, 2007 would have been higher than reported by $41 million
(or
$1.51 per share). Market value changes to our liabilities (and market
value changes for certain other assets) are not recognized for GAAP
purposes and we do not include them in our capital calculations.
In any
event, changes in market values of any of these assets or liabilities
generally have little effect on our cash flows.
|
| Ø |
Redwood
debt balances started and finished the first quarter of 2007 at $1.9
billion.
|
| Ø |
At
March 31, 2007, Redwood debt funded $0.9 billion residential whole
loans
and $1.0 billion securities.
|
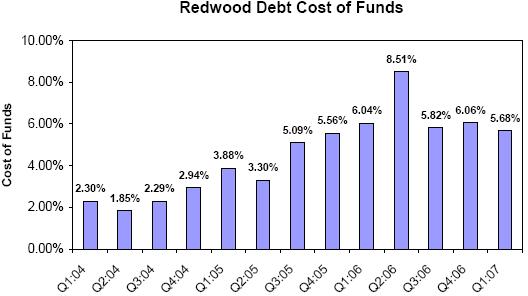
| Ø |
The
cost of funds for Redwood’s debt was 5.68% for the first quarter and 6.06%
for the fourth quarter. Interest expense for Redwood debt was $31
million
for the first quarter. Our debt expense varies by the rate of short-term
interest rates, the type of facility used, and the type of collateral
financed.
|
| Ø |
At
March 31, 2007, all Redwood debt was short-term debt collateralized
by the
pledge of assets. Maturities are generally one year or less, and
the
interest rate usually adjusts to market levels each
month.
|
| Ø |
When
we fund fixed-rate or hybrid-rate assets with Redwood debt, we may
use
interest rate agreements to reduce the interest rate mismatch between
the
asset and the liability.
|
| Ø |
Commercial
paper borrowings under our Madrona program are rated the highest
CP rating
of A1+/P1 and represent our lowest cost borrowings. At March 31,
2007, CP
outstanding
was $250 million. We expect to use CP more extensively in the
future.
|
| Ø |
Redwood’s
debt obligations of $2.0 billion (including $100 million of junior
subordinated notes) were 2.1 times Redwood’s equity of $924 million at
March 31, 2007.
|
| · |
We
believe we should be
able to
benefit from the current turmoil in the new issuance market for
CDO
securities. Our competitive advantages in the CDO business include
a large
permanent capital base, the ability to acquire and hold CDO CES,
a
well-developed real estate investment infrastructure, access
to
collateral, access to warehouse and other inventory financings,
a strong
track record, and a good reputation.
|
| · |
In
addition,
given our modeling and collateral evaluation capabilities, in
the current
environment we believe we will be able to source an new opportunities
to
invest in CDO assets issued from securitizations sponsored by
others.
|
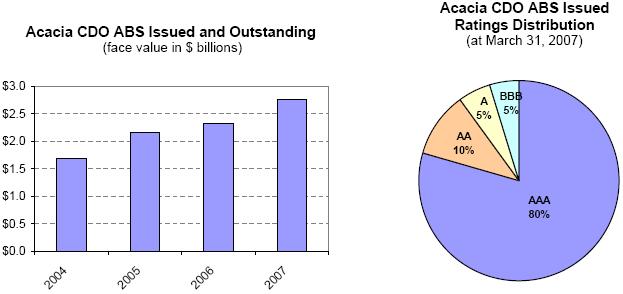
| Ø |
Acacia
CDO ABS outstanding increased from $2.3 billion to $2.8
billion during the
first quarter of 2007, an increase of 19%. Acacia issued
one new CDO ABS
during the quarter, Acacia 11, which experienced very
good investor
participation and attractive funding costs for Redwood.
Paydowns of Acacia
CDO securities were $44 million for the first
quarter.
|
| Ø |
In
April, we priced
Acacia
Option ARM CDO 1, and we expect to close this $500 million
transaction in
May. These CDO bonds priced at wider spreads (higher
cost of funds) than
Acacia 11 and consequently the CDO CES securities Redwood
acquired from
this transaction will likely have lower returns than
initially expected.
Since we have acquired and continue to acquire investment-grade
rated
option ARM-backed assets at wide spreads as collateral
for this
transaction, we still expect to earn attractive returns
on our investment
in the CDO CES from this transaction (even though some
of the collateral
we acquired for this transaction was accumulated in a
tighter spread
environment and we have had to mark down the value of
these assets for
GAAP reporting).
|
| Ø |
We
currently
expect to price an additional $500 million CDO bonds
in the second
quarter. While our cost of funds for this transaction
will not be known
until pricing, we expect that our economics on this transaction
will be
favorable if we can price at today’s spreads (which already reflect
substantial illiquidity and turmoil in the CDO markets),
although it is
possible that the transaction could be priced with wider
spreads less
favorable to Redwood, delayed, or even cancelled due
unfavorable market
conditions.
|
| Ø |
Spreads
have
widened (yields increased) for both collateral assets
and CDO liabilities.
We believe the resulting spread that can be earned for
new assets and new
liabilities is attractive, although there is substantial
uncertainty as to
where CDO liabilities will actually
price.
|
| Ø |
The
cost of funds of issued Acacia CDO ABS was 6.20% in the
first quarter of
2007 as compared to 6.08% for the fourth quarter of 2006.
Interest
expense, net of interest rate agreements, for Acacia
ABS issued was $39
million for the first quarter of 2007.
|
| Ø |
At
March 31, 2007, the credit ratings for Acacia bonds outstanding
were $2.2
billion AAA, $292 million AA, $172 million A, and $151
million BBB. In
addition, Acacia has sold a portion of its unrated CDO
CES (CDO equity) to
third parties, of which $21 million was outstanding at
March 31,
2007.
|
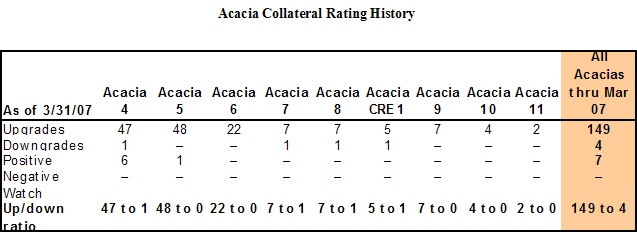
| Ø |
Our
collateral rating history continues to be strong. To
date, we have had 149
rating upgrades and four rating downgrades on all collateral
within the
existing Acacia program.
|
| Ø |
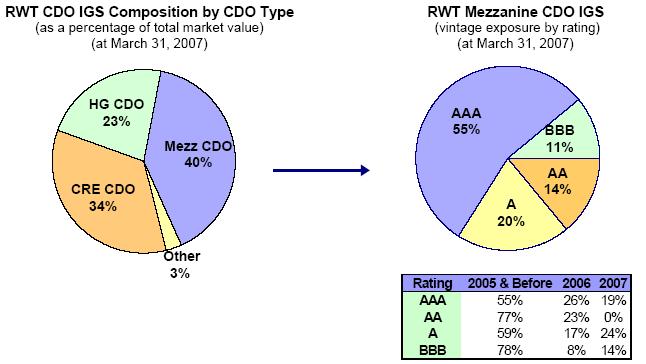
Relative
to most
other real estate CDO programs, Acacia has limited
subprime risk. We have
concentrated our subprime investments for Acacia collateral
in AA and A
rated securities, with limited exposure to BBB and
BBB- rated securities
from recent vintages. We sold some assets that appeared
they might
under-perform and losses related to these sales were
de minimis. Overall,
we believe Acacia’s CDO bonds are likely to perform well for their
investors, on an absolute basis
and
also relative to other CDO bonds. This should allow
us to continue to use
the sale of Acacia bonds as a form of financing except
in the most
difficult markets.
|
| Ø |
The
Acacia CDO CES Redwood has acquired from Acacia had a
market value of $135
million at March 31, 2007. Redwood’s economic risk with respect to
Acacia’s assets and liabilities is generally limited to our
cost
basis in these assets, which at March 31, 2007 totaled
$82 million. For
accounting purposes, we account for Acacia transactions
as financings, so
the assets owned by Acacia are consolidated with our
assets and the CDO
bonds issued by Acacia are consolidated with our liabilities.
As a result,
the Acacia CDO CES securities we issue and then acquire
do not appear on
our GAAP balance sheet, but rather are implicitly represented
as the
excess of consolidated Acacia assets over consolidated
Acacia
liabilities.
|
| Ø |
For
GAAP balance
sheet
purposes, we mark-to-market most of the assets and derivatives
owned by
the Acacia entities, but none of Acacia’s liabilities. For GAAP purposes,
if market values for Acacia’s $2.8 billion assets declined sufficiently,
we could be required to record balance sheet charges
in excess of the
total maximum economic amount ($82 million) that Redwood
actually has
invested. Conversely, we would not be permitted to reflect
an offsetting
improvement in Acacia liability MTM results in our GAAP
financials. None
of these market value changes would affect the cash flows
we expect to
earn from our Acacia investments, however. The net balance
sheet market
value markdown for assets and derivatives in closed Acacia
transactions
was $49 million for the first
quarter.
|
| Ø |
For
managing the outstanding
Acacia transactions, Redwood’s taxable asset management subsidiaries
earned $1.2 million asset management fees in the first
quarter of 2007.
This income was sourced from the assets owned by Acacia,
and these assets
are consolidated on our GAAP balance sheet, for GAAP
purposes so we
currently include this asset management income as part
of the interest
income generated by those assets.
|
| Ø |
Additional
information about Acacia CDO ABS issued can be found
in Table 21 of the
Appendix.
|
| · |
We
completed one Sequoia securitization in the first quarter
and have priced
another Sequoia securitization that will close in
May.
|
| · |
Recent
Sequoia ABS debt issued has been backed by prime hybrid
mortgages, as
prime ARMs have gone out of favor.
|
| · |
We
called an older Sequoia transaction that was issued
in 2004 and we expect
to call more transactions in 2007 and
2008.
|
| · |
We
expect to expand our residential conduit’s activities and commence
acquiring alt-a and subprime loans to be funded primarily
through
securitization.
|
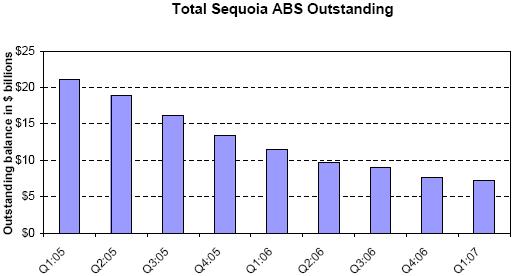
| Ø |
Sequoia
ABS outstanding
decreased from $7.7 billion to $7.2 billion in the first
quarter, a
decline of 6%. The primary reason for the decline in
the outstanding
balance was fast prepayment speeds on the underlying
Sequoia loans. In the
first quarter, the CPR for the loans owned by Sequoia
entities was
37%.
|
| Ø |
We
completed
one
securitization during the first quarter, financing $885
million prime
hybrid mortgages. In conjunction with the securitization,
Sequoia issued
$850 million AAA-rated ABS debt and another $25 million
of
investment-grade ABS debt. The ABS debt had similar interest
rate
characteristics to the underlying loans, thus minimizing
our interest rate
risk. The cost of funds on the newly issued ABS debt
was 5.91%.
|
| Ø |
We
called and retired $0.3 billion ABS debt associated with
a Sequoia
securitization issued in early 2004. When we exercise
the call option,
Redwood acquires all the ABS debt that remains outstanding
at the par
value. This debt is canceled, the Sequoia entity is collapsed,
and Redwood
reacquires the underlying loans.
|
| Ø |
Interest
expense for Sequoia ABS issued was $96 million for the
first quarter for a
cost of funds of 5.60%.
|
| Ø |
Redwood’s
economic risk with respect to Sequoia’s assets and liabilities is
generally limited to the value of Sequoia ABS we have
acquired, which
included $21 million market value IO securities rated
AAA, $88 million
CES, and $76 million investment-grade securities at March
31, 2007. For
GAAP accounting purposes, we account for Sequoia transactions
as
financings, so the assets owned by Sequoia are consolidated
with our
assets and the ABS bonds issued by Sequoia are consolidated
with our
liabilities. As a result, the Sequoia ABS we acquire
do not appear on our
GAAP balance sheet, but rather are implicitly represented
as the excess of
consolidated Sequoia assets over consolidated Sequoia
liabilities.
|
| Ø |
Total
ABS
issued on
our March 31, 2007 balance sheet included $7.2 billion
Sequoia ABS, $2.7
billion Acacia CDO ABS, and $5 million ABS issued by
our Madrona CP
issuance facility.
|
| Ø |
Additional
information about Sequoia ABS issued can be found in
Tables 19 and 20 of
the Appendix.
|
|
|
|
|
|
|
|
|
|
|
|
Full
Year
|
Full
year
|
|||||||||||||||||||||||
|
|
Q1:2007
|
Q4:2006
|
Q3:2006
|
Q2:2006
|
Q1:2006
|
Q4:2005
|
Q3:2005
|
Q2:2005
|
Q1:2005
|
2006
|
2005
|
|||||||||||||||||||||||
|
|
||||||||||||||||||||||||||||||||||
|
Interest
income
|
$
|
207,906
|
$
|
213,504
|
$
|
217,504
|
$
|
214,544
|
$
|
224,795
|
$
|
234,531
|
$
|
246,810
|
$
|
248,786
|
$
|
237,714
|
$
|
870,347
|
$
|
967,840
|
||||||||||||
|
Net
securities
discount amortization income
|
20,268
|
18,665
|
17,842
|
13,234
|
13,245
|
10,971
|
11,523
|
8,049
|
8,908
|
62,986
|
39,451
|
|||||||||||||||||||||||
|
Other
real
estate investment interest income
|
2,465
|
-
|
-
|
-
|
-
|
-
|
-
|
-
|
-
|
-
|
-
|
|||||||||||||||||||||||
|
Net
loan
premium amortization expense
|
(11,705
|
)
|
(13,272
|
)
|
(11,232
|
)
|
(12,046
|
)
|
(11,982
|
)
|
(13,486
|
)
|
(14,507
|
)
|
(9,857
|
)
|
(7,674
|
)
|
(48,532
|
)
|
(45,524
|
)
|
||||||||||||
|
(Provision
for) reversal of credit reserve
|
(3,829
|
)
|
(1,506
|
)
|
(465
|
)
|
2,506
|
(176
|
)
|
(877
|
)
|
805
|
1,527
|
(1,025
|
)
|
359
|
430
|
|||||||||||||||||
|
Total
GAAP
interest income
|
215,105
|
217,391
|
223,649
|
218,238
|
225,882
|
231,139
|
244,631
|
248,505
|
237,923
|
885,160
|
962,197
|
|||||||||||||||||||||||
|
|
||||||||||||||||||||||||||||||||||
|
Interest
expense on Redwood debt
|
(31,094
|
)
|
(16,520
|
)
|
(9,422
|
)
|
(1,822
|
)
|
(2,072
|
)
|
(3,521
|
)
|
(3,789
|
)
|
(1,789
|
)
|
(2,694
|
)
|
(29,836
|
)
|
(11,793
|
)
|
||||||||||||
|
|
||||||||||||||||||||||||||||||||||
|
ABS
interest
expense consolidated from trusts
|
(131,392
|
)
|
(152,043
|
)
|
(165,177
|
)
|
(171,659
|
)
|
(178,183
|
)
|
(186,433
|
)
|
(190,996
|
)
|
(191,966
|
)
|
(173,146
|
)
|
(667,061
|
)
|
(742,541
|
)
|
||||||||||||
|
ABS
issuance
expense amortization
|
(7,068
|
)
|
(7,897
|
)
|
(5,786
|
)
|
(6,079
|
)
|
(5,907
|
)
|
(6,069
|
)
|
(5,162
|
)
|
(5,386
|
)
|
(5,273
|
)
|
(25,669
|
)
|
(21,890
|
)
|
||||||||||||
|
ABS
interest
agreement income
|
1,646
|
2,497
|
3,317
|
3,678
|
2,980
|
3,573
|
623
|
876
|
1,469
|
12,472
|
6,541
|
|||||||||||||||||||||||
|
ABS
issuance
premium amortization income
|
1,869
|
1,529
|
2,395
|
2,363
|
2,527
|
2,793
|
2,733
|
3,140
|
3,747
|
8,813
|
$
|
12,413
|
||||||||||||||||||||||
|
Total
consolidated ABS expense
|
(134,945
|
)
|
(155,914
|
)
|
(165,251
|
)
|
(171,697
|
)
|
(178,583
|
)
|
(186,136
|
)
|
(192,802
|
)
|
(193,336
|
)
|
(173,203
|
)
|
(671,445
|
)
|
(745,477
|
)
|
||||||||||||
|
|
||||||||||||||||||||||||||||||||||
|
Junior
subordinated notes interest expense
|
(2,057
|
)
|
(423
|
)
|
-
|
-
|
-
|
-
|
-
|
-
|
-
|
(423
|
)
|
-
|
||||||||||||||||||||
|
|
||||||||||||||||||||||||||||||||||
|
GAAP
net
interest income
|
47,009
|
44,534
|
48,976
|
44,719
|
45,227
|
41,481
|
48,040
|
53,380
|
62,026
|
183,456
|
204,927
|
|||||||||||||||||||||||
|
|
||||||||||||||||||||||||||||||||||
|
Fixed
compensation expense
|
(4,616
|
)
|
(3,688
|
)
|
(3,437
|
)
|
(3,309
|
)
|
(3,437
|
)
|
(2,879
|
)
|
(2,802
|
)
|
(2,623
|
)
|
(2,778
|
)
|
(13,871
|
)
|
(11,082
|
)
|
||||||||||||
|
Variable
compensation expense
|
(2,251
|
)
|
(1,666
|
)
|
(2,630
|
)
|
(1,900
|
)
|
(1,514
|
)
|
(2,110
|
)
|
(1,980
|
)
|
(2,420
|
)
|
(2,240
|
)
|
(7,710
|
)
|
(8,750
|
)
|
||||||||||||
|
Equity
compensation expense
|
(3,349
|
)
|
(3,233
|
)
|
(2,579
|
)
|
(2,991
|
)
|
(2,694
|
)
|
(2,793
|
)
|
(2,145
|
)
|
(2,657
|
)
|
(2,214
|
)
|
(11,497
|
)
|
(9,809
|
)
|
||||||||||||
|
Severance
expense
|
(2,380
|
)
|
-
|
-
|
-
|
-
|
-
|
-
|
-
|
-
|
-
|
-
|
||||||||||||||||||||||
|
Other
operating expense
|
(4,479
|
)
|
(4,732
|
)
|
(4,425
|
)
|
(5,150
|
)
|
(4,505
|
)
|
(4,685
|
)
|
(4,362
|
)
|
(3,639
|
)
|
(3,809
|
)
|
(18,812
|
)
|
(16,495
|
)
|
||||||||||||
|
Due
diligence
expenses
|
(707
|
)
|
(532
|
)
|
(384
|
)
|
(2,687
|
)
|
(432
|
)
|
(298
|
)
|
(1,075
|
)
|
(117
|
)
|
(757
|
)
|
(4,035
|
)
|
(2,246
|
)
|
||||||||||||
|
Total
GAAP
operating expenses
|
(17,782
|
)
|
(13,851
|
)
|
(13,455
|
)
|
(16,037
|
)
|
(12,582
|
)
|
(12,765
|
)
|
(12,364
|
)
|
(11,456
|
)
|
(11,798
|
)
|
(55,925
|
)
|
(48,382
|
)
|
||||||||||||
|
|
||||||||||||||||||||||||||||||||||
|
Realized
gains
on sales
|
303
|
5,308
|
4,968
|
8,239
|
1,062
|
14,815
|
23,053
|
516
|
8,346
|
19,577
|
46,730
|
|||||||||||||||||||||||
|
Realized
gains
on calls
|
843
|
1,511
|
722
|
747
|
-
|
4,265
|
2,914
|
4,421
|
7,548
|
2,980
|
19,149
|
|||||||||||||||||||||||
|
Unrealized
market valuation adjustments
|
(10,264
|
)
|
(1,404
|
)
|
(5,257
|
)
|
(2,993
|
)
|
(2,932
|
)
|
(1,205
|
)
|
(1,051
|
)
|
(1,892
|
)
|
(883
|
)
|
(12,586
|
)
|
(5,031
|
)
|
||||||||||||
|
Net
gains and
valuation adjustments
|
(9,118
|
)
|
5,415
|
433
|
5,993
|
(1,870
|
)
|
17,875
|
24,916
|
3,045
|
15,011
|
9,971
|
60,848
|
|||||||||||||||||||||
|
|
||||||||||||||||||||||||||||||||||
|
Provision
for
income taxes
|
(1,800
|
)
|
(407
|
)
|
(3,538
|
)
|
(3,265
|
)
|
(2,760
|
)
|
(4,097
|
)
|
(4,693
|
)
|
(4,054
|
)
|
(4,677
|
)
|
(9,970
|
)
|
(17,521
|
)
|
||||||||||||
|
GAAP
net
income
|
$
|
18,309
|
$
|
35,691
|
$
|
32,416
|
$
|
31,410
|
$
|
28,015
|
$
|
42,495
|
$
|
55,899
|
$
|
40,915
|
$
|
60,563
|
$
|
127,532
|
$
|
199,872
|
||||||||||||
|
|
||||||||||||||||||||||||||||||||||
|
Diluted
average shares
|
27,684
|
27,122
|
26,625
|
26,109
|
25,703
|
25,311
|
25,314
|
25,196
|
25,021
|
26,314
|
25,121
|
|||||||||||||||||||||||
|
GAAP
earnings
per share
|
$
|
0.66
|
$
|
1.32
|
$
|
1.22
|
$
|
1.20
|
$
|
1.09
|
$
|
1.68
|
$
|
2.21
|
$
|
1.62
|
$
|
2.42
|
$
|
4.85
|
$
|
7.96
|
||||||||||||
|
Table
2: Core Earnings (in thousands, except per share
data)
|
||||||||||||||||||||||||||||||||||
|
|
Full
Year
|
Full
Year
|
||||||||||||||||||||||||||||||||
|
|
Q1:2007
|
Q4:2006
|
Q3:2006
|
Q2:2006
|
Q1:2006
|
Q4:2005
|
Q3:2005
|
Q2:2005
|
Q1:2005
|
2006
|
2005
|
|||||||||||||||||||||||
|
|
||||||||||||||||||||||||||||||||||
|
GAAP
net
income
|
$
|
18,309
|
$
|
35,691
|
$
|
32,416
|
$
|
31,410
|
$
|
28,015
|
$
|
42,495
|
$
|
55,899
|
$
|
40,915
|
$
|
60,563
|
$
|
127,532
|
$
|
199,872
|
||||||||||||
|
GAAP
income
items not included in core earnings
|
||||||||||||||||||||||||||||||||||
|
Severance
expense
|
(2,380
|
)
|
-
|
-
|
-
|
-
|
-
|
-
|
-
|
-
|
-
|
-
|
||||||||||||||||||||||
|
Realized
gains
on sales
|
303
|
5,308
|
4,968
|
8,239
|
1,062
|
14,815
|
23,053
|
516
|
8,346
|
19,577
|
46,730
|
|||||||||||||||||||||||
|
Realized
gains
on calls
|
843
|
1,511
|
722
|
747
|
-
|
4,265
|
2,914
|
4,421
|
7,548
|
2,980
|
19,149
|
|||||||||||||||||||||||
|
Unrealized
market valuation adjustments
|
(10,264
|
)
|
(1,404
|
)
|
(5,257
|
)
|
(2,993
|
)
|
(2,932
|
)
|
(1,205
|
)
|
(1,051
|
)
|
(1,892
|
)
|
(883
|
)
|
(12,586
|
)
|
(5,031
|
)
|
||||||||||||
|
Variable
stock
option market value change
|
-
|
-
|
-
|
-
|
-
|
25
|
16
|
(2
|
)
|
84
|
-
|
123
|
||||||||||||||||||||||
|
Total
GAAP /
core earnings differences
|
(11,498
|
)
|
5,415
|
433
|
5,993
|
(1,870
|
)
|
17,900
|
24,932
|
3,043
|
15,095
|
9,971
|
60,971
|
|||||||||||||||||||||
|
|
||||||||||||||||||||||||||||||||||
|
Core
earnings
|
$
|
29,807
|
$
|
30,276
|
$
|
31,983
|
$
|
25,417
|
$
|
29,885
|
$
|
24,594
|
$
|
30,967
|
$
|
37,872
|
$
|
45,468
|
$
|
117,561
|
$
|
138,901
|
||||||||||||
|
Per
share
analysis
|
||||||||||||||||||||||||||||||||||
|
GAAP
earnings
per share
|
$
|
0.66
|
$
|
1.32
|
$
|
1.22
|
$
|
1.20
|
$
|
1.09
|
$
|
1.68
|
$
|
2.21
|
$
|
1.62
|
$
|
2.42
|
$
|
4.85
|
$
|
7.96
|
||||||||||||
|
GAAP
income
items not included in core earnings
|
||||||||||||||||||||||||||||||||||
|
Severance
expense
|
($0.09
|
)
|
$
|
0.00
|
$
|
0.00
|
$
|
0.00
|
$
|
0.00
|
$
|
0.00
|
$
|
0.00
|
$
|
0.00
|
$
|
0.00
|
$
|
0.00
|
$
|
0.00
|
||||||||||||
|
Realized
gains
on sales
|
0.01
|
0.20
|
0.19
|
0.32
|
0.04
|
0.59
|
0.91
|
0.02
|
0.33
|
0.74
|
1.86
|
|||||||||||||||||||||||
|
Realized
gains
on calls
|
0.03
|
0.05
|
0.03
|
0.03
|
-
|
0.17
|
0.12
|
0.18
|
0.30
|
0.11
|
0.76
|
|||||||||||||||||||||||
|
Valuation
adjustments
|
(0.37
|
)
|
(0.05
|
)
|
(0.20
|
)
|
(0.11
|
)
|
(0.11
|
)
|
(0.05
|
)
|
(0.04
|
)
|
(0.08
|
)
|
(0.04
|
)
|
(0.48
|
)
|
(0.20
|
)
|
||||||||||||
|
Variable
stock
option market value change
|
-
|
-
|
-
|
-
|
-
|
-
|
-
|
-
|
-
|
-
|
-
|
|||||||||||||||||||||||
|
GAAP
/ Core
earnings differences per share
|
($0.42
|
)
|
$
|
0.20
|
$
|
0.02
|
$
|
0.23
|
($0.07
|
)
|
$
|
0.71
|
$
|
0.98
|
$
|
0.12
|
$
|
0.60
|
$
|
0.38
|
$
|
2.43
|
||||||||||||
|
|
||||||||||||||||||||||||||||||||||
|
Core
earnings
per share
|
$
|
1.08
|
$
|
1.12
|
$
|
1.20
|
$
|
0.97
|
$
|
1.16
|
$
|
0.97
|
$
|
1.22
|
$
|
1.50
|
$
|
1.82
|
$
|
4.47
|
$
|
5.53
|
||||||||||||
|
Table
3: Taxable Income and GAAP / Tax Differences (in thousands,
except per
share data)
|
||||||||||||||||||||||||||||||||||
|
|
Estimated
|
Estimated
|
Actual
|
Estimated
|
Actual
|
|||||||||||||||||||||||||||||
|
|
Q1:2007
|
Q4:2006
|
Q3:2006
|
Q2:2006
|
Q1:2006
|
Q4:2005
|
Q3:2005
|
Q2:2005
|
Q1:2005
|
Full
Year
2006
|
Full
Year 2005
|
|||||||||||||||||||||||
|
|
||||||||||||||||||||||||||||||||||
|
GAAP
net
income
|
$
|
18,309
|
$
|
35,691
|
$
|
32,416
|
$
|
31,410
|
$
|
28,015
|
$
|
42,495
|
$
|
55,899
|
$
|
40,915
|
$
|
60,563
|
$
|
127,532
|
$
|
199,872
|
||||||||||||
|
Difference
in Taxable Income Calculations
|
||||||||||||||||||||||||||||||||||
|
Amortization
and credit losses (net interest income)
|
10,417
|
12,794
|
12,558
|
12,779
|
4,939
|
(1,314
|
)
|
202
|
(7,079
|
)
|
(19,302
|
)
|
43,070
|
(27,493
|
)
|
|||||||||||||||||||
|
Operating
expense differences
|
(1,713
|
)
|
(12,090
|
)
|
2,545
|
(288
|
)
|
1,604
|
396
|
576
|
2,438
|
2,019
|
(8,229
|
)
|
5,429
|
|||||||||||||||||||
|
Realized
gains
on calls and sales
|
2,100
|
(5,073
|
)
|
(1,141
|
)
|
(699
|
)
|
(613
|
)
|
(5,959
|
)
|
(8,582
|
)
|
823
|
2,527
|
(7,526
|
)
|
(11,191
|
)
|
|||||||||||||||
|
Unrealized
market valuation adjustments
|
9,118
|
6,571
|
484
|
2,305
|
3,226
|
1,772
|
2,048
|
820
|
391
|
12,586
|
5,031
|
|||||||||||||||||||||||
|
Income
tax
provisions
|
1,800
|
405
|
4,123
|
3,265
|
(703
|
)
|
4,096
|
5,013
|
3,035
|
134
|
7,090
|
12,278
|
||||||||||||||||||||||
|
Total
differences in GAAP / Tax income
|
21,722
|
2,607
|
18,569
|
17,362
|
8,453
|
(1,009
|
)
|
(743
|
)
|
37
|
(14,231
|
)
|
46,991
|
(15,946
|
)
|
|||||||||||||||||||
|
|
||||||||||||||||||||||||||||||||||
|
Taxable
Income
|
$
|
40,031
|
$
|
38,298
|
$
|
50,985
|
$
|
48,772
|
$
|
36,468
|
$
|
41,486
|
$
|
55,156
|
$
|
40,952
|
$
|
46,332
|
$
|
174,523
|
$
|
183,926
|
||||||||||||
|
|
||||||||||||||||||||||||||||||||||
|
REIT
taxable
income
|
$
|
35,112
|
$
|
40,829
|
$
|
45,751
|
$
|
45,040
|
$
|
35,382
|
$
|
39,793
|
$
|
47,118
|
$
|
39,237
|
$
|
45,161
|
$
|
167,002
|
$
|
171,309
|
||||||||||||
|
Taxable
income
in taxable subsidiaries
|
4,919
|
(2,531
|
)
|
5,234
|
3,732
|
1,086
|
1,694
|
8,038
|
1,715
|
1,170
|
7,521
|
12,617
|
||||||||||||||||||||||
|
Total
taxable
income
|
$
|
40,031
|
$
|
38,298
|
$
|
50,985
|
$
|
48,772
|
$
|
36,468
|
$
|
41,487
|
$
|
55,156
|
$
|
40,952
|
$
|
46,331
|
$
|
174,523
|
$
|
183,926
|
||||||||||||
|
|
||||||||||||||||||||||||||||||||||
|
Retained
REIT
taxable income (after-tax)
|
$
|
1,933
|
$
|
673
|
$
|
2,500
|
$
|
2,166
|
$
|
1,313
|
$
|
1,895
|
$
|
1,164
|
$
|
1,798
|
$
|
1,261
|
$
|
6,652
|
$
|
6,118
|
||||||||||||
|
Retained
taxable income in taxable subsidiaries (after-tax)
|
4,522
|
(953
|
)
|
3,156
|
2,032
|
556
|
1,238
|
4,386
|
845
|
340
|
4,791
|
6,809
|
||||||||||||||||||||||
|
Total
retained
taxable income (after-tax)
|
$
|
6,455
|
($280
|
)
|
$
|
5,656
|
$
|
4,198
|
$
|
1,869
|
$
|
3,133
|
$
|
5,550
|
$
|
2,643
|
$
|
1,601
|
$
|
11,443
|
$
|
12,927
|
||||||||||||
|
|
||||||||||||||||||||||||||||||||||
|
Shares
used
for taxable EPS calculation
|
27,129
|
26,733
|
26,053
|
25,668
|
25,382
|
25,133
|
24,764
|
24,647
|
24,514
|
25,971
|
24,754
|
|||||||||||||||||||||||
|
|
||||||||||||||||||||||||||||||||||
|
REIT
taxable
income per share
|
$
|
1.29
|
$
|
1.53
|
$
|
1.76
|
$
|
1.75
|
$
|
1.39
|
$
|
1.58
|
$
|
1.90
|
$
|
1.59
|
$
|
1.84
|
$
|
6.43
|
$
|
6.92
|
||||||||||||
|
Taxable
income
in taxable subsidiaries per share
|
$
|
0.18
|
($0.11
|
)
|
$
|
0.20
|
$
|
0.16
|
$
|
0.04
|
$
|
0.07
|
$
|
0.32
|
$
|
0.07
|
$
|
0.05
|
$
|
0.29
|
$
|
0.51
|
||||||||||||
|
Total
taxable
income per share
|
$
|
1.48
|
$
|
1.42
|
$
|
1.96
|
$
|
1.91
|
$
|
1.44
|
$
|
1.65
|
$
|
2.23
|
$
|
1.66
|
$
|
1.89
|
$
|
6.72
|
$
|
7.43
|
||||||||||||
|
|
||||||||||||||||||||||||||||||||||
|
Total
retained
taxable income (after-tax)
|
$
|
0.24
|
($0.01
|
)
|
$
|
0.22
|
$
|
0.16
|
$
|
0.07
|
$
|
0.12
|
$
|
0.22
|
$
|
0.11
|
$
|
0.07
|
$
|
0.44
|
$
|
0.52
|
||||||||||||
|
|
Estimated
|
Actual
|
||||||||||||||||||||||||||||||||
|
|
Estimated
|
Estimated
|
Actual
|
Full
Year
|
Full
Year
|
|||||||||||||||||||||||||||||
|
|
Q1:2007
|
Q4:2006
|
Q3:2006
|
Q2:2006
|
Q1:2006
|
Q4:2005
|
Q3:2005
|
Q2:2005
|
Q1:2005
|
2006
|
2005
|
|||||||||||||||||||||||
|
Dividends
declared
|
$
|
20,347
|
$
|
98,476
|
$
|
18,237
|
$
|
17,967
|
$
|
17,767
|
$
|
92,150
|
$
|
17,335
|
$
|
17,253
|
$
|
17,160
|
$
|
152,447
|
$
|
143,898
|
||||||||||||
|
Dividend
deduction on stock issued through DRIP
|
660
|
812
|
177
|
239
|
176
|
263
|
128
|
112
|
56
|
1,404
|
559
|
|||||||||||||||||||||||
|
Total
dividend
deductions
|
$
|
21,007
|
$
|
99,288
|
$
|
18,414
|
$
|
18,206
|
$
|
17,943
|
$
|
92,413
|
$
|
17,463
|
$
|
17,365
|
$
|
17,216
|
$
|
153,851
|
$
|
144,457
|
||||||||||||
|
|
||||||||||||||||||||||||||||||||||
|
Regular
dividend per share
|
$
|
0.75
|
$
|
0.70
|
$
|
0.70
|
$
|
0.70
|
$
|
0.70
|
$
|
0.70
|
$
|
0.70
|
$
|
0.70
|
$
|
0.70
|
$
|
2.80
|
$
|
2.80
|
||||||||||||
|
Special
dividend per share
|
-
|
3.00
|
-
|
-
|
-
|
3.00
|
-
|
-
|
-
|
3.00
|
3.00
|
|||||||||||||||||||||||
|
Total
dividends per share
|
$
|
0.75
|
$
|
3.70
|
$
|
0.70
|
$
|
0.70
|
$
|
0.70
|
$
|
3.70
|
$
|
0.70
|
$
|
0.70
|
$
|
0.70
|
$
|
5.80
|
$
|
5.80
|
||||||||||||
|
|
||||||||||||||||||||||||||||||||||
|
Undistributed
REIT taxable income at beginning of period (pre-tax):
|
$
|
48,909
|
$
|
111,248
|
$
|
88,257
|
$
|
65,687
|
$
|
51,568
|
$
|
106,719
|
$
|
80,166
|
$
|
62,218
|
$
|
37,291
|
$
|
51,568
|
$
|
37,291
|
||||||||||||
|
REIT
taxable
income (pre-tax)
|
35,112
|
40,829
|
45,751
|
45,040
|
35,382
|
39,793
|
47,118
|
39,237
|
45,161
|
167,002
|
171,309
|
|||||||||||||||||||||||
|
Permanently
retained (pre-tax)
|
(3,336
|
)
|
(3,879
|
)
|
(4,346
|
)
|
(4,263
|
)
|
(3,320
|
)
|
(2,531
|
)
|
(3,102
|
)
|
(3,924
|
)
|
(3,018
|
)
|
(15,808
|
)
|
(12,575
|
)
|
||||||||||||
|
Dividend
of
2004 income
|
-
|
-
|
-
|
-
|
-
|
-
|
(2,710
|
)
|
(17,365
|
)
|
(17,216
|
)
|
-
|
(37,291
|
)
|
|||||||||||||||||||
|
Dividend
of
2005 income
|
-
|
-
|
(15,418
|
)
|
(18,207
|
)
|
(17,943
|
)
|
(92,413
|
)
|
(14,753
|
)
|
-
|
-
|
(51,568
|
)
|
(107,166
|
)
|
||||||||||||||||
|
Dividend
of
2006 income
|
(21,007
|
)
|
(99,288
|
)
|
(2,996
|
)
|
-
|
-
|
-
|
-
|
-
|
-
|
(102,284
|
)
|
-
|
|||||||||||||||||||
|
Dividend
of
2007 income
|
-
|
-
|
-
|
-
|
-
|
-
|
-
|
-
|
-
|
-
|
-
|
|||||||||||||||||||||||
|
Undistributed
REIT taxable income at period end (pre-tax):
|
$
|
59,678
|
$
|
48,909
|
$
|
111,248
|
$
|
88,257
|
$
|
65,687
|
$
|
51,568
|
$
|
106,719
|
$
|
80,166
|
$
|
62,218
|
$
|
48,909
|
$
|
51,568
|
||||||||||||
|
|
||||||||||||||||||||||||||||||||||
|
Undistributed
REIT taxable income (pre-tax) at period end
|
||||||||||||||||||||||||||||||||||
|
From
2004's
income
|
$
|
-
|
$
|
-
|
$
|
-
|
$
|
-
|
$
|
-
|
$
|
-
|
$
|
-
|
$
|
2,710
|
$
|
20,075
|
$
|
-
|
$
|
-
|
||||||||||||
|
From
2005's
income
|
-
|
-
|
-
|
15,418
|
33,625
|
51,568
|
106,719
|
77,456
|
42,143
|
-
|
51,568
|
|||||||||||||||||||||||
|
From
2006's
income
|
27,902
|
48,909
|
111,248
|
72,839
|
32,062
|
-
|
-
|
-
|
-
|
48,909
|
-
|
|||||||||||||||||||||||
|
From
2007's
income
|
31,776
|
-
|
-
|
-
|
-
|
-
|
-
|
-
|
-
|
-
|
-
|
|||||||||||||||||||||||
|
Total
|
$
|
59,678
|
$
|
48,909
|
$
|
111,248
|
$
|
88,257
|
$
|
65,687
|
$
|
51,568
|
$
|
106,719
|
$
|
80,166
|
$
|
62,218
|
$
|
48,909
|
$
|
51,568
|
||||||||||||
|
|
||||||||||||||||||||||||||||||||||
|
Shares
outstanding at period end
|
27,129
|
26,733
|
26,053
|
25,668
|
25,382
|
25,133
|
24,764
|
24,647
|
24,514
|
26,733
|
25,133
|
|||||||||||||||||||||||
|
Undistributed
REIT taxable income (pre-tax)per share outstanding
at period
end
|
$
|
2.20
|
$
|
1.83
|
$
|
4.27
|
$
|
3.44
|
$
|
2.59
|
$
|
2.04
|
$
|
4.31
|
$
|
3.25
|
$
|
2.54
|
$
|
1.83
|
$
|
2.05
|
||||||||||||
|
Table
5: Assets (in millions)
|
||||||||||||||||||||||||||||
|
|
||||||||||||||||||||||||||||
|
|
Q1:2007
|
Q4:2006
|
Q3:2006
|
Q2:2006
|
Q1:2006
|
Q4:2005
|
Q3:2005
|
Q2:2005
|
Q1:2005
|
|||||||||||||||||||
|
Residential
CES owned by Redwood
|
$
|
256
|
$
|
230
|
$
|
291
|
$
|
403
|
$
|
303
|
$
|
309
|
$
|
338
|
$
|
469
|
$
|
374
|
||||||||||
|
Residential
CES consolidated from Acacia
|
496
|
492
|
424
|
274
|
292
|
284
|
305
|
215
|
214
|
|||||||||||||||||||
|
Total
GAAP
residential CES
|
$
|
752
|
$
|
722
|
$
|
715
|
$
|
677
|
$
|
595
|
$
|
593
|
$
|
643
|
$
|
684
|
$
|
588
|
||||||||||
|
|
||||||||||||||||||||||||||||
|
Residential
loans owned by Redwood
|
$
|
1,256
|
$
|
1,339
|
$
|
520
|
$
|
351
|
$
|
87
|
$
|
45
|
$
|
17
|
$
|
300
|
$
|
256
|
||||||||||
|
Residential
loans consolidated from Sequoia
|
7,424
|
7,985
|
9,323
|
10,102
|
11,903
|
13,830
|
16,539
|
19,330
|
21,516
|
|||||||||||||||||||
|
Total
GAAP
residential loans
|
$
|
8,680
|
$
|
9,324
|
$
|
9,843
|
$
|
10,453
|
$
|
11,990
|
$
|
13,875
|
$
|
16,556
|
$
|
19,630
|
$
|
21,772
|
||||||||||
|
|
||||||||||||||||||||||||||||
|
Residential
IGS owned by Redwood
|
$
|
106
|
$
|
318
|
$
|
105
|
$
|
206
|
$
|
42
|
$
|
151
|
$
|
139
|
$
|
140
|
$
|
22
|
||||||||||
|
Residential
IGS consolidated from Acacia
|
1,920
|
1,379
|
1,369
|
1,184
|
1,305
|
1,109
|
1,140
|
1,053
|
1,066
|
|||||||||||||||||||
|
Total
GAAP
residential IGS
|
$
|
2,026
|
$
|
1,697
|
$
|
1,474
|
$
|
1,390
|
$
|
1,347
|
$
|
1,260
|
$
|
1,279
|
$
|
1,193
|
$
|
1,088
|
||||||||||
|
|
||||||||||||||||||||||||||||
|
Commercial
CES
owned by Redwood
|
$
|
189
|
$
|
224
|
$
|
156
|
$
|
93
|
$
|
68
|
$
|
59
|
$
|
98
|
$
|
79
|
$
|
73
|
||||||||||
|
Commercial
CES
consolidated from Acacia
|
246
|
224
|
224
|
178
|
156
|
160
|
89
|
59
|
55
|
|||||||||||||||||||
|
Total
GAAP
commercial CES
|
$
|
435
|
$
|
448
|
$
|
380
|
$
|
271
|
$
|
224
|
$
|
219
|
$
|
187
|
$
|
138
|
$
|
128
|
||||||||||
|
|
||||||||||||||||||||||||||||
|
Commercial
loans owned by Redwood
|
$
|
0
|
$
|
2
|
$
|
2
|
$
|
2
|
$
|
2
|
$
|
7
|
$
|
21
|
$
|
16
|
$
|
22
|
||||||||||
|
Commercial
loans consolidated from securitization
|
26
|
26
|
30
|
36
|
53
|
53
|
35
|
26
|
35
|
|||||||||||||||||||
|
Total
GAAP
commercial loans
|
$
|
26
|
$
|
28
|
$
|
32
|
$
|
38
|
$
|
55
|
$
|
60
|
$
|
56
|
$
|
42
|
$
|
57
|
||||||||||
|
|
||||||||||||||||||||||||||||
|
Commercial
IGS
owned by Redwood
|
$
|
9
|
$
|
0
|
$
|
0
|
$
|
1
|
$
|
3
|
$
|
6
|
$
|
23
|
$
|
10
|
$
|
1
|
||||||||||
|
Commercial
IGS
consolidated from Acacia
|
107
|
120
|
135
|
130
|
182
|
179
|
200
|
208
|
205
|
|||||||||||||||||||
|
Total
GAAP
commercial IGS
|
$
|
116
|
$
|
120
|
$
|
135
|
$
|
131
|
$
|
185
|
$
|
185
|
$
|
223
|
$
|
218
|
$
|
206
|
||||||||||
|
|
||||||||||||||||||||||||||||
|
CDO
CES owned
by Redwood
|
$
|
4
|
$
|
9
|
$
|
10
|
$
|
5
|
$
|
5
|
$
|
5
|
$
|
12
|
$
|
2
|
$
|
2
|
||||||||||
|
CDO
CES
consolidated from Acacia
|
12
|
13
|
13
|
10
|
9
|
7
|
-
|
-
|
-
|
|||||||||||||||||||
|
Total
GAAP CDO
CES
|
$
|
16
|
$
|
22
|
$
|
23
|
$
|
15
|
$
|
14
|
$
|
12
|
$
|
12
|
$
|
2
|
$
|
2
|
||||||||||
|
|
||||||||||||||||||||||||||||
|
CDO
IGS owned
by Redwood
|
$
|
20
|
$
|
14
|
$
|
2
|
$
|
17
|
$
|
4
|
$
|
6
|
$
|
5
|
$
|
6
|
$
|
0
|
||||||||||
|
CDO
IGS
consolidated from Acacia
|
234
|
210
|
183
|
160
|
160
|
145
|
141
|
143
|
133
|
|||||||||||||||||||
|
Total
GAAP CDO
IGS
|
$
|
254
|
$
|
224
|
$
|
185
|
$
|
177
|
$
|
164
|
$
|
151
|
$
|
146
|
$
|
149
|
$
|
133
|
||||||||||
|
|
||||||||||||||||||||||||||||
|
Other
real
estate investments owned by Redwood
|
$
|
47
|
$
|
0
|
$
|
0
|
$
|
0
|
$
|
0
|
$
|
0
|
$
|
0
|
$
|
0
|
$
|
0
|
||||||||||
|
Other
real
estate investments consolidated from Acacia
|
3
|
-
|
-
|
-
|
-
|
-
|
-
|
-
|
-
|
|||||||||||||||||||
|
Total
other
real estate investments
|
$
|
50
|
$
|
0
|
$
|
0
|
$
|
0
|
$
|
0
|
$
|
0
|
$
|
0
|
$
|
0
|
$
|
0
|
||||||||||
|
|
||||||||||||||||||||||||||||
|
Cash
owned by
Redwood
|
$
|
92
|
$
|
168
|
$
|
113
|
$
|
106
|
$
|
85
|
$
|
176
|
$
|
163
|
$
|
72
|
$
|
65
|
||||||||||
|
Restricted
cash consolidated from entities
|
340
|
112
|
139
|
86
|
131
|
72
|
59
|
48
|
58
|
|||||||||||||||||||
|
Accrued
interest receivable
|
65
|
71
|
67
|
67
|
73
|
76
|
80
|
85
|
82
|
|||||||||||||||||||
|
Principal
receivable
|
7
|
4
|
1
|
1
|
2
|
-
|
2
|
-
|
-
|
|||||||||||||||||||
|
Derivative
assets
|
18
|
27
|
30
|
54
|
48
|
31
|
25
|
13
|
29
|
|||||||||||||||||||
|
Deferred
tax
asset
|
6
|
5
|
3
|
5
|
5
|
5
|
8
|
7
|
8
|
|||||||||||||||||||
|
Deferred
asset-backed security issuance costs
|
41
|
42
|
47
|
46
|
52
|
54
|
56
|
59
|
63
|
|||||||||||||||||||
|
Other
assets
|
23
|
16
|
13
|
13
|
10
|
8
|
10
|
6
|
6
|
|||||||||||||||||||
|
Total
GAAP
assets
|
$
|
12,947
|
$
|
13,030
|
$
|
13,200
|
$
|
13,530
|
$
|
14,979
|
$
|
16,777
|
$
|
19,505
|
$
|
22,346
|
$
|
24,285
|
||||||||||
|
|
||||||||||||||||||||||||||||
|
Residential
CES owned by Redwood
|
$
|
256
|
$
|
230
|
$
|
291
|
$
|
403
|
$
|
303
|
$
|
309
|
$
|
338
|
$
|
469
|
$
|
374
|
||||||||||
|
Residential
loans owned by Redwood
|
1,256
|
1,339
|
520
|
351
|
87
|
45
|
17
|
300
|
256
|
|||||||||||||||||||
|
Residential
IGS owned by Redwood
|
106
|
318
|
105
|
206
|
42
|
151
|
139
|
140
|
22
|
|||||||||||||||||||
|
Commercial
CES
owned by Redwood
|
189
|
224
|
156
|
93
|
68
|
59
|
98
|
79
|
73
|
|||||||||||||||||||
|
Commercial
loans owned by Redwood
|
-
|
2
|
2
|
2
|
2
|
7
|
21
|
16
|
22
|
|||||||||||||||||||
|
Commercial
IGS
owned by Redwood
|
9
|
-
|
-
|
1
|
3
|
6
|
23
|
10
|
1
|
|||||||||||||||||||
|
CDO
CES owned
by Redwood
|
4
|
9
|
10
|
5
|
5
|
5
|
12
|
2
|
2
|
|||||||||||||||||||
|
CDO
IGS owned
by Redwood
|
20
|
14
|
2
|
17
|
4
|
6
|
5
|
6
|
-
|
|||||||||||||||||||
|
Other
real
estate investments owned by Redwood
|
47
|
-
|
-
|
-
|
-
|
-
|
-
|
-
|
-
|
|||||||||||||||||||
|
Cash
owned by
Redwood
|
92
|
168
|
113
|
106
|
85
|
176
|
163
|
72
|
65
|
|||||||||||||||||||
|
Total
assets
owned by Redwood
|
1,979
|
2,304
|
1,199
|
1,184
|
599
|
764
|
816
|
1,094
|
815
|
|||||||||||||||||||
|
Assets
of
securitizations for GAAP
|
10,468
|
10,449
|
11,701
|
12,074
|
14,060
|
15,767
|
18,449
|
21,034
|
23,224
|
|||||||||||||||||||
|
ABS
liabilities of entities for GAAP
|
(9,947
|
)
|
(9,979
|
)
|
(11,554
|
)
|
(11,898
|
)
|
(13,930
|
)
|
(15,585
|
)
|
(18,237
|
)
|
(20,815
|
)
|
(23,057
|
)
|
||||||||||
|
Redwood
earning assets - GAAP basis
|
$
|
2,500
|
$
|
2,774
|
$
|
1,346
|
$
|
1,360
|
$
|
729
|
$
|
946
|
$
|
1,028
|
$
|
1,313
|
$
|
982
|
||||||||||
|
|
|
|
|
|
|
|
|
|
|
|||||||||||||||||||
|
|
Q1:2007
|
Q4:2006
|
Q3:2006
|
Q2:2006
|
Q1:2006
|
Q4:2005
|
Q3:2005
|
Q2:2005
|
Q1:2005
|
|||||||||||||||||||
|
|
||||||||||||||||||||||||||||
|
Redwood
debt
|
$
|
1,630
|
$
|
1,556
|
$
|
510
|
$
|
529
|
$
|
-
|
$
|
170
|
$
|
162
|
$
|
453
|
$
|
199
|
||||||||||
|
Madrona
commercial paper
|
250
|
300
|
-
|
-
|
-
|
-
|
-
|
-
|
-
|
|||||||||||||||||||
|
Total
Redwood
debt
|
1,880
|
1,856
|
510
|
529
|
-
|
170
|
162
|
453
|
199
|
|||||||||||||||||||
|
|
||||||||||||||||||||||||||||
|
ABS
issued,
consolidated from entities
|
9,890
|
9,907
|
11,466
|
11,775
|
13,788
|
15,422
|
18,049
|
20,598
|
22,821
|
|||||||||||||||||||
|
Unamortized
IO
issuance premium
|
62
|
75
|
90
|
106
|
124
|
143
|
163
|
186
|
202
|
|||||||||||||||||||
|
Unamortized
ABS issuance premium (discount)
|
(5
|
)
|
(3
|
)
|
(2
|
)
|
17
|
18
|
20
|
25
|
31
|
34
|
||||||||||||||||
|
ABS
obligations of entities
|
9,947
|
9,979
|
11,554
|
11,898
|
13,930
|
15,585
|
18,237
|
20,815
|
23,057
|
|||||||||||||||||||
|
|
||||||||||||||||||||||||||||
|
Junior
subordinated notes
|
100
|
100
|
-
|
-
|
-
|
-
|
-
|
-
|
-
|
|||||||||||||||||||
|
|
||||||||||||||||||||||||||||
|
Accrued
interest payable
|
52
|
50
|
51
|
47
|
43
|
41
|
42
|
43
|
38
|
|||||||||||||||||||
|
Interest
rate
agreements
|
7
|
6
|
6
|
4
|
-
|
1
|
1
|
3
|
-
|
|||||||||||||||||||
|
Accrued
expenses and other liabilities
|
17
|
17
|
18
|
29
|
21
|
28
|
30
|
23
|
26
|
|||||||||||||||||||
|
Dividends
payable
|
20
|
19
|
18
|
18
|
18
|
17
|
17
|
17
|
17
|
|||||||||||||||||||
|
Total
GAAP
liabilities
|
12,023
|
12,027
|
12,157
|
12,525
|
14,012
|
15,842
|
18,489
|
21,354
|
23,337
|
|||||||||||||||||||
|
|
||||||||||||||||||||||||||||
|
|
||||||||||||||||||||||||||||
|
Common
stock
and paid-in capital
|
928
|
904
|
875
|
854
|
839
|
825
|
808
|
803
|
795
|
|||||||||||||||||||
|
Accumulated
other comprehensive income
|
(6
|
)
|
93
|
95
|
91
|
82
|
74
|
117
|
137
|
125
|
||||||||||||||||||
|
Cumulative
GAAP earnings
|
827
|
809
|
773
|
740
|
709
|
681
|
639
|
583
|
542
|
|||||||||||||||||||
|
Cumulative
distributions to shareholders
|
(825
|
)
|
(803
|
)
|
(700
|
)
|
(681
|
)
|
(663
|
)
|
(645
|
)
|
(548
|
)
|
(531
|
)
|
(514
|
)
|
||||||||||
|
GAAP
stockholders' equity
|
924
|
1,003
|
1,043
|
1,004
|
967
|
935
|
1,016
|
992
|
948
|
|||||||||||||||||||
|
|
||||||||||||||||||||||||||||
|
Total
GAAP
liabilities and equity
|
$
|
12,947
|
$
|
13,030
|
$
|
13,200
|
$
|
13,530
|
$
|
14,979
|
$
|
16,777
|
$
|
19,505
|
$
|
22,346
|
$
|
24,285
|
||||||||||
|
|
||||||||||||||||||||||||||||
|
Total
Redwood
debt
|
$
|
1,880
|
$
|
1,856
|
$
|
510
|
$
|
529
|
$
|
0
|
$
|
170
|
$
|
162
|
$
|
453
|
$
|
199
|
||||||||||
|
Junior
subordinated notes
|
100
|
100
|
-
|
-
|
-
|
-
|
-
|
-
|
-
|
|||||||||||||||||||
|
Redwood
obligations
|
$
|
1,980
|
$
|
1,956
|
$
|
510
|
$
|
529
|
$
|
0
|
$
|
170
|
$
|
162
|
$
|
453
|
$
|
199
|
||||||||||
|
|
||||||||||||||||||||||||||||
|
GAAP
stockholders' equity
|
$
|
924
|
$
|
1,003
|
$
|
1,043
|
$
|
1,004
|
$
|
967
|
$
|
935
|
$
|
1,016
|
$
|
992
|
$
|
948
|
||||||||||
|
|
||||||||||||||||||||||||||||
|
Redwood
obligations to equity
|
2.1
|
2.0
|
0.5
|
0.5
|
-
|
0.2
|
0.2
|
0.5
|
0.2
|
|||||||||||||||||||
|
Redwood
obligations to (equity + Redwood
obligations)
|
68
|
%
|
66
|
%
|
33
|
%
|
35
|
%
|
0
|
%
|
15
|
%
|
14
|
%
|
31
|
%
|
17
|
%
|
||||||||||
|
|
||||||||||||||||||||||||||||
|
Redwood
obligations
|
$
|
1,980
|
$
|
1,956
|
$
|
510
|
$
|
529
|
$
|
0
|
$
|
170
|
$
|
162
|
$
|
453
|
$
|
199
|
||||||||||
|
ABS
obligations of consolidated entities
|
9,947
|
9,979
|
11,554
|
11,898
|
13,930
|
15,585
|
18,237
|
20,815
|
23,057
|
|||||||||||||||||||
|
GAAP
debt
|
$
|
11,927
|
$
|
11,935
|
$
|
12,064
|
$
|
12,427
|
$
|
13,930
|
$
|
15,755
|
$
|
18,399
|
$
|
21,268
|
$
|
23,256
|
||||||||||
|
|
||||||||||||||||||||||||||||
|
GAAP
debt to
equity
|
12.9
|
11.9
|
11.6
|
12.4
|
14.4
|
16.9
|
18.1
|
21.4
|
24.5
|
|||||||||||||||||||
|
GAAP
debt to
(equity + GAAP debt)
|
93
|
%
|
92
|
%
|
92
|
%
|
93
|
%
|
94
|
%
|
94
|
%
|
95
|
%
|
96
|
%
|
96
|
%
|
||||||||||
|
|
Full
Year
|
Full
year
|
||||||||||||||||||||||||||||||||
|
|
Q1:2007
|
Q4:2006
|
Q3:2006
|
Q2:2006
|
Q1:2006
|
Q4:2005
|
Q3:2005
|
Q2:2005
|
Q1:2005
|
2006
|
2005
|
|||||||||||||||||||||||
|
|
||||||||||||||||||||||||||||||||||
|
GAAP
stockholders' equity
|
$
|
924,040
|
$
|
1,002,690
|
$
|
1,042,661
|
$
|
1,004,265
|
$
|
967,333
|
$
|
934,960
|
$
|
1,016,065
|
$
|
991,757
|
$
|
948,001
|
$
|
1,002,690
|
$
|
934,960
|
||||||||||||
|
Balance
sheet
mark-to-market adjustments
|
(6,183
|
)
|
93,158
|
94,780
|
90,937
|
81,591
|
73,731
|
117,043
|
137,380
|
124,784
|
93,158
|
73,731
|
||||||||||||||||||||||
|
Core
equity
|
$
|
930,223
|
$
|
909,532
|
$
|
947,881
|
$
|
913,328
|
$
|
885,742
|
$
|
861,229
|
$
|
899,022
|
$
|
854,377
|
$
|
823,217
|
$
|
909,532
|
$
|
861,229
|
||||||||||||
|
|
||||||||||||||||||||||||||||||||||
|
Shares
outstanding at quarter
end
|
27,129
|
26,733
|
26,053
|
25,668
|
25,382
|
25,133
|
24,764
|
24,647
|
24,514
|
26,733
|
25,133
|
|||||||||||||||||||||||
|
|
||||||||||||||||||||||||||||||||||
|
GAAP
equity
per share
|
$
|
34.06
|
$
|
37.51
|
$
|
40.02
|
$
|
39.13
|
$
|
38.11
|
$
|
37.20
|
$
|
41.03
|
$
|
40.24
|
$
|
38.67
|
$
|
37.51
|
$
|
37.20
|
||||||||||||
|
Core
equity
per share
|
$
|
34.29
|
$
|
34.02
|
$
|
36.38
|
$
|
35.58
|
$
|
34.90
|
$
|
34.27
|
$
|
36.30
|
$
|
34.66
|
$
|
33.58
|
$
|
34.02
|
$
|
34.27
|
||||||||||||
|
|
||||||||||||||||||||||||||||||||||
|
Net
interest
income
|
$
|
47,009
|
$
|
44,534
|
$
|
48,976
|
$
|
44,719
|
$
|
45,227
|
$
|
41,481
|
$
|
48,040
|
$
|
53,380
|
$
|
62,026
|
$
|
183,456
|
$
|
204,927
|
||||||||||||
|
Net
interest
income / average core
equity
|
20.3
|
%
|
19.3
|
%
|
21.0
|
%
|
19.9
|
%
|
20.6
|
%
|
18.8
|
%
|
21.8
|
%
|
25.4
|
%
|
31.2
|
%
|
20.2
|
%
|
24.1
|
%
|
||||||||||||
|
|
||||||||||||||||||||||||||||||||||
|
Operating
expenses (excluding
severance expense)
|
$
|
15,402
|
$
|
13,851
|
$
|
13,455
|
$
|
16,037
|
$
|
12,582
|
$
|
12,765
|
$
|
12,364
|
$
|
11,456
|
$
|
11,798
|
$
|
55,925
|
$
|
48,382
|
||||||||||||
|
|
||||||||||||||||||||||||||||||||||
|
Average
total
assets
|
$
|
12,865,979
|
$
|
13,041,794
|
$
|
13,480,361
|
$
|
14,168,755
|
$
|
15,839,483
|
$
|
18,348,681
|
$
|
20,991,299
|
$
|
23,365,553
|
$
|
24,563,184
|
$
|
14,123,149
|
$
|
21,797,922
|
||||||||||||
|
Average
total
equity
|
$
|
1,008,688
|
$
|
1,008,863
|
$
|
1,011,609
|
$
|
980,402
|
$
|
952,230
|
$
|
999,313
|
$
|
1,014,329
|
$
|
970,344
|
$
|
895,462
|
$
|
988,495
|
$
|
970,268
|
||||||||||||
|
|
||||||||||||||||||||||||||||||||||
|
Operating
expenses / net interest
income
|
32.8
|
%
|
31.1
|
%
|
27.5
|
%
|
35.9
|
%
|
27.8
|
%
|
30.8
|
%
|
25.7
|
%
|
21.5
|
%
|
19.0
|
%
|
30.5
|
%
|
23.6
|
%
|
||||||||||||
|
Operating
expenses / average
total assets
|
0.48
|
%
|
0.42
|
%
|
0.40
|
%
|
0.45
|
%
|
0.32
|
%
|
0.28
|
%
|
0.24
|
%
|
0.20
|
%
|
0.19
|
%
|
0.40
|
%
|
0.22
|
%
|
||||||||||||
|
Operating
expenses / average
total equity
|
6.1
|
%
|
5.5
|
%
|
5.3
|
%
|
6.5
|
%
|
5.3
|
%
|
5.1
|
%
|
4.9
|
%
|
4.7
|
%
|
5.3
|
%
|
5.7
|
%
|
5.0
|
%
|
||||||||||||
|
|
||||||||||||||||||||||||||||||||||
|
GAAP
net
income
|
$
|
18,309
|
$
|
35,691
|
$
|
32,416
|
$
|
31,410
|
$
|
28,015
|
$
|
42,495
|
$
|
55,899
|
$
|
40,915
|
$
|
60,563
|
$
|
127,532
|
$
|
199,872
|
||||||||||||
|
GAAP
net
Income / average total
assets
|
0.57
|
%
|
1.09
|
%
|
0.96
|
%
|
0.89
|
%
|
0.71
|
%
|
0.93
|
%
|
1.07
|
%
|
0.70
|
%
|
0.99
|
%
|
0.90
|
%
|
0.92
|
%
|
||||||||||||
|
GAAP
net
income / average equity
(GAAP ROE)
|
7.3
|
%
|
14.2
|
%
|
12.4
|
%
|
12.5
|
%
|
11.6
|
%
|
18.2
|
%
|
22.0
|
%
|
16.5
|
%
|
25.6
|
%
|
12.7
|
%
|
21.4
|
%
|
||||||||||||
|
GAAP
net
income / average core
equity (adjusted ROE)
|
7.9
|
%
|
15.5
|
%
|
13.9
|
%
|
14.0
|
%
|
12.8
|
%
|
19.3
|
%
|
25.4
|
%
|
19.5
|
%
|
30.5
|
%
|
14.0
|
%
|
23.5
|
%
|
||||||||||||
|
|
||||||||||||||||||||||||||||||||||
|
Core
earnings
|
29,807
|
30,276
|
31,983
|
25,417
|
29,885
|
24,594
|
30,967
|
37,872
|
45,468
|
117,561
|
138,901
|
|||||||||||||||||||||||
|
Average
core
equity
|
925,128
|
923,856
|
932,030
|
898,409
|
877,212
|
880,329
|
880,482
|
840,098
|
794,866
|
908,071
|
849,257
|
|||||||||||||||||||||||
|
Core
earnings
/ average core equity
(core adjusted ROE)
|
12.9
|
%
|
13.1
|
%
|
13.7
|
%
|
11.3
|
%
|
13.6
|
%
|
11.2
|
%
|
14.1
|
%
|
18.0
|
%
|
22.9
|
%
|
12.9
|
%
|
16.4
|
%
|
||||||||||||
|
|
||||||||||||||||||||||||||||||||||
|
Interest
income
|
$
|
215,105
|
$
|
217,391
|
$
|
223,649
|
$
|
218,238
|
$
|
225,882
|
$
|
231,139
|
$
|
244,631
|
$
|
248,505
|
$
|
237,923
|
$
|
885,160
|
$
|
962,197
|
||||||||||||
|
Average
consolidated earning
assets
|
$
|
12,279,814
|
$
|
12,498,889
|
$
|
12,860,488
|
$
|
13,581,710
|
$
|
15,229,790
|
$
|
17,542,352
|
$
|
20,085,392
|
$
|
22,606,037
|
$
|
24,042,561
|
$
|
13,533,367
|
$
|
21,048,582
|
||||||||||||
|
Asset
yield
|
7.01
|
%
|
6.96
|
%
|
6.96
|
%
|
6.43
|
%
|
5.93
|
%
|
5.27
|
%
|
4.87
|
%
|
4.40
|
%
|
3.96
|
%
|
6.54
|
%
|
4.57
|
%
|
||||||||||||
|
|
||||||||||||||||||||||||||||||||||
|
Interest
expense
|
($166,039
|
)
|
($172,434
|
)
|
($174,673
|
)
|
($173,519
|
)
|
($180,655
|
)
|
($189,657
|
)
|
($196,591
|
)
|
($195,125
|
)
|
($175,897
|
)
|
($701,281
|
)
|
($757,270
|
)
|
||||||||||||
|
Average
consolidated interest-bearing
liabilities
|
$
|
11,526,614
|
$
|
11,815,316
|
$
|
12,332,390
|
$
|
13,055,417
|
$
|
14,800,315
|
$
|
17,194,545
|
$
|
19,840,201
|
$
|
22,283,915
|
$
|
23,601,534
|
$
|
12,990,908
|
$
|
20,710,057
|
||||||||||||
|
Cost
of
funds
|
5.76
|
%
|
5.84
|
%
|
5.67
|
%
|
5.32
|
%
|
4.88
|
%
|
4.41
|
%
|
3.96
|
%
|
3.50
|
%
|
2.98
|
%
|
5.40
|
%
|
3.66
|
%
|
||||||||||||
|
|
||||||||||||||||||||||||||||||||||
|
Asset
yield
|
7.01
|
%
|
6.96
|
%
|
6.96
|
%
|
6.43
|
%
|
5.93
|
%
|
5.27
|
%
|
4.87
|
%
|
4.40
|
%
|
3.96
|
%
|
6.54
|
%
|
4.57
|
%
|
||||||||||||
|
Cost
of
funds
|
-5.76
|
%
|
-5.84
|
%
|
-5.67
|
%
|
-5.32
|
%
|
-4.88
|
%
|
-4.41
|
%
|
-3.96
|
%
|
-3.50
|
%
|
-2.98
|
%
|
-5.40
|
%
|
-3.66
|
%
|
||||||||||||
|
Interest
rate
spread
|
1.24
|
%
|
1.12
|
%
|
1.29
|
%
|
1.11
|
%
|
1.05
|
%
|
0.86
|
%
|
0.91
|
%
|
0.89
|
%
|
0.98
|
%
|
1.14
|
%
|
0.91
|
%
|
||||||||||||
|
|
||||||||||||||||||||||||||||||||||
|
Net
interest
income
|
$
|
47,009
|
$
|
44,534
|
$
|
48,976
|
$
|
44,719
|
$
|
45,227
|
$
|
41,481
|
$
|
48,040
|
$
|
53,380
|
$
|
62,026
|
$
|
183,456
|
$
|
204,927
|
||||||||||||
|
Average
consolidated earning
assets
|
$
|
12,279,814
|
$
|
12,498,889
|
$
|
12,860,488
|
$
|
13,581,710
|
$
|
15,229,790
|
$
|
17,542,352
|
$
|
20,085,392
|
$
|
22,606,037
|
$
|
24,042,561
|
$
|
13,533,367
|
$
|
21,048,582
|
||||||||||||
|
Net
interest
margin
|
1.53
|
%
|
1.43
|
%
|
1.52
|
%
|
1.32
|
%
|
1.19
|
%
|
0.95
|
%
|
0.96
|
%
|
0.94
|
%
|
1.03
|
%
|
1.36
|
%
|
0.97
|
%
|
||||||||||||
|
Table
8: Average
Balance Sheet
(in thousands)
|
||||||||||||||||||||||||||||||||||
|
|
Full
Year
|
Full
Year
|
||||||||||||||||||||||||||||||||
|
|
Q1:2007
|
Q4:2006
|
Q3:2006
|
Q2:2006
|
Q1:2006
|
Q4:2005
|
Q3:2005
|
Q2:2005
|
Q1:2005
|
2006
|
2005
|
|||||||||||||||||||||||
|
Average
GAAP balances
|
||||||||||||||||||||||||||||||||||
|
Residential
CES
|
$
|
673,114
|
$
|
654,909
|
$
|
641,694
|
$
|
573,253
|
$
|
516,962
|
$
|
517,138
|
$
|
567,689
|
$
|
531,456
|
$
|
473,562
|
$
|
597,206
|
$
|
522,704
|
||||||||||||
|
Residential
loans
|
8,704,147
|
9,212,346
|
9,947,068
|
10,789,275
|
12,542,519
|
14,821,587
|
17,597,906
|
20,312,485
|
21,925,643
|
10,611,827
|
18,642,020
|
|||||||||||||||||||||||
|
Residential
IGS
|
1,795,130
|
1,513,794
|
1,404,281
|
1,358,453
|
1,299,933
|
1,263,277
|
1,219,034
|
1,122,945
|
1,030,406
|
1,393,736
|
1,158,785
|
|||||||||||||||||||||||
|
Commercial
CES
|
426,121
|
364,405
|
328,211
|
253,429
|
215,769
|
191,586
|
152,641
|
123,390
|
102,699
|
290,964
|
142,850
|
|||||||||||||||||||||||
|
Commercial
loans
|
28,186
|
29,571
|
32,194
|
42,912
|
56,777
|
59,049
|
47,703
|
45,214
|
56,080
|
40,267
|
52,008
|
|||||||||||||||||||||||
|
Commercial
IGS
|
122,099
|
106,902
|
128,355
|
132,154
|
181,549
|
188,445
|
215,109
|
204,247
|
198,437
|
138,425
|
202,594
|
|||||||||||||||||||||||
|
CDO
CES
|
18,348
|
19,539
|
20,999
|
13,950
|
14,709
|
12,231
|
11,892
|
2,816
|
6,302
|
17,245
|
8,155
|
|||||||||||||||||||||||
|
CDO
IGS
|
230,684
|
198,749
|
174,363
|
171,687
|
157,570
|
149,660
|
138,996
|
138,777
|
124,747
|
175,358
|
138,207
|
|||||||||||||||||||||||
|
Other
real
estate investments
|
37,169
|
-
|
-
|
-
|
-
|
-
|
-
|
-
|
-
|
-
|
-
|
|||||||||||||||||||||||
|
Cash
and cash
equivalents
|
244,816
|
398,674
|
183,323
|
246,597
|
244,002
|
339,379
|
134,422
|
124,707
|
124,685
|
268,340
|
181,259
|
|||||||||||||||||||||||
|
Earning
assets
|
12,279,814
|
12,498,889
|
12,860,488
|
13,581,710
|
15,229,790
|
17,542,352
|
20,085,392
|
22,606,037
|
24,042,561
|
13,533,367
|
21,048,582
|
|||||||||||||||||||||||
|
Other
assets
|
586,165
|
542,905
|
619,873
|
587,045
|
609,693
|
806,329
|
905,907
|
759,516
|
520,623
|
589,782
|
749,342
|
|||||||||||||||||||||||
|
Total
assets
|
$
|
12,865,979
|
$
|
13,041,794
|
$
|
13,480,361
|
$
|
14,168,755
|
$
|
15,839,483
|
$
|
18,348,681
|
$
|
20,991,299
|
$
|
23,365,553
|
$
|
24,563,184
|
$
|
14,123,149
|
$
|
21,797,922
|
||||||||||||
|
|
||||||||||||||||||||||||||||||||||
|
Redwood
debt
|
$
|
2,188,561
|
$
|
1,090,480
|
$
|
647,978
|
$
|
85,616
|
$
|
137,181
|
$
|
253,302
|
$
|
297,788
|
$
|
216,639
|
$
|
277,423
|
$
|
493,357
|
$
|
261,322
|
||||||||||||
|
Junior
subordinated
notes
|
97,013
|
21,401
|
-
|
-
|
-
|
-
|
-
|
-
|
-
|
5,336
|
-
|
|||||||||||||||||||||||
|
ABS
obligations
of entities
|
9,338,053
|
10,724,837
|
11,684,412
|
12,969,801
|
14,663,134
|
16,941,243
|
19,542,413
|
22,067,276
|
23,324,111
|
12,497,551
|
20,448,735
|
|||||||||||||||||||||||
|
Other
liabilities
|
233,664
|
196,214
|
136,362
|
132,936
|
86,938
|
154,823
|
136,769
|
111,294
|
66,188
|
138,409
|
117,597
|
|||||||||||||||||||||||
|
Total
liabilities
|
11,857,291
|
12,032,931
|
12,468,752
|
13,188,353
|
14,887,253
|
17,349,368
|
19,976,970
|
22,395,209
|
23,667,722
|
13,134,653
|
20,827,654
|
|||||||||||||||||||||||
|
|
||||||||||||||||||||||||||||||||||
|
Core
equity
|
925,128
|
923,856
|
932,030
|
898,409
|
877,212
|
880,329
|
880,482
|
840,098
|
794,866
|
908,071
|
849,257
|
|||||||||||||||||||||||
|
Balance
sheet
mark-to-market
adjustments
|
83,560
|
85,007
|
79,579
|
81,993
|
75,018
|
118,984
|
133,847
|
130,246
|
100,596
|
80,424
|
121,011
|
|||||||||||||||||||||||
|
Total
equity
|
1,008,688
|
1,008,863
|
1,011,609
|
980,402
|
952,230
|
999,313
|
1,014,329
|
970,344
|
895,462
|
988,495
|
970,268
|
|||||||||||||||||||||||
|
Total
liabilities
and equity
|
$
|
12,865,979
|
$
|
13,041,794
|
$
|
13,480,361
|
$
|
14,168,755
|
$
|
15,839,483
|
$
|
18,348,681
|
$
|
20,991,299
|
$
|
23,365,553
|
$
|
24,563,184
|
$
|
14,123,149
|
$
|
21,797,922
|
||||||||||||
|
Table
9
-
Balances
&
Yields
by
Portfolio
(In
Thousands)
|
||||||||||||||||||||||||||||
|
Residential
IGS
|
||||||||||||||||||||||||||||
|
Q1:
2007
|
Q4:
2006
|
Q3:
2006
|
Q2:
2006
|
Q1:
2006
|
Q4:
2005
|
Q3:
2005
|
Q2:
2005
|
Q1:
2005
|
||||||||||||||||||||
|
Current
face
|
$
|
2,094,494
|
$
|
1,708,607
|
$
|
1,484,095
|
$
|
1,406,195
|
$
|
1,361,245
|
$
|
1,273,985
|
$
|
1,282,132
|
$
|
1,189,207
|
$
|
1,084,556
|
||||||||||
|
Unamortized
premium/
(discount)
|
(19,617
|
)
|
(16,382
|
)
|
(17,362
|
)
|
(18,788
|
)
|
(19,874
|
)
|
(11,595
|
)
|
(13,970
|
)
|
(12,165
|
)
|
(9,054
|
)
|
||||||||||
|
Credit
protection
|
-
|
-
|
-
|
-
|
-
|
-
|
-
|
-
|
-
|
|||||||||||||||||||
|
Unrealized
market
value
gains
|
(49,027
|
)
|
5,025
|
8,270
|
2,609
|
5,304
|
(2,300
|
)
|
11,082
|
16,252
|
11,895
|
|||||||||||||||||
|
Net
book
value
|
$
|
2,025,850
|
$
|
1,697,250
|
$
|
1,475,003
|
$
|
1,390,016
|
$
|
1,346,675
|
$
|
1,260,090
|
$
|
1,279,244
|
$
|
1,193,294
|
$
|
1,087,397
|
||||||||||
|
Average
balance
|
$
|
1,795,130
|
$
|
1,513,794
|
$
|
1,404,281
|
$
|
1,358,453
|
$
|
1,299,933
|
$
|
1,263,277
|
$
|
1,219,034
|
$
|
1,122,945
|
$
|
1,030,406
|
||||||||||
|
Interest
income
|
$
|
29,420
|
$
|
25,626
|
$
|
24,961
|
$
|
22,287
|
$
|
20,180
|
$
|
18,148
|
$
|
16,942
|
$
|
13,909
|
$
|
12,865
|
||||||||||
|
Yield
|
6.56
|
%
|
6.77
|
%
|
7.11
|
%
|
6.56
|
%
|
6.21
|
%
|
5.75
|
%
|
5.56
|
%
|
4.95
|
%
|
4.99
|
%
|
||||||||||
|
Residential
CES
|
||||||||||||||||||||||||||||
|
Q1:
2007
|
Q4:
2006
|
Q3:
2006
|
Q2:
2006
|
Q1:
2006
|
Q4:
2005
|
Q3:
2005
|
Q2:
2005
|
Q1:
2005
|
||||||||||||||||||||
|
Current
face
|
$
|
1,259,446
|
$
|
1,180,605
|
$
|
1,183,142
|
$
|
1,168,602
|
$
|
1,034,069
|
$
|
1,013,793
|
$
|
1,029,786
|
$
|
1,079,323
|
$
|
952,925
|
||||||||||
|
Unamortized
premium/
(discount)
|
(158,664
|
)
|
(144,842
|
)
|
(140,585
|
)
|
(116,702
|
)
|
(108,371
|
)
|
(121,824
|
)
|
(84,084
|
)
|
(90,716
|
)
|
(83,263
|
)
|
||||||||||
|
Credit
protection
|
(392,768
|
)
|
(372,247
|
)
|
(384,397
|
)
|
(425,578
|
)
|
(373,781
|
)
|
(354,610
|
)
|
(382,862
|
)
|
(404,180
|
)
|
(365,998
|
)
|
||||||||||
|
Unrealized
market
value
gains
|
44,263
|
58,015
|
57,495
|
50,854
|
43,522
|
55,193
|
80,867
|
99,380
|
84,096
|
|||||||||||||||||||
|
Net
book
value
|
$
|
752,277
|
$
|
721,531
|
$
|
715,655
|
$
|
677,176
|
$
|
595,439
|
$
|
592,552
|
$
|
643,707
|
$
|
683,807
|
$
|
587,760
|
||||||||||
|
Average
balance
|
$
|
673,114
|
$
|
654,909
|
$
|
641,694
|
$
|
573,253
|
$
|
516,962
|
$
|
517,138
|
$
|
567,689
|
$
|
531,456
|
$
|
473,562
|
||||||||||
|
Interest
income
|
$
|
37,664
|
$
|
35,650
|
$
|
34,585
|
$
|
28,059
|
$
|
26,245
|
$
|
22,556
|
$
|
23,640
|
$
|
18,778
|
$
|
18,850
|
||||||||||
|
Yield
|
22.38
|
%
|
21.77
|
%
|
21.56
|
%
|
19.58
|
%
|
20.31
|
%
|
17.45
|
%
|
16.66
|
%
|
14.13
|
%
|
15.92
|
%
|
||||||||||
|
Other
Real
Estate
Investments
|
||||||||||||||||||||||||||||
|
Q1:
2007
|
Q4:
2006
|
Q3:
2006
|
Q2:
2006
|
Q1:
2006
|
Q4:
2005
|
Q3:
2005
|
Q2:
2005
|
Q1:
2005
|
||||||||||||||||||||
|
Current
face
|
$
|
38,670
|
$
|
0
|
$
|
0
|
$
|
0
|
$
|
0
|
$
|
0
|
$
|
0
|
$
|
0
|
$
|
0
|
||||||||||
|
Unamortized
premium/
(discount)
|
16,375
|
-
|
-
|
-
|
-
|
-
|
-
|
-
|
-
|
|||||||||||||||||||
|
Credit
protection
|
-
|
-
|
-
|
-
|
-
|
-
|
-
|
-
|
-
|
|||||||||||||||||||
|
Unrealized
market
value
gains
|
(4,988
|
)
|
-
|
-
|
-
|
-
|
-
|
-
|
-
|
-
|
||||||||||||||||||
|
Net
book
value
|
$
|
50,057
|
$
|
0
|
$
|
0
|
$
|
0
|
$
|
0
|
$
|
0
|
$
|
0
|
$
|
0
|
$
|
0
|
||||||||||
|
-
|
-
|
-
|
-
|
-
|
-
|
-
|
-
|
|||||||||||||||||||||
|
Average
balance
|
$
|
37,169
|
-
|
-
|
-
|
-
|
-
|
-
|
-
|
-
|
||||||||||||||||||
|
Interest
income
|
$
|
2,465
|
-
|
-
|
-
|
-
|
-
|
-
|
-
|
-
|
||||||||||||||||||
|
Yield
|
26.53
|
%
|
0.00
|
%
|
0.00
|
%
|
0.00
|
%
|
0.00
|
%
|
0.00
|
%
|
0.00
|
%
|
0.00
|
%
|
0.00
|
%
|
||||||||||
|
Residential
Real
Estate
Loans
|
||||||||||||||||||||||||||||
|
Q1:
2007
|
Q4:
2006
|
Q3:
2006
|
Q2:
2006
|
Q1:
2006
|
Q4:
2005
|
Q3:
2005
|
Q2:
2005
|
Q1:
2005
|
||||||||||||||||||||
|
Current
face
|
$
|
8,582,964
|
$
|
9,212,002
|
$
|
9,718,985
|
$
|
10,318,641
|
$
|
11,846,454
|
$
|
13,719,242
|
$
|
16,386,833
|
$
|
19,443,387
|
$
|
21,579,671
|
||||||||||
|
Unamortized
premium/
(discount)
|
117,477
|
132,052
|
143,135
|
155,101
|
166,134
|
178,206
|
191,513
|
210,137
|
217,852
|
|||||||||||||||||||
|
Credit
protection
|
(19,954
|
)
|
(20,119
|
)
|
(19,326
|
)
|
(19,450
|
)
|
(22,372
|
)
|
(22,656
|
)
|
(22,029
|
)
|
(22,959
|
)
|
(24,827
|
)
|
||||||||||
|
Unrealized
market
value
gains
|
-
|
-
|
-
|
-
|
-
|
-
|
-
|
-
|
-
|
|||||||||||||||||||
|
Net
book
value
|
$
|
8,680,487
|
$
|
9,323,935
|
$
|
9,842,794
|
$
|
10,454,292
|
$
|
11,990,216
|
$
|
13,874,792
|
$
|
16,556,317
|
$
|
19,630,565
|
$
|
21,772,696
|
||||||||||
|
Average
balance
|
$
|
8,704,147
|
$
|
9,212,346
|
$
|
9,947,068
|
$
|
10,789,275
|
$
|
12,542,519
|
$
|
14,821,587
|
$
|
17,597,906
|
$
|
20,312,485
|
$
|
21,925,643
|
||||||||||
|
Interest
income
|
$
|
129,143
|
$
|
137,568
|
$
|
148,494
|
$
|
154,160
|
$
|
165,664
|
$
|
176,599
|
$
|
193,621
|
$
|
206,263
|
$
|
197,701
|
||||||||||
|
Yield
|
5.93
|
%
|
5.97
|
%
|
5.97
|
%
|
5.72
|
%
|
5.28
|
%
|
4.77
|
%
|
4.40
|
%
|
4.06
|
%
|
3.61
|
%
|
||||||||||
|
Table
9
-
Balances
&
Yields
by
Portfolio
(In
Thousands)
|
||||||||||||||||||||||||||||
|
Commercial
CES
|
||||||||||||||||||||||||||||
|
Q1:
2007
|
Q4:
2006
|
Q3:
2006
|
Q2:
2006
|
Q1:
2006
|
Q4:
2005
|
Q3:
2005
|
Q2:
2005
|
Q1:
2005
|
||||||||||||||||||||
|
Current
face
|
$
|
792,240
|
$
|
793,743
|
$
|
667,512
|
$
|
486,622
|
$
|
407,466
|
$
|
383,334
|
$
|
323,724
|
$
|
222,522
|
$
|
218,991
|
||||||||||
|
Unamortized
premium/
(discount)
|
(71,455
|
)
|
(71,424
|
)
|
(48,712
|
)
|
(28,184
|
)
|
(20,473
|
)
|
(28,993
|
)
|
(2,428
|
)
|
(8,062
|
)
|
(7,241
|
)
|
||||||||||
|
Credit
protection
|
(294,466
|
)
|
(295,340
|
)
|
(258,382
|
)
|
(192,134
|
)
|
(167,772
|
)
|
(141,806
|
)
|
(138,530
|
)
|
(87,210
|
)
|
(88,671
|
)
|
||||||||||
|
Unrealized
market
value
gains
|
9,063
|
21,081
|
19,449
|
4,939
|
4,081
|
6,321
|
4,462
|
10,779
|
4,608
|
|||||||||||||||||||
|
Net
book
value
|
$
|
435,382
|
$
|
448,060
|
$
|
379,867
|
$
|
271,243
|
$
|
223,302
|
$
|
218,856
|
$
|
187,228
|
$
|
138,029
|
$
|
127,687
|
||||||||||
|
Average
balance
|
$
|
426,121
|
$
|
364,405
|
$
|
328,211
|
$
|
253,429
|
$
|
215,769
|
$
|
191,586
|
$
|
152,641
|
$
|
123,390
|
$
|
102,699
|
||||||||||
|
Interest
income
|
$
|
10,140
|
$
|
8,170
|
$
|
7,381
|
$
|
5,581
|
$
|
4,268
|
$
|
3,927
|
$
|
2,747
|
$
|
2,811
|
$
|
1,987
|
||||||||||
|
Yield
|
9.52
|
%
|
8.97
|
%
|
9.00
|
%
|
8.81
|
%
|
7.91
|
%
|
8.20
|
%
|
7.20
|
%
|
9.11
|
%
|
7.74
|
%
|
||||||||||
|
Commercial
IGS
|
||||||||||||||||||||||||||||
|
Q1:
2007
|
Q4:
2006
|
Q3:
2006
|
Q2:
2006
|
Q1:
2006
|
Q4:
2005
|
Q3:
2005
|
Q2:
2005
|
Q1:
2005
|
||||||||||||||||||||
|
Current
face
|
$
|
121,737
|
$
|
122,869
|
$
|
133,361
|
$
|
134,244
|
$
|
182,041
|
$
|
180,213
|
$
|
209,524
|
$
|
199,957
|
$
|
192,551
|
||||||||||
|
Unamortized
premium/
(discount)
|
(3,172
|
)
|
(3,367
|
)
|
701
|
727
|
5,295
|
8,100
|
13,303
|
14,129
|
14,561
|
|||||||||||||||||
|
Credit
protection
|
-
|
-
|
-
|
-
|
-
|
-
|
-
|
-
|
-
|
|||||||||||||||||||
|
Unrealized
market
value
gains
|
(2,071
|
)
|
111
|
577
|
(3,937
|
)
|
(2,936
|
)
|
(3,281
|
)
|
(44
|
)
|
3,762
|
(522
|
)
|
|||||||||||||
|
Net
book
value
|
$
|
116,494
|
$
|
119,613
|
$
|
134,639
|
$
|
131,034
|
$
|
184,400
|
$
|
185,032
|
$
|
222,783
|
$
|
217,848
|
$
|
206,590
|
||||||||||
|
Average
balance
|
$
|
122,099
|
$
|
106,902
|
$
|
128,355
|
$
|
132,154
|
$
|
181,549
|
$
|
188,445
|
$
|
215,109
|
$
|
204,247
|
$
|
198,437
|
||||||||||
|
Interest
income
|
$
|
1,875
|
$
|
2,344
|
$
|
2,342
|
$
|
2,133
|
$
|
2,880
|
$
|
3,102
|
$
|
3,398
|
$
|
3,036
|
$
|
2,922
|
||||||||||
|
Yield
|
6.14
|
%
|
8.77
|
%
|
7.30
|
%
|
6.46
|
%
|
6.35
|
%
|
6.58
|
%
|
6.32
|
%
|
5.95
|
%
|
5.89
|
%
|
||||||||||
|
Commercial
Loans
|
||||||||||||||||||||||||||||
|
Q1:
2007
|
Q4:
2006
|
Q3:
2006
|
Q2:
2006
|
Q1:
2006
|
Q4:
2005
|
Q3:
2005
|
Q2:
2005
|
Q1:
2005
|
||||||||||||||||||||
|
Current
face
|
$
|
38,394
|
$
|
38,360
|
$
|
42,384
|
$
|
46,959
|
$
|
65,508
|
$
|
70,091
|
$
|
66,348
|
$
|
51,778
|
$
|
67,365
|
||||||||||
|
Unamortized
premium/
(discount)
|
(2,022
|
)
|
(2,047
|
)
|
(2,073
|
)
|
(2,096
|
)
|
(2,200
|
)
|
(2,258
|
)
|
(2,105
|
)
|
(1,843
|
)
|
(2,305
|
)
|
||||||||||
|
Credit
protection
|
(10,489
|
)
|
(8,141
|
)
|
(8,141
|
)
|
(8,141
|
)
|
(8,141
|
)
|
(8,141
|
)
|
(8,141
|
)
|
(8,141
|
)
|
(8,456
|
)
|
||||||||||
|
Unrealized
market
value
gains
|
-
|
-
|
-
|
-
|
-
|
-
|
-
|
-
|
-
|
|||||||||||||||||||
|
Net
book
value
|
$
|
25,883
|
$
|
28,172
|
$
|
32,170
|
$
|
36,722
|
$
|
55,167
|
$
|
59,692
|
$
|
56,102
|
$
|
41,794
|
$
|
56,604
|
||||||||||
|
Average
balance
|
$
|
28,186
|
$
|
29,571
|
$
|
32,194
|
$
|
42,912
|
$
|
56,777
|
$
|
59,049
|
$
|
47,703
|
$
|
45,214
|
$
|
56,080
|
||||||||||
|
Interest
(loss)
income
|
-$2,293
|
$
|
409
|
$
|
524
|
$
|
812
|
$
|
1,238
|
$
|
1,281
|
$
|
1,209
|
$
|
1,208
|
$
|
1,587
|
|||||||||||
|
Yield
|
-32.54
|
%
|
5.53
|
%
|
6.51
|
%
|
7.57
|
%
|
8.72
|
%
|
8.68
|
%
|
10.14
|
%
|
10.69
|
%
|
11.32
|
%
|
||||||||||
|
CDO
CES
|
||||||||||||||||||||||||||||
|
Q1:
2007
|
Q4:
2006
|
Q3:
2006
|
Q2:
2006
|
Q1:
2006
|
Q4:
2005
|
Q3:
2005
|
Q2:
2005
|
Q1:
2005
|
||||||||||||||||||||
|
Current
face
|
$
|
23,731
|
$
|
28,731
|
$
|
29,231
|
$
|
22,226
|
$
|
23,226
|
$
|
20,226
|
$
|
20,226
|
$
|
10,184
|
$
|
10,184
|
||||||||||
|
Unamortized
premium/
(discount)
|
(7,004
|
)
|
(6,889
|
)
|
(7,298
|
)
|
(7,978
|
)
|
(8,048
|
)
|
(8,004
|
)
|
(7,907
|
)
|
(7,232
|
)
|
(7,113
|
)
|
||||||||||
|
Credit
protection
|
-
|
-
|
-
|
-
|
-
|
-
|
-
|
-
|
-
|
|||||||||||||||||||
|
Unrealized
market
value
gains
|
(575
|
)
|
122
|
326
|
470
|
(436
|
)
|
(484
|
)
|
144
|
(187
|
)
|
(287
|
)
|
||||||||||||||
|
Net
book
value
|
$
|
16,152
|
$
|
21,964
|
$
|
22,259
|
$
|
14,718
|
$
|
14,742
|
$
|
11,738
|
$
|
12,463
|
$
|
2,765
|
$
|
2,784
|
||||||||||
|
Average
balance
|
$
|
18,348
|
$
|
19,539
|
$
|
20,999
|
$
|
13,950
|
$
|
14,709
|
$
|
12,231
|
$
|
11,892
|
$
|
2,816
|
$
|
6,302
|
||||||||||
|
Interest
income
|
$
|
497
|
$
|
570
|
$
|
609
|
$
|
236
|
$
|
439
|
$
|
125
|
$
|
131
|
$
|
127
|
$
|
246
|
||||||||||
|
Yield
|
10.84
|
%
|
11.67
|
%
|
11.60
|
%
|
6.77
|
%
|
11.94
|
%
|
4.09
|
%
|
4.41
|
%
|
18.04
|
%
|
15.61
|
%
|
||||||||||
|
Table
9
-
Balances
&
Yields
by
Portfolio
(In
Thousands)
|
||||||||||||||||||||||||||||
|
CDO
IGS
|
||||||||||||||||||||||||||||
|
Q1:
2007
|
Q4:
2006
|
Q3:
2006
|
Q2:
2006
|
Q1:
2006
|
Q4:
2005
|
Q3:
2005
|
Q2:
2005
|
Q1:
2005
|
||||||||||||||||||||
|
Current
face
|
$
|
263,237
|
$
|
222,413
|
$
|
182,352
|
$
|
175,586
|
$
|
162,844
|
$
|
149,812
|
$
|
144,246
|
$
|
145,933
|
$
|
130,686
|
||||||||||
|
Unamortized
premium/
(discount)
|
(945
|
)
|
(238
|
)
|
(236
|
)
|
(241
|
)
|
(249
|
)
|
(257
|
)
|
(264
|
)
|
(470
|
)
|
(485
|
)
|
||||||||||
|
Credit
protection
|
-
|
-
|
-
|
-
|
-
|
-
|
-
|
-
|
-
|
|||||||||||||||||||
|
Unrealized
market
value
gains
|
(7,985
|
)
|
2,174
|
2,826
|
1,718
|
944
|
1,092
|
2,362
|
3,221
|
2,922
|
||||||||||||||||||
|
Net
book
value
|
$
|
254,307
|
$
|
224,349
|
$
|
184,942
|
$
|
177,063
|
$
|
163,539
|
$
|
150,647
|
$
|
146,344
|
$
|
148,684
|
$
|
133,123
|
||||||||||
|
Average
balance
|
$
|
230,684
|
$
|
198,749
|
$
|
174,363
|
$
|
171,687
|
$
|
157,570
|
$
|
149,660
|
$
|
138,996
|
$
|
138,777
|
$
|
124,747
|
||||||||||
|
Interest
income
|
$
|
3,862
|
$
|
3,335
|
$
|
2,881
|
$
|
2,099
|
$
|
2,491
|
$
|
2,571
|
$
|
1,953
|
$
|
1,569
|
$
|
1,184
|
||||||||||
|
Yield
|
6.70
|
%
|
6.71
|
%
|
6.61
|
%
|
4.89
|
%
|
6.32
|
%
|
6.87
|
%
|
5.62
|
%
|
4.52
|
%
|
3.80
|
%
|
||||||||||
|
Cash
&
Equivalents
|
||||||||||||||||||||||||||||
|
Q1:
2007
|
Q4:
2006
|
Q3:
2006
|
Q2:
2006
|
Q1:
2006
|
Q4:
2005
|
Q3:
2005
|
Q2:
2005
|
Q1:
2005
|
||||||||||||||||||||
|
Current
face
|
$
|
91,656
|
$
|
168,016
|
$
|
112,926
|
$
|
106,491
|
$
|
85,466
|
$
|
175,885
|
$
|
163,160
|
$
|
72,193
|
$
|
64,714
|
||||||||||
|
Unamortized
premium/
(discount)
|
-
|
-
|
-
|
-
|
-
|
-
|
-
|
-
|
-
|
|||||||||||||||||||
|
Credit
protection
|
-
|
-
|
-
|
-
|
-
|
-
|
-
|
-
|
-
|
|||||||||||||||||||
|
Unrealized
market
value
gains
|
-
|
-
|
-
|
-
|
-
|
-
|
-
|
-
|
-
|
|||||||||||||||||||
|
Net
book
value
|
$
|
91,656
|
$
|
168,016
|
$
|
112,926
|
$
|
106,491
|
$
|
85,466
|
$
|
175,885
|
$
|
163,160
|
$
|
72,193
|
$
|
64,714
|
||||||||||
|
Average
balance
|
$
|
244,816
|
$
|
398,674
|
$
|
183,323
|
$
|
246,597
|
$
|
244,002
|
$
|
339,379
|
$
|
134,422
|
$
|
124,707
|
$
|
124,685
|
||||||||||
|
Interest
income
|
$
|
2,332
|
$
|
3,719
|
$
|
1,872
|
$
|
2,871
|
$
|
2,477
|
$
|
2,830
|
$
|
990
|
$
|
804
|
$
|
580
|
||||||||||
|
Yield
|
3.81
|
%
|
3.73
|
%
|
4.08
|
%
|
4.66
|
%
|
4.06
|
%
|
3.34
|
%
|
2.95
|
%
|
2.58
|
%
|
1.86
|
%
|
||||||||||
|
Total
Earning
Assets
(GAAP)
|
||||||||||||||||||||||||||||
|
Q1:
2007
|
Q4:
2006
|
Q3:
2006
|
Q2:
2006
|
Q1:
2006
|
Q4:
2005
|
Q3:
2005
|
Q2:
2005
|
Q1:
2005
|
||||||||||||||||||||
|
Current
face
|
$
|
13,306,569
|
$
|
13,475,346
|
$
|
13,553,988
|
$
|
13,865,566
|
$
|
15,168,319
|
$
|
16,986,581
|
$
|
19,625,979
|
$
|
22,414,484
|
$
|
24,301,643
|
||||||||||
|
Unamortized
premium/
(discount)
|
(129,027
|
)
|
(113,137
|
)
|
(72,430
|
)
|
(18,161
|
)
|
12,214
|
13,375
|
94,058
|
103,778
|
122,952
|
|||||||||||||||
|
Credit
protection
|
(717,677
|
)
|
(695,847
|
)
|
(670,246
|
)
|
(645,303
|
)
|
(572,066
|
)
|
(527,213
|
)
|
(551,562
|
)
|
(522,490
|
)
|
(487,952
|
)
|
||||||||||
|
Unrealized
market
value
gains
|
(11,320
|
)
|
86,528
|
88,943
|
56,653
|
50,479
|
56,541
|
98,873
|
133,207
|
102,712
|
||||||||||||||||||
|
Net
book
value
|
$
|
12,448,545
|
$
|
12,752,890
|
$
|
12,900,255
|
$
|
13,258,755
|
$
|
14,658,946
|
$
|
16,529,284
|
$
|
19,267,348
|
$
|
22,128,979
|
$
|
24,039,355
|
||||||||||
|
Average
balance
|
$
|
12,279,814
|
$
|
12,498,889
|
$
|
12,860,487
|
$
|
13,581,710
|
$
|
15,229,790
|
$
|
17,542,352
|
$
|
20,085,392
|
$
|
22,606,037
|
$
|
24,042,561
|
||||||||||
|
Interest
income
|
$
|
215,105
|
$
|
217,391
|
$
|
223,649
|
$
|
218,238
|
$
|
225,882
|
$
|
231,139
|
$
|
244,631
|
$
|
248,505
|
$
|
237,922
|
||||||||||
|
Yield
|
7.01
|
%
|
6.96
|
%
|
6.96
|
%
|
6.43
|
%
|
5.93
|
%
|
5.27
|
%
|
4.87
|
%
|
4.40
|
%
|
3.96
|
%
|
||||||||||
|
Table
10:
Portfolio
Activity
(in
thousands)
|
||||||||||||||||||||||||||||
|
Residential
IGS
|
||||||||||||||||||||||||||||
|
Q1:
2007
|
Q4:
2006
|
Q3:
2006
|
Q2:
2006
|
Q1:
2006
|
Q4:
2005
|
Q3:
2005
|
Q2:
2005
|
Q1:
2005
|
||||||||||||||||||||
|
Beginning
balance
|
$
|
1,697,250
|
$
|
1,475,002
|
$
|
1,390,015
|
$
|
1,346,674
|
$
|
1,260,089
|
$
|
1,279,243
|
$
|
1,193,293
|
$
|
1,087,396
|
$
|
973,884
|
||||||||||
|
Acquisitions
|
535,346
|
352,292
|
120,316
|
179,115
|
80,970
|
116,987
|
114,699
|
128,708
|
120,709
|
|||||||||||||||||||
|
Upgrades
/
downgrades
|
-
|
-
|
-
|
-
|
30,667
|
-
|
-
|
-
|
23,701
|
|||||||||||||||||||
|
Transfer
to
other
portfolios
|
(13,816
|
)
|
-
|
-
|
-
|
-
|
-
|
-
|
-
|
-
|
||||||||||||||||||
|
Sales
|
(108,372
|
)
|
(97,124
|
)
|
(12,669
|
)
|
(104,442
|
)
|
(3,984
|
)
|
(95,328
|
)
|
4,000
|
(3,012
|
)
|
(11,488
|
)
|
|||||||||||
|
Principal
payments
|
(32,248
|
)
|
(31,398
|
)
|
(29,997
|
)
|
(31,136
|
)
|
(25,445
|
)
|
(29,834
|
)
|
(27,627
|
)
|
(22,961
|
)
|
(22,345
|
)
|
||||||||||
|
Discount
/
(premium)
amortization
|
1,321
|
1,023
|
1,943
|
1,446
|
853
|
790
|
761
|
347
|
547
|
|||||||||||||||||||
|
Net
mark-to-market
adjustment
|
(53,631
|
)
|
(2,545
|
)
|
5,394
|
(1,642
|
)
|
3,524
|
(11,769
|
)
|
(5,883
|
)
|
2,815
|
2,388
|
||||||||||||||
|
Ending
Balance
|
$
|
2,025,850
|
$
|
1,697,250
|
$
|
1,475,002
|
$
|
1,390,015
|
$
|
1,346,674
|
$
|
1,260,089
|
$
|
1,279,243
|
$
|
1,193,293
|
$
|
1,087,396
|
||||||||||
|
Residential
CES
|
||||||||||||||||||||||||||||
|
Q1:
2007
|
Q4:
2006
|
Q3:
2006
|
Q2:
2006
|
Q1:
2006
|
Q4:
2005
|
Q3:
2005
|
Q2:
2005
|
Q1:
2005
|
||||||||||||||||||||
|
Beginning
balance
|
$
|
721,531
|
$
|
715,655
|
$
|
677,176
|
$
|
595,439
|
$
|
592,552
|
$
|
566,450
|
$
|
470,403
|
$
|
510,503
|
$
|
561,658
|
||||||||||
|
Acquisitions
|
73,725
|
20,870
|
87,305
|
89,217
|
52,822
|
67,796
|
87,864
|
57,479
|
54,664
|
|||||||||||||||||||
|
Upgrades
/
downgrades
|
-
|
-
|
-
|
-
|
(30,667
|
)
|
(23,701
|
)
|
-
|
-
|
-
|
|||||||||||||||||
|
Transfer
to
other
portfolios
|
(4,480
|
)
|
-
|
-
|
-
|
-
|
-
|
-
|
-
|
-
|
||||||||||||||||||
|
Sales
|
(5,214
|
)
|
(962
|
)
|
(47,585
|
)
|
(4,035
|
)
|
(9,650
|
)
|
(27,293
|
)
|
-
|
(98,775
|
)
|
(81,292
|
)
|
|||||||||||
|
Principal
payments
|
(35,672
|
)
|
(32,639
|
)
|
(28,835
|
)
|
(23,302
|
)
|
(14,110
|
)
|
(23,156
|
)
|
(18,931
|
)
|
(17,013
|
)
|
(21,523
|
)
|
||||||||||
|
Discount
/
(premium)
amortization
|
18,892
|
17,412
|
15,917
|
11,684
|
12,391
|
8,252
|
7,424
|
10,766
|
10,098
|
|||||||||||||||||||
|
Net
mark-to-market
adjustment
|
(16,505
|
)
|
1,195
|
11,677
|
8,173
|
(7,899
|
)
|
24,204
|
19,690
|
7,443
|
(13,102
|
)
|
||||||||||||||||
|
Ending
balance
|
$
|
752,277
|
$
|
721,531
|
$
|
715,655
|
$
|
677,176
|
$
|
595,439
|
$
|
592,552
|
$
|
566,450
|
$
|
470,403
|
$
|
510,503
|
||||||||||
|
Other
Real
Estate
Investments
|
||||||||||||||||||||||||||||
|
Q1:
2007
|
Q4:
2006
|
Q3:
2006
|
Q2:
2006
|
Q1:
2006
|
Q4:
2005
|
Q3:
2005
|
Q2:
2005
|
Q1:
2005
|
||||||||||||||||||||
|
Beginning
balance
|
$
|
0
|
$
|
0
|
$
|
0
|
$
|
0
|
$
|
0
|
$
|
0
|
$
|
0
|
$
|
0
|
$
|
0
|
||||||||||
|
Acquisitions
|
40,790
|
-
|
-
|
-
|
-
|
-
|
-
|
-
|
-
|
|||||||||||||||||||
|
Upgrades
/
downgrades
|
-
|
-
|
-
|
-
|
-
|
-
|
-
|
-
|
-
|
|||||||||||||||||||
|
Transfer
from
other
portfolios
|
18,296
|
-
|
-
|
-
|
-
|
-
|
-
|
-
|
-
|
|||||||||||||||||||
|
Sales
|
-
|
-
|
-
|
-
|
-
|
-
|
-
|
-
|
-
|
|||||||||||||||||||
|
Principal
payments
|
(3,079
|
)
|
-
|
-
|
-
|
-
|
-
|
-
|
-
|
-
|
||||||||||||||||||
|
Discount
/
(premium)
amortization
|
(532
|
)
|
-
|
-
|
-
|
-
|
-
|
-
|
-
|
-
|
||||||||||||||||||
|
Net
mark-to-market
adjustment
|
(5,418
|
)
|
-
|
-
|
-
|
-
|
-
|
-
|
-
|
-
|
||||||||||||||||||
|
Ending
balance
|
$
|
50,057
|
$
|
0
|
$
|
0
|
$
|
0
|
$
|
0
|
$
|
0
|
$
|
0
|
$
|
0
|
$
|
0
|
||||||||||
|
Table
10:
Portfolio
Activity
(in
thousands)
|
||||||||||||||||||||||||||||
|
Real
Estate
Loans
|
||||||||||||||||||||||||||||
|
Q1:
2007
|
Q4:
2006
|
Q3:
2006
|
Q2:
2006
|
Q1:
2006
|
Q4:
2005
|
Q3:
2005
|
Q2:
2005
|
Q1:
2005
|
||||||||||||||||||||
|
Beginning
balance
|
$
|
9,323,935
|
$
|
9,842,794
|
$
|
10,454,292
|
$
|
11,990,216
|
$
|
13,874,792
|
$
|
16,556,317
|
$
|
19,630,565
|
$
|
21,772,696
|
$
|
22,504,765
|
||||||||||
|
Acquisitions
|
415,283
|
725,695
|
966,673
|
272,627
|
52,691
|
271,875
|
332,049
|
426,933
|
832,383
|
|||||||||||||||||||
|
Sales
|
-
|
-
|
-
|
-
|
-
|
(240,987
|
)
|
(263,079
|
)
|
(3,378
|
)
|
-
|
||||||||||||||||
|
Principal
payments
|
(1,047,170
|
)
|
(1,230,545
|
)
|
(1,567,041
|
)
|
(1,799,401
|
)
|
(1,925,475
|
)
|
(2,698,500
|
)
|
(3,129,492
|
)
|
(2,557,675
|
)
|
(1,555,752
|
)
|
||||||||||
|
Discount
/
(premium)
amortization
|
(11,726
|
)
|
(13,298
|
)
|
(11,254
|
)
|
(12,073
|
)
|
(12,075
|
)
|
(13,334
|
)
|
(14,438
|
)
|
(9,758
|
)
|
(7,644
|
)
|
||||||||||
|
Credit
provision
|
(1,481
|
)
|
(1,505
|
)
|
(465
|
)
|
2,507
|
(141
|
)
|
(877
|
)
|
805
|
1,527
|
(1,210
|
)
|
|||||||||||||
|
Net
charge-offs
/
(recoveries)
|
1,646
|
794
|
589
|
416
|
424
|
250
|
125
|
(34
|
)
|
154
|
||||||||||||||||||
|
Net
mark-to-market
adjustment
|
-
|
-
|
-
|
-
|
-
|
48
|
(218
|
)
|
254
|
-
|
||||||||||||||||||
|
Ending
balance
|
$
|
8,680,487
|
$
|
9,323,935
|
$
|
9,842,794
|
$
|
10,454,292
|
$
|
11,990,216
|
$
|
13,874,792
|
$
|
16,556,317
|
$
|
19,630,565
|
$
|
21,772,696
|
||||||||||
|
Commercial
CES
|
||||||||||||||||||||||||||||
|
Q1:
2007
|
Q4:
2006
|
Q3:
2006
|
Q2:
2006
|
Q1:
2006
|
Q4:
2005
|
Q3:
2005
|
Q2:
2005
|
Q1:
2005
|
||||||||||||||||||||
|
Beginning
balance
|
$
|
448,060
|
$
|
379,867
|
$
|
271,243
|
$
|
223,302
|
$
|
218,856
|
$
|
187,228
|
$
|
138,029
|
$
|
127,687
|
$
|
87,250
|
||||||||||
|
Acquisitions
|
2,743
|
76,496
|
99,065
|
51,978
|
11,130
|
30,293
|
55,941
|
4,263
|
41,072
|
|||||||||||||||||||
|
Upgrades
/
downgrades
|
(3,501
|
)
|
-
|
-
|
-
|
(3,966
|
)
|
-
|
-
|
-
|
(2,192
|
)
|
||||||||||||||||
|
Sales
|
-
|
(9,914
|
)
|
(4,216
|
)
|
(2,820
|
)
|
-
|
-
|
-
|
-
|
-
|
||||||||||||||||
|
Principal
payments
|
-
|
(13
|
)
|
(9
|
)
|
(9
|
)
|
(10
|
)
|
(9
|
)
|
(8
|
)
|
(8
|
)
|
(10
|
)
|
|||||||||||
|
Discount
/
(premium)
amortization
|
(9
|
)
|
(289
|
)
|
(451
|
)
|
(257
|
)
|
(564
|
)
|
(276
|
)
|
(416
|
)
|
68
|
(174
|
)
|
|||||||||||
|
Net
mark-to-market
adjustment
|
(11,911
|
)
|
1,913
|
14,235
|
(951
|
)
|
(2,144
|
)
|
1,620
|
(6,318
|
)
|
6,019
|
1,741
|
|||||||||||||||
|
Ending
Balance
|
$
|
435,382
|
$
|
448,060
|
$
|
379,867
|
$
|
271,243
|
$
|
223,302
|
$
|
218,856
|
$
|
187,228
|
$
|
138,029
|
$
|
127,687
|
||||||||||
|
Commercial
Loans
|
||||||||||||||||||||||||||||
|
Q1:
2007
|
Q4:
2006
|
Q3:
2006
|
Q2:
2006
|
Q1:
2006
|
Q4:
2005
|
Q3:
2005
|
Q2:
2005
|
Q1:
2005
|
||||||||||||||||||||
|
Beginning
balance
|
$
|
28,172
|
$
|
32,170
|
$
|
36,722
|
$
|
55,167
|
$
|
59,692
|
$
|
56,102
|
$
|
41,794
|
$
|
56,604
|
$
|
54,479
|
||||||||||
|
Acquisitions
|
-
|
-
|
-
|
-
|
-
|
4,248
|
14,219
|
-
|
6,732
|
|||||||||||||||||||
|
Sales
|
-
|
-
|
-
|
(8,408
|
)
|
-
|
-
|
(17
|
)
|
(11,192
|
)
|
-
|
||||||||||||||||
|
Principal
payments
|
38
|
(4,024
|
)
|
(4,574
|
)
|
(10,049
|
)
|
(4,583
|
)
|
(506
|
)
|
158
|
(3,769
|
)
|
(5,267
|
)
|
||||||||||||
|
Discount
/
(premium)
amortization
|
21
|
26
|
22
|
27
|
93
|
(152
|
)
|
(69
|
)
|
(99
|
)
|
(30
|
)
|
|||||||||||||||
|
Credit
provision
|
(2,348
|
)
|
-
|
-
|
-
|
(35
|
)
|
-
|
-
|
-
|
185
|
|||||||||||||||||
|
Net
mark-to-market
adjustment
|
-
|
-
|
-
|
(14
|
)
|
-
|
-
|
17
|
250
|
505
|
||||||||||||||||||
|
Ending
Balance
|
$
|
25,883
|
$
|
28,172
|
$
|
32,170
|
$
|
36,722
|
$
|
55,167
|
$
|
59,692
|
$
|
56,102
|
$
|
41,794
|
$
|
56,604
|
||||||||||
|
Table
10:
Portfolio
Activity
(in
thousands)
|
||||||||||||||||||||||||||||
|
Commercial
IGS
|
||||||||||||||||||||||||||||
|
Q1:
2007
|
Q4:
2006
|
Q3:
2006
|
Q2:
2006
|
Q1:
2006
|
Q4:
2005
|
Q3:
2005
|
Q2:
2005
|
Q1:
2005
|
||||||||||||||||||||
|
Beginning
balance
|
$
|
119,613
|
$
|
134,639
|
$
|
131,034
|
$
|
184,400
|
$
|
185,032
|
$
|
222,783
|
$
|
217,848
|
$
|
206,590
|
$
|
220,357
|
||||||||||
|
Acquisitions
|
2,964
|
8,999
|
(3
|
)
|
-
|
2,177
|
29,684
|
17,179
|
7,845
|
3,500
|
||||||||||||||||||
|
Upgrades
/
downgrades
|
3,501
|
-
|
-
|
-
|
3,966
|
-
|
-
|
-
|
2,192
|
|||||||||||||||||||
|
Sales
|
(6,464
|
)
|
(24,007
|
)
|
-
|
(51,501
|
)
|
-
|
(56,292
|
)
|
(4,000
|
)
|
-
|
(8,790
|
)
|
|||||||||||||
|
Principal
payments
|
(938
|
)
|
(737
|
)
|
(883
|
)
|
(998
|
)
|
(5,006
|
)
|
(8,560
|
)
|
(4,174
|
)
|
(594
|
)
|
(5,298
|
)
|
||||||||||
|
Discount
/
(premium)
amortization
|
67
|
51
|
(14
|
)
|
(90
|
)
|
(159
|
)
|
(145
|
)
|
(269
|
)
|
(281
|
)
|
(244
|
)
|
||||||||||||
|
Net
mark-to-market
adjustment
|
(2,249
|
)
|
668
|
4,505
|
(777
|
)
|
(1,610
|
)
|
(2,438
|
)
|
(3,801
|
)
|
4,288
|
(5,127
|
)
|
|||||||||||||
|
Ending
Balance
|
$
|
116,494
|
$
|
119,613
|
$
|
134,639
|
$
|
131,034
|
$
|
184,400
|
$
|
185,032
|
$
|
222,783
|
$
|
217,848
|
$
|
206,590
|
||||||||||
|
CDO
CES
|
||||||||||||||||||||||||||||
|
Q1:
2007
|
Q4:
2006
|
Q3:
2006
|
Q2:
2006
|
Q1:
2006
|
Q4:
2005
|
Q3:
2005
|
Q2:
2005
|
Q1:
2005
|
||||||||||||||||||||
|
Beginning
balance
|
$
|
21,964
|
$
|
22,259
|
$
|
14,718
|
$
|
14,742
|
$
|
11,738
|
$
|
12,463
|
$
|
2,765
|
$
|
2,784
|
$
|
3,052
|
||||||||||
|
Acquisitions
|
(149
|
)
|
-
|
7,714
|
(87
|
)
|
3,000
|
(97
|
)
|
9,970
|
(119
|
)
|
(71
|
)
|
||||||||||||||
|
Upgrades
/
downgrades
|
(5,000
|
)
|
-
|
-
|
-
|
-
|
-
|
-
|
-
|
430
|
||||||||||||||||||
|
Sales
|
-
|
-
|
(722
|
)
|
-
|
-
|
-
|
-
|
-
|
-
|
||||||||||||||||||
|
Principal
payments
|
-
|
(769
|
)
|
(29
|
)
|
(1,017
|
)
|
(44
|
)
|
-
|
42
|
-
|
35
|
|||||||||||||||
|
Discount
/
(premium)
amortization
|
-
|
-
|
-
|
-
|
-
|
-
|
36
|
-
|
48
|
|||||||||||||||||||
|
Net
mark-to-market
adjustment
|
(663
|
)
|
474
|
578
|
1,080
|
48
|
(628
|
)
|
(350
|
)
|
100
|
(710
|
)
|
|||||||||||||||
|
Ending
Balance
|
$
|
16,152
|
$
|
21,964
|
$
|
22,259
|
$
|
14,718
|
$
|
14,742
|
$
|
11,738
|
$
|
12,463
|
$
|
2,765
|
$
|
2,784
|
||||||||||
|
CDO
IGS
|
||||||||||||||||||||||||||||
|
Q1:
2007
|
Q4:
2006
|
Q3:
2006
|
Q2:
2006
|
Q1:
2006
|
Q4:
2005
|
Q3:
2005
|
Q2:
2005
|
Q1:
2005
|
||||||||||||||||||||
|
Beginning
balance
|
$
|
224,349
|
$
|
184,942
|
$
|
177,063
|
$
|
163,539
|
$
|
150,647
|
$
|
146,344
|
$
|
148,684
|
$
|
133,123
|
$
|
110,032
|
||||||||||
|
Acquisitions
|
35,496
|
45,388
|
7,000
|
13,000
|
13,500
|
5,900
|
9,553
|
15,485
|
23,913
|
|||||||||||||||||||
|
Upgrades
/
downgrades
|
5,000
|
-
|
-
|
-
|
-
|
-
|
-
|
-
|
(430
|
)
|
||||||||||||||||||
|
Sales
|
-
|
(5,350
|
)
|
-
|
-
|
-
|
-
|
-
|
-
|
-
|
||||||||||||||||||
|
Principal
payments
|
(376
|
)
|
(338
|
)
|
(235
|
)
|
(257
|
)
|
(468
|
)
|
(335
|
)
|
(11,240
|
)
|
(237
|
)
|
(227
|
)
|
||||||||||
|
Discount
/
(premium)
amortization
|
(3
|
)
|
9
|
5
|
7
|
8
|
7
|
10
|
18
|
(41
|
)
|
|||||||||||||||||
|
Net
mark-to-market
adjustment
|
(10,159
|
)
|
(302
|
)
|
1,109
|
774
|
(148
|
)
|
(1,269
|
)
|
(663
|
)
|
295
|
(124
|
)
|
|||||||||||||
|
Ending
Balance
|
$
|
254,307
|
$
|
224,349
|
$
|
184,942
|
$
|
177,063
|
$
|
163,539
|
$
|
150,647
|
$
|
146,344
|
$
|
148,684
|
$
|
133,123
|
||||||||||
|
Table
11A:
Managed
Residential
Loans
Credit
Performance
(in
thousands)
|
|||||||||||||||||||||||||||||||||||||
|
Managed
Loans
|
|
Internally-Designated
Credit
Reserve
|
|
External
Credit
Enhancement
|
|
Total
Credit
Protection
(1)
|
|
Total
Credit
Protection
as
%
of
Loans
|
|
Seriously
Delinquent
Loans
|
|
Seriously
Delinquent
Loan
%
of
Current
Balance
|
|
Total
Credit
Losses
|
|
Losses
To
Securities
Junior
to
Redwood's
Interest
|
|
Redwood's
Share
of
Net
Charge-offs/(Recoveries)
|
|
Total
Credit
Losses
As
%
of
Loans
(Annualized)
|
|||||||||||||||||
|
Total
Managed
|
Q1:
2005
|
175,450,637
|
390,825
|
65,116
|
455,941
|
0.26
|
%
|
217,894
|
0.12
|
%
|
1,377
|
0
|
1,377
|
<0.01
|
%
|
||||||||||||||||||||||
|
Resi
Portfolio
|
Q2:
2005
|
192,291,401
|
427,139
|
139,847
|
566,986
|
0.29
|
%
|
230,538
|
0.12
|
%
|
740
|
196
|
544
|
<0.01
|
%
|
||||||||||||||||||||||
|
Q3:
2005
|
192,368,457
|
404,891
|
133,080
|
537,971
|
0.28
|
%
|
268,341
|
0.14
|
%
|
1,812
|
220
|
1,592
|
<0.01
|
%
|
|||||||||||||||||||||||
|
Q4:
2005
|
190,570,193
|
377,266
|
139,129
|
516,395
|
0.27
|
%
|
349,068
|
0.18
|
%
|
1,175
|
0
|
1,175
|
<0.01
|
%
|
|||||||||||||||||||||||
|
2005
|
190,570,193
|
377,266
|
139,129
|
516,395
|
0.27
|
%
|
349,068
|
0.18
|
%
|
5,104
|
416
|
4,688
|
<0.01
|
%
|
|||||||||||||||||||||||
|
Q1:
2006
|
198,252,684
|
396,153
|
126,376
|
522,529
|
0.26
|
%
|
467,352
|
0.24
|
%
|
3,002
|
0
|
3,002
|
<0.01
|
%
|
|||||||||||||||||||||||
|
Q2:
2006
|
227,928,505
|
445,028
|
126,264
|
571,292
|
0.25
|
%
|
441,430
|
0.19
|
%
|
1,464
|
0
|
1,464
|
<0.01
|
%
|
|||||||||||||||||||||||
|
Q3:
2006
|
235,127,925
|
403,723
|
215,285
|
619,008
|
0.26
|
%
|
658,262
|
0.28
|
%
|
2,748
|
155
|
2,593
|
<0.01
|
%
|
|||||||||||||||||||||||
|
Q4:
2006
|
219,178,838
|
392,365
|
302,072
|
694,437
|
0.32
|
%
|
850,761
|
0.39
|
%
|
5,058
|
196
|
4,862
|
<0.01
|
%
|
|||||||||||||||||||||||
|
2006
|
$
|
219,178,838
|
$
|
392,365
|
$
|
302,072
|
$
|
694,437
|
0.32
|
%
|
$
|
850,761
|
0.39
|
%
|
$
|
12,272
|
$
|
351
|
$
|
11,921
|
<0.01
|
%
|
|||||||||||||||
|
Q1:
2007
|
$
|
245,080,031
|
$
|
412,717
|
$
|
272,613
|
$
|
685,330
|
0.28
|
%
|
$
|
1,086,341
|
0.44
|
%
|
$
|
5,776
|
$
|
325
|
$
|
5,451
|
<0.01
|
%
|
|||||||||||||||
|
Residential
Real
|
Q1:
2005
|
21,579,671
|
24,827
|
0
|
24,827
|
0.12
|
%
|
16,066
|
0.07
|
%
|
154
|
0
|
154
|
<0.01
|
%
|
||||||||||||||||||||||
|
Estate
Loans
|
Q2:
2005
|
19,443,387
|
22,959
|
0
|
22,959
|
0.12
|
%
|
16,514
|
0.08
|
%
|
(34
|
)
|
0
|
(34
|
)
|
<0.01
|
%
|
||||||||||||||||||||
|
Q3:
2005
|
16,386,833
|
22,029
|
0
|
22,029
|
0.13
|
%
|
22,956
|
0.14
|
%
|
90
|
0
|
90
|
0.00
|
%
|
|||||||||||||||||||||||
|
Q4:
2005
|
13,719,242
|
22,656
|
0
|
22,656
|
0.17
|
%
|
37,335
|
0.27
|
%
|
251
|
0
|
251
|
<0.01
|
%
|
|||||||||||||||||||||||
|
2005
|
13,719,242
|
22,656
|
0
|
22,656
|
0.17
|
%
|
37,335
|
0.27
|
%
|
461
|
0
|
461
|
<0.01
|
%
|
|||||||||||||||||||||||
|
Q1:
2006
|
11,846,454
|
22,372
|
0
|
22,372
|
0.19
|
%
|
48,677
|
0.41
|
%
|
425
|
0
|
425
|
<0.01
|
%
|
|||||||||||||||||||||||
|
Q2:
2006
|
10,318,641
|
19,450
|
0
|
19,450
|
0.19
|
%
|
47,162
|
0.46
|
%
|
423
|
0
|
423
|
<0.01
|
%
|
|||||||||||||||||||||||
|
Q3:
2006
|
9,718,985
|
19,326
|
0
|
19,326
|
0.20
|
%
|
61,447
|
0.63
|
%
|
589
|
-
|
589
|
0.02
|
%
|
|||||||||||||||||||||||
|
Q4:
2006
|
9,212,002
|
20,119
|
0
|
20,119
|
0.22
|
%
|
74,236
|
0.79
|
%
|
711
|
-
|
711
|
0.02
|
%
|
|||||||||||||||||||||||
|
2006
|
9,212,002
|
20,119
|
0
|
20,119
|
0.22
|
%
|
74,236
|
0.79
|
%
|
2,148
|
-
|
2,148
|
0.03
|
%
|
|||||||||||||||||||||||
|
Q1:
2007
|
$
|
8,582,964
|
$
|
19,954
|
$
|
0
|
$
|
19,954
|
0.23
|
%
|
$
|
79,290
|
0.92
|
%
|
$
|
1,646
|
$
|
0
|
$
|
1,646
|
0.08
|
%
|
|||||||||||||||
|
Residential
CES
|
Q1:
2005
|
153,870,966
|
365,998
|
65,116
|
431,114
|
0.28
|
%
|
201,828
|
0.13
|
%
|
1,223
|
0
|
1,223
|
<0.01
|
%
|
||||||||||||||||||||||
|
Q2:
2005
|
172,848,014
|
404,180
|
139,847
|
544,027
|
0.31
|
%
|
214,024
|
0.12
|
%
|
774
|
196
|
578
|
<0.01
|
%
|
|||||||||||||||||||||||
|
Q3:
2005
|
175,981,624
|
382,862
|
133,080
|
515,942
|
0.29
|
%
|
245,385
|
0.14
|
%
|
1,722
|
220
|
1,502
|
<0.01
|
%
|
|||||||||||||||||||||||
|
Q4:
2005
|
176,850,951
|
354,610
|
139,129
|
493,739
|
0.28
|
%
|
311,733
|
0.18
|
%
|
924
|
0
|
924
|
<0.01
|
%
|
|||||||||||||||||||||||
|
2005
|
176,850,951
|
354,610
|
139,129
|
493,739
|
0.28
|
%
|
311,733
|
0.18
|
%
|
4,643
|
416
|
4,227
|
<0.01
|
%
|
|||||||||||||||||||||||
|
Q1:
2006
|
186,406,230
|
373,781
|
126,376
|
500,157
|
0.27
|
%
|
418,675
|
0.22
|
%
|
2,577
|
0
|
2,577
|
<0.01
|
%
|
|||||||||||||||||||||||
|
Q2:
2006
|
217,609,864
|
425,578
|
126,264
|
551,842
|
0.25
|
%
|
394,268
|
0.18
|
%
|
1,041
|
0
|
1,041
|
<0.01
|
%
|
|||||||||||||||||||||||
|
Q3:
2006
|
225,408,940
|
384,397
|
215,285
|
599,682
|
0.27
|
%
|
596,815
|
0.26
|
%
|
2,159
|
155
|
2,004
|
<0.01
|
%
|
|||||||||||||||||||||||
|
Q4:
2006
|
209,966,836
|
372,246
|
302,072
|
674,318
|
0.32
|
%
|
777,675
|
0.37
|
%
|
4,347
|
196
|
4,151
|
<0.01
|
%
|
|||||||||||||||||||||||
|
2006
|
209,966,836
|
372,246
|
302,072
|
674,318
|
0.32
|
%
|
777,675
|
0.37
|
%
|
10,124
|
351
|
9,773
|
<0.01
|
%
|
|||||||||||||||||||||||
|
Q1:
2007
|
$
|
236,497,067
|
$
|
392,763
|
$
|
272,613
|
$
|
665,376
|
0.28
|
%
|
$
|
1,007,051
|
0.43
|
%
|
$
|
4,130
|
$
|
325
|
$
|
3,805
|
<0.01
|
%
|
|||||||||||||||
|
(1)The
credit
reserve
on
residential
real
estate
loans
is
only
available
to
absorb
losses
on
our
residential
real
estate
loans.
Internally-designated
credit
reserves
and
external
credit
enhancement
are
only
available
to
absorb
losses
on
our
residential
CES.
|
|||||||||||||||||||||||||||||||||||||
|
Table
11B:
Managed
Residential
Loans
Credit
Performance
(in
thousands)
|
|||||||||||||||||||||||||
|
Managed
Loans
(1)
|
|
Internally-Designated
Credit
Reserve
|
|
Total
Credit
Reserve
as
%
of
Loans
|
|
Seriously
Delinquent
Loans
|
|
Seriously
Delinquent
Loan
%
of
Current
Balance
|
|
Redwood's
Share
of
losses
|
|
Total
Credit
Losses
As
%
of
Loans
(Annualized)
|
|||||||||||||
|
Total
Managed
|
Q1:
2005
|
$
|
117,121,507
|
$
|
390,475
|
0.33
|
%
|
$
|
185,027
|
0.16
|
%
|
$
|
1,377
|
0.00
|
%
|
||||||||||
|
Resi
Portfolio
|
Q2:
2005
|
130,690,357
|
426,834
|
0.33
|
%
|
194,431
|
0.15
|
%
|
544
|
0.00
|
%
|
||||||||||||||
|
Q3:
2005
|
125,971,360
|
404,191
|
0.32
|
%
|
230,263
|
0.18
|
%
|
1,592
|
0.00
|
%
|
|||||||||||||||
|
Q4:
2005
|
129,833,862
|
377,259
|
0.29
|
%
|
318,112
|
0.25
|
%
|
1,175
|
0.00
|
%
|
|||||||||||||||
|
2005
|
129,833,862
|
377,259
|
0.29
|
%
|
318,112
|
0.25
|
%
|
4,688
|
0.00
|
%
|
|||||||||||||||
|
Q1:
2006
|
150,039,853
|
433,658
|
0.29
|
%
|
432,120
|
0.29
|
%
|
3,002
|
0.00
|
%
|
|||||||||||||||
|
Q2:
2006
|
159,800,662
|
444,323
|
0.28
|
%
|
402,617
|
0.25
|
%
|
1,464
|
0.00
|
%
|
|||||||||||||||
|
Q3:
2006
|
141,357,008
|
402,655
|
0.28
|
%
|
463,911
|
0.33
|
%
|
2,593
|
0.00
|
%
|
|||||||||||||||
|
Q4:
2006
|
134,696,897
|
392,366
|
0.29
|
%
|
549,860
|
0.41
|
%
|
4,862
|
0.00
|
%
|
|||||||||||||||
|
2006
|
134,696,897
|
392,366
|
0.29
|
%
|
549,860
|
0.41
|
%
|
11,921
|
0.01
|
%
|
|||||||||||||||
|
Q1:
2007
|
$
|
114,624,260
|
$
|
412,717
|
0.36
|
%
|
$
|
682,892
|
0.60
|
%
|
$
|
5,451
|
0.02
|
%
|
|||||||||||
|
Residential
Alt
A
CES
|
Q1:
2005
|
$
|
11,612,670
|
$
|
51,791
|
0.45
|
%
|
$
|
26,578
|
0.23
|
%
|
$
|
5
|
0.00
|
%
|
||||||||||
|
Q2:
2005
|
15,865,802
|
67,319
|
0.42
|
%
|
28,293
|
0.18
|
%
|
225
|
0.01
|
%
|
|||||||||||||||
|
Q3:
2005
|
14,615,816
|
58,323
|
0.40
|
%
|
34,698
|
0.24
|
%
|
271
|
0.01
|
%
|
|||||||||||||||
|
Q4:
2005
|
15,778,989
|
58,241
|
0.37
|
%
|
58,614
|
0.37
|
%
|
53
|
0.00
|
%
|
|||||||||||||||
|
2005
|
15,778,989
|
58,241
|
0.37
|
%
|
58,614
|
0.37
|
%
|
554
|
0.00
|
%
|
|||||||||||||||
|
Q1:
2006
|
15,660,444
|
68,077
|
0.43
|
%
|
86,641
|
0.55
|
%
|
174
|
0.00
|
%
|
|||||||||||||||
|
Q2:
2006
|
19,960,837
|
115,170
|
0.58
|
%
|
106,953
|
0.54
|
%
|
225
|
0.00
|
%
|
|||||||||||||||
|
Q3:
2006
|
19,200,967
|
107,140
|
0.56
|
%
|
132,968
|
0.69
|
%
|
178
|
0.00
|
%
|
|||||||||||||||
|
Q4:
2006
|
18,127,353
|
115,315
|
0.64
|
%
|
187,465
|
1.03
|
%
|
1,311
|
0.03
|
%
|
|||||||||||||||
|
2006
|
18,127,353
|
115,315
|
0.64
|
%
|
187,465
|
1.03
|
%
|
1,887
|
0.01
|
%
|
|||||||||||||||
|
Q1:
2007
|
$
|
18,577,577
|
$
|
128,772
|
0.69
|
%
|
$
|
278,021
|
1.50
|
%
|
$
|
1,331
|
0.03
|
%
|
|||||||||||
|
Residential
Prime
CES
|
Q1:
2005
|
$
|
83,929,166
|
$
|
313,857
|
0.37
|
%
|
$
|
142,383
|
0.17
|
%
|
$
|
1,218
|
0.01
|
%
|
||||||||||
|
Q2:
2005
|
95,381,168
|
336,556
|
0.35
|
%
|
149,624
|
0.16
|
%
|
353
|
0.00
|
%
|
|||||||||||||||
|
Q3:
2005
|
94,968,711
|
323,839
|
0.34
|
%
|
172,609
|
0.18
|
%
|
1,231
|
0.01
|
%
|
|||||||||||||||
|
Q4:
2005
|
100,335,631
|
296,362
|
0.30
|
%
|
222,162
|
0.22
|
%
|
871
|
0.00
|
%
|
|||||||||||||||
|
2005
|
100,335,631
|
296,362
|
0.30
|
%
|
222,162
|
0.22
|
%
|
3,673
|
0.00
|
%
|
|||||||||||||||
|
Q1:
2006
|
122,532,955
|
343,209
|
0.28
|
%
|
296,802
|
0.24
|
%
|
2,403
|
0.01
|
%
|
|||||||||||||||
|
Q2:
2006
|
129,521,184
|
309,703
|
0.24
|
%
|
248,502
|
0.19
|
%
|
816
|
0.00
|
%
|
|||||||||||||||
|
Q3:
2006
|
112,437,056
|
276,189
|
0.25
|
%
|
269,496
|
0.24
|
%
|
1,826
|
0.01
|
%
|
|||||||||||||||
|
Q4:
2006
|
107,357,542
|
256,932
|
0.24
|
%
|
288,159
|
0.27
|
%
|
2,840
|
0.01
|
%
|
|||||||||||||||
|
2006
|
107,357,542
|
256,932
|
0.24
|
%
|
288,159
|
0.27
|
%
|
7,886
|
0.01
|
%
|
|||||||||||||||
|
Q1:
2007
|
$
|
87,463,719
|
$
|
263,991
|
0.30
|
%
|
$
|
325,581
|
0.37
|
%
|
$
|
2,474
|
0.01
|
%
|
|||||||||||
|
Residential
Real
|
Q1:
2005
|
$
|
21,579,671
|
$
|
24,827
|
0.12
|
%
|
$
|
16,066
|
0.07
|
%
|
$
|
154
|
<0.01
|
%
|
||||||||||
|
Estate
Loans
|
Q2:
2005
|
19,443,387
|
22,959
|
0.12
|
%
|
16,514
|
0.08
|
%
|
(34
|
)
|
0.00
|
%
|
|||||||||||||
|
Q3:
2005
|
16,386,833
|
22,029
|
0.13
|
%
|
22,956
|
0.14
|
%
|
90
|
<0.01
|
%
|
|||||||||||||||
|
Q4:
2005
|
13,719,242
|
22,656
|
0.17
|
%
|
37,335
|
0.27
|
%
|
251
|
<0.01
|
%
|
|||||||||||||||
|
2005
|
13,719,242
|
22,656
|
0.17
|
%
|
37,335
|
0.27
|
%
|
461
|
<0.01
|
%
|
|||||||||||||||
|
Q1:
2006
|
11,846,454
|
22,372
|
0.19
|
%
|
48,677
|
0.41
|
%
|
425
|
<0.01
|
%
|
|||||||||||||||
|
Q2:
2006
|
10,318,641
|
19,450
|
0.19
|
%
|
47,162
|
0.46
|
%
|
423
|
0.02
|
%
|
|||||||||||||||
|
Q3:
2006
|
9,718,985
|
19,326
|
0.20
|
%
|
61,447
|
0.63
|
%
|
589
|
0.02
|
%
|
|||||||||||||||
|
Q4:
2006
|
9,212,002
|
20,119
|
0.22
|
%
|
74,236
|
0.81
|
%
|
711
|
0.03
|
%
|
|||||||||||||||
|
2006
|
9,212,002
|
20,119
|
0.22
|
%
|
74,236
|
0.81
|
%
|
2,148
|
0.02
|
%
|
|||||||||||||||
|
Q1:
2007
|
$
|
8,582,964
|
$
|
19,954
|
0.23
|
%
|
$
|
79,290
|
0.92
|
%
|
$
|
1,646
|
0.08
|
%
|
|||||||||||
|
(1)
The
credit
reserve
on
residential
real
estate
loans
is
only
available
to
absorb
losses
on
our
residential
real
estate
loan
portfolio.
The
managed
loans
amout
for
residential
CES
prime
and
alt-a
portfolios
represents
the
loan
balances
for
the
securities
were
Redwood
is
first
in
line
to
absorb
losses.
The
internally
designated
credit
reserve
is
established
to
protect
Redwood
against
losses
suffered
from
these
underlying
loan
balances.
|
|||||||||||||||||||||||||
|
Table
12A: Residential CES Prime and
Underlying Loan Characteristics
(all $ in
thousands)
|
||||||||||||||||||||||||||||
|
Residential
Prime CES
|
Q1
2007
|
|
Q4
2006
|
|
Q3
2006
|
|
Q2
2006
|
|
Q1
2006
|
|
Q4
2005
|
|
Q3
2005
|
|
Q2
2005
|
|
Q1
2005
|
|||||||||||
|
Principal
value
|
$
|
899,856
|
$
|
871,984
|
$
|
900,358
|
$
|
925,212
|
$
|
849,556
|
$
|
858,999
|
$
|
885,264
|
$
|
908,780
|
$
|
826,789
|
||||||||||
|
Unamortized
premium
|
(115,563
|
)
|
(117,016
|
)
|
(113,398
|
)
|
(105,707
|
)
|
(52,906
|
)
|
(105,078
|
)
|
(76,264
|
)
|
(80,172
|
)
|
(74,657
|
)
|
||||||||||
|
Credit
protection
|
(263,991
|
)
|
(256,932
|
)
|
(276,189
|
)
|
(309,703
|
)
|
(343,209
|
)
|
(296,362
|
)
|
(323,839
|
)
|
(336,556
|
)
|
(313,857
|
)
|
||||||||||
|
Unrealized
market value
|
50,847
|
57,333
|
57,459
|
51,733
|
43,276
|
55,293
|
74,925
|
93,954
|
79,710
|
|||||||||||||||||||
|
Market
value
(book value)
|
$
|
571,149
|
$
|
555,369
|
$
|
568,230
|
$
|
561,535
|
$
|
496,717
|
$
|
512,852
|
$
|
560,086
|
$
|
586,006
|
$
|
517,985
|
||||||||||
|
Market
value /
principal value
|
$
|
63.47
|
$
|
63.69
|
$
|
63.11
|
$
|
60.69
|
$
|
58.47
|
$
|
59.70
|
$
|
63.27
|
$
|
64.48
|
$
|
62.65
|
||||||||||
|
|
|
|
|
|
|
|
|
|
|
|||||||||||||||||||
|
Current
Rating
|
|
|
|
|
|
|
|
|
|
|||||||||||||||||||
|
BB
|
$
|
315,865
|
$
|
307,713
|
$
|
314,279
|
$
|
286,321
|
$
|
255,488
|
$
|
271,389
|
$
|
270,770
|
$
|
259,922
|
$
|
233,505
|
||||||||||
|
B
|
131,224
|
118,836
|
119,458
|
133,410
|
108,574
|
107,091
|
156,951
|
194,911
|
167,554
|
|||||||||||||||||||
|
Non
Rated
|
124,060
|
128,820
|
134,493
|
141,804
|
132,655
|
134,372
|
132,365
|
131,173
|
116,926
|
|||||||||||||||||||
|
Total
market
value
|
$
|
571,149
|
$
|
555,369
|
$
|
568,230
|
$
|
561,535
|
$
|
496,717
|
$
|
512,852
|
$
|
560,087
|
$
|
586,006
|
$
|
517,985
|
||||||||||
|
|
|
|
|
|
|
|
|
|
|
|||||||||||||||||||
|
Security
Type
|
|
|
|
|
|
|
|
|
|
|||||||||||||||||||
|
Option
ARM
|
$
|
235,959
|
$
|
226,014
|
$
|
227,349
|
$
|
202,377
|
$
|
188,202
|
$
|
197,411
|
$
|
178,816
|
$
|
156,537
|
$
|
136,237
|
||||||||||
|
ARM
|
48,424
|
48,610
|
53,596
|
72,806
|
65,937
|
76,658
|
93,613
|
94,983
|
77,557
|
|||||||||||||||||||
|
Hybrid
|
226,520
|
221,094
|
227,093
|
223,716
|
183,392
|
174,886
|
216,545
|
254,741
|
226,543
|
|||||||||||||||||||
|
Fixed
|
60,246
|
59,651
|
60,193
|
62,636
|
59,185
|
63,896
|
71,112
|
79,745
|
77,648
|
|||||||||||||||||||
|
Total
market
value
|
$
|
571,149
|
$
|
555,369
|
$
|
568,230
|
$
|
561,535
|
$
|
496,717
|
$
|
512,852
|
$
|
560,087
|
$
|
586,006
|
$
|
517,985
|
||||||||||
|
|
|
|
|
|
|
|
|
|
|
|||||||||||||||||||
|
Interest
income
|
$
|
14,443
|
$
|
13,776
|
$
|
16,745
|
$
|
14,629
|
$
|
11,619
|
$
|
10,535
|
$
|
11,143
|
$
|
9,845
|
$
|
8,967
|
||||||||||
|
Discount
amortization
|
15,644
|
14,084
|
13,987
|
10,205
|
10,957
|
9,523
|
10,311
|
7,051
|
7,603
|
|||||||||||||||||||
|
Total
interest
income
|
$
|
30,087
|
$
|
27,860
|
$
|
30,732
|
$
|
24,834
|
$
|
22,576
|
$
|
20,058
|
$
|
21,454
|
$
|
16,896
|
$
|
16,570
|
||||||||||
|
|
|
|
|
|
|
|
|
|
|
|||||||||||||||||||
|
Avg
Balance
|
$
|
511,659
|
$
|
491,576
|
$
|
497,983
|
$
|
466,605
|
$
|
424,723
|
$
|
439,171
|
$
|
489,342
|
$
|
447,454
|
$
|
412,098
|
||||||||||
|
|
|
|
|
|
|
|
|
|
|
|||||||||||||||||||
|
Interest
income %
|
11.29
|
%
|
11.21
|
%
|
13.45
|
%
|
12.54
|
%
|
10.94
|
%
|
9.60
|
%
|
9.11
|
%
|
8.80
|
%
|
8.70
|
%
|
||||||||||
|
Discount
amort
%
|
12.23
|
%
|
11.46
|
%
|
11.23
|
%
|
8.75
|
%
|
10.32
|
%
|
8.67
|
%
|
8.43
|
%
|
6.30
|
%
|
7.38
|
%
|
||||||||||
|
Yield
|
23.52
|
%
|
22.67
|
%
|
24.69
|
%
|
21.29
|
%
|
21.26
|
%
|
18.27
|
%
|
17.54
|
%
|
15.10
|
%
|
16.08
|
%
|
||||||||||
|
|
|
|
|
|
|
|
|
|
|
|||||||||||||||||||
|
Underlying
Loan Characteristics
|
|
|
|
|
|
|
|
|
|
|||||||||||||||||||
|
Number
of
loans
|
600,406
|
551,613
|
569,884
|
559,587
|
508,003
|
464,904
|
451,718
|
436,791
|
368,201
|
|||||||||||||||||||
|
Total
Loan
Face
|
$
|
213,261,566
|
$
|
186,501,498
|
$
|
197,336,150
|
$
|
197,813,355
|
$
|
170,935,424
|
$
|
161,295,244
|
$
|
161,719,044
|
$
|
154,885,307
|
$
|
142,258,296
|
||||||||||
|
Average
loan
size
|
$
|
355
|
$
|
338
|
$
|
346
|
$
|
353
|
$
|
336
|
$
|
347
|
$
|
358
|
$
|
355
|
$
|
386
|
||||||||||
|
|
|
|
|
|
|
|
|
|
|
|||||||||||||||||||
|
Southern
CA
|
24
|
%
|
25
|
%
|
25
|
%
|
25
|
%
|
26
|
%
|
24
|
%
|
23
|
%
|
23
|
%
|
23
|
%
|
||||||||||
|
Northern
CA
|
21
|
%
|
22
|
%
|
22
|
%
|
22
|
%
|
24
|
%
|
21
|
%
|
20
|
%
|
20
|
%
|
20
|
%
|
||||||||||
|
Florida
|
6
|
%
|
6
|
%
|
6
|
%
|
6
|
%
|
5
|
%
|
5
|
%
|
5
|
%
|
5
|
%
|
5
|
%
|
||||||||||
|
New
York
|
5
|
%
|
5
|
%
|
5
|
%
|
5
|
%
|
5
|
%
|
5
|
%
|
5
|
%
|
5
|
%
|
5
|
%
|
||||||||||
|
Georgia
|
2
|
%
|
2
|
%
|
2
|
%
|
2
|
%
|
2
|
%
|
2
|
%
|
2
|
%
|
2
|
%
|
2
|
%
|
||||||||||
|
New
Jersey
|
3
|
%
|
3
|
%
|
4
|
%
|
4
|
%
|
3
|
%
|
4
|
%
|
4
|
%
|
4
|
%
|
4
|
%
|
||||||||||
|
Texas
|
3
|
%
|
3
|
%
|
3
|
%
|
3
|
%
|
3
|
%
|
3
|
%
|
3
|
%
|
3
|
%
|
3
|
%
|
||||||||||
|
Arizona
|
2
|
%
|
2
|
%
|
2
|
%
|
2
|
%
|
2
|
%
|
2
|
%
|
2
|
%
|
2
|
%
|
2
|
%
|
||||||||||
|
Illinois
|
3
|
%
|
3
|
%
|
3
|
%
|
3
|
%
|
3
|
%
|
3
|
%
|
3
|
%
|
3
|
%
|
3
|
%
|
||||||||||
|
Colorado
|
2
|
%
|
2
|
%
|
2
|
%
|
2
|
%
|
2
|
%
|
2
|
%
|
3
|
%
|
3
|
%
|
3
|
%
|
||||||||||
|
Virginia
|
4
|
%
|
4
|
%
|
4
|
%
|
4
|
%
|
4
|
%
|
4
|
%
|
4
|
%
|
4
|
%
|
4
|
%
|
||||||||||
|
Other
states
|
25
|
%
|
23
|
%
|
22
|
%
|
22
|
%
|
21
|
%
|
25
|
%
|
26
|
%
|
26
|
%
|
26
|
%
|
||||||||||
|
Table
12A: Residential CES Prime and
Underlying Loan Characteristics
(all $ in
thousands)
|
||||||||||||||||||||||||||||
|
Q1
2007
|
|
Q4
2006
|
|
Q3
2006
|
|
Q2
2006
|
|
Q1
2006
|
|
Q4
2005
|
|
Q3
2005
|
|
Q2
2005
|
|
Q1
2005
|
||||||||||||
|
Year
2007
origination
|
2
|
%
|
0
|
%
|
0
|
%
|
0
|
%
|
0
|
%
|
0
|
%
|
0
|
%
|
0
|
%
|
0
|
%
|
||||||||||
|
Year
2006
origination
|
20
|
%
|
11
|
%
|
14
|
%
|
11
|
%
|
1
|
%
|
0
|
%
|
0
|
%
|
0
|
%
|
0
|
%
|
||||||||||
|
Year
2005
origination
|
28
|
%
|
28
|
%
|
27
|
%
|
29
|
%
|
32
|
%
|
23
|
%
|
16
|
%
|
7
|
%
|
1
|
%
|
||||||||||
|
Year
2004
origination and earlier
|
50
|
%
|
61
|
%
|
59
|
%
|
60
|
%
|
67
|
%
|
77
|
%
|
84
|
%
|
93
|
%
|
99
|
%
|
||||||||||
|
|
|
|
|
|
|
|
|
|
|
|||||||||||||||||||
|
Wtd
Avg
Original LTV
|
68
|
%
|
68
|
%
|
68
|
%
|
68
|
%
|
68
|
%
|
67
|
%
|
67
|
%
|
67
|
%
|
68
|
%
|
||||||||||
|
Original
LTV:
0 - 50
|
13
|
%
|
14
|
%
|
13
|
%
|
13
|
%
|
14
|
%
|
14
|
%
|
14
|
%
|
14
|
%
|
13
|
%
|
||||||||||
|
Original
LTV:
50.01 - 60
|
12
|
%
|
12
|
%
|
12
|
%
|
12
|
%
|
12
|
%
|
13
|
%
|
13
|
%
|
12
|
%
|
12
|
%
|
||||||||||
|
Original
LTV:
60.01 - 70
|
22
|
%
|
22
|
%
|
22
|
%
|
22
|
%
|
22
|
%
|
23
|
%
|
23
|
%
|
23
|
%
|
23
|
%
|
||||||||||
|
Original
LTV:
70.01 - 80
|
50
|
%
|
49
|
%
|
50
|
%
|
50
|
%
|
49
|
%
|
47
|
%
|
47
|
%
|
48
|
%
|
49
|
%
|
||||||||||
|
Original
LTV:
80.01 - 90
|
2
|
%
|
2
|
%
|
2
|
%
|
2
|
%
|
2
|
%
|
2
|
%
|
2
|
%
|
2
|
%
|
2
|
%
|
||||||||||
|
Original
LTV:
90.01 - 100
|
1
|
%
|
1
|
%
|
1
|
%
|
1
|
%
|
1
|
%
|
1
|
%
|
1
|
%
|
1
|
%
|
1
|
%
|
||||||||||
|
Unknown
|
0
|
%
|
0
|
%
|
0
|
%
|
0
|
%
|
0
|
%
|
0
|
%
|
0
|
%
|
0
|
%
|
0
|
%
|
||||||||||
|
|
|
|
|
|
|
|
|
|
|
|||||||||||||||||||
|
Wtd
Avg
FICO
|
737
|
735
|
734
|
734
|
734
|
729
|
729
|
727
|
731
|
|||||||||||||||||||
|
FICO:
<=
600
|
1
|
%
|
1
|
%
|
1
|
%
|
1
|
%
|
1
|
%
|
0
|
%
|
0
|
%
|
0
|
%
|
0
|
%
|
||||||||||
|
FICO:
601 -
620
|
1
|
%
|
1
|
%
|
1
|
%
|
1
|
%
|
1
|
%
|
1
|
%
|
0
|
%
|
0
|
%
|
0
|
%
|
||||||||||
|
FICO:
621 -
640
|
2
|
%
|
2
|
%
|
2
|
%
|
2
|
%
|
2
|
%
|
2
|
%
|
2
|
%
|
2
|
%
|
2
|
%
|
||||||||||
|
FICO:
641 -
660
|
3
|
%
|
3
|
%
|
3
|
%
|
3
|
%
|
3
|
%
|
4
|
%
|
4
|
%
|
4
|
%
|
4
|
%
|
||||||||||
|
FICO:
661 -
680
|
6
|
%
|
6
|
%
|
7
|
%
|
6
|
%
|
6
|
%
|
7
|
%
|
7
|
%
|
7
|
%
|
7
|
%
|
||||||||||
|
FICO:
681 -
700
|
10
|
%
|
10
|
%
|
10
|
%
|
10
|
%
|
11
|
%
|
11
|
%
|
11
|
%
|
11
|
%
|
11
|
%
|
||||||||||
|
FICO:
701 -
720
|
12
|
%
|
12
|
%
|
13
|
%
|
13
|
%
|
12
|
%
|
12
|
%
|
13
|
%
|
13
|
%
|
13
|
%
|
||||||||||
|
FICO:
721 -
740
|
14
|
%
|
13
|
%
|
13
|
%
|
13
|
%
|
13
|
%
|
14
|
%
|
14
|
%
|
14
|
%
|
14
|
%
|
||||||||||
|
FICO:
741 -
760
|
15
|
%
|
15
|
%
|
15
|
%
|
15
|
%
|
15
|
%
|
15
|
%
|
15
|
%
|
15
|
%
|
16
|
%
|
||||||||||
|
FICO:
761 -
780
|
18
|
%
|
18
|
%
|
17
|
%
|
17
|
%
|
17
|
%
|
17
|
%
|
18
|
%
|
18
|
%
|
18
|
%
|
||||||||||
|
FICO:
781 -
800
|
14
|
%
|
14
|
%
|
13
|
%
|
13
|
%
|
13
|
%
|
13
|
%
|
12
|
%
|
12
|
%
|
12
|
%
|
||||||||||
|
FICO:
>=
801
|
4
|
%
|
4
|
%
|
4
|
%
|
4
|
%
|
4
|
%
|
3
|
%
|
3
|
%
|
3
|
%
|
2
|
%
|
||||||||||
|
Unknown
|
0
|
%
|
1
|
%
|
1
|
%
|
2
|
%
|
2
|
%
|
1
|
%
|
1
|
%
|
1
|
%
|
1
|
%
|
||||||||||
|
|
|
|
|
|
|
|
|
|
|
|||||||||||||||||||
|
Conforming
at
Origination %
|
31
|
%
|
34
|
%
|
34
|
%
|
33
|
%
|
35
|
%
|
25
|
%
|
23
|
%
|
23
|
%
|
21
|
%
|
||||||||||
|
>
$1
MM
%
|
9
|
%
|
8
|
%
|
9
|
%
|
9
|
%
|
7
|
%
|
7
|
%
|
6
|
%
|
6
|
%
|
6
|
%
|
||||||||||
|
|
|
|
|
|
|
|
|
|
|
|||||||||||||||||||
|
2nd
Home
%
|
7
|
%
|
6
|
%
|
6
|
%
|
6
|
%
|
6
|
%
|
6
|
%
|
6
|
%
|
5
|
%
|
5
|
%
|
||||||||||
|
Investment
Home %
|
2
|
%
|
2
|
%
|
2
|
%
|
2
|
%
|
2
|
%
|
2
|
%
|
2
|
%
|
2
|
%
|
2
|
%
|
||||||||||
|
|
|
|
|
|
|
|
|
|
|
|||||||||||||||||||
|
Purchase
|
42
|
%
|
39
|
%
|
39
|
%
|
39
|
%
|
38
|
%
|
36
|
%
|
36
|
%
|
35
|
%
|
35
|
%
|
||||||||||
|
Cash
Out
Refi
|
27
|
%
|
27
|
%
|
29
|
%
|
30
|
%
|
28
|
%
|
27
|
%
|
26
|
%
|
25
|
%
|
25
|
%
|
||||||||||
|
Rate-Term
Refi
|
30
|
%
|
33
|
%
|
31
|
%
|
31
|
%
|
33
|
%
|
36
|
%
|
37
|
%
|
39
|
%
|
39
|
%
|
||||||||||
|
Construction
|
0
|
%
|
0
|
%
|
0
|
%
|
0
|
%
|
0
|
%
|
0
|
%
|
0
|
%
|
0
|
%
|
0
|
%
|
||||||||||
|
Other
|
1
|
%
|
1
|
%
|
1
|
%
|
0
|
%
|
1
|
%
|
1
|
%
|
1
|
%
|
1
|
%
|
1
|
%
|
||||||||||
|
|
|
|
|
|
|
|
|
|
|
|||||||||||||||||||
|
Full
Doc
|
45
|
%
|
46
|
%
|
44
|
%
|
44
|
%
|
47
|
%
|
47
|
%
|
53
|
%
|
52
|
%
|
54
|
%
|
||||||||||
|
No
Doc
|
6
|
%
|
7
|
%
|
6
|
%
|
5
|
%
|
5
|
%
|
4
|
%
|
5
|
%
|
5
|
%
|
5
|
%
|
||||||||||
|
Other
Doc
(Lim, Red, Stated, etc)
|
49
|
%
|
47
|
%
|
50
|
%
|
51
|
%
|
48
|
%
|
49
|
%
|
42
|
%
|
43
|
%
|
41
|
%
|
||||||||||
|
|
|
|
|
|
|
|
|
|
|
|||||||||||||||||||
|
2-4
Family
|
2
|
%
|
2
|
%
|
2
|
%
|
2
|
%
|
2
|
%
|
2
|
%
|
2
|
%
|
2
|
%
|
2
|
%
|
||||||||||
|
Condo
|
9
|
%
|
8
|
%
|
8
|
%
|
8
|
%
|
8
|
%
|
4
|
%
|
3
|
%
|
3
|
%
|
3
|
%
|
||||||||||
|
Single
Family
|
88
|
%
|
89
|
%
|
89
|
%
|
89
|
%
|
89
|
%
|
55
|
%
|
56
|
%
|
53
|
%
|
52
|
%
|
||||||||||
|
Other
|
1
|
%
|
1
|
%
|
1
|
%
|
1
|
%
|
1
|
%
|
39
|
%
|
39
|
%
|
42
|
%
|
43
|
%
|
||||||||||
|
Table
12B: Residential CES Alt A and
Underlying Loan Characteristics
(all $ in
thousands)
|
||||||||||||||||||||||||||||
|
Residential
CES Alt A
|
Q1
2007
|
|
Q4
2006
|
|
Q3
2006
|
|
Q2
2006
|
|
Q1
2006
|
|
Q4
2005
|
|
Q3
2005
|
|
Q2
2005
|
|
Q1
2005
|
|||||||||||
|
Principal
value
|
$
|
348,371
|
$
|
298,780
|
$
|
272,957
|
$
|
243,391
|
$
|
184,513
|
$
|
154,794
|
$
|
144,521
|
$
|
170,543
|
$
|
126,137
|
||||||||||
|
Unamortized
premium
|
(41,680
|
)
|
(26,440
|
)
|
(26,849
|
)
|
(11,700
|
)
|
(17,960
|
)
|
(16,752
|
)
|
(8,520
|
)
|
(10,849
|
)
|
(8,956
|
)
|
||||||||||
|
Credit
protection
|
(128,772
|
)
|
(115,315
|
)
|
(107,140
|
)
|
(115,170
|
)
|
(68,077
|
)
|
(58,241
|
)
|
(58,323
|
)
|
(67,319
|
)
|
(51,791
|
)
|
||||||||||
|
Unrealized
market value
|
(5,932
|
)
|
(166
|
)
|
52
|
(879
|
)
|
246
|
(99
|
)
|
5,942
|
5,427
|
4,386
|
|||||||||||||||
|
Market
value
(book value)
|
$
|
171,987
|
$
|
156,859
|
$
|
139,020
|
$
|
115,642
|
$
|
98,722
|
$
|
79,702
|
$
|
83,620
|
$
|
97,802
|
$
|
69,776
|
||||||||||
|
Market
value /
principal value
|
$
|
49.37
|
$
|
52.50
|
$
|
50.93
|
$
|
47.51
|
$
|
53.50
|
$
|
51.49
|
$
|
57.86
|
$
|
57.35
|
$
|
55.32
|
||||||||||
|
|
|
|
|
|
|
|
|
|
|
|||||||||||||||||||
|
Current
Rating
|
|
|
|
|
|
|
|
|
|
|||||||||||||||||||
|
BB
|
$
|
100,895
|
$
|
94,239
|
$
|
85,874
|
$
|
62,063
|
$
|
63,244
|
$
|
51,175
|
$
|
55,065
|
$
|
50,983
|
$
|
35,752
|
||||||||||
|
B
|
30,989
|
22,861
|
19,722
|
22,122
|
13,377
|
7,969
|
8,451
|
27,370
|
20,756
|
|||||||||||||||||||
|
Non
Rated
|
40,103
|
39,759
|
33,424
|
31,457
|
22,101
|
20,558
|
20,104
|
19,449
|
13,268
|
|||||||||||||||||||
|
Total
market
value
|
$
|
171,987
|
$
|
156,859
|
$
|
139,020
|
$
|
115,642
|
$
|
98,722
|
$
|
79,702
|
$
|
83,620
|
$
|
97,802
|
$
|
69,775
|
||||||||||
|
|
|
|
|
|
|
|
|
|
|
|||||||||||||||||||
|
Security
Type
|
|
|
|
|
|
|
|
|
|
|||||||||||||||||||
|
Option
ARM
|
$
|
158,116
|
$
|
133,411
|
$
|
117,908
|
$
|
92,209
|
$
|
76,868
|
$
|
60,635
|
$
|
59,978
|
$
|
53,459
|
$
|
34,575
|
||||||||||
|
ARM
|
837
|
990
|
4,483
|
7,318
|
6,457
|
2,671
|
6,823
|
23,549
|
19,191
|
|||||||||||||||||||
|
Hybrid
|
10,701
|
21,835
|
16,012
|
15,589
|
14,867
|
15,741
|
16,000
|
18,871
|
13,654
|
|||||||||||||||||||
|
Fixed
|
2,333
|
623
|
616
|
526
|
529
|
654
|
819
|
1,922
|
2,355
|
|||||||||||||||||||
|
Total
market
value
|
$
|
171,987
|
$
|
156,859
|
$
|
139,019
|
$
|
115,642
|
$
|
98,721
|
$
|
79,701
|
$
|
83,620
|
$
|
97,801
|
$
|
69,775
|
||||||||||
|
|
|
|
|
|
|
|
|
|
|
|||||||||||||||||||
|
Interest
income
|
$
|
4,143
|
$
|
4,312
|
$
|
1,872
|
$
|
1,746
|
$
|
2,235
|
$
|
1,926
|
$
|
1,732
|
$
|
1,508
|
$
|
1,630
|
||||||||||
|
Discount
amortization
|
3,197
|
3,307
|
1,915
|
1,479
|
1,434
|
575
|
455
|
373
|
649
|
|||||||||||||||||||
|
Total
interest
income
|
$
|
7,340
|
$
|
7,619
|
$
|
3,787
|
$
|
3,225
|
$
|
3,669
|
$
|
2,501
|
$
|
2,187
|
$
|
1,881
|
$
|
2,279
|
||||||||||
|
|
|
|
|
|
|
|
|
|
|
|||||||||||||||||||
|
Avg
Balance
|
$
|
151,740
|
$
|
154,988
|
$
|
135,489
|
$
|
106,648
|
$
|
92,239
|
$
|
70,315
|
$
|
78,347
|
$
|
84,002
|
$
|
61,484
|
||||||||||
|
|
|
|
|
|
|
|
|
|
|
|||||||||||||||||||
|
Interest
income %
|
10.92
|
%
|
11.13
|
%
|
5.53
|
%
|
6.55
|
%
|
9.69
|
%
|
10.96
|
%
|
8.84
|
%
|
7.18
|
%
|
10.60
|
%
|
||||||||||
|
Discount
amort
%
|
8.43
|
%
|
8.53
|
%
|
5.65
|
%
|
5.55
|
%
|
6.22
|
%
|
3.27
|
%
|
2.32
|
%
|
1.78
|
%
|
4.22
|
%
|
||||||||||
|
Yield
|
19.35
|
%
|
19.66
|
%
|
11.18
|
%
|
12.10
|
%
|
15.91
|
%
|
14.23
|
%
|
11.17
|
%
|
8.96
|
%
|
14.83
|
%
|
||||||||||
|
|
|
|
|
|
|
|
|
|
|
|||||||||||||||||||
|
Underlying
Loan Characteristics
|
|
|
|
|
|
|
|
|
|
|||||||||||||||||||
|
Number
of
loans
|
58,960
|
54,599
|
67,132
|
60,471
|
50,168
|
49,596
|
46,682
|
58,163
|
38,421
|
|||||||||||||||||||
|
Total
Loan
Face
|
$
|
19,620,740
|
$
|
18,026,078
|
$
|
22,126,922
|
$
|
19,796,509
|
$
|
15,470,805
|
$
|
15,555,706
|
$
|
14,262,580
|
$
|
17,962,707
|
$
|
11,612,670
|
||||||||||
|
Average
loan
size
|
$
|
333
|
$
|
330
|
$
|
330
|
$
|
327
|
$
|
308
|
$
|
314
|
$
|
306
|
$
|
309
|
$
|
302
|
||||||||||
|
|
|
|
|
|
|
|
|
|
|
|||||||||||||||||||
|
Southern
CA
|
31
|
%
|
32
|
%
|
31
|
%
|
34
|
%
|
35
|
%
|
35
|
%
|
35
|
%
|
36
|
%
|
33
|
%
|
||||||||||
|
Northern
CA
|
21
|
%
|
22
|
%
|
22
|
%
|
23
|
%
|
24
|
%
|
22
|
%
|
21
|
%
|
21
|
%
|
19
|
%
|
||||||||||
|
Florida
|
10
|
%
|
10
|
%
|
9
|
%
|
9
|
%
|
8
|
%
|
8
|
%
|
7
|
%
|
7
|
%
|
8
|
%
|
||||||||||
|
New
York
|
2
|
%
|
2
|
%
|
2
|
%
|
1
|
%
|
1
|
%
|
1
|
%
|
1
|
%
|
1
|
%
|
1
|
%
|
||||||||||
|
Georgia
|
1
|
%
|
1
|
%
|
1
|
%
|
1
|
%
|
1
|
%
|
1
|
%
|
1
|
%
|
1
|
%
|
1
|
%
|
||||||||||
|
New
Jersey
|
3
|
%
|
3
|
%
|
3
|
%
|
2
|
%
|
2
|
%
|
2
|
%
|
3
|
%
|
2
|
%
|
2
|
%
|
||||||||||
|
Texas
|
1
|
%
|
1
|
%
|
1
|
%
|
1
|
%
|
1
|
%
|
1
|
%
|
1
|
%
|
1
|
%
|
1
|
%
|
||||||||||
|
Arizona
|
4
|
%
|
4
|
%
|
4
|
%
|
3
|
%
|
3
|
%
|
2
|
%
|
2
|
%
|
2
|
%
|
2
|
%
|
||||||||||
|
Illinois
|
1
|
%
|
1
|
%
|
1
|
%
|
1
|
%
|
1
|
%
|
2
|
%
|
2
|
%
|
2
|
%
|
2
|
%
|
||||||||||
|
Colorado
|
3
|
%
|
3
|
%
|
3
|
%
|
3
|
%
|
3
|
%
|
3
|
%
|
4
|
%
|
3
|
%
|
4
|
%
|
||||||||||
|
Virginia
|
3
|
%
|
3
|
%
|
3
|
%
|
3
|
%
|
2
|
%
|
2
|
%
|
2
|
%
|
2
|
%
|
2
|
%
|
||||||||||
|
Other
states
|
20
|
%
|
18
|
%
|
20
|
%
|
19
|
%
|
19
|
%
|
21
|
%
|
21
|
%
|
22
|
%
|
25
|
%
|
||||||||||
|
Table
12B: Residential CES Alt A and
Underlying Loan Characteristics
(all $ in
thousands)
|
||||||||||||||||||||||||||||
|
Q1
2007
|
Q4
2006
|
Q3
2006
|
Q2
2006
|
Q1
2006
|
Q4
2005
|
Q3
2005
|
Q2
2005
|
Q1
2005
|
||||||||||||||||||||
|
Year
2007
origination
|
4
|
%
|
0
|
%
|
0
|
%
|
0
|
%
|
0
|
%
|
0
|
%
|
0
|
%
|
0
|
%
|
0
|
%
|
||||||||||
|
Year
2006
origination
|
25
|
%
|
21
|
%
|
19
|
%
|
9
|
%
|
1
|
%
|
0
|
%
|
0
|
%
|
0
|
%
|
0
|
%
|
||||||||||
|
Year
2005
origination
|
39
|
%
|
38
|
%
|
41
|
%
|
45
|
%
|
39
|
%
|
35
|
%
|
21
|
%
|
19
|
%
|
0
|
%
|
||||||||||
|
Year
2004
origination and earlier
|
32
|
%
|
41
|
%
|
40
|
%
|
46
|
%
|
60
|
%
|
65
|
%
|
79
|
%
|
81
|
%
|
100
|
%
|
||||||||||
|
|
|
|
|
|
|
|
|
|
|
|||||||||||||||||||
|
Wtd
Avg
Original LTV
|
75
|
%
|
75
|
%
|
75
|
%
|
75
|
%
|
74
|
%
|
75
|
%
|
75
|
%
|
74
|
%
|
74
|
%
|
||||||||||
|
Original
LTV:
0 - 50
|
4
|
%
|
4
|
%
|
4
|
%
|
4
|
%
|
5
|
%
|
4
|
%
|
5
|
%
|
5
|
%
|
5
|
%
|
||||||||||
|
Original
LTV:
50.01 - 60
|
6
|
%
|
6
|
%
|
6
|
%
|
6
|
%
|
7
|
%
|
6
|
%
|
6
|
%
|
7
|
%
|
7
|
%
|
||||||||||
|
Original
LTV:
60.01 - 70
|
15
|
%
|
16
|
%
|
16
|
%
|
16
|
%
|
16
|
%
|
15
|
%
|
16
|
%
|
16
|
%
|
17
|
%
|
||||||||||
|
Original
LTV:
70.01 - 80
|
61
|
%
|
61
|
%
|
58
|
%
|
59
|
%
|
59
|
%
|
62
|
%
|
60
|
%
|
62
|
%
|
64
|
%
|
||||||||||
|
Original
LTV:
80.01 - 90
|
10
|
%
|
9
|
%
|
11
|
%
|
10
|
%
|
9
|
%
|
8
|
%
|
8
|
%
|
7
|
%
|
4
|
%
|
||||||||||
|
Original
LTV:
90.01 - 100
|
4
|
%
|
4
|
%
|
5
|
%
|
5
|
%
|
4
|
%
|
5
|
%
|
5
|
%
|
3
|
%
|
3
|
%
|
||||||||||
|
Unknown
|
0
|
%
|
0
|
%
|
0
|
%
|
0
|
%
|
0
|
%
|
0
|
%
|
0
|
%
|
0
|
%
|
0
|
%
|
||||||||||
|
|
|
|
|
|
|
|
|
|
|
|||||||||||||||||||
|
Wtd
Avg
FICO
|
708
|
708
|
708
|
708
|
710
|
706
|
708
|
707
|
706
|
|||||||||||||||||||
|
FICO:
<=
600
|
2
|
%
|
1
|
%
|
3
|
%
|
2
|
%
|
2
|
%
|
0
|
%
|
0
|
%
|
0
|
%
|
0
|
%
|
||||||||||
|
FICO:
601 -
620
|
1
|
%
|
1
|
%
|
1
|
%
|
1
|
%
|
1
|
%
|
1
|
%
|
0
|
%
|
0
|
%
|
0
|
%
|
||||||||||
|
FICO:
621 -
640
|
5
|
%
|
5
|
%
|
5
|
%
|
5
|
%
|
5
|
%
|
5
|
%
|
5
|
%
|
5
|
%
|
5
|
%
|
||||||||||
|
FICO:
641 -
660
|
9
|
%
|
8
|
%
|
8
|
%
|
8
|
%
|
8
|
%
|
8
|
%
|
8
|
%
|
8
|
%
|
7
|
%
|
||||||||||
|
FICO:
661 -
680
|
14
|
%
|
14
|
%
|
13
|
%
|
13
|
%
|
12
|
%
|
13
|
%
|
12
|
%
|
12
|
%
|
12
|
%
|
||||||||||
|
FICO:
681 -
700
|
15
|
%
|
15
|
%
|
15
|
%
|
15
|
%
|
13
|
%
|
15
|
%
|
15
|
%
|
15
|
%
|
15
|
%
|
||||||||||
|
FICO:
701 -
720
|
13
|
%
|
13
|
%
|
13
|
%
|
13
|
%
|
12
|
%
|
14
|
%
|
15
|
%
|
15
|
%
|
15
|
%
|
||||||||||
|
FICO:
721 -
740
|
11
|
%
|
11
|
%
|
11
|
%
|
11
|
%
|
11
|
%
|
12
|
%
|
13
|
%
|
13
|
%
|
13
|
%
|
||||||||||
|
FICO:
741 -
760
|
9
|
%
|
10
|
%
|
10
|
%
|
10
|
%
|
9
|
%
|
11
|
%
|
11
|
%
|
11
|
%
|
12
|
%
|
||||||||||
|
FICO:
761 -
780
|
8
|
%
|
8
|
%
|
8
|
%
|
8
|
%
|
8
|
%
|
9
|
%
|
10
|
%
|
10
|
%
|
10
|
%
|
||||||||||
|
FICO:
781 -
800
|
5
|
%
|
5
|
%
|
5
|
%
|
5
|
%
|
5
|
%
|
5
|
%
|
5
|
%
|
5
|
%
|
5
|
%
|
||||||||||
|
FICO:
>=
801
|
1
|
%
|
1
|
%
|
1
|
%
|
1
|
%
|
1
|
%
|
1
|
%
|
1
|
%
|
1
|
%
|
1
|
%
|
||||||||||
|
Unknown
|
7
|
%
|
8
|
%
|
7
|
%
|
8
|
%
|
13
|
%
|
6
|
%
|
5
|
%
|
5
|
%
|
5
|
%
|
||||||||||
|
|
|
|
|
|
|
|
|
|
|
|||||||||||||||||||
|
Conforming
at
Origination %
|
49
|
%
|
52
|
%
|
53
|
%
|
53
|
%
|
56
|
%
|
46
|
%
|
49
|
%
|
48
|
%
|
50
|
%
|
||||||||||
|
>
$1
MM
%
|
10
|
%
|
9
|
%
|
8
|
%
|
7
|
%
|
7
|
%
|
6
|
%
|
6
|
%
|
6
|
%
|
7
|
%
|
||||||||||
|
|
|
|
|
|
|
|
|
|
|
|||||||||||||||||||
|
2nd
Home
%
|
6
|
%
|
6
|
%
|
5
|
%
|
5
|
%
|
5
|
%
|
5
|
%
|
5
|
%
|
5
|
%
|
6
|
%
|
||||||||||
|
Investment
Home %
|
11
|
%
|
12
|
%
|
11
|
%
|
11
|
%
|
11
|
%
|
11
|
%
|
10
|
%
|
10
|
%
|
11
|
%
|
||||||||||
|
|
|
|
|
|
|
|
|
|
|
|||||||||||||||||||
|
Purchase
|
37
|
%
|
41
|
%
|
42
|
%
|
40
|
%
|
41
|
%
|
45
|
%
|
47
|
%
|
48
|
%
|
53
|
%
|
||||||||||
|
Cash
Out
Refi
|
41
|
%
|
39
|
%
|
38
|
%
|
40
|
%
|
38
|
%
|
37
|
%
|
34
|
%
|
34
|
%
|
30
|
%
|
||||||||||
|
Rate-Term
Refi
|
22
|
%
|
19
|
%
|
21
|
%
|
20
|
%
|
21
|
%
|
18
|
%
|
19
|
%
|
18
|
%
|
17
|
%
|
||||||||||
|
Construction
|
0
|
%
|
0
|
%
|
0
|
%
|
0
|
%
|
0
|
%
|
0
|
%
|
0
|
%
|
0
|
%
|
0
|
%
|
||||||||||
|
Other
|
0
|
%
|
0
|
%
|
0
|
%
|
0
|
%
|
0
|
%
|
0
|
%
|
0
|
%
|
0
|
%
|
0
|
%
|
||||||||||
|
|
|
|
|
|
|
|
|
|
|
|||||||||||||||||||
|
Full
Doc
|
18
|
%
|
23
|
%
|
24
|
%
|
22
|
%
|
22
|
%
|
19
|
%
|
19
|
%
|
19
|
%
|
16
|
%
|
||||||||||
|
No
Doc
|
1
|
%
|
1
|
%
|
1
|
%
|
1
|
%
|
1
|
%
|
0
|
%
|
0
|
%
|
0
|
%
|
1
|
%
|
||||||||||
|
Other
Doc
(Lim, Red, Stated, etc)
|
71
|
%
|
67
|
%
|
64
|
%
|
67
|
%
|
62
|
%
|
81
|
%
|
81
|
%
|
81
|
%
|
83
|
%
|
||||||||||
|
Unknown/Not
Categorized
|
10
|
%
|
9
|
%
|
11
|
%
|
10
|
%
|
15
|
%
|
0
|
%
|
0
|
%
|
0
|
%
|
0
|
%
|
||||||||||
|
|
|
|
|
|
|
|
|
|
|
|||||||||||||||||||
|
2-4
Family
|
4
|
%
|
4
|
%
|
4
|
%
|
4
|
%
|
4
|
%
|
4
|
%
|
3
|
%
|
3
|
%
|
4
|
%
|
||||||||||
|
Condo
|
11
|
%
|
11
|
%
|
11
|
%
|
11
|
%
|
11
|
%
|
1
|
%
|
1
|
%
|
1
|
%
|
0
|
%
|
||||||||||
|
Single
Family
|
85
|
%
|
85
|
%
|
85
|
%
|
85
|
%
|
85
|
%
|
6
|
%
|
6
|
%
|
4
|
%
|
0
|
%
|
||||||||||
|
Other
|
0
|
%
|
0
|
%
|
0
|
%
|
0
|
%
|
0
|
%
|
89
|
%
|
90
|
%
|
92
|
%
|
96
|
%
|
||||||||||
|
Table
12C: Residential CES Subprime and
Underlying Loan Characteristics
(all $
in thousands)
|
||||||||||||||||||||||||||||
|
Residential
CES Subprime
|
Q1
2007
|
|
Q4
2006
|
|
Q3
2006
|
|
Q2
2006
|
|
Q1
2006
|
|
Q4
2005
|
|
Q3
2005
|
|
Q2
2005
|
|
Q1
2005
|
|||||||||||
|
Principal
value
|
$
|
11,219
|
9,841
|
9,841
|
$
|
0
|
$
|
0
|
$
|
0
|
$
|
0
|
$
|
0
|
$
|
0
|
||||||||||||
|
Unamortized
premium
|
(1,426
|
)
|
(1,387
|
)
|
(1,407
|
)
|
-
|
-
|
-
|
-
|
-
|
-
|
||||||||||||||||
|
Credit
protection
|
0
|
0
|
0
|
-
|
-
|
-
|
-
|
-
|
-
|
|||||||||||||||||||
|
Unrealized
market value
|
(652
|
)
|
849
|
(15
|
)
|
-
|
-
|
-
|
-
|
-
|
-
|
|||||||||||||||||
|
Market
value
(book value)
|
$
|
9,141
|
9,303
|
8,419
|
$
|
0
|
$
|
0
|
$
|
0
|
$
|
0
|
$
|
0
|
$
|
0
|
||||||||||||
|
Market
value /
principal value
|
$
|
81.48
|
$
|
94.53
|
$
|
85.55
|
$
|
0.00
|
$
|
0.00
|
$
|
0.00
|
$
|
0.00
|
$
|
0.00
|
$
|
0.00
|
||||||||||
|
|
|
|
|
|
|
|
|
|
|
|||||||||||||||||||
|
Current
Rating
|
|
|
|
|
|
|
|
|
|
|||||||||||||||||||
|
BB
|
$
|
9,141
|
$
|
6,678
|
$
|
5,919
|
$
|
0
|
$
|
0
|
$
|
0
|
$
|
0
|
$
|
0
|
$
|
0
|
||||||||||
|
B
|
-
|
-
|
-
|
-
|
-
|
-
|
-
|
-
|
-
|
|||||||||||||||||||
|
Non
Rated
|
-
|
2,625
|
2,500
|
-
|
-
|
-
|
-
|
-
|
-
|
|||||||||||||||||||
|
Total
market
value
|
$
|
9,141
|
$
|
9,303
|
$
|
8,419
|
$
|
0
|
$
|
0
|
$
|
0
|
$
|
0
|
$
|
0
|
$
|
0
|
||||||||||
|
|
|
|
|
|
|
|
|
|
|
|||||||||||||||||||
|
Security
Type
|
|
|
|
|
|
|
|
|
|
|||||||||||||||||||
|
Option
ARM
|
$
|
0
|
$
|
0
|
$
|
0
|
$
|
0
|
$
|
0
|
$
|
0
|
$
|
0
|
$
|
0
|
$
|
0
|
||||||||||
|
ARM
|
-
|
-
|
-
|
-
|
-
|
-
|
-
|
-
|
-
|
|||||||||||||||||||
|
Hybrid
|
1,013
|
4,127
|
4,064
|
-
|
-
|
-
|
-
|
-
|
-
|
|||||||||||||||||||
|
Fixed
|
8,128
|
5,176
|
4,355
|
-
|
-
|
-
|
-
|
-
|
-
|
|||||||||||||||||||
|
Total
market
value
|
$
|
9,141
|
$
|
9,303
|
$
|
8,419
|
$
|
0
|
$
|
0
|
$
|
0
|
$
|
0
|
$
|
0
|
$
|
0
|
||||||||||
|
|
|
|
|
|
|
|
|
|
|
|||||||||||||||||||
|
Interest
income
|
$
|
186
|
$
|
151
|
$
|
51
|
$
|
0
|
$
|
0
|
$
|
0
|
$
|
0
|
$
|
0
|
$
|
0
|
||||||||||
|
Discount
amortization
|
51
|
22
|
15
|
-
|
-
|
-
|
-
|
-
|
-
|
|||||||||||||||||||
|
Total
interest
income
|
$
|
237
|
$
|
173
|
$
|
66
|
$
|
0
|
$
|
0
|
$
|
0
|
$
|
0
|
$
|
0
|
$
|
0
|
||||||||||
|
|
|
|
|
|
|
|
|
|
|
|||||||||||||||||||
|
Avg
Balance
|
$
|
9,715
|
$
|
8,344
|
$
|
8,223
|
$
|
0
|
$
|
0
|
$
|
0
|
$
|
0
|
$
|
0
|
$
|
0
|
||||||||||
|
|
|
|
|
|
|
|
|
|
|
|||||||||||||||||||
|
Interest
income %
|
7.66
|
%
|
7.24
|
%
|
2.48
|
%
|
0.00
|
%
|
0.00
|
%
|
0.00
|
%
|
0.00
|
%
|
0.00
|
%
|
0.00
|
%
|
||||||||||
|
Discount
amort
%
|
2.10
|
%
|
1.05
|
%
|
0.73
|
%
|
0.00
|
%
|
0.00
|
%
|
0.00
|
%
|
0.00
|
%
|
0.00
|
%
|
0.00
|
%
|
||||||||||
|
Yield
|
9.76
|
%
|
8.29
|
%
|
3.21
|
%
|
0.00
|
%
|
0.00
|
%
|
0.00
|
%
|
0.00
|
%
|
0.00
|
%
|
0.00
|
%
|
||||||||||
|
|
|
|
|
|
|
|
|
|
|
|||||||||||||||||||
|
Underlying
Loan Characteristics
|
|
|
|
|
|
|
|
|
|
|||||||||||||||||||
|
Number
of
loans
|
25,001
|
31,873
|
34,841
|
-
|
-
|
-
|
-
|
-
|
-
|
|||||||||||||||||||
|
Total
Loan
Face
|
$
|
3,614,761
|
$
|
5,439,260
|
$
|
5,945,868
|
$
|
0
|
$
|
0
|
$
|
0
|
$
|
0
|
$
|
0
|
$
|
0
|
||||||||||
|
Average
loan
size
|
$
|
145
|
$
|
171
|
$
|
171
|
$
|
0
|
$
|
0
|
$
|
0
|
$
|
0
|
$
|
0
|
$
|
0
|
||||||||||
|
|
|
|
|
|
|
|
|
|
|
|||||||||||||||||||
|
Southern
CA
|
18
|
%
|
19
|
%
|
19
|
%
|
0
|
%
|
0
|
%
|
0
|
%
|
0
|
%
|
0
|
%
|
0
|
%
|
||||||||||
|
Northern
CA
|
13
|
%
|
14
|
%
|
14
|
%
|
0
|
%
|
0
|
%
|
0
|
%
|
0
|
%
|
0
|
%
|
0
|
%
|
||||||||||
|
Florida
|
12
|
%
|
12
|
%
|
12
|
%
|
0
|
%
|
0
|
%
|
0
|
%
|
0
|
%
|
0
|
%
|
0
|
%
|
||||||||||
|
New
York
|
4
|
%
|
4
|
%
|
4
|
%
|
0
|
%
|
0
|
%
|
0
|
%
|
0
|
%
|
0
|
%
|
0
|
%
|
||||||||||
|
Georgia
|
1
|
%
|
1
|
%
|
1
|
%
|
0
|
%
|
0
|
%
|
0
|
%
|
0
|
%
|
0
|
%
|
0
|
%
|
||||||||||
|
New
Jersey
|
4
|
%
|
4
|
%
|
4
|
%
|
0
|
%
|
0
|
%
|
0
|
%
|
0
|
%
|
0
|
%
|
0
|
%
|
||||||||||
|
Texas
|
4
|
%
|
4
|
%
|
4
|
%
|
0
|
%
|
0
|
%
|
0
|
%
|
0
|
%
|
0
|
%
|
0
|
%
|
||||||||||
|
Arizona
|
5
|
%
|
4
|
%
|
4
|
%
|
0
|
%
|
0
|
%
|
0
|
%
|
0
|
%
|
0
|
%
|
0
|
%
|
||||||||||
|
Illinois
|
6
|
%
|
6
|
%
|
6
|
%
|
0
|
%
|
0
|
%
|
0
|
%
|
0
|
%
|
0
|
%
|
0
|
%
|
||||||||||
|
Colorado
|
2
|
%
|
2
|
%
|
2
|
%
|
0
|
%
|
0
|
%
|
0
|
%
|
0
|
%
|
0
|
%
|
0
|
%
|
||||||||||
|
Virginia
|
2
|
%
|
2
|
%
|
2
|
%
|
0
|
%
|
0
|
%
|
0
|
%
|
0
|
%
|
0
|
%
|
0
|
%
|
||||||||||
|
Other
states
|
29
|
%
|
28
|
%
|
28
|
%
|
0
|
%
|
0
|
%
|
0
|
%
|
0
|
%
|
0
|
%
|
0
|
%
|
||||||||||
|
Table
12C: Residential CES Subprime and
Underlying Loan Characteristics
(all $
in thousands)
|
||||||||||||||||||||||||||||
|
Q1
2007
|
Q4
2006
|
Q3
2006
|
Q2
2006
|
Q1
2006
|
Q4
2005
|
Q3
2005
|
Q2
2005
|
Q1
2005
|
||||||||||||||||||||
|
Year
2007
origination
|
2
|
%
|
0
|
%
|
0
|
%
|
0
|
%
|
0
|
%
|
0
|
%
|
0
|
%
|
0
|
%
|
0
|
%
|
||||||||||
|
Year
2006
origination
|
98
|
%
|
100
|
%
|
100
|
%
|
0
|
%
|
0
|
%
|
0
|
%
|
0
|
%
|
0
|
%
|
0
|
%
|
||||||||||
|
Year
2005
origination
|
0
|
%
|
0
|
%
|
0
|
%
|
0
|
%
|
0
|
%
|
0
|
%
|
0
|
%
|
0
|
%
|
0
|
%
|
||||||||||
|
Year
2004
origination and earlier
|
0
|
%
|
0
|
%
|
0
|
%
|
0
|
%
|
0
|
%
|
0
|
%
|
0
|
%
|
0
|
%
|
0
|
%
|
||||||||||
|
|
|
|
|
|
|
|
|
|
|
|||||||||||||||||||
|
Wtd
Avg
Original LTV
|
75
|
%
|
73
|
%
|
73
|
%
|
0
|
%
|
0
|
%
|
0
|
%
|
0
|
%
|
0
|
%
|
0
|
%
|
||||||||||
|
Original
LTV:
0 - 50
|
13
|
%
|
14
|
%
|
14
|
%
|
0
|
%
|
0
|
%
|
0
|
%
|
0
|
%
|
0
|
%
|
0
|
%
|
||||||||||
|
Original
LTV:
50.01 - 60
|
2
|
%
|
3
|
%
|
3
|
%
|
0
|
%
|
0
|
%
|
0
|
%
|
0
|
%
|
0
|
%
|
0
|
%
|
||||||||||
|
Original
LTV:
60.01 - 70
|
6
|
%
|
6
|
%
|
6
|
%
|
0
|
%
|
0
|
%
|
0
|
%
|
0
|
%
|
0
|
%
|
0
|
%
|
||||||||||
|
Original
LTV:
70.01 - 80
|
43
|
%
|
47
|
%
|
47
|
%
|
0
|
%
|
0
|
%
|
0
|
%
|
0
|
%
|
0
|
%
|
0
|
%
|
||||||||||
|
Original
LTV:
80.01 - 90
|
22
|
%
|
23
|
%
|
23
|
%
|
0
|
%
|
0
|
%
|
0
|
%
|
0
|
%
|
0
|
%
|
0
|
%
|
||||||||||
|
Original
LTV:
90.01 - 100
|
14
|
%
|
7
|
%
|
7
|
%
|
0
|
%
|
0
|
%
|
0
|
%
|
0
|
%
|
0
|
%
|
0
|
%
|
||||||||||
|
Unknown
|
0
|
%
|
0
|
%
|
0
|
%
|
0
|
%
|
0
|
%
|
0
|
%
|
0
|
%
|
0
|
%
|
0
|
%
|
||||||||||
|
|
|
|
|
|
|
|
|
|
|
|||||||||||||||||||
|
Wtd
Avg
FICO
|
642
|
636
|
636
|
-
|
-
|
-
|
-
|
-
|
-
|
|||||||||||||||||||
|
FICO:
<=
600
|
25
|
%
|
25
|
%
|
25
|
%
|
0
|
%
|
0
|
%
|
0
|
%
|
0
|
%
|
0
|
%
|
0
|
%
|
||||||||||
|
FICO:
601 -
620
|
12
|
%
|
13
|
%
|
13
|
%
|
0
|
%
|
0
|
%
|
0
|
%
|
0
|
%
|
0
|
%
|
0
|
%
|
||||||||||
|
FICO:
621 -
640
|
16
|
%
|
17
|
%
|
17
|
%
|
0
|
%
|
0
|
%
|
0
|
%
|
0
|
%
|
0
|
%
|
0
|
%
|
||||||||||
|
FICO:
641 -
660
|
12
|
%
|
13
|
%
|
13
|
%
|
0
|
%
|
0
|
%
|
0
|
%
|
0
|
%
|
0
|
%
|
0
|
%
|
||||||||||
|
FICO:
661 -
680
|
10
|
%
|
10
|
%
|
10
|
%
|
0
|
%
|
0
|
%
|
0
|
%
|
0
|
%
|
0
|
%
|
0
|
%
|
||||||||||
|
FICO:
681 -
700
|
9
|
%
|
8
|
%
|
8
|
%
|
0
|
%
|
0
|
%
|
0
|
%
|
0
|
%
|
0
|
%
|
0
|
%
|
||||||||||
|
FICO:
701 -
720
|
6
|
%
|
5
|
%
|
5
|
%
|
0
|
%
|
0
|
%
|
0
|
%
|
0
|
%
|
0
|
%
|
0
|
%
|
||||||||||
|
FICO:
721 -
740
|
4
|
%
|
4
|
%
|
4
|
%
|
0
|
%
|
0
|
%
|
0
|
%
|
0
|
%
|
0
|
%
|
0
|
%
|
||||||||||
|
FICO:
741 -
760
|
3
|
%
|
2
|
%
|
2
|
%
|
0
|
%
|
0
|
%
|
0
|
%
|
0
|
%
|
0
|
%
|
0
|
%
|
||||||||||
|
FICO:
761 -
780
|
2
|
%
|
2
|
%
|
2
|
%
|
0
|
%
|
0
|
%
|
0
|
%
|
0
|
%
|
0
|
%
|
0
|
%
|
||||||||||
|
FICO:
781 -
800
|
1
|
%
|
1
|
%
|
1
|
%
|
0
|
%
|
0
|
%
|
0
|
%
|
0
|
%
|
0
|
%
|
0
|
%
|
||||||||||
|
FICO:
>=
801
|
0
|
%
|
0
|
%
|
0
|
%
|
0
|
%
|
0
|
%
|
0
|
%
|
0
|
%
|
0
|
%
|
0
|
%
|
||||||||||
|
Unknown
|
0
|
%
|
0
|
%
|
0
|
%
|
0
|
%
|
0
|
%
|
0
|
%
|
0
|
%
|
0
|
%
|
0
|
%
|
||||||||||
|
|
|
|
|
|
|
|
|
|
|
|||||||||||||||||||
|
Conforming
at
Origination %
|
77
|
%
|
75
|
%
|
75
|
%
|
0
|
%
|
0
|
%
|
0
|
%
|
0
|
%
|
0
|
%
|
0
|
%
|
||||||||||
|
>
$1
MM
%
|
0
|
%
|
0
|
%
|
0
|
%
|
0
|
%
|
0
|
%
|
0
|
%
|
0
|
%
|
0
|
%
|
0
|
%
|
||||||||||
|
|
|
|
|
|
|
|
|
|
|
|||||||||||||||||||
|
2nd
Home
%
|
2
|
%
|
1
|
%
|
1
|
%
|
0
|
%
|
0
|
%
|
0
|
%
|
0
|
%
|
0
|
%
|
0
|
%
|
||||||||||
|
Investment
Home %
|
9
|
%
|
8
|
%
|
8
|
%
|
0
|
%
|
0
|
%
|
0
|
%
|
0
|
%
|
0
|
%
|
0
|
%
|
||||||||||
|
|
|
|
|
|
|
|
|
|
|
|||||||||||||||||||
|
Purchase
|
52
|
%
|
50
|
%
|
50
|
%
|
0
|
%
|
0
|
%
|
0
|
%
|
0
|
%
|
0
|
%
|
0
|
%
|
||||||||||
|
Cash
Out
Refi
|
44
|
%
|
47
|
%
|
47
|
%
|
0
|
%
|
0
|
%
|
0
|
%
|
0
|
%
|
0
|
%
|
0
|
%
|
||||||||||
|
Rate-Term
Refi
|
4
|
%
|
3
|
%
|
3
|
%
|
0
|
%
|
0
|
%
|
0
|
%
|
0
|
%
|
0
|
%
|
0
|
%
|
||||||||||
|
Construction
|
0
|
%
|
0
|
%
|
0
|
%
|
0
|
%
|
0
|
%
|
0
|
%
|
0
|
%
|
0
|
%
|
0
|
%
|
||||||||||
|
Other
|
0
|
%
|
0
|
%
|
0
|
%
|
0
|
%
|
0
|
%
|
0
|
%
|
0
|
%
|
0
|
%
|
0
|
%
|
||||||||||
|
|
|
|
|
|
|
|
|
|
|
|||||||||||||||||||
|
Full
Doc
|
49
|
%
|
53
|
%
|
53
|
%
|
0
|
%
|
0
|
%
|
0
|
%
|
0
|
%
|
0
|
%
|
0
|
%
|
||||||||||
|
No
Doc
|
1
|
%
|
0
|
%
|
0
|
%
|
0
|
%
|
0
|
%
|
0
|
%
|
0
|
%
|
0
|
%
|
0
|
%
|
||||||||||
|
Other
Doc
(Lim, Red, Stated, etc)
|
50
|
%
|
47
|
%
|
47
|
%
|
0
|
%
|
0
|
%
|
0
|
%
|
0
|
%
|
0
|
%
|
0
|
%
|
||||||||||
|
|
|
|
|
|
|
|
|
|
|
|||||||||||||||||||
|
2-4
Family
|
7
|
%
|
7
|
%
|
7
|
%
|
0
|
%
|
0
|
%
|
0
|
%
|
0
|
%
|
0
|
%
|
0
|
%
|
||||||||||
|
Condo
|
7
|
%
|
7
|
%
|
7
|
%
|
0
|
%
|
0
|
%
|
0
|
%
|
0
|
%
|
0
|
%
|
0
|
%
|
||||||||||
|
Single
Family
|
86
|
%
|
86
|
%
|
86
|
%
|
0
|
%
|
0
|
%
|
0
|
%
|
0
|
%
|
0
|
%
|
0
|
%
|
||||||||||
|
Other
|
0
|
%
|
0
|
%
|
0
|
%
|
0
|
%
|
0
|
%
|
0
|
%
|
0
|
%
|
0
|
%
|
0
|
%
|
||||||||||
|
Table
13 - Other Real Estate Investments
and Underlying Characteristics
(all $
in thousands)
|
||||||||||||||||||||||||||||
|
Q1
2007
|
Q4
2006
|
Q3
2006
|
Q2
2006
|
Q1
2006
|
Q4
2005
|
Q3
2005
|
Q2
2005
|
Q1
2005
|
||||||||||||||||||||
|
Market
Value
|
$
|
50,057
|
$
|
0
|
$
|
0
|
$
|
0
|
$
|
0
|
$
|
0
|
$
|
0
|
$
|
0
|
$
|
0
|
||||||||||
|
|
|
|
|
|
|
|
|
|
|
|||||||||||||||||||
|
Current
Rating
|
|
|
|
|
|
|
|
|
|
|||||||||||||||||||
|
AAA
|
$
|
2,038
|
$
|
0
|
$
|
0
|
$
|
0
|
$
|
0
|
$
|
0
|
$
|
0
|
$
|
0
|
$
|
0
|
||||||||||
|
AA
|
0
|
0
|
0
|
0
|
0
|
0
|
0
|
0
|
0
|
|||||||||||||||||||
|
A
|
18,699
|
0
|
0
|
0
|
0
|
0
|
0
|
0
|
0
|
|||||||||||||||||||
|
BBB
|
5,729
|
0
|
0
|
0
|
0
|
0
|
0
|
0
|
0
|
|||||||||||||||||||
|
BB
|
4,185
|
0
|
0
|
0
|
0
|
0
|
0
|
0
|
0
|
|||||||||||||||||||
|
B
|
0
|
0
|
0
|
0
|
0
|
0
|
0
|
0
|
0
|
|||||||||||||||||||
|
Non
Rated
|
19,406
|
0
|
0
|
0
|
0
|
0
|
0
|
0
|
0
|
|||||||||||||||||||
|
Total
market
value
|
$
|
50,057
|
$
|
0
|
$
|
0
|
$
|
0
|
$
|
0
|
$
|
0
|
$
|
0
|
$
|
0
|
$
|
0
|
||||||||||
|
|
|
|
|
|
|
|
|
|
|
|||||||||||||||||||
|
Security
Type
|
|
|
|
|
|
|
|
|
|
|||||||||||||||||||
|
ARM
|
$
|
422
|
$
|
0
|
$
|
0
|
$
|
0
|
$
|
0
|
$
|
0
|
$
|
0
|
$
|
0
|
$
|
0
|
||||||||||
|
Option
ARM
|
3,198
|
0
|
0
|
0
|
0
|
0
|
0
|
0
|
0
|
|||||||||||||||||||
|
Hybrid
|
43,969
|
0
|
0
|
0
|
0
|
0
|
0
|
0
|
0
|
|||||||||||||||||||
|
Fixed
|
2,468
|
0
|
0
|
0
|
0
|
0
|
0
|
0
|
0
|
|||||||||||||||||||
|
Total
market
value
|
$
|
50,057
|
$
|
0
|
$
|
0
|
$
|
0
|
$
|
0
|
$
|
0
|
$
|
0
|
$
|
0
|
$
|
0
|
||||||||||
|
|
|
|
|
|
|
|
|
|
|
|||||||||||||||||||
|
Interest
income
|
$
|
2,997
|
$
|
0
|
$
|
0
|
$
|
0
|
$
|
0
|
$
|
0
|
$
|
0
|
$
|
0
|
$
|
0
|
||||||||||
|
Discount
amortization
|
(532
|
)
|
0
|
0
|
0
|
0
|
0
|
0
|
0
|
0
|
||||||||||||||||||
|
Total
interest
income
|
$
|
2,465
|
$
|
0
|
$
|
0
|
$
|
0
|
$
|
0
|
$
|
0
|
$
|
0
|
$
|
0
|
$
|
0
|
||||||||||
|
|
|
|
|
|
|
|
|
|
|
|||||||||||||||||||
|
Avg
Balance
|
$
|
37,169
|
$
|
0
|
$
|
0
|
$
|
0
|
$
|
0
|
$
|
0
|
$
|
0
|
$
|
0
|
$
|
0
|
||||||||||
|
|
|
|
|
|
|
|
|
|
|
|||||||||||||||||||
|
Interest
income %
|
32.25
|
%
|
0.00
|
%
|
0.00
|
%
|
0.00
|
%
|
0.00
|
%
|
0.00
|
%
|
0.00
|
%
|
0.00
|
%
|
0.00
|
%
|
||||||||||
|
Discount
amort
%
|
-5.73
|
%
|
0.00
|
%
|
0.00
|
%
|
0.00
|
%
|
0.00
|
%
|
0.00
|
%
|
0.00
|
%
|
0.00
|
%
|
0.00
|
%
|
||||||||||
|
Yield
|
26.53
|
%
|
0.00
|
%
|
0.00
|
%
|
0.00
|
%
|
0.00
|
%
|
0.00
|
%
|
0.00
|
%
|
0.00
|
%
|
0.00
|
%
|
||||||||||
|
Table
14: Residential Real Estate Loan
Characteristics (all $ in
thousands)
|
||||||||||||||||||||||||||||
|
Q1:2007
|
Q4:2006
|
Q3:2006
|
Q2:2006
|
Q1:2006
|
Q4:2005
|
Q3:2005
|
Q2:2005
|
Q1:2005
|
||||||||||||||||||||
|
Residential
Loans
|
$
|
8,582,964
|
$
|
9,212,002
|
$
|
9,718,985
|
$
|
10,318,641
|
$
|
11,846,454
|
$
|
13,719,242
|
$
|
16,386,833
|
$
|
19,443,387
|
$
|
21,579,671
|
||||||||||
|
Number
of
loans
|
25,579
|
27,695
|
31,744
|
34,013
|
37,458
|
33,863
|
51,593
|
58,941
|
62,060
|
|||||||||||||||||||
|
Average
loan
size
|
$
|
336
|
$
|
333
|
$
|
306
|
$
|
303
|
$
|
316
|
$
|
405
|
$
|
318
|
$
|
330
|
$
|
348
|
||||||||||
|
Adjustable
%
|
79
|
%
|
85
|
%
|
89
|
%
|
99
|
%
|
99
|
%
|
98
|
%
|
100
|
%
|
100
|
%
|
100
|
%
|
||||||||||
|
Hybrid
%
|
20
|
%
|
15
|
%
|
11
|
%
|
1
|
%
|
1
|
%
|
2
|
%
|
0
|
%
|
0
|
%
|
0
|
%
|
||||||||||
|
Fixed
%
|
1
|
%
|
0
|
%
|
0
|
%
|
0
|
%
|
0
|
%
|
0
|
%
|
0
|
%
|
0
|
%
|
0
|
%
|
||||||||||
|
Amortizing
%
|
4
|
%
|
3
|
%
|
3
|
%
|
1
|
%
|
1
|
%
|
1
|
%
|
0
|
%
|
0
|
%
|
0
|
%
|
||||||||||
|
Interest-only
%
|
96
|
%
|
97
|
%
|
97
|
%
|
99
|
%
|
99
|
%
|
99
|
%
|
100
|
%
|
100
|
%
|
100
|
%
|
||||||||||
|
Negatively
amortizing %
|
0
|
%
|
0
|
%
|
0
|
%
|
0
|
%
|
0
|
%
|
0
|
%
|
0
|
%
|
0
|
%
|
0
|
%
|
||||||||||
|
Southern
California
|
14
|
%
|
13
|
%
|
12
|
%
|
11
|
%
|
11
|
%
|
11
|
%
|
11
|
%
|
12
|
%
|
12
|
%
|
||||||||||
|
Northern
California
|
10
|
%
|
10
|
%
|
10
|
%
|
10
|
%
|
10
|
%
|
12
|
%
|
11
|
%
|
12
|
%
|
12
|
%
|
||||||||||
|
Florida
|
13
|
%
|
12
|
%
|
12
|
%
|
13
|
%
|
12
|
%
|
13
|
%
|
12
|
%
|
11
|
%
|
11
|
%
|
||||||||||
|
New
York
|
6
|
%
|
6
|
%
|
6
|
%
|
6
|
%
|
6
|
%
|
5
|
%
|
5
|
%
|
5
|
%
|
5
|
%
|
||||||||||
|
Georgia
|
5
|
%
|
5
|
%
|
5
|
%
|
5
|
%
|
5
|
%
|
5
|
%
|
5
|
%
|
5
|
%
|
5
|
%
|
||||||||||
|
New
Jersey
|
4
|
%
|
4
|
%
|
4
|
%
|
4
|
%
|
4
|
%
|
4
|
%
|
4
|
%
|
4
|
%
|
4
|
%
|
||||||||||
|
Texas
|
5
|
%
|
5
|
%
|
5
|
%
|
5
|
%
|
5
|
%
|
4
|
%
|
4
|
%
|
4
|
%
|
4
|
%
|
||||||||||
|
Arizona
|
4
|
%
|
4
|
%
|
4
|
%
|
4
|
%
|
4
|
%
|
4
|
%
|
4
|
%
|
4
|
%
|
4
|
%
|
||||||||||
|
Illinois
|
3
|
%
|
3
|
%
|
3
|
%
|
2
|
%
|
2
|
%
|
2
|
%
|
3
|
%
|
3
|
%
|
3
|
%
|
||||||||||
|
Colorado
|
3
|
%
|
4
|
%
|
4
|
%
|
4
|
%
|
4
|
%
|
4
|
%
|
4
|
%
|
4
|
%
|
4
|
%
|
||||||||||
|
Virginia
|
3
|
%
|
3
|
%
|
3
|
%
|
3
|
%
|
3
|
%
|
3
|
%
|
3
|
%
|
3
|
%
|
3
|
%
|
||||||||||
|
Other
states
(none greater than 3%)
|
30
|
%
|
31
|
%
|
32
|
%
|
33
|
%
|
34
|
%
|
33
|
%
|
34
|
%
|
33
|
%
|
33
|
%
|
||||||||||
|
Year
2007
origination
|
3
|
%
|
0
|
%
|
0
|
%
|
0
|
%
|
0
|
%
|
0
|
%
|
0
|
%
|
0
|
%
|
0
|
%
|
||||||||||
|
Year
2006
origination
|
19
|
%
|
17
|
%
|
10
|
%
|
0
|
%
|
0
|
%
|
0
|
%
|
0
|
%
|
0
|
%
|
0
|
%
|
||||||||||
|
Year
2005
origination
|
5
|
%
|
5
|
%
|
5
|
%
|
5
|
%
|
5
|
%
|
6
|
%
|
5
|
%
|
4
|
%
|
3
|
%
|
||||||||||
|
Year
2004
origination or earlier
|
73
|
%
|
78
|
%
|
85
|
%
|
95
|
%
|
95
|
%
|
94
|
%
|
95
|
%
|
96
|
%
|
97
|
%
|
||||||||||
|
Wtd
Avg
Original LTV
|
68
|
%
|
68
|
%
|
68
|
%
|
68
|
%
|
68
|
%
|
69
|
%
|
68
|
%
|
69
|
%
|
68
|
%
|
||||||||||
|
Original
LTV:
0 - 50
|
15
|
%
|
16
|
%
|
15
|
%
|
15
|
%
|
15
|
%
|
13
|
%
|
14
|
%
|
13
|
%
|
13
|
%
|
||||||||||
|
Original
LTV:
50 - 60
|
12
|
%
|
12
|
%
|
12
|
%
|
12
|
%
|
12
|
%
|
11
|
%
|
11
|
%
|
11
|
%
|
11
|
%
|
||||||||||
|
Original
LTV:
60 - 70
|
20
|
%
|
20
|
%
|
20
|
%
|
21
|
%
|
21
|
%
|
21
|
%
|
20
|
%
|
20
|
%
|
20
|
%
|
||||||||||
|
Original
LTV:
70 - 80
|
46
|
%
|
45
|
%
|
46
|
%
|
45
|
%
|
45
|
%
|
48
|
%
|
46
|
%
|
47
|
%
|
46
|
%
|
||||||||||
|
Original
LTV:
80 - 90
|
2
|
%
|
2
|
%
|
2
|
%
|
2
|
%
|
2
|
%
|
2
|
%
|
2
|
%
|
2
|
%
|
2
|
%
|
||||||||||
|
Original
LTV:
90 - 100
|
5
|
%
|
5
|
%
|
5
|
%
|
5
|
%
|
5
|
%
|
5
|
%
|
7
|
%
|
7
|
%
|
8
|
%
|
||||||||||
|
Wtg
Avg FICO
|
727
|
733
|
730
|
730
|
730
|
731
|
731
|
731
|
731
|
|||||||||||||||||||
|
FICO:
<=
600
|
1
|
%
|
1
|
%
|
1
|
%
|
1
|
%
|
1
|
%
|
1
|
%
|
1
|
%
|
1
|
%
|
1
|
%
|
||||||||||
|
FICO:
601 -620
|
1
|
%
|
1
|
%
|
1
|
%
|
1
|
%
|
1
|
%
|
1
|
%
|
1
|
%
|
1
|
%
|
1
|
%
|
||||||||||
|
FICO:
621 -
640
|
2
|
%
|
1
|
%
|
1
|
%
|
1
|
%
|
2
|
%
|
1
|
%
|
1
|
%
|
1
|
%
|
1
|
%
|
||||||||||
|
FICO:
641 -660
|
3
|
%
|
3
|
%
|
3
|
%
|
3
|
%
|
3
|
%
|
3
|
%
|
3
|
%
|
3
|
%
|
3
|
%
|
||||||||||
|
FICO:
661 -
680
|
7
|
%
|
8
|
%
|
8
|
%
|
8
|
%
|
8
|
%
|
8
|
%
|
8
|
%
|
8
|
%
|
8
|
%
|
||||||||||
|
FICO:
681 -
700
|
12
|
%
|
12
|
%
|
12
|
%
|
12
|
%
|
12
|
%
|
12
|
%
|
12
|
%
|
12
|
%
|
12
|
%
|
||||||||||
|
FICO:
701 -
720
|
14
|
%
|
14
|
%
|
14
|
%
|
14
|
%
|
14
|
%
|
15
|
%
|
14
|
%
|
14
|
%
|
14
|
%
|
||||||||||
|
FICO:
721 -
740
|
13
|
%
|
13
|
%
|
14
|
%
|
13
|
%
|
13
|
%
|
13
|
%
|
14
|
%
|
14
|
%
|
14
|
%
|
||||||||||
|
FICO:
741 -
760
|
15
|
%
|
15
|
%
|
15
|
%
|
15
|
%
|
15
|
%
|
15
|
%
|
15
|
%
|
15
|
%
|
16
|
%
|
||||||||||
|
FICO:
761 -
780
|
17
|
%
|
17
|
%
|
17
|
%
|
17
|
%
|
17
|
%
|
17
|
%
|
17
|
%
|
17
|
%
|
17
|
%
|
||||||||||
|
FICO:
781 -
800
|
12
|
%
|
12
|
%
|
12
|
%
|
12
|
%
|
11
|
%
|
11
|
%
|
11
|
%
|
11
|
%
|
11
|
%
|
||||||||||
|
FICO:
>=
801
|
3
|
%
|
3
|
%
|
2
|
%
|
3
|
%
|
3
|
%
|
3
|
%
|
3
|
%
|
3
|
%
|
2
|
%
|
||||||||||
|
Conforming
balance at origination %
|
37
|
%
|
38
|
%
|
41
|
%
|
45
|
%
|
37
|
%
|
38
|
%
|
37
|
%
|
37
|
%
|
36
|
%
|
||||||||||
|
%
balance in
loans > $1mm per loan
|
16
|
%
|
18
|
%
|
14
|
%
|
14
|
%
|
14
|
%
|
13
|
%
|
14
|
%
|
13
|
%
|
13
|
%
|
||||||||||
|
2nd
home %
|
11
|
%
|
11
|
%
|
11
|
%
|
11
|
%
|
11
|
%
|
10
|
%
|
10
|
%
|
10
|
%
|
10
|
%
|
||||||||||
|
Investment
home %
|
3
|
%
|
3
|
%
|
3
|
%
|
3
|
%
|
3
|
%
|
2
|
%
|
2
|
%
|
2
|
%
|
2
|
%
|
||||||||||
|
Purchase
|
35
|
%
|
34
|
%
|
34
|
%
|
33
|
%
|
33
|
%
|
33
|
%
|
33
|
%
|
33
|
%
|
34
|
%
|
||||||||||
|
Cash
out
refinance
|
31
|
%
|
32
|
%
|
32
|
%
|
32
|
%
|
34
|
%
|
34
|
%
|
34
|
%
|
34
|
%
|
34
|
%
|
||||||||||
|
Rate-term
refinance
|
32
|
%
|
32
|
%
|
32
|
%
|
34
|
%
|
32
|
%
|
32
|
%
|
32
|
%
|
32
|
%
|
31
|
%
|
||||||||||
|
Construction
|
0
|
%
|
0
|
%
|
0
|
%
|
0
|
%
|
0
|
%
|
0
|
%
|
0
|
%
|
0
|
%
|
0
|
%
|
||||||||||
|
Other
|
2
|
%
|
2
|
%
|
2
|
%
|
1
|
%
|
1
|
%
|
1
|
%
|
1
|
%
|
1
|
%
|
1
|
%
|
||||||||||
|
Table
15: Commercial Real Estate Loans
Credit Performance (all $ in
thousands)
|
|||||||||||||||||||||||||||||||||||||
|
Managed
Loans
|
Internally-Designated
Credit Reserve
|
External
Credit Enhancement
|
Total
Credit Protection (1)
|
Total
Credit Protection as % of Loans
|
Seriously
Delinquent Loans
|
Seriously
Delinquent Loan % of Current Balance
|
Total
Credit Losses
|
Third
Parties' Share of Net Charge-offs/
(Recoveries)
|
Redwood's
Share of Net Charge-offs/ (Recoveries)
|
Total
Credit Losses As % of Loans (Annualized)
|
|||||||||||||||||||||||||||
|
Total
Managed Commercial Portfolio
|
Q1:
2005
|
$
|
27,830,707
|
$
|
97,127
|
$
|
557,480
|
$
|
654,607
|
2.35
|
%
|
$
|
15,305
|
0.05
|
%
|
$
|
315
|
$
|
0
|
$
|
315
|
0.00
|
%
|
||||||||||||||
|
Q2:
2005
|
31,324,563
|
95,351
|
681,133
|
776,484
|
2.48
|
%
|
35,971
|
0.11
|
%
|
1,213
|
1,213
|
-
|
0.02
|
%
|
|||||||||||||||||||||||
|
Q3:
2005
|
40,081,879
|
146,671
|
706,532
|
853,203
|
2.13
|
%
|
20,690
|
0.05
|
%
|
59
|
59
|
-
|
0.00
|
%
|
|||||||||||||||||||||||
|
Q4:
2005
|
46,825,453
|
149,947
|
714,168
|
864,115
|
1.85
|
%
|
40,916
|
0.09
|
%
|
-
|
-
|
-
|
0.00
|
%
|
|||||||||||||||||||||||
|
2005
|
46,825,453
|
149,947
|
714,168
|
864,115
|
1.85
|
%
|
40,916
|
0.09
|
%
|
1,587
|
1,272
|
315
|
0.00
|
%
|
|||||||||||||||||||||||
|
Q1:
2006
|
48,366,213
|
175,913
|
645,675
|
821,588
|
1.70
|
%
|
38,124
|
0.08
|
%
|
90
|
55
|
35
|
0.00
|
%
|
|||||||||||||||||||||||
|
Q2:
2006
|
51,635,796
|
200,275
|
653,476
|
853,751
|
1.65
|
%
|
44,632
|
0.09
|
%
|
1,463
|
1,463
|
-
|
0.01
|
%
|
|||||||||||||||||||||||
|
Q3:
2006
|
58,106,355
|
266,523
|
678,489
|
945,012
|
1.63
|
%
|
70,586
|
0.12
|
%
|
2,167
|
1,705
|
462
|
0.01
|
%
|
|||||||||||||||||||||||
|
Q4:
2006
|
57,789,159
|
303,481
|
472,669
|
776,150
|
1.34
|
%
|
64,367
|
0.11
|
%
|
1,156
|
1,132
|
24
|
0.01
|
%
|
|||||||||||||||||||||||
|
2006
|
57,789,159
|
303,481
|
472,669
|
776,150
|
1.34
|
%
|
64,367
|
0.11
|
%
|
4,876
|
4,355
|
521
|
0.03
|
%
|
|||||||||||||||||||||||
|
Q1:
2007
|
$
|
57,450,042
|
$
|
304,955
|
$
|
551,917
|
$
|
856,872
|
1.49
|
%
|
$
|
77,726
|
0.14
|
%
|
$
|
1,471
|
$
|
1,417
|
$
|
24
|
0.01
|
%
|
|||||||||||||||
|
Commercial
Real Estate Loans
|
Q1:
2005
|
$
|
67,365
|
$
|
8,456
|
$
|
0
|
$
|
8,456
|
12.55
|
%
|
$
|
0
|
0.00
|
%
|
$
|
315
|
$
|
0
|
$
|
315
|
1.87
|
%
|
||||||||||||||
|
Q2:
2005
|
51,778
|
8,141
|
-
|
8,141
|
15.72
|
%
|
-
|
0.00
|
%
|
-
|
-
|
-
|
0.00
|
%
|
|||||||||||||||||||||||
|
Q3:
2005
|
66,348
|
8,141
|
-
|
8,141
|
12.27
|
%
|
-
|
0.00
|
%
|
-
|
-
|
-
|
0.00
|
%
|
|||||||||||||||||||||||
|
Q4:
2005
|
70,091
|
8,141
|
-
|
8,141
|
11.61
|
%
|
-
|
0.00
|
%
|
-
|
-
|
-
|
0.00
|
%
|
|||||||||||||||||||||||
|
2005
|
70,091
|
8,141
|
-
|
8,141
|
11.61
|
%
|
-
|
0.00
|
%
|
315
|
-
|
315
|
0.45
|
%
|
|||||||||||||||||||||||
|
Q1:
2006
|
65,508
|
8,141
|
-
|
8,141
|
12.43
|
%
|
-
|
0.00
|
%
|
35
|
-
|
35
|
0.21
|
%
|
|||||||||||||||||||||||
|
Q2:
2006
|
46,959
|
8,141
|
-
|
8,141
|
17.34
|
%
|
-
|
0.00
|
%
|
-
|
-
|
-
|
0.00
|
%
|
|||||||||||||||||||||||
|
Q3:
2006
|
42,384
|
8,141
|
-
|
8,141
|
19.21
|
%
|
-
|
0.00
|
%
|
-
|
-
|
-
|
0.00
|
%
|
|||||||||||||||||||||||
|
Q4:
2006
|
38,360
|
8,141
|
-
|
8,141
|
21.22
|
%
|
-
|
0.00
|
%
|
-
|
-
|
-
|
0.00
|
%
|
|||||||||||||||||||||||
|
2006
|
38,360
|
8,141
|
-
|
8,141
|
21.22
|
%
|
-
|
0.00
|
%
|
35
|
-
|
35
|
0.36
|
%
|
|||||||||||||||||||||||
|
Q1:
2007
|
$
|
38,394
|
$
|
10,489
|
$
|
0
|
$
|
10,489
|
27.32
|
%
|
$
|
0
|
0.00
|
%
|
$
|
0
|
$
|
0
|
$
|
0
|
0.00
|
%
|
|||||||||||||||
|
Commercial
CES
|
Q1:
2005
|
$
|
27,763,342
|
$
|
88,671
|
$
|
557,480
|
$
|
646,151
|
2.33
|
%
|
$
|
15,305
|
0.06
|
%
|
$
|
0
|
$
|
0
|
$
|
0
|
0.00
|
%
|
||||||||||||||
|
Q2:
2005
|
31,272,785
|
87,210
|
681,133
|
768,343
|
2.46
|
%
|
35,971
|
0.12
|
%
|
1,213
|
1,213
|
-
|
0.02
|
%
|
|||||||||||||||||||||||
|
Q3:
2005
|
40,015,531
|
138,530
|
706,532
|
845,062
|
2.11
|
%
|
20,690
|
0.05
|
%
|
59
|
59
|
-
|
0.00
|
%
|
|||||||||||||||||||||||
|
Q4:
2005
|
46,755,362
|
141,806
|
714,168
|
855,974
|
1.83
|
%
|
40,916
|
0.09
|
%
|
-
|
-
|
-
|
0.00
|
%
|
|||||||||||||||||||||||
|
2005
|
46,755,362
|
141,806
|
714,168
|
855,974
|
1.83
|
%
|
40,916
|
0.09
|
%
|
1,272
|
1,272
|
-
|
0.00
|
%
|
|||||||||||||||||||||||
|
Q1:
2006
|
48,300,705
|
167,772
|
645,675
|
813,447
|
1.68
|
%
|
38,124
|
0.08
|
%
|
55
|
55
|
-
|
0.00
|
%
|
|||||||||||||||||||||||
|
Q2:
2006
|
51,588,837
|
192,134
|
653,476
|
845,610
|
1.64
|
%
|
44,632
|
0.09
|
%
|
1,463
|
1,463
|
-
|
0.01
|
%
|
|||||||||||||||||||||||
|
Q3:
2006
|
58,063,971
|
258,382
|
678,489
|
936,871
|
1.61
|
%
|
70,586
|
0.12
|
%
|
2,167
|
1,705
|
462
|
0.01
|
%
|
|||||||||||||||||||||||
|
Q4:
2006
|
57,750,799
|
295,340
|
472,669
|
768,009
|
1.33
|
%
|
64,367
|
0.11
|
%
|
1,156
|
1,132
|
24
|
0.01
|
%
|
|||||||||||||||||||||||
|
2006
|
57,750,799
|
295,340
|
472,669
|
768,009
|
1.33
|
%
|
64,367
|
0.11
|
%
|
4,841
|
4,355
|
486
|
0.01
|
%
|
|||||||||||||||||||||||
|
Q1:
2007
|
$
|
57,411,648
|
$
|
294,466
|
$
|
551,917
|
$
|
846,383
|
1.47
|
%
|
$
|
77,726
|
0.14
|
%
|
$
|
1,471
|
$
|
1,417
|
$
|
24
|
0.01
|
%
|
|||||||||||||||
|
(1)
The
credit reserve on commercial real
estate loans is only available
to absorb
losses on our commercial real estate
loan portfolio. Internally-designated
credit reserves and external credit
enhancement are only available
to
absorb losses on the commercial
CES. Much of the external credit
enhancement will share loan losses
with Redwood rather than protect
Redwood from losses.
|
|||||||||||||||||||||||||||||||||||||
|
Table
16: Commercial CES Underlying
Loan Characteristics (all $ in
thousands)
|
||||||||||||||||||||||||||||
|
Q1:2007
|
Q4:2006
|
Q3:2006
|
Q2:2006
|
Q1:2006
|
Q4:2005
|
Q3:2005
|
Q2:2005
|
Q1:2005
|
||||||||||||||||||||
|
Commercial
CES
Loans
|
$
|
57,411,648
|
$
|
57,750,799
|
$
|
58,063,971
|
$
|
51,588,837
|
$
|
48,300,705
|
$
|
46,755,362
|
$
|
40,015,531
|
$
|
31,272,785
|
$
|
27,763,342
|
||||||||||
|
Number
of
loans
|
3,968
|
3,889
|
4,032
|
3,456
|
3,737
|
3,618
|
2,866
|
2,248
|
2,059
|
|||||||||||||||||||
|
Average
face
value
|
$
|
14,469
|
$
|
14,850
|
$
|
14,401
|
$
|
14,927
|
$
|
12,925
|
$
|
12,923
|
$
|
13,962
|
$
|
13,911
|
$
|
13,484
|
||||||||||
|
State
Distribution
|
||||||||||||||||||||||||||||
|
CA
|
17
|
%
|
17
|
%
|
18
|
%
|
18
|
%
|
17
|
%
|
17
|
%
|
16
|
%
|
18
|
%
|
17
|
%
|
||||||||||
|
NY
|
13
|
%
|
13
|
%
|
11
|
%
|
12
|
%
|
12
|
%
|
13
|
%
|
13
|
%
|
14
|
%
|
16
|
%
|
||||||||||
|
TX
|
8
|
%
|
8
|
%
|
5
|
%
|
6
|
%
|
6
|
%
|
6
|
%
|
7
|
%
|
7
|
%
|
7
|
%
|
||||||||||
|
VA
|
4
|
%
|
4
|
%
|
2
|
%
|
2
|
%
|
2
|
%
|
2
|
%
|
3
|
%
|
1
|
%
|
1
|
%
|
||||||||||
|
FL
|
6
|
%
|
6
|
%
|
5
|
%
|
5
|
%
|
5
|
%
|
5
|
%
|
5
|
%
|
4
|
%
|
4
|
%
|
||||||||||
|
Other
|
52
|
%
|
52
|
%
|
59
|
%
|
57
|
%
|
58
|
%
|
57
|
%
|
56
|
%
|
56
|
%
|
55
|
%
|
||||||||||
|
Property
Type Distribution
|
||||||||||||||||||||||||||||
|
Office
|
35
|
%
|
37
|
%
|
30
|
%
|
36
|
%
|
32
|
%
|
37
|
%
|
39
|
%
|
40
|
%
|
40
|
%
|
||||||||||
|
Retail
|
30
|
%
|
31
|
%
|
32
|
%
|
32
|
%
|
33
|
%
|
33
|
%
|
34
|
%
|
34
|
%
|
34
|
%
|
||||||||||
|
Multi-family
|
12
|
%
|
12
|
%
|
11
|
%
|
11
|
%
|
16
|
%
|
12
|
%
|
10
|
%
|
10
|
%
|
12
|
%
|
||||||||||
|
Hospitality
|
7
|
%
|
7
|
%
|
6
|
%
|
5
|
%
|
7
|
%
|
3
|
%
|
5
|
%
|
4
|
%
|
3
|
%
|
||||||||||
|
Self-storage
|
3
|
%
|
3
|
%
|
0
|
%
|
0
|
%
|
0
|
%
|
0
|
%
|
0
|
%
|
0
|
%
|
0
|
%
|
||||||||||
|
Industrial
|
3
|
%
|
3
|
%
|
1
|
%
|
1
|
%
|
2
|
%
|
2
|
%
|
1
|
%
|
2
|
%
|
2
|
%
|
||||||||||
|
Other
|
10
|
%
|
7
|
%
|
20
|
%
|
15
|
%
|
10
|
%
|
13
|
%
|
11
|
%
|
10
|
%
|
9
|
%
|
||||||||||
|
|
||||||||||||||||||||||||||||
|
Weighted
average LTV
|
68
|
%
|
69
|
%
|
69
|
%
|
69
|
%
|
68
|
%
|
68
|
%
|
68
|
%
|
67
|
%
|
68
|
%
|
||||||||||
|
|
||||||||||||||||||||||||||||
|
Weighted
average debt service coverage
ratio
|
1.73
|
1.60
|
1.72
|
1.75
|
1.99
|
2.05
|
1.88
|
1.79
|
1.86
|
|||||||||||||||||||
|
|
||||||||||||||||||||||||||||
|
Table
17: Commercial Real Estate
Loan Characteristics (all $
in
thousands)
|
||||||||||||||||||||||||||||
|
Q1:2007
|
|
Q4:2006
|
|
Q3:2006
|
|
Q2:2006
|
|
Q1:2006
|
|
Q4:2005
|
|
Q3:2005
|
|
Q2:2005
|
|
Q1:2005
|
||||||||||||
|
Commercial
mortgage loans, reported value
|
$
|
25,883
|
$
|
28,172
|
$
|
32,170
|
$
|
36,722
|
$
|
55,167
|
$
|
59,692
|
$
|
56,102
|
$
|
41,794
|
$
|
56,604
|
||||||||||
|
Number
of
loans
|
7
|
7
|
8
|
9
|
12
|
13
|
12
|
9
|
12
|
|||||||||||||||||||
|
Average
loan
size
|
$
|
3,698
|
$
|
4,025
|
$
|
4,021
|
$
|
4,080
|
$
|
4,597
|
$
|
4,592
|
$
|
4,675
|
$
|
4,644
|
$
|
4,717
|
||||||||||
|
Seriously
delinquent loans
|
-
|
-
|
-
|
-
|
-
|
-
|
-
|
-
|
-
|
|||||||||||||||||||
|
Realized
credit losses
|
-
|
-
|
-
|
-
|
-
|
-
|
-
|
-
|
-
|
|||||||||||||||||||
|
California
%
(based on reported value)
|
1
|
%
|
7
|
%
|
7
|
%
|
6
|
%
|
19
|
%
|
25
|
%
|
28
|
%
|
37
|
%
|
42
|
%
|
||||||||||
|
Table
18: Securities Portfolios Credit
Rating and Collateral Type (in
millions)
|
|||||||||||||||||||||||||
|
CURRENT
RATING
|
|||||||||||||||||||||||||
|
At
March 31, 2007:
|
|||||||||||||||||||||||||
|
Total
|
|
AAA
|
|
AA
|
|
A
|
|
BBB
|
|
BB
|
|
B
|
|
Unrated
|
|||||||||||
|
Residential
prime
|
$
|
1,361
|
$
|
67
|
$
|
180
|
$
|
247
|
$
|
295
|
$
|
316
|
$
|
132
|
$
|
124
|
|||||||||
|
Residential
alt-a
|
938
|
207
|
92
|
225
|
243
|
101
|
30
|
40
|
|||||||||||||||||
|
Residential
sub-prime
|
480
|
8
|
152
|
173
|
138
|
9
|
-
|
-
|
|||||||||||||||||
|
Other
real
estate investments
|
50
|
2
|
-
|
19
|
6
|
4
|
-
|
19
|
|||||||||||||||||
|
Commercial
|
551
|
9
|
4
|
24
|
79
|
222
|
89
|
124
|
|||||||||||||||||
|
CDO
|
270
|
86
|
27
|
57
|
84
|
13
|
-
|
3
|
|||||||||||||||||
|
Total
securities portfolio market value
|
$
|
3,650
|
$
|
379
|
$
|
455
|
$
|
745
|
$
|
845
|
$
|
665
|
$
|
251
|
$
|
310
|
|||||||||
|
CURRENT
RATING
|
|||||||||||||||||||||||||
|
At
December 31, 2006:
|
|||||||||||||||||||||||||
|
Total
|
|
AAA
|
|
AA
|
|
A
|
|
BBB
|
|
BB
|
|
B
|
|
Unrated
|
|||||||||||
|
Residential
prime
|
$
|
1,278
|
$
|
14
|
$
|
181
|
$
|
243
|
$
|
285
|
$
|
307
|
$
|
119
|
$
|
129
|
|||||||||
|
Residential
alt-a
|
613
|
136
|
84
|
106
|
130
|
94
|
23
|
40
|
|||||||||||||||||
|
Residential
sub-prime
|
528
|
8
|
127
|
209
|
174
|
7
|
-
|
3
|
|||||||||||||||||
|
Commercial
|
568
|
9
|
2
|
16
|
93
|
224
|
90
|
134
|
|||||||||||||||||
|
CDO
|
246
|
66
|
30
|
52
|
76
|
14
|
-
|
8
|
|||||||||||||||||
|
Total
securities portfolio market value
|
$
|
3,233
|
$
|
233
|
$
|
424
|
$
|
626
|
$
|
757
|
$
|
648
|
$
|
232
|
$
|
313
|
|||||||||
|
Table
19: Sequoia ABS Issued
|
||||||||||||||||
|
(all
$ in thousands)
|
||||||||||||||||
|
|
Outstanding
|
|||||||||||||||
|
|
|
Original
|
|
Estimated
|
Balance
|
|||||||||||
|
Sequoia
|
Issue
|
Issue
|
Stated
|
Callable
|
March
31,
|
|||||||||||
|
ABS
Issued
|
Date
|
Amount
|
Maturity
|
Date
|
2007
|
|||||||||||
|
Sequoia
1
|
07/29/97
|
$
|
534,347
|
2028
|
Called
|
$
|
-
|
|||||||||
|
Sequoia
2
|
11/06/97
|
749,160
|
2029
|
Called
|
-
|
|||||||||||
|
Sequoia
3
|
06/26/98
|
635,288
|
2028
|
Called
|
-
|
|||||||||||
|
Sequoia
1A
|
05/04/99
|
157,266
|
2028
|
Called
|
-
|
|||||||||||
|
Sequoia
4
|
03/21/00
|
377,119
|
2024
|
2007
|
65,457
|
|||||||||||
|
Sequoia
5
|
10/29/01
|
510,047
|
2026
|
2007
|
95,447
|
|||||||||||
|
Sequoia
6
|
04/26/02
|
506,142
|
2027
|
2007
|
104,604
|
|||||||||||
|
Sequoia
7
|
05/29/02
|
572,000
|
2032
|
Called
|
-
|
|||||||||||
|
Sequoia
8
|
07/30/02
|
642,998
|
2032
|
Called
|
-
|
|||||||||||
|
Sequoia
9
|
08/28/02
|
558,266
|
2032
|
2007
|
89,332
|
|||||||||||
|
Sequoia
10
|
09/26/02
|
1,041,600
|
2027
|
2008
|
218,151
|
|||||||||||
|
Sequoia
11
|
10/30/02
|
704,936
|
2032
|
2007
|
117,516
|
|||||||||||
|
Sequoia
12
|
12/19/02
|
1,096,891
|
2033
|
Called
|
-
|
|||||||||||
|
Sequoia
2003-1
|
02/27/03
|
1,012,321
|
2033
|
2007
|
199,260
|
|||||||||||
|
Sequoia
2003-2
|
04/29/03
|
815,080
|
2022
|
2007
|
155,841
|
|||||||||||
|
Sequoia
2003-3
|
06/26/03
|
538,452
|
2023
|
2007
|
101,944
|
|||||||||||
|
MLCC
2003-C
|
06/26/03
|
984,349
|
2023
|
2008
|
212,945
|
|||||||||||
|
MLCC
2003-D
|
07/29/03
|
1,003,591
|
2028
|
2008
|
226,783
|
|||||||||||
|
Sequoia
2003-4
|
07/29/03
|
504,273
|
2033
|
2007
|
171,936
|
|||||||||||
|
Sequoia
2003-5
|
08/27/03
|
840,248
|
2033
|
2007
|
136,923
|
|||||||||||
|
Sequoia
2003-6
|
10/29/03
|
649,999
|
2033
|
Called
|
-
|
|||||||||||
|
Sequoia
2003-7
|
11/25/03
|
811,707
|
2034
|
Called
|
-
|
|||||||||||
|
Sequoia
2003-8
|
12/23/03
|
964,238
|
2034
|
2007
|
201,343
|
|||||||||||
|
MLCC
2003-E
|
08/28/03
|
983,852
|
2028
|
2008
|
223,532
|
|||||||||||
|
MLCC
2003-F
|
09/25/03
|
1,297,913
|
2028
|
2007
|
293,348
|
|||||||||||
|
MLCC
2003-H
|
12/22/03
|
739,196
|
2029
|
2008
|
157,211
|
|||||||||||
|
Table
19: Sequoia ABS Issued
|
||||||||||||||||
|
(all
$ in thousands)
|
||||||||||||||||
|
|
Outstanding
|
|||||||||||||||
|
|
|
Original
|
|
Estimated
|
Balance
|
|||||||||||
|
Sequoia
|
Issue
|
Issue
|
Stated
|
Callable
|
March
31,
|
|||||||||||
|
ABS
Issued
|
Date
|
Amount
|
Maturity
|
Date
|
2007
|
|||||||||||
|
Sequoia
2004-1
|
01/28/04
|
$
|
616,562
|
2034
|
2007
|
$
|
120,444
|
|||||||||
|
Sequoia
2004-2
|
02/25/04
|
690,548
|
2034
|
2007
|
132,810
|
|||||||||||
|
Sequoia
2004-3
|
03/30/04
|
917,673
|
2034
|
2007
|
164,666
|
|||||||||||
|
Sequoia
2004-4
|
04/29/04
|
808,933
|
2010
|
2007
|
166,300
|
|||||||||||
|
Sequoia
2004-5
|
05/27/04
|
831,540
|
2012
|
2008
|
176,121
|
|||||||||||
|
Sequoia
2004-6
|
06/29/04
|
910,662
|
2012
|
2008
|
205,194
|
|||||||||||
|
SEMHT
2004-01
|
06/29/04
|
317,044
|
2014
|
2008
|
85,244
|
|||||||||||
|
Sequoia
2004-7
|
07/29/04
|
1,032,685
|
2034
|
2008
|
199,197
|
|||||||||||
|
Sequoia
2004-8
|
08/27/04
|
807,699
|
2034
|
2008
|
192,160
|
|||||||||||
|
Sequoia
2004-9
|
09/29/04
|
772,831
|
2034
|
2008
|
217,535
|
|||||||||||
|
Sequoia
2004-10
|
10/28/04
|
673,356
|
2034
|
2008
|
183,412
|
|||||||||||
|
Sequoia
2004-11
|
11/23/04
|
705,746
|
2034
|
2008
|
236,835
|
|||||||||||
|
Sequoia
2004-12
|
12/22/04
|
821,955
|
2035
|
2008
|
221,569
|
|||||||||||
|
Sequoia
2005-1
|
01/27/05
|
409,071
|
2035
|
2008
|
130,387
|
|||||||||||
|
Sequoia
2005-2
|
02/24/05
|
338,481
|
2035
|
2008
|
93,055
|
|||||||||||
|
Sequoia
2005-3
|
04/28/05
|
359,182
|
2035
|
2008
|
114,142
|
|||||||||||
|
Madrona
2005-A
|
08/25/05
|
5,400
|
2008
|
2008
|
5,400
|
|||||||||||
|
Sequoia
2005-4
|
09/29/05
|
324,576
|
2035
|
2009
|
205,212
|
|||||||||||
|
Sequoia
2006-1
|
08/30/06
|
742,507
|
2046
|
2011
|
644,784
|
|||||||||||
|
Sequoia
2007-1
|
03/30/07
|
864,089
|
2047
|
2015
|
864,089
|
|||||||||||
|
Total
Sequoia ABS Issuance
|
$
|
32,181,819
|
$
|
7,130,129
|
||||||||||||
|
Table
20: Sequoia IO ABS Issued
|
||||||||||||||||
|
(all
$ in thousands)
|
||||||||||||||||
|
|
Outstanding
|
|||||||||||||||
|
|
|
Original
|
|
Estimated
|
Balance
At
|
|||||||||||
|
Sequoia
ABS
|
Issue
|
Issue
|
Stated
|
Callable
|
March
31,
|
|||||||||||
|
IO's
Issued
|
Date
|
Amount
|
Maturity
|
Date
|
2007
|
|||||||||||
|
MLCC
2003-C
X-A-2
|
06/26/03
|
$
|
12,662
|
2007
|
2007
|
$
|
144
|
|||||||||
|
MLCC
2003-D
X-A-1
|
07/29/03
|
22,371
|
2007
|
2007
|
446
|
|||||||||||
|
MLCC
2003-E
X-A-1
|
08/28/03
|
16,550
|
2007
|
2007
|
593
|
|||||||||||
|
MLCC
2003-F
X-A-1
|
09/25/03
|
18,666
|
2007
|
2007
|
536
|
|||||||||||
|
Sequoia
2003-6 X-1
|
10/29/03
|
8,220
|
2007
|
Called
|
-
|
|||||||||||
|
SMFC
2003A
AX1
|
10/31/03
|
70,568
|
2007
|
2007
|
1,052
|
|||||||||||
|
Sequoia
2003-7 X-1
|
11/25/03
|
10,345
|
2007
|
Called
|
-
|
|||||||||||
|
Sequoia
2003-8 X-1
|
12/23/03
|
12,256
|
2007
|
2007
|
277
|
|||||||||||
|
Sequoia
2004-1 X-1
|
01/28/04
|
7,801
|
2007
|
2007
|
267
|
|||||||||||
|
Sequoia
2004-2 X-1
|
02/25/04
|
8,776
|
2007
|
2007
|
-
|
|||||||||||
|
SMFC
2004A
AX1
|
02/26/04
|
10,626
|
2007
|
2007
|
451
|
|||||||||||
|
MLCC
2003-H
X-A-1
|
12/22/03
|
10,430
|
2007
|
2007
|
791
|
|||||||||||
|
Sequoia
2004-4 X-1
|
05/28/04
|
9,789
|
2010
|
2007
|
567
|
|||||||||||
|
Sequoia
2004-5 X-1
|
05/27/04
|
3,371
|
2012
|
2008
|
284
|
|||||||||||
|
Sequoia
2004-6 X-A
|
06/29/04
|
10,884
|
2012
|
2008
|
3,504
|
|||||||||||
|
Sequoia
2004-7 X-A
|
07/29/04
|
12,145
|
2034
|
2008
|
4,214
|
|||||||||||
|
Sequoia
2004-8 X-A
|
08/27/04
|
18,270
|
2034
|
2008
|
6,361
|
|||||||||||
|
Sequoia
2004-9 X-A
|
09/29/04
|
16,951
|
2034
|
2008
|
6,486
|
|||||||||||
|
Sequoia
2004-10 X-A
|
10/28/04
|
14,735
|
2034
|
2008
|
5,672
|
|||||||||||
|
Sequoia
2004-11 X-A-1
|
11/23/04
|
12,603
|
2034
|
2008
|
5,387
|
|||||||||||
|
Sequoia
2004-11 X-A-2
|
11/23/04
|
4,697
|
2034
|
2008
|
2,197
|
|||||||||||
|
Sequoia
2004-12 X-A-1
|
12/22/04
|
14,453
|
2035
|
2008
|
5,953
|
|||||||||||
|
Sequoia
2004-12 X-A-2
|
12/22/04
|
5,081
|
2035
|
2008
|
5,081
|
|||||||||||
|
Sequoia
2005-1 X-A
|
01/27/05
|
9,669
|
2035
|
2008
|
4,276
|
|||||||||||
|
Sequoia
2005-2 X-A
|
02/24/05
|
7,484
|
2035
|
2008
|
3,218
|
|||||||||||
|
Sequoia
2005-3 X-A
|
04/28/05
|
8,183
|
2035
|
2008
|
3,994
|
|||||||||||
|
Total
Sequoia Issuance
|
$
|
357,586
|
$
|
61,751
|
||||||||||||
|
Table
21: Acacia CDO ABS Issued
|
||||||||||||||||
|
(all
$ in thousands)
|
||||||||||||||||
|
|
Principal
|
|
||||||||||||||
|
|
|
|
|
Original
|
|
|
|
Optional
|
|
Outstanding
At
|
|
|||||
|
|
|
Issue
|
|
Issue
|
|
Stated
|
|
Redemption
|
|
March
31,
|
|
|||||
|
CDO
Issuance
|
|
Date
|
|
Amount
|
|
Maturity
|
|
Date
|
|
2007
|
||||||
|
Acacia
CDO 1
|
12/10/02
|
$
|
285,000
|
2023
|
Called
|
$
|
-
|
|||||||||
|
Acacia
CDO 2
|
05/13/03
|
283,875
|
2023
|
Called
|
-
|
|||||||||||
|
Acacia
CDO 3
|
11/04/03
|
284,250
|
2038
|
Called
|
-
|
|||||||||||
|
Acacia
CDO 4
|
04/08/04
|
293,400
|
2039
|
2007
|
241,651
|
|||||||||||
|
Acacia
CDO 5
|
07/14/04
|
282,125
|
2039
|
2007
|
262,752
|
|||||||||||
|
Acacia
CDO 6
|
11/09/04
|
282,000
|
2040
|
2007
|
270,641
|
|||||||||||
|
Acacia
CDO 7
|
03/10/05
|
282,000
|
2045
|
2008
|
281,112
|
|||||||||||
|
Acacia
CDO 8
|
07/14/05
|
252,000
|
2045
|
2008
|
251,444
|
|||||||||||
|
Acacia
CRE 1
|
12/14/05
|
261,750
|
2045
|
2010
|
261,543
|
|||||||||||
|
Acacia
CDO 9
|
03/09/06
|
277,800
|
2046
|
2009
|
277,788
|
|||||||||||
|
Acacia
CDO 10
|
08/02/06
|
436,500
|
2046
|
2009
|
436,500
|
|||||||||||
|
Acacia
CDO 11
|
02/15/07
|
476,660
|
2047
|
2010
|
476,660
|
|||||||||||
|
Total
Acacia CDO Issuance
|
$
|
3,697,360
|
$
|
2,760,091
|
||||||||||||