 |
||
 |
 |
 |
|
The
Redwood Review
2nd
Quarter 2007
|
||
|
|
||
|
|
||
|
|
|
|
|
The
Redwood Review
2nd
Quarter 2007
|
||
|
|
||
|
|
Table
of Contents
|
|
Introduction
|
2
|
|||
|
Shareholder
Letter
|
3
|
|||
|
Quarterly
Overview
|
4
|
|||
|
Financial
and Business Modules
|
||||
|
|
||||
|
•
Financial
|
6
|
|||
|
•
Residential
|
16
|
|||
|
•
Commercial
|
41
|
|||
|
•
CDO
|
47
|
|||
|
•
Capital
|
52
|
|||
|
•
Debt
|
54
|
|||
|
•
ABS
Issued
|
56
|
|||
|
Redwood
Business and Strategy
|
64
|
|||
|
Appendix
|
||||
|
•
Glossary
|
70
|
|||
|
•
Financial
Tables
|
77
|
|
The
Redwood
Review
2nd
Quarter
2007
|
|
1 |
 |
Introduction
|
|
Quarter:Year
|
GAAP
Earnings per Share |
Core
Earnings per Share |
Total
Taxable
Earnings per Share |
Adjusted
Return on Equity |
GAAP
Book
Value per Share |
Total
Dividends per Share |
|
Q2:05
|
$1.62
|
$1.50
|
$1.66
|
19%
|
$40.24
|
$0.70
|
|
Q3:05
|
$2.21
|
$1.22
|
$2.23
|
25%
|
$41.03
|
$0.70
|
|
Q4:05
|
$1.68
|
$0.97
|
$1.65
|
19%
|
$37.20
|
$3.70
|
|
Q1:06
|
$1.09
|
$1.16
|
$1.44
|
13%
|
$38.11
|
$0.70
|
|
Q2:06
|
$1.20
|
$0.97
|
$1.91
|
14%
|
$39.13
|
$0.70
|
|
Q3:06
|
$1.22
|
$1.20
|
$1.96
|
14%
|
$40.02
|
$0.70
|
|
Q4:06
|
$1.32
|
$1.12
|
$1.42
|
15%
|
$37.51
|
$3.70
|
|
Q1:07
|
$0.66
|
$1.08
|
$1.48
|
8%
|
$34.06
|
$0.75
|
|
Q2:07
|
$0.41
|
$1.35
|
$1.66
|
5%
|
$31.50
|
$0.75
|
| 2 |
|
The
Redwood
Review
2nd
Quarter
2007
|
|
|
Shareholder
Letter
|
 |
 |
|
|
George
E.
Bull, III
|
Douglas
B.
Hansen
|
|
|
Chairman
and CEO
|
President
|
|
The
Redwood
Review
2nd
Quarter
2007
|
|
3 |
|
|
Quarterly
Overview
|
| 4 |
|
The
Redwood
Review
2nd
Quarter
2007
|
|
|
Quarterly
Overview
|
|
The
Redwood
Review
2nd
Quarter
2007
|
|
5 |
 |
GAAP
Earnings and Core Earnings
|
| · |
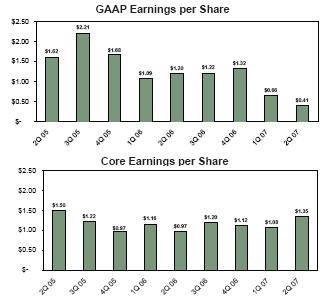
GAAP
earnings
per share for the second quarter of $0.41 per share were lower
than recent
quarters primarily due to $29 million negative unrealized mark-to-market
valuation adjustments. Net interest income for the second quarter
was
strong.
|
| · |
For
the past
year and a half, quarterly core earnings have ranged from $0.97
to $1.35
per share. Our second quarter core earnings of $1.35 per share
were at the
top of this range.
|
|
For
the Quarter Ended
|
||||||||||
|
GAAP
Earnings
|
Jun-07
|
Mar-07
|
Jun-06
|
|||||||
|
Net
interest
income
|
$
|
53,901
|
$
|
47,009
|
$
|
44,719
|
||||
|
|
||||||||||
|
Operating
expenses
|
(12,772
|
)
|
(17,782
|
)
|
(16,037
|
)
|
||||
|
Gains
on
sales
|
1,428
|
303
|
8,241
|
|||||||
|
Gains
on
calls
|
1,310
|
843
|
747
|
|||||||
|
Valuation
adjustments, net
|
(29,430
|
)
|
(10,264
|
)
|
(2,995
|
)
|
||||
|
Provision
for
income taxes
|
(3,021
|
)
|
(1,800
|
)
|
(3,265
|
)
|
||||
|
|
||||||||||
|
GAAP
earnings
|
$
|
11,416
|
$
|
18,309
|
$
|
31,410
|
||||
|
|
||||||||||
|
GAAP
earnings
per share
|
$
|
0.41
|
$
|
0.66
|
$
|
1.20
|
||||
|
For
the Quarter Ended
|
||||||||||
|
Core
Earnings
|
Jun-07
|
Mar-07
|
Jun-06
|
|||||||
|
Net
interest
income
|
$
|
53,901
|
$
|
47,009
|
$
|
44,719
|
||||
|
|
||||||||||
|
Operating
expenses
|
(12,772
|
)
|
(15,402
|
)
|
(16,037
|
)
|
||||
|
Gains
on
sales
|
-
|
-
|
-
|
|||||||
|
Gains
on
calls
|
-
|
-
|
-
|
|||||||
|
Valuation
adjustments, net
|
-
|
-
|
-
|
|||||||
|
Provision
for
income taxes
|
(3,021
|
)
|
(1,800
|
)
|
(3,265
|
)
|
||||
|
|
||||||||||
|
Core
earnings
|
$
|
38,108
|
$
|
29,807
|
$
|
25,417
|
||||
|
|
||||||||||
|
Core
earnings
per share
|
$
|
1.35
|
$
|
1.08
|
$
|
0.97
|
||||
| 6 |
|
The
Redwood
Review
2nd
Quarter
2007
|
|
|
GAAP
Earnings and Core Earnings
|
|
Financial
|
| Ø |
Net
interest
income for the second quarter of 2007 increased by $7 million
over the
first quarter of 2007 and $9 million over the second quarter
of 2006.
Higher net interest income earnings from our CES and IGS portfolios
more
than offset a decrease in net interest income from a decline
in balance in
our residential loan portfolio. The average balance of our residential
loan portfolio continued to decline due to high prepayments on
adjustable-rate residential loans acquired and securitized under
our
Sequoia program.
|
| Ø |
Our
residential CES portfolio continues to benefit from strong credit
performance, and from rapid prepayments on those securities backed
by ARM
loans. The yield for the total CES portfolio was 24% in the second
quarter
of 2007, 22% in the first quarter of 2007, and 20% in the second
quarter
of 2006.
|
| Ø |
Operating
expenses in the second quarter of 2007 were $5 million lower than
the
first quarter of 2007. The primary reason for this decline was
lower
severance charges and lower bonus accruals. In comparison to the
second
quarter of last year, operating expenses declined by $3 million
primarily
due to lower due diligence expenses as a result of lower commercial
CES
acquisitions activity.
|
| Ø |
The
largest
factor causing a decline in our GAAP earnings was $29 million of
negative
unrealized mark-to-market (MTM) valuation adjustments. These adjustments
were $19 million higher than the first quarter of 2007 and $26
million
higher than the second quarter of 2006. The decrease in fair value
reflects the overall market decline in prices for real estate securities
(particularly, securities backed by subprime and low quality alt-a
loans)
that occurred during the second quarter. Of the $29 million income
statement MTM write-downs taken during the second quarter, $19
million
were impairments as defined by
GAAP.
|
|
The
Redwood
Review
2nd
Quarter
2007
|
|
7 |
|
|
Taxable
Income
|
| · |
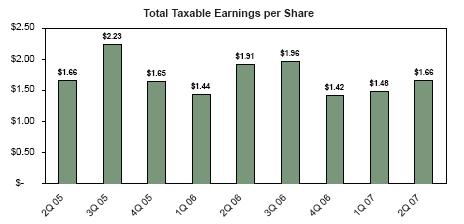
Total
taxable
income for the second quarter of 2007 was strong at $1.66 per
share, an
increase from the prior quarter due to reduced tax deductions
from stock
option exercises and lower overall operating
expenses.
|
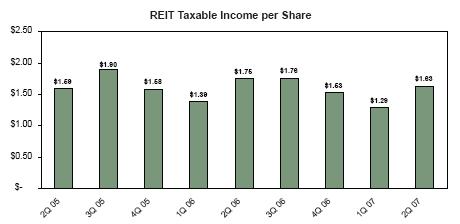
| · |
REIT
taxable
income remained strong at $1.63 per share and continues to exceed
our
regular quarterly dividend by a comfortable
margin.
|
| 8 |
|
The
Redwood
Review
2nd
Quarter
2007
|
|
|
Taxable
Income
|
| Ø |
Total
taxable
income was $46 million, or $1.66 per share, in the second quarter
of 2007.
This was an increase from the total taxable income we generated
in the
prior quarter of $40 million, or $1.48 per share. In the prior
quarter, we
had more tax deductions relating to stock option exercises and
higher
overall operating expenses.
|
| Ø |
Our
REIT
taxable income was $1.63 per share in the second quarter of 2007.
This was
higher than first quarter taxable income of $1.29 for the same
reasons
total taxable income was higher.
|
| Ø |
Our
taxable
income continues to be higher than our GAAP income as we are not
permitted
to establish credit reserves for tax. As a result, we amortize
more of our
CES discount into income for tax and recognize a higher yield until
credit
losses occur. The cumulative difference at June 30, 2007 in the
discount
amortization between tax and GAAP for residential, commercial,
and CDO CES
was $115 million.
|
| Ø |
Another
reason for the difference between tax and GAAP income is that we
do not
recognize changes in market values of assets for tax until the
asset is
sold. Consequently, the negative $29 million of unrealized market
valuation adjustments included in our GAAP earnings this quarter
were not
included in our tax earnings.
|
| Ø |
Total
taxable
income and REIT taxable income were reduced by $2 million ($0.08
per
share) in the second quarter of 2007 as a result of deductions
for actual
credit losses. These deductions were less than the actual principal
losses
incurred on the underlying loans of $6 million, as we own most
of our
credit-sensitive assets at a tax basis that is substantially less
than par
(principal) value. We currently expect that realized credit losses
will
increase substantially relative to our recent experience. All realized
credit losses, after adjusting for our tax basis in the assets
we own,
will reduce our dividend distribution
requirements.
|
|
The
Redwood
Review
2nd
Quarter
2007
|
|
9 |
|
|
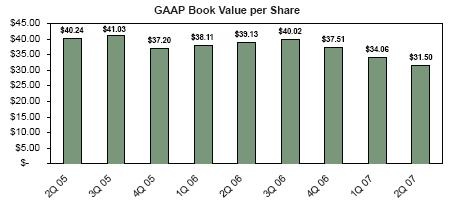
Book
Value per Share
|
| · |
GAAP
book
value declined by 8%, or $2.56 per share, during the second quarter
of
2007 from $34.06 per share to $31.50 per share primarily as a result
of
declining values for assets we own that are marked-to-market for
balance
sheet purposes.
|
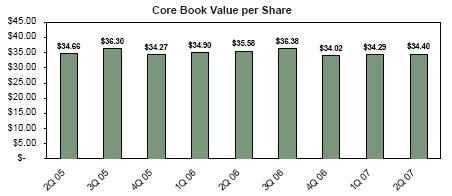
| · |
Core
book
value rose by 0.3% during the second quarter of 2007 from $34.29
per share
to $34.40 per share as a result of accretive stock issuance through
our
direct stock purchase and dividend reinvestment
plan.
|
| · |
Under
GAAP,
we are required to carry our real estate securities on our balance
sheet
at their fair market value, but we are not permitted to adjust
paired ABS
issued liabilities to fair market value. Using the assumption described
in
footnote 14 of our June 30, 2007 quarterly financial statements,
we
estimate that if we had recorded our Acacia ABS issued at fair
market
value and adjusted for Acacia unamortized deferred bond issuance
costs of
$26 million, our book value as of June 30, 2007 would have been
higher
than reported by $75 million.
|
| 10 |
|
The
Redwood
Review
2nd
Quarter
2007
|
|
|
Book
Value per Share
|
|
Financial
|
| Ø |
The
difference between core book value of $34.40 per share and GAAP
book value
of $31.50 per share at June 30, 2007 was cumulative mark-to-market
balance
sheet adjustments for GAAP of negative $81 million at
quarter-end.
|
| Ø |
For
the $3.7
billion of assets that were marked-to-market at June 30, 2007,
market
values declined by $124 million in the second quarter of 2007.
This
represents an average decline in value during the quarter of 3%
of
principal value.
|
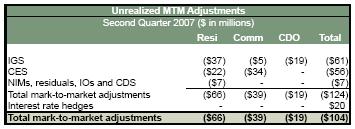
| Ø |
Market
spreads widened in the second quarter; that is, the yields the
market
required increased, so asset values dropped. For some assets, value
declines reflected a decline in economic value due to an increase
in
credit loss expectations. For other assets (including most of our
assets),
value declines reflect an increase in potential risks rather than
a change
in expected cash flows. The table below summarizes the change in
unrealized mark-to-market (MTM) adjustments during the second
quarter.
|
| Ø |
At
the end of
our first quarter of operations in September 1994, GAAP book value
was
$11.67 per share. Since that time, we have paid $41.93 per share
of
dividends while also increasing GAAP book value by $19.83 per
share.
|
| Ø |
Book
value
per share growth generally is not a direct indicator of our
market value
or an indicator of the returns available to our shareholders.
If you had
acquired Redwood stock at our initial public offering in August
1995 and
had reinvested all dividends back into Redwood stock, your
compounded
return as a shareholder would have been 20% per year through
June 30,
2007. Future results will
vary.
|
|
The
Redwood
Review
2nd
Quarter
2007
|
|
11 |
|
|
Return
on Equity
|
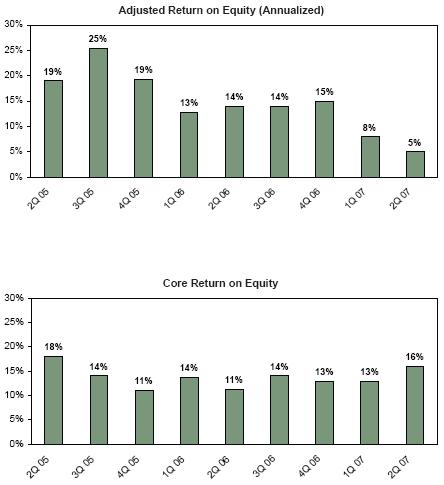
| · |
During
the
second quarter of 2007, our adjusted return on equity was 5%. The
return
was lower in the past two quarters primarily due to the amount
of
unrealized market valuation adjustments included our GAAP
earnings.
|
| · |
Core
return
on equity (core earnings divided by core equity) was 16% for the
second
quarter.
|
| · |
Over
the long
term, we expect to be able to generate annual adjusted returns
on equity
between 11% and 18%.
|
| 12 |
|
The
Redwood Review
2nd
Quarter 2007
|
|
|
Return
on Equity
|
|
Financial
|
|
The
Redwood
Review
2nd
Quarter
2007
|
|
13
|
|
|
Dividends
|
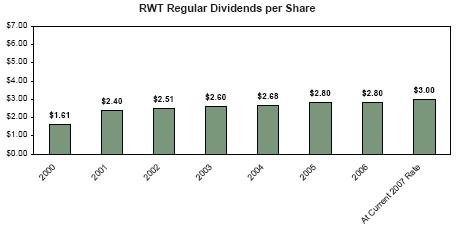
| · |
Our
current
regular dividend rate is $0.75 per share per
quarter.
|
|
14
|
|
The
Redwood
Review
2nd
Quarter
2007
|
|
|
Dividends
|
|
Financial
|
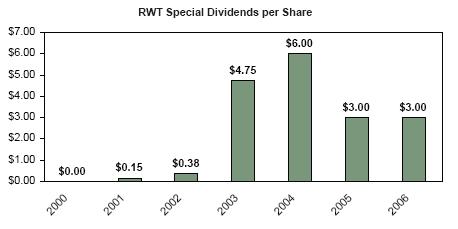
| Ø |
Total
dividend distributions over the last four quarters were $5.90 per
share.
Assuming the August 6, 2007 Redwood stock price of $36.04, the
indicated
dividend yield would be 16.4% based on the last twelve months of
dividends
and would be 8.3% based on the current regular dividend rate of
$3.00 per
share.
|
| Ø |
Based
on our
estimates of REIT taxable income through the second quarter of
2007, at
quarter end, we had $80 million ($2.86 per share) undistributed
REIT
taxable income that we anticipate distributing in 2007 and 2008
through
our regular quarterly dividend and a 2007 special dividend.
|
| Ø |
We
generally
distribute 100% of REIT capital gains income and 90% of REIT ordinary
income, retaining 10% of the ordinary REIT income. We generally
retain
100% of the after-tax income we generate in taxable subsidiaries.
|
| Ø |
As
has been
our recent policy, we currently intend to carry over two to three
quarters
worth of regular dividends into
2008.
|
|
15
|
|
The
Redwood
Review
2nd
Quarter
2007
|
 |
Residential
Real Estate Securities
|
| · |
Total
residential securities increased by 4% in the second quarter from
$2.8
billion to $2.9 billion as a result of $307 million of acquisitions,
$23
million of discount amortization, $56 million of sales, $89 million
of
calls and principal pay downs, and $59 million of market value
declines.
Our primary focus during the quarter was buying IGS for our two
Acacia CDO
securitizations that closed in May and June.
|
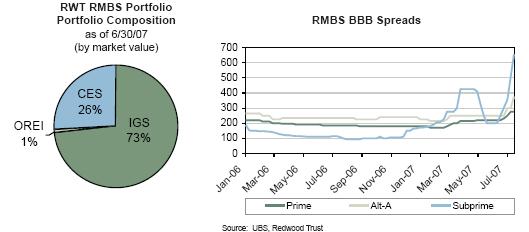
| · |
Of
the $2.9
billion residential securities we owned at June 30, 2007, $2.4
billion
were financed through re-securitization via Acacia CDO transactions
and
$0.5 billion were financed with Redwood debt and capital.
|
| · |
Future
residential IGS investment will largely depend on the availability
and
pricing of future Acacia CDO financing. If today’s turbulent environment
persists, it is unlikely that we would complete another CDO transaction
this year. This will require us to look to other potential sources
of
financing, such as Redwood debt or capital, to fund acquisitions,
or else
slow the pace of our IGS acquisitions.
|
|
16
|
|
The
Redwood
Review
2nd
Quarter
2007
|
|
|
Residential
Real Estate Securities
|
|
Residential
|
| · |
In
light of
generally rising residential mortgage delinquencies and the continued
slide in home prices, we are closely monitoring the collateral
performance
underlying our CES and IGS portfolios. During the quarter we sold
$49
million of subprime collateral. We may make additional targeted
sales in
the third quarter.
|
| · |
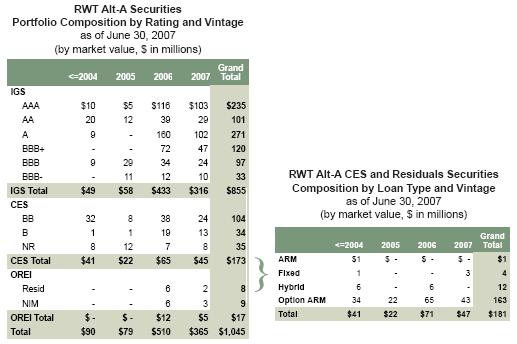
Our
CES
portfolio backed by prime assets as well as our alt-a option ARM
loans
continue to perform better than, or within, our range of expectations.
Prime represents 74% and alt-a option ARMS represent 22% of our
residential CES portfolio by market value. At June 30, our credit
reserves
associated with these securities were $293 million for prime and
$151
million for alt-a.
|
| · |
Credit
performance on alt-a securities backed by hybrids is now worse
than we had
projected. These securities represent 1% of our total residential
portfolio. During the quarter we took a mark-to-market valuation
charge
against these assets of $7 million.
|
| · |
Prices
for
residential mortgage-backed securities (RMBS) declined across the
credit
spectrum with the most severe drops impacting 2006 and early 2007
vintage
subprime and alt-a securities. Prices continued to fall further
in July
and August as the market continued to weaken amid increased supply
and
reduced demand for RMBS.
|
| · |
In
the RMBS
market, trading volume is light since willing buyers and sellers
cannot
agree on price. Until a market clearing level develops, it is difficult
to
accurately know true RMBS market values.
|
| · |
Overall
we
believe this disruption will be good for Redwood since the likely
result
will be an improvement in loan credit quality and heightened appreciation
for credit risk. This would create more opportunities to invest
capital in
our core residential credit business over the next year and the
disruption
may also lead to exceptional distressed buying
opportunities.
|
| · |
We
are
particularly pleased that Andy Sirkis, who has successfully led
our CDO
group for the past 5 years, will take on the added responsibility
of
leading our expanding high-grade investment efforts. Recently,
we changed
the name of our wholly-owned qualified REIT subsidiary to Juniper
Trust
due to potential identity confusion with another financial company
using
the prior name, Cypress. Juniper currently intends to expand in
high-grade
spread lending product lines such as high-quality residential whole
loans
funded through securitization, high-grade CDOs backed by AAA and
AA rated
collateral, and AAA securities funded with repo borrowings. We
are pleased
with our team’s progress in the development of business strategies and the
establishment of supporting systems for Juniper. Initially, Juniper
will
be funded by Redwood. In the future, we may raise additional capital
to
accommodate growth for this strategy by selling new shares in Juniper.
Our
asset management subsidiary, Redwood Asset Management, Inc., would
manage
Juniper as an external REIT.
|
|
The
Redwood
Review
2nd
Quarter
2007
|
|
17
|
|
|
Residential
Real Estate Securities
|
|
RWT
Residential IGS Portfolio
|
||||
|
Activity
|
||||
|
as
of
06/30/07
|
||||
|
(by
market
value, $ in millions)
|
|
Prime
|
Alt-A
|
Subprime
|
Total
|
|
|
Market
Value 3/31/07
|
$789
|
$766
|
$471
|
$2,026
|
|
Acquisitions
|
114
|
106
|
47
|
267
|
|
Upgrades
/
Downgrades
|
2
|
-
|
-
|
2
|
|
Sales
|
(3)
|
-
|
(49)
|
(52)
|
|
Principal
Payments
|
(29)
|
(1)
|
(16)
|
(46)
|
|
Discount
/
(Premium) Amortization
|
1
|
-
|
1
|
2
|
|
Gains
on
Sales/Calls
|
-
|
-
|
1
|
1
|
|
Net
Mark-to-Market Adjustment
|
(4)
|
(16)
|
(17)
|
(37)
|
|
Market
Value 6/30/07
|
$870
|
$855
|
$438
|
$2,163
|
|
18
|
|
The
Redwood
Review
2nd
Quarter
2007
|
|
|
Residential
Real Estate Securities
|
|
Residential
|
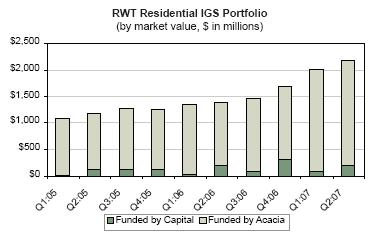
| Ø |
Our
residential IGS portfolio increased by 7% in the second quarter from
$2.0
billion to $2.2 billion.
|
| Ø |
Of
the $37
million in market value declines, $13 million were related to interest
rate increases that were largely offset by hedge
gains.
|
| Ø |
The
majority
of our residential IGS acquisitions for the quarter were designated
investments for two Acacia securitizations that closed in May and
June.
|
| Ø |
During
the
second quarter, our residential IGS acquisitions were 43% prime,
40%
alt-a, and 17% subprime. By interest rate type, these acquisitions
were
33% option ARMs, 47% hybrids, and 20%
fixed-rate.
|
| Ø |
At
June 30,
2007, $2.0 billion residential IGS were financed via securitization
in our
Acacia CDO program and $0.2 billion were financed with Redwood debt
and
capital.
|
| Ø |
At
June 30,
2007, the interest rate characteristics of our residential IGS portfolio
were 46% adjustable-rate, 35% hybrid, and 19% fixed-rate. We use
interest
rate agreements to generally match the interest rate characteristics
of
these assets to their corresponding funding
sources.
|
| Ø |
Interest
income generated by residential IGS was $36 million for the second
quarter. The yield for the second quarter was 6.80%, an increase
from
6.56% the previous quarter.
|
| Ø |
Net
discount
amortization income (which is included in interest income) for the
second
quarter was $2 million. At quarter-end, our net discount balance
for these
assets was $32 million, giving us an average amortized balance sheet
cost
basis for residential IGS of 98.59% of principal
value.
|
| Ø |
In
the second
quarter, our residential prime IGS portfolio grew by $81 million
(or 10%)
to $870 million. Our residential alt-a IGS portfolio grew by $90
million
(or 12%) to $856 million.
|
| Ø |
Our
subprime
IGS portfolio declined by $33 million (or 7%) to $438 million. Sales
of
$49 million subprime IGS in the second quarter exceeded new
acquisitions of $47 million. Although $36 million of these sales
were due
to increased credit risk of underperforming securities, $13 million
were
not credit related. The sales of these securities generated a GAAP
income
statement net gain of $2 million in the second
quarter.
|
| Ø |
Additional
information on our residential IGS can be found in Tables 9, 10,
and 18 of
the Appendix.
|
|
The
Redwood
Review
2nd
Quarter
2007
|
|
19
|
|
|
Residential
Real Estate Securities
|
|
RWT
Residential CES Portfolio
|
|
Activity
|
|
as
of
06/30/07
|
|
(by
market
value, $ in millions)
|
|
Prime
|
Alt-A
|
Subprime
|
Total
|
|
|
Market
Value 3/31/07
|
$571
|
$172
|
$9
|
$752
|
|
Acquisitions
|
25
|
15
|
-
|
40
|
|
Upgrades
/
Downgrades
|
-
|
-
|
-
|
-
|
|
Sales
|
(1)
|
(2)
|
-
|
(3)
|
|
Principal
Payments
|
(35)
|
(7)
|
(1)
|
(43)
|
|
Discount
/
(Premium) Amortization
|
17
|
4
|
-
|
21
|
|
Net
Mark-to-Market Adjustment
|
(8)
|
(10)
|
(5)
|
(23)
|
|
Market
Value 6/30/07
|
$570
|
$173
|
$3
|
$745
|
|
20
|
|
The
Redwood
Review
2nd
Quarter
2007
|
|
|
Residential
Real Estate Securities
|
|
Residential
|
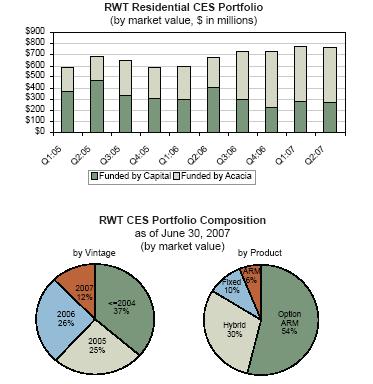
| Ø |
Our
residential CES portfolio decreased by 1% from $752 million to $745
million during the quarter.
|
| Ø |
At
June 30,
2007, $259 million residential CES were financed with equity and
$486
million were financed through our Acacia CDO
program.
|
| Ø |
The
balance
of residential loans underlying our residential CES decreased by
7% from
$237 billion to $220 billion during the second
quarter.
|
| Ø |
The
loans
underlying our residential CES acquisitions made during the quarter
were
62% prime and 38% alt-a by market value. Option ARM CES represented
72% of
our second quarter acquisitions while hybrids and fixed represented
13%
and 15%, respectively, by market value.
|
| Ø |
Interest
income generated by residential CES was $41 million for the second
quarter. The yield for the second quarter was 24%. Yields for the
second
quarter were 24% for prime CES, 22% for alt-a CES, and 16% for subprime
CES. Interest income was $31 million, $10 million, and $0.3 million
for
these sub-portfolios, respectively. CES yields remain high due to
fast
prepayment speeds and continued good credit performance for underlying
loans.
|
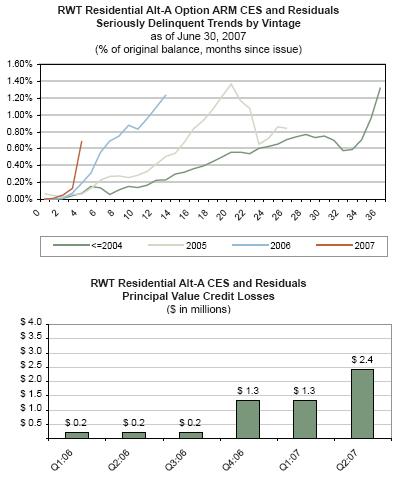
| Ø |
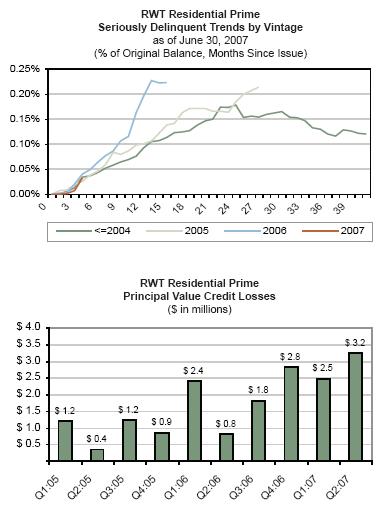
Principal
value credit losses for loans underlying CES were $6 million for
the
quarter, an increase from $4 million in the previous quarter. As
assets
season, we expect losses to increase substantially in percentage
terms.
Cumulative losses and the current loss rate remain lower than our
original
pricing expectations.
|
| Ø |
For
tax
purposes, realized credit losses were $2 million ($0.08 per share)
for
residential CES for the second quarter. This deduction is less than
the
principal value losses incurred on the underlying loans of $6 million,
as
we own most of our credit-sensitive assets at a tax basis that is
substantially less than par (principal) value.
|
| Ø |
Our
GAAP
credit reserves for residential CES were $453 million ($16.29 per
share)
at June 30, 2007, an increase of $60 million for the quarter. New
acquisitions increased this reserve by $46 million while the reallocation
of $22 million of unamortized purchase discount to reserve as some
loss
expectations increased for some assets less $6 million of
actual losses accounted for the remaining
change.
|
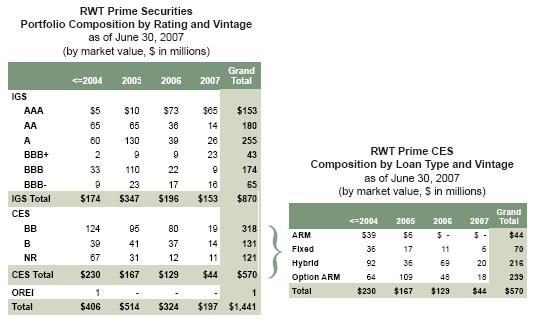
| Ø |
Our
total
residential prime CES portfolio decreased by $1 million (0.2%) to
$570
million during the second quarter. Overall, our prime CES portfolio
is
performing well from a credit perspective and continues to benefit
from
fast prepayments.
|
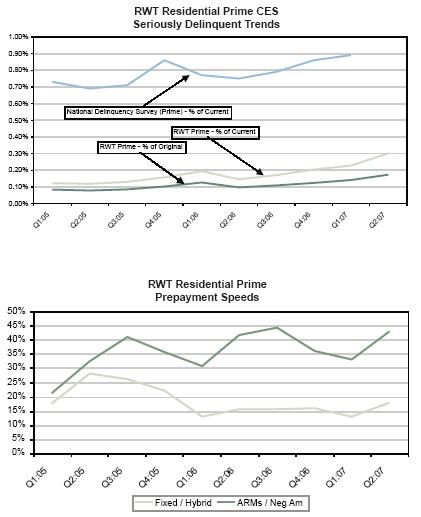
| Ø |
The
balance
of seriously delinquent loans underlying prime residential CES increased
from $485 million to $589 million during the quarter, an increase
from
0.14% to 0.17%, respectively, of original balances and 0.23% to 0.30%
of
current balances, respectively. These increases remain in line with
normal
seasoning and remain below our initial modeling
expectations.
|
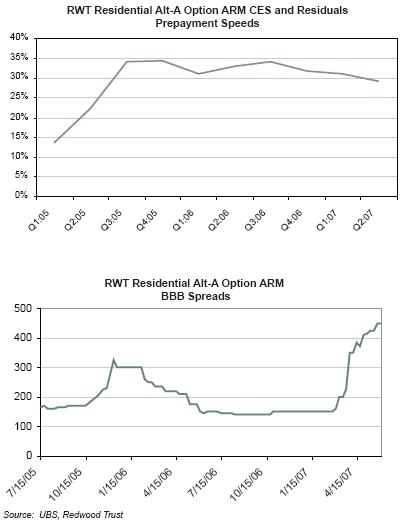
| Ø |
Securities
backed by option ARM and traditional ARM loans continued to prepay
significantly faster than our original expectations at a weighted
average
CPR of 43%. These securities represent 50% of our prime CES and they
are
priced and structured to benefit from fast prepayment speeds in addition
to low losses.
|
| Ø |
The
principal
value of credit losses for loans underlying our prime CES was $3
million,
which is an annualized rate of loss of less than one basis point
per
year.
|
|
The
Redwood
Review
2nd
Quarter
2007
|
|
21
|
|
|
Residential
Real Estate Securities
|
| Ø |
Fifty
percent
of our prime portfolio is composed of securities backed by hybrid
and
fixed-rate mortgages by market value. The loans underlying these
securities prepaid at a weighted average CPR of 18% in the second
quarter.
|
| Ø |
Our
residential alt-a CES portfolio held flat at $172 million during
the
second quarter. Option ARM collateral makes up 95% of this portfolio
by
market value.
|
| Ø |
We
acquire
alt-a securities backed by option ARMs with loss expectations that
are
significantly greater than we expect for our prime hybrid CES. To
date,
the performance of our CES backed by option ARMs continues to exceed
our
expectations.
|
| Ø |
The
balance
of seriously delinquent loans underlying alt-a residential CES increased
from $296 million to $399 million during the quarter, an increase
from
0.82% to 1.04% of original balances, respectively, and 1.51% to 1.95%
of
current balances, respectively.
|
| Ø |
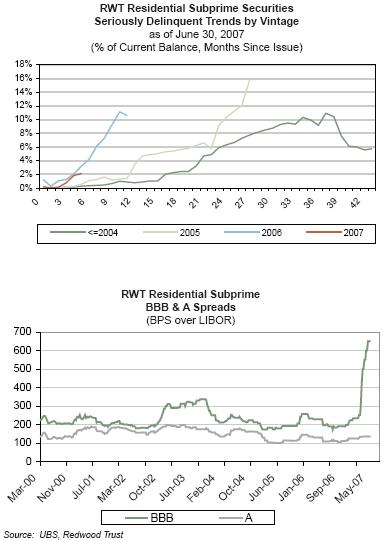
Our
subprime
CES portfolio decreased 69% from $9 million to $3 million for the
quarter
as a result of $5 million in market value declines and $1 million
in
principal repayments. Our subprime CES portfolio has limited seasoning;
however, the early credit performance is
disappointing.
|
| Ø |
We
continue
to explore opportunities to invest in subprime residuals through
joint
venture partnerships or whole loan securitizations. We believe that
once
the market rationalization is complete the subprime business will
be
viable for the long term and presents an excellent opportunity to
expand
the Redwood franchise.
|
| Ø |
For
the
foreseeable future we expect subprime originations to continue to
decline
in volume, however the nature of subprime residuals will provide
sufficient opportunities for investment given the required size of
CES
created in each deal.
|
| Ø |
Additional
information on our residential CES can be found in Tables 9, 10,
11, and
12 of the Appendix.
|
|
22
|
|
The
Redwood
Review
2nd
Quarter
2007
|
|
|
Residential
Real Estate Securities
|
|
Residential
|
| Ø |
Other
real
estate investments (OREI) are assets that we mark-to-market for income
statement purposes, because they may otherwise be deemed to contain
embedded derivatives for accounting purposes under FAS 155. We expect
to
acquire additional OREI assets. Mark-to-market fluctuations affect
GAAP
income.
|
| Ø |
OREI
is a new
reporting category we established in the first quarter of 2007. Total
OREI
at June 30, 2007 was $34 million. This included $22 million net interest
margin securities (NIMs), $10 million residuals, and $2 million IOs.
|
| Ø |
Residuals
are
first-loss securities that are not rated by a rating agency. The
value of
residual securities can vary widely and is highly dependent on prepayment
speeds. The value is also dependent on the level and timing of credit
losses, and often is not as sensitive to losses as it is to prepayment
speeds. These securities perform poorly when prepayments are fast
and
losses are higher than expected.
|
| Ø |
By
market
value, our OREI was 4% prime, 50% alt-a, and 46% subprime at June
30,
2007.
|
| Ø |
Mark-to-market
charges in our OREI portfolio were negative $6 million for the quarter
and
were included in our income statement. Valuations decline were a
result of
credit performance below our expectations, and a general spread widening
in the mortgage market. Although the reported yield has averaged
15% after
the first two quarters, our total reported return equals the cash
income
and any change in market value, and will continue to be
volatile.
|
| Ø |
Our
NIMs are
structured in such a way that they mature quickly (typically less
than two
years). The majority of the NIMs we have acquired have an investment-grade
rating.
|
| Ø |
OREI
at June
30, 2007 consisted of $9 million of investment-grade NIMs with an
average
life of 0.6 years.
|
|
The
Redwood
Review
2nd
Quarter
2007
|
|
23
|
|
|
Residential
Real Estate Securities
|
|
24
|
|
The
Redwood
Review
2nd
Quarter
2007
|
|
|
Residential
Real Estate Securities
|
|
Residential
|
|
The
Redwood
Review
2nd
Quarter
2007
|
|
25 |
|
|
Residential
Real Estate Securities
|
|
26
|
|
The
Redwood
Review
2nd
Quarter
2007
|
|
|
Residential
Real Estate Securities
|
|
Residential
|
|
RWT
Residential Prime Securities
|
|
Activity
|
|
as
of June
30, 2007
|
|
(by
market
value, $ in millions)
|
|
IGS
|
CES
|
OREI
|
Total
|
|
|
Market
Value 3/31/07
|
$789
|
$571
|
$2
|
$1,362
|
|
Acquisitions
|
114
|
25
|
-
|
139
|
|
Upgrades
/
Downgrades
|
2
|
(2)
|
-
|
-
|
|
Sales
|
(3)
|
(1)
|
-
|
(4)
|
|
Principal
Payments
|
(29)
|
(35)
|
-
|
(63)
|
|
Discount
/
(Premium) Amortization
|
1
|
17
|
-
|
18
|
|
Net
Mark-to-Market Adjustment
|
(4)
|
(7)
|
-
|
(11)
|
|
Market
Value 6/30/07
|
$870
|
$570
|
$2
|
$1,442
|
|
RWT
Residential Prime Securities
|
|
Underlying
Loan Characteristics
|
|
as
of June
30, 2007
|
|
Number
of
loans
|
554,494
|
Wtd
Avg
FICO
|
737
|
|
|
Total
loan
face ($ in millions)
|
195,757
|
FICO:
<=
620
|
2%
|
|
|
Average
loan
size ($ in 1000's)
|
353
|
FICO:
621 -
660
|
4%
|
|
|
|
FICO:
661 -
700
|
16%
|
||
|
Southern
CA
|
24%
|
|
FICO:
701 -
740
|
26%
|
|
Northern
CA
|
21%
|
FICO:
>
740
|
51%
|
|
|
Florida
|
6%
|
Unknown
|
1%
|
|
|
New
York
|
5%
|
|||
|
Georgia
|
2%
|
Conforming
at
origination %
|
31%
|
|
|
New
Jersey
|
3%
|
>
$1
MM
%
|
9%
|
|
|
Other
states
|
39%
|
|
|
|
|
|
2nd
home
%
|
7%
|
||
|
2007
origination
|
4%
|
|
Investment
home %
|
3%
|
|
2006
origination
|
20%
|
|
|
|
|
2005
origination
|
27%
|
Purchase
|
41%
|
|
|
2004
origination and earlier
|
49%
|
Cash
out
refi
|
27%
|
|
|
|
Rate-term
refi
|
30%
|
||
|
Wtd
Avg
Original LTV
|
68%
|
|
|
|
|
Original
LTV:
0 - 50
|
13%
|
Full
doc
|
45%
|
|
|
Original
LTV:
50 - 60
|
12%
|
No
doc
|
6%
|
|
|
Original
LTV:
60. - 70
|
22%
|
Other
(limited, etc)
|
49%
|
|
|
Original
LTV:
70 - 80
|
51%
|
|
||
|
Original
LTV:
80 - 90
|
2%
|
|
|
|
|
Original
LTV:
90 - 100
|
1%
|
2-4
family
|
2%
|
|
|
Condo
|
9%
|
|||
|
Single
family
|
89%
|
|
The
Redwood
Review
2nd
Quarter
2007
|
|
27
|
|
|
Residential
Real Estate Securities
|
|
28
|
|
The
Redwood
Review
2nd
Quarter
2007
|
|
|
Residential
Real Estate Securities
|
|
Residential
|
|
The
Redwood
Review
2nd
Quarter
2007
|
|
29
|
|
|
Residential
Real Estate Securities
|
|
30
|
|
The
Redwood
Review
2nd
Quarter
2007
|
|
|
Residential
Real Estate Securities
|
|
Residential
|
|
RWT
Residential Alt-A Securities
|
|
Activity
|
|
as
of June
30, 2007
|
|
(by
market
value, $ in millions)
|
|
IGS
|
CES
|
OREI
|
Total
|
|
|
Market
Value 3/31/07
|
$766
|
$172
|
$28
|
$966
|
|
Acquisitions
|
106
|
15
|
-
|
121
|
|
Sales
|
-
|
(2)
|
(2)
|
(4)
|
|
Principal
payments
|
(1)
|
(7)
|
(1)
|
(9)
|
|
Discount
/
(premium) amortization
|
-
|
4
|
(3)
|
1
|
|
Net
mark-to-market adjustment
|
(16)
|
(10)
|
(6)
|
(32)
|
|
Market
Value 6/30/07
|
$856
|
$173
|
$16
|
$1,045
|
|
RWT
Residential Alt-A Securities
|
|
Underlying
Loan Characteristics
|
|
as
of June
30, 2007
|
|
Number
of
loans
|
59,767
|
Wtd
avg
FICO
|
707
|
|
|
Total
loan
face ($ in millions)
|
20,523
|
FICO:
<=
620
|
2%
|
|
|
Average
loan
size ($ in 1000's)
|
$343
|
FICO:
621 -
660
|
14%
|
|
|
FICO:
661 -
700
|
29%
|
|||
|
Southern
CA
|
31%
|
FICO:
701 -
740
|
24%
|
|
|
Northern
CA
|
21%
|
FICO:
>
740
|
23%
|
|
|
Florida
|
10%
|
Unknown
|
8%
|
|
|
New
York
|
2%
|
|
||
|
Georgia
|
1%
|
Conforming
at
origination %
|
47%
|
|
|
New
Jersey
|
3%
|
>
$1
MM
%
|
12%
|
|
|
Other
states
|
32%
|
|
|
|
|
2nd
home
%
|
6%
|
|||
|
2007
origination
|
14%
|
Investment
home %
|
11%
|
|
|
2006
origination
|
23%
|
|
|
|
|
2005
origination
|
33%
|
Purchase
|
34%
|
|
|
2004
origination and earlier
|
30%
|
Cash
out
refi
|
43%
|
|
|
Rate-term
refi
|
22%
|
|||
|
Wtd
avg
original LTV
|
75%
|
|
|
|
|
Original
LTV:
0 - 50
|
4%
|
Full
doc
|
17%
|
|
|
Original
LTV:
50 - 60
|
6%
|
No
doc
|
1%
|
|
|
Original
LTV:
60 - 70
|
16%
|
Other
(limited, etc)
|
74%
|
|
|
Original
LTV:
70 - 80
|
61%
|
Unknown/not
categorized
|
8%
|
|
|
Original
LTV:
80 - 90
|
9%
|
|
|
|
|
Original
LTV:
90 - 100
|
3%
|
2-4
family
|
4%
|
|
|
Condo
|
11%
|
|||
|
Single
family
|
85%
|
|
The
Redwood
Review
2nd
Quarter
2007
|
|
31
|
|
|
Residential
Real Estate Securities
|
|
RWT
Subprime Securities
|
|
Portfolio
Composition by Rating and Vintage
|
|
as
of June
30, 2007
|
|
(by
market
value, $ in millions)
|
|
|
<=2004
|
2005
|
2006
|
2007
|
Grand
Total
|
|
IGS
|
|
|
|
|
|
|
AAA
|
$
-
|
$5
|
$9
|
$
-
|
$14
|
|
AA
|
43
|
57
|
25
|
29
|
154
|
|
A
|
95
|
27
|
13
|
15
|
149
|
|
BBB+
|
36
|
-
|
39
|
9
|
85
|
|
BBB
|
-
|
-
|
8
|
6
|
15
|
|
BBB-
|
-
|
-
|
10
|
10
|
20
|
|
IGS
Total
|
$174
|
$88
|
$106
|
$70
|
$438
|
|
CES
|
|
|
|
|
|
|
BB
|
-
|
-
|
1
|
2
|
3
|
|
CES
Total
|
$
-
|
$
-
|
$1
|
$2
|
$3
|
|
OREI
|
|
|
|
|
|
|
Resid
|
-
|
-
|
2
|
-
|
2
|
|
NIM
|
-
|
-
|
-
|
13
|
13
|
|
OREI
Total
|
$
-
|
$
-
|
$2
|
$13
|
$15
|
|
Total
|
$174
|
$88
|
$109
|
$85
|
$456
|
|
32
|
|
The
Redwood
Review
2nd
Quarter
2007
|
|
|
Residential
Real Estate Securities
|
|
Residential
|
|
The
Redwood
Review
2nd
Quarter
2007
|
|
33
|
|
|
Residential
Real Estate Securities
|
|
|
7/10
|
7/13
|
7/19
|
|
|
|
1st
Lien
|
1st
Lien
|
2nd
Lien
|
|
|
|
Moodys
|
S&P
|
S&P
|
Total
|
|
Total
Activity
|
|
|
|
|
|
Negative
Watch
|
32
|
26
|
0
|
58
|
|
Downgraded
|
399
|
498
|
418
|
1315
|
|
Redwood
Exposure
|
|
|
|
|
|
Negative
Watch
|
1
|
0
|
0
|
1
|
|
Downgrade
|
2
|
2
|
2
|
6*
|
|
*
The
same two bonds were downgraded by Moodys and by S&P (7/13). Redwood
had a total of four bonds downgraded and one placed on negative
watch
|
||||
|
34
|
|
The
Redwood
Review
2nd
Quarter
2007
|
|
|
Residential
Real Estate Securities
|
|
Residential
|
|
RWT
Residential Subprime Securities
|
|
Activity
|
|
as
of June
30, 2007
|
|
(by
market
value, $ in millions)
|
|
IGS
|
CES
|
OREI
|
Total
|
|
|
Market
Value 3/31/07
|
$471
|
$9
|
$20
|
$500
|
|
Acquisitions
|
47
|
-
|
-
|
47
|
|
Sales
|
(49)
|
-
|
-
|
(49)
|
|
Principal
payments
|
(16)
|
(1)
|
(4)
|
(21)
|
|
Discount
/
(premium) amortization
|
1
|
-
|
1
|
2
|
|
Net
mark-to-market adjustment
|
(17)
|
(5)
|
-
|
(22)
|
|
Market
Value 6/30/07
|
$438
|
$3
|
$17
|
$457
|
|
RWT
Residential CES Subprime Securities
|
|
Underlying
Loan Characteristics
|
|
as
of June
30, 2007
|
|
Number
of
loans
|
23,662
|
Wtd
avg
FICO
|
640
|
|
|
Total
loan
face ($ in millions)
|
3,436
|
FICO:
<=
620
|
36%
|
|
|
Average
loan
size ($ in 1000's)
|
145
|
FICO:
621 -
660
|
29%
|
|
|
|
FICO:
661 -
700
|
19%
|
||
|
Southern
CA
|
19%
|
FICO:
701 -
740
|
10%
|
|
|
Northern
CA
|
14%
|
FICO:
>
740
|
6%
|
|
|
Florida
|
12%
|
Unknown
|
0%
|
|
|
New
York
|
4%
|
|||
|
Georgia
|
1%
|
Conforming
at
origination %
|
77%
|
|
|
New
Jersey
|
3%
|
>
$1
MM
%
|
0%
|
|
|
Other
states
|
47%
|
|
||
|
2nd
Home
%
|
2%
|
|||
|
2007
origination
|
1%
|
Investment
Home %
|
9%
|
|
|
2006
origination
|
98%
|
|
||
|
2005
origination
|
0%
|
Purchase
|
52%
|
|
|
2004
origination and earlier
|
0%
|
|
Cash
out
refi
|
44%
|
|
Rate-term
refi
|
4%
|
|||
|
Wtd
avg
original LTV
|
69%
|
|
||
|
Original
LTV:
0 - 50
|
20%
|
Full
doc
|
50%
|
|
|
Original
LTV:
50 - 60
|
3%
|
No
doc
|
1%
|
|
|
Original
LTV:
60 - 70
|
6%
|
Other
(limited, etc)
|
49%
|
|
|
Original
LTV:
70 - 80
|
44%
|
Unknown/not
categorized
|
0%
|
|
|
Original
LTV:
80 - 90
|
22%
|
|
|
|
|
Original
LTV:
90 - 100
|
6%
|
2-4
family
|
8%
|
|
|
Condo
|
7%
|
|||
|
Single
family
|
85%
|
|
The
Redwood
Review
2nd
Quarter
2007
|
|
35
|
|
|
Residential
Real Estate Loans
|
| · |
Recently,
our
primary focus has been prime hybrids, as prime ARMs are out of favor
among
borrowers in the current yield environment. We purchased $675 million
residential loans this quarter. All our loans were prime-quality
loans at
origination.
|
| · |
Seriously
delinquent loans and credit losses on residential loans are increasing
due
to normal seasoning, but remain well below our initial
expectations.
|
| · |
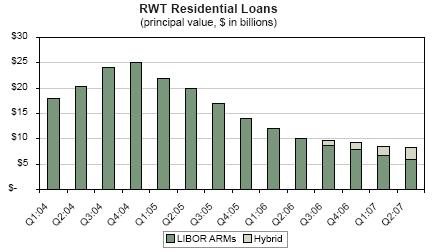
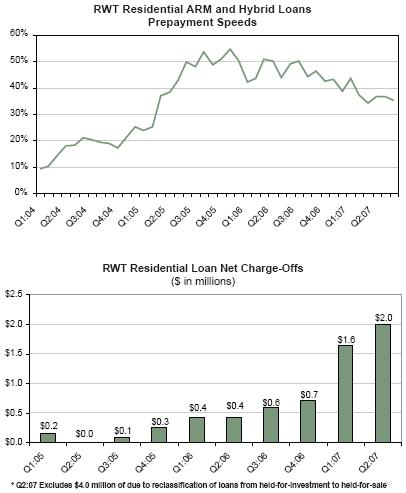
Prepayment
speeds on our loan portfolio, consisting mostly of ARM loans, continued
to
be fast, prepaying at a CPR of nearly 37% for the second quarter.
|
| · |
We
completed
one securitization during the second quarter, financing $407 million
prime
hybrid mortgages and $654 million prime ARM mortgages and priced
another
Sequoia securitization that closed in July. We called one older Sequoia
securitization during the second quarter. Although we completed this
latest Sequoia transaction on overall favorable economic terms, in
general
the cost of financing loans through securitization has risen as market
spreads for ABS have widened.
|
| 36 |
|
The
Redwood
Review
2nd
Quarter
2007
|
|
|
Residential
Real Estate Loans
|
|
Residential
|
| Ø |
In
the second
quarter, our residential loan portfolio declined from $8.7 billion
to $8.4
billion. We acquired $675 million loans and sold $2 million seriously
delinquent loans. Principal pay downs were $1.0 billion. The average
CPR
was 37% for the second quarter versus 44% for all of 2006. Most of
these
loans are ARM loans that tend to prepay rapidly when the yield curve
is
flat or inverted.
|
| Ø |
Interest
income on our residential loans was $119 million in the second quarter,
a
decrease from $129 million in the previous quarter. This portfolio
yielded
5.79%. The yield in the previous quarter was 5.93%. The primary reason
for
the decrease in yields was an increase in the provision for credit
losses.
|
| Ø |
Premium
amortization expenses, a component of interest income, were $11 million
for the second quarter. We ended the second quarter with $8.3 billion
principal value of loans and a loan premium balance of $99 million
for an
average basis of 101.19% of principal value. For accounting reasons,
for
several years we have not been able to amortize premium expense balances
as quickly as the loans prepaid. If short-term interest rates decline,
under these accounting rules we would expect premium amortization
expenses
to increase significantly. Largely because premium amortization expenses
have not kept pace with prepayments in the past, we estimate the
book
value of residential loans exceeded their market value by $82 million
at
quarter-end.
|
| Ø |
Net
charge-offs were $6 million for the second quarter. We reclassified
$13
million of seriously delinquent loans from held-for-investment to
held-for-sale. This increased our net charge-offs by $4 million and
reduced our credit reserve by $4 million. Adjusting for this
reclassification, net charge-offs would have otherwise been $2 million,
an
annual loss rate of ten basis points (0.10%) of the current loan
balances.
|
| Ø |
Cumulative
losses have been far lower than our original expectations. We expect
losses to continue to increase as loans season. Credit reserves for
this
portfolio were $16.4 million (or 0.20%) of current loan balances
at
quarter-end. In July, we had a recovery of $0.6 million of a previously
realized loss on a loan we were able to put back to the originator.
This
event will be reflected in our Q3 financial
statements.
|
| Ø |
The
balance
of seriously delinquent loans decreased from $69 million to $56 million
during the quarter, a decrease from 0.22% to 0.20% of original
balances, and a decrease from 0.80% to 0.67% of current balances.
|
| Ø |
At
the end of
the second quarter, $7.5 billion of residential loans were financed
via
Sequoia securitizations and $878 million were financed with Redwood
debt
and equity. As a result of the July Sequoia transaction, unsecuritized
whole loans at the end of July were $195
million.
|
| Ø |
Additional
information on our residential loans can be found in Tables 9, 10,
11, and
14 of the Appendix.
|
|
The
Redwood
Review
2nd
Quarter
2007
|
|
37 |
|
|
Residential
Real Estate Loans
|
| 38 |
|
The
Redwood
Review
2nd
Quarter
2007
|
|
|
Residential
Real Estate Loans
|
|
Residential
|
|
RWT
Residential Loan Portfolio
|
|
Activity
|
|
as
of June
30, 2007
|
|
(by
market
value, $ in millions)
|
|
Q207
|
Q107
|
Q206
|
||
|
Carrying
Value Beginning
|
|
$8,680
|
$9,324
|
$11,990
|
|
Acquisitions
|
|
675
|
415
|
273
|
|
Sales
|
|
(2)
|
-
|
-
|
|
Principal
Payments
|
|
(989)
|
(1,047)
|
(1,800)
|
|
Discount
/
(Premium) Amortization
|
|
(11)
|
(12)
|
(12)
|
|
Credit
provision
|
|
(3)
|
(2)
|
3
|
|
Net
charge-offs/(recoveries)
|
|
2
|
2
|
-
|
|
Carrying
Value Ending
|
|
$8,352
|
$8,680
|
$10,454
|
|
RWT
Residential Portfolio
|
|
Loan
Characteristics
|
|
as
of June
30, 2007
|
|
Number
of
loans
|
24,452
|
Wtd
Avg
FICO
|
732
|
|
|
Total
loan
face ($ in millions)
|
8,256
|
FICO:
<=
620
|
2%
|
|
|
Average
loan
size ($ in 1000's)
|
338
|
FICO:
621 -
660
|
5%
|
|
|
FICO:
661 -
700
|
19%
|
|||
|
Southern
CA
|
14%
|
FICO:
701 -
740
|
27%
|
|
|
Northern
CA
|
11%
|
FICO:
>
740
|
47%
|
|
|
Florida
|
12%
|
|||
|
New
York
|
6%
|
Conforming
at
origination %
|
35%
|
|
|
Georgia
|
4%
|
>
$1
MM
%
|
15%
|
|
|
New
Jersey
|
4%
|
|
|
|
|
Other
states
|
48%
|
2nd
home
%
|
11%
|
|
|
Investment
home %
|
3%
|
|||
|
2007
origination
|
11%
|
|
|
|
|
2006
origination
|
18%
|
Purchase
|
35%
|
|
|
2005
origination
|
5%
|
Cash
out
refi
|
31%
|
|
|
2004
origination and earlier
|
66%
|
Rate-term
refi
|
32%
|
|
|
Other
|
2%
|
|||
|
Wtd
avg
original LTV
|
68%
|
|
||
|
Original
LTV:
0 - 50
|
15%
|
Hybrid
|
28%
|
|
|
Original
LTV:
50 - 60
|
11%
|
Adjustable
|
71%
|
|
|
Original
LTV:
60 - 70
|
19%
|
Interest
Only
|
95%
|
|
|
Original
LTV:
70 - 80
|
47%
|
Fully-Amortizing
|
5%
|
|
|
Original
LTV:
80 - 90
|
2%
|
|||
|
Original
LTV:
90 - 100
|
5%
|
|
The
Redwood
Review
2nd
Quarter
2007
|
|
39 |
 |
|
| 40 |
|
The
Redwood
Review
2nd
Quarter
2007
|
|
|
Commercial
Real Estate Securities
|
|
Commercial
|
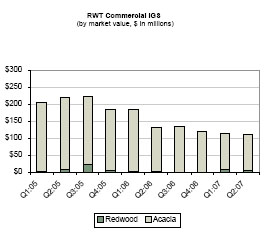
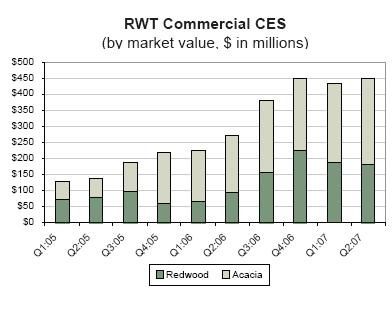
| · |
Total
commercial securities increased by 2% in the second quarter, from
$552
million to $562 million, as a result of $49 million acquisitions
and $39
million negative market value changes. Increases in interest rates
accounted for $12 million of these negative adjustments, which
were
largely offset by our use of interest rate derivatives. Less than
$1
million of the total market value decline was due to credit deterioration
on CES, which we expensed as impairments through our GAAP income
statement.
|
| · |
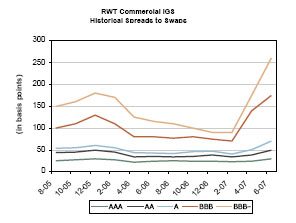
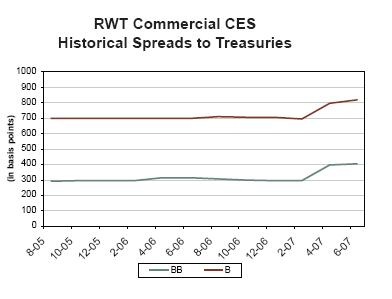
Turmoil
in
the CDO markets, as well as uncertainty surrounding credit rating
agency methodology changes, has caused spreads for commercial
securities to widen and asset prices to decline. Investor sentiment
in the
commercial capital markets has been clearly affected by defaults
and
credit rating downgrades in the residential subprime mortgage
sector.
|
| · |
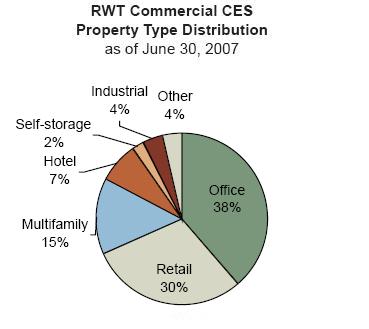
Commercial
real estate fundamentals remain strong, with historically low
delinquencies across all major property types. Total serious delinquencies
in our commercial CES portfolio were $73 million, or 0.10% of the
$70
billion in loans that we
credit-enhance.
|
| · |
We
have
slowed the pace of our commercial CES acquisitions. We feel that
underwriting standards for late 2006 and 2007 vintage commercial
loans
became overly aggressive, and that yields on recent issue CES are
not
commensurate with this risk. Though spread widening and forthcoming
increases in subordination levels may make future commercial CES
attractive, we do not anticipate deploying capital in this sector
for the
remainder of the year.
|
| · |
We
continue
to analyze new investments, especially commercial IGS and seasoned
CES.
Our focus will remain on underwriting quality and attractive pricing
levels. We anticipate using CRE CDO financing to efficiently match-fund
our investments once the CDO market
stabilizes.
|
| · |
Our
near-term
objectives are to enhance our surveillance capabilities and to
build an
asset management business. Our long-term strategy is to establish
a
vertically integrated commercial real estate platform, enabling
us to
invest across a broader range of commercial product types. Though
this
will take time, we believe it will establish Redwood’s position as a
strong long-term competitor in the commercial real estate
markets.
|
|
The
Redwood
Review
2nd
Quarter
2007
|
|
41 |
|
|
Commercial
Real Estate Securities
|
 |
 |
 |
 |
| 42 |
|
The
Redwood
Review
2nd
Quarter
2007
|
|
|
Commercial
Real Estate Securities
|
|
Commercial
|
| Ø |
Our
commercial IGS declined by $5 million (or 4%) to $111 million in
the
second quarter. This decrease was due to negative market value changes.
There were no purchases or sales during the quarter.
|
| Ø |
Interest
income generated by commercial IGS was $2 million for the second
quarter.
The yield for the quarter was 6.18%, an increase from 6.14% in the
previous quarter.
|
| Ø |
The
market
value decline of $5 million in commercial IGS was largely the result
of
credit spread widening in BBB-rated securities, reflecting increased
supply of CMBS amidst credit concerns across all mortgage ABS
sectors.
|
| Ø |
We
are
exploring opportunities to take on synthetic exposure with derivatives
that reference commercial IGS collateral. Through synthetic technology,
we
can seek out exposure to seasoned vintages that are not otherwise
available.
|
| Ø |
We
have never
incurred a principal loss on any commercial IGS. We do not maintain
GAAP
credit reserves against our commercial IGS, since we expect external
credit-enhancement (primarily structural credit subordination) to
protect
our investments from principal losses.
|
| Ø |
The
interest
rate characteristics of commercial IGS were 80% fixed-rate and 20%
adjustable-rate. We use interest rate agreements to reduce interest
rate
mismatches that may occur between assets and their associated liabilities.
Interest rate agreements offset $1 million, or 25%, of the market
value
declines on commercial IGS during the
quarter.
|
| Ø |
At
June 30,
2007, 95% of our commercial IGS were financed via our Acacia CDO
program.
|
| Ø |
Additional
information on this portfolio can be found in Tables 9, 10, and 18
of the
Appendix.
|
|
The
Redwood
Review
2nd
Quarter
2007
|
|
43 |
|
|
Commercial
Real Estate Securities
|
 |
 |
|
|
|
 |
 |
| 44 |
|
The
Redwood
Review
2nd
Quarter
2007
|
|
|
Commercial
Real Estate Securities
|
|
Commercial
|
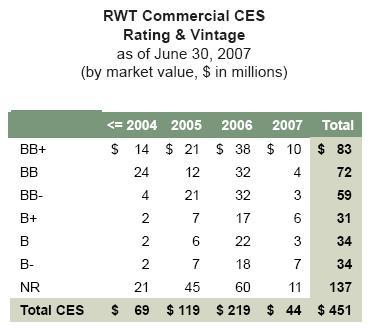
| Ø |
Our
commercial CES increased by $15 million (or 4%) in the second quarter
to
$451 million. Acquisitions were $49 million and market value declines
were
$34 million. There were no sales during the
quarter.
|
| Ø |
The
market
value of our commercial CES declined by $34 million during the second
quarter. Approximately $12 million of this decline was due to increases
in
interest rates, which was largely offset through our use of interest
rate
swaps. The remaining $22 million decline was due to widening credit
spreads amidst declining market liquidity.
|
| Ø |
Of
the $34
million in total market value decline, $33 million was unrealized
and
recorded on our balance sheet, as the underlying credit performance
of
these securities remains strong. The remaining $1 million was recorded
as
an impairment to our income statement during the second
quarter.
|
| Ø |
Interest
income generated by commercial CES was $11 million for the second
quarter.
The yield for the quarter was 9.75%, an increase from 9.52% in the
previous quarter. The level of current yield we recognize on these
assets
is largely a function of the amount and timing of our future credit
loss
assumptions. All of our commercial CES pay fixed rate of
interest.
|
| Ø |
Seriously
delinquent loans underlying commercial CES were $73 million, a decrease
of
$5 million from the previous quarter. Of the $73 million in serious
delinquencies, $57 million are contained within one security that
we
deemed impaired during a prior period. We currently have a zero cost
basis
in this security, with no risk of future write-downs affecting our
GAAP
income statement.
|
| Ø |
There
were
$0.1 million in realized credit losses during the quarter. Credit
losses
on this portfolio to date total less than one basis point (0.01%).
|
| Ø |
Our
GAAP
credit reserves for commercial CES were $311 million ($11.17 per
share) at
June 30, 2007, or 0.44% of underlying loan balances. Total credit
reserves
increased by $26 million upon acquisition of new commercial CES during
the
second quarter, offset by reserve releases on seasoned CES totaling
$10
million.
|
| Ø |
Most
of our
commercial CES ($314 million or 70%) are in a second-loss or more
senior
position, and thus are protected from initial credit losses within
the
underlying loan pool. For the remaining $137 million of securities
that
are in a direct first-loss position, 42% share losses with other
CES
investors.
|
| Ø |
The
geographical distribution of our underlying loans is very diverse.
The top
five concentrations are in California (16%), New York (13%), Texas
(8%),
Florida (6%), and Virginia (4%).
|
| Ø |
At
June 30,
2007, $180 million (or 40%) commercial CES were funded with Redwood
capital and $271 million (or 60%) were financed through our Acacia
CDO
program. We continue to seek financing facilities for our unsecuritized
commercial CES that would allow us to recycle some of the Redwood
capital
currently employed by these assets.
|
| Ø |
Additional
information on commercial CES can be found in Tables 9, 10, 15, 16,
and 18
of the Appendix.
|
|
The
Redwood
Review
2nd
Quarter
2007
|
|
45 |
|
|
Commercial
Real Estate Loans
|
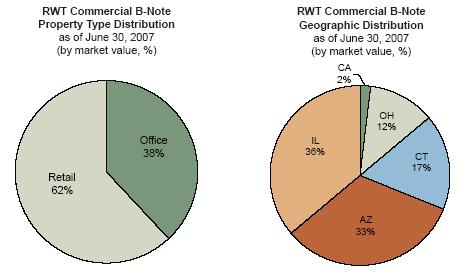
| · |
Our
commercial loan portfolio was unchanged during the second quarter,
at $26
million. No new delinquencies occurred during the quarter. All
of the $26
million of loans are structured as b-note
loans.
|
| · |
Of
our $26
million b-note investments, 99% are financed through Acacia CDO
securitizations.
|
| · |
Additional
information on our commercial loans can be found in Tables 9, 10,
15, and
17 of the Appendix.
|
| 46 |
|
The
Redwood
Review
2nd
Quarter
2007
|
|
|
CDO
Securities
|
|
CDO
|
| · |
The
CDO
markets experienced dramatic volatility by the end of the second
quarter
and into the third quarter. This volatility was driven by severe
problems
with portfolio liquidations by over-leveraged CDO investors, further
erosion in the subprime market, and unprecedented rating downgrades
by the
rating agencies.
|
| · |
Liquidity
is
extremely poor, actual trading activity is minimal, and prices
for CDO
securities have plummeted.
|
| · |
New
issuance
activity is minimal with few new CDOs coming to market. New CDOs
backed by
commercial assets are seeing better demand and better execution
than
residential backed CDOs.
|
| · |
The
CDO
securities experiencing the most dramatic price declines and related
rating downgrades are those backed by collateral pools containing
high
concentrations of 2006 and 2007 vintage subprime securities rated
BBB and
BBB-. CDO securities backed by CMBS and earlier vintage (2005 and
prior)
RMBS do not, at this time, appear to have significant performance
issues.
|
| · |
Our
exposure
to CDO transactions backed by 2006 and 2007 vintage BBB and BBB-
subprime
assets is limited. Approximately 75% of our CDO portfolio is comprised
of
securities backed by commercial real estate or residential real
estate
from vintages pre-dating 2006.
|
| · |
As
of June
30, 2007, none of the CDO securities owned by Redwood were downgraded
or
placed on credit watch by the credit rating agencies. In July 2007,
one
CDO security owned by Redwood was placed on credit watch negative.
We
recorded impairments on three 2006 vintage CDO assets this quarter,
resulting in a $6 million charge against income.
|
| · |
Should
there
be additional and severe downgrades of subprime collateral over
the coming
months and years, these CDO securities themselves may experience
downgrades and potentially losses. Should this occur, we expect
lower
rated securities to be the most heavily impacted. However, rating
downgrades and potential losses may extend up the capital structure
and
even impact AAA and AA rated
securities.
|
| · |
We
have no
immediate plans to sell any CDO securities. However, we will continue
to
monitor our portfolio and take action to sell underperforming assets
where
appropriate.
|
| · |
We
still
believe that once the turmoil in the CDO and mortgage markets subsides
there will be some very attractive buying opportunities. We have
directed
resources towards evaluating acquisition of CDO securities but
until there
is more certainty around the actual performance of residential
assets
backing CDOs, any new purchases will likely be minimal.
|
|
The
Redwood
Review
2nd
Quarter
2007
|
|
47 |
 |
CDO
Securities
|
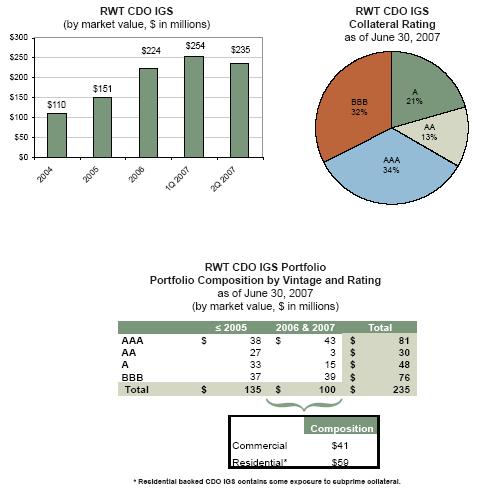
| 48 |
|
The
Redwood
Review
2nd
Quarter
2007
|
|
|
CDO
Securities
|
|
CDO
|
| Ø |
Our
total
investment in CDO IGS decreased 7% during the second quarter, to
$235
million from $254 million as a result of market value decreases totaling
$19 million. There were no sales or acquisitions during the quarter.
|
| Ø |
At
June 30,
2007, $219 million of our CDO IGS portfolio was financed via
securitization in our Acacia CDO program and the remaining $16 million
was
funded with capital.
|
| Ø |
Interest
income generated by the CDO IGS portfolio during the second quarter
was
$4.6 million, an increase of 20% over the $3.9 million generated
in the
first quarter of 2007. The yield for the second quarter was 7.08%,
consistent with the previous quarter, as LIBOR interest rates have
remained relatively stable. Substantially all of these assets earn
a
floating rate of interest based on the LIBOR interest
rate.
|
| Ø |
We
have never
incurred a principal loss on a CDO IGS security and we do not currently
have credit reserves for these assets. However, we did record impairment
charges totaling $6 million related to three CDO IGS assets during
the
second quarter.
|
| Ø |
We
use
interest rate agreements to reduce mismatches of interest rate
characteristics between the fixed-rate CDO IGS we own and the
floating-rate CDO securities issued by Acacia to finance these
assets.
|
|
The
Redwood
Review
2nd
Quarter
2007
|
|
49 |
|
|
CDO
Securities
|
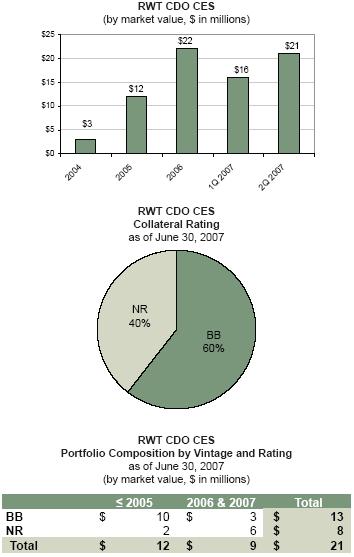
| 50 |
|
The
Redwood
Review
2nd
Quarter
2007
|
|
|
CDO
Securities
|
|
CDO
|
| Ø |
Our
CDO CES
portfolio increased by $5 million due to acquisitions during the
second
quarter to $21 million, or 31% over the first quarter of
2007.
|
| Ø |
At
June 30,
2007, $13 million of CDO CES was financed via our Acacia CDO program
and
$8 million was financed with capital.
|
| Ø |
Approximately
69% of the $21 million of CDO CES was backed by commercial real estate
collateral.
|
| Ø |
Interest
income generated by CDO CES was $0.7 million for the second quarter.
The
yield for the quarter was 14.38%, an increase over the previous quarter’s
yield of 10.84%. The underlying securities supporting our CES CDO
investments continue to perform
well.
|
|
The
Redwood
Review
2nd
Quarter
2007
|
|
51 |
 |
Redwood
Capital
|
| · |
We
had $158
million excess capital at June 30, 2007, an increase from $114
million at
the beginning of the quarter. In part as a result of a successful
Sequoia
securitization of prime residential whole loans, our excess capital
at the
end of July increased to $200
million.
|
| · |
At
the
beginning of 2007, we anticipated net capital absorption of $200 million
to $400 million for 2007. At this point, the outlook for capital
absorption is uncertain due to market turmoil. The amount of capital
we
deploy will depend on the level of expected returns from possible
acquisitions. Given our current acquisition plans, it is possible
that we
will finish the year at, or below, the lower end of that
range.
|
| · |
It
is also
possible that large and exceptional opportunities may develop during
the
remainder of the year. If that occurs, we may utilize our current
excess
capital and also elect to raise additional capital, through the
issuance
of long-term debt or equity. Alternatively, if our stock price
were to
decline to a level that we deemed attractive relative to our opportunities
to acquire new real estate assets, we would consider using some
of our
excess capital to repurchase
shares.
|
| 52 |
|
The
Redwood
Review
2nd
Quarter
2007
|
|
|
Redwood
Capital
|
|
Capital
|
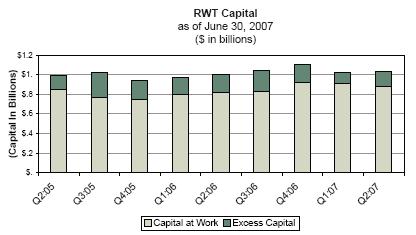
| Ø |
Excess
capital increased by $44 million to $158 million during the quarter.
In
the second quarter of 2007, uses of capital included asset acquisitions
($143 million) and dividends ($21 million). Sources of capital included
asset sales ($22 million), principal payments ($45 million), debt
issuance
($50 million), equity issuance ($37 million), earnings ($11 million),
and
other factors including recycling of capital ($43 million).
|
| Ø |
Capital
employed decreased in the first quarter from $910 million to $877
million
as a result of market value changes that were recognized for
GAAP.
|
| Ø |
Market
declines did not have a large effect on excess capital, since, for
the
most part, asset value declines result in an equal reduction of both
total
capital and also of capital required under our internal risk-adjusted
capital guidelines.
|
| Ø |
Some
of the
capital utilized during the quarter is currently used on a temporary
basis
in an inefficient manner to fund assets that would be more efficiently
financed with debt or via securitization or to fund delinquent loans
from
called Sequoia securitizations. Over time, we hope to employ this
capital
more efficiently, freeing capital to support future
growth.
|
| Ø |
Our
total
capital base remained flat at $1.0 billion between March 31 and June
30.
Issuance of new equity ($37 million) and subordinated debt ($50 million)
offset market valuation adjustments ($75 million) and dividends ($21
million) and earnings ($11 million) for assets and derivatives that
were
recorded for GAAP.
|
|
The
Redwood
Review
2nd
Quarter
2007
|
|
53 |
|
|
Redwood
Debt
|
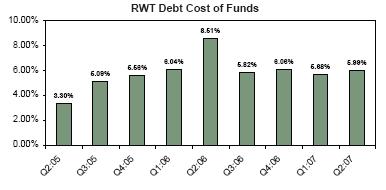
| 54 |
|
The
Redwood
Review
2nd
Quarter
2007
|
|
|
Redwood
Debt
|
|
Debt
|
| Ø |
Redwood
debt
balances finished the second quarter of 2007 at $0.8
billion.
|
| Ø |
At
June 30,
2007, Redwood debt funded $0.7 billion residential whole loans and
$0.1
billion securities.
|
| Ø |
Interest
expense for Redwood debt was $23 million for the second quarter.
The cost
of funds for Redwood’s debt was 5.99% for the second quarter and 5.68% for
the first quarter. Our debt expense varies, due to short-term interest
rates, the type of facility used, and the type of collateral
financed.
|
| Ø |
At
June 30,
2007, all Redwood debt was short-term debt collateralized by the
pledge of
assets. Maturities are generally one year or less, and the interest
rate
usually adjusts to market levels each
month.
|
| Ø |
When
we fund
fixed-rate or hybrid-rate assets with Redwood debt, we may use interest
rate agreements to reduce the interest rate mismatch between the
asset and
the liability.
|
| Ø |
Commercial
paper (CP) borrowings under our Madrona program are rated the highest
CP
rating of A1+/P1 and represent our lowest cost borrowings. At June
30,
2007, CP outstanding was $191 million. We had no CP outstanding at
the end
of July.
|
| Ø |
Redwood’s
debt obligations of $1.0 billion (including $150 million of subordinated
notes) were 1.1 times Redwood’s equity of $876 million at June 30,
2007.
|
| Ø |
At
June 30,
2007, we had $83 million of unrestricted cash. We also had $878 million
unsecuritized prime residential loans and $168 million of AAA-rated
prime
residential securities. Total short-term borrowings against these
assets
were $849 million. Since the end of the second quarter, we completed
a
securitization of residential loans through our Sequoia program.
As a
result of this and other activity, as of August 7, 2007, we had $231
million of unrestricted cash, $189 million unsecuritized residential
loans, $330 million AAA-rated securities, and short-term borrowings
of
$472 million. We also owned other assets on an unencumbered basis,
including CES, OREI, and retained assets from our Sequoia and Acacia
securitizations.
|
|
The
Redwood
Review
2nd
Quarter
2007
|
|
55 |
 |
Acacia
CDO ABS Issued
|
| · |
The
market
for new issuance CDO ABS securities is currently distressed. Dealer
inventory has swelled and pricing on new securities has weakened
in order
to accommodate the lack of demand and increased risk associated
with new
deals backed by 2006 and 2007 vintage assets.
|
| · |
During
the
very difficult market conditions of the second quarter we successfully
priced and issued two CDO ABS deals, Acacia Option ARM 1 and Acacia
12,
with equity returns that are expected to meet or exceed our internal
hurdle rates. Relative to other real estate CDO issuance in the
second
quarter, our Acacia CDO ABS securities were priced at lower, more
attractive yields than other comparable CDO securities that priced
during
the quarter.
|
| · |
CDO
ABS
issuance comprised of commercial, mezzanine, and high grade backed
collateral slowed dramatically during the second quarter. Total
issuance
decreased by 50% with issuance in the mezzanine sector being impacted
most
dramatically and posting a 75% decrease over the previous quarter.
|
| · |
Subsequent
to
the end of the second quarter, the credit rating agencies have
been
issuing credit watch and downgrade actions to reflect the recent
deterioration in the mortgage markets. Additionally, the credit
rating
agencies have revised their rating criteria, which will put additional
pressure on the new issuance
markets.
|
| · |
In
the short
term, the continued dislocation within the mortgage sector, poor
performance of 2006 vintage subprime collateral and related CDOs,
credit
rating agency actions, and lack of liquidity for CDO ABS could
hinder our
ability to issue new Acacia CDO ABS deals. However, we believe
we should
be able to continue to leverage our competitive advantages in the
CDO
business. These include the ability to acquire and hold CDO CES,
a
well-developed real estate investment and credit management
infrastructure, access to collateral, access to warehouse and other
inventory financings, a strong track record, and an excellent reputation.
These competitive advantages should enable us to maintain our status
as a
market participant and quality issuer in the CDO ABS markets.
|
| 56 |
|
The
Redwood
Review
2nd
Quarter
2007
|
|
|
Acacia
CDO ABS Issued
|
|
ABS
Issued
|
| · |
Within
our
Acacia CDOs, we limited our exposure to the riskier 2006 and 2007
vintage
subprime collateral. In the limited incidents where we did acquire
subprime securities issued in 2006 and 2007, we focused our purchases
in
AA and A rated securities, with small exposure to BBB and BBB- rated
securities.
|
| · |
Going
forward, we believe Acacia’s issued CDO bonds are likely to perform well
on an absolute basis and also relative to other CDO
bonds.
|
|
The
Redwood
Review
2nd
Quarter
2007
|
|
57 |
|
|
Acacia
CDO ABS Issued
|
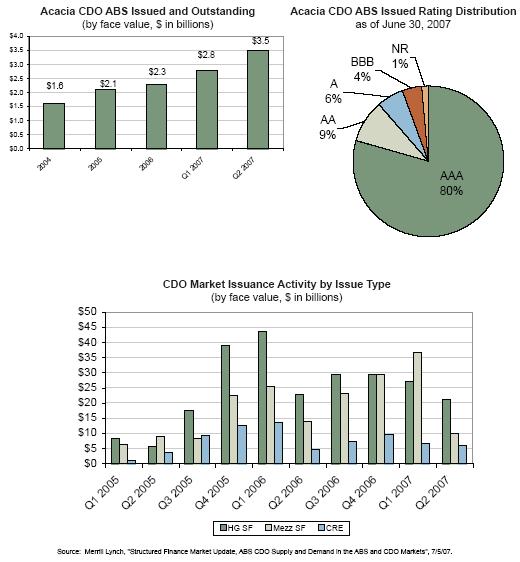
| 58 |
|
The
Redwood
Review
2nd
Quarter
2007
|
|
|
Acacia
CDO ABS Issued
|
|
ABS
Issued
|
| Ø |
Acacia
CDO
ABS outstanding increased from $2.8 billion to $3.5 billion during
the
second quarter of 2007, an increase of 25%. Acacia issued two new
CDO ABS
during the quarter, Acacia Option ARM 1 and Acacia 12, which experienced
good investor participation and provided attractive funding costs
for
Redwood. Paydowns of Acacia CDO ABS issued were $259 million for
the
second quarter; of this amount, $242 million was attributable to
the
retirement of debt related to the Acacia 4 call.
|
| Ø |
Spreads
have
continued to widen (yields increased) for both collateral assets
and CDO
liabilities beyond levels seen at the end of the first quarter of
2007.
Uncertainty remains regarding the ultimate cost of new ABS CDO liabilities
we might issue in the future.
|
| Ø |
The
cost of
funds of issued Acacia CDO ABS was 6.00% in the second quarter of
2007 as
compared to 6.20% for the first quarter of 2007. Interest expense,
net of
interest rate agreements, for Acacia ABS issued was $43 million for
the
second quarter of 2007.
|
| Ø |
At
June 30,
2007, the credit ratings for Acacia bonds outstanding were $2.7 billion
AAA, $320 million AA, $201 million A, and $145 million BBB. In addition,
Acacia has sold a portion of its unrated CDO CES (CDO equity) to
third
parties, of which $20 million was outstanding at June 30,
2007.
|
| Ø |
During
the
quarter, two Acacia CDO 5 ABS were placed on credit watch positive,
giving
further credence to our reputation as a quality issuer in the CDO
ABS
market.
|
| Ø |
Our
collateral rating history continues to be strong. As of June 30,
2007, we
have had 117 rating upgrades and three rating downgrades on all collateral
within the existing Acacia program. In July 2007, there were 50 additional
rating upgrades, two rating downgrades, and one credit watch negative.
|
| Ø |
The
Acacia
CDO CES Redwood has acquired from Acacia had a market value of $117
million at June 30, 2007. For accounting purposes, we account for
Acacia
transactions as financings, so the assets owned by Acacia are consolidated
with our assets and the CDO bonds issued by Acacia are consolidated
with
our liabilities. As a result, the Acacia CDO CES we issue and then
acquire
do not appear on our GAAP balance sheet, but rather are implicitly
represented as the excess of consolidated Acacia assets over consolidated
Acacia liabilities.
|
| Ø |
For
GAAP
financial reporting purposes, we mark-to-market most of the assets
and
derivatives owned by the Acacia entities, but none of Acacia’s
liabilities. For GAAP purposes, if market values for Acacia’s $3.5 billion
assets declined sufficiently, we could be required to record balance
sheet
charges in excess of the total amount that Redwood actually has invested.
Conversely, we are not permitted to reflect an offsetting mark-to-market
improvement in Acacia liability results in our GAAP financials. None
of
these market value changes would affect the cash flows we expect
to earn
from our Acacia investments, however. The net balance sheet market
valuation adjustment for assets and derivatives in closed Acacia
transactions was $57 million for the second
quarter.
|
| Ø |
For
managing
the outstanding Acacia transactions, Redwood’s taxable asset management
subsidiaries earned $1.5 million of asset management fees during
the
second quarter of 2007. This income was sourced from the assets owned
by
Acacia, and these assets are consolidated on our GAAP balance sheet.
Thus,
for GAAP purposes we currently include this asset management income
as
part of interest income.
|
| Ø |
Additional
information about Acacia CDO ABS issued can be found in Table 21
of the
Appendix.
|
|
The
Redwood
Review
2nd
Quarter
2007
|
|
59 |
|
|
Acacia
CDO ABS Issued
|
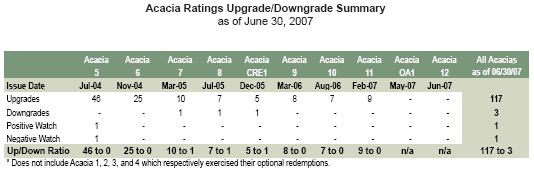
| 60 |
|
The
Redwood
Review
2nd
Quarter
2007
|
|
|
Acacia
CDO ABS Issued
|
|
ABS
Issued
|
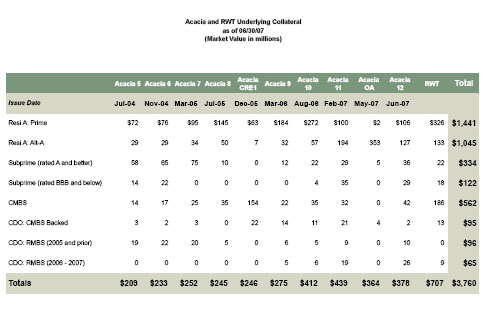
|
The
Redwood
Review
2nd
Quarter
2007
|
|
61 |
|
|
Sequoia
ABS Issued
|
| · |
We
completed
one Sequoia securitization in the second quarter and completed
another
Sequoia securitization that closed in July
2007.
|
| · |
Recent
Sequoia ABS issued has been backed by prime hybrid and ARM
mortgages.
|
| · |
In
the second
quarter, we called an older Sequoia transaction that was issued
in 2004
and we may call more transactions in 2007 and
2008.
|
| · |
We
expect to
expand our residential conduit’s activities and to acquire alt-a and
subprime loans, when appropriate, to be funded primarily through
securitization.
|
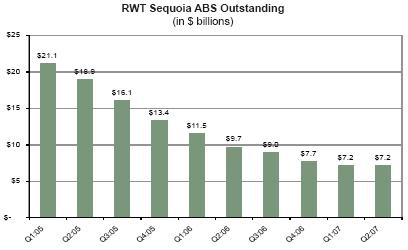
| 62 |
|
The
Redwood
Review
2nd
Quarter
2007
|
|
|
Sequoia
ABS Issued
|
|
ABS
Issued
|
| Ø |
Sequoia
ABS
issued and outstanding remained flat at $7.2 billion in the second
quarter. In the second quarter, the CPR for the loans owned by Sequoia
entities was 37%.
|
| Ø |
We
completed
one securitization during the second quarter, financing $407 million
prime
hybrid mortgages and $654 million prime ARM mortgages. In conjunction
with
the securitization, Sequoia issued $1 billion AAA-rated ABS and another
$15 million of investment-grade ABS. The ABS had similar interest
rate
characteristics to the underlying loans, thus minimizing our interest
rate
risk. The current cost of funds on the newly issued ABS was
5.68%.
|
| Ø |
In
the second
quarter, we called and retired $133 million ABS associated with a
Sequoia
securitization issued in early 2004. When we exercise the call option,
Redwood acquires all the ABS that remains outstanding at par value.
This
securitization was canceled, the Sequoia entity was collapsed, and
Redwood
reacquired the underlying loans. Some of these loans were included
in the
2007 Sequoia securitizations.
|
| Ø |
Interest
expense for Sequoia ABS issued was $98 million for the second quarter
for
a cost of funds of 5.42%.
|
| Ø |
Redwood’s
economic risk with respect to Sequoia’s assets and liabilities is
generally limited to the value of Sequoia ABS we have acquired, which
at
June 30, included $54 million market value IO securities rated AAA,
$52
million CES, and $12 million IGS. For GAAP accounting purposes, we
account
for Sequoia transactions as financings, so the assets owned by Sequoia
are
consolidated with our assets and the ABS bonds issued by Sequoia
are
consolidated with our liabilities. As a result, the Sequoia ABS we
acquire
do not appear on our GAAP balance sheet, but rather are implicitly
represented as the excess of consolidated Sequoia assets over consolidated
Sequoia liabilities.
|
| Ø |
Additional
information about Sequoia ABS issued can be found in Tables 19 and
20 of
the Appendix.
|
|
The
Redwood
Review
2nd
Quarter
2007
|
|
63 |
|
|
Redwood
Business and Strategy
|
| 1. |
Redwood
Trust is a financial institution with competitive advantages in
the
business of investing in real estate loans and
securities.
|
| 64 |
|
The
Redwood
Review
2nd
Quarter
2007
|
|
|
Redwood
Business and Strategy
|
| 2. |
In
terms of capital employed, our largest area of investment is real
estate
credit-enhancement
securities.
|
| 3. |
We
are increasing our investment in investment-grade rated real estate
securities.
|
|
The
Redwood
Review
2nd
Quarter
2007
|
|
65 |
|
|
Redwood
Business and Strategy
|
| 4. |
We
are increasing our investment in residential real estate
loans.
|
| 66 |
|
The
Redwood
Review
2nd
Quarter
2007
|
|
|
Redwood
Business and Strategy
|
| 5. |
We
buy most of our assets rather than originate
them.
|
| 6. |
Competition
for assets is strong, but we believe our operating efficiencies
will allow
us to remain competitive.
|
|
The
Redwood
Review
2nd
Quarter
2007
|
|
67 |
|
|
Redwood
Business and Strategy
|
| 7. |
We
maintain a strong balance sheet with risks that are largely segregated
and
limited.
|
| 68 |
|
The
Redwood
Review
2nd
Quarter
2007
|
|
|
Redwood
Business and Strategy
|
| 8. |
Our
primary financial goal is to deliver an attractive sum of dividends
per
share over time.
|
| 9. |
Growth
is our mission.
|
|
The
Redwood
Review
2nd
Quarter
2007
|
|
69 |
|
|
Glossary
|
| 70 |
|
The
Redwood
Review
2nd
Quarter
2007
|
|
|
Glossary
|
|
The
Redwood
Review
2nd
Quarter
2007
|
|
71 |
|
|
Glossary
|
|
72
|
|
The
Redwood
Review
2nd
Quarter
2007
|
|
|
Glossary
|
|
The
Redwood
Review
2nd
Quarter
2007
|
|
73
|
|
|
Glossary
|
|
74
|
|
The
Redwood
Review
2nd
Quarter
2007
|
|
|
Glossary
|
|
The
Redwood
Review
2nd
Quarter
2007
|
|
75
|
|
|
Glossary
|
|
76
|
|
The
Redwood
Review
2nd
Quarter
2007
|
|
|
||
|
|
|
|
|
Financial
Tables
2nd
Quarter 2007
|
||
|
|
||
|
78
|
|
The
Redwood
Review
2nd
Quarter
2007
|
|
|
|||||||||||
|
|
|
|
Six
Months
|
Six
Months
|
|||||||
|
|
Q2:2007
|
Q1:2007
|
Q4:2006
|
Q3:2006
|
Q2:2006
|
Q1:2006
|
Q4:2005
|
Q3:2005
|
Q2:2005
|
2007
|
2006
|
|
|
|
|
|
|
|||||||
|
Interest
income
|
$208,039
|
$207,906
|
$213,504
|
$217,504
|
$214,544
|
$224,795
|
$234,531
|
$246,810
|
$248,786
|
$415,945
|
$439,339
|
|
Net
securities
discount amortization income
|
23,849
|
20,268
|
18,665
|
17,842
|
13,234
|
13,245
|
10,971
|
11,523
|
8,049
|
44,117
|
26,479
|
|
Other
real
estate investment interest income
|
669
|
2,465
|
-
|
-
|
-
|
-
|
-
|
-
|
-
|
3,134
|
-
|
|
Non
real
estate investment interest income
|
464
|
-
|
-
|
-
|
-
|
-
|
-
|
-
|
-
|
464
|
-
|
|
Net
loan
premium amortization expense
|
(10,863)
|
(11,705)
|
(13,272)
|
(11,232)
|
(12,046)
|
(11,982)
|
(13,486)
|
(14,507)
|
(9,857)
|
(22,568)
|
(24,028)
|
|
(Provision
for) reversal of credit reserve
|
(2,500)
|
(3,829)
|
(1,506)
|
(465)
|
2,506
|
(176)
|
(877)
|
805
|
1,527
|
(6,329)
|
2,330
|
|
Total
GAAP
interest income
|
219,658
|
215,105
|
217,391
|
223,649
|
218,238
|
225,882
|
231,139
|
244,631
|
248,505
|
434,763
|
444,120
|
|
|
|
|
|
|
|||||||
|
Interest
expense on Redwood debt
|
(22,700)
|
(31,094)
|
(16,520)
|
(9,422)
|
(1,822)
|
(2,072)
|
(3,521)
|
(3,789)
|
(1,789)
|
(53,794)
|
(3,894)
|
|
|
|
|
|
|
|||||||
|
ABS
interest
expense consolidated from trusts
|
(140,512)
|
(131,391)
|
(152,043)
|
(165,177)
|
(171,659)
|
(178,183)
|
(186,433)
|
(190,996)
|
(191,966)
|
(271,903)
|
(349,842)
|
|
ABS
issuance
expense amortization
|
(5,681)
|
(7,068)
|
(7,897)
|
(5,786)
|
(6,079)
|
(5,907)
|
(6,069)
|
(5,162)
|
(5,386)
|
(12,749)
|
(11,986)
|
|
ABS
interest
rate agreement income
|
3,358
|
1,646
|
2,497
|
3,317
|
3,678
|
2,980
|
3,573
|
623
|
876
|
5,004
|
6,658
|
|
ABS
issuance
premium amortization income
|
2,294
|
1,869
|
1,529
|
2,395
|
2,363
|
2,527
|
2,793
|
2,733
|
3,140
|
4,163
|
4,890
|
|
Total
consolidated ABS expense
|
(140,541)
|
(134,944)
|
(155,914)
|
(165,251)
|
(171,697)
|
(178,583)
|
(186,136)
|
(192,802)
|
(193,336)
|
(275,485)
|
(350,280)
|
|
|
|
|
|
|
|||||||
|
Subordinated
notes interest expense
|
(2,516)
|
(2,057)
|
(423)
|
-
|
-
|
-
|
-
|
-
|
-
|
(4,573)
|
-
|
|
|
|
|
|
|
|||||||
|
GAAP
net
interest income
|
53,901
|
47,010
|
44,534
|
48,976
|
44,719
|
45,227
|
41,481
|
48,040
|
53,380
|
100,911
|
89,946
|
|
|
|
|
|
|
|||||||
|
Fixed
compensation expense
|
(4,286)
|
(4,616)
|
(3,688)
|
(3,437)
|
(3,310)
|
(3,437)
|
(2,879)
|
(2,802)
|
(2,623)
|
(8,902)
|
(6,747)
|
|
Variable
compensation expense
|
(198)
|
(2,251)
|
(1,666)
|
(2,630)
|
(1,900)
|
(1,514)
|
(2,110)
|
(1,980)
|
(2,420)
|
(2,449)
|
(3,414)
|
|
Equity
compensation expense
|
(3,540)
|
(3,349)
|
(3,233)
|
(2,579)
|
(2,991)
|
(2,694)
|
(2,793)
|
(2,145)
|
(2,657)
|
(6,889)
|
(5,685)
|
|
Severance
expense
|
-
|
(2,380)
|
-
|
-
|
-
|
-
|
-
|
-
|
-
|
(2,380)
|
-
|
|
Other
operating expense
|
(4,670)
|
(4,479)
|
(4,732)
|
(4,425)
|
(5,149)
|
(4,505)
|
(4,685)
|
(4,362)
|
(3,639)
|
(9,149)
|
(9,654)
|
|
Due
diligence
expenses
|
(78)
|
(707)
|
(532)
|
(384)
|
(2,687)
|
(432)
|
(298)
|
(1,075)
|
(117)
|
(785)
|
(3,119)
|
|
Total
GAAP
operating expenses
|
(12,772)
|
(17,782)
|
(13,851)
|
(13,455)
|
(16,037)
|
(12,582)
|
(12,765)
|
(12,364)
|
(11,456)
|
(30,554)
|
(28,619)
|
|
|
|
|
|
|
|||||||
|
Realized
gains
on sales
|
1,428
|
303
|
5,308
|
4,968
|
8,241
|
1,062
|
14,815
|
23,053
|
516
|
1,731
|
9,303
|
|
Realized
gains
on calls
|
1,310
|
843
|
1,511
|
722
|
747
|
-
|
4,265
|
2,914
|
4,421
|
2,153
|
747
|
|
Unrealized
market valuation adjustments
|
(29,430)
|
(10,264)
|
(1,404)
|
(5,257)
|
(2,995)
|
(2,932)
|
(1,205)
|
(1,051)
|
(1,892)
|
(39,694)
|
(5,927)
|
|
Net
gains and
valuation adjustments
|
(26,692)
|
(9,118)
|
5,415
|
433
|
5,993
|
(1,870)
|
17,875
|
24,916
|
3,045
|
(35,810)
|
4,123
|
|
|
|
|
|
|
|||||||
|
Provision
for
income taxes
|
(3,021)
|
(1,801)
|
(407)
|
(3,538)
|
(3,265)
|
(2,760)
|
(4,097)
|
(4,693)
|
(4,054)
|
(4,822)
|
(6,025)
|
|
GAAP
net
income
|
$11,416
|
$18,309
|
$35,691
|
$32,416
|
$31,410
|
$28,015
|
$42,495
|
$55,899
|
$40,915
|
$29,725
|
$59,425
|
|
|
|
|
|
|
|||||||
|
Diluted
average shares
|
28,165
|
27,684
|
27,122
|
26,625
|
26,109
|
25,703
|
25,311
|
25,314
|
25,196
|
27,918
|
25,910
|
|
GAAP
earnings
per share
|
$0.41
|
$0.66
|
$1.32
|
$1.22
|
$1.20
|
$1.09
|
$1.68
|
$2.21
|
$1.62
|
$1.06
|
$2.29
|
|
The
Redwood
Review
2nd
Quarter
|
Appendix
Table
1 - GAAP
Earnings
|
79
|
|
|
|||||||||||
|
|
|
|
Six
Months
|
Six
Months
|
|||||||
|
|
Q2:2007
|
Q1:2007
|
Q4:2006
|
Q3:2006
|
Q2:2006
|
Q1:2006
|
Q4:2005
|
Q3:2005
|
Q2:2005
|
2007
|
2006
|
|
|
|
|
|
|
|||||||
|
GAAP
net
income
|
$11,416
|
$18,309
|
$35,691
|
$32,416
|
$31,410
|
$28,015
|
$42,495
|
$55,899
|
$40,915
|
$29,725
|
$59,425
|
|
GAAP
income
items not included in core earnings
|
|
|
|
|
|||||||
|
Severance
expense
|
-
|
(2,380)
|
-
|
-
|
-
|
-
|
-
|
-
|
-
|
(2,380)
|
-
|
|
Realized
gains
on sales
|
1,428
|
303
|
5,308
|
4,968
|
8,241
|
1,062
|
14,815
|
23,053
|
516
|
1,731
|
9,303
|
|
Realized
gains
on calls
|
1,310
|
843
|
1,511
|
722
|
747
|
-
|
4,265
|
2,914
|
4,421
|
2,153
|
747
|
|
Unrealized
market valuation adjustments
|
(29,430)
|
(10,264)
|
(1,404)
|
(5,257)
|
(2,995)
|
(2,932)
|
(1,205)
|
(1,051)
|
(1,892)
|
(39,694)
|
(5,927)
|
|
Variable
stock
option market value change
|
-
|
-
|
-
|
-
|
-
|
-
|
25
|
16
|
(2)
|
-
|
-
|
|
Total
GAAP /
core earnings differences
|
(26,692)
|
(11,498)
|
5,415
|
433
|
5,993
|
(1,870)
|
17,900
|
24,932
|
3,043
|
(38,190)
|
4,123
|
|
|
|
|
|
|
|
|
|
|
|
|
|
|
Core
earnings
|
$38,108
|
$29,807
|
$30,276
|
$31,983
|
$25,417
|
$29,885
|
$24,594
|
$30,967
|
$37,872
|
$67,915
|
$55,302
|
|
Per
share
analysis
|
|
|
|
|
|||||||
|
GAAP
earnings
per share
|
$0.41
|
$0.66
|
$1.32
|
$1.22
|
$1.20
|
$1.09
|
$1.68
|
$2.21
|
$1.62
|
$1.06
|
$2.29
|
|
GAAP
income
items not included in core earnings
|
|
|
|
|
|||||||
|
Severance
expense
|
-
|
(0.09)
|
-
|
-
|
-
|
-
|
-
|
-
|
-
|
(0.09)
|
-
|
|
Realized
gains
on sales
|
0.05
|
0.01
|
0.20
|
0.19
|
0.32
|
0.04
|
0.59
|
0.91
|
0.02
|
0.06
|
0.36
|
|
Realized
gains
on calls
|
0.05
|
0.03
|
0.05
|
0.03
|
0.03
|
-
|
0.17
|
0.12
|
0.18
|
0.08
|
0.03
|
|
Valuation
adjustments
|
(1.04)
|
(0.37)
|
(0.05)
|
(0.20)
|
(0.11)
|
(0.11)
|
(0.05)
|
(0.04)
|
(0.08)
|
(1.42)
|
(0.23)
|
|
Variable
stock
option market value change
|
-
|
-
|
-
|
-
|
-
|
-
|
-
|
-
|
-
|
-
|
-
|
|
GAAP
/ Core
earnings differences per share
|
(0.94)
|
(0.42)
|
0.20
|
0.02
|
0.23
|
(0.07)
|
0.71
|
0.98
|
0.12
|
(1.37)
|
0.16
|
|
|
|
|
|
|
|
|
|
|
|
|
|
|
Core
earnings
per share
|
$1.35
|
$1.08
|
$1.12
|
$1.20
|
$0.97
|
$1.16
|
$0.97
|
$1.22
|
$1.50
|
$2.43
|
$2.13
|
|
|
|
|
|
|
|
|
|
|
|
|
|
|
The
Redwood
Review
2nd
Quarter
|
Appendix
Table
2 - Core
Earnings
|
80
|
|
|
|||||||||||
|
|
Estimated
|
Estimated
|
|||||||||
|
|
Estimated
|
Estimated
|
Actual
|
Six
Months
|
Six
Months
|
||||||
|
|
Q2:2007
|
Q1:2007
|
Q4:2006
|
Q3:2006
|
Q2:2006
|
Q1:2006
|
Q4:2005
|
Q3:2005
|
Q2:2005
|
2007
|
2006
|
|
|
|
|
|
|
|
|
|
||||
|
GAAP
net
income
|
$11,416
|
$18,309
|
$35,691
|
$32,416
|
$31,410
|
$28,015
|
$42,495
|
$55,899
|
$40,915
|
$29,725
|
$59,425
|
|
Difference
in Taxable Income Calculations
|
|
|
|
|
|
|
|
||||
|
Amortization
and credit losses (net interest income)
|
10,298
|
10,417
|
12,794
|
12,558
|
12,779
|
4,939
|
(1,314)
|
202
|
(7,079)
|
20,715
|
17,718
|
|
Operating
expense differences
|
(2,921)
|
(1,713)
|
(12,090)
|
2,545
|
(288)
|
1,604
|
396
|
576
|
2,438
|
(4,634)
|
1,316
|
|
Realized
gains
on calls and sales
|
(4,735)
|
2,100
|
(5,073)
|
(1,141)
|
(699)
|
(613)
|
(5,959)
|
(8,582)
|
823
|
(2,635)
|
(1,312)
|
|
Unrealized
market valuation adjustments
|
30,576
|
9,118
|
6,571
|
484
|
2,305
|
3,226
|
1,772
|
2,048
|
820
|
39,694
|
5,531
|
|
Income
tax
provisions
|
1,662
|
1,800
|
405
|
4,123
|
3,265
|
(703)
|
4,096
|
5,013
|
3,035
|
3,462
|
2,562
|
|
Total
differences in GAAP / Tax income
|
34,880
|
21,722
|
2,607
|
18,569
|
17,362
|
8,453
|
(1,009)
|
(743)
|
37
|
56,602
|
25,815
|
|
|
|
|
|
|
|
|
|
|
|
|
|
|
Taxable
Income
|
$46,296
|
$40,031
|
$38,298
|
$50,985
|
$48,772
|
$36,468
|
$41,486
|
$55,156
|
$40,952
|
$86,327
|
$85,240
|
|
|
|
|
|
|
|
|
|
||||
|
|
|
|
|
|
|
|
|
||||
|
|
|
|
|
|
|
|
|
||||
|
REIT
taxable
income
|
$45,233
|
$35,112
|
$40,829
|
$45,751
|
$45,040
|
$35,382
|
$39,793
|
$47,118
|
$39,237
|
$80,345
|
$80,422
|
|
Taxable
income
in taxable subsidiaries
|
1,063
|
4,919
|
(2,531)
|
5,234
|
3,732
|
1,086
|
1,694
|
8,038
|
1,715
|
5,982
|
4,818
|
|
Total
taxable
income
|
$46,296
|
$40,031
|
$38,298
|
$50,985
|
$48,772
|
$36,468
|
$41,487
|
$55,156
|
$40,952
|
$86,327
|
$85,240
|
|
|
|
|
|
|
|
|
|
||||
|
Retained
REIT
taxable income (after-tax)
|
$2,490
|
$1,933
|
$673
|
$2,500
|
$2,166
|
$1,313
|
$1,895
|
$1,164
|
$1,798
|
$4,423
|
$3,479
|
|
Retained
taxable income in taxable subsidiaries (after-tax)
|
677
|
3,133
|
(953)
|
3,156
|
2,032
|
556
|
1,238
|
4,386
|
845
|
3,811
|
2,588
|
|
Total
retained
taxable income (after-tax)
|
$3,167
|
$5,066
|
($280)
|
$5,656
|
$4,198
|
$1,869
|
$3,133
|
$5,550
|
$2,643
|
$8,234
|
$6,067
|
|
|
|
|
|
|
|
|
|||||
|
Shares
used
for taxable EPS calculation
|
27,816
|
27,129
|
26,733
|
26,053
|
25,668
|
25,382
|
25,133
|
24,764
|
24,647
|
27,816
|
25,668
|
|
|
|
|
|
|
|
|
|||||
|
REIT
taxable
income per share
|
$1.63
|
$1.29
|
$1.53
|
$1.76
|
$1.75
|
$1.39
|
$1.58
|
$1.90
|
$1.59
|
$2.92
|
$3.14
|
|
Taxable
income
in taxable subsidiaries per share
|
$0.03
|
$0.19
|
($0.11)
|
$0.20
|
$0.16
|
$0.04
|
$0.07
|
$0.32
|
$0.07
|
$0.22
|
$0.20
|
|
Total
taxable
income per share
|
$1.66
|
$1.48
|
$1.42
|
$1.96
|
$1.91
|
$1.44
|
$1.65
|
$2.23
|
$1.66
|
$3.14
|
$3.35
|
|
|
|
|
|
|
|
|
|||||
|
Total
retained
taxable income (after-tax)
|
$0.11
|
$0.19
|
($0.01)
|
$0.22
|
$0.16
|
$0.07
|
$0.12
|
$0.22
|
$0.11
|
$0.30
|
$0.23
|
|
|
|
|
|
|
|
|
|
|
|
|
|
|
The
Redwood
Review
2nd
Quarter
|
Appendix
Table
3 -
Table Taxable Income and GAAP/Tax Differences
|
81
|
|
|
|||||||||||
|
|
|
|
|
|
|
|
|
|
|
Estimated
|
Estimated
|
|
|
Estimated
|
Estimated
|
Actual
|
Six
Months
|
Six
Months
|
||||||
|
|
Q2:2007
|
Q1:2007
|
Q4:2006
|
Q3:2006
|
Q2:2006
|
Q1:2006
|
Q4:2005
|
Q3:2005
|
Q2:2005
|
2007
|
2006
|
|
Dividends
declared
|
$20,862
|
$20,347
|
$97,665
|
$18,237
|
$17,967
|
$17,767
|
$92,150
|
$17,335
|
$17,253
|
$41,209
|
$35,734
|
|
Dividend
deduction on stock issued through DRIP
|
933
|
660
|
812
|
177
|
239
|
176
|
263
|
128
|
112
|
1,593
|
415
|
|
Total
dividend
deductions
|
$21,795
|
$21,007
|
$98,477
|
$18,414
|
$18,206
|
$17,943
|
$92,413
|
$17,463
|
$17,365
|
$42,802
|
$36,149
|
|
|
|
|
|
|
|||||||
|
Regular
dividend per share
|
$0.75
|
$0.75
|
$0.70
|
$0.70
|
$0.70
|
$0.70
|
$0.70
|
$0.70
|
$0.70
|
$1.50
|
$1.40
|
|
Special
dividend per share
|
-
|
-
|
3.00
|
-
|
-
|
-
|
3.00
|
-
|
-
|
-
|
-
|
|
Total
dividends per share
|
$0.75
|
$0.75
|
$3.70
|
$0.70
|
$0.70
|
$0.70
|
$3.70
|
$0.70
|
$0.70
|
$1.50
|
$1.40
|
|
|
|
|
|
|
|||||||
|
Undistributed
REIT taxable income at beginning of period (pre-tax):
|
$60,490
|
$49,721
|
$111,248
|
$88,257
|
$65,687
|
$51,568
|
$106,719
|
$80,166
|
$62,218
|
$49,721
|
$51,568
|
|
REIT
taxable
income (pre-tax)
|
45,233
|
35,112
|
40,829
|
45,751
|
45,040
|
35,382
|
39,793
|
47,118
|
39,237
|
80,345
|
80,422
|
|
Permanently
retained (pre-tax)
|
(4,297)
|
(3,336)
|
(3,879)
|
(4,346)
|
(4,263)
|
(3,320)
|
(2,531)
|
(3,102)
|
(3,924)
|
(7,633)
|
(7,583)
|
|
Dividend
of
2004 income
|
-
|
-
|
-
|
-
|
-
|
-
|
-
|
(2,710)
|
(17,365)
|
-
|
-
|
|
Dividend
of
2005 income
|
-
|
-
|
-
|
(15,418)
|
(18,207)
|
(17,943)
|
(92,413)
|
(14,753)
|
-
|
-
|
(36,150)
|
|
Dividend
of
2006 income
|
(21,795)
|
(21,007)
|
(98,477)
|
(2,996)
|
-
|
-
|
-
|
-
|
-
|
(42,802)
|
-
|
|
Dividend
of
2007 income
|
-
|
-
|
-
|
-
|
-
|
-
|
-
|
-
|
-
|
-
|
-
|
|
Undistributed
REIT taxable income at period end (pre-tax):
|
$79,631
|
$60,490
|
$49,721
|
$111,248
|
$88,257
|
$65,687
|
$51,568
|
$106,719
|
$80,166
|
$79,631
|
$88,257
|
|
|
|
|
|
|
|||||||
|
Undistributed
REIT taxable income (pre-tax) at period end
|
|
|
|
|
|||||||
|
From
2004's
income
|
$-
|
$-
|
$-
|
$-
|
$-
|
$-
|
$-
|
$-
|
$2,710
|
$-
|
$-
|
|
From
2005's
income
|
-
|
-
|
-
|
-
|
15,418
|
33,625
|
51,568
|
106,719
|
77,456
|
-
|
15,418
|
|
From
2006's
income
|
6,919
|
28,714
|
49,721
|
111,248
|
72,839
|
32,062
|
-
|
-
|
-
|
6,919
|
72,839
|
|
From
2007's
income
|
72,712
|
31,776
|
-
|
-
|
-
|
-
|
-
|
-
|
-
|
72,712
|
-
|
|
Total
|
$79,631
|
$60,490
|
$49,721
|
$111,248
|
$88,257
|
$65,687
|
$51,568
|
$106,719
|
$80,166
|
$79,631
|
$88,257
|
|
|
|
|
|
|
|||||||
|
Shares
outstanding at period end
|
27,816
|
27,129
|
26,733
|
26,053
|
25,668
|
25,382
|
25,133
|
24,764
|
24,647
|
27,816
|
25,668
|
|
Undistributed
REIT taxable income (pre-tax)
|
|
|
|
|
|||||||
|
per
share
outstanding at period end
|
$2.86
|
$2.23
|
$1.86
|
$4.27
|
$3.44
|
$2.59
|
$2.04
|
$4.31
|
$3.25
|
$2.86
|
$3.44
|
|
The
Redwood
Review
2nd
Quarter
|
Appendix
Table
4 - Retention and Distribution of Taxable
Income
|
82
|
|
|
|||||||||
|
|
|
|
|
|
|
||||
|
|
Q2:2007
|
Q1:2007
|
Q4:2006
|
Q3:2006
|
Q2:2006
|
Q1:2006
|
Q4:2005
|
Q3:2005
|
Q2:2005
|
|
Residential
CES owned by Redwood
|
$259
|
$256
|
$230
|
$291
|
$403
|
$303
|
$309
|
$338
|
$469
|
|
Residential
CES consolidated from Acacia
|
486
|
496
|
492
|
424
|
274
|
292
|
284
|
305
|
215
|
|
Total
GAAP
residential CES
|
$745
|
$752
|
$722
|
$715
|
$677
|
$595
|
$593
|
$643
|
$684
|
|
|
|
|
|
||||||
|
Residential
loans owned by Redwood
|
$878
|
$1,256
|
$1,339
|
$520
|
$351
|
$87
|
$45
|
$17
|
$300
|
|
Residential
loans consolidated from Sequoia
|
7,473
|
7,424
|
7,985
|
9,323
|
10,102
|
11,903
|
13,830
|
16,539
|
19,330
|
|
Total
GAAP
residential loans
|
$8,351
|
$8,680
|
$9,324
|
$9,843
|
$10,453
|
$11,990
|
$13,875
|
$16,556
|
$19,630
|
|
|
|
|
|
||||||
|
Residential
IGS owned by Redwood
|
$204
|
$106
|
$318
|
$105
|
$206
|
$42
|
$151
|
$139
|
$140
|
|
Residential
IGS consolidated from Acacia
|
1,958
|
1,920
|
1,379
|
1,369
|
1,184
|
1,305
|
1,109
|
1,140
|
1,053
|
|
Total
GAAP
residential IGS
|
$2,162
|
$2,026
|
$1,697
|
$1,474
|
$1,390
|
$1,347
|
$1,260
|
$1,279
|
$1,193
|
|
|
|
|
|
||||||
|
Commercial
CES
owned by Redwood
|
$180
|
$189
|
$224
|
$156
|
$93
|
$68
|
$59
|
$98
|
$79
|
|
Commercial
CES
consolidated from Acacia
|
271
|
246
|
224
|
224
|
178
|
156
|
160
|
89
|
59
|
|
Total
GAAP
commercial CES
|
$451
|
$435
|
$448
|
$380
|
$271
|
$224
|
$219
|
$187
|
$138
|
|
|
|
|
|
||||||
|
Commercial
loans owned by Redwood
|
$0
|
$0
|
$2
|
$2
|
$2
|
$2
|
$7
|
$21
|
$16
|
|
Commercial
loans consolidated from securitization
|
26
|
26
|
26
|
30
|
36
|
53
|
53
|
35
|
26
|
|
Total
GAAP
commercial loans
|
$26
|
$26
|
$28
|
$32
|
$38
|
$55
|
$60
|
$56
|
$42
|
|
|
|
|
|
||||||
|
Commercial
IGS
owned by Redwood
|
$6
|
$9
|
$0
|
$0
|
$1
|
$3
|
$6
|
$23
|
$10
|
|
Commercial
IGS
consolidated from Acacia
|
105
|
107
|
120
|
135
|
130
|
182
|
179
|
200
|
208
|
|
Total
GAAP
commercial IGS
|
$111
|
$116
|
$120
|
$135
|
$131
|
$185
|
$185
|
$223
|
$218
|
|
|
|
|
|
||||||
|
CDO
CES owned
by Redwood
|
$8
|
$4
|
$9
|
$10
|
$5
|
$5
|
$5
|
$12
|
$2
|
|
CDO
CES
consolidated from Acacia
|
13
|
12
|
13
|
13
|
10
|
9
|
7
|
-
|
-
|
|
Total
GAAP CDO
CES
|
$21
|
$16
|
$22
|
$23
|
$15
|
$14
|
$12
|
$12
|
$2
|
|
|
|
|
|
||||||
|
CDO
IGS owned
by Redwood
|
$16
|
$20
|
$14
|
$2
|
$17
|
$4
|
$6
|
$5
|
$6
|
|
CDO
IGS
consolidated from Acacia
|
219
|
234
|
210
|
183
|
160
|
160
|
145
|
141
|
143
|
|
Total
GAAP CDO
IGS
|
$235
|
$254
|
$224
|
$185
|
$177
|
$164
|
$151
|
$146
|
$149
|
|
|
|
|
|
||||||
|
Other
real
estate investments owned by Redwood
|
$32
|
$47
|
$0
|
$0
|
$0
|
$0
|
$0
|
$0
|
$0
|
|
Other
real
estate investments consolidated from Acacia
|
2
|
3
|
-
|
-
|
-
|
-
|
-
|
-
|
-
|
|
Total
other
real estate investments
|
$34
|
$50
|
$0
|
$0
|
$0
|
$0
|
$0
|
$0
|
$0
|
|
|
|
|
|
||||||
|
Non-real
estate investments owned by Redwood
|
$0
|
$0
|
$0
|
$0
|
$0
|
$0
|
$0
|
$0
|
$0
|
|
Non-real
estate investments consolidated from Acacia
|
80
|
-
|
-
|
-
|
-
|
-
|
-
|
-
|
-
|
|
Total
non-real
estate investments
|
$80
|
$0
|
$0
|
$0
|
$0
|
$0
|
$0
|
$0
|
$0
|
|
|
|
|
|
||||||
|
Cash
owned by
Redwood
|
$83
|
$92
|
$168
|
$113
|
$106
|
$85
|
$176
|
$163
|
$72
|
|
Restricted
cash consolidated from entities
|
207
|
340
|
112
|
139
|
86
|
131
|
72
|
59
|
48
|
|
Accrued
interest receivable
|
57
|
65
|
71
|
67
|
67
|
73
|
76
|
80
|
85
|
|
Principal
receivable
|
4
|
7
|
4
|
1
|
1
|
2
|
-
|
2
|
-
|
|
Derivative
assets
|
41
|
18
|
27
|
30
|
54
|
48
|
31
|
25
|
13
|
|
Deferred
tax
asset
|
5
|
6
|
5
|
3
|
5
|
5
|
5
|
8
|
7
|
|
Deferred
asset-backed security issuance costs
|
49
|
41
|
42
|
47
|
46
|
52
|
54
|
56
|
59
|
|
Other
assets
|
19
|
23
|
16
|
13
|
13
|
10
|
8
|
10
|
6
|
|
Total
GAAP
assets
|
$12,681
|
$12,947
|
$13,030
|
$13,200
|
$13,530
|
$14,979
|
$16,777
|
$19,505
|
$22,346
|
|
|
|
|
|
||||||
|
Residential
CES owned by Redwood
|
$259
|
$256
|
$230
|
$291
|
$403
|
$303
|
$309
|
$338
|
$469
|
|
Residential
loans owned by Redwood
|
878
|
1,256
|
1,339
|
520
|
351
|
87
|
45
|
17
|
300
|
|
Residential
IGS owned by Redwood
|
204
|
106
|
318
|
105
|
206
|
42
|
151
|
139
|
140
|
|
Commercial
CES
owned by Redwood
|
180
|
189
|
224
|
156
|
93
|
68
|
59
|
98
|
79
|
|
Commercial
loans owned by Redwood
|
-
|
-
|
2
|
2
|
2
|
2
|
7
|
21
|
16
|
|
Commercial
IGS
owned by Redwood
|
6
|
9
|
-
|
-
|
1
|
3
|
6
|
23
|
10
|
|
CDO
CES owned
by Redwood
|
8
|
4
|
9
|
10
|
5
|
5
|
5
|
12
|
2
|
|
CDO
IGS owned
by Redwood
|
16
|
20
|
14
|
2
|
17
|
4
|
6
|
5
|
6
|
|
Other
real
estate investments owned by Redwood
|
32
|
47
|
-
|
-
|
-
|
-
|
-
|
-
|
-
|
|
Cash
owned by
Redwood
|
83
|
92
|
168
|
113
|
106
|
85
|
176
|
163
|
72
|
|
Total
assets
owned by Redwood
|
1,666
|
1,979
|
2,304
|
1,199
|
1,184
|
599
|
764
|
816
|
1,094
|
|
Assets
of
securitizations for GAAP
|
10,553
|
10,468
|
10,449
|
11,701
|
12,074
|
14,060
|
15,767
|
18,449
|
21,034
|
|
ABS
liabilities of entities for GAAP
|
(10,675)
|
(9,947)
|
(9,979)
|
(11,554)
|
(11,898)
|
(13,930)
|
(15,585)
|
(18,237)
|
(20,815)
|
|
Redwood
earning assets - GAAP basis
|
$1,544
|
$2,500
|
$2,774
|
$1,346
|
$1,360
|
$729
|
$946
|
$1,028
|
$1,313
|
|
The
Redwood
Review
2nd
Quarter
|
Appendix
Table
5 -
Assets
|
83
|
|
|
|||||||||
|
|
|
|
|
|
|
|
|
|
|
|
|
Q2:2007
|
Q1:2007
|
Q4:2006
|
Q3:2006
|
Q2:2006
|
Q1:2006
|
Q4:2005
|
Q3:2005
|
Q2:2005
|
|
|
|
|
|
||||||
|
Redwood
debt
|
$658
|
$1,630
|
$1,556
|
$510
|
$529
|
$0
|
$170
|
$162
|
$453
|
|
Madrona
commercial paper
|
191
|
250
|
300
|
-
|
-
|
-
|
-
|
-
|
-
|
|
Total
Redwood
debt
|
849
|
1,880
|
1,856
|
510
|
529
|
-
|
170
|
162
|
453
|
|
|
|
|
|
||||||
|
ABS
issued,
consolidated from entities
|
10,630
|
9,890
|
9,907
|
11,466
|
11,775
|
13,788
|
15,422
|
18,049
|
20,598
|
|
Unamortized
IO
issuance premium
|
51
|
62
|
75
|
90
|
106
|
124
|
143
|
163
|
186
|
|
Unamortized
ABS issuance premium (discount)
|
(6)
|
(5)
|
(3)
|
(2)
|
17
|
18
|
20
|
25
|
31
|
|
ABS
obligations of entities
|
10,675
|
9,947
|
9,979
|
11,554
|
11,898
|
13,930
|
15,585
|
18,237
|
20,815
|
|
|
|
|
|
||||||
|
Subordinated
notes
|
150
|
100
|
100
|
-
|
-
|
-
|
-
|
-
|
-
|
|
|
|
|
|
||||||
|
Accrued
interest payable
|
48
|
52
|
50
|
51
|
47
|
43
|
41
|
42
|
43
|
|
Interest
rate
agreements
|
6
|
7
|
6
|
6
|
4
|
0
|
1
|
1
|
3
|
|
Accrued
expenses and other liabilities
|
56
|
17
|
17
|
18
|
29
|
21
|
28
|
30
|
23
|
|
Dividends
payable
|
21
|
20
|
19
|
18
|
18
|
18
|
17
|
17
|
17
|
|
Total
GAAP
liabilities
|
11,805
|
12,023
|
12,027
|
12,157
|
12,525
|
14,012
|
15,842
|
18,489
|
21,354
|
|
|
|
|
|
||||||
|
|
|
|
|
||||||
|
Common
stock
and paid-in capital
|
965
|
928
|
904
|
875
|
853.9
|
839
|
825
|
808
|
803
|
|
Accumulated
other comprehensive income
|
(81)
|
(6)
|
93
|
95
|
91
|
82
|
74
|
117
|
137
|
|
Cumulative
GAAP earnings
|
839
|
827
|
809
|
773
|
740.41
|
709
|
681
|
639
|
583
|
|
Cumulative
distributions to shareholders
|
(847)
|
(825)
|
(803)
|
(700)
|
(681)
|
(663)
|
(645)
|
(548)
|
(531)
|
|
GAAP
stockholders' equity
|
876
|
924
|
1,003
|
1,043
|
1,004
|
967
|
935
|
1,016
|
992
|
|
|
|
|
|
||||||
|
Total
GAAP
liabilities and equity
|
$12,681
|
$12,947
|
$13,030
|
$13,200
|
$13,530
|
$14,979
|
$16,777
|
$19,505
|
$22,346
|
|
|
|
|
|
||||||
|
Total
Redwood
debt
|
$849
|
$1,880
|
$1,856
|
$510
|
$529
|
$0
|
$170
|
$162
|
$453
|
|
Subordinated
notes
|
150
|
100
|
100
|
-
|
-
|
-
|
-
|
-
|
-
|
|
Redwood
obligations
|
$999
|
$1,980
|
$1,956
|
$510
|
$529
|
$0
|
$170
|
$162
|
$453
|
|
|
|
|
|
||||||
|
GAAP
stockholders' equity
|
$876
|
$924
|
$1,003
|
$1,043
|
$1,004
|
$967
|
$935
|
$1,016
|
$992
|
|
|
|
|
|
||||||
|
Redwood
obligations to equity
|
1.1
|
2.1
|
2.0
|
0.5
|
0.5
|
-
|
0.2
|
0.2
|
0.5
|
|
Redwood
obligations to (equity + Redwood obligations)
|
53%
|
68%
|
66%
|
33%
|
35%
|
0%
|
15%
|
14%
|
31%
|
|
|
|
|
|
||||||
|
Redwood
obligations
|
$999
|
$1,980
|
$1,956
|
$510
|
$529
|
$0
|
$170
|
$162
|
$453
|
|
ABS
obligations of consolidated entities
|
10,675
|
9,947
|
9,979
|
11,554
|
11,898
|
13,930
|
15,585
|
18,237
|
20,815
|
|
GAAP
debt
|
$11,674
|
$11,927
|
$11,935
|
$12,064
|
$12,427
|
$13,930
|
$15,755
|
$18,399
|
$21,268
|
|
|
|
|
|
||||||
|
GAAP
debt to
equity
|
13.3
|
12.9
|
11.9
|
11.6
|
12.4
|
14.4
|
16.9
|
18.1
|
21.4
|
|
GAAP
debt to
(equity + GAAP debt)
|
93%
|
93%
|
92%
|
92%
|
93%
|
94%
|
94%
|
95%
|
96%
|
|
|
|
|
|
|
|
|
|
|
|
|
The
Redwood
Review
2nd
Quarter
|
Appendix
Table
6 -
Liabilities and Equity
|
84
|
|
|
|||||||||||
|
|
|
|
|
|
Six
Months
|
Six
Months
|
|||||
|
|
Q2:2007
|
Q1:2007
|
Q4:2006
|
Q3:2006
|
Q2:2006
|
Q1:2006
|
Q4:2005
|
Q3:2005
|
Q2:2005
|
2007
|
2006
|
|
|
|
|
|
|
|
||||||
|
GAAP
stockholders' equity
|
$876,084
|
$924,040
|
$1,002,690
|
$1,042,661
|
$1,004,265
|
$967,333
|
$934,960
|
$1,016,065
|
$991,757
|
$876,084
|
$1,004,265
|
|
Balance
sheet
mark-to-market adjustments
|
(80,913)
|
(6,183)
|
93,158
|
94,780
|
90,937
|
81,591
|
73,731
|
117,043
|
137,380
|
(80,913)
|
90,937
|
|
Core
equity
|
$956,997
|
$930,223
|
$909,532
|
$947,881
|
$913,328
|
$885,742
|
$861,229
|
$899,022
|
$854,377
|
$956,997
|
$913,328
|
|
|
|
|
|
|
|
||||||
|
Shares
outstanding at quarter end
|
27,816
|
27,129
|
26,733
|
26,053
|
25,668
|
25,382
|
25,133
|
24,764
|
24,647
|
27,816
|
25,668
|
|
|
|
|
|
|
|
||||||
|
GAAP
equity
per share
|
$31.50
|
$34.06
|
$37.51
|
$40.02
|
$39.13
|
$38.11
|
$37.20
|
$41.03
|
$40.24
|
31.50
|
$39.13
|
|
Core
equity
per share
|
$34.40
|
$34.29
|
$34.02
|
$36.38
|
$35.58
|
$34.90
|
$34.27
|
$36.30
|
$34.66
|
34.40
|
$35.58
|
|
|
|
|
|
|
|
||||||
|
Net
interest
income
|
$53,901
|
$47,010
|
$44,534
|
$48,976
|
$44,719
|
$45,227
|
$41,481
|
$48,040
|
$53,380
|
$100,911
|
$89,946
|
|
Net
interest
income / average core equity
|
22.66%
|
20.33%
|
19.28%
|
21.02%
|
19.91%
|
20.62%
|
18.85%
|
21.82%
|
25.42%
|
21.51%
|
20.26%
|
|
|
|
|
|
|
|
||||||
|
Operating
expenses (excluding severance expense)
|
$12,772
|
$15,402
|
$13,851
|
$13,455
|
$16,037
|
$12,582
|
$12,765
|
$12,364
|
$11,456
|
$28,174
|
$28,619
|
|
|
|
|
|
|
|
||||||
|
Average
total
assets
|
$12,688,468
|
$12,865,979
|
$13,041,794
|
$13,480,361
|
$14,168,755
|
$15,839,483
|
$18,348,681
|
$20,991,299
|
$23,365,553
|
$12,779,089
|
$14,999,505
|
|
Average
total
equity
|
$946,454
|
$1,008,688
|
$1,008,863
|
$1,011,609
|
$980,402
|
$952,230
|
$999,313
|
$1,014,329
|
$970,344
|
$977,068
|
$966,394
|
|
|
|
|
|
|
|
||||||
|
Operating
expenses / net interest income
|
23.70%
|
32.76%
|
31.10%
|
27.47%
|
35.86%
|
27.82%
|
30.77%
|
25.74%
|
21.46%
|
27.92%
|
31.82%
|
|
Operating
expenses / average total assets
|
0.40%
|
0.48%
|
0.42%
|
0.40%
|
0.45%
|
0.32%
|
0.28%
|
0.24%
|
0.20%
|
0.44%
|
0.38%
|
|
Operating
expenses / average total equity
|
5.40%
|
6.11%
|
5.49%
|
5.32%
|
6.54%
|
5.29%
|
5.11%
|
4.88%
|
4.72%
|
5.77%
|
5.92%
|
|
|
|
|
|
|
|
||||||
|
GAAP
net
income
|
$11,416
|
$18,309
|
$35,691
|
$32,416
|
$31,410
|
$28,015
|
$42,495
|
$55,899
|
$40,915
|
$29,725
|
$59,425
|
|
GAAP
net
income / average total assets
|
0.36%
|
0.57%
|
1.09%
|
0.96%
|
0.89%
|
0.71%
|
0.93%
|
1.07%
|
0.70%
|
0.47%
|
0.79%
|
|
GAAP
net
income / average equity (GAAP ROE)
|
4.82%
|
7.26%
|
14.15%
|
12.44%
|
12.51%
|
11.58%
|
18.18%
|
22.01%
|
16.50%
|
6.08%
|
12.30%
|
|
GAAP
net
income / average core equity (adjusted ROE)
|
4.80%
|
7.92%
|
15.45%
|
13.91%
|
13.98%
|
12.77%
|
19.31%
|
25.39%
|
19.48%
|
6.34%
|
13.39%
|
|
|
|
|
|
|
|
||||||
|
Core
earnings
|
$38,108
|
$29,807
|
$30,276
|
$31,983
|
$25,417
|
$29,885
|
$24,594
|
$30,967
|
$37,872
|
$67,915
|
$55,302
|
|
Average
core
equity
|
$951,378
|
$925,128
|
$923,856
|
$932,030
|
$898,409
|
$877,212
|
$880,329
|
$880,482
|
$840,098
|
$938,212
|
$887,870
|
|
Core
earnings
/ average core equity (core ROE)
|
16.02%
|
12.89%
|
13.11%
|
13.73%
|
11.32%
|
13.63%
|
11.18%
|
14.07%
|
18.03%
|
14.48%
|
12.46%
|
|
|
|
|
|
|
|
|
|
||||
|
Interest
income
|
$219,658
|
$215,105
|
$217,391
|
$223,649
|
$218,238
|
$225,882
|
$231,139
|
$244,631
|
$248,505
|
$434,763
|
$444,120
|
|
Average
consolidated earning assets
|
$12,301,562
|
$12,279,814
|
$12,498,889
|
$12,860,488
|
$13,581,710
|
$15,229,790
|
$17,542,352
|
$20,085,392
|
$22,606,037
|
$12,291,559
|
$14,401,199
|
|
Asset
yield
|
7.14%
|
7.01%
|
6.96%
|
6.96%
|
6.43%
|
5.93%
|
5.27%
|
4.87%
|
4.40%
|
7.07%
|
6.17%
|
|
|
|
|
|
|
|
||||||
|
Interest
expense
|
($165,757)
|
($168,095)
|
($172,434)
|
($174,673)
|
($173,519)
|
($180,655)
|
($189,657)
|
($196,591)
|
($195,125)
|
($333,852)
|
($354,174)
|
|
Average
consolidated interest-bearing liabilities
|
$11,580,196
|
$11,623,627
|
$11,836,717
|
$12,332,390
|
$13,055,417
|
$14,800,315
|
$17,194,545
|
$19,840,201
|
$22,283,915
|
$11,603,779
|
$13,923,046
|
|
Cost
of
funds
|
5.73%
|
5.78%
|
5.83%
|
5.67%
|
5.32%
|
4.88%
|
4.41%
|
3.96%
|
3.50%
|
5.75%
|
5.09%
|
|
|
|
|
|
|
|
||||||
|
Asset
yield
|
7.14%
|
7.01%
|
6.96%
|
6.96%
|
6.43%
|
5.93%
|
5.27%
|
4.87%
|
4.40%
|
7.07%
|
6.17%
|
|
Cost
of
funds
|
-5.73%
|
-5.78%
|
-5.84%
|
-5.67%
|
-5.32%
|
-4.88%
|
-4.41%
|
-3.96%
|
-3.50%
|
-5.75%
|
-5.09%
|
|
Interest
rate
spread
|
1.42%
|
1.22%
|
1.12%
|
1.29%
|
1.11%
|
1.05%
|
0.86%
|
0.91%
|
0.89%
|
1.32%
|
1.08%
|
|
|
|
|
|
|
|
||||||
|
Net
interest
income
|
$53,901
|
$47,010
|
$44,534
|
$48,976
|
$44,719
|
$45,227
|
$41,481
|
$48,040
|
$53,380
|
$100,911
|
$89,946
|
|
Average
consolidated earning assets
|
$12,301,562
|
$12,279,814
|
$12,498,889
|
$12,860,488
|
$13,581,710
|
$15,229,790
|
$17,542,352
|
$20,085,392
|
$22,606,037
|
$12,291,559
|
$14,401,199
|
|
Net
interest
margin
|
1.75%
|
1.53%
|
1.43%
|
1.52%
|
1.32%
|
1.19%
|
0.95%
|
0.96%
|
0.94%
|
1.64%
|
1.25%
|
|
|
|
|
|
|
|
|
|
|
|
|
|
|
The
Redwood
Review
2nd
Quarter
|
Appendix
Table
7 - Book
Value and Profitability Ratios
|
85
|
|
|
|||||||||||
|
|
|
|
|
|
|
|
|
|
Six
Months
|
Six
Months
|
|
|
|
Q2:2007
|
Q1:2007
|
Q4:2006
|
Q3:2006
|
Q2:2006
|
Q1:2006
|
Q4:2005
|
Q3:2005
|
Q2:2005
|
2007
|
2006
|
|
Average
GAAP balances
|
|
|
|
|
|
||||||
|
Residential
CES
|
$695,709
|
$673,114
|
$654,909
|
$641,694
|
$573,253
|
$516,962
|
$517,138
|
$567,689
|
$531,456
|
$684,474
|
$545,108
|
|
Residential
loans
|
8,232,476
|
8,704,147
|
9,212,346
|
9,947,068
|
10,789,275
|
12,542,519
|
14,821,587
|
17,597,906
|
20,312,485
|
8,467,009
|
11,661,054
|
|
Residential
IGS
|
2,119,280
|
1,795,130
|
1,513,794
|
1,404,281
|
1,358,453
|
1,299,933
|
1,263,277
|
1,219,034
|
1,122,945
|
1,958,101
|
1,329,514
|
|
Commercial
CES
|
456,039
|
426,121
|
364,405
|
328,211
|
253,429
|
215,769
|
191,586
|
152,641
|
123,390
|
441,163
|
234,599
|
|
Commercial
loans
|
25,846
|
28,186
|
29,571
|
32,194
|
42,912
|
56,777
|
59,049
|
47,703
|
45,214
|
27,009
|
49,807
|
|
Commercial
IGS
|
118,231
|
122,099
|
106,902
|
128,355
|
132,154
|
181,549
|
188,445
|
215,109
|
204,247
|
120,154
|
156,852
|
|
CDO
CES
|
18,365
|
18,348
|
19,539
|
20,999
|
13,950
|
14,709
|
12,231
|
11,892
|
2,816
|
18,357
|
14,330
|
|
CDO
IGS
|
262,005
|
230,684
|
198,749
|
174,363
|
171,687
|
157,570
|
149,660
|
138,996
|
138,777
|
246,431
|
164,629
|
|
Other
real
estate investments
|
44,061
|
37,169
|
-
|
-
|
-
|
-
|
-
|
-
|
-
|
40,634
|
-
|
|
Non
real
Estate Investments
|
38,681
|
-
|
-
|
-
|
-
|
-
|
-
|
-
|
-
|
19,448
|
-
|
|
Cash
and cash
equivalents
|
290,869
|
244,816
|
398,674
|
183,323
|
246,597
|
244,002
|
339,379
|
134,422
|
124,707
|
268,779
|
245,306
|
|
Earning
assets
|
12,301,562
|
12,279,814
|
12,498,889
|
12,860,488
|
13,581,710
|
15,229,790
|
17,542,352
|
20,085,392
|
22,606,037
|
12,291,559
|
14,401,199
|
|
Other
assets
|
386,906
|
586,165
|
542,905
|
619,873
|
587,045
|
609,693
|
806,329
|
905,907
|
759,516
|
487,530
|
598,306
|
|
Total
assets
|
$12,688,468
|
$12,865,979
|
$13,041,794
|
$13,480,361
|
$14,168,755
|
$15,839,483
|
$18,348,681
|
$20,991,299
|
$23,365,553
|
$12,779,089
|
$14,999,505
|
|
|
|
|
|
|
|
||||||
|
|
|
|
|
|
|
||||||
|
Redwood
debt
|
$1,515,988
|
$2,188,561
|
$1,090,480
|
$647,978
|
$85,616
|
$137,181
|
$253,302
|
$297,788
|
$216,639
|
$1,850,144
|
$111,256
|
|
Subordinated
notes
|
117,934
|
97,013
|
21,401
|
-
|
-
|
-
|
-
|
-
|
-
|
107,531
|
-
|
|
ABS
obligations of entities
|
9,946,274
|
9,338,053
|
10,724,837
|
11,684,412
|
12,969,801
|
14,663,134
|
16,941,243
|
19,542,413
|
22,067,276
|
9,646,104
|
13,811,790
|
|
Other
liabilities
|
161,819
|
233,664
|
196,214
|
136,362
|
132,936
|
86,938
|
154,823
|
136,769
|
111,294
|
198,242
|
110,065
|
|
Total
liabilities
|
11,742,015
|
11,857,291
|
12,032,931
|
12,468,752
|
13,188,353
|
14,887,253
|
17,349,368
|
19,976,970
|
22,395,209
|
11,802,021
|
14,033,111
|
|
|
|
|
|
|
|
||||||
|
Core
equity
|
951,378
|
925,128
|
923,856
|
932,030
|
898,409
|
877,212
|
880,329
|
880,482
|
840,098
|
938,212
|
887,870
|
|
Balance
sheet
mark-to-market adjustments
|
(4,924)
|
83,560
|
85,007
|
79,579
|
81,993
|
75,018
|
118,984
|
133,847
|
130,246
|
38,856
|
78,525
|
|
Total
equity
|
946,454
|
1,008,688
|
1,008,863
|
1,011,609
|
980,402
|
952,230
|
999,313
|
1,014,329
|
970,344
|
977,068
|
966,394
|
|
Total
liabilities and equity
|
$12,688,468
|
$12,865,979
|
$13,041,794
|
$13,480,361
|
$14,168,755
|
$15,839,483
|
$18,348,681
|
$20,991,299
|
$23,365,553
|
$12,779,089
|
$14,999,505
|
|
The
Redwood
Review
2nd
Quarter
|
Appendix
Table
8
Average Balance Sheet
|
86
|
|
|
Table
9 - Balances & Yields by Portfolio ($ in
thousands)
|
|
Residential
IGS
|
||||||||||
|
Q2:
2007
|
Q1:
2007
|
Q4:
2006
|
Q3:
2006
|
Q2:
2006
|
Q1:
2006
|
Q4:
2005
|
Q3:
2005
|
Q2:
2005
|
||
|
Current
face
|
$2,276,704
|
$2,094,494
|
$1,708,607
|
$1,484,095
|
$1,406,195
|
$1,361,245
|
$1,273,985
|
$1,282,132
|
$1,189,207
|
|
|
Unamortized
discount
|
(32,187)
|
(19,617)
|
(16,382)
|
(17,362)
|
(18,788)
|
(19,874)
|
(11,595)
|
(13,970)
|
(12,165)
|
|
|
Credit
protection
|
-
|
-
|
-
|
-
|
-
|
-
|
-
|
-
|
-
|
|
|
Unrealized
market value gains/(losses)
|
(81,571)
|
(49,027)
|
5,025
|
8,270
|
2,609
|
5,304
|
(2,300)
|
11,082
|
16,252
|
|
|
Net
book value
|
$2,162,946
|
$2,025,850
|
$1,697,250
|
$1,475,002
|
$1,390,016
|
$1,346,675
|
$1,260,090
|
$1,279,244
|
$1,193,294
|
|
|
Average
balance
|
$2,119,280
|
$1,795,130
|
$1,513,794
|
$1,404,281
|
$1,358,453
|
$1,299,933
|
$1,263,277
|
$1,219,034
|
$1,122,945
|
|
|
Interest
income
|
$36,061
|
$29,420
|
$25,626
|
$24,961
|
$22,287
|
$20,180
|
$18,148
|
$16,942
|
$13,909
|
|
|
Yield
|
6.80%
|
6.56%
|
6.77%
|
7.11%
|
6.56%
|
6.21%
|
5.75%
|
5.56%
|
4.95%
|
|
|
Residential
CES
|
||||||||||
|
Q2:
2007
|
Q1:
2007
|
Q4:
2006
|
Q3:
2006
|
Q2:
2006
|
Q1:
2006
|
Q4:
2005
|
Q3:
2005
|
Q2:
2005
|
||
|
Current
face
|
$1,291,193
|
$1,259,446
|
$1,180,605
|
$1,183,142
|
$1,168,602
|
$1,034,069
|
$1,013,793
|
$1,029,786
|
$1,079,323
|
|
|
Unamortized
discount
|
(125,948)
|
(158,664)
|
(144,842)
|
(140,585)
|
(116,702)
|
(108,371)
|
(121,824)
|
(84,084)
|
(90,716)
|
|
|
Credit
protection
|
(453,076)
|
(392,768)
|
(372,247)
|
(384,397)
|
(425,578)
|
(373,781)
|
(354,610)
|
(382,862)
|
(404,180)
|
|
|
Unrealized
market value gains/(losses)
|
32,806
|
44,263
|
58,015
|
57,495
|
50,854
|
43,522
|
55,193
|
80,867
|
99,380
|
|
|
Net
book value
|
$744,975
|
$752,277
|
$721,531
|
$715,655
|
$677,176
|
$595,439
|
$592,552
|
$643,707
|
$683,807
|
|
|
Average
balance
|
$695,709
|
$673,114
|
$654,909
|
$641,694
|
$573,253
|
$516,962
|
$517,138
|
$567,689
|
$531,456
|
|
|
Interest
income
|
$40,885
|
$37,664
|
$35,650
|
$34,585
|
$28,059
|
$26,245
|
$22,556
|
$23,640
|
$18,778
|
|
|
Yield
|
23.51%
|
22.38%
|
21.77%
|
21.56%
|
19.58%
|
20.31%
|
17.45%
|
16.66%
|
14.13%
|
|
|
Other
Real Estate Investments
|
||||||||||
|
Other
Real Estate Investments
|
Q2:
2007
|
Q1:
2007
|
Q4:
2006
|
Q3:
2006
|
Q2:
2006
|
Q1:
2006
|
Q4:
2005
|
Q3:
2005
|
Q2:
2005
|
|
|
Current
face
|
$33,340
|
$38,670
|
-
|
-
|
-
|
-
|
-
|
-
|
-
|
|
|
Unamortized
premium
|
-
|
-
|
-
|
-
|
-
|
-
|
-
|
-
|
-
|
|
|
Credit
protection
|
-
|
-
|
-
|
-
|
-
|
-
|
-
|
-
|
-
|
|
|
Unrealized
market value gains/(losses)
|
828
|
11,387
|
-
|
-
|
-
|
-
|
-
|
-
|
-
|
|
|
Net
book value
|
$34,168
|
$50,057
|
-
|
-
|
-
|
-
|
-
|
-
|
-
|
|
|
-
|
-
|
-
|
-
|
-
|
-
|
-
|
||||
|
Average
balance
|
$44,061
|
$37,169
|
-
|
-
|
-
|
-
|
-
|
-
|
-
|
|
|
Interest
income
|
$669
|
$2,465
|
-
|
-
|
-
|
-
|
-
|
-
|
-
|
|
|
Yield
|
6.07%
|
26.53%
|
-
|
-
|
-
|
-
|
-
|
-
|
-
|
|
|
The
Redwood
Review
2nd
Quarter
|
Appendix
Table
9 -
Balances and Yields by Portfolio
|
87
|
|
|
Table
9 - Balances & Yields by Portfolio ($ in
thousands)
|
|
Residential
Real Estate Loans
|
||||||||||
|
Q2:
2007
|
Q1:
2007
|
Q4:
2006
|
Q3:
2006
|
Q2:
2006
|
Q1:
2006
|
Q4:
2005
|
Q3:
2005
|
Q2:
2005
|
||
|
Current
face
|
$8,269,306
|
$8,582,964
|
$9,212,002
|
$9,718,985
|
$10,318,641
|
$11,846,454
|
$13,719,242
|
$16,386,833
|
$19,443,387
|
|
|
Unamortized
premium
|
98,757
|
117,477
|
132,052
|
143,135
|
155,101
|
166,134
|
178,206
|
191,513
|
210,137
|
|
|
Credit
protection
|
(16,416)
|
(19,954)
|
(20,119)
|
(19,326)
|
(19,450)
|
(22,372)
|
(22,656)
|
(22,029)
|
(22,959)
|
|
|
Unrealized
market value gains/(losses)
|
-
|
-
|
-
|
-
|
-
|
-
|
-
|
-
|
-
|
|
|
Net
book value
|
$8,351,647
|
$8,680,487
|
$9,323,935
|
$9,842,794
|
$10,454,292
|
$11,990,216
|
$13,874,792
|
$16,556,317
|
$19,630,565
|
|
|
Average
balance
|
$8,232,476
|
$8,704,147
|
$9,212,346
|
$9,947,068
|
$10,789,275
|
$12,542,519
|
$14,821,587
|
$17,597,906
|
$20,312,485
|
|
|
Interest
income
|
$119,157
|
$129,143
|
$137,568
|
$148,494
|
$154,160
|
$165,664
|
$176,599
|
$193,621
|
$206,263
|
|
|
Yield
|
5.79%
|
5.93%
|
5.97%
|
5.97%
|
5.72%
|
5.28%
|
4.77%
|
4.40%
|
4.06%
|
|
|
Commercial
CES
|
||||||||||
|
Q2:
2007
|
Q1:
2007
|
Q4:
2006
|
Q3:
2006
|
Q2:
2006
|
Q1:
2006
|
Q4:
2005
|
Q3:
2005
|
Q2:
2005
|
||
|
Current
face
|
$880,987
|
$792,240
|
$793,743
|
$667,512
|
$486,622
|
$407,466
|
$383,334
|
$323,724
|
$222,522
|
|
|
Unamortized
discount
|
(95,346)
|
(71,455)
|
(71,424)
|
(48,712)
|
(28,184)
|
(20,473)
|
(28,993)
|
(2,428)
|
(8,062)
|
|
|
Credit
protection
|
(310,745)
|
(294,466)
|
(295,340)
|
(258,382)
|
(192,134)
|
(167,772)
|
(141,806)
|
(138,530)
|
(87,210)
|
|
|
Unrealized
market value gains/(losses)
|
(23,955)
|
9,063
|
21,081
|
19,449
|
4,939
|
4,081
|
6,321
|
4,462
|
10,779
|
|
|
Net
book value
|
$450,941
|
$435,382
|
$448,060
|
$379,867
|
$271,243
|
$223,302
|
$218,856
|
$187,228
|
$138,029
|
|
|
Average
balance
|
$456,039
|
$426,121
|
$364,405
|
$328,211
|
$253,429
|
$215,769
|
$191,586
|
$152,641
|
$123,390
|
|
|
Interest
income
|
$11,119
|
$10,140
|
$8,170
|
$7,381
|
$5,581
|
$4,268
|
$3,927
|
$2,747
|
$2,811
|
|
|
Yield
|
9.75%
|
9.52%
|
8.97%
|
9.00%
|
8.81%
|
7.91%
|
8.20%
|
7.20%
|
9.11%
|
|
|
Commercial
IGS
|
||||||||||
|
Q2:
2007
|
Q1:
2007
|
Q4:
2006
|
Q3:
2006
|
Q2:
2006
|
Q1:
2006
|
Q4:
2005
|
Q3:
2005
|
Q2:
2005
|
||
|
Current
face
|
$121,131
|
$121,737
|
$122,869
|
$133,361
|
$134,244
|
$182,041
|
$180,213
|
$209,524
|
$199,957
|
|
|
Unamortized
premium/ (discount)
|
(3,103)
|
(3,172)
|
(3,367)
|
701
|
727
|
5,295
|
8,100
|
13,303
|
14,129
|
|
|
Credit
protection
|
-
|
-
|
-
|
-
|
-
|
-
|
-
|
-
|
-
|
|
|
Unrealized
market value gains/(losses)
|
(6,884)
|
(2,071)
|
111
|
577
|
(3,937)
|
(2,936)
|
(3,281)
|
(44)
|
3,762
|
|
|
Net
book value
|
$111,144
|
$116,494
|
$119,613
|
$134,639
|
$131,034
|
$184,400
|
$185,032
|
$222,783
|
$217,848
|
|
|
Average
balance
|
$118,231
|
$122,099
|
$106,902
|
$128,355
|
$132,154
|
$181,549
|
$188,445
|
$215,109
|
$204,247
|
|
|
Interest
income
|
$1,827
|
$1,875
|
$2,344
|
$2,342
|
$2,133
|
$2,880
|
$3,102
|
$3,398
|
$3,036
|
|
|
Yield
|
6.18%
|
6.14%
|
8.77%
|
7.30%
|
6.46%
|
6.35%
|
6.58%
|
6.32%
|
5.95%
|
|
|
The
Redwood
Review
2nd
Quarter
|
Appendix
Table
9
Balances and Yields by Portfolio
|
88
|
|
|
Table
9 - Balances & Yields by Portfolio ($ in
thousands)
|
|
Commercial
Loans
|
||||||||||
|
Q2:
2007
|
Q1:
2007
|
Q4:
2006
|
Q3:
2006
|
Q2:
2006
|
Q1:
2006
|
Q4:
2005
|
Q3:
2005
|
Q2:
2005
|
||
|
Current
face
|
$38,311
|
$38,394
|
$38,360
|
$42,384
|
$46,959
|
$65,508
|
$70,091
|
$66,348
|
$51,778
|
|
|
Unamortized
discount
|
(1,995)
|
(2,022)
|
(2,047)
|
(2,073)
|
(2,096)
|
(2,200)
|
(2,258)
|
(2,105)
|
(1,843)
|
|
|
Credit
protection
|
(10,489)
|
(10,489)
|
(8,141)
|
(8,141)
|
(8,141)
|
(8,141)
|
(8,141)
|
(8,141)
|
(8,141)
|
|
|
Unrealized
market value gains/(losses)
|
-
|
-
|
-
|
-
|
-
|
-
|
-
|
-
|
-
|
|
|
Net
book value
|
$25,827
|
$25,883
|
$28,172
|
$32,170
|
$36,722
|
$55,167
|
$59,692
|
$56,102
|
$41,794
|
|
|
Average
balance
|
$25,846
|
$28,186
|
$29,571
|
$32,194
|
$42,912
|
$56,777
|
$59,049
|
$47,703
|
$45,214
|
|
|
Interest
(loss) income
|
$419
|
(2,293)
|
$409
|
$524
|
$812
|
$1,238
|
$1,281
|
$1,209
|
$1,208
|
|
|
Yield
|
6.48%
|
-32.54%
|
5.53%
|
6.51%
|
7.57%
|
8.72%
|
8.68%
|
10.14%
|
10.69%
|
|
|
CDO
CES
|
||||||||||
|
Q2:
2007
|
Q1:
2007
|
Q4:
2006
|
Q3:
2006
|
Q2:
2006
|
Q1:
2006
|
Q4:
2005
|
Q3:
2005
|
Q2:
2005
|
||
|
Current
face
|
$31,381
|
$23,731
|
$28,731
|
$29,231
|
$22,226
|
$23,226
|
$20,226
|
$20,226
|
$10,184
|
|
|
Unamortized
discount
|
(9,955)
|
(7,004)
|
(6,889)
|
(7,298)
|
(7,978)
|
(8,048)
|
(8,004)
|
(7,907)
|
(7,232)
|
|
|
Credit
protection
|
-
|
-
|
-
|
-
|
-
|
-
|
-
|
-
|
-
|
|
|
Unrealized
market value gains/(losses)
|
(293)
|
(575)
|
122
|
326
|
470
|
(436)
|
(484)
|
144
|
(187)
|
|
|
Net
book value
|
$21,133
|
$16,152
|
$21,964
|
$22,259
|
$14,718
|
$14,742
|
$11,738
|
$12,463
|
$2,765
|
|
|
Average
balance
|
$18,365
|
$18,348
|
$19,539
|
$20,999
|
$13,950
|
$14,709
|
$12,231
|
$11,892
|
$2,816
|
|
|
Interest
income
|
$660
|
$497
|
$570
|
$609
|
$236
|
$439
|
$125
|
$131
|
$127
|
|
|
Yield
|
14.38%
|
10.84%
|
11.67%
|
11.60%
|
6.77%
|
11.94%
|
4.09%
|
4.41%
|
18.04%
|
|
|
|
|
|||||||||
|
CDO
IGS
|
||||||||||
|
Q2:
2007
|
Q1:
2007
|
Q4:
2006
|
Q3:
2006
|
Q2:
2006
|
Q1:
2006
|
Q4:
2005
|
Q3:
2005
|
Q2:
2005
|
||
|
Current
face
|
$262,881
|
$263,237
|
$222,413
|
$182,352
|
$175,586
|
$162,844
|
$149,812
|
$144,246
|
$145,933
|
|
|
Unamortized
discount
|
(7,096)
|
(945)
|
(238)
|
(236)
|
(241)
|
(249)
|
(257)
|
(264)
|
(470)
|
|
|
Credit
protection
|
-
|
-
|
-
|
-
|
-
|
-
|
-
|
-
|
-
|
|
|
Unrealized
market value gains/(losses)
|
(21,152)
|
(7,985)
|
2,174
|
2,826
|
1,718
|
944
|
1,092
|
2,362
|
3,221
|
|
|
Net
book value
|
$234,633
|
$254,307
|
$224,349
|
$184,942
|
$177,063
|
$163,539
|
$150,647
|
$146,344
|
$148,684
|
|
|
Average
balance
|
$262,005
|
$230,684
|
$198,749
|
$174,363
|
$171,687
|
$157,570
|
$149,660
|
$138,996
|
$138,777
|
|
|
Interest
income
|
$4,641
|
$3,862
|
$3,335
|
$2,881
|
$2,099
|
$2,491
|
$2,571
|
$1,953
|
$1,569
|
|
|
Yield
|
7.08%
|
6.70%
|
6.71%
|
6.61%
|
4.89%
|
6.32%
|
6.87%
|
5.62%
|
4.52%
|
|
|
The
Redwood
Review
2nd
Quarter
|
Appendix
Table
9
Balances and Yields by Portfolio
|
89
|
|
|
Table
9 - Balances & Yields by Portfolio ($ in
thousands)
|
|
Non
Real Estate Investments
|
||||||||||
|
Q2:
2007
|
Q1:
2007
|
Q4:
2006
|
Q3:
2006
|
Q2:
2006
|
Q1:
2006
|
Q4:
2005
|
Q3:
2005
|
Q2:
2005
|
||
|
Current
face
|
$80,000
|
-
|
-
|
-
|
-
|
-
|
-
|
-
|
-
|
|
|
Unamortized
premium/ (discount)
|
-
|
-
|
-
|
-
|
-
|
-
|
-
|
-
|
-
|
|
|
Credit
protection
|
-
|
-
|
-
|
-
|
-
|
-
|
-
|
-
|
-
|
|
|
Unrealized
market value gains/(losses)
|
-
|
-
|
-
|
-
|
-
|
-
|
-
|
-
|
-
|
|
|
Net
book value
|
$80,000
|
-
|
-
|
-
|
-
|
-
|
-
|
-
|
-
|
|
|
Average
balance
|
$38,681
|
$0
|
$0
|
$0
|
$0
|
$0
|
$0
|
$0
|
$0
|
|
|
Interest
income
|
$464
|
$0
|
$0
|
$0
|
$0
|
$0
|
$0
|
$0
|
$0
|
|
|
Yield
|
4.80%
|
0.00%
|
0.00%
|
0.00%
|
0.00%
|
0.00%
|
0.00%
|
0.00%
|
0.00%
|
|
|
Cash
& Equivalents
|
||||||||||
|
Q2:
2007
|
Q1:
2007
|
Q4:
2006
|
Q3:
2006
|
Q2:
2006
|
Q1:
2006
|
Q4:
2005
|
Q3:
2005
|
Q2:
2005
|
||
|
Current
face
|
$82,626
|
$91,656
|
$168,016
|
$112,926
|
$106,491
|
$85,466
|
$175,885
|
$163,160
|
$72,193
|
|
|
Unamortized
premium/ (discount)
|
-
|
-
|
-
|
-
|
-
|
-
|
-
|
-
|
-
|
|
|
Credit
protection
|
-
|
-
|
-
|
-
|
-
|
-
|
-
|
-
|
-
|
|
|
Unrealized
market value gains/(losses)
|
-
|
-
|
-
|
-
|
-
|
-
|
-
|
-
|
-
|
|
|
Net
book value
|
$82,626
|
$91,656
|
$168,016
|
$112,926
|
$106,491
|
$85,466
|
$175,885
|
$163,160
|
$72,193
|
|
|
Average
balance
|
$290,869
|
$244,816
|
$398,674
|
$183,323
|
$246,597
|
$244,002
|
$339,379
|
$134,422
|
$124,707
|
|
|
Interest
income
|
$3,756
|
$2,332
|
$3,719
|
$1,872
|
$2,871
|
$2,477
|
$2,830
|
$990
|
$804
|
|
|
Yield
|
5.17%
|
3.81%
|
3.73%
|
4.08%
|
4.66%
|
4.06%
|
3.34%
|
2.95%
|
2.58%
|
|
|
Total
Earning Assets (GAAP)
|
||||||||||
|
Q2:
2007
|
Q1:
2007
|
Q4:
2006
|
Q3:
2006
|
Q2:
2006
|
Q1:
2006
|
Q4:
2005
|
Q3:
2005
|
Q2:
2005
|
||
|
Current
face
|
$13,367,860
|
$13,306,569
|
$13,475,346
|
$13,553,988
|
$13,865,566
|
$15,168,319
|
$16,986,581
|
$19,625,979
|
$22,414,484
|
|
|
Unamortized
premium/ (discount)
|
(176,873)
|
(129,027)
|
(113,137)
|
(72,430)
|
(18,161)
|
12,214
|
13,375
|
94,058
|
103,778
|
|
|
Credit
protection
|
(790,726)
|
(717,677)
|
(695,847)
|
(670,246)
|
(645,303)
|
(572,066)
|
(527,213)
|
(551,562)
|
(522,490)
|
|
|
Unrealized
market value gains/(losses)
|
(100,221)
|
(11,320)
|
86,528
|
88,943
|
56,653
|
50,479
|
56,541
|
98,873
|
133,207
|
|
|
Net
book value
|
$12,300,040
|
$12,448,545
|
$12,752,890
|
$12,900,255
|
$13,258,755
|
$14,658,946
|
$16,529,284
|
$19,267,348
|
$22,128,979
|
|
|
Average
balance
|
$12,301,562
|
$12,279,814
|
$12,498,889
|
$12,860,487
|
$13,581,710
|
$15,229,790
|
$17,542,352
|
$20,085,392
|
$22,606,037
|
|
|
Interest
income
|
$219,658
|
$215,105
|
$217,391
|
$223,649
|
$218,238
|
$225,882
|
$231,139
|
$244,631
|
$248,505
|
|
|
Yield
|
7.14%
|
7.01%
|
6.96%
|
6.96%
|
6.43%
|
5.93%
|
5.27%
|
4.87%
|
4.40%
|
|
|
The
Redwood
Review
2nd
Quarter
|
Appendix
Table
9
Balances and Yields by Portfolio
|
90
|
|
|
Table
10: Portfolio Activity (in
thousands)
|
|
|
||||||||||
|
Residential
IGS
|
||||||||||
|
Q2:
2007
|
Q1:
2007
|
Q4:
2006
|
Q3:
2006
|
Q2:
2006
|
Q1:
2006
|
Q4:
2005
|
Q3:
2005
|
Q2:
2005
|
||
|
Beginning
balance
|
$2,025,850
|
$1,697,250
|
$1,475,002
|
$1,390,015
|
$1,346,674
|
$1,260,089
|
$1,279,243
|
$1,193,293
|
$1,087,396
|
|
|
Acquisitions
|
267,695
|
535,346
|
352,292
|
120,316
|
179,115
|
80,970
|
116,987
|
114,699
|
128,708
|
|
|
Upgrades
/
downgrades
|
-
|
-
|
-
|
-
|
-
|
30,667
|
-
|
-
|
-
|
|
|
Transfer
to
other portfolios
|
-
|
(13,816)
|
-
|
-
|
-
|
-
|
-
|
-
|
-
|
|
|
Sales
|
(52,217)
|
(108,372)
|
(97,124)
|
(12,669)
|
(104,442)
|
(3,984)
|
(95,328)
|
4,000
|
(3,012)
|
|
|
Principal
payments
|
(45,857)
|
(32,248)
|
(31,398)
|
(29,997)
|
(31,136)
|
(25,445)
|
(29,834)
|
(27,627)
|
(22,961)
|
|
|
Discount
amortization
|
2,449
|
1,321
|
1,023
|
1,943
|
1,446
|
853
|
790
|
761
|
347
|
|
|
Net
mark-to-market adjustment
|
(34,974)
|
(53,631)
|
(2,545)
|
5,394
|
(1,642)
|
3,524
|
(11,769)
|
(5,883)
|
2,815
|
|
|
Ending
Balance
|
$2,162,946
|
$2,025,850
|
$1,697,250
|
$1,475,002
|
$1,390,015
|
$1,346,674
|
$1,260,089
|
$1,279,243
|
$1,193,293
|
|
|
Residential
CES
|
||||||||||
|
Q2:
2007
|
Q1:
2007
|
Q4:
2006
|
Q3:
2006
|
Q2:
2006
|
Q1:
2006
|
Q4:
2005
|
Q3:
2005
|
Q2:
2005
|
||
|
Beginning
balance
|
$752,277
|
$721,531
|
$715,655
|
$677,176
|
$595,439
|
$592,552
|
$643,707
|
$683,807
|
$587,760
|
|
|
Acquisitions
|
39,381
|
73,725
|
20,870
|
87,305
|
89,217
|
52,822
|
54,664
|
57,479
|
87,864
|
|
|
Upgrades
/
downgrades
|
-
|
-
|
-
|
-
|
-
|
(30,667)
|
-
|
-
|
-
|
|
|
Transfer
to
other portfolios
|
-
|
(4,480)
|
-
|
-
|
-
|
-
|
-
|
-
|
-
|
|
|
Sales
|
(3,292)
|
(5,214)
|
(962)
|
(47,585)
|
(4,035)
|
(9,650)
|
(81,292)
|
(98,775)
|
-
|
|
|
Principal
payments
|
(43,556)
|
(35,672)
|
(32,639)
|
(28,835)
|
(23,302)
|
(14,110)
|
(21,523)
|
(17,013)
|
(18,931)
|
|
|
Discount
amortization
|
21,065
|
18,892
|
17,412
|
15,917
|
11,684
|
12,391
|
10,098
|
10,766
|
7,424
|
|
|
Net
mark-to-market adjustment
|
(20,900)
|
(16,505)
|
1,195
|
11,677
|
8,173
|
(7,899)
|
(13,102)
|
7,443
|
19,690
|
|
|
Ending
balance
|
$744,975
|
$752,277
|
$721,531
|
$715,655
|
$677,176
|
$595,439
|
$592,552
|
$643,707
|
$683,807
|
|
|
Other
Real Estate Investments
|
||||||||||
|
Q2:
2007
|
Q1:
2007
|
Q4:
2006
|
Q3:
2006
|
Q2:
2006
|
Q1:
2006
|
Q4:
2005
|
Q3:
2005
|
Q2:
2005
|
||
|
Beginning
balance
|
$50,057
|
$0
|
-
|
-
|
-
|
-
|
-
|
-
|
-
|
|
|
Acquisitions
|
-
|
40,790
|
-
|
-
|
-
|
-
|
-
|
-
|
-
|
|
|
Upgrades
/
downgrades
|
-
|
-
|
-
|
-
|
-
|
-
|
-
|
-
|
-
|
|
|
Transfer
from
other portfolios
|
-
|
18,296
|
-
|
-
|
-
|
-
|
-
|
-
|
-
|
|
|
Sales
|
(2,237)
|
-
|
-
|
-
|
-
|
-
|
-
|
-
|
-
|
|
|
Principal
payments
|
(5,301)
|
(3,079)
|
-
|
-
|
-
|
-
|
-
|
-
|
-
|
|
|
Premium
amortization
|
(2,104)
|
(532)
|
-
|
-
|
-
|
-
|
-
|
-
|
-
|
|
|
Net
mark-to-market adjustment
|
(6,247)
|
(5,418)
|
-
|
-
|
-
|
-
|
-
|
-
|
-
|
|
|
Ending
balance
|
$34,168
|
$50,057
|
-
|
-
|
-
|
-
|
-
|
-
|
-
|
|
|
The
Redwood
Review
2nd
Quarter
|
Appendix
Table
10
Portfolio Activity
|
91
|
|
|
Table
10: Portfolio Activity (in
thousands)
|
|
Real
Estate Loans
|
||||||||||
|
Q2:
2007
|
Q1:
2007
|
Q4:
2006
|
Q3:
2006
|
Q2:
2006
|
Q1:
2006
|
Q4:
2005
|
Q3:
2005
|
Q2:
2005
|
||
|
Beginning
balance
|
$8,680,487
|
$9,323,935
|
$9,842,794
|
$10,454,292
|
$11,990,216
|
$13,874,792
|
$16,556,317
|
$19,630,565
|
$21,772,696
|
|
|
Acquisitions
|
674,932
|
415,283
|
725,695
|
966,673
|
272,627
|
52,691
|
271,875
|
332,049
|
426,933
|
|
|
Sales
|
(2,191)
|
-
|
-
|
-
|
-
|
-
|
(240,987)
|
(263,079)
|
(3,378)
|
|
|
Principal
payments
|
(983,557)
|
(1,047,170)
|
(1,230,545)
|
(1,567,041)
|
(1,799,401)
|
(1,925,475)
|
(2,698,500)
|
(3,129,492)
|
(2,557,675)
|
|
|
Premium
amortization
|
(10,889)
|
(11,726)
|
(13,298)
|
(11,254)
|
(12,073)
|
(12,075)
|
(13,334)
|
(14,438)
|
(9,758)
|
|
|
Credit
provision
|
(2,500)
|
(1,481)
|
(1,505)
|
(465)
|
2,507
|
(141)
|
(877)
|
805
|
1,527
|
|
|
Net
charge-offs / (recoveries)
|
(4,635)
|
1,646
|
794
|
589
|
416
|
424
|
250
|
125
|
(34)
|
|
|
Net
mark-to-market adjustment
|
-
|
-
|
-
|
-
|
-
|
-
|
48
|
(218)
|
254
|
|
|
Ending
balance
|
$8,351,647
|
$8,680,487
|
$9,323,935
|
$9,842,794
|
$10,454,292
|
$11,990,216
|
$13,874,792
|
$16,556,317
|
$19,630,565
|
|
|
Commercial
CES
|
||||||||||
|
Q2:
2007
|
Q1:
2007
|
Q4:
2006
|
Q3:
2006
|
Q2:
2006
|
Q1:
2006
|
Q4:
2005
|
Q3:
2005
|
Q2:
2005
|
||
|
Beginning
balance
|
$435,382
|
$448,060
|
$379,867
|
$271,243
|
$223,302
|
$218,856
|
$187,228
|
$138,029
|
$127,687
|
|
|
Acquisitions
|
49,177
|
2,743
|
76,496
|
99,065
|
51,978
|
11,130
|
30,293
|
55,941
|
4,263
|
|
|
Upgrades
/
downgrades
|
-
|
(3,501)
|
-
|
-
|
-
|
(3,966)
|
-
|
-
|
-
|
|
|
Sales
|
-
|
-
|
(9,914)
|
(4,216)
|
(2,820)
|
-
|
-
|
-
|
-
|
|
|
Principal
payments
|
-
|
-
|
(13)
|
(9)
|
(9)
|
(10)
|
(9)
|
(8)
|
(8)
|
|
|
Discount
/
(premium) amortization
|
200
|
(9)
|
(289)
|
(451)
|
(257)
|
(564)
|
(276)
|
(416)
|
68
|
|
|
Net
mark-to-market adjustment
|
(33,818)
|
(11,911)
|
1,913
|
14,235
|
(951)
|
(2,144)
|
1,620
|
(6,318)
|
6,019
|
|
|
Ending
Balance
|
$450,941
|
$435,382
|
$448,060
|
$379,867
|
$271,243
|
$223,302
|
$218,856
|
$187,228
|
$138,029
|
|
|
Commercial
Loans
|
||||||||||
|
Q2:
2007
|
Q1:
2007
|
Q4:
2006
|
Q3:
2006
|
Q2:
2006
|
Q1:
2006
|
Q4:
2005
|
Q3:
2005
|
Q2:
2005
|
||
|
Beginning
balance
|
$25,883
|
$28,172
|
$32,170
|
$36,722
|
$55,167
|
$59,692
|
$56,102
|
$41,794
|
$56,604
|
|
|
Acquisitions
|
-
|
-
|
-
|
-
|
-
|
-
|
4,248
|
14,219
|
-
|
|
|
Sales
|
-
|
-
|
-
|
-
|
(8,408)
|
-
|
-
|
(17)
|
(11,192)
|
|
|
Principal
payments
|
(82)
|
38
|
(4,024)
|
(4,574)
|
(10,049)
|
(4,583)
|
(506)
|
158
|
(3,769)
|
|
|
Discount
/
(premium) amortization
|
26
|
21
|
26
|
22
|
27
|
93
|
(152)
|
(69)
|
(99)
|
|
|
Credit
provision
|
-
|
(2,348)
|
-
|
-
|
-
|
(35)
|
-
|
-
|
-
|
|
|
Net
mark-to-market adjustment
|
-
|
-
|
-
|
-
|
(14)
|
-
|
-
|
17
|
250
|
|
|
Ending
Balance
|
$25,827
|
$25,883
|
$28,172
|
$32,170
|
$36,722
|
$55,167
|
$59,692
|
$56,102
|
$41,794
|
|
|
The
Redwood
Review
2nd
Quarter
|
Appendix
Table
10
Portfolio Activity
|
92
|
|
|
Table
10: Portfolio Activity (in
thousands)
|
|
Commercial
IGS
|
||||||||||
|
Q2:
2007
|
Q1:
2007
|
Q4:
2006
|
Q3:
2006
|
Q2:
2006
|
Q1:
2006
|
Q4:
2005
|
Q3:
2005
|
Q2:
2005
|
||
|
Beginning
balance
|
$116,494
|
$119,613
|
$134,639
|
$131,034
|
$184,400
|
$185,032
|
$222,783
|
$217,848
|
$206,590
|
|
|
Acquisitions
|
-
|
2,964
|
8,999
|
(3)
|
-
|
2,177
|
29,684
|
17,179
|
7,845
|
|
|
Upgrades
/
downgrades
|
-
|
3,501
|
-
|
-
|
-
|
3,966
|
-
|
-
|
-
|
|
|
Sales
|
-
|
(6,464)
|
(24,007)
|
-
|
(51,501)
|
-
|
(56,292)
|
(4,000)
|
-
|
|
|
Principal
payments
|
(607)
|
(938)
|
(737)
|
(883)
|
(998)
|
(5,006)
|
(8,560)
|
(4,174)
|
(594)
|
|
|
Discount
/
(premium) amortization
|
69
|
67
|
51
|
(14)
|
(90)
|
(159)
|
(145)
|
(269)
|
(281)
|
|
|
Net
mark-to-market adjustment
|
(4,812)
|
(2,249)
|
668
|
4,505
|
(777)
|
(1,610)
|
(2,438)
|
(3,801)
|
4,288
|
|
|
Ending
Balance
|
$111,144
|
$116,494
|
$119,613
|
$134,639
|
$131,034
|
$184,400
|
$185,032
|
$222,783
|
$217,848
|
|
|
CDO
CES
|
||||||||||
|
Q2:
2007
|
Q1:
2007
|
Q4:
2006
|
Q3:
2006
|
Q2:
2006
|
Q1:
2006
|
Q4:
2005
|
Q3:
2005
|
Q2:
2005
|
||
|
Beginning
balance
|
$16,152
|
$21,964
|
$22,259
|
$14,718
|
$14,742
|
$11,738
|
$12,463
|
$2,765
|
$2,784
|
|
|
Acquisitions
|
4,804
|
(149)
|
-
|
7,714
|
(87)
|
3,000
|
(97)
|
9,970
|
(119)
|
|
|
Upgrades
/
downgrades
|
-
|
(5,000)
|
-
|
-
|
-
|
-
|
-
|
-
|
-
|
|
|
Sales
|
-
|
-
|
-
|
(722)
|
-
|
-
|
-
|
-
|
-
|
|
|
Principal
payments
|
(105)
|
-
|
(769)
|
(29)
|
(1,017)
|
(44)
|
-
|
42
|
-
|
|
|
Discount
amortization
|
-
|
-
|
-
|
-
|
-
|
-
|
-
|
36
|
-
|
|
|
Net
mark-to-market adjustment
|
282
|
(663)
|
474
|
578
|
1,080
|
48
|
(628)
|
(350)
|
100
|
|
|
Ending
Balance
|
$21,133
|
$16,152
|
$21,964
|
$22,259
|
$14,718
|
$14,742
|
$11,738
|
$12,463
|
$2,765
|
|
|
CDO
IGS
|
||||||||||
|
Q2:
2007
|
Q1:
2007
|
Q4:
2006
|
Q3:
2006
|
Q2:
2006
|
Q1:
2006
|
Q4:
2005
|
Q3:
2005
|
Q2:
2005
|
||
|
Beginning
balance
|
$254,307
|
$224,349
|
$184,942
|
$177,063
|
$163,539
|
$150,647
|
$146,344
|
$148,684
|
$133,123
|
|
|
Acquisitions
|
-
|
35,496
|
45,388
|
7,000
|
13,000
|
13,500
|
5,900
|
9,553
|
15,485
|
|
|
Upgrades
/
downgrades
|
-
|
5,000
|
-
|
-
|
-
|
-
|
-
|
-
|
-
|
|
|
Sales
|
-
|
-
|
(5,350)
|
-
|
-
|
-
|
-
|
-
|
-
|
|
|
Principal
payments
|
(356)
|
(376)
|
(338)
|
(235)
|
(257)
|
(468)
|
(335)
|
(11,240)
|
(237)
|
|
|
Discount
/
(premium) amortization
|
66
|
(3)
|
9
|
5
|
7
|
8
|
7
|
10
|
18
|
|
|
Net
mark-to-market adjustment
|
(19,384)
|
(10,159)
|
(302)
|
1,109
|
774
|
(148)
|
(1,269)
|
(663)
|
295
|
|
|
Ending
Balance
|
$234,633
|
$254,307
|
$224,349
|
$184,942
|
$177,063
|
$163,539
|
$150,647
|
$146,344
|
$148,684
|
|
|
The
Redwood
Review
2nd
Quarter
|
Appendix
Table
10
Portfolio Activity
|
93
|
|
|
Managed
Loans
|
Internally-Designated
Credit Reserve
|
External
Credit Enhancement
|
Total
Credit Protection (1)
|
Total
Credit Protection as % of Loans
|
Seriously
Delinquent Loans
|
Seriously
Delinquent Loan % of Current Balance
|
Total
Credit Losses
|
Losses
To Securities Junior to Redwood's Interest
|
Redwood's
Share of Net Charge-offs/(Recoveries)
|
Total
Credit Losses As % of Loans (Annualized)
|
||
|
|
|
|
|
|
|
|
|
|
|
|
|
||
|
Total
Managed
|
Q2:
2005
|
$192,291,401
|
$427,139
|
$139,847
|
$566,986
|
0.29%
|
$230,538
|
0.12%
|
$740
|
$196
|
$544
|
<0.01%
|
|
|
Residential
Portfolio
|
Q3:
2005
|
192,368,457
|
404,891
|
133,080
|
537,971
|
0.28%
|
268,341
|
0.14%
|
1,812
|
220
|
1,592
|
<0.01%
|
|
|
Portfolio
|
Q4:
2005
|
190,570,193
|
377,266
|
139,129
|
516,395
|
0.27%
|
349,068
|
0.18%
|
1,175
|
-
|
1,175
|
<0.01%
|
|
|
2005
|
190,570,193
|
377,266
|
139,129
|
516,395
|
0.27%
|
349,068
|
0.18%
|
5,104
|
416
|
4,688
|
<0.01%
|
||
|
Q1:
2006
|
198,252,684
|
396,153
|
126,376
|
522,529
|
0.26%
|
467,352
|
0.24%
|
3,002
|
-
|
3,002
|
0.01%
|
||
|
Q2:
2006
|
227,928,505
|
445,028
|
126,264
|
571,292
|
0.25%
|
441,430
|
0.19%
|
1,464
|
-
|
1,464
|
<0.01%
|
||
|
Q3:
2006
|
235,127,925
|
403,723
|
215,285
|
619,008
|
0.26%
|
658,262
|
0.28%
|
2,748
|
155
|
2,593
|
<0.01%
|
||
|
Q4:
2006
|
219,178,838
|
392,365
|
302,072
|
694,437
|
0.32%
|
842,746
|
0.39%
|
5,058
|
196
|
4,862
|
0.01%
|
||
|
2006
|
219,178,838
|
392,365
|
302,072
|
694,437
|
0.32%
|
842,746
|
0.39%
|
12,272
|
351
|
11,921
|
0.01%
|
||
|
Q1:
2007
|
245,080,031
|
412,717
|
355,855
|
768,572
|
0.31%
|
1,075,683
|
0.44%
|
5,776
|
325
|
5,451
|
0.01%
|
||
|
Q2:
2007
|
$227,973,546
|
$469,492
|
$356,374
|
$825,866
|
0.36%
|
$1,431,963
|
0.63%
|
$12,157
|
$471
|
$11,686
|
0.02%
|
||
|
|
|
|
|
|
|
|
|
|
|
|
|
||
|
Residential
Real
|
Q2:
2005
|
$19,443,387
|
$22,959
|
-
|
$22,959
|
0.12%
|
$16,514
|
0.08%
|
($34)
|
-
|
($34)
|
<0.01%
|
|
|
Estate
Loans
|
Q3:
2005
|
16,386,833
|
22,029
|
-
|
22,029
|
0.13%
|
22,956
|
0.14%
|
90
|
-
|
90
|
<0.01%
|
|
|
Q4:
2005
|
13,719,242
|
22,656
|
-
|
22,656
|
0.17%
|
37,335
|
0.27%
|
251
|
-
|
251
|
<0.01%
|
||
|
2005
|
13,719,242
|
22,656
|
-
|
22,656
|
0.17%
|
37,335
|
0.27%
|
461
|
-
|
461
|
<0.01%
|
||
|
Q1:
2006
|
11,846,454
|
22,372
|
-
|
22,372
|
0.19%
|
48,677
|
0.41%
|
425
|
-
|
425
|
<0.01%
|
||
|
Q2:
2006
|
10,318,641
|
19,450
|
-
|
19,450
|
0.19%
|
47,162
|
0.46%
|
423
|
-
|
423
|
<0.01%
|
||
|
Q3:
2006
|
9,718,985
|
19,326
|
-
|
19,326
|
0.20%
|
61,447
|
0.63%
|
589
|
-
|
589
|
0.02%
|
||
|
Q4:
2006
|
9,212,002
|
20,119
|
-
|
20,119
|
0.22%
|
65,071
|
0.79%
|
711
|
-
|
711
|
0.02%
|
||
|
2006
|
9,212,002
|
20,119
|
-
|
20,119
|
0.22%
|
65,071
|
0.79%
|
2,148
|
-
|
2,148
|
0.02%
|
||
|
Q1:
2007
|
8,582,964
|
19,954
|
-
|
19,954
|
0.23%
|
68,632
|
0.92%
|
1,646
|
-
|
1,646
|
0.08%
|
||
|
Q2:
2007
|
$8,256,759
|
$16,416
|
-
|
$16,416
|
0.20%
|
$55,674
|
0.67%
|
$6,038
|
-
|
$6,038
|
0.29%
|
||
|
|
|
|
|
|
|
|
|
|
|
|
|
||
|
Residential
CES
|
Q2:
2005
|
$172,848,014
|
$404,180
|
$139,847
|
$544,027
|
0.31%
|
$214,024
|
0.12%
|
$774
|
$196
|
$578
|
<0.01%
|
|
|
Q3:
2005
|
175,981,624
|
382,862
|
133,080
|
515,942
|
0.29%
|
245,385
|
0.14%
|
1,722
|
220
|
1,502
|
<0.01%
|
||
|
Q4:
2005
|
176,850,951
|
354,610
|
139,129
|
493,739
|
0.28%
|
311,733
|
0.18%
|
924
|
0
|
924
|
<0.01%
|
||
|
2005
|
176,850,951
|
354,610
|
139,129
|
493,739
|
0.28%
|
311,733
|
0.18%
|
4,643
|
416
|
4,227
|
<0.01%
|
||
|
Q1:
2006
|
186,406,230
|
373,781
|
126,376
|
500,157
|
0.27%
|
418,675
|
0.22%
|
2,577
|
0
|
2,577
|
<0.01%
|
||
|
Q2:
2006
|
217,609,864
|
425,578
|
126,264
|
551,842
|
0.25%
|
394,268
|
0.18%
|
1,041
|
0
|
1,041
|
<0.01%
|
||
|
Q3:
2006
|
225,408,940
|
384,397
|
215,285
|
599,682
|
0.27%
|
596,815
|
0.26%
|
2,159
|
155
|
2,004
|
<0.01%
|
||
|
Q4:
2006
|
209,966,836
|
372,246
|
302,072
|
674,318
|
0.32%
|
777,675
|
0.37%
|
4,347
|
196
|
4,151
|
<0.01%
|
||
|
2006
|
209,966,836
|
372,246
|
302,072
|
674,318
|
0.32%
|
777,675
|
0.37%
|
10,124
|
351
|
9,773
|
<0.01%
|
||
|
Q1:
2007
|
236,497,067
|
392,763
|
355,855
|
748,618
|
0.32%
|
1,007,051
|
0.43%
|
4,130
|
325
|
3,805
|
<0.01%
|
||
|
Q2:
2007
|
$219,716,787
|
$453,076
|
$356,374
|
$809,450
|
0.37%
|
$1,376,289
|
0.63%
|
$6,119
|
$471
|
$5,648
|
0.01%
|
||
| (1) The credit reserve on residential real estate loans is only available to absorb losses on our residential real estate loans. Internally-designated credit reserves and external credit enhancement are only available to absorb losses on our residential CES. | |||||||||||||
|
The
Redwood
Review
2nd
Quarter
|
Appendix
Table
11A -
Managed Residential Loans Credit Performance
|
94
|
|
|
Managed
Loans (1)
|
Internally-Designated
Credit Reserve
|
Total
Credit Reserve as % of Loans
|
Seriously
Delinquent Loans
|
Seriously
Delinquent Loan % of Current Balance
|
Redwood's
Share of Losses
|
Total
Credit Losses As % of Loans (Annualized)
|
||
|
|
|
|
|
|
|
|
|
||
|
Total
Managed
|
Q2:
2005
|
$130,690,357
|
$426,834
|
0.33%
|
$194,431
|
0.15%
|
$544
|
0.00%
|
|
|
Residential
Loans and
|
Q3:
2005
|
125,971,360
|
404,191
|
0.32%
|
230,263
|
0.18%
|
1,592
|
0.00%
|
|
|
Non-Rated
Securities
|
Q4:
2005
|
129,833,862
|
377,259
|
0.29%
|
318,112
|
0.25%
|
1,175
|
0.00%
|
|
|
|
2005
|
129,833,862
|
377,259
|
0.29%
|
318,112
|
0.25%
|
3,465
|
0.00%
|
|
|
|
Q1:
2006
|
150,039,853
|
433,658
|
0.29%
|
432,120
|
0.29%
|
3,002
|
0.00%
|
|
|
|
Q2:
2006
|
159,800,662
|
444,323
|
0.28%
|
402,617
|
0.25%
|
1,464
|
0.00%
|
|
|
|
Q3:
2006
|
141,357,008
|
402,655
|
0.28%
|
463,911
|
0.33%
|
2,593
|
0.00%
|
|
|
|
Q4:
2006
|
134,696,897
|
392,366
|
0.29%
|
540,695
|
0.40%
|
4,862
|
0.00%
|
|
|
|
2006
|
134,696,897
|
392,366
|
0.29%
|
540,695
|
0.40%
|
11,921
|
0.01%
|
|
|
|
Q1:
2007
|
114,624,260
|
412,717
|
0.36%
|
672,234
|
0.59%
|
5,451
|
0.02%
|
|
|
|
Q2:
2007
|
$115,584,033
|
$460,152
|
0.40%
|
$816,092
|
0.71%
|
$11,687
|
0.04%
|
|
|
|
|
|
|
|
|
|
|
||
|
Residential
Alt-A Non-Rated
|
Q2:
2005
|
$15,865,802
|
$67,319
|
0.42%
|
$28,293
|
0.18%
|
$225
|
0.01%
|
|
|
Q3:
2005
|
14,615,816
|
58,323
|
0.40%
|
34,698
|
0.24%
|
271
|
0.01%
|
||
|
Q4:
2005
|
15,778,989
|
58,241
|
0.37%
|
58,614
|
0.37%
|
53
|
0.00%
|
||
|
2005
|
15,778,989
|
58,241
|
0.37%
|
58,614
|
0.37%
|
549
|
0.00%
|
||
|
Q1:
2006
|
15,660,444
|
68,077
|
0.43%
|
86,641
|
0.55%
|
174
|
0.00%
|
||
|
Q2:
2006
|
19,960,837
|
115,170
|
0.58%
|
106,953
|
0.54%
|
225
|
0.00%
|
||
|
Q3:
2006
|
19,200,967
|
107,140
|
0.56%
|
132,968
|
0.69%
|
178
|
0.00%
|
||
|
Q4:
2006
|
18,127,353
|
115,315
|
0.64%
|
187,465
|
1.03%
|
1,311
|
0.03%
|
||
|
2006
|
18,127,353
|
115,315
|
0.64%
|
187,465
|
1.03%
|
1,887
|
0.01%
|
||
|
Q1:
2007
|
18,577,577
|
128,772
|
0.69%
|
278,021
|
1.50%
|
1,331
|
0.03%
|
||
|
Q2:
2007
|
$19,580,134
|
$150,801
|
0.77%
|
$376,151
|
1.92%
|
$2,408
|
0.05%
|
||
|
|
|
|
|
|
|
|
|
||
|
Residential
Prime Non-Rated
|
Q2:
2005
|
$95,381,168
|
$336,556
|
0.35%
|
$149,624
|
0.16%
|
$353
|
<0.01%
|
|
|
Q3:
2005
|
94,968,711
|
323,839
|
0.34%
|
172,609
|
0.18%
|
1,231
|
0.01%
|
||
|
Q4:
2005
|
100,335,631
|
296,362
|
0.30%
|
222,162
|
0.22%
|
871
|
0.00%
|
||
|
2005
|
100,335,631
|
296,362
|
0.30%
|
222,162
|
0.22%
|
2,455
|
0.00%
|
||
|
Q1:
2006
|
122,532,955
|
343,209
|
0.28%
|
296,802
|
0.24%
|
2,403
|
0.01%
|
||
|
Q2:
2006
|
129,521,184
|
309,703
|
0.24%
|
248,502
|
0.19%
|
816
|
<0.01%
|
||
|
Q3:
2006
|
112,437,056
|
276,189
|
0.25%
|
269,496
|
0.24%
|
1,826
|
0.01%
|
||
|
Q4:
2006
|
107,357,542
|
256,932
|
0.24%
|
288,159
|
0.27%
|
2,840
|
0.01%
|
||
|
2006
|
107,357,542
|
256,932
|
0.24%
|
288,159
|
0.27%
|
7,886
|
0.01%
|
||
|
Q1:
2007
|
87,463,719
|
263,991
|
0.30%
|
325,581
|
0.37%
|
2,474
|
0.01%
|
||
|
Q2:
2007
|
$87,747,140
|
$292,935
|
0.33%
|
$384,267
|
0.44%
|
$3,241
|
0.01%
|
||
|
|
|
|
|
|
|
|
|
||
|
Residential
Real
|
Q2:
2005
|
$19,443,387
|
$22,959
|
0.12%
|
$16,514
|
0.08%
|
($34)
|
0.00%
|
|
|
Estate
Loans
|
Q3:
2005
|
16,386,833
|
22,029
|
0.13%
|
22,956
|
0.14%
|
90
|
<0.01%
|
|
|
Q4:
2005
|
13,719,242
|
22,656
|
0.17%
|
37,335
|
0.27%
|
251
|
<0.01%
|
||
|
2005
|
13,719,242
|
22,656
|
0.17%
|
37,335
|
0.27%
|
461
|
<0.01%
|
||
|
Q1:
2006
|
11,846,454
|
22,372
|
0.19%
|
48,677
|
0.41%
|
425
|
<0.01%
|
||
|
Q2:
2006
|
10,318,641
|
19,450
|
0.19%
|
47,162
|
0.46%
|
423
|
0.02%
|
||
|
Q3:
2006
|
9,718,985
|
19,326
|
0.20%
|
61,447
|
0.63%
|
589
|
0.02%
|
||
|
Q4:
2006
|
9,212,002
|
20,119
|
0.22%
|
65,071
|
0.71%
|
711
|
0.03%
|
||
|
2006
|
9,212,002
|
20,119
|
0.22%
|
65,071
|
0.71%
|
2,148
|
0.02%
|
||
|
Q1:
2007
|
8,582,964
|
19,954
|
0.23%
|
68,632
|
0.80%
|
1,646
|
0.08%
|
||
|
Q2:
2007
|
$8,256,759
|
$16,416
|
0.20%
|
$55,674
|
0.67%
|
$6,038
|
0.29%
|
||
|
|
|||||||||
| (1) The credit reserve on residential real estate loans is only available to absorb losses on our residential real estate loan portfolio. The managed loans amount for residential CES prime and alt-a portfolios represents the loan balances for the securities where Redwood is first in line to absorb losses. The internally-designated credit reserve is established to protect Redwood against losses suffered from these underlying loan balances. | |||||||||
|
The
Redwood
Review
2nd
Quarter
|
Appendix
Table
11B -
Managed Residential Loans Credit Performance
|
95
|
|
|
Table
12A: Residential Prime CES and Underlying Loan Characteristics
($ in
thousands)
|
|
Residential
Prime CES
|
Q2:2007
|
Q1:2007
|
Q4:2006
|
Q3:2006
|
Q2:2006
|
Q1:2006
|
Q4:2005
|
Q3:2005
|
Q2:2005
|
|
Principal
value
|
$915,731
|
$899,856
|
$871,984
|
$900,358
|
$925,212
|
$849,556
|
$858,999
|
$885,264
|
$908,780
|
|
Unamortized
premium
|
(98,787)
|
(115,563)
|
(117,016)
|
(113,398)
|
(105,707)
|
(52,906)
|
(105,078)
|
(76,264)
|
(80,172)
|
|
Credit
protection
|
(292,934)
|
(263,991)
|
(256,932)
|
(276,189)
|
(309,703)
|
(343,209)
|
(296,362)
|
(323,839)
|
(336,556)
|
|
Unrealized
market value
|
45,779
|
50,847
|
57,333
|
57,459
|
51,733
|
43,276
|
55,293
|
74,925
|
93,954
|
|
Market
value
(book value)
|
$569,789
|
$571,149
|
$555,369
|
$568,230
|
$561,535
|
$496,717
|
$512,852
|
$560,086
|
$586,006
|
|
Market
value /
principal value
|
$62.22
|
$63.47
|
$63.69
|
$63.11
|
$60.69
|
$58.47
|
$59.70
|
$63.27
|
$64.48
|
|
|
|
|
|
|
|
|
|
|
|
|
Current
Rating
|
|
|
|
|
|
|
|
|
|
|
BB
|
$317,589
|
$315,865
|
$307,713
|
$314,279
|
$286,321
|
$255,488
|
$271,389
|
$270,770
|
$259,922
|
|
B
|
131,015
|
131,224
|
118,836
|
119,458
|
133,410
|
108,574
|
107,091
|
156,951
|
194,911
|
|
Non
Rated
|
121,185
|
124,060
|
128,820
|
134,493
|
141,804
|
132,655
|
134,372
|
132,365
|
131,173
|
|
Total
market
value
|
$569,789
|
$571,149
|
$555,369
|
$568,230
|
$561,535
|
$496,717
|
$512,852
|
$560,087
|
$586,006
|
|
|
|
|
|
|
|
|
|
|
|
|
Security
Type
|
|
|
|
|
|
|
|
|
|
|
Option
ARM
|
$238,728
|
$235,959
|
$226,014
|
$227,349
|
$202,377
|
$188,202
|
$197,411
|
$178,816
|
$156,537
|
|
ARM
|
44,470
|
48,424
|
48,610
|
53,596
|
72,806
|
65,937
|
76,658
|
93,613
|
94,983
|
|
Hybrid
|
220,043
|
226,520
|
221,094
|
227,093
|
223,716
|
183,392
|
174,886
|
216,545
|
254,741
|
|
Fixed
|
66,548
|
60,246
|
59,651
|
60,193
|
62,636
|
59,185
|
63,896
|
71,112
|
79,745
|
|
Total
market
value
|
$569,789
|
$571,149
|
$555,369
|
$568,230
|
$561,535
|
$496,717
|
$512,852
|
$560,087
|
$586,006
|
|
|
|
|
|
|
|
|
|
|
|
|
Interest
income
|
$13,973
|
$14,443
|
$13,776
|
$16,745
|
$14,629
|
$11,619
|
$10,535
|
$11,143
|
$9,845
|
|
Discount
amortization
|
16,926
|
15,644
|
14,084
|
13,987
|
10,205
|
10,957
|
9,523
|
10,311
|
7,051
|
|
Total
interest
income
|
$30,899
|
$30,087
|
$27,860
|
$30,732
|
$24,834
|
$22,576
|
$20,058
|
$21,454
|
$16,896
|
|
|
|
|
|
|
|
|
|
|
|
|
Average
Balance
|
$510,835
|
$511,659
|
$491,576
|
$497,983
|
$466,605
|
$424,723
|
$439,171
|
$489,342
|
$447,454
|
|
|
|
|
|
|
|
|
|
|
|
|
Interest
income %
|
10.94%
|
11.29%
|
11.21%
|
13.45%
|
12.54%
|
10.94%
|
9.60%
|
9.11%
|
8.80%
|
|
Discount
amort
%
|
13.25%
|
12.23%
|
11.46%
|
11.23%
|
8.75%
|
10.32%
|
8.67%
|
8.43%
|
6.30%
|
|
Yield
|
24.19%
|
23.52%
|
22.67%
|
24.69%
|
21.29%
|
21.26%
|
18.27%
|
17.54%
|
15.10%
|
|
|
|
|
|
|
|
|
|
|
|
|
Underlying
Loan Characteristics
|
|
|
|
|
|
|
|
|
|
|
Number
of
loans
|
554,494
|
600,406
|
551,613
|
569,884
|
559,587
|
508,003
|
464,904
|
451,718
|
436,791
|
|
Total
loan
face
|
$195,757,045
|
$213,261,566
|
$186,501,498
|
$197,336,150
|
$197,813,355
|
$170,935,424
|
$161,295,244
|
$161,719,044
|
$154,885,307
|
|
Average
loan
size
|
$353
|
$355
|
$338
|
$346
|
$353
|
$336
|
$347
|
$358
|
$355
|
|
|
|
|
|
|
|
|
|
|
|
|
Southern
CA
|
24%
|
24%
|
25%
|
25%
|
25%
|
26%
|
24%
|
23%
|
23%
|
|
Northern
CA
|
21%
|
21%
|
22%
|
22%
|
22%
|
24%
|
21%
|
20%
|
20%
|
|
Florida
|
6%
|
6%
|
6%
|
6%
|
6%
|
5%
|
5%
|
5%
|
5%
|
|
New
York
|
5%
|
5%
|
5%
|
5%
|
5%
|
5%
|
5%
|
5%
|
5%
|
|
Georgia
|
2%
|
2%
|
2%
|
2%
|
2%
|
2%
|
2%
|
2%
|
2%
|
|
New
Jersey
|
3%
|
3%
|
3%
|
4%
|
4%
|
3%
|
4%
|
4%
|
4%
|
|
Texas
|
3%
|
3%
|
3%
|
3%
|
3%
|
3%
|
3%
|
3%
|
3%
|
|
Arizona
|
2%
|
2%
|
2%
|
2%
|
2%
|
2%
|
2%
|
2%
|
2%
|
|
Illinois
|
3%
|
3%
|
3%
|
3%
|
3%
|
3%
|
3%
|
3%
|
3%
|
|
Colorado
|
2%
|
2%
|
2%
|
2%
|
2%
|
2%
|
2%
|
3%
|
3%
|
|
Virginia
|
4%
|
4%
|
4%
|
4%
|
4%
|
4%
|
4%
|
4%
|
4%
|
|
Other
states
|
25%
|
25%
|
23%
|
22%
|
22%
|
21%
|
25%
|
26%
|
26%
|
|
The
Redwood
Review
2nd
Quarter
|
Appendix
Table
12A -
Residential CES Prime and Underlying Loan Characteristics
|
96
|
|
|
Table
12A: Residential Prime CES and Underlying Loan Characteristics
($ in
thousands)
|
|
|
|||||||||
|
|
Q2:2007
|
Q1:2007
|
Q4:2006
|
Q3:2006
|
Q2:2006
|
Q1:2006
|
Q4:2005
|
Q3:2005
|
Q2:2005
|
|
Year
2007
origination
|
4%
|
2%
|
0%
|
0%
|
0%
|
0%
|
0%
|
0%
|
0%
|
|
Year
2006
origination
|
20%
|
20%
|
11%
|
14%
|
11%
|
1%
|
0%
|
0%
|
0%
|
|
Year
2005
origination
|
27%
|
28%
|
28%
|
27%
|
29%
|
32%
|
23%
|
16%
|
7%
|
|
Year
2004
origination and earlier
|
48%
|
50%
|
61%
|
59%
|
60%
|
67%
|
77%
|
84%
|
93%
|
|
|
|
|
|
|
|
|
|
|
|
|
Wtd
Avg
Original LTV
|
68%
|
68%
|
68%
|
68%
|
68%
|
68%
|
67%
|
67%
|
67%
|
|
Original
LTV:
0 - 50
|
13%
|
13%
|
14%
|
13%
|
13%
|
14%
|
14%
|
14%
|
14%
|
|
Original
LTV:
50.01 - 60
|
12%
|
12%
|
12%
|
12%
|
12%
|
12%
|
13%
|
13%
|
12%
|
|
Original
LTV:
60.01 - 70
|
22%
|
22%
|
22%
|
22%
|
22%
|
22%
|
23%
|
23%
|
23%
|
|
Original
LTV:
70.01 - 80
|
50%
|
50%
|
49%
|
50%
|
50%
|
49%
|
47%
|
47%
|
48%
|
|
Original
LTV:
80.01 - 90
|
2%
|
2%
|
2%
|
2%
|
2%
|
2%
|
2%
|
2%
|
2%
|
|
Original
LTV:
90.01 - 100
|
1%
|
1%
|
1%
|
1%
|
1%
|
1%
|
1%
|
1%
|
1%
|
|
Unknown
|
0%
|
0%
|
0%
|
0%
|
0%
|
0%
|
0%
|
0%
|
0%
|
|
|
|
|
|
|
|
|
|
|
|
|
Wtd
Avg
FICO
|
737
|
737
|
735
|
734
|
734
|
734
|
729
|
729
|
727
|
|
FICO:
<=
600
|
1%
|
1%
|
1%
|
1%
|
1%
|
1%
|
0%
|
0%
|
0%
|
|
FICO:
601 -
620
|
1%
|
1%
|
1%
|
1%
|
1%
|
1%
|
1%
|
0%
|
0%
|
|
FICO:
621 -
640
|
2%
|
2%
|
2%
|
2%
|
2%
|
2%
|
2%
|
2%
|
2%
|
|
FICO:
641 -
660
|
3%
|
3%
|
3%
|
3%
|
3%
|
3%
|
4%
|
4%
|
4%
|
|
FICO:
661 -
680
|
6%
|
6%
|
6%
|
7%
|
6%
|
6%
|
7%
|
7%
|
7%
|
|
FICO:
681 -
700
|
10%
|
10%
|
10%
|
10%
|
10%
|
11%
|
11%
|
11%
|
11%
|
|
FICO:
701 -
720
|
13%
|
12%
|
12%
|
13%
|
13%
|
12%
|
12%
|
13%
|
13%
|
|
FICO:
721 -
740
|
14%
|
14%
|
13%
|
13%
|
13%
|
13%
|
14%
|
14%
|
14%
|
|
FICO:
741 -
760
|
15%
|
15%
|
15%
|
15%
|
15%
|
15%
|
15%
|
15%
|
15%
|
|
FICO:
761 -
780
|
18%
|
18%
|
18%
|
17%
|
17%
|
17%
|
17%
|
18%
|
18%
|
|
FICO:
781 -
800
|
14%
|
14%
|
14%
|
13%
|
13%
|
13%
|
13%
|
12%
|
12%
|
|
FICO:
>=
801
|
5%
|
4%
|
4%
|
4%
|
4%
|
4%
|
3%
|
3%
|
3%
|
|
Unknown
|
1%
|
0%
|
1%
|
1%
|
2%
|
2%
|
1%
|
1%
|
1%
|
|
|
|
|
|
|
|
|
|
|
|
|
Conforming
at
Origination %
|
31%
|
31%
|
34%
|
34%
|
33%
|
35%
|
25%
|
23%
|
23%
|
|
>
$1
MM
%
|
9%
|
9%
|
8%
|
9%
|
9%
|
7%
|
7%
|
6%
|
6%
|
|
|
|
|
|
|
|
|
|
|
|
|
2nd
Home
%
|
7%
|
7%
|
6%
|
6%
|
6%
|
6%
|
6%
|
6%
|
5%
|
|
Investment
Home %
|
2%
|
2%
|
2%
|
2%
|
2%
|
2%
|
2%
|
2%
|
2%
|
|
|
|
|
|
|
|
|
|
|
|
|
Purchase
|
42%
|
42%
|
39%
|
39%
|
39%
|
38%
|
36%
|
36%
|
35%
|
|
Cash
Out
Refi
|
27%
|
27%
|
27%
|
29%
|
30%
|
28%
|
27%
|
26%
|
25%
|
|
Rate-Term
Refi
|
30%
|
30%
|
33%
|
31%
|
31%
|
33%
|
36%
|
37%
|
39%
|
|
Construction
|
0%
|
0%
|
0%
|
0%
|
0%
|
0%
|
0%
|
0%
|
0%
|
|
Other
|
1%
|
1%
|
1%
|
1%
|
0%
|
1%
|
1%
|
1%
|
1%
|
|
|
|
|
|
|
|
|
|
|
|
|
Full
Doc
|
45%
|
45%
|
46%
|
44%
|
44%
|
47%
|
47%
|
53%
|
52%
|
|
No
Doc
|
6%
|
6%
|
7%
|
6%
|
5%
|
5%
|
4%
|
5%
|
5%
|
|
Other
Doc
(Lim, Red, Stated, etc)
|
49%
|
49%
|
47%
|
50%
|
51%
|
48%
|
49%
|
42%
|
43%
|
|
|
|
|
|
|
|
|
|
|
|
|
2-4
Family
|
2%
|
2%
|
2%
|
2%
|
2%
|
2%
|
2%
|
2%
|
2%
|
|
Condo
|
9%
|
9%
|
8%
|
8%
|
8%
|
8%
|
4%
|
3%
|
3%
|
|
Single
Family
|
88%
|
88%
|
89%
|
89%
|
89%
|
89%
|
55%
|
56%
|
53%
|
|
Other
|
1%
|
1%
|
1%
|
1%
|
1%
|
1%
|
39%
|
39%
|
42%
|
|
The
Redwood
Review
2nd
Quarter
|
Appendix
Table
12A -
Residential CES Prime and Underlying Loan Characteristics
|
97
|
|
|
Table
12B: Residential Alt-A CES and Underlying Loan Characteristics
($ in
thousands)
|
|
|
|||||||||
|
Residential
CES Alt A
|
Q2:2007
|
Q1:2007
|
Q4:2006
|
Q3:2006
|
Q2:2006
|
Q1:2006
|
Q4:2005
|
Q3:2005
|
Q2:2005
|
|
Principal
value
|
$365,837
|
$348,371
|
$298,780
|
$272,957
|
$243,391
|
$184,513
|
$154,794
|
$144,521
|
$170,543
|
|
Unamortized
premium
|
(30,054)
|
(41,680)
|
(26,440)
|
(26,849)
|
(11,700)
|
(17,960)
|
(16,752)
|
(8,520)
|
(10,849)
|
|
Credit
protection
|
(150,801)
|
(128,772)
|
(115,315)
|
(107,140)
|
(115,170)
|
(68,077)
|
(58,241)
|
(58,323)
|
(67,319)
|
|
Unrealized
market value
|
(12,626)
|
(5,932)
|
(166)
|
52
|
(879)
|
246
|
(99)
|
5,942
|
5,427
|
|
Market
value
(book value)
|
$172,356
|
$171,987
|
$156,859
|
$139,020
|
$115,642
|
$98,722
|
$79,702
|
$83,620
|
$97,802
|
|
Market
value /
principal value
|
$47.11
|
$49.37
|
$52.50
|
$50.93
|
$47.51
|
$53.50
|
$51.49
|
$57.86
|
$57.35
|
|
|
|
|
|
|
|
|
|
|
|
|
Current
Rating
|
|
|
|
|
|
|
|
|
|
|
BB
|
$103,717
|
$100,895
|
$94,239
|
$85,874
|
$62,063
|
$63,244
|
$51,175
|
$55,065
|
$50,983
|
|
B
|
33,911
|
30,989
|
22,861
|
19,722
|
22,122
|
13,377
|
7,969
|
8,451
|
27,370
|
|
Non
Rated
|
34,728
|
40,103
|
39,759
|
33,424
|
31,457
|
22,101
|
20,558
|
20,104
|
19,449
|
|
Total
market
value
|
$172,356
|
$171,987
|
$156,859
|
$139,020
|
$115,642
|
$98,722
|
$79,702
|
$83,620
|
$97,802
|
|
|
|
|
|
|
|
|
|
|
|
|
Security
Type
|
|
|
|
|
|
|
|
|
|
|
Option
ARM
|
$162,924
|
$158,116
|
$133,411
|
$117,908
|
$92,209
|
$76,868
|
$60,635
|
$59,978
|
$53,459
|
|
ARM
|
720
|
837
|
990
|
4,483
|
7,318
|
6,457
|
2,671
|
6,823
|
23,549
|
|
Hybrid
|
6,664
|
10,701
|
21,835
|
16,012
|
15,589
|
14,867
|
15,741
|
16,000
|
18,871
|
|
Fixed
|
2,048
|
2,333
|
623
|
616
|
526
|
529
|
654
|
819
|
1,922
|
|
Total
market
value
|
$172,356
|
$171,987
|
$156,859
|
$139,019
|
$115,642
|
$98,721
|
$79,701
|
$83,620
|
$97,801
|
|
|
|
|
|
|
|
|
|
|
|
|
Interest
income
|
$5,632
|
$4,143
|
$4,312
|
$1,872
|
$1,746
|
$2,235
|
$1,926
|
$1,732
|
$1,508
|
|
Discount
amortization
|
4,013
|
3,197
|
3,307
|
1,915
|
1,479
|
1,434
|
575
|
455
|
373
|
|
Total
interest
income
|
$9,645
|
$7,340
|
$7,619
|
$3,787
|
$3,225
|
$3,669
|
$2,501
|
$2,187
|
$1,881
|
|
|
|
|
|
|
|
|
|
|
|
|
Average
Balance
|
$176,130
|
$151,740
|
$154,988
|
$135,489
|
$106,648
|
$92,239
|
$70,315
|
$78,347
|
$84,002
|
|
|
|
|
|
|
|
|
|
|
|
|
Interest
income %
|
12.79%
|
10.92%
|
11.13%
|
5.53%
|
6.55%
|
9.69%
|
10.96%
|
8.84%
|
7.18%
|
|
Discount
amort
%
|
9.11%
|
8.43%
|
8.53%
|
5.65%
|
5.55%
|
6.22%
|
3.27%
|
2.32%
|
1.78%
|
|
Yield
|
21.90%
|
19.35%
|
19.66%
|
11.18%
|
12.10%
|
15.91%
|
14.23%
|
11.17%
|
8.96%
|
|
|
|
|
|
|
|
|
|
|
|
|
Underlying
Loan Characteristics
|
|
|
|
|
|
|
|
|
|
|
Number
of
loans
|
59,767
|
58,960
|
54,599
|
67,132
|
60,471
|
50,168
|
49,596
|
46,682
|
58,163
|
|
Total
loan
face
|
$20,523,349
|
$19,620,740
|
$18,026,078
|
$22,126,922
|
$19,796,509
|
$15,470,805
|
$15,555,706
|
$14,262,580
|
$17,962,707
|
|
Average
loan
size
|
$343
|
$333
|
$330
|
$330
|
$327
|
$308
|
$314
|
$306
|
$309
|
|
|
|
|
|
|
|
|
|
|
|
|
Southern
CA
|
31%
|
31%
|
32%
|
31%
|
34%
|
35%
|
35%
|
35%
|
36%
|
|
Northern
CA
|
21%
|
21%
|
22%
|
22%
|
23%
|
24%
|
22%
|
21%
|
21%
|
|
Florida
|
10%
|
10%
|
10%
|
9%
|
9%
|
8%
|
8%
|
7%
|
7%
|
|
New
York
|
2%
|
2%
|
2%
|
2%
|
1%
|
1%
|
1%
|
1%
|
1%
|
|
Georgia
|
1%
|
1%
|
1%
|
1%
|
1%
|
1%
|
1%
|
1%
|
1%
|
|
New
Jersey
|
3%
|
3%
|
3%
|
3%
|
2%
|
2%
|
2%
|
3%
|
2%
|
|
Texas
|
1%
|
1%
|
1%
|
1%
|
1%
|
1%
|
1%
|
1%
|
1%
|
|
Arizona
|
4%
|
4%
|
4%
|
4%
|
3%
|
3%
|
2%
|
2%
|
2%
|
|
Illinois
|
1%
|
1%
|
1%
|
1%
|
1%
|
1%
|
2%
|
2%
|
2%
|
|
Colorado
|
3%
|
3%
|
3%
|
3%
|
3%
|
3%
|
3%
|
4%
|
3%
|
|
Virginia
|
3%
|
3%
|
3%
|
3%
|
3%
|
2%
|
2%
|
2%
|
2%
|
|
Other
states
|
20%
|
20%
|
18%
|
20%
|
19%
|
19%
|
21%
|
21%
|
22%
|
|
|
|
|
|
|
|
|
|
|
|
|
The
Redwood
Review
2nd
Quarter
|
Appendix
Table
12B -
Residential CES Alt-A and Underlying Loan Characteristics
|
98
|
|
|
Table
12B: Residential Alt-A CES and Underlying Loan Characteristics
( $ in
thousands)
|
|
|
|||||||||
|
|
Q2:2007
|
Q1:2007
|
Q4:2006
|
Q3:2006
|
Q2:2006
|
Q1:2006
|
Q4:2005
|
Q3:2005
|
Q2:2005
|
|
Year
2007
origination
|
14%
|
4%
|
0%
|
0%
|
0%
|
0%
|
0%
|
0%
|
0%
|
|
Year
2006
origination
|
23%
|
25%
|
21%
|
19%
|
9%
|
1%
|
0%
|
0%
|
0%
|
|
Year
2005
origination
|
33%
|
39%
|
38%
|
41%
|
45%
|
39%
|
35%
|
21%
|
19%
|
|
Year
2004
origination and earlier
|
30%
|
32%
|
41%
|
40%
|
46%
|
60%
|
65%
|
79%
|
81%
|
|
|
|
|
|
|
|
|
|
|
|
|
Wtd
Avg
Original LTV
|
75%
|
75%
|
75%
|
75%
|
75%
|
74%
|
75%
|
75%
|
74%
|
|
Original
LTV:
0 - 50
|
4%
|
4%
|
4%
|
4%
|
4%
|
5%
|
4%
|
5%
|
5%
|
|
Original
LTV:
50.01 - 60
|
6%
|
6%
|
6%
|
6%
|
6%
|
7%
|
6%
|
6%
|
7%
|
|
Original
LTV:
60.01 - 70
|
15%
|
15%
|
16%
|
16%
|
16%
|
16%
|
15%
|
16%
|
16%
|
|
Original
LTV:
70.01 - 80
|
61%
|
61%
|
61%
|
58%
|
59%
|
59%
|
62%
|
60%
|
62%
|
|
Original
LTV:
80.01 - 90
|
10%
|
10%
|
9%
|
11%
|
10%
|
9%
|
8%
|
8%
|
7%
|
|
Original
LTV:
90.01 - 100
|
4%
|
4%
|
4%
|
5%
|
5%
|
4%
|
5%
|
5%
|
3%
|
|
Unknown
|
0%
|
0%
|
0%
|
0%
|
0%
|
0%
|
0%
|
0%
|
0%
|
|
|
|
|
|
|
|
|
|
|
|
|
Wtd
Avg
FICO
|
707
|
708
|
708
|
708
|
708
|
710
|
706
|
708
|
707
|
|
FICO:
<=
600
|
1%
|
2%
|
1%
|
3%
|
2%
|
2%
|
0%
|
0%
|
0%
|
|
FICO:
601 -
620
|
1%
|
1%
|
1%
|
1%
|
1%
|
1%
|
1%
|
0%
|
0%
|
|
FICO:
621 -
640
|
5%
|
5%
|
5%
|
5%
|
5%
|
5%
|
5%
|
5%
|
5%
|
|
FICO:
641 -
660
|
9%
|
9%
|
8%
|
8%
|
8%
|
8%
|
8%
|
8%
|
8%
|
|
FICO:
661 -
680
|
14%
|
14%
|
14%
|
13%
|
13%
|
12%
|
13%
|
12%
|
12%
|
|
FICO:
681 -
700
|
15%
|
15%
|
15%
|
15%
|
15%
|
13%
|
15%
|
15%
|
15%
|
|
FICO:
701 -
720
|
14%
|
13%
|
13%
|
13%
|
13%
|
12%
|
14%
|
15%
|
15%
|
|
FICO:
721 -
740
|
11%
|
11%
|
11%
|
11%
|
11%
|
11%
|
12%
|
13%
|
13%
|
|
FICO:
741 -
760
|
9%
|
9%
|
10%
|
10%
|
10%
|
9%
|
11%
|
11%
|
11%
|
|
FICO:
761 -
780
|
8%
|
8%
|
8%
|
8%
|
8%
|
8%
|
9%
|
10%
|
10%
|
|
FICO:
781 -
800
|
4%
|
5%
|
5%
|
5%
|
5%
|
5%
|
5%
|
5%
|
5%
|
|
FICO:
>=
801
|
1%
|
1%
|
1%
|
1%
|
1%
|
1%
|
1%
|
1%
|
1%
|
|
Unknown
|
7%
|
7%
|
8%
|
7%
|
8%
|
13%
|
6%
|
5%
|
5%
|
|
|
|
|
|
|
|
|
|
|
|
|
Conforming
at
Origination %
|
47%
|
49%
|
52%
|
53%
|
53%
|
56%
|
46%
|
49%
|
48%
|
|
>
$1
MM
%
|
12%
|
10%
|
9%
|
8%
|
7%
|
7%
|
6%
|
6%
|
6%
|
|
|
|
|
|
|
|
|
|
|
|
|
2nd
Home
%
|
6%
|
6%
|
6%
|
5%
|
5%
|
5%
|
5%
|
5%
|
5%
|
|
Investment
Home %
|
11%
|
11%
|
12%
|
11%
|
11%
|
11%
|
11%
|
10%
|
10%
|
|
|
|
|
|
|
|
|
|
|
|
|
Purchase
|
35%
|
37%
|
41%
|
42%
|
40%
|
41%
|
45%
|
47%
|
48%
|
|
Cash
Out
Refi
|
43%
|
41%
|
39%
|
38%
|
40%
|
38%
|
37%
|
34%
|
34%
|
|
Rate-Term
Refi
|
22%
|
22%
|
19%
|
21%
|
20%
|
21%
|
18%
|
19%
|
18%
|
|
Construction
|
0%
|
0%
|
0%
|
0%
|
0%
|
0%
|
0%
|
0%
|
0%
|
|
Other
|
0%
|
0%
|
0%
|
0%
|
0%
|
0%
|
0%
|
0%
|
0%
|
|
|
|
|
|
|
|
|
|
|
|
|
Full
Doc
|
17%
|
18%
|
23%
|
24%
|
22%
|
22%
|
19%
|
19%
|
19%
|
|
No
Doc
|
1%
|
1%
|
1%
|
1%
|
1%
|
1%
|
0%
|
0%
|
0%
|
|
Other
Doc
(Lim, Red, Stated, etc)
|
74%
|
71%
|
67%
|
64%
|
67%
|
62%
|
81%
|
81%
|
81%
|
|
Unknown/Not
Categorized
|
8%
|
10%
|
9%
|
11%
|
10%
|
15%
|
0%
|
0%
|
0%
|
|
|
|
|
|
|
|
|
|
|
|
|
2-4
Family
|
4%
|
4%
|
4%
|
4%
|
4%
|
4%
|
4%
|
3%
|
3%
|
|
Condo
|
11%
|
11%
|
11%
|
11%
|
11%
|
11%
|
1%
|
1%
|
1%
|
|
Single
Family
|
85%
|
85%
|
85%
|
85%
|
85%
|
85%
|
6%
|
6%
|
4%
|
|
Other
|
0%
|
0%
|
0%
|
0%
|
0%
|
0%
|
89%
|
90%
|
92%
|
|
The
Redwood
Review
2nd
Quarter
|
Appendix
Table
12B -
Residential CES Alt-A and Underlying Loan
Characteristics
|
99
|
|
|
Table
12C: Residential Subprime CES and Underlying Loan Characteristics
($ in
thousands)
|
|
|
|||||||||
|
Residential
CES Subprime
|
Q2:2007
|
Q1:2007
|
Q4:2006
|
Q3:2006
|
Q2:2006
|
Q1:2006
|
Q4:2005
|
Q3:2005
|
Q2:2005
|
|
Principal
value
|
$9,625
|
11,219
|
9,841
|
$9,841
|
-
|
-
|
-
|
-
|
-
|
|
Unamortized
premium
|
2,893
|
(1,426)
|
(1,387)
|
(1,407)
|
-
|
-
|
-
|
-
|
-
|
|
Credit
protection
|
(9,341)
|
0
|
0
|
-
|
-
|
-
|
-
|
-
|
-
|
|
Unrealized
market value
|
(347)
|
(652)
|
849
|
(15)
|
-
|
-
|
-
|
-
|
-
|
|
Market
value
(book value)
|
$2,830
|
9,141
|
9,303
|
$8,419
|
-
|
-
|
-
|
-
|
-
|
|
Market
value /
principal value
|
$29.40
|
$81.48
|
$94.53
|
$85.55
|
-
|
-
|
-
|
-
|
-
|
|
|
|
|
|
|
|
|
|
|
|
|
Current
Rating
|
|
|
|
|
|
|
|
|
|
|
BB
|
$2,830
|
$9,141
|
$6,678
|
$5,919
|
-
|
-
|
-
|
-
|
-
|
|
B
|
-
|
-
|
-
|
-
|
-
|
-
|
-
|
-
|
-
|
|
Non
Rated
|
-
|
-
|
2,625
|
2,500
|
-
|
-
|
-
|
-
|
-
|
|
Total
market
value
|
$2,830
|
$9,141
|
$9,303
|
$8,419
|
-
|
-
|
-
|
-
|
-
|
|
|
|
|
|
|
|
|
|
|
|
|
Security
Type
|
|
|
|
|
|
|
|
|
|
|
Option
ARM
|
$0
|
$0
|
$0
|
$0
|
-
|
-
|
-
|
-
|
-
|
|
ARM
|
-
|
-
|
-
|
-
|
-
|
-
|
-
|
-
|
-
|
|
Hybrid
|
400
|
1,013
|
4,127
|
4,064
|
-
|
-
|
-
|
-
|
-
|
|
Fixed
|
2,430
|
8,128
|
5,176
|
4,355
|
-
|
-
|
-
|
-
|
-
|
|
Total
market
value
|
$2,830
|
$9,141
|
$9,303
|
$8,419
|
-
|
-
|
-
|
-
|
-
|
|
|
|
|
|
|
|
|
|
|
|
|
Interest
income
|
$215
|
$186
|
$151
|
$51
|
-
|
-
|
-
|
-
|
-
|
|
Discount
amortization
|
126
|
51
|
22
|
15
|
-
|
-
|
-
|
-
|
-
|
|
Total
interest
income
|
$341
|
$237
|
$173
|
$66
|
-
|
-
|
-
|
-
|
-
|
|
|
|
|
|
|
|
|
|
|
|
|
Average
Balance
|
$8,744
|
$9,715
|
$8,344
|
$8,223
|
-
|
-
|
-
|
-
|
-
|
|
|
|
|
|
|
|
|
|
|
|
|
Interest
income %
|
9.84%
|
7.66%
|
7.24%
|
2.48%
|
-
|
-
|
-
|
-
|
-
|
|
Discount
amort
%
|
5.76%
|
2.10%
|
1.05%
|
0.73%
|
-
|
-
|
-
|
-
|
-
|
|
Yield
|
15.60%
|
9.76%
|
8.29%
|
3.21%
|
-
|
-
|
-
|
-
|
-
|
|
|
|
|
|
|
|
|
|
|
|
|
Underlying
Loan Characteristics
|
|
|
|
|
|
|
|
|
|
|
Number
of
loans
|
23,662
|
25,001
|
31,873
|
34,841
|
-
|
-
|
-
|
-
|
-
|
|
Total
loan
face
|
$3,436,393
|
$3,614,761
|
$5,439,260
|
$5,945,868
|
-
|
-
|
-
|
-
|
-
|
|
Average
loan
size
|
$145
|
$145
|
$171
|
$171
|
-
|
-
|
-
|
-
|
-
|
|
|
|
|
|
|
|
|
|
|
|
|
Southern
CA
|
19%
|
18%
|
19%
|
19%
|
-
|
-
|
-
|
-
|
-
|
|
Northern
CA
|
14%
|
13%
|
14%
|
14%
|
-
|
-
|
-
|
-
|
-
|
|
Florida
|
12%
|
12%
|
12%
|
12%
|
-
|
-
|
-
|
-
|
-
|
|
New
York
|
4%
|
4%
|
4%
|
4%
|
-
|
-
|
-
|
-
|
-
|
|
Georgia
|
1%
|
1%
|
1%
|
1%
|
-
|
-
|
-
|
-
|
-
|
|
New
Jersey
|
3%
|
4%
|
4%
|
4%
|
-
|
-
|
-
|
-
|
-
|
|
Texas
|
4%
|
4%
|
4%
|
4%
|
-
|
-
|
-
|
-
|
-
|
|
Arizona
|
5%
|
5%
|
4%
|
4%
|
-
|
-
|
-
|
-
|
-
|
|
Illinois
|
5%
|
6%
|
6%
|
6%
|
-
|
-
|
-
|
-
|
-
|
|
Colorado
|
2%
|
2%
|
2%
|
2%
|
-
|
-
|
-
|
-
|
-
|
|
Virginia
|
1%
|
2%
|
2%
|
2%
|
-
|
-
|
-
|
-
|
-
|
|
Other
states
|
29%
|
29%
|
28%
|
28%
|
-
|
-
|
-
|
-
|
-
|
|
|
|
|
|
|
|
|
|
|
|
|
The
Redwood
Review
2nd
Quarter
|
Appendix
Table
12B -
Residential CES Subprime and Underlying Loan
Characteristics
|
100
|
|
|
Table
12C: Residential Subprime CES and Underlying Loan Characteristics
($ in
thousands)
|
|
|
|||||||||
|
|
Q2:2007
|
Q1:2007
|
Q4:2006
|
Q3:2006
|
Q2:2006
|
Q1:
2006
|
Q4:2005
|
Q3:2005
|
Q2:2005
|
|
Year
2007
origination
|
2%
|
2%
|
0%
|
0%
|
-
|
-
|
-
|
-
|
-
|
|
Year
2006
origination
|
98%
|
98%
|
100%
|
100%
|
-
|
-
|
-
|
-
|
-
|
|
Year
2005
origination
|
0%
|
0%
|
0%
|
0%
|
-
|
-
|
-
|
-
|
-
|
|
Year
2004
origination and earlier
|
0%
|
0%
|
0%
|
0%
|
-
|
-
|
-
|
-
|
-
|
|
|
|
|
|
|
|
|
|
|
|
|
Wtd
Avg
Original LTV
|
69%
|
75%
|
73%
|
73%
|
-
|
-
|
-
|
-
|
-
|
|
Original
LTV:
0 - 50
|
20%
|
13%
|
14%
|
14%
|
-
|
-
|
-
|
-
|
-
|
|
Original
LTV:
50.01 - 60
|
3%
|
2%
|
3%
|
3%
|
-
|
-
|
-
|
-
|
-
|
|
Original
LTV:
60.01 - 70
|
6%
|
6%
|
6%
|
6%
|
-
|
-
|
-
|
-
|
-
|
|
Original
LTV:
70.01 - 80
|
44%
|
43%
|
47%
|
47%
|
-
|
-
|
-
|
-
|
-
|
|
Original
LTV:
80.01 - 90
|
22%
|
22%
|
23%
|
23%
|
-
|
-
|
-
|
-
|
-
|
|
Original
LTV:
90.01 - 100
|
6%
|
14%
|
7%
|
7%
|
-
|
-
|
-
|
-
|
-
|
|
Unknown
|
0%
|
0%
|
0%
|
0%
|
-
|
-
|
-
|
-
|
-
|
|
|
|
|
|
|
|
|
|
|
|
|
Wtd
Avg
FICO
|
640
|
642
|
636
|
636
|
-
|
-
|
-
|
-
|
-
|
|
FICO:
<=
600
|
24%
|
25%
|
25%
|
25%
|
-
|
-
|
-
|
-
|
-
|
|
FICO:
601 -
620
|
12%
|
12%
|
13%
|
13%
|
-
|
-
|
-
|
-
|
-
|
|
FICO:
621 -
640
|
17%
|
16%
|
17%
|
17%
|
-
|
-
|
-
|
-
|
-
|
|
FICO:
641 -
660
|
13%
|
12%
|
13%
|
13%
|
-
|
-
|
-
|
-
|
-
|
|
FICO:
661 -
680
|
10%
|
10%
|
10%
|
10%
|
-
|
-
|
-
|
-
|
-
|
|
FICO:
681 -
700
|
8%
|
9%
|
8%
|
8%
|
-
|
-
|
-
|
-
|
-
|
|
FICO:
701 -
720
|
6%
|
6%
|
5%
|
5%
|
-
|
-
|
-
|
-
|
-
|
|
FICO:
721 -
740
|
4%
|
4%
|
4%
|
4%
|
-
|
-
|
-
|
-
|
-
|
|
FICO:
741 -
760
|
3%
|
3%
|
2%
|
2%
|
-
|
-
|
-
|
-
|
-
|
|
FICO:
761 -
780
|
2%
|
2%
|
2%
|
2%
|
-
|
-
|
-
|
-
|
-
|
|
FICO:
781 -
800
|
1%
|
1%
|
1%
|
1%
|
-
|
-
|
-
|
-
|
-
|
|
FICO:
>=
801
|
0%
|
0%
|
0%
|
0%
|
-
|
-
|
-
|
-
|
-
|
|
Unknown
|
0%
|
0%
|
0%
|
0%
|
-
|
-
|
-
|
-
|
-
|
|
|
|
|
|
|
|
|
|
|
|
|
Conforming
at
Origination %
|
77%
|
77%
|
75%
|
75%
|
-
|
-
|
-
|
-
|
-
|
|
>
$1
MM
%
|
0%
|
0%
|
0%
|
0%
|
-
|
-
|
-
|
-
|
-
|
|
|
|
|
|
|
|
|
|
|
|
|
2nd
Home
%
|
2%
|
2%
|
1%
|
1%
|
-
|
-
|
-
|
-
|
-
|
|
Investment
Home %
|
9%
|
9%
|
8%
|
8%
|
-
|
-
|
-
|
-
|
-
|
|
|
|
|
|
|
|
|
|
|
|
|
Purchase
|
52%
|
52%
|
50%
|
50%
|
-
|
-
|
-
|
-
|
-
|
|
Cash
Out
Refi
|
44%
|
44%
|
47%
|
47%
|
-
|
-
|
-
|
-
|
-
|
|
Rate-Term
Refi
|
4%
|
4%
|
3%
|
3%
|
-
|
-
|
-
|
-
|
-
|
|
Construction
|
0%
|
0%
|
0%
|
0%
|
-
|
-
|
-
|
-
|
-
|
|
Other
|
0%
|
0%
|
0%
|
0%
|
-
|
-
|
-
|
-
|
-
|
|
|
|
|
|
|
|
|
|
|
|
|
Full
Doc
|
50%
|
49%
|
53%
|
53%
|
-
|
-
|
-
|
-
|
-
|
|
No
Doc
|
1%
|
1%
|
0%
|
0%
|
-
|
-
|
-
|
-
|
-
|
|
Other
Doc
(Lim, Red, Stated, etc)
|
49%
|
50%
|
47%
|
47%
|
-
|
-
|
-
|
-
|
-
|
|
|
|
|
|
|
|
|
|
|
|
|
2-4
Family
|
8%
|
7%
|
7%
|
7%
|
-
|
-
|
-
|
-
|
-
|
|
Condo
|
7%
|
7%
|
7%
|
7%
|
-
|
-
|
-
|
-
|
-
|
|
Single
Family
|
85%
|
86%
|
86%
|
86%
|
-
|
-
|
-
|
-
|
-
|
|
Other
|
0%
|
0%
|
0%
|
0%
|
-
|
-
|
-
|
-
|
-
|
|
The
Redwood
Review
2nd
Quarter
|
Appendix
Table
12B -
Residential CES Subprime and Underlying Loan
Characteristics
|
101
|
|
|
|||||||||
|
|
Q2:2007
|
Q1:2007
|
Q4:2006
|
Q3:2006
|
Q2:2006
|
Q1:2006
|
Q4:2005
|
Q3:2005
|
Q2:2005
|
|
|
|
|
|
|
|
|
|
|
|
|
Market
Value
|
$34,168
|
$50,057
|
-
|
-
|
-
|
-
|
-
|
-
|
-
|
|
|
|
|
|
|
|
|
|
|
|
|
Current
Rating
|
|
|
|
|
|
|
|
|
|
|
AAA
|
$1,804
|
$2,038
|
-
|
-
|
-
|
-
|
-
|
-
|
-
|
|
AA
|
-
|
-
|
-
|
-
|
-
|
-
|
-
|
-
|
-
|
|
A
|
13,958
|
18,699
|
-
|
-
|
-
|
-
|
-
|
-
|
-
|
|
BBB
|
4,437
|
5,729
|
-
|
-
|
-
|
-
|
-
|
-
|
-
|
|
BB
|
3,775
|
4,185
|
-
|
-
|
-
|
-
|
-
|
-
|
-
|
|
B
|
-
|
-
|
-
|
-
|
-
|
-
|
-
|
-
|
-
|
|
Non-rated
|
10,194
|
19,406
|
-
|
-
|
-
|
-
|
-
|
-
|
-
|
|
Total
market
value
|
$34,168
|
$50,057
|
-
|
-
|
-
|
-
|
-
|
-
|
-
|
|
|
|
|
|
|
|
|
|
|
|
|
Security
Type
|
|
|
|
|
|
|
|
|
|
|
ARM
|
$398
|
$422
|
-
|
-
|
-
|
-
|
-
|
-
|
-
|
|
Option
ARM
|
2,597
|
3,198
|
-
|
-
|
-
|
-
|
-
|
-
|
-
|
|
Hybrid
|
29,245
|
43,969
|
-
|
-
|
-
|
-
|
-
|
-
|
-
|
|
Fixed
|
1,928
|
2,468
|
-
|
-
|
-
|
-
|
-
|
-
|
-
|
|
Total
market
value
|
$34,168
|
$50,057
|
-
|
-
|
-
|
-
|
-
|
-
|
-
|
|
|
|
|
|
|
|
|
|
|
|
|
Interest
income
|
$669
|
$2,465
|
-
|
-
|
-
|
-
|
-
|
-
|
-
|
|
|
|
|
|
|
|
|
|
|
|
|
Avg
Balance
|
$44,061
|
$37,169
|
-
|
-
|
-
|
-
|
-
|
-
|
-
|
|
|
|
|
|
|
|
|
|
|
|
|
Yield
|
6.07%
|
26.53%
|
-
|
-
|
-
|
-
|
-
|
-
|
-
|
|
|
|
|
|
|
|
|
|
|
|
|
The
Redwood
Review
2nd
Quarter
|
Appendix
Table
13 -
OREI and Underlying Characteristics
|
102
|
|
|
|||||||||
|
|
Q2:2007
|
Q1:2007
|
Q4:2006
|
Q3:2006
|
Q2:2006
|
Q1:2006
|
Q4:2005
|
Q3:2005
|
Q2:2005
|
|
Residential
Loans
|
$8,256,759
|
$8,582,964
|
$9,212,002
|
$9,718,985
|
$10,318,641
|
$11,846,454
|
$13,719,242
|
$16,386,833
|
$19,443,387
|
|
Number
of
loans
|
24,452
|
25,579
|
27,695
|
31,744
|
34,013
|
37,458
|
33,863
|
51,593
|
58,941
|
|
Average
loan
size
|
$338
|
$336
|
$333
|
$306
|
$303
|
$316
|
$405
|
$318
|
$330
|
|
|
|||||||||
|
Adjustable
%
|
71%
|
79%
|
85%
|
89%
|
99%
|
99%
|
98%
|
100%
|
100%
|
|
Hybrid
%
|
29%
|
20%
|
15%
|
11%
|
1%
|
1%
|
2%
|
0%
|
0%
|
|
Fixed
%
|
0%
|
1%
|
0%
|
0%
|
0%
|
0%
|
0%
|
0%
|
0%
|
|
|
|||||||||
|
Amortizing
%
|
5%
|
4%
|
3%
|
3%
|
1%
|
1%
|
1%
|
0%
|
0%
|
|
Interest-only
%
|
95%
|
96%
|
97%
|
97%
|
99%
|
99%
|
99%
|
100%
|
100%
|
|
Negatively
amortizing %
|
0%
|
0%
|
0%
|
0%
|
0%
|
0%
|
0%
|
0%
|
0%
|
|
|
|||||||||
|
Southern
California
|
14%
|
14%
|
13%
|
12%
|
11%
|
11%
|
11%
|
11%
|
12%
|
|
Northern
California
|
11%
|
10%
|
10%
|
10%
|
10%
|
10%
|
12%
|
11%
|
12%
|
|
Florida
|
12%
|
13%
|
12%
|
12%
|
13%
|
12%
|
13%
|
12%
|
11%
|
|
New
York
|
6%
|
6%
|
6%
|
6%
|
6%
|
6%
|
5%
|
5%
|
5%
|
|
Georgia
|
4%
|
5%
|
5%
|
5%
|
5%
|
5%
|
5%
|
5%
|
5%
|
|
New
Jersey
|
4%
|
4%
|
4%
|
4%
|
4%
|
4%
|
4%
|
4%
|
4%
|
|
Texas
|
5%
|
5%
|
5%
|
5%
|
5%
|
5%
|
4%
|
4%
|
4%
|
|
Arizona
|
4%
|
4%
|
4%
|
4%
|
4%
|
4%
|
4%
|
4%
|
4%
|
|
Illinois
|
3%
|
3%
|
3%
|
3%
|
2%
|
2%
|
2%
|
3%
|
3%
|
|
Colorado
|
3%
|
3%
|
4%
|
4%
|
4%
|
4%
|
4%
|
4%
|
4%
|
|
Virginia
|
3%
|
3%
|
3%
|
3%
|
3%
|
3%
|
3%
|
3%
|
3%
|
|
Other
states
(none greater than 3%)
|
31%
|
30%
|
31%
|
32%
|
33%
|
34%
|
33%
|
34%
|
33%
|
|
|
|||||||||
|
Year
2007
origination
|
11%
|
3%
|
0%
|
0%
|
0%
|
0%
|
0%
|
0%
|
0%
|
|
Year
2006
origination
|
18%
|
19%
|
17%
|
10%
|
0%
|
0%
|
0%
|
0%
|
0%
|
|
Year
2005
origination
|
5%
|
5%
|
5%
|
5%
|
5%
|
5%
|
6%
|
5%
|
4%
|
|
Year
2004
origination or earlier
|
66%
|
73%
|
78%
|
85%
|
95%
|
95%
|
94%
|
95%
|
96%
|
|
|
|||||||||
|
Wtd
Avg
Original LTV
|
68%
|
68%
|
68%
|
68%
|
68%
|
68%
|
69%
|
68%
|
69%
|
|
Original
LTV:
0 - 50
|
15%
|
15%
|
16%
|
15%
|
15%
|
15%
|
13%
|
14%
|
13%
|
|
Original
LTV:
50 - 60
|
11%
|
12%
|
12%
|
12%
|
12%
|
12%
|
11%
|
11%
|
11%
|
|
Original
LTV:
60 - 70
|
20%
|
20%
|
20%
|
20%
|
21%
|
21%
|
21%
|
20%
|
20%
|
|
Original
LTV:
70 - 80
|
47%
|
46%
|
45%
|
46%
|
45%
|
45%
|
48%
|
46%
|
47%
|
|
Original
LTV:
80 - 90
|
2%
|
2%
|
2%
|
2%
|
2%
|
2%
|
2%
|
2%
|
2%
|
|
Original
LTV:
90 - 100
|
5%
|
5%
|
5%
|
5%
|
5%
|
5%
|
5%
|
7%
|
7%
|
|
|
|||||||||
|
Wtg
Avg FICO
|
732
|
727
|
733
|
730
|
730
|
730
|
731
|
731
|
731
|
|
FICO:
<=
600
|
1%
|
1%
|
1%
|
1%
|
1%
|
1%
|
1%
|
1%
|
1%
|
|
FICO:
601 -620
|
1%
|
1%
|
1%
|
1%
|
1%
|
1%
|
1%
|
1%
|
1%
|
|
FICO:
621 -
640
|
2%
|
2%
|
1%
|
1%
|
1%
|
2%
|
1%
|
1%
|
1%
|
|
FICO:
641 -660
|
3%
|
3%
|
3%
|
3%
|
3%
|
3%
|
3%
|
3%
|
3%
|
|
FICO:
661 -
680
|
7%
|
7%
|
8%
|
8%
|
8%
|
8%
|
8%
|
8%
|
8%
|
|
FICO:
681 -
700
|
12%
|
12%
|
12%
|
12%
|
12%
|
12%
|
12%
|
12%
|
12%
|
|
FICO:
701 -
720
|
14%
|
14%
|
14%
|
14%
|
14%
|
14%
|
15%
|
14%
|
14%
|
|
FICO:
721 -
740
|
13%
|
13%
|
13%
|
14%
|
13%
|
13%
|
13%
|
14%
|
14%
|
|
FICO:
741 -
760
|
15%
|
15%
|
15%
|
15%
|
15%
|
15%
|
15%
|
15%
|
15%
|
|
FICO:
761 -
780
|
17%
|
17%
|
17%
|
17%
|
17%
|
17%
|
17%
|
17%
|
17%
|
|
FICO:
781 -
800
|
13%
|
12%
|
12%
|
12%
|
12%
|
11%
|
11%
|
11%
|
11%
|
|
FICO:
>=
801
|
4%
|
3%
|
3%
|
2%
|
3%
|
3%
|
3%
|
3%
|
3%
|
|
|
|||||||||
|
|
|||||||||
|
Conforming
balance at origination %
|
35%
|
37%
|
38%
|
41%
|
45%
|
37%
|
38%
|
37%
|
37%
|
|
%
balance in
loans > $1mm per loan
|
15%
|
16%
|
18%
|
14%
|
14%
|
14%
|
13%
|
14%
|
13%
|
|
|
|||||||||
|
2nd
home %
|
11%
|
11%
|
11%
|
11%
|
11%
|
11%
|
10%
|
10%
|
10%
|
|
Investment
home %
|
3%
|
3%
|
3%
|
3%
|
3%
|
3%
|
2%
|
2%
|
2%
|
|
|
|||||||||
|
Purchase
|
35%
|
35%
|
34%
|
34%
|
33%
|
33%
|
33%
|
33%
|
33%
|
|
Cash
out
refinance
|
32%
|
31%
|
32%
|
32%
|
32%
|
34%
|
34%
|
34%
|
34%
|
|
Rate-term
refinance
|
31%
|
32%
|
32%
|
32%
|
34%
|
32%
|
32%
|
32%
|
32%
|
|
Construction
|
0%
|
0%
|
0%
|
0%
|
0%
|
0%
|
0%
|
0%
|
0%
|
|
Other
|
2%
|
2%
|
2%
|
2%
|
1%
|
1%
|
1%
|
1%
|
1%
|
|
The
Redwood
Review
2nd
Quarter
|
Appendix
Table
14 -
Residential Real Estate Loan Characteristics
|
103
|
|
|
Table
15: Commercial Real Estate Loans Credit Performance ($ in
thousands)
|
|
Managed
Loans
|
Internally-Designated
Credit Reserve
|
External
Credit Enhancement
|
Total
Credit Protection (1)
|
Total
Credit Protection as % of Loans
|
Seriously
Delinquent Loans
|
Seriously
Delinquent Loan % of Current Balance
|
Total
Credit Losses
|
Third
Parties' Share of Net Charge-offs/ (Recoveries)
|
Redwood's
Share of Net Charge-offs/ (Recoveries)
|
Total
Credit Losses As % of Loans (Annualized)
|
|||
|
|
|
|
|
|
|
|
|
|
|
|
|
||
|
Total
Managed
|
Q2:
2005
|
$31,324,563
|
$95,351
|
$681,133
|
$776,484
|
2.48%
|
$35,971
|
0.11%
|
$1,213
|
$1,213
|
$0
|
0.02%
|
|
|
Commercial
|
Q3:
2005
|
40,081,879
|
146,671
|
706,532
|
853,203
|
2.13%
|
20,690
|
0.05%
|
59
|
59
|
-
|
0.00%
|
|
|
Portfolio
|
Q4:
2005
|
46,825,453
|
149,947
|
714,168
|
864,115
|
1.85%
|
40,916
|
0.09%
|
-
|
-
|
-
|
0.00%
|
|
|
2005
|
46,825,453
|
149,947
|
714,168
|
864,115
|
1.85%
|
40,916
|
0.09%
|
1,587
|
1,272
|
315
|
0.00%
|
||
|
Q1:
2006
|
48,366,213
|
175,913
|
645,675
|
821,588
|
1.70%
|
38,124
|
0.08%
|
90
|
55
|
35
|
0.00%
|
||
|
Q2:
2006
|
51,635,796
|
200,275
|
653,476
|
853,751
|
1.65%
|
44,632
|
0.09%
|
1,463
|
1,463
|
-
|
0.01%
|
||
|
Q3:
2006
|
58,106,355
|
266,523
|
678,489
|
945,012
|
1.63%
|
70,586
|
0.12%
|
2,167
|
1,705
|
462
|
0.01%
|
||
|
Q4:
2006
|
57,789,159
|
303,481
|
472,669
|
776,150
|
1.34%
|
64,367
|
0.11%
|
1,156
|
1,132
|
24
|
0.01%
|
||
|
2006
|
57,789,159
|
303,481
|
472,669
|
776,150
|
1.34%
|
64,367
|
0.11%
|
4,876
|
4,355
|
521
|
0.03%
|
||
|
Q1:
2007
|
57,450,042
|
304,955
|
551,917
|
856,872
|
1.49%
|
77,726
|
0.14%
|
1,471
|
1,417
|
24
|
0.01%
|
||
|
Q2:
2007
|
$70,009,123
|
$321,234
|
$584,706
|
$905,940
|
1.29%
|
$73,104
|
0.10%
|
$76
|
$30
|
$46
|
0.00%
|
||
|
|
|
|
|
|
|
|
|
|
|
|
|
||
|
Commercial
|
Q2:
2005
|
$51,778
|
$8,141
|
$0
|
$8,141
|
15.72%
|
$0
|
0.00%
|
$0
|
$0
|
$0
|
0.00%
|
|
|
Real
Estate
|
Q3:
2005
|
66,348
|
8,141
|
-
|
8,141
|
12.27%
|
-
|
0.00%
|
-
|
-
|
-
|
0.00%
|
|
|
Loans
|
Q4:
2005
|
70,091
|
8,141
|
-
|
8,141
|
11.61%
|
-
|
0.00%
|
-
|
-
|
-
|
0.00%
|
|
|
2005
|
70,091
|
8,141
|
-
|
8,141
|
11.61%
|
-
|
0.00%
|
315
|
-
|
315
|
0.45%
|
||
|
Q1:
2006
|
65,508
|
8,141
|
-
|
8,141
|
12.43%
|
-
|
0.00%
|
35
|
-
|
35
|
0.21%
|
||
|
Q2:
2006
|
46,959
|
8,141
|
-
|
8,141
|
17.34%
|
-
|
0.00%
|
-
|
-
|
-
|
0.00%
|
||
|
Q3:
2006
|
42,384
|
8,141
|
-
|
8,141
|
19.21%
|
-
|
0.00%
|
-
|
-
|
-
|
0.00%
|
||
|
Q4:
2006
|
38,360
|
8,141
|
-
|
8,141
|
21.22%
|
-
|
0.00%
|
-
|
-
|
-
|
0.00%
|
||
|
2006
|
38,360
|
8,141
|
-
|
8,141
|
21.22%
|
-
|
0.00%
|
35
|
-
|
35
|
0.36%
|
||
|
Q1:
2007
|
38,394
|
10,489
|
-
|
10,489
|
27.32%
|
-
|
0.00%
|
-
|
-
|
-
|
0.00%
|
||
|
Q2:
2007
|
$38,311
|
$10,489
|
$0
|
$10,489
|
27.38%
|
$0
|
0.00%
|
$0
|
$0
|
$0
|
0.00%
|
||
|
|
|
|
|
|
|
|
|
|
|
|
|
||
|
Commercial
CES
|
Q2:
2005
|
$31,272,785
|
$87,210
|
$681,133
|
$768,343
|
2.46%
|
$35,971
|
0.12%
|
$1,213
|
$1,213
|
$0
|
0.02%
|
|
|
Q3:
2005
|
40,015,531
|
138,530
|
706,532
|
845,062
|
2.11%
|
20,690
|
0.05%
|
59
|
59
|
-
|
0.00%
|
||
|
Q4:
2005
|
46,755,362
|
141,806
|
714,168
|
855,974
|
1.83%
|
40,916
|
0.09%
|
-
|
-
|
-
|
0.00%
|
||
|
2005
|
46,755,362
|
141,806
|
714,168
|
855,974
|
1.83%
|
40,916
|
0.09%
|
1,272
|
1,272
|
-
|
0.00%
|
||
|
Q1:
2006
|
48,300,705
|
167,772
|
645,675
|
813,447
|
1.68%
|
38,124
|
0.08%
|
55
|
55
|
-
|
0.00%
|
||
|
Q2:
2006
|
51,588,837
|
192,134
|
653,476
|
845,610
|
1.64%
|
44,632
|
0.09%
|
1,463
|
1,463
|
-
|
0.01%
|
||
|
Q3:
2006
|
58,063,971
|
258,382
|
678,489
|
936,871
|
1.61%
|
70,586
|
0.12%
|
2,167
|
1,705
|
462
|
0.01%
|
||
|
Q4:
2006
|
57,750,799
|
295,340
|
472,669
|
768,009
|
1.33%
|
64,367
|
0.11%
|
1,156
|
1,132
|
24
|
0.01%
|
||
|
2006
|
57,750,799
|
295,340
|
472,669
|
768,009
|
1.33%
|
64,367
|
0.11%
|
4,841
|
4,355
|
486
|
0.01%
|
||
|
Q1:
2007
|
57,411,648
|
294,466
|
551,917
|
846,383
|
1.47%
|
77,726
|
0.14%
|
1,471
|
1,417
|
24
|
0.01%
|
||
|
Q2:
2007
|
$69,970,812
|
$310,745
|
$584,706
|
$895,451
|
1.28%
|
$73,104
|
0.10%
|
$76
|
$30
|
$46
|
0.00%
|
||
|
(1)
The credit
reserve on commercial real estate loans is only available
to absorb losses
on our commercial real estate loan portfolio. Internally-designated
credit
reserves and external credit enhancement are only available
to absorb
losses on the commercial CES. Much of the external credit
enhancement will
share loan losses with Redwood rather than protect Redwood
from
losses.
|
|||||||||||||
|
The
Redwood
Review
2nd
Quarter
|
Appendix
Table
15 -
Commercial Real Estate Loans Credit Performance
|
104
|
|
|
|||||||||
|
|
|
|
|
|
|
|
|
|
|
|
|
Q2:2007
|
Q1:2007
|
Q4:2006
|
Q3:2006
|
Q2:2006
|
Q1:2006
|
Q4:2005
|
Q3:2005
|
Q2:2005
|
|
Commercial
CES
Loans
|
$69,970,812
|
$57,411,648
|
$57,750,799
|
$58,063,971
|
$51,588,837
|
$48,300,705
|
$46,755,362
|
$40,015,531
|
$31,272,785
|
|
Number
of
loans
|
4,648
|
3,968
|
3,889
|
4,032
|
3,456
|
3,737
|
3,618
|
2,866
|
2,248
|
|
Average
face
value
|
$15,054
|
$14,469
|
$14,850
|
$14,401
|
$14,927
|
$12,925
|
$12,923
|
$13,962
|
$13,911
|
|
|
|
|
|
||||||
|
|
|
|
|
||||||
|
State
Distribution
|
|
|
|
||||||
|
CA
|
16%
|
17%
|
17%
|
18%
|
18%
|
17%
|
17%
|
16%
|
18%
|
|
NY
|
13%
|
13%
|
13%
|
11%
|
12%
|
12%
|
13%
|
13%
|
14%
|
|
TX
|
8%
|
8%
|
8%
|
5%
|
6%
|
6%
|
6%
|
7%
|
7%
|
|
VA
|
4%
|
4%
|
4%
|
2%
|
2%
|
2%
|
2%
|
3%
|
1%
|
|
FL
|
6%
|
6%
|
6%
|
5%
|
5%
|
5%
|
5%
|
5%
|
4%
|
|
Other
|
52%
|
52%
|
52%
|
59%
|
57%
|
58%
|
57%
|
56%
|
56%
|
|
|
|
|
|
||||||
|
Property
Type Distribution
|
|
|
|
||||||
|
Office
|
38%
|
35%
|
37%
|
30%
|
36%
|
32%
|
37%
|
39%
|
40%
|
|
Retail
|
30%
|
30%
|
31%
|
32%
|
32%
|
33%
|
33%
|
34%
|
34%
|
|
Multi-family
|
15%
|
12%
|
12%
|
11%
|
11%
|
16%
|
12%
|
10%
|
10%
|
|
Hospitality
|
7%
|
7%
|
7%
|
6%
|
5%
|
7%
|
3%
|
5%
|
4%
|
|
Self-storage
|
2%
|
3%
|
3%
|
0%
|
0%
|
0%
|
0%
|
0%
|
0%
|
|
Industrial
|
4%
|
3%
|
3%
|
1%
|
1%
|
2%
|
2%
|
1%
|
2%
|
|
Other
|
4%
|
10%
|
7%
|
20%
|
15%
|
10%
|
13%
|
11%
|
10%
|
|
|
|
|
|
||||||
|
Weighted
average LTV
|
70%
|
68%
|
69%
|
69%
|
69%
|
68%
|
68%
|
68%
|
67%
|
|
|
|
|
|
|
|
||||
|
Weighted
average debt service coverage ratio
|
1.59
|
1.73
|
1.60
|
1.72
|
1.75
|
1.99
|
2.05
|
1.88
|
1.79
|
|
|
|
|
|
|
|
|
|
|
|
|
The
Redwood
Review
2nd
Quarter
|
Appendix
Table
16 -
Commercial CES Loan Characteristics
|
105
|
|
|
||||||||
|
|
|
|
|
|
|
|
|
|
|
|
Q2:2007
|
Q1:2007
|
Q4:2006
|
Q3:2006
|
Q2:2006
|
Q1:2006
|
Q4:2005
|
Q3:2005
|
|
Commercial
mortgage loans, reported value
|
$25,827
|
$25,883
|
$28,172
|
$32,170
|
$36,722
|
$55,167
|
$59,692
|
$56,102
|
|
Number
of
loans
|
7
|
7
|
7
|
8
|
9
|
12
|
13
|
12
|
|
Average
loan
size
|
$3,690
|
$3,698
|
$4,025
|
$4,021
|
$4,080
|
$4,597
|
$4,592
|
$4,675
|
|
Seriously
delinquent loans
|
-
|
-
|
-
|
-
|
-
|
-
|
-
|
-
|
|
Realized
credit losses
|
-
|
-
|
-
|
-
|
-
|
-
|
-
|
-
|
|
California
%
(based on reported value)
|
1%
|
1%
|
7%
|
7%
|
6%
|
19%
|
25%
|
28%
|
|
|
|
|
|
|
|
|
|
|
|
The
Redwood
Review
2nd
Quarter
|
Appendix
Table
17 -
Commercial Real Estate Loan Characteristics
|
106
|
|
|
Table
18: Securities Portfolios Credit Rating and Collateral Type ($
in
millions)
|
|
|
|||||||||
|
At
June 30, 2007:
|
CURRENT
RATING AT 6/30/2007
|
||||||||
|
|
Total
|
AAA
|
AA
|
A
|
BBB
|
BB
|
B
|
Unrated
|
|
|
Residential
prime
|
$1,440
|
$153
|
$180
|
$255
|
$282
|
$318
|
$131
|
$121
|
|
|
Residential
alt-a
|
1,028
|
235
|
101
|
271
|
249
|
103
|
34
|
35
|
|
|
Residential
sub-prime
|
440
|
14
|
154
|
149
|
120
|
3
|
-
|
-
|
|
|
Other
real
estate investments
|
34
|
2
|
-
|
14
|
4
|
4
|
-
|
10
|
|
|
Commercial
|
563
|
8
|
4
|
23
|
76
|
215
|
99
|
137
|
|
|
CDO
|
256
|
81
|
30
|
48
|
76
|
13
|
-
|
8
|
|
|
Total
securities portfolio market value
|
$3,760
|
$493
|
$469
|
$760
|
$807
|
$656
|
$264
|
$311
|
|
|
|
|||||||||
|
At
March 31, 2007:
|
CURRENT
RATING AT 3/31/2007
|
||||||||
|
|
Total
|
AAA
|
AA
|
A
|
BBB
|
BB
|
B
|
Unrated
|
|
|
Residential
prime
|
$1,361
|
$67
|
$180
|
$247
|
$295
|
$316
|
$132
|
$124
|
|
|
Residential
alt-a
|
938
|
207
|
92
|
225
|
243
|
101
|
30
|
40
|
|
|
Residential
sub-prime
|
480
|
8
|
152
|
173
|
138
|
9
|
-
|
-
|
|
|
Other
real
estate investments
|
50
|
2
|
-
|
19
|
6
|
4
|
-
|
19
|
|
|
Commercial
|
551
|
9
|
4
|
24
|
79
|
222
|
89
|
124
|
|
|
CDO
|
270
|
86
|
27
|
57
|
84
|
13
|
-
|
3
|
|
|
Total
securities portfolio market value
|
$3,650
|
$379
|
$455
|
$745
|
$845
|
$665
|
$251
|
$310
|
|
|
|
|||||||||
|
At
December 31, 2006:
|
CURRENT
RATING AT 12/31/2006
|
||||||||
|
|
Total
|
AAA
|
AA
|
A
|
BBB
|
BB
|
B
|
Unrated
|
|
|
Residential
prime
|
$1,278
|
$14
|
$181
|
$243
|
$285
|
$307
|
$119
|
$129
|
|
|
Residential
alt-a
|
613
|
136
|
84
|
106
|
130
|
94
|
23
|
40
|
|
|
Residential
sub-prime
|
528
|
8
|
127
|
209
|
174
|
7
|
-
|
3
|
|
|
Commercial
|
568
|
9
|
2
|
16
|
93
|
224
|
90
|
134
|
|
|
CDO
|
246
|
66
|
30
|
52
|
76
|
14
|
-
|
8
|
|
|
Total
securities portfolio market value
|
$3,233
|
$233
|
$424
|
$626
|
$757
|
$648
|
$232
|
$313
|
|
|
|
|||||||||
|
The
Redwood
Review
2nd
Quarter
|
Appendix
Table
18 -
Securities Portfolios Credit Rating and Collateral Type
|
107
|
|
|
|||||
|
Sequoia
ABS
Issued
|
Issue
Date
|
Original
Issue
Amount
|
Stated
Maturity
|
Estimated
Callable
Date
|
Outstanding
Balance
June
30,
2007
|
|
Sequoia
1
|
07/29/97
|
$534,347
|
2028
|
Called
|
$0
|
|
Sequoia
2
|
11/06/97
|
749,160
|
2029
|
Called
|
-
|
|
Sequoia
3
|
06/26/98
|
635,288
|
2028
|
Called
|
-
|
|
Sequoia
1A
|
05/04/99
|
157,266
|
2028
|
Called
|
-
|
|
Sequoia
4
|
03/21/00
|
377,119
|
2024
|
2007
|
60,600
|
|
Sequoia
5
|
10/29/01
|
510,047
|
2026
|
2007
|
87,695
|
|
Sequoia
6
|
04/26/02
|
506,142
|
2027
|
2007
|
90,669
|
|
Sequoia
7
|
05/29/02
|
572,000
|
2032
|
Called
|
-
|
|
Sequoia
8
|
07/30/02
|
642,998
|
2032
|
Called
|
-
|
|
Sequoia
9
|
08/28/02
|
558,266
|
2032
|
2007
|
79,698
|
|
Sequoia
10
|
09/26/02
|
1,041,600
|
2027
|
2008
|
184,600
|
|
Sequoia
11
|
10/30/02
|
704,936
|
2032
|
2007
|
103,311
|
|
Sequoia
12
|
12/19/02
|
1,096,891
|
2033
|
Called
|
-
|
|
Sequoia
2003-1
|
02/27/03
|
1,012,321
|
2033
|
2007
|
170,783
|
|
Sequoia
2003-2
|
04/29/03
|
815,080
|
2022
|
2007
|
138,001
|
|
Sequoia
2003-3
|
06/26/03
|
538,452
|
2023
|
2007
|
93,673
|
|
MLCC
2003-C
|
06/26/03
|
984,349
|
2023
|
2008
|
183,670
|
|
MLCC
2003-D
|
07/29/03
|
1,003,591
|
2028
|
2008
|
198,365
|
|
Sequoia
2003-4
|
07/29/03
|
504,273
|
2033
|
2007
|
141,595
|
|
Sequoia
2003-5
|
08/27/03
|
840,248
|
2033
|
2007
|
117,566
|
|
Sequoia
2003-6
|
10/29/03
|
649,999
|
2033
|
Called
|
-
|
|
Sequoia
2003-7
|
11/25/03
|
811,707
|
2034
|
Called
|
-
|
|
Sequoia
2003-8
|
12/23/03
|
964,238
|
2034
|
2007
|
166,344
|
|
MLCC
2003-E
|
08/28/03
|
983,852
|
2028
|
2008
|
194,514
|
|
MLCC
2003-F
|
09/25/03
|
1,297,913
|
2028
|
2007
|
251,942
|
|
MLCC
2003-H
|
12/22/03
|
739,196
|
2029
|
2008
|
134,184
|
|
The
Redwood
Review
2nd
Quarter
|
Appendix
Table
19
Sequoia ABS Issued
|
108
|
|
|
Table
19: Sequoia ABS Issued ($ in
thousands)
|
|
|
|||||
|
Sequoia
ABS
Issued
|
Issue
Date
|
Original
Issue
Amount
|
Stated
Maturity
|
Estimated
Callable
Date
|
Outstanding
Balance
June
30,
2007
|
|
Sequoia
2004-1
|
01/28/04
|
$616,562
|
2034
|
2007
|
$105,125
|
|
Sequoia
2004-2
|
02/25/04
|
690,548
|
2034
|
Called
|
-
|
|
Sequoia
2004-3
|
03/30/04
|
917,673
|
2034
|
2007
|
130,677
|
|
Sequoia
2004-4
|
04/29/04
|
808,933
|
2010
|
2007
|
122,198
|
|
Sequoia
2004-5
|
05/27/04
|
831,540
|
2012
|
2008
|
137,030
|
|
Sequoia
2004-6
|
06/29/04
|
910,662
|
2012
|
2008
|
173,056
|
|
SEMHT
2004-01
|
06/29/04
|
317,044
|
2014
|
2008
|
75,571
|
|
Sequoia
2004-7
|
07/29/04
|
1,032,685
|
2034
|
2008
|
179,730
|
|
Sequoia
2004-8
|
08/27/04
|
807,699
|
2034
|
2008
|
176,976
|
|
Sequoia
2004-9
|
09/29/04
|
772,831
|
2034
|
2008
|
195,266
|
|
Sequoia
2004-10
|
10/28/04
|
673,356
|
2034
|
2008
|
160,143
|
|
Sequoia
2004-11
|
11/23/04
|
705,746
|
2034
|
2008
|
210,777
|
|
Sequoia
2004-12
|
12/22/04
|
821,955
|
2035
|
2008
|
195,459
|
|
Sequoia
2005-1
|
01/27/05
|
409,071
|
2035
|
2008
|
112,440
|
|
Sequoia
2005-2
|
02/24/05
|
338,481
|
2035
|
2008
|
81,427
|
|
Sequoia
2005-3
|
04/28/05
|
359,182
|
2035
|
2008
|
102,348
|
|
Madrona
2005-A
|
08/25/05
|
5,400
|
2008
|
2008
|
5,400
|
|
Sequoia
2005-4
|
09/29/05
|
324,576
|
2035
|
2009
|
195,074
|
|
Sequoia
2006-1
|
08/30/06
|
742,507
|
2046
|
2011
|
604,377
|
|
Sequoia
2007-1
|
03/30/07
|
864,089
|
2047
|
2015
|
821,307
|
|
Sequoia
2007-2
|
05/25/07
|
1,018,484
|
2038
|
2017
|
994,791
|
|
Total
Sequoia ABS Issuance
|
|
$33,200,303
|
|
|
$7,176,382
|
|
The
Redwood
Review
2nd
Quarter
|
Appendix
Table
19
Sequoia ABS Issued
|
109
|
|
Sequoia
ABS
IO's
Issued
|
Issue
Date
|
Original
Issue
Amount
|
Stated
Maturity
|
Estimated
Callable
Date
|
Outstanding
Balance
At
June
30,
2007
|
|
MLCC
2003-C
X-A-2
|
06/26/03
|
$12,662
|
2007
|
2007
|
$0
|
|
MLCC
2003-D
X-A-1
|
07/29/03
|
22,371
|
2007
|
2007
|
-
|
|
MLCC
2003-E
X-A-1
|
08/28/03
|
16,550
|
2007
|
2007
|
138
|
|
MLCC
2003-F
X-A-1
|
09/25/03
|
18,666
|
2007
|
2007
|
-
|
|
Sequoia
2003-6
X-1
|
10/29/03
|
8,220
|
2007
|
Called
|
-
|
|
SMFC
2003A AX1
|
10/31/03
|
70,568
|
2007
|
2007
|
495
|
|
Sequoia
2003-7
X-1
|
11/25/03
|
10,345
|
2007
|
Called
|
-
|
|
Sequoia
2003-8
X-1
|
12/23/03
|
12,256
|
2007
|
2007
|
-
|
|
Sequoia
2004-1
X-1
|
01/28/04
|
7,801
|
2007
|
2007
|
-
|
|
Sequoia
2004-2
X-1
|
02/25/04
|
8,776
|
2007
|
Called
|
-
|
|
SMFC
2004A AX1
|
02/26/04
|
10,626
|
2007
|
2007
|
297
|
|
MLCC
2003-H
X-A-1
|
12/22/03
|
10,430
|
2007
|
2007
|
469
|
|
Sequoia
2004-4
X-1
|
05/28/04
|
9,789
|
2010
|
2007
|
281
|
|
Sequoia
2004-5
X-1
|
05/27/04
|
3,371
|
2012
|
2008
|
154
|
|
Sequoia
2004-6
X-A
|
06/29/04
|
10,884
|
2012
|
2008
|
2,874
|
|
Sequoia
2004-7
X-A
|
07/29/04
|
12,145
|
2034
|
2008
|
3,590
|
|
Sequoia
2004-8
X-A
|
08/27/04
|
18,270
|
2034
|
2008
|
5,380
|
|
Sequoia
2004-9
X-A
|
09/29/04
|
16,951
|
2034
|
2008
|
5,642
|
|
Sequoia
2004-10 X-A
|
10/28/04
|
14,735
|
2034
|
2008
|
4,887
|
|
Sequoia
2004-11 X-A-1
|
11/23/04
|
12,603
|
2034
|
2008
|
4,732
|
|
Sequoia
2004-11 X-A-2
|
11/23/04
|
4,697
|
2034
|
2008
|
1,973
|
|
Sequoia
2004-12 X-A-1
|
12/22/04
|
14,453
|
2035
|
2008
|
5,158
|
|
Sequoia
2004-12 X-A-2
|
12/22/04
|
5,081
|
2035
|
2008
|
5,081
|
|
Sequoia
2005-1
X-A
|
01/27/05
|
9,669
|
2035
|
2008
|
3,748
|
|
Sequoia
2005-2
X-A
|
02/24/05
|
7,484
|
2035
|
2008
|
2,769
|
|
Sequoia
2005-3
X-A
|
04/28/05
|
8,183
|
2035
|
2008
|
3,518
|
|
Total
Sequoia Issuance
|
|
$357,586
|
|
|
$51,187
|
|
The
Redwood
Review
2nd
Quarter
|
Appendix
Table 20
- Sequoia IO ABS Issued
|
110
|
|
|
Table
21: Acacia CDO ABS Issued ($ in thousands)
|
|
|
|||||
|
CDO
Issuance
|
Issue
Date
|
Original
Issue
Amount
|
Stated
Maturity
|
Optional
Redemption
Date
|
Principal
Outstanding
At
June
30,
2007
|
|
Acacia
CDO 1
|
12/10/02
|
$285,000
|
2023
|
Called
|
$0
|
|
Acacia
CDO 2
|
05/13/03
|
283,875
|
2023
|
Called
|
-
|
|
Acacia
CDO 3
|
11/04/03
|
284,250
|
2038
|
Called
|
-
|
|
Acacia
CDO 4
|
04/08/04
|
293,400
|
2039
|
Called
|
-
|
|
Acacia
CDO 5
|
07/14/04
|
282,125
|
2039
|
2007
|
245,560
|
|
Acacia
CDO 6
|
11/09/04
|
282,000
|
2040
|
2007
|
270,540
|
|
Acacia
CDO 7
|
03/10/05
|
282,000
|
2045
|
2008
|
281,112
|
|
Acacia
CDO 8
|
07/14/05
|
252,000
|
2045
|
2008
|
251,345
|
|
Acacia
CRE 1
|
12/14/05
|
261,750
|
2045
|
2010
|
261,543
|
|
Acacia
CDO 9
|
03/09/06
|
277,800
|
2046
|
2009
|
277,787
|
|
Acacia
CDO 10
|
08/02/06
|
436,500
|
2046
|
2009
|
436,500
|
|
Acacia
CDO 11
|
02/15/07
|
476,660
|
2047
|
2010
|
476,660
|
|
Acacia
CDO 12
|
05/18/07
|
458,000
|
2047
|
2010
|
458,000
|
|
Acacia
CDO OA
1 (1)
|
06/14/07
|
486,000
|
2052
|
2010
|
494,800
|
|
|
|
||||
|
Total
Acacia CDO Issuance
|
$4,641,360
|
$3,453,848
|
|||
|
|
|
|
The
Redwood
Review
2nd
Quarter
|
Appendix
Table 21
- Sequoia CDO ABS Issued
|
111
|