 |
||
 |
 |
 |
|
The
Redwood Review
3rd
Quarter 2007
|
||
|
|
||
|
|
||
|
|
|
|
|
The
Redwood Review
3rd
Quarter 2007
|
||
|
|
||
|
|
Table
of Contents
|
|
Introduction
|
|
|
2
|
|
|
Shareholder
Letter
|
|
|
3
|
|
|
Quarterly
Overview
|
|
|
5
|
|
|
Mark-to-Market
Adjustments
|
|
|
12
|
|
|
|
|
|
|
|
|
Financial
and Business Modules
|
|
|
|
|
|
|
|
|
|
|
|
•
Financial
|
|
|
22
|
|
|
•
Residential
|
|
|
32
|
|
|
•
Commercial
|
|
|
54
|
|
|
•
CDO
|
|
|
61
|
|
|
•
Capital
and
Liquidity
|
|
|
66
|
|
|
•
Debt
|
|
|
68
|
|
|
•
ABS
Issued
|
|
|
70
|
|
|
|
|
|
|
|
|
Appendix
|
|
|
|
|
|
•
Glossary
|
|
|
76
|
|
|
•
Financial
Tables
|
|
|
83
|
|
|
The
Redwood
Review
3rd
Quarter
2007
|
|
1 |
 |
Introduction
|
|
Quarter:
Year
|
GAAP
Earnings
per
Share
|
Core
Earnings
per
Share
|
Total
Taxable
Earnings
per
Share
|
Adjusted
Return
on
Equity
|
GAAP
Book
Value
per
Share
|
Core
Book
Value
per
Share
|
Total
Dividends
per
Share
|
|
Q3:05
|
$2.21
|
$1.22
|
$2.23
|
25%
|
$41.03
|
$36.30
|
$0.70
|
|
Q4:05
|
$1.68
|
$0.97
|
$1.65
|
19%
|
$37.20
|
$34.27
|
$3.70
|
|
Q1:06
|
$1.09
|
$1.16
|
$1.44
|
13%
|
$38.11
|
$34.90
|
$0.70
|
|
Q2:06
|
$1.20
|
$0.97
|
$1.91
|
14%
|
$39.13
|
$35.58
|
$0.70
|
|
Q3:06
|
$1.22
|
$1.20
|
$1.96
|
14%
|
$40.02
|
$36.38
|
$0.70
|
|
Q4:06
|
$1.32
|
$1.12
|
$1.45
|
15%
|
$37.51
|
$34.02
|
$3.70
|
|
Q1:07
|
$0.66
|
$1.08
|
$1.48
|
8%
|
$34.06
|
$34.29
|
$0.75
|
|
Q2:07
|
$0.41
|
$1.35
|
$1.66
|
5%
|
$31.50
|
$34.40
|
$0.75
|
|
Q3:07
|
($2.18)
|
$1.43
|
$1.74
|
(26%)
|
$5.32
|
$31.58
|
$0.75
|
| 2 |
|
The
Redwood
Review
3rd
Quarter
2007
|
|
|
Shareholder
Letter
|
|
The
Redwood
Review
3rd
Quarter
2007
|
|
3 |
|
|
Shareholder
Letter
|
 |
 |
|
|
George
E.
Bull, III
|
Douglas
B.
Hansen
|
|
|
Chairman
and CEO
|
President
|
| 4 |
|
The
Redwood
Review
3rd
Quarter
2007
|
|
|
Quarterly
Overview
|
|
Net
Liquidity Position
($
in millions)
|
|||||||
|
Sept.
30, 2007
|
June
30, 2007
|
||||||
|
|
|
|
|||||
|
Unrestricted
cash
|
|
$310
|
|
$83
|
|||
|
Unsecuritized
residential loans
|
6
|
888
|
|||||
|
AAA-rated
residential securities
|
45
|
|
168
|
|
|||
|
Liquid
assets
|
361
|
1,139
|
|||||
|
Repo
and CP borrowings
|
(39
|
) |
(849
|
) | |||
|
|
|
|
|||||
|
Net
Liquidity Position
|
|
$322
|
|
$290
|
|||
|
The
Redwood
Review
3rd
Quarter
2007
|
|
5 |
|
|
Quarterly
Overview
|
|
6
|
|
The
Redwood
Review
3rd
Quarter
2007
|
|
|
Quarterly
Overview
|
|
The
Redwood
Review
3rd
Quarter
2007
|
|
7 |
|
|
Quarterly
Overview
|
|
8
|
|
The
Redwood
Review
3rd
Quarter
2007
|
|
|
Quarterly
Overview
|
| l |
We
believe
the easiest way to evaluate our consolidated balance sheet
is by
separately analyzing Redwood and Acacia. By separating
Acacia from Redwood, the
following balance sheet more clearly highlights and provides
insight
into where the vast majority of Redwood’s capital is invested.
|
| l |
The
pro forma balance sheet below shows Redwood at September 30,
2007
excluding the assets and liabilities of Acacia
entities.
|
|
Pro
Forma Balance Sheet
Redwood
Excluding Acacia
as
of September 30, 2007
($
in millions)
|
||||
|
|
|
|||
|
Real
estate loans
|
|
$7,630
|
||
|
Real
estate securities
|
429
|
|||
|
Cash
and cash equivalents
|
310
|
|||
|
Total
earning assets
|
8,369
|
|||
|
Restricted
cash
|
14
|
|||
|
Other
assets
|
95
|
|||
|
Total
Assets
|
|
$8,478
|
||
|
Redwood
debt
|
$39
|
|||
|
Asset-backed
securities issued
|
7,500
|
|||
|
Subordinated
notes
|
150
|
|||
|
Other
liabilities
|
60
|
|||
|
Total
Liabilities
|
7,749
|
|||
|
Total
Stockholders’ Equity
|
729
|
|||
|
Total
Liabilities & Stockholders’ Equity
|
|
$8,478
|
||
|
The
preceding pro forma presentation is not a GAAP measurement.
The pro forma
information is reconciled to our GAAP consolidated
balance sheet on a
table presented on page 14 of this Redwood Review under
Mark-to-Market
Adjustments; Impact on Redwood. The purpose is to show
information about
Redwood’s balance sheet without any investment in Acacia entities
at
September 30,
2007.
|
||||
| l |
If
you valued our investment in Acacia entities at the low end
of the range
discussed on page 7 equaling $55 million, then our overall
adjusted book
value would be $784 million ($729 million plus $55 million).
Thus, 7% of
our capital is invested in Acacia entities and 93% is at
Redwood.
|
|
The
Redwood
Review
3rd
Quarter
2007
|
|
9 |
|
|
Quarterly
Overview
|
|
Pro
Forma Balance Sheet Information
Securities:
Underlying Collateral Type by Vintage
Redwood
Excluding Acacia
as
of September 30, 2007
($
in millions)
|
||||||||||||||||
|
|
|
|
|
|
|
|||||||||||
|
|
2004
& Earlier
|
2005
|
2006
|
2007
|
Total
|
|||||||||||
|
Residential
IGS
|
|
|
|
|
|
|||||||||||
|
Prime
|
$
|
2
|
$
|
-
|
$
|
-
|
$
|
-
|
$
|
2
|
||||||
|
Alt-a
|
-
|
-
|
-
|
46
|
46
|
|||||||||||
|
Subprime
|
1
|
-
|
-
|
12
|
13
|
|||||||||||
|
Residential
IGS
|
3
|
-
|
-
|
58
|
61
|
|||||||||||
|
Residential
CES
|
||||||||||||||||
|
Prime
|
77
|
24
|
13
|
18
|
132
|
|||||||||||
|
Alt-a
|
7
|
10
|
9
|
18
|
44
|
|||||||||||
|
Subprime
|
1
|
-
|
-
|
-
|
1
|
|||||||||||
|
Residential
CES
|
85
|
34
|
22
|
36
|
177
|
|||||||||||
|
Residential
OREI
|
2
|
-
|
17
|
5
|
24
|
|||||||||||
|
Commercial
IGS
|
1
|
-
|
-
|
-
|
1
|
|||||||||||
|
Commercial
CES
|
26
|
35
|
75
|
21
|
157
|
|||||||||||
|
CDO
IGS
|
2
|
-
|
1
|
3
|
6
|
|||||||||||
|
CDO
CES
|
1
|
-
|
-
|
2
|
3
|
|||||||||||
|
Totals
|
$
|
120
|
$
|
69
|
$
|
115
|
$
|
125
|
$
|
429
|
||||||
|
The
preceding pro forma presentation is not a GAAP measurement.
The pro forma
information is reconciled to our GAAP consolidated balance
sheet on a
table presented on page 14 of this Redwood Review under
Mark-to-Market
Adjustments, Impact on Redwood. The purpose is to show
information about
Redwood’s balance sheet excluding Acacia at September 30,
2007.
|
||||||||||||||||
| · |
All
of the securities are financed with capital, except for $45 million
of
residential IGS, which are funded with Redwood debt of $39 million
and
capital of $6 million. The total capital invested in real estate
securities is $390 million.
|
|
10
|
|
The
Redwood
Review
3rd
Quarter
2007
|
|
|
Quarterly
Overview
|
| · |
Our
potential GAAP earnings upside from good credit performance can
be
estimated by referencing the size of our credit reserves. In
the event we
experience no future credit losses, our GAAP earnings would benefit
by the
amount of these credit reserves as these loans pay off. Our current
earnings incorporate these loss estimates, so income from the
reversal of
credit reserves would add to our current GAAP earnings run rate
(all other
factors being equal).
|
| · |
Our
investments incorporate a high degree of credit risk, so high
credit loss
rates would reduce GAAP earnings, taxable income, and
dividends.
|
| · |
The
following table shows the components comprising the carrying
value of our
residential prime and alt-a CES and our commercial CES at Redwood.
This
table does not include securities owned by
Acacia.
|
|
Pro
Forma Balance Sheet Information
Credit
Enhancement Securities
Redwood
Excluding Acacia
as
of September 30, 2007
($
in millions)
|
||||||||||
|
|
Residential
|
|
||||||||
|
|
||||||||||
|
|
Prime
|
Alt-a
|
Commercial
|
|||||||
|
Current
face
|
|
$417
|
|
$244
|
|
$500
|
||||
|
Unamortized
discount, net
|
(64
|
)
|
(9
|
)
|
(10
|
) | ||||
|
Discount
designated as credit reserve
|
(223
|
)
|
(159
|
)
|
(310
|
) | ||||
|
Amortized
cost
|
130
|
76
|
180
|
|||||||
|
Gross
unrealized market value gains
|
29
|
1
|
8
|
|||||||
|
Gross
unrealized market value losses
|
(27
|
)
|
(33
|
)
|
(31
|
) | ||||
|
Carrying
value
|
|
$132
|
|
$44
|
|
$157
|
||||
|
The
preceding pro forma presentation is not a GAAP measurement.
The pro forma
information is reconciled to our GAAP consolidated balance
sheet on a
table presented on page 14 of this Redwood Review under Mark-to-Market
Adjustments, Impact on Redwood. The purpose is to show information
about
Redwood’s balance sheet as if there was no investment in Acacia at
September 30,
2007.
|
||||||||||
|
The
Redwood
Review
3rd
Quarter
2007
|
|
11 |
|
|
Mark-to-Market
Adjustments
|
| Ø |
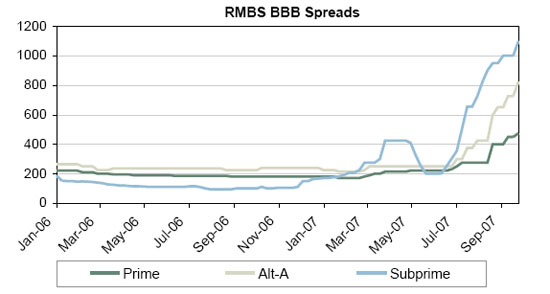
The
mortgage market faced adversity in the third quarter of 2007
as the
continued broad re-pricing of mortgage credit risk led to
a severe
contraction in market liquidity. The most dramatic price
adjustments
involved residential mortgage-backed securities (RMBS) and
CDO securities
backed by subprime and alt-a mortgages originated in 2006
and
2007.
|
| Ø |
We
believe several converging factors led to the broad re-pricing,
including
general concerns over the decline in home prices, the rapid
increase in
the number of delinquent subprime and alt-a loans, the reduced
willingness
of investors to acquire commercial paper backed by mortgage
collateral and
the resulting contraction in market liquidity and availability
of
financing lines, the numerous rating agency downgrades of
securities, and
an increase in the supply of securities potentially available
for sale.
|
| Ø |
The
downward spiraling of negative pricing adjustments on assets
had a
snowball effect as lower prices led to increased lender margin
calls for
some market participants, which in turn, forced additional
selling,
causing yet further declines in prices. These events continued
to feed off
each other through much of the quarter.
|
| Ø |
Normal
market trading activity during the quarter was unusually
light as
uncertainty related to future loss estimates made it difficult
for willing
buyers and sellers to agree on price. This condition is particularly
acute
with respect to RMBS and CDO securities backed by 2006 and
2007 subprime
and alt-a loans where market participants are setting price
levels based
on widely varied opinions about future loan performance and
loan loss
severity. While the early credit performance for these securities
has been
clearly far worse than initial expectations, the ultimate
level of
realized losses will largely be influenced by events that
will likely
unfold over the next 12 to 36 months, including the severity
of housing
price declines and the overall strength of the
economy.
|
| Ø |
The
actions taken late in the quarter by the Federal Reserve
to reduce the
federal funds and discount rates provided some temporary
market
confidence. We caution that Federal Reserve actions alone
are not likely
to result in price stability as the aforementioned market
concerns remain
largely unresolved. From the end of the third quarter through
the
beginning of November, prices for RMBS and CDO securities
continued to
decline, in particular for those securities backed by 2006
and 2007
subprime loans.
|
|
12
|
|
The
Redwood
Review
3rd
Quarter
2007
|
|
|
Mark-to-Market
Adjustments
|
| Ø |
We
believe that, in the long run, the widening spreads (reduction
in asset
prices) will be advantageous to us as we are buying and will
continue to
buy high quality assets at more attractive prices than we have
seen in
recent years.
|
| Ø |
During
the quarter, we experienced no liquidity issues as all of our
credit-sensitive investments were financed with capital or through
our
Acacia securitization entities. Additionally, we only had a small
amount
of less credit sensitive assets borrowed on repo facilities.
Our cash
balances exceed our short-term
debt.
|
| Ø |
The
continued extensive price decline in real estate securities in
the third
quarter had a significant negative GAAP financial reporting impact
on
Redwood, as mark-to-market (MTM) adjustments to our real estate
securities
portfolio caused our GAAP book value and our GAAP earnings to
decline
significantly. We strongly believe that the real economic effect
of MTM is
significantly less than the impact shown under GAAP. The primary
reason
for the divergence between economics and GAAP is the accounting
treatment
required for our investments in Acacia
CDOs.
|
|
The
Redwood
Review
3rd
Quarter
2007
|
|
13 |
|
|
Mark-to-Market
Adjustments
|
| Ø |
As
a result of this accounting treatment, our investments in Acacia
CDO
entities, in which we have a net cash investment of $113 million,
are
carried in our reported GAAP consolidated statement of stockholders’
equity
as having $580 million of negative book value at September 30,
2007. (See
the consolidating balance sheet below). However, economically
this
investment cannot be worth less than zero, because in the worst
case, we
cannot lose more than the amount we invested. Nonetheless, GAAP
requires
us to prepare our financials in a manner that could cause readers
to
conclude that market values declined by more than we invested.
The debt of
Acacia is not an obligation of Redwood and we have not provided
Acacia
with any guarantees. Therefore, even if you assume that our investment
in
Acacia is worthless, our reported GAAP book value is understated
by $580
million. Furthermore, we believe that our investments in Acacia
have
positive value and will continue to generate cash flow. Our calculation
of
the present value of the future cash flows (adjusted for projected
credit
losses) from Acacia entities discounted at 45% and 14% range
from $55
million to $145 million. Due to the current market illiquidity
for CDO
equity, we would expect that the fair value of our Acacia investments
at
the end of the quarter to be on the lower end of the
range.
|
|
Pro
Forma Consolidating Balance Sheet
as
of September 30, 2007
($
in millions)
|
|||||||||||||
|
|
Redwood
Excluding Acacia
|
Acacia
|
Intercompany
|
Redwood
Consolidated
|
|||||||||
|
Real
estate loans
|
|
$7,630
|
|
$26
|
|
$0
|
|
$7,656
|
|||||
|
Real
estate & other securities
|
429
|
2,715
|
(113
|
)
|
3,031
|
||||||||
|
Cash
and cash equivalents
|
310
|
-
|
-
|
310
|
|||||||||
|
Total
earning assets
|
8,369
|
2,741
|
(113
|
)
|
10,997
|
||||||||
|
Restricted
cash
|
14
|
123
|
-
|
137
|
|||||||||
|
Other
assets
|
95
|
54
|
-
|
149
|
|||||||||
|
Total
Assets
|
|
$8,478
|
|
$2,918
|
($113
|
)
|
|
$11,283
|
|||||
|
Redwood
debt
|
|
$39
|
|
$0
|
|
$0
|
|
$39
|
|||||
|
Asset-backed
securities issued
|
7,500
|
3,416
|
(113
|
)
|
10,803
|
||||||||
|
Subordinated
notes
|
150
|
-
|
-
|
150
|
|||||||||
|
Other
liabilities
|
60
|
82
|
-
|
142
|
|||||||||
|
Total
Liabilities
|
7,749
|
3,498
|
(113
|
)
|
11,134
|
||||||||
|
Total
Stockholders’ Equity
|
729
|
(580
|
)
|
-
|
149
|
||||||||
|
Total
Liabilities & Stockholders’ Equity
|
|
$8,478
|
|
$2,918
|
($113
|
)
|
|
$11,283
|
|||||
|
The
purpose of this pro forma presentation is to show the
consolidating
components to our balance sheet and to highlight the
negative impact that
Acacia has on our consolidated stockholders’ equity at quarter end. The
Redwood excluding Acacia column reflects Redwood without
any investment in
Acacia entities. While the components reconcile to our
consolidated GAAP
balance sheet, this is a non-GAAP presentation. In a
GAAP presentation,
the Redwood excluding Acacia balance sheet shown above
would have
reflected an investment in Acacia and reflected the negative
equity of
Acacia.
|
|||||||||||||
| Ø |
Unless
RMBS and CDO securities prices recover from early November levels, we would be required to record
additional negative mark-to-market valuation adjustments in the
fourth
quarter. These adjustments could cause our GAAP stockholders’ equity at
December 31, 2007 to be negative. We are considering adopting
FAS 159 on
January 1, 2008, which would enable us to mark-to-market the
Acacia
liabilities. These rules would allow us to better conform our
GAAP
stockholders’ equity and what we believe economic reality to
be.
|
|
14
|
|
The
Redwood
Review
3rd
Quarter
2007
|
|
|
Mark-to-Market
Adjustments
|
| Ø |
From
an income statement perspective, MTM adjustments reduced our
third quarter
earnings by $103 million, of which $85 million were related
to assets
owned by Acacia.
|
|
Pro Forma Consolidating
Income Statement
Three
Months Ended September 30, 2007
($
in millions)
|
||||||||||
|
Redwood
Excluding Acacia
|
Acacia
|
Redwood
Consolidated
|
||||||||
|
|
|
|
|
|||||||
|
Net interest income
|
$42
|
$12
|
$54
|
|||||||
|
Operating
expenses
|
(12
|
)
|
-
|
(12
|
)
|
|||||
|
Realized gains on sales and
calls,
net
|
2
|
-
|
2
|
|||||||
|
Market valuation adjustments,
net
|
(18
|
)
|
(85
|
)
|
(103
|
)
|
||||
|
Provision
for income taxes
taxes
|
(2
|
)
|
-
|
(2
|
)
|
|||||
|
|
||||||||||
|
Net Income
(Loss)
|
$12
|
($73
|
)
|
($61
|
)
|
|||||
|
Nine
Months Ended September 30, 2007
($
in millions)
|
||||||||||
|
|
Redwood
Excluding Acacia
|
Acacia
|
Redwood
Consolidated
|
|||||||
|
Net interest income
|
$120
|
$34
|
$154
|
|||||||
|
Operating expenses
|
(42
|
)
|
-
|
(42
|
) | |||||
|
Realized gains on sales and
calls,net
|
6
|
-
|
6
|
|||||||
|
Market valuation adjustments, net
|
(44
|
)
|
(98
|
)
|
(142
|
) | ||||
|
Provision
for income taxes
|
(7
|
)
|
-
|
(7
|
) | |||||
|
Net Income (Loss)
|
$33
|
($64
|
)
|
($31
|
) | |||||
|
The
purpose of this pro forma presentation is to show the consolidating
components to our income statement and to highlight the negative
impact
that Acacia had on our consolidated net loss for the three and
nine months
ended September 30, 2007. While components reconciled to our
consolidated
GAAP income statement, this is a non-GAAP presentation. In a
GAAP
presentation, the Redwood excluding Acacia income statement shown
above
would have reflected the loss from
Acacia.
|
||||||||||
|
The
Redwood
Review
3rd
Quarter
2007
|
|
15 |
|
|
Mark-to-Market
Adjustments
|
| Ø |
Total
MTM adjustments taken during the three and nine months ended
September 30,
2007 were $757 million and $969 million, respectively. The tables
below
show the breakdown of these MTM adjustments between Redwood and
Acacia.
They also detail the amounts that flowed through our income statement
and
stockholders’ equity.
|
|
Pro
Forma Balance Sheet and Income Statement Information
Mark-to-Market
Adjustments
Three
Months Ended September 30, 2007
($
in millions)
|
||||||||||
|
Redwood
Excluding Acacia
|
Acacia
|
Redwood
Consolidated
|
||||||||
|
|
|
|
|
|||||||
|
Balance
Sheet Impact
|
|
|
|
|||||||
|
Reduction
in stockholders' equity
|
($98
|
)
|
($556
|
)
|
($654
|
) | ||||
|
Income
Statement Impact
|
||||||||||
|
Market
Valuation adjustments
|
||||||||||
|
Impairment
valuation on AFS securities
|
(15
|
)
|
(68
|
)
|
(83
|
) | ||||
|
Fair
value adjustment on trading assets
|
(3
|
)
|
(17
|
)
|
(20
|
) | ||||
|
Total
income statement impact
|
(18
|
)
|
(85
|
)
|
(103
|
) | ||||
|
Total
Mark-to-Market Adjustments
|
($116
|
)
|
($641
|
)
|
($757
|
) | ||||
|
Nine
Months Ended September 30, 2007
($
in millions)
|
||||||||||
|
Redwood
Excluding Acacia
|
Acacia
|
Redwood
Consolidated
|
||||||||
|
Balance
Sheet Impact
|
|
|
|
|||||||
|
Reduction
in stockholders' equity
|
($132
|
)
|
($696
|
)
|
($828
|
)
|
||||
|
Income
Statement Impact
|
||||||||||
|
Market valuation
adjustments
|
||||||||||
|
Impairment
valuation on AFS securities
|
(28
|
)
|
(79
|
)
|
(107
|
)
|
||||
|
Fair
value adjustment on trading assets
|
(28
|
)
|
(79
|
)
|
(34
|
)
|
||||
|
Total
income statement impact
|
(43
|
)
|
(98
|
)
|
(141
|
)
|
||||
|
Total
Mark-to-Market Adjustments
|
($175
|
)
|
($794
|
)
|
($969
|
)
|
||||
|
The
purpose of this pro forma presentation is to show the consolidating
components for total mark-to-market adjustments for the three
and nine
months ended September 30, 2007. These mark-to-market adjustments
are
further detailed by the balance sheet (stockholders’ equity) and income
statement impact. This is a non-GAAP presentation. The total
stockholders’
equity impact of $654 million and $828 million for the three
and nine
months ended September 30, 2007, respectively, agree to our
consolidated
statement of comprehensive income for those periods. The
total income
statement impact of $103 million and $141 million for the
three and nine
month periods ended September 30, 2007, respectively, agree
to our
consolidated income statement for those
periods.
|
||||||||||
| Ø |
MTM
adjustments on securities can result from a decline in the economic
value
of the securities (i.e., increased credit loss estimates reduce
expected
future cash flows), or from changes in market discount rates
(i.e., the
market requires a greater risk premium and/or interest rates
rise), or a
combination of both. A summary of the accounting rules regarding
MTMs is
provided below.
|
| Ø |
If
the change
in fair value for available-for-sale securities (AFS) is due
solely to
changes in market discount rates, then the entire MTM adjustment
is flowed
through our balance sheet as an adjustment to stockholders’ equity. These
adjustments can go back and forth (positive or negative) from
period to
period.
|
|
16
|
|
The
Redwood
Review
3rd
Quarter
2007
|
|
|
Mark-to-Market
Adjustments
|
| Ø |
If
the change
in fair value for AFS is accompanied by an adverse change in
projected
cash flows, then the entire MTM adjustment is flowed through
the income
statement. This is required even if the change in projected cash
flows is
small relative to the resulting MTM income statement charge.
We offer the
following example: Assume Redwood acquired a security for $100
and the
value of this acquisition was based on $150 of future expected
cash flows
discounted at 12%. If at the end of an accounting period, the
market value
of the security was $50 and that value was based on $149 of future
expected cash flows discounted at 25% (the prevailing market
rates), the
entire $50 change in value is considered “permanently impaired” for
accounting purposes. AFS deemed permanently impaired for accounting
purposes cannot be written back up through market valuation adjustments
in
our income statement. This does not mean the underlying security
could not
recover in economic or market value. If the economic value of
an impaired
security does recover, we would recognize this benefit through
higher
interest yields over time. It is often difficult to separate
with
precision how much of the change in fair value is driven by changes
in
expected cash flows versus changes in required market discount
rates, but
during periods of market illiquidity and uncertainty, the market
discount
rate component can be significant. Therefore, some of our securities
classified as permanently impaired for accounting purposes during
the
third quarter may eventually prove to have significant economic
value to
us.
|
| Ø |
All
changes
in fair value for trading securities or derivative instruments
flow
through the income statement. These adjustments can be either
positive or
negative from period to period.
|
| Ø |
The
table below details the total MTM adjustments by the underlying
collateral
type.
|
|
Total
Mark-To-Market Adjustments
|
||||||||||||||||
|
By
Underlying Collateral Type
|
||||||||||||||||
|
Three
Months Ended September 30, 2007
|
||||||||||||||||
|
($
in millions)
|
||||||||||||||||
|
|
|
|
|
|
|
|||||||||||
|
|
|
|
OREI
&
|
|
MTM
|
|||||||||||
|
|
IGS
|
CES
|
Derivatives
|
Total
|
Percent
(1)
|
|||||||||||
|
|
||||||||||||||||
|
Residential
|
||||||||||||||||
|
Prime
|
$
|
(82
|
)
|
$
|
(131
|
)
|
$
|
-
|
$
|
(213
|
)
|
(16
|
)%
|
|||
|
Alt-a
|
(197
|
)
|
(67
|
)
|
(13
|
)
|
(277
|
)
|
(22
|
)%
|
||||||
|
Subprime
|
(92
|
)
|
(11
|
)
|
(5
|
)
|
(108
|
)
|
(24
|
)%
|
||||||
| Residential total |
(371
|
)
|
(209
|
)
|
(18
|
)
|
(598
|
)
|
||||||||
|
|
||||||||||||||||
|
Commercial
|
(6
|
)
|
(56
|
)
|
-
|
(62
|
)
|
(11
|
)%
|
|||||||
|
CDO
|
(57
|
)
|
(9
|
)
|
-
|
(66
|
)
|
(26
|
)%
|
|||||||
|
Derivatives
|
-
|
-
|
(31
|
)
|
(31
|
)
|
||||||||||
|
|
||||||||||||||||
|
Total
mark-to-market adjustments
|
$
|
(434
|
)
|
$
|
(274
|
)
|
$
|
(49
|
)
|
$
|
(757
|
)
|
||||
|
Nine
Months Ended September 30, 2007
|
||||||||||||||||
|
($
in millions)
|
||||||||||||||||
|
|
|
|
|
|
|
|||||||||||
|
|
|
|
OREI
&
|
|
MTM
|
|||||||||||
|
|
IGS
|
CES
|
Derivatives
|
Total
|
Percent
(1)
|
|||||||||||
|
|
||||||||||||||||
|
Residential
|
||||||||||||||||
|
Prime
|
$
|
(100
|
)
|
$
|
(146
|
)
|
$
|
1
|
$
|
(245
|
)
|
(19
|
)%
|
|||
|
Alt-a
|
(234
|
)
|
(85
|
)
|
(28
|
)
|
(347
|
)
|
(29
|
)%
|
||||||
|
Subprime
|
(128
|
)
|
(18
|
)
|
(6
|
)
|
(152
|
)
|
(32
|
)%
|
||||||
| Residential total |
(462
|
)
|
(249
|
)
|
(33
|
)
|
(744
|
)
|
||||||||
|
|
||||||||||||||||
|
Commercial
|
(13
|
)
|
(101
|
)
|
-
|
(114
|
)
|
(20
|
)%
|
|||||||
|
CDO
|
(86
|
)
|
(11
|
)
|
-
|
(97
|
)
|
(36
|
)%
|
|||||||
|
Derivatives
|
-
|
-
|
(14
|
)
|
(14
|
)
|
||||||||||
|
|
|
|
|
|
|
|||||||||||
|
Total
mark-to-market adjustments
|
$
|
(561
|
)
|
$
|
(361
|
)
|
$
|
(47
|
)
|
$
|
(969
|
)
|
||||
|
(1)
This
percentage represents the MTMs taken as a percentage of the reported
market values at the beginning of the period, or purchase price
if
acquired during the period. It is intended to highlight the price
declines
by collateral type for the three and nine month periods ended
September
30, 2007. These price declines are for our specific portfolio
and may not
be indicative of price declines in the market in
general.
|
||||||||||||||||
|
The
Redwood
Review
3rd
Quarter
2007
|
|
17 |
|
|
Mark-to-Market
Adjustments
|
| Ø |
Under
our Acacia program we re-securitize real estate securities using
bankruptcy remote CDO entities that sell ABS (asset backed securities)
to
independent third-party debt investors. We typically retain an
equity
interest in the Acacia CDOs. This allows us to generate asset
management
fees and what we believe to be attractive assets for our portfolio.
Our
equity investments are entitled to the net cash flows (i.e.,
the net cash
flows generated by the assets after deducting the money owed
to the ABS
debt holders) of the Acacia entities. Our share of any credit
losses
generated by the underlying Acacia assets is capped for us at
the amount
of our net equity investment, with the remainder of losses borne
by the
ABS holders.
|
| Ø |
As
a hypothetical example, an Acacia CDO transaction might have
$300 million
of assets, $285 million of liabilities (ABS issued), and $15
million of
equity. If in any year the assets earned 6% or $18 million, and
the ABS
were paid interest of 5% or $14.25 million, our equity would
be entitled
to a distribution of $3.75 million in that year. In certain circumstances,
our equity cash distributions can be disrupted based on rating
agency
down-grades or due to a deterioration in collateral performance.
|
| Ø |
We
have ten Acacia CDO transactions outstanding. Our investment
in each of
these transactions are separate and independent, thus diminished
cash flow
generated by any one of our CDO equity investments would have
no effect on
our other CDO equity investments. During the three and nine months
ended
September 30, 2007, we collected $5.3 million and $14.6 million,
respectively, of cash flow distributions from our Acacia investments.
Currently, we are continuing to receive distributions from all
Acacias. We
are closely monitoring the four Acacia transactions issued since
August
2006 as further rating agency down-grades or further deterioration
in
collateral performance could disrupt cash distributions from
these Acacia
entities. During the three and nine months ended September 30,
2007, we
received cash distributions of $1.5 million and $3.4 million,
respectively, from these four Acacia entities (Acacia’s 10, 11, 12, and
option ARM).
|
| Ø |
We
believe the best measure of economic value for our Acacia equity
investment is the net present value of the future cash flow distributions,
though we would caution that in this environment it is particularly
difficult to predict future cash flows with much certainty given
the
potential for future rating agency down-grades and the uncertainties
around future credit performance and the problems in the housing
market
that we discussed above. Our calculation of the present value
of the
future cash flows (adjusted for projected credit losses) from
Acacia
entities discounted at 45% and 14% range from $55 million to
$145 million.
Due to the current market illiquidity for CDO equity, we would
expect that
the fair value of our Acacia investments to be on the lower end
of the
range rather than the higher end. Our initial cash investment
in these
Acacia transactions was $140 million. Cumulatively, we have received
cash
distributions of $27 million on our investments in these Acacia
entities.
In addition, we have received management fees of $8 million.
|
|
18
|
|
The
Redwood
Review
3rd
Quarter
2007
|
|
|
Mark-to-Market
Adjustments
|
| Ø |
The
assets, liabilities, and earnings from the Acacia entities are
consolidated for GAAP purposes with Redwood. Over time, the economic
and
GAAP results of Acacia will be the same. However, there can be
interim
periods when GAAP and economic losses diverge significantly.
This results
from the fact that under GAAP we are not permitted to adjust
the carrying
values of our Acacia liabilities until actual losses are passed
through to
debt holders or the securitization is called (which may not occur
for a
significant period of time), but we are required to mark-to-market
all of
the Acacia assets on a quarterly basis. This GAAP accounting
treatment
resulted in the carrying value of Acacia to be negative $580
million.
However, since the economic value of our equity investment cannot
be less
than zero, our September 30, 2007 consolidated GAAP book value
of $149
million understates the value of Acacia by at least $580 million.
|
| Ø |
The
divergence between economic and accounting results,
is highlighted by Acacia OA (option ARM) in the table below. We made an
initial $14
million cash investment. We have already recognized $20 million
of losses
through the income statement ($6 million more than our investment).
In
addition we have further reduced stockholders’ equity by $149 million for
negative MTM adjustments. Thus, our $14 million investment, in
which our
maximum loss is $14 million, is carried at a $155 million negative
book
value on our consolidated balance sheet at September 30,
2007.
|
|
Acacia
Balance Sheets
|
||||||||||||||||||||||||||||||||||
|
as
of September 30, 2007
|
||||||||||||||||||||||||||||||||||
|
($
in millions)
|
||||||||||||||||||||||||||||||||||
|
|
|
|
|
|
|
|
|
|
|
|
|
|||||||||||||||||||||||
|
|
Acacia
|
Acacia
|
Acacia
|
Acacia
|
Acacia
|
Acacia
|
Acacia
|
Acacia
|
Acacia
|
Acacia
|
|
|||||||||||||||||||||||
|
|
5
|
6
|
7
|
8
|
CRE1
|
9
|
10
|
11
|
OA
|
12
|
Total
|
|||||||||||||||||||||||
|
Issue
Date
|
Jul-04
|
Nov-04
|
Mar-05
|
Jul-05
|
Dec-05
|
Mar-06
|
Aug-06
|
Feb-07
|
May-07
|
Jun-07
|
Acacia
|
|||||||||||||||||||||||
|
|
|
|||||||||||||||||||||||||||||||||
|
Real
estate
investments
|
|
|||||||||||||||||||||||||||||||||
|
Current
face
|
$247
|
$283
|
$293
|
$288
|
$300
|
$301
|
$503
|
$499
|
$424
|
$484
|
$3,622
|
|||||||||||||||||||||||
|
Unamortized
discount, net
|
(6
|
)
|
(9
|
)
|
(8
|
)
|
(18
|
)
|
(32
|
)
|
(10
|
)
|
(43
|
)
|
(29
|
)
|
(5
|
)
|
(35
|
)
|
(195
|
)
|
||||||||||||
|
Designated
credit reserve
|
(2
|
)
|
(3
|
)
|
(2
|
)
|
(5
|
)
|
-
|
(3
|
)
|
(37
|
)
|
(32
|
)
|
-
|
(15
|
)
|
(99
|
)
|
||||||||||||||
|
Unrealized
(losses)
|
(26
|
)
|
(35
|
)
|
(33
|
)
|
(45
|
)
|
(41
|
)
|
(50
|
)
|
(88
|
)
|
(109
|
)
|
(149
|
)
|
(92
|
)
|
(668
|
)
|
||||||||||||
|
Other
investments
|
-
|
-
|
-
|
-
|
-
|
-
|
1
|
-
|
80
|
-
|
81
|
|||||||||||||||||||||||
|
Total
earning
assets
|
213
|
236
|
250
|
220
|
227
|
238
|
336
|
329
|
350
|
342
|
2,741
|
|||||||||||||||||||||||
|
Restricted
cash
|
17
|
15
|
18
|
12
|
6
|
6
|
5
|
5
|
14
|
25
|
123
|
|||||||||||||||||||||||
|
Other
assets
|
2
|
3
|
4
|
5
|
9
|
4
|
5
|
6
|
9
|
7
|
54
|
|||||||||||||||||||||||
|
Total
Assets
|
$232
|
$254
|
$272
|
$237
|
$242
|
$248
|
$346
|
$340
|
$373
|
$374
|
$2,918
|
|||||||||||||||||||||||
|
|
||||||||||||||||||||||||||||||||||
|
ABS
issued
|
$242
|
$269
|
$279
|
$250
|
$262
|
$277
|
$412
|
$472
|
$495
|
$458
|
$3,416
|
|||||||||||||||||||||||
|
Other
liabilities
|
2
|
8
|
10
|
2
|
4
|
4
|
7
|
3
|
33
|
9
|
82
|
|||||||||||||||||||||||
|
Total
Liabilities
|
244
|
277
|
289
|
252
|
266
|
281
|
419
|
475
|
528
|
467
|
3,498
|
|||||||||||||||||||||||
|
|
||||||||||||||||||||||||||||||||||
|
Initial
investment
|
8
|
8
|
11
|
18
|
14
|
11
|
29
|
5
|
14
|
22
|
140
|
|||||||||||||||||||||||
|
Cummulative
Earnings
|
10
|
8
|
5
|
13
|
7
|
8
|
(6
|
)
|
(27
|
)
|
(20
|
)
|
(21
|
)
|
(23
|
)
|
||||||||||||||||||
|
Cummulative
Distributions
|
(6
|
)
|
(6
|
)
|
(3
|
)
|
(4
|
)
|
(2
|
)
|
(2
|
)
|
(3
|
)
|
(1
|
)
|
-
|
-
|
(27
|
)
|
||||||||||||||
|
OCI
|
(24
|
)
|
(33
|
)
|
(30
|
)
|
(42
|
)
|
(43
|
)
|
(50
|
)
|
(93
|
)
|
(112
|
)
|
(149
|
)
|
(94
|
)
|
(670
|
)
|
||||||||||||
|
Total
Equity
|
(12
|
)
|
(23
|
)
|
(17
|
)
|
(15
|
)
|
(24
|
)
|
(33
|
)
|
(73
|
)
|
(135
|
)
|
(155
|
)
|
(93
|
)
|
(580
|
)
|
||||||||||||
|
|
||||||||||||||||||||||||||||||||||
|
Total
Liabilities & Equity
|
$232
|
$254
|
$272
|
$237
|
$242
|
$248
|
$346
|
$340
|
$373
|
$374
|
$2,918
|
|||||||||||||||||||||||
|
|
||||||||||||||||||||||||||||||||||
|
Summary
of
Cash Activity
|
||||||||||||||||||||||||||||||||||
|
Initial
Investment
|
($8
|
)
|
($8
|
)
|
($11
|
)
|
($18
|
)
|
($14
|
)
|
($11
|
)
|
($29
|
)
|
($5
|
)
|
($14
|
)
|
($22
|
)
|
($140
|
)
|
||||||||||||
|
Cash
received
*
|
6
|
6
|
3
|
4
|
2
|
2
|
3
|
1
|
-
|
-
|
27
|
|||||||||||||||||||||||
|
|
|
|
|
|
|
|
|
|
|
|
|
|||||||||||||||||||||||
|
Net
cash flow to date
|
($2
|
)
|
($2
|
)
|
($8
|
)
|
($14
|
)
|
($12
|
)
|
($9
|
)
|
($26
|
)
|
($4
|
)
|
($14
|
)
|
($22
|
)
|
($113
|
)
|
||||||||||||
|
The
Redwood
Review
3rd
Quarter
2007
|
|
19 |
|
|
Mark-to-Market
Adjustments
|
| Ø |
With
respect to the four Acacia transactions that currently concern
us, our net
cash investment as of September 30, 2007 was $66 million. From
a GAAP
income statement standpoint, we have already collectively recognized
losses of $74 million. Therefore, we have already effectively
taken $8
million of write-offs through the income statement in excess
of the
maximum loss value of these
investments.
|
| Ø |
On
January 1, 2008, FASB Statement No. 159, The Fair Value Option
for
Financial Assets and Financial Liabilities Including an Amendment
of FASB
Statement No. 115 (FAS 159) becomes effective. If adopted by
us, FAS 159
will enable us to mark-to-market the Acacia liabilities. We are
considering adopting FAS 159 for valuing the assets and liabilities
owned
by Acacia on January 1, 2008. These rules may allow us to better
conform
our book value and GAAP income results more closely to what we
believe
economic reality to be. However, we do not believe the new rules
will
address all of the related mark-to-market challenges and our
reported
numbers are likely to remain
volatile.
|
| Ø |
The
following table details Acacia’s exposure to different collateral types
owned by Acacia entities.
|
|
Acacia
Balance Sheet Information
|
||||||||||||||||||||||||||||||||||
|
Underlying
Collateral Type
|
||||||||||||||||||||||||||||||||||
|
as
of September 30, 2007
|
||||||||||||||||||||||||||||||||||
|
($
in millions)
|
||||||||||||||||||||||||||||||||||
|
|
|
|
|
|
|
|
|
|
|
|
|
|||||||||||||||||||||||
|
|
Acacia
|
Acacia
|
Acacia
|
Acacia
|
Acacia
|
Acacia
|
Acacia
|
Acacia
|
Acacia
|
Acacia
|
|
|||||||||||||||||||||||
|
|
5
|
6
|
7
|
8
|
CRE1
|
9
|
10
|
11
|
OA
|
12
|
|
|||||||||||||||||||||||
|
Issue
Date
|
Jul-04
|
Nov-04
|
Mar-05
|
Jul-05
|
Dec-05
|
Mar-06
|
Aug-06
|
Feb-07
|
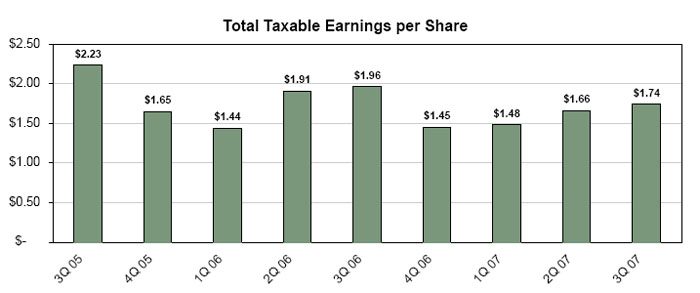
May-07
|
Jun-07
|
Total
|
|||||||||||||||||||||||
|
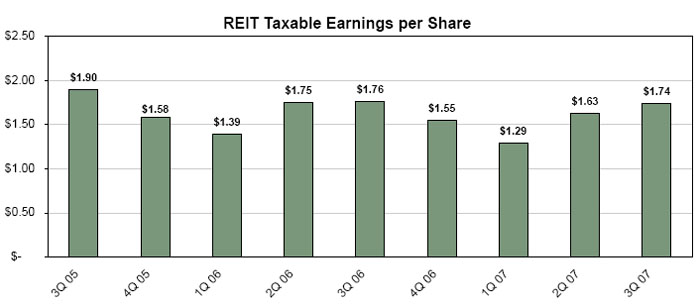
|
|
|||||||||||||||||||||||||||||||||
|
Resi
IGS
|
|
|||||||||||||||||||||||||||||||||
|
Prime
Sequoia
|
$15
|
$15
|
$11
|
$6
|
$1
|
$3
|
$4
|
$3
|
$8
|
$21
|
$87
|
|||||||||||||||||||||||
|
Prime
Other
|
43
|
57
|
73
|
77
|
52
|
133
|
115
|
52
|
9
|
60
|
671
|
|||||||||||||||||||||||
|
Alt-a
|
27
|
18
|
25
|
23
|
5
|
23
|
44
|
124
|
244
|
125
|
658
|
|||||||||||||||||||||||
|
Subprime
|
62
|
81
|
66
|
8
|
-
|
12
|
11
|
31
|
2
|
39
|
312
|
|||||||||||||||||||||||
|
|
||||||||||||||||||||||||||||||||||
|
Resi
CES
|
||||||||||||||||||||||||||||||||||
|
Prime
Sequoia
|
3
|
5
|
4
|
7
|
-
|
2
|
5
|
-
|
-
|
-
|
26
|
|||||||||||||||||||||||
|
Prime
Other
|
28
|
23
|
16
|
42
|
-
|
25
|
102
|
26
|
-
|
15
|
277
|
|||||||||||||||||||||||
|
Alt-a
|
1
|
6
|
3
|
16
|
-
|
3
|
3
|
25
|
-
|
10
|
67
|
|||||||||||||||||||||||
|
Subprime
|
-
|
-
|
-
|
-
|
-
|
-
|
5
|
4
|
-
|
3
|
12
|
|||||||||||||||||||||||
|
|
||||||||||||||||||||||||||||||||||
|
COMM
IGS
|
12
|
11
|
8
|
9
|
56
|
3
|
1
|
-
|
-
|
3
|
103
|
|||||||||||||||||||||||
|
COMM
CES
|
2
|
5
|
16
|
24
|
86
|
15
|
29
|
26
|
-
|
35
|
238
|
|||||||||||||||||||||||
|
COMM
Loans
|
4
|
-
|
9
|
4
|
9
|
-
|
-
|
-
|
-
|
-
|
26
|
|||||||||||||||||||||||
|
CDO:
CMBS
|
3
|
2
|
2
|
-
|
18
|
12
|
10
|
20
|
7
|
9
|
83
|
|||||||||||||||||||||||
|
CDO:
RMBS
|
13
|
13
|
17
|
4
|
-
|
7
|
6
|
18
|
-
|
22
|
100
|
|||||||||||||||||||||||
|
GIC
|
-
|
-
|
-
|
-
|
-
|
-
|
-
|
-
|
80
|
-
|
80
|
|||||||||||||||||||||||
|
Other
|
-
|
-
|
-
|
-
|
-
|
-
|
1
|
-
|
-
|
-
|
1
|
|||||||||||||||||||||||
|
|
|
|
|
|
|
|
|
|
|
|
|
|||||||||||||||||||||||
|
Totals
|
$213
|
$236
|
$250
|
$220
|
$227
|
$238
|
$336
|
$329
|
$350
|
$342
|
$2,741
|
|||||||||||||||||||||||
| Ø |
Net interest income earned on Acacia’s 5-9, and Acacia CRE 1 was $7 million and $21 million, respectively, for the three
month and nine month periods ended September 30, 2007. After market valuation adjustments, on Acacia’s
5-9 and CRE 1 our net loss was $3 million and our net income was $9 million, respectively, for the three month and nine month periods ended September
30, 2007.
|
| Ø |
Net interest income earned on Acacia’s 10, 11, 12, and OA 1 was $5 million and $13 million, respectively, for the three
month and nine month periods ended September 30, 2007. Our net loss, after market valuation adjustments, on Acacia’s 10,
11, 12, and OA 1 was $70 million and $74 million, respectively, for the three month and nine month periods ended
September 30, 2007.
|
|
20
|
|
The
Redwood
Review
3rd
Quarter
2007
|
|
|
Mark-to-Market
Adjustments
|
| Ø |
Our
fair market values reflect what we believe we could realize if
we chose to
sell our securities. However, most of our securities (in particular
our
CES and CDO investments) are generally illiquid. Consequently,
establishing fair market values for these securities is inherently
subjective and is dependent upon modeling assumptions and indications
of
value obtained from brokers or
dealers.
|
| Ø |
As
a consequence of limited trading visibility during the quarter
and the
significant uncertainties regarding credit loss levels, the fair
market
values underpinning our market valuation adjustments are based
on facts
that are far less certain than has historically been the case
in prior
periods. We expect that the market valuations will continue to
be highly
volatile over time.
|
| Ø |
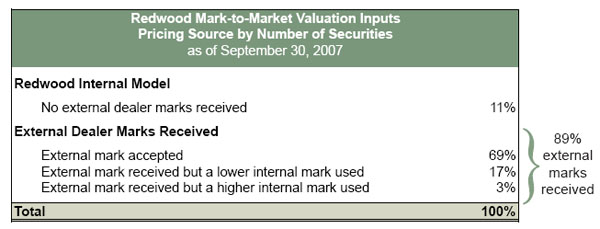
To
establish fair market values at September 30, 2007, we relied
heavily on
indications of value (marks) from dealers, and to a lesser extent,
on
values derived from our internal cash flow modeling. We received
third-party dealer marks on 89% of the number of securities reflected
on
our balance sheet, and with respect to the remaining 11% for
which we did
not receive third party dealer marks, we used our internal model
to
establish fair value.
|
| Ø |
We
compared all of the dealers’ marks to our internal model for
reasonableness. As a result of this process, we accepted some
of these
marks as an indication of fair value and rejected others. If
we rejected
the dealer mark, we used our internal model. The table below
details the
breakdown of internal and external inputs used.
|
| Ø |
In
only 3% of the cases in which we had a third-party dealer mark
did we
value securities above the dealer mark. For these 3%, the difference
between the lower dealer marks and our higher internal marks
was $9.6
million at September 30, 2007.
|
| Ø |
Our
internal pricing model calculates fair value based on the net
present
value of projected future cash flows of each individual security.
This
calculation is dependent on a number of assumptions including:
future
interest rates, prepayment rates, market discount rates, and
timing and
amount of future credit losses. The valuation parameters of these
models
are calibrated to what we believe are bid-side fair market
assumptions.
|
| Ø |
The
dealers we received marks from are active participants in the
capital
markets. However, it is likely that most of the dealer marks
we received
this period were based on their pricing models and not on actual
trade
information. Their indications of value are based on a variety
of
assumptions they do not share and may prove to be
inaccurate.
|
|
The
Redwood
Review
3rd
Quarter
2007
|
|
21 |
 |
GAAP
Earnings and Core Earnings
|
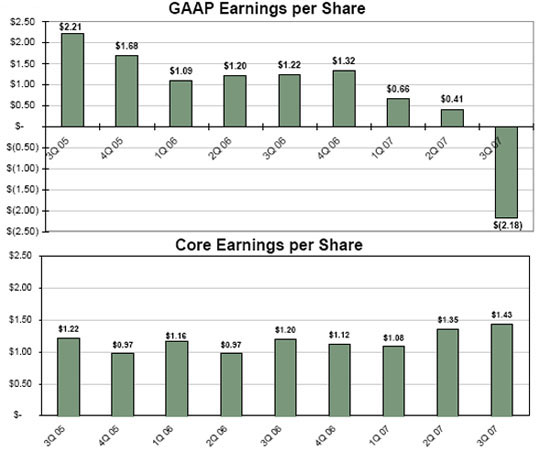
| Ø |
GAAP
loss per share for the third quarter of $2.18 per share was primarily
due
to $103 million negative unrealized mark-to-market valuation
adjustments.
Net interest income for the third quarter was
strong.
|
| Ø |
For
the past year and a half, quarterly core earnings have ranged
from $0.97
to $1.43 per share. Our third quarter core earnings of $1.43
per share
were at the top of this
range.
|
|
|
For
the Quarter Ended
|
|||||||||
|
GAAP
Earnings
|
Sep-07
|
Jun-07
|
Sep-06
|
|||||||
|
|
|
|||||||||
|
Net
interest
income
|
$53,594
|
$53,901
|
$48,976
|
|||||||
|
|
||||||||||
|
Operating
expenses
|
(11,732
|
)
|
(12,772
|
)
|
(13,455
|
)
|
||||
|
Gains
(losses) on sales
|
(1,460
|
)
|
1,428
|
4,967
|
||||||
|
Gains
(losses) on calls
|
3,284
|
1,310
|
723
|
|||||||
|
Valuation
adjustments, net
|
(102,766
|
)
|
(29,430
|
)
|
(5,257
|
)
|
||||
|
Provision
for
income taxes
|
(1,837
|
)
|
(3,021
|
)
|
(3,538
|
)
|
||||
|
|
||||||||||
|
GAAP
earnings (loss)
|
($60,917
|
)
|
$11,416
|
$32,416
|
||||||
|
|
||||||||||
|
GAAP
earnings
(loss) per share
|
$
(2.18
|
)
|
$
0.41
|
$
1.22
|
||||||
|
|
For
the Quarter Ended
|
|||||||||
|
Core
Earnings
|
Sep-07
|
Jun-07
|
Sep-06
|
|||||||
|
|
|
|||||||||
|
Net
interest
income
|
$53,594
|
$53,901
|
$48,976
|
|||||||
|
|
||||||||||
|
Operating
expenses
|
(11,732
|
)
|
(12,772
|
)
|
(13,455
|
)
|
||||
|
Gains
(losses) on sales
|
-
|
-
|
-
|
|||||||
|
Gains
(losses) on calls
|
-
|
-
|
-
|
|||||||
|
Valuation
adjustments, net
|
-
|
-
|
-
|
|||||||
|
Provision
for
income taxes
|
(1,837
|
)
|
(3,021
|
)
|
(3,538
|
)
|
||||
|
|
||||||||||
|
Core
earnings (loss)
|
$40,025
|
$38,108
|
$31,983
|
|||||||
|
|
||||||||||
|
Core
earnings
(loss) per share
|
$
1.43
|
$
1.35
|
$
1.20
|
|||||||
|
22
|
|
The
Redwood
Review
3rd
Quarter
2007
|
|
|
GAAP
Earnings and Core
Earnings
|
|
Financial
|
| Ø |
Net
interest income for the third quarter of 2007 was similar to
net interest
income in the second quarter of 2007 and $5 million higher
than the third
quarter of 2006. Higher net interest income earnings from our
securities
more than offset a decrease in net interest income from a decline
in
balance of the consolidated residential loan portfolio. The
average
balance of this residential loan portfolio continued to decline
due to
high prepayments on adjustable-rate residential loans acquired
and
securitized under our Sequoia
program.
|
| Ø |
Our
residential CES portfolio continues to benefit from strong credit
performance and from rapid prepayments on securities backed by
ARM loans.
The yield for the residential CES portfolio was 22% in the third
quarter
of 2007, 24% in the second quarter of 2007, and 22% in the third
quarter
of 2006. Prepayments have slowed by quarter end, which may lower
yields
going forward.
|
| Ø |
Operating
expenses in the third quarter of 2007 were $1 million lower than
the
second quarter of 2007 and $2 million lower in comparison to
third quarter
of last year. The primary reason for this decline was lower bonus
accruals.
|
| Ø |
The
largest factor causing a decline in our GAAP earnings was $103
million of
negative unrealized mark-to-market (MTM) valuation adjustments.
These
negative adjustments were $73 million greater than the second
quarter of
2007 and $98 million greater than the third quarter of 2006.
The decrease
in fair value reflects the overall market decline in prices for
real
estate securities (particularly, securities backed by subprime
and low
quality alt-a loans) that occurred during the third quarter of
2007. Of
the $103 million income statement MTM write-downs taken during
the third
quarter, $83 million were impairments as defined by GAAP and
$20 million
were changes in fair value on assets accounted for as trading
investments.
|
|
The
Redwood
Review
3rd
Quarter
2007
|
|
23 |
|
|
Taxable
Income
|
| · |
Total
taxable income for the third quarter of 2007 was strong at $1.74
per
share, an increase from the prior quarter due to continued strong
performance with relatively few credit losses on our
investments.
|
| · |
REIT
taxable income remained strong at $1.74 per share and continues
to exceed
our regular quarterly dividend by a comfortable
margin.
|
| 24 |
|
The
Redwood
Review
3rd
Quarter
2007
|
|
|
Taxable
Income
|
|
Financial
|
| Ø |
Total
taxable income was $49 million, or $1.74 per share, in the third
quarter
of 2007. This was an increase from the total taxable income we
generated
in the prior quarter of $46 million, or $1.66 per share. The
increase was
due to the continued strong performance with relatively few credit
losses
on our investments.
|
| Ø |
Our
REIT taxable income was $1.74 per share in the third quarter
of 2007. This
was higher than second quarter taxable income of $1.63 for the
same
reasons total taxable income was
higher.
|
| Ø |
Our
taxable income continues to be higher than our GAAP income as
we are not
permitted to establish credit reserves for tax. As a result,
we amortize
more of our CES discount into income for tax and recognize a
higher yield
until credit losses occur. The cumulative difference at September
30, 2007
in the discount amortization between tax and GAAP for residential,
commercial, and CDO CES was $138
million.
|
| Ø |
Another
reason for the difference between tax and GAAP income is that
we do not
recognize changes in market values of assets for tax until the
asset is
sold. Consequently, the negative $103 million of unrealized market
valuation adjustments included in our GAAP earnings this quarter
were not
included in our tax earnings.
|
| Ø |
Total
taxable income and REIT taxable income were reduced by $2 million
($0.08
per share) in the third quarter of 2007 as a result of deductions
for
actual credit losses. These deductions were less than the actual
principal
losses incurred on the underlying loans of $6 million, as we
own most of
our credit-sensitive assets at a tax basis that is substantially
less than
par (principal) value. We currently expect that realized credit
losses
will increase substantially relative to our recent experience.
All
realized credit losses, after adjusting for our tax basis in
the assets we
own, will reduce our dividend distribution
requirements.
|
|
The
Redwood
Review
3rd
Quarter
2007
|
|
25 |
|
|
Book
Value per Share
|
| · |
As
discussed earlier in this Redwood Review, GAAP book value declined
by 83%,
or $26.18 per share, during the third quarter of 2007, from $31.50
per
share to $5.32 per share, primarily as a result of declining
values for
assets owned by Acacia entities that are consolidated on our
balance sheet
and are marked-to-market for balance sheet
purposes.
|
| · |
Under
GAAP, we are required to carry Acacia’s real estate securities on our
balance sheet at their fair market value, but we are not permitted
to
adjust paired ABS issued liabilities to fair market value. Had
we been
able to mark-to-market Acacia’s liabilities, our reported GAAP book value
would be significantly higher.
|
| · |
Core
book value declined by 8% during the third quarter of 2007 from
$34.40 per
share to $31.58 per share as a result of the reported loss during
the
quarter and $0.75 per share dividend. These were only partially
offset by
accretive stock issuance through our direct stock purchase and
dividend
reinvestment plan.
|
| · |
As
previously described in the Quarterly Overview, if we carried
our
investments in Acacia at a book value of $55 million instead
of the
negative $580 million reported under GAAP, our adjusted book
value at
September 30, 2007 would have been $784 million, or $28.01 per
share. Adjusted book value is a non-GAAP measure (see reconciliation to GAAP book value below). We
believe that $28.01 represents a good overall quarter end per
share
estimate of the fair market value of all of our financial assets,
less the
fair value of all our liabilities.
|
| · |
Asset
market values, especially for 2006 and 2007 RMBS and CDO securities
backed
by subprime loans, continued to decline early into the fourth
quarter.
Unless market values recover, we could report a negative overall
book
value for GAAP purposes at December 31, 2007. We are currently
considering
adopting FAS 159 for our Acacia assets and liabilities as of
January 1,
2008. These rules will allow us to better conform our GAAP book
value and
what we believe economic reality to be.
|
|
26
|
|
The
Redwood
Review
3rd
Quarter
2007
|
|
|
Book
Value per Share
|
|
Financial
|
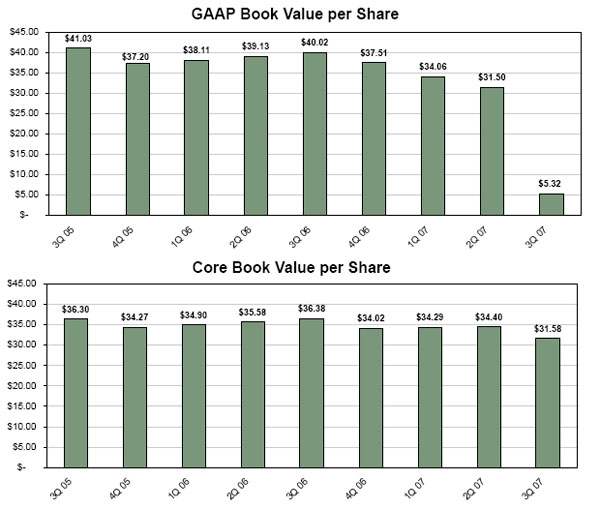
| Ø |
Adjusted
book value is calculated as follows ($ millions):
|
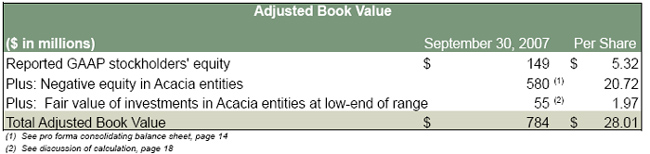
| Ø |
The
difference between core book value of $31.58 per share and
GAAP book value
of $5.32 per share at September 30, 2007 was cumulative mark-to-market
balance sheet adjustments for GAAP of negative $735 million
at
quarter-end.
|
| Ø |
Book
value per share growth generally is not a direct indicator
of our market
value or an indicator of the returns available to our shareholders.
If you
had acquired Redwood stock at our initial public offering in
August 1995
and had reinvested all dividends back into Redwood stock, your
compounded
return as a shareholder would have been 16% per year through
September 30,
2007. Future results will
vary.
|
|
The
Redwood
Review
3rd
Quarter
2007
|
|
27 |
|
|
Return
on Equity
|
| · |
During
the third quarter of 2007, our adjusted return on equity was
negative 26%.
The return was significantly lower in the past three quarters
primarily
due to the amount of unrealized market valuation adjustments
included in
our GAAP earnings.
|
| · |
Core
return on equity (core earnings divided by core equity) was 17%
for the
third quarter.
|
| · |
Over
the long term, we expect to be able to generate annual adjusted
returns on
equity between 11% and 18%.
|
| 28 |
|
The
Redwood Review
3rd
Quarter 2007
|
|
|
Return
on Equity
|
|
Financial
|
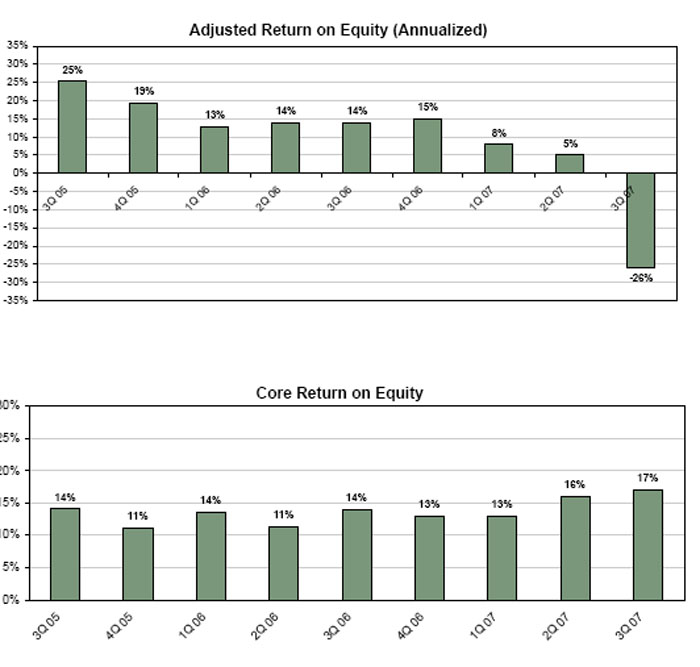
|
The
Redwood
Review
3rd
Quarter
2007
|
|
29
|
|
|
Dividends
|
| · |
Our
current regular dividend rate for 2007 was $0.75 per share
per quarter. We
have announced our Board’s intention to maintain the regular dividend at
$0.75 per quarter.
|
| · |
On
November 5, 2007, our Board of Directors declared a 2007 special
dividend
of $2.00 per share.
|
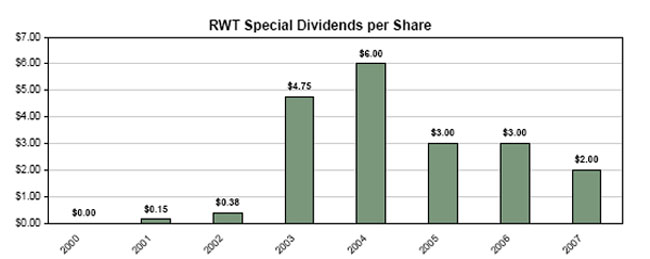
|
30
|
|
The
Redwood
Review
3rd
Quarter
2007
|
|
|
Dividends
|
|
Financial
|
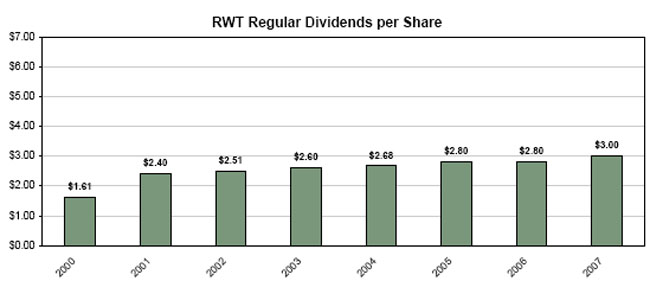
| · |
Total
dividend distributions over the last four quarters were $5.95 per
share.
Assuming the November 2, 2007 Redwood stock price of $25.55, the
indicated
dividend yield would be 23.3% based on the last twelve months of
dividends
and would be 11.7% based on the current regular dividend rate of
$3.00 per
share.
|
| · |
We
generally distribute 100% of REIT capital gains income and 90%
of REIT
ordinary income, retaining 10% of the ordinary REIT income. We
generally
retain 100% of the after-tax income we generate in taxable subsidiaries.
|
| · |
Based
on our estimates of REIT taxable income through the third quarter
of 2007,
at quarter end, we had $103 million ($3.69 per share) undistributed
REIT
taxable income that we anticipate distributing in 2007 and 2008.
|
| · |
On
November 5, 2007, our Board of Directors declared a 2007 special
dividend
of $2.00 per share, payable on December 7, 2007 to stockholders
of record
on November 26, 2007.
|
| · |
As
in prior years, we intend to defer the distribution of a portion
of REIT
taxable income earned in 2007 until 2008. Based on the number of
currently
outstanding shares, we expect the amount of deferred 2007 taxable
income
to exceed three quarters of dividends at our anticipated 2008 regular
dividend rate.
|
|
The
Redwood
Review
3rd
Quarter
2007
|
|
31 |
 |
Residential
Real Estate Securities
|
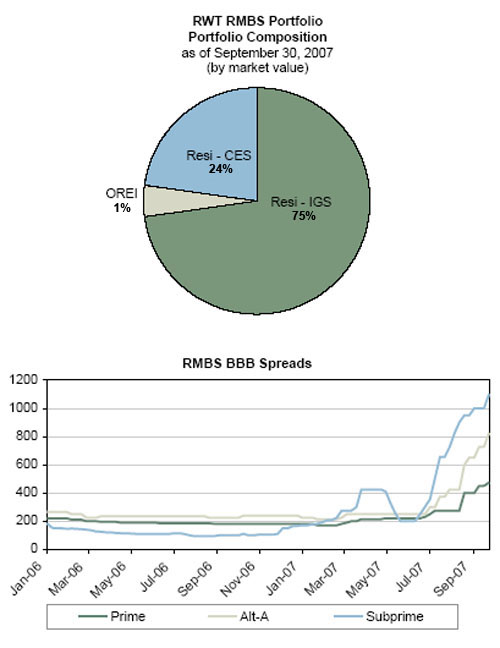
|
32
|
|
The
Redwood
Review
3rd
Quarter
2007
|
|
|
Residential
Real Estate Securities
|
|
Residential
|
| · |
Total
residential securities declined by 22% in the third quarter from
$2.9
billion to $2.3 billion as a result of $565 million of market
value
declines, $178 million of sales, $154 million of acquisitions,
$89 million
of calls and principal pay downs, and $20 million of discount
amortization.
|
| · |
Of
the $2.2 billion residential securities consolidated at September
30,
2007, $2.0 billion were financed through re-securitization via
Acacia CDO
transactions and $0.2 billion were financed with Redwood debt
and
capital.
|
| · |
Future
residential IGS investment will largely depend on the availability
and
pricing of future Acacia CDO financing. Given the current state
of the CDO
market, we will look to other potential sources of financing,
such as
Redwood debt or capital, to fund acquisitions, or else significantly
slow
the pace of our IGS acquisitions from our levels of the past
few years.
|
| · |
Overall
our CES portfolio backed by prime assets as well as our alt-a
option ARM
loans continue to perform better than, or within, our range of
expectations. Prime represents 77% and alt-a option ARMS represent
20% of
our residential CES portfolio by market value. At September 30,
2007, our
credit reserves associated with these securities were $260 million
for
prime and $176 million for alt-a option
ARMs.
|
| · |
Credit
performance on alt-a securities backed by hybrids is now worse
than we had
projected. These securities represent less than 1% of our total
residential portfolio.
|
|
The
Redwood
Review
3rd
Quarter
2007
|
|
33 |
|
|
Residential
Real Estate Securities
|
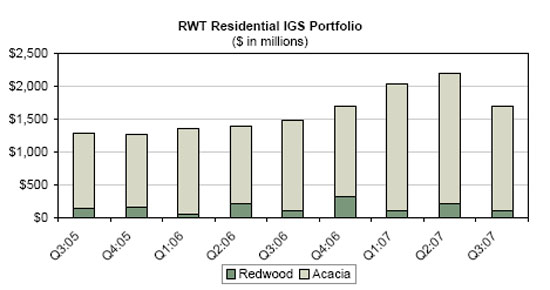
|
RWT
Residential IGS Portfolio
|
|||||||||||||
|
Activity
|
|||||||||||||
|
as
of
September 30, 2007
|
|||||||||||||
|
(by
market
value, $ in millions)
|
|||||||||||||
|
|
Prime
|
Alt-A
|
Subprime
|
Total
|
|||||||||
|
Market
Value 6/30/07
|
$870
|
$855
|
$438
|
$2,163
|
|||||||||
|
Acquisitions
|
47
|
38
|
68
|
153
|
|||||||||
|
Moved
due to
ratings action
|
5
|
-
|
(22
|
)
|
(17
|
)
|
|||||||
|
Transfers
to
/ from other portfolios
|
(17
|
)
|
17
|
-
|
-
|
||||||||
|
Sales
|
(128
|
)
|
-
|
(50
|
)
|
(178
|
)
|
||||||
|
Principal
payments
|
(21
|
)
|
(9
|
)
|
(17
|
)
|
(47
|
)
|
|||||
|
Discount
amortization
|
2
|
-
|
-
|
2
|
|||||||||
|
Gains
on
sales/calls
|
(3
|
)
|
-
|
-
|
(3
|
)
|
|||||||
|
Net
mark-to-market adjustment
|
(82
|
)
|
(197
|
)
|
(92
|
)
|
(371
|
)
|
|||||
|
Market
Value 9/30/07
|
$673
|
$704
|
$325
|
$1,702
|
|||||||||
|
34
|
|
The
Redwood
Review
3rd
Quarter
2007
|
|
|
Residential
Real Estate Securities
|
|
Residential
|
| Ø |
Our
consolidated residential IGS portfolio decreased by $0.5 billion
in the
third quarter from $2.2 billion to $1.7 billion. By collateral
type, prime
declined by $197 million (or 23%), alt-a by $151 million (or 18%),
and
subprime by $113 million (or 26%).
|
| Ø |
The
majority of our residential IGS acquisitions for the quarter were
reinvestments for our existing Acacia securitizations. These acquisitions
were 61% prime, 28% alt-a, and 11% subprime by credit tier and
29% option
ARMs, 51% hybrids, and 19% fixed-rate by interest rate
type.
|
| Ø |
Interest
income generated by residential IGS was $37 million for the third
quarter.
The yield for the third quarter was 7%, consistent with the previous
quarter.
|
| Ø |
Net
discount amortization income (a component of interest income) for
the
third quarter was $2 million. At quarter-end, our net discount
balance for
these assets was $83 million, giving us an average amortized balance
sheet
cost basis for residential IGS of 96.00% of principal
value.
|
| Ø |
Our
subprime IGS portfolio declined by $113 million (or 26%) to $325
million
due mainly to market value declines of $92 million. Of this $92
million
decline, $86 million was on assets owned by Acacia CDO entities.
|
| Ø |
Additional
information on our residential IGS can be found in Tables 9, 10,
and 18 of
the Appendix.
|
|
The
Redwood
Review
3rd
Quarter
2007
|
|
35
|
|
|
Residential
Real Estate Securities
|

|
RWT
Residential CES Portfolio
|
|||||||||||||
|
Activity
|
|||||||||||||
|
as
of
September 30, 2007
|
|||||||||||||
|
(by
market
value, $ in millions)
|
|||||||||||||
|
|
Prime
|
Alt-A
|
Subprime
|
Total
|
|||||||||
|
Market
Value 6/30/07
|
$570
|
$172
|
$3
|
$745
|
|||||||||
|
Acquisitions
|
1
|
-
|
-
|
1
|
|||||||||
|
Moved
due to
ratings action
|
(5
|
)
|
-
|
22
|
17
|
||||||||
|
Transfers
to
/ from other portfolios
|
(11
|
)
|
11
|
-
|
-
|
||||||||
|
Sales
|
-
|
-
|
-
|
-
|
|||||||||
|
Principal
payments
|
(34
|
)
|
(8
|
)
|
-
|
(42
|
)
|
||||||
|
Discount
amortization
|
16
|
3
|
-
|
19
|
|||||||||
|
Gains
on
sales/calls
|
3
|
-
|
-
|
3
|
|||||||||
|
Net
mark-to-market adjustment
|
(131
|
)
|
(67
|
)
|
(12
|
)
|
(210
|
)
|
|||||
|
Market
Value 9/30/07
|
$409
|
$111
|
$13
|
$533
|
|||||||||
|
36
|
|
The
Redwood
Review
3rd
Quarter
2007
|
|
|
Residential
Real Estate Securities
|
|
Residential
|
| Ø |
Our
residential CES portfolio decreased by $212 from $745 million to
$533
million during the quarter.
|
| Ø |
At
September 30, 2007, $177 million residential CES were financed
with equity
and $356 million were financed through our Acacia CDO
program.
|
| Ø |
The
balance of residential loans underlying our residential CES decreased
by
$8 billion from $220 billion to $212 billion during the third
quarter.
|
| Ø |
Interest
income generated by residential CES was $39 million for the third
quarter.
The yield for the third quarter was 22%.
|
| Ø |
Prepayment
speeds on these loans underlying our residential CES are slowing
down in
general, which may reduce the yields we recognize on these assets
from
current levels.
|
| Ø |
Principal
value credit losses for loans underlying CES were $6.1 million
for the
quarter, which were the same as credit losses in the previous quarter.
As
assets season, we expect losses to increase substantially in percentage
terms. Cumulative losses and the current loss rate remain lower
than our
original pricing expectations.
|
| Ø |
The
loans underlying our prime CES experienced a principal value credit
loss
of $2.8 million - an annualized rate of loss of less than one basis
point
per year. The loans underlying our alt-a CES experienced a principal
value
credit loss of $3.1 million.
|
| Ø |
For
tax purposes, realized credit losses were $2.3 million ($0.08 per
share)
for residential CES for the third quarter compared to a $2.2 million
($0.08 per share) in the second quarter. This deduction is less
than the
principal value losses incurred on the underlying loans of $6 million,
as
we own most of our credit-sensitive assets at a tax basis that
is
substantially less than par (principal) value.
|
| Ø |
Our
GAAP credit reserves for residential CES were $451 million ($16.11
per
share) at September 30, 2007, a decrease of $2 million for the
quarter. We
realized $6 million of losses during the quarter and had few acquisitions.
|
| Ø |
The
balance of seriously delinquent loans underlying prime residential
CES
increased from $589 million to $844 million during the quarter,
an
increase from 0.17% to 0.25%, respectively, of original balances
and 0.30%
to 0.45% of current balances, respectively. Overall, these increases remain
in line
with normal seasoning and our initial modeling
expectations.
|
| Ø |
Securities
backed by option ARM and traditional ARM loans continued to prepay
faster
than our original expectations at a weighted average CPR of 40%.
These
securities represent 41% of our prime CES and they are priced and
structured to benefit from fast prepayment speeds in addition to
low
losses.
|
|
The
Redwood
Review
2nd
Quarter
2007
|
|
37
|
|
|
Residential
Real Estate Securities
|
| Ø |
Securities
backed by hybrid and fixed-rate mortgages represent 59% of our
prime
portfolio. The loans underlying these securities prepaid at a weighted
average CPR of 12% in the third quarter.
|
| Ø |
Our
residential alt-a CES portfolio declined by $61 million during
the third
quarter. Option ARM collateral makes up 95% of this portfolio by
market
value.
|
| Ø |
We
acquire alt-a securities backed by option ARMs with loss expectations
that
are significantly greater than we expect for our prime hybrid CES.
To
date, the performance of our CES backed by option ARMs continues
to be
better than our expectations.
|
| Ø |
The
balance of seriously delinquent loans underlying alt-a residential
CES
increased from $399 million to $642 million during the quarter,
an
increase from 1.04% to 1.60% of original balances, respectively,
and 1.95%
to 3.10% of current balances,
respectively.
|
| Ø |
The
$10 million increase of our subprime CES portfolio to $13 million
was due
to the re-categorization of downgraded securities from IGS to CES.
Our
subprime CES portfolio has limited seasoning; however, the early
credit
performance is disappointing relative to our initial
expectations.
|
| Ø |
Additional
information on our residential CES can be found in Tables 9, 10,
11, and
12 of the Appendix.
|
|
38
|
|
The
Redwood
Review
3rd
Quarter
2007
|
|
|
Residential
Real Estate Securities
|
|
Residential
|
| Ø |
Other
real estate investments (OREI) are assets that we mark-to-market
for
income statement purposes, because they may otherwise be deemed
to contain
embedded derivatives for accounting purposes under FAS 155. We
expect to
acquire additional OREI assets.
|
| Ø |
OREI
is a new reporting category we established in the first quarter
of 2007.
Total OREI at September 30, 2007 was $25 million. This included
$15
million net interest margin securities (NIMs), $8 million residuals,
and
$2 million IOs.
|
| Ø |
Residuals
are first-loss securities that are not rated by a rating agency.
The value
of residual securities can vary widely and is highly dependent
on
prepayment speeds. The value is also dependent on the level and
timing of
credit losses, and often is not as sensitive to losses as it
is to
prepayment speeds. These securities perform poorly when prepayments
are
fast and losses are higher than
expected.
|
| Ø |
By
market value, our OREI was 8% prime, 64% alt-a, and 28% subprime
at
September 30, 2007.
|
| Ø |
Mark-to-market
charges in our OREI portfolio were negative $6 million for the
quarter and
were included in our income statement. Valuation declines were
a result of
credit performance below our expectations and a general spread
widening in
the mortgage market. Our total reported return equals the cash
income and
any change in market value and will continue to be
volatile.
|
| Ø |
Our
NIMs are structured in such a way that they mature quickly (typically
in
less than two years). The majority of the NIMs have an investment-grade
rating.
|
|
The
Redwood
Review
3rd
Quarter
2007
|
|
39
|
|
|
Residential
Real Estate Securities
|
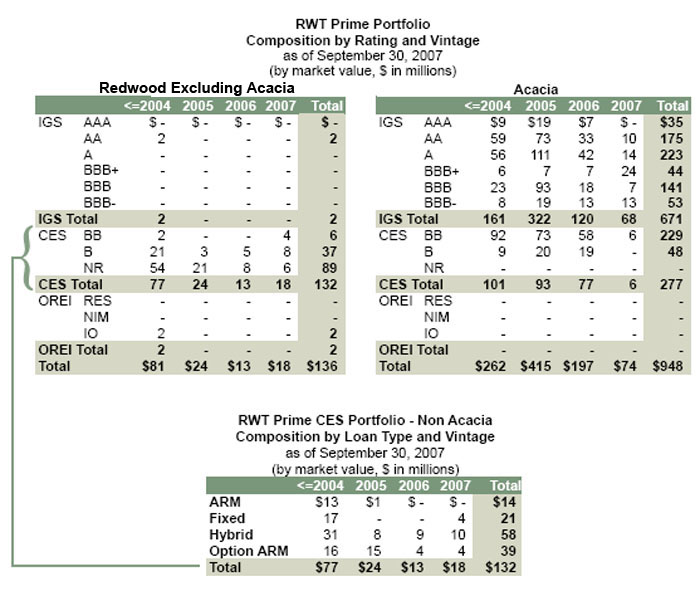
|
40
|
|
The
Redwood
Review
3rd
Quarter
2007
|
|
|
Residential
Real Estate Securities
|
|
Residential
|
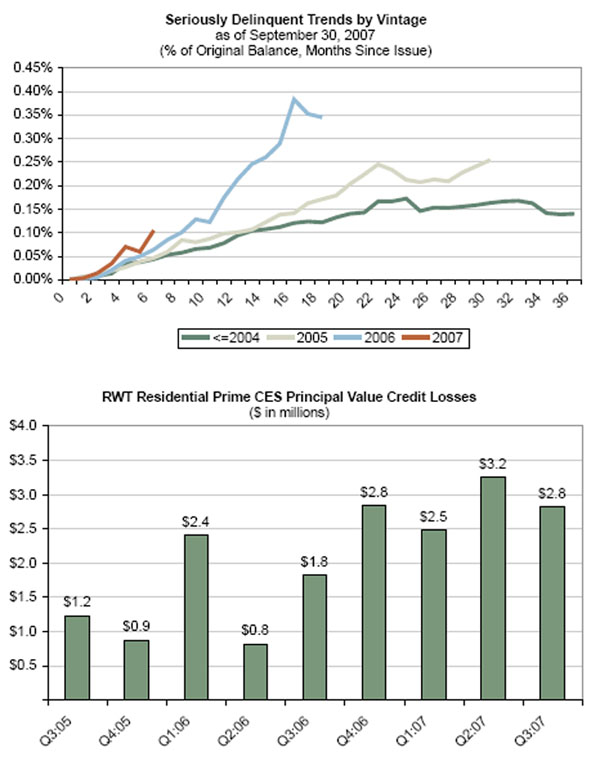
|
The
Redwood
Review
3rd
Quarter
2007
|
|
41 |
|
|
Residential
Real Estate Securities
|
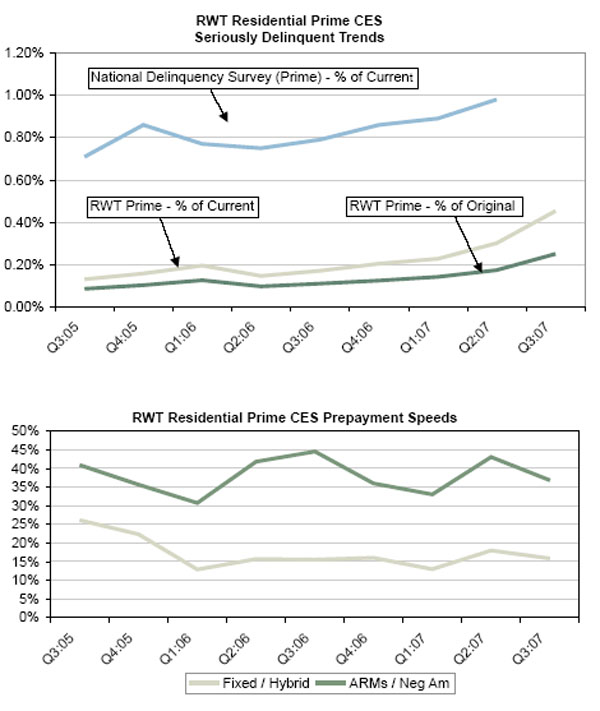
|
42
|
|
The
Redwood
Review
3rd
Quarter
2007
|
|
|
Residential
Real Estate Securities
|
|
Residential
|
|
RWT
Residential Prime Portfolio
|
|||||||||||||
|
Activity
|
|||||||||||||
|
as
of
September 30, 2007
|
|||||||||||||
|
(by
market
value, $ in millions)
|
|||||||||||||
|
|
IGS
|
CES
|
OREI
|
Total
|
|||||||||
|
Market
Value 6/30/07
|
$870
|
$570
|
$1
|
$1,441
|
|||||||||
|
Acquisitions
|
47
|
1
|
-
|
48
|
|||||||||
|
Moved
due to
ratings action
|
5
|
(5
|
)
|
-
|
-
|
||||||||
|
Transfers
to
/ from other portfolios
|
(17
|
)
|
(11
|
)
|
-
|
(28
|
)
|
||||||
|
Sales
|
(128
|
)
|
-
|
-
|
(128
|
)
|
|||||||
|
Principal
payments
|
(21
|
)
|
(34
|
)
|
-
|
(55
|
)
|
||||||
|
Discount
amortization
|
2
|
16
|
1
|
19
|
|||||||||
|
Gains
on
sales/calls
|
(3
|
)
|
3
|
-
|
-
|
||||||||
|
Net
mark-to-market adjustment
|
(82
|
)
|
(131
|
)
|
-
|
(213
|
)
|
||||||
|
Market
Value 9/30/07
|
$673
|
$409
|
$2
|
$1,084
|
|||||||||
|
RWT
Residential Prime CES Securities
|
||||
|
Underlying
Loan Characteristics
|
||||
|
as
of
September 30, 2007
|
||||
|
Number
of
loans
|
538,681
|
|
Wtd
Avg
FICO
|
737
|
|
Total
loan
face ($ in millions)
|
186,172
|
FICO:
<=
620
|
2%
|
|
|
Average
loan
size ($ in 1000's)
|
$346
|
FICO:
621 -
660
|
5%
|
|
|
|
|
FICO:
661 -
700
|
15%
|
|
|
Southern
CA
|
24%
|
FICO:
701 -
740
|
26%
|
|
|
Northern
CA
|
21%
|
FICO:
>
740
|
51%
|
|
|
Florida
|
6%
|
Unknown
|
1%
|
|
|
New
York
|
6%
|
|
||
|
Georgia
|
2%
|
Conforming
at
origination %
|
31%
|
|
|
New
Jersey
|
3%
|
>
$1
MM
%
|
9%
|
|
|
Other
states
|
38%
|
|
|
|
|
|
|
2nd
home
%
|
6%
|
|
|
2007
origination
|
3%
|
Investment
home %
|
2%
|
|
|
2006
origination
|
15%
|
|
|
|
|
2005
origination
|
31%
|
Purchase
|
42%
|
|
|
2004
origination and earlier
|
51%
|
Cash
out
refi
|
27%
|
|
|
|
|
Rate-term
refi
|
30%
|
|
|
Wtd
Avg
Original LTV
|
68%
|
|
|
|
|
Original
LTV:
0 - 50
|
13%
|
Full
doc
|
48%
|
|
|
Original
LTV:
50 - 60
|
12%
|
No
doc
|
8%
|
|
|
Original
LTV:
60. - 70
|
22%
|
Other
(limited, etc)
|
44%
|
|
|
Original
LTV:
70 - 80
|
50%
|
|
||
|
Original
LTV:
80 - 90
|
2%
|
2-4
family
|
2%
|
|
|
Original
LTV:
90 - 100
|
1%
|
Condo
|
9%
|
|
|
|
|
|
Single
family
|
88%
|
|
The
Redwood
Review
3rd
Quarter
2007
|
|
43
|
|
|
Residential
Real Estate Securities
|
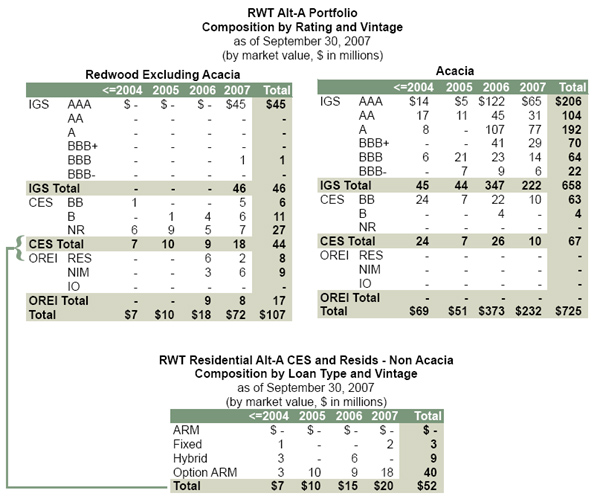
|
44
|
|
The
Redwood
Review
3rd
Quarter
2007
|
|
|
Residential
Real Estate Securities
|
|
Residential
|
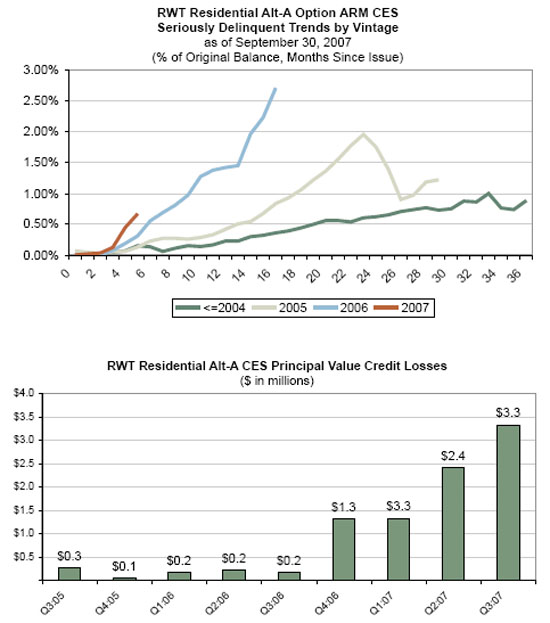
|
The
Redwood
Review
3rd
Quarter
2007
|
|
45
|
|
|
Residential
Real Estate Securities
|
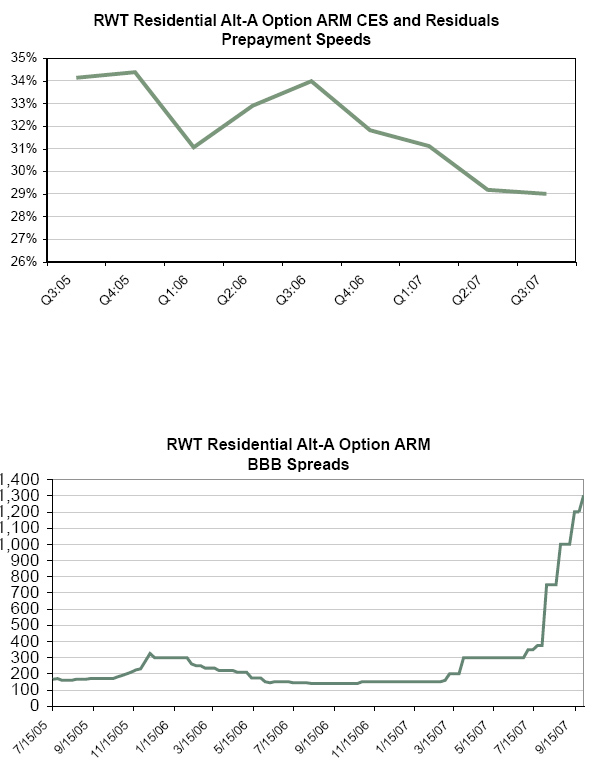
|
46
|
|
The
Redwood
Review
3rd
Quarter
2007
|
|
|
Residential
Real Estate Securities
|
|
Residential
|
|
RWT
Residential Alt-A Portfolio
|
|||||||||||||
|
Activity
|
|||||||||||||
|
as
of
September 30, 2007
|
|||||||||||||
|
(by
market
value, $ in millions)
|
|||||||||||||
|
|
IGS
|
CES
|
OREI
|
Total
|
|||||||||
|
Market
Value 6/30/07
|
$855
|
$172
|
$17
|
$1,044
|
|||||||||
|
Acquisitions
|
38
|
-
|
-
|
38
|
|||||||||
|
Moved
due to
ratings action
|
-
|
-
|
-
|
-
|
|||||||||
|
Transfers
to
/ from other portfolios
|
17
|
11
|
-
|
28
|
|||||||||
|
Sales
|
-
|
-
|
-
|
-
|
|||||||||
|
Principal
payments
|
(9
|
)
|
(8
|
)
|
(1
|
)
|
(18
|
)
|
|||||
|
Discount
amortization
|
-
|
3
|
2
|
5
|
|||||||||
|
Gains
on
sales/calls
|
-
|
-
|
-
|
-
|
|||||||||
|
Net
mark-to-market adjustment
|
(197
|
)
|
(67
|
)
|
(2
|
)
|
(266
|
)
|
|||||
|
Market
Value 9/30/07
|
$704
|
$111
|
$16
|
$831
|
|||||||||
|
RWT
Residential Alt-A CES Securities
|
||||
|
Underlying
Loan Characteristics
|
||||
|
as
of
September 30, 2007
|
||||
|
Number
of
loans
|
58,299
|
|
Wtd
avg
FICO
|
705
|
|
Total
loan
face ($ in millions)
|
20,719
|
FICO:
<=
620
|
2%
|
|
|
Average
loan
size ($ in 1000's)
|
$355
|
FICO:
621 -
660
|
14%
|
|
|
|
|
FICO:
661 -
700
|
30%
|
|
|
Southern
CA
|
33%
|
FICO:
701 -
740
|
25%
|
|
|
Northern
CA
|
19%
|
FICO:
>
740
|
22%
|
|
|
Florida
|
10%
|
Unknown
|
7%
|
|
|
New
York
|
2%
|
|
||
|
Georgia
|
1%
|
Conforming
at
origination %
|
44%
|
|
|
New
Jersey
|
3%
|
>
$1
MM
%
|
15%
|
|
|
Other
states
|
32%
|
|
|
|
|
|
|
2nd
home
%
|
6%
|
|
|
2007
origination
|
21%
|
Investment
home %
|
11%
|
|
|
2006
origination
|
21%
|
|
|
|
|
2005
origination
|
30%
|
Purchase
|
35%
|
|
|
2004
origination and earlier
|
28%
|
Cash
out
refi
|
43%
|
|
|
|
|
Rate-term
refi
|
22%
|
|
|
Wtd
avg
original LTV
|
75%
|
|
|
|
|
Original
LTV:
0 - 50
|
4%
|
Full
doc
|
16%
|
|
|
Original
LTV:
50 - 60
|
6%
|
No
doc
|
1%
|
|
|
Original
LTV:
60 - 70
|
16%
|
Other
(limited, etc)
|
76%
|
|
|
Original
LTV:
70 - 80
|
62%
|
Unknown/not
categorized
|
7%
|
|
|
Original
LTV:
80 - 90
|
9%
|
|
|
|
|
Original
LTV:
90 - 100
|
3%
|
2-4
family
|
4%
|
|
|
|
|
Condo
|
11%
|
|
|
|
|
|
Single
family
|
85%
|
|
The
Redwood
Review
3rd
Quarter
2007
|
|
47
|
|
|
Residential
Real Estate Securities
|
|
RWT
Subprime Portfolio
Composition
by Rating and Vintage
as
of
September 30, 2007
(by
market
value, $ in millions)
|
||||||||||||||
|
Redwood
Excluding Acacia
|
Acacia
|
|||||||||||||
|
|
|
<=2004
|
2005
|
2006
|
2007
|
Total
|
|
|
|
<=2004
|
2005
|
2006
|
2007
|
Total
|
|
IGS
|
AAA
|
$
-
|
$
-
|
$
-
|
$
-
|
$
-
|
|
IGS
|
AAA
|
$
-
|
$4
|
$2
|
$10
|
$16
|
|
AA
|
-
|
-
|
-
|
-
|
-
|
|
AA
|
45
|
46
|
17
|
19
|
127
|
||
|
A
|
-
|
-
|
-
|
3
|
3
|
|
A
|
71
|
22
|
4
|
6
|
103
|
||
|
BBB+
|
1
|
-
|
-
|
-
|
1
|
|
BBB+
|
28
|
-
|
15
|
7
|
50
|
||
|
BBB
|
-
|
-
|
-
|
4
|
4
|
|
BBB
|
-
|
-
|
3
|
-
|
3
|
||
|
BBB-
|
-
|
-
|
-
|
5
|
5
|
|
BBB-
|
4
|
-
|
9
|
-
|
13
|
||
|
IGS
Total
|
1
|
-
|
-
|
12
|
13
|
|
IGS
Total
|
148
|
72
|
50
|
42
|
312
|
||
|
CES
|
BB
|
-
|
-
|
-
|
-
|
-
|
|
CES
|
BB
|
-
|
-
|
4
|
-
|
4
|
|
B
|
-
|
-
|
-
|
-
|
-
|
|
B
|
-
|
-
|
7
|
-
|
7
|
||
|
NR
|
1
|
-
|
-
|
-
|
1
|
|
NR
|
-
|
-
|
1
|
-
|
1
|
||
|
CES
Total
|
1
|
-
|
-
|
-
|
1
|
|
CES
Total
|
-
|
-
|
12
|
-
|
12
|
||
|
OREI
|
RES
|
-
|
-
|
1
|
-
|
1
|
|
OREI
|
RES
|
-
|
-
|
-
|
-
|
-
|
|
NIM
|
-
|
-
|
5
|
-
|
5
|
|
NIM
|
-
|
-
|
-
|
-
|
-
|
||
|
IO
|
-
|
-
|
-
|
-
|
-
|
|
IO
|
-
|
-
|
-
|
-
|
-
|
||
|
OREI
Total
|
-
|
-
|
6
|
-
|
6
|
|
OREI
Total
|
-
|
-
|
-
|
-
|
-
|
||
|
Total
|
|
$2
|
$
-
|
$6
|
$12
|
$20
|
|
Total
|
|
$148
|
$72
|
$62
|
$42
|
$324
|
|
48
|
|
The
Redwood
Review
3rd
Quarter
2007
|
|
|
Residential
Real Estate Securities
|
|
Residential
|
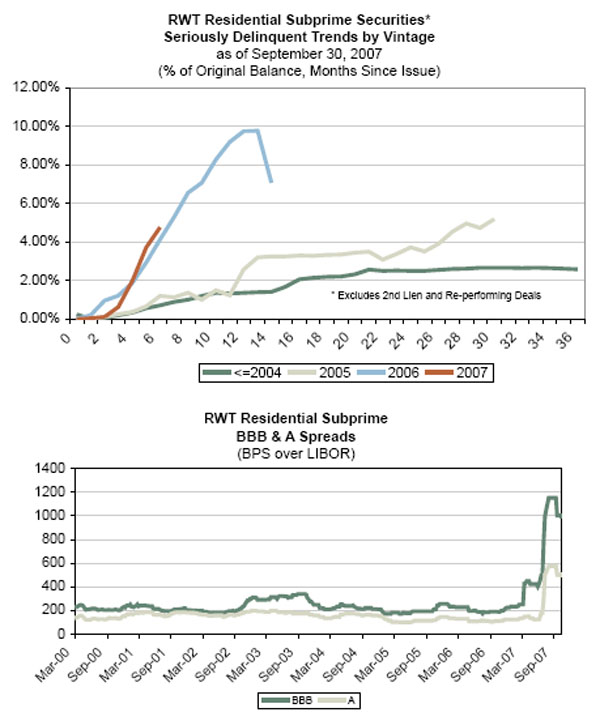
|
The
Redwood
Review
3rd
Quarter
2007
|
|
49
|
|
|
Residential
Real Estate Securities
|
|
RWT
Residential Subprime Portfolio
|
|||||||||||||
|
Activity
|
|||||||||||||
|
as
of
September 30, 2007
|
|||||||||||||
|
(by
market
value, $ in millions)
|
|||||||||||||
|
|
IGS
|
CES
|
OREI
|
Total
|
|||||||||
|
Market
Value 6/30/07
|
$438
|
$3
|
$16
|
$457
|
|||||||||
|
Acquisitions
|
68
|
-
|
-
|
68
|
|||||||||
|
Moved
due to
ratings action
|
(22
|
)
|
22
|
-
|
-
|
||||||||
|
Transfers
to
/ from other portfolios
|
-
|
-
|
-
|
-
|
|||||||||
|
Sales
|
(50
|
)
|
-
|
-
|
(50
|
)
|
|||||||
|
Principal
payments
|
(17
|
)
|
-
|
(3
|
)
|
(20
|
)
|
||||||
|
Discount
amortization
|
-
|
-
|
(5
|
)
|
(5
|
)
|
|||||||
|
Gains
on
sales/calls
|
-
|
-
|
-
|
-
|
|||||||||
|
Net
mark-to-market adjustment
|
(92
|
)
|
(12
|
)
|
-
|
(104
|
)
|
||||||
|
Market
Value 9/30/07
|
$325
|
$13
|
$7
|
$345
|
|||||||||
|
RWT
Residential CES Subprime Securities
|
||||
|
Underlying
Loan Characteristics
|
||||
|
as
of
September 30, 2007
|
||||
|
Number
of
loans
|
47,114
|
|
Wtd
avg
FICO
|
644
|
|
Total
loan
face ($ in millions)
|
5,028
|
FICO:
<=
620
|
32%
|
|
|
Average
loan
size ($ in 1000's)
|
107
|
FICO:
621 -
660
|
31%
|
|
|
|
|
FICO:
661 -
700
|
21%
|
|
|
Southern
CA
|
19%
|
FICO:
701 -
740
|
10%
|
|
|
Northern
CA
|
13%
|
FICO:
>
740
|
6%
|
|
|
Florida
|
12%
|
Unknown
|
0%
|
|
|
New
York
|
4%
|
|
||
|
Georgia
|
2%
|
Conforming
at
origination %
|
82%
|
|
|
New
Jersey
|
3%
|
>
$1
MM
%
|
0%
|
|
|
Other
states
|
47%
|
|
|
|
|
|
|
2nd
Home
%
|
1%
|
|
|
2007
origination
|
1%
|
Investment
Home %
|
7%
|
|
|
2006
origination
|
99%
|
|
|
|
|
2005
origination
|
0%
|
Purchase
|
60%
|
|
|
2004
origination and earlier
|
0%
|
Cash
out
refi
|
37%
|
|
|
|
|
Rate-term
refi
|
3%
|
|
|
Wtd
avg
original LTV
|
86%
|
|
|
|
|
Original
LTV:
0 - 50
|
15%
|
Full
doc
|
53%
|
|
|
Original
LTV:
50 - 60
|
2%
|
No
doc
|
1%
|
|
|
Original
LTV:
60 - 70
|
5%
|
Other
(limited, etc)
|
46%
|
|
|
Original
LTV:
70 - 80
|
36%
|
Unknown/not
categorized
|
0%
|
|
|
Original
LTV:
80 - 90
|
18%
|
|
|
|
|
Original
LTV:
90 - 100
|
24%
|
2-4
family
|
7%
|
|
|
|
|
Condo
|
8%
|
|
|
|
|
|
Single
family
|
85%
|
|
50
|
|
The
Redwood
Review
3rd
Quarter
2007
|
|
|
Residential
Real Estate Loans
|
|
Residential
|
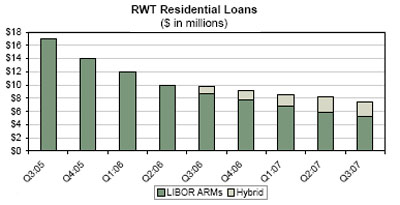
| Ø |
In
the third quarter, our residential loan portfolio decreased from
$8.4
billion to $7.6 billion. We acquired $82 million loans and sold
$6.7
million seriously delinquent loans. Principal pay downs were
$772 million.
The average CPR was 37% for the third quarter versus 44% for
all of 2006.
Most of these loans are ARM loans that tend to prepay rapidly
when the
yield curve is flat or inverted.
|
| Ø |
Interest
income on our residential loans was $116 million in the third
quarter, a
decrease from $119 million in the previous quarter. This portfolio
yielded
5.79%. The yield in the previous quarter was 5.91%.
|
| Ø |
Premium
amortization expenses, a component of interest income, were $8
million for
the third quarter. We ended the third quarter with $7.6 billion
principal
value of loans and a loan premium balance of $99 million for
an average
basis of 101.19% of principal value. For several years we have
not been
able to amortize premium expense balances as quickly as the loans
prepaid
for accounting reasons. If short-term interest rates decline,
under these
accounting rules we would expect premium amortization expenses
to increase
significantly.
|
| Ø |
Cumulative
losses have been far lower than our original expectations. We
expect
losses to continue to increase as loans season. Credit reserves
for this
portfolio were $15.2 million (or 0.2%) of current loan balances
at
quarter-end. In the third quarter, we had a net overall recovery
of $0.6
million of a previously realized loss on a loan that was repurchased
by
the originator.
|
| Ø |
The
seriously delinquent loans balance of $56 million was the same
as the
previous quarter, representing 0.20% of original balances, and
an increase
from 0.67% to 0.74% of current balances from the previous quarter.
|
| Ø |
At
the end of
the third quarter, $7.6 billion of residential loans were financed
via
Sequoia securitizations and $6 million were financed with equity.
Additional information on our residential loans can be found
in Tables 9,
10, 11, and 14 of the
Appendix.
|
|
The
Redwood
Review
3rd
Quarter
2007
|
|
51
|
|
|
Residential
Real Estate Loans
|
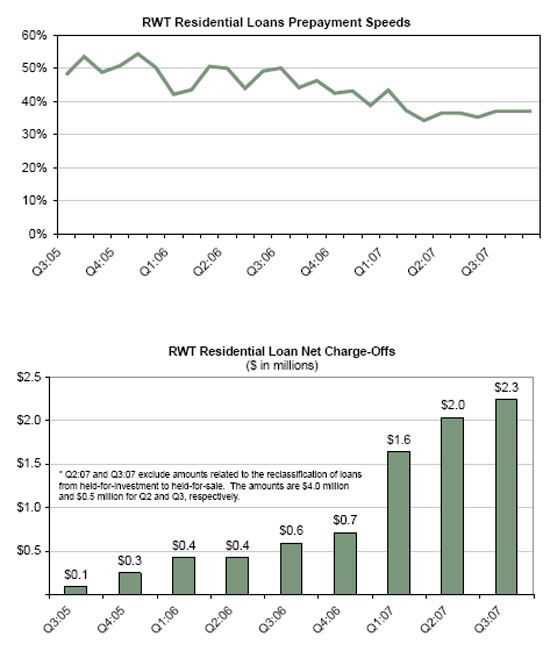
| 52 |
|
The
Redwood
Review
2nd
Quarter
2007
|
|
|
Residential
Real Estate Loans
|
|
Residential
|
|
RWT
Residential Loan Portfolio
|
||||||||||
|
Activity
|
||||||||||
|
as
of
September 30, 2007
|
||||||||||
|
(by
market
value, $ in millions)
|
||||||||||
|
|
Q307
|
Q207
|
Q306
|
|||||||
|
Carrying
Value Beginning
|
$8,352
|
$8,680
|
$10,454
|
|||||||
|
Acquisitions
|
82
|
675
|
967
|
|||||||
|
Sales
|
(13
|
)
|
(2
|
)
|
-
|
|||||
|
Principal
payments
|
(781
|
)
|
(989
|
)
|
(1,567
|
)
|
||||
|
Premium
amortization
|
(8
|
)
|
(11
|
)
|
(11
|
)
|
||||
|
Credit
provision
|
(2
|
)
|
(3
|
)
|
(1
|
)
|
||||
|
Net
charge-offs/(recoveries)
|
-
|
2
|
1
|
|||||||
|
Carrying
Value Ending
|
$7,630
|
$8,352
|
$9,843
|
|||||||
|
RWT
Residential Loan Portfolio
|
||||
|
Loan
Characteristics
|
||||
|
as
of
September 30, 2007
|
||||
|
Number
of
loans
|
21,981
|
|
Wtd
Avg
FICO
|
732
|
|
Total
loan
face ($ in millions)
|
7,547
|
FICO:
<=
620
|
1%
|
|
|
Average
loan
size ($ in 1000's)
|
343
|
FICO:
621 -
660
|
5%
|
|
|
|
|
FICO:
661 -
700
|
19%
|
|
|
Southern
CA
|
15%
|
FICO:
701 -
740
|
27%
|
|
|
Northern
CA
|
10%
|
FICO:
>
740
|
48%
|
|
|
Florida
|
12%
|
|
||
|
New
York
|
6%
|
Conforming
at
origination %
|
35%
|
|
|
Georgia
|
4%
|
>
$1
MM
%
|
15%
|
|
|
New
Jersey
|
4%
|
|
|
|
|
Other
states
|
48%
|
2nd
home
%
|
11%
|
|
|
|
|
Investment
home %
|
3%
|
|
|
2007
origination
|
12%
|
|
|
|
|
2006
origination
|
19%
|
Purchase
|
36%
|
|
|
2005
origination
|
5%
|
Cash
out
refi
|
32%
|
|
|
2004
origination and earlier
|
64%
|
Rate-term
refi
|
31%
|
|
|
|
|
Other
|
2%
|
|
|
Wtd
avg
original LTV
|
68%
|
|
|
|
|
Original
LTV:
0 - 50
|
15%
|
Hybrid
|
31%
|
|
|
Original
LTV:
50 - 60
|
11%
|
Adjustable
|
69%
|
|
|
Original
LTV:
60 - 70
|
19%
|
Interest
only
|
95%
|
|
|
Original
LTV:
70 - 80
|
48%
|
Fully-amortizing
|
5%
|
|
|
Original
LTV:
80 - 90
|
2%
|
|
||
|
Original
LTV:
90 - 100
|
5%
|
|
|
|
|
The
Redwood
Review
3rd
Quarter
2007
|
|
53 |
 |
Commercial
Real Estate
Securities
|
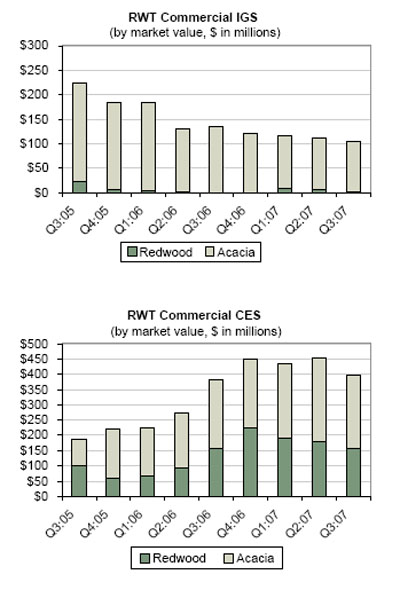
| 54 |
|
The
Redwood
Review
3rd
Quarter
2007
|
|
|
Commercial
Real Estate Securities
|
|
Commercial
|
| · |
Total
commercial securities decreased by 11% in the third quarter,
from $562
million to $499 million, as a result of $2 million acquisitions
and $61
million negative market value changes. Less than $1 million
of the total
market value decline was expensed as impairments through
our GAAP income
statement.
|
| · |
Turmoil
in the residential subprime mortgage sector continued to
affect the CMBS
and CRE CDO markets during the third quarter. Credit spreads
for
commercial securities widened and asset prices declined relative
to prior
periods. We intend to take advantage of the market dislocation
by
investing in attractively priced commercial assets funded
with capital. As
always, our investment strategy will focus on credit performance
and
underwriting quality.
|
| · |
We
remain optimistic on our current investments and our future
prospects in
the commercial real estate sector even though we anticipate
slower growth
ahead. Our overall credit performance remains strong with
serious
delinquencies at low levels across all major property types.
Total serious
delinquencies in our commercial CES portfolio were $181 million,
or 0.28%
of the $65 billion in loans that we credit-enhance.
|
|
The
Redwood
Review
3rd
Quarter
2007
|
|
55 |
|
|
Commercial
Real Estate
Securities
|
|
RWT
Commercial IGS
Composition
by Rating and Vintage
as
of
September 30, 2007
(by
market
value, $ in millions)
|
||||||||||||
|
Redwood
Excluding Acacia
|
Acacia
|
|||||||||||
|
|
<=2004
|
2005
|
2006
|
2007
|
Total
|
<=2004
|
2005
|
2006
|
2007
|
Total
|
||
|
AAA
|
$
-
|
$
-
|
$
-
|
$
-
|
$
-
|
AAA
|
$0
|
$9
|
$2
|
$0
|
$11
|
|
|
AA
|
-
|
-
|
-
|
-
|
-
|
AA
|
2
|
0
|
0
|
0
|
2
|
|
|
A
|
-
|
-
|
-
|
-
|
-
|
A
|
17
|
4
|
0
|
0
|
21
|
|
|
BBB+
|
-
|
-
|
-
|
-
|
-
|
BBB+
|
4
|
6
|
0
|
0
|
10
|
|
|
BBB
|
-
|
-
|
-
|
-
|
-
|
BBB
|
9
|
18
|
0
|
0
|
27
|
|
|
BBB-
|
1
|
-
|
-
|
-
|
1
|
BBB-
|
14
|
16
|
2
|
0
|
32
|
|
|
IGS
Total
|
$1
|
$
-
|
$
-
|
$
-
|
$1
|
IGS
Total
|
$46
|
$53
|
$4
|
$0
|
$103
|
|
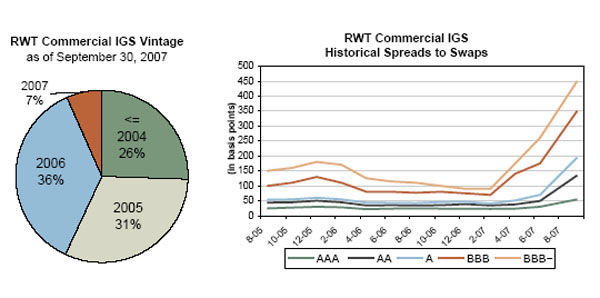
| 56 |
|
The
Redwood
Review
3rd
Quarter
2007
|
|
|
Commercial
Real Estate Securities
|
|
Commercial
|
| Ø |
Our
commercial IGS declined by $7 million (or 6%) to $104 million in
the third
quarter. This decrease was due to $6 million negative market value
changes
and $3 million of principal paydowns. We purchased $2 million of
IGS and
had no sales during the quarter.
|
| Ø |
The
total market value decline of $6 million in commercial IGS was
primarily
the result of spread widening due to low market liquidity. These
securities have proven difficult for many market participants to
leverage,
despite their generally attractive credit
profiles.
|
| Ø |
Interest
income generated by commercial IGS was $2 million for the third
quarter.
The yield for the quarter was 6.20%, an increase from 6.18% in
the
previous quarter.
|
| Ø |
The
performance of our commercial IGS portfolio remains strong, with
two of
our IGS recently being upgraded by Moody’s. We do not maintain GAAP credit
reserves against our commercial IGS, since we expect external
credit-enhancement to protect our investments from principal losses.
We
have never incurred a principal loss on any commercial
IGS.
|
| Ø |
The
interest rate characteristics of commercial IGS were 80% fixed-rate
and
20% adjustable-rate. We use interest rate agreements to reduce
interest
rate mismatches that may occur between assets and their associated
liabilities.
|
| Ø |
At
September 30, 2007, 99% of our commercial IGS were financed via
our Acacia
CDO program.
|
| Ø |
Additional
information on this portfolio can be found in Tables 9, 10, and
18 of the
Appendix.
|
|
The
Redwood
Review
3rd
Quarter
2007
|
|
57 |
|
|
Commercial
Real Estate Securities
|
|
RWT
Commercial CES
Composition
by Rating and Vintage
as
of
September 30, 2007
(by
market
value, $ in millions)
|
||||||||||||
|
Redwood
Excluding Acacia
|
Acacia
|
|||||||||||
|
|
<=2004
|
2005
|
2006
|
2007
|
Total
|
<=2004
|
2005
|
2006
|
2007
|
Total
|
||
|
BB+
|
$7
|
$
-
|
$2
|
$
-
|
$9
|
BB+
|
$7
|
$19
|
$29
|
$8
|
$63
|
|
|
BB
|
3
|
-
|
5
|
1
|
9
|
BB
|
23
|
17
|
22
|
3
|
65
|
|
|
BB-
|
1
|
-
|
-
|
1
|
2
|
BB-
|
3
|
19
|
27
|
2
|
51
|
|
|
B+
|
-
|
-
|
6
|
5
|
11
|
B+
|
2
|
7
|
8
|
0
|
17
|
|
|
B
|
-
|
-
|
3
|
2
|
5
|
B
|
2
|
6
|
16
|
0
|
24
|
|
|
B-
|
-
|
-
|
5
|
6
|
11
|
B-
|
2
|
7
|
9
|
0
|
18
|
|
|
NR
|
15
|
35
|
54
|
6
|
110
|
NR
|
0
|
0
|
0
|
0
|
0
|
|
|
CES
Total
|
$26
|
$35
|
$75
|
$21
|
$157
|
CES
Total
|
$39
|
$75
|
$111
|
$13
|
$238
|
|

| 58 |
|
The
Redwood
Review
3rd
Quarter
2007
|
|
|
Commercial
Real Estate Securities
|
|
Commercial
|
| Ø |
Our
commercial CES decreased by $56 million (or 12%) in the third
quarter to
$395 million due to negative market value changes. There
were no
acquisitions or sales during the
quarter.
|
| Ø |
The
$56 million market value decline was primarily due to widening
credit
spreads amidst low market liquidity. Of the total decline,
$55 million was
unrealized and recorded on our balance sheet, as the underlying
credit
performance of these securities remains strong. The remaining
$1 million
was recorded as impairment to our income statement during
the third
quarter.
|
| Ø |
Interest
income generated by commercial CES was $11 million for the
third quarter.
The yield for the quarter was 9.47%, a decrease from 9.75%
in the previous
quarter.
|
| Ø |
Seriously
delinquent commercial loans (60 days or more delinquent)
underlying
commercial CES were $181 million, an increase of $108 million
from the
previous quarter.
|
| Ø |
The
majority of the increase in seriously delinquent loans was
concentrated in
one $86 million loan. This loan was made to finance the acquisition
of a
regional shopping mall near Houston, TX. Although the borrower
has
recently declared bankruptcy, the prognosis for this loan
is good. We
currently do not expect a loss as the collateral appears
to be sufficient
to cover the outstanding loan balance if the property is
liquidated. The
loan was also underwritten with in-place reserves, which
have been used to
bring the delinquent balance current as of October 15, 2007.
We anticipate
that the resolution of this loan will take a number of months
to
occur.
|
| Ø |
Of
the remaining $95 million in serious delinquencies, $48 million
is
contained within one security that we deemed impaired during
a prior
period. We currently have a zero cost basis in this security,
with no risk
of future write-downs affecting our GAAP income statement.
|
| Ø |
There
were less than $1 million in realized credit losses during
the quarter.
Credit losses on this portfolio to date total less than one
basis point
(0.01%) of underlying loans, or $2 million. Our GAAP credit
reserves for
commercial CES were $310 million ($11.60 per share) at September
30, 2007,
or 0.44% of underlying loan balances.
|
| Ø |
Most
of our commercial CES ($287 million or 73%) are in a second-loss
or more
senior position. For the remaining $108 million of securities
that are in
a direct first-loss position, 42% share losses with other
CES
investors.
|
| Ø |
Additional
information on commercial CES can be found in Tables 9, 10,
15, 16, and 18
of the Appendix.
|
|
The
Redwood
Review
3rd
Quarter
2007
|
|
59 |
|
|
Commercial
Real Estate Loans
|
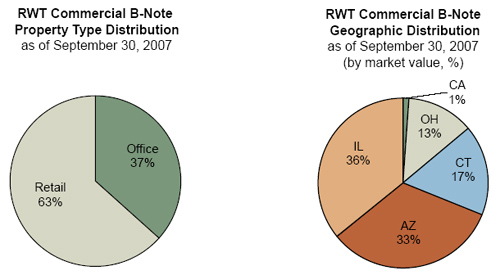
| · |
Our
commercial loan portfolio was unchanged during the third quarter,
at $26
million. No new delinquencies occurred during the quarter.
|
| · |
Our
$26 million b-note investments are financed through Acacia CDO
securitizations.
|
| · |
Additional
information on our commercial loans can be found in Tables 9, 10,
15, and
17 of the Appendix.
|
| 60 |
|
The
Redwood
Review
3rnd
Quarter
2007
|
|
|
CDO
Securities
|
|
CDO
|
| · |
The
third quarter ended much like it began, with the market for
CDO securities
remaining in a state of severe price dislocation and increased
credit
deterioration. The severe liquidity issues experienced by
many CDO
investors during the quarter coupled with ongoing ratings
downgrades from
the credit rating agencies have continued to keep the overall
market for
CDO securities in a state of disarray.
|
| · |
New
issuance activity was virtually nonexistent during the quarter
for
commercial, mezzanine, and high grade collateral backed CDO
deals.
Currently, high yield loan-backed CDOs have been the only
deals to price
during the third quarter.
|
| · |
Market
pricing transparency for CDOs traded in the secondary market
is extremely
poor; thus, market prices for our own CDO portfolio are difficult
to
determine and are subject to greater than normal volatility
going forward.
|
| · |
CDO
securitizations backed by collateral pools containing high
concentrations
of 2006 and 2007 vintage subprime securities rated BBB and
BBB- continue
to be those experiencing the greatest degree of price decline.
However, we
started to see other types of collateral being affected by
rating
downgrades, thus certain CDO deals backed by higher rated
subprime
securities as well as alt-a securities and 2005 vintage subprime
securities are experiencing some performance
issues.
|
| · |
As
of September 30, 2007, 5 of the 88 CDO securities owned by
Acacia were
downgraded and one placed on credit watch negative by the
credit rating
agencies. We recorded impairments on seven 2004 through 2007
vintage CDO
assets this quarter, resulting in a $13 million charge against
income.
|
| · |
We
believe the impact of poor loan performance as well as the
recent ratings
downgrades by the rating agencies regarding 2006 and 2007
residential
securities could cause additional losses on our CDO securities
in
subsequent quarters. Additionally, we believe there is a
strong
possibility that these potential losses could impact some
of the AA and
AAA rated CDO securities that we
own.
|
| · |
We
have no immediate plans to sell any CDO securities but we
continue to
monitor our portfolio and will take action to sell underperforming
assets
if possible and where appropriate. However, the current illiquidity
in the
secondary market for CDO securities could make it difficult
to sell any
securities.
|
| · |
We
believe there will be some very attractive buying opportunities
on a going
forward
basis.
We continue to believe that we will be able to capitalize
on these
opportunities and have maintained resources focused on evaluating
acquisition of CDO
securities.
|
|
The
Redwood
Review
3rd
Quarter
2007
|
|
61 |
 |
CDO
Securities
|
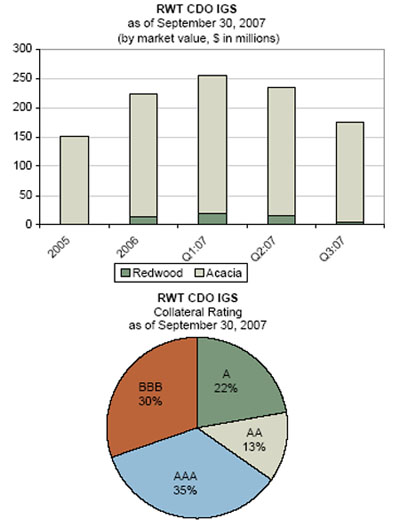
|
RWT
CDO IGS Porfolio
Porfolio
Composition by Vintage and Rating
as
of
September 30, 2007
(by
market
value, $ in millions)
|
||||||||||
|
|
<
2005
|
2006
& 2007
|
Total
|
|||||||
|
AAA
|
$
|
32
|
$
|
29
|
$
|
61
|
||||
|
AA
|
20
|
2
|
22
|
|||||||
|
A
|
29
|
10
|
39
|
|||||||
|
BBB
|
25
|
28
|
53
|
|||||||
|
Total
|
$
|
106
|
$
|
69
|
$
|
175
|
||||
| 62 |
|
The
Redwood
Review
3rd
Quarter
2007
|
|
|
CDO
Securities
|
|
CDO
|
| Ø |
Our
total investment in CDO IGS decreased 26% during the third quarter,
to
$175 million from $235 million as a result of market value decreases
totaling $57 million and an additional $3 million of net decreases
related
to pay downs and rating changes.
|
| Ø |
At
September 30, 2007, $170 million of our CDO IGS portfolio was financed
via
securitization in our Acacia CDO program and the remaining $5 million
was
funded with Redwood capital.
|
| Ø |
Interest
income generated by the CDO IGS portfolio during the third quarter
was $5
million, consistent with interest income generated in the second
quarter
of 2007. The yield for the third quarter was 7.22%, 14 basis points
higher
than the yield in the second quarter. Substantially all of these
assets
earn a floating rate of interest based on the LIBOR interest
rate.
|
| Ø |
As
of September 30, 2007, we recorded impairment charges totaling
$9 million
related to five CDO IGS assets.
|
| Ø |
We
use interest rate agreements to reduce mismatches of interest rate
characteristics between the fixed-rate CDO IGS we own and the
floating-rate CDO securities issued by Acacia to finance these
assets.
|
|
The
Redwood
Review
3rd
Quarter
2007
|
|
63 |
|
|
CDO
Securities
|
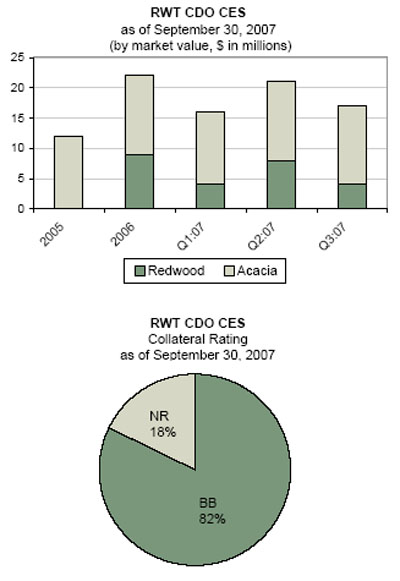
|
RWT
CDO CES Porfolio
Porfolio
Composition by Vintage and Rating
as
of
September 30, 2007
(by
market
value, $ in millions)
|
||||||||||
|
<
2005
|
2006
& 2007
|
Total
|
||||||||
|
BB
|
$
|
11
|
$
|
3
|
$
|
14
|
||||
|
NR
|
-
|
3
|
$
|
3
|
||||||
|
Total
|
$
|
11
|
$
|
6
|
$
|
17
|
||||
| 64 |
|
The
Redwood
Review
3rd
Quarter
2007
|
|
|
CDO
Securities
|
|
CDO
|
| Ø |
Our
CDO CES portfolio decreased by $4 million due to mark-to-market
adjustments during the third quarter to $17 million in comparison
to the
second quarter of 2007.
|
| Ø |
At
September 30, 2007, $13 million of CDO CES was financed via our
Acacia CDO
program and $4 million was financed with
capital.
|
| Ø |
Approximately
81% of the $17 million of CDO CES was backed by commercial real
estate
collateral.
|
| Ø |
Interest
income generated by CDO CES was $0.9 million for the third quarter.
The
yield for the quarter was 15.39%, an increase over the previous
quarter’s
yield of 14.38%.
|
| Ø |
As
of September 30, 2007, we recorded impairment charges totaling
$4 million
dollars related to two CDO CES assets.
|
|
The
Redwood
Review
3rd
Quarter
2007
|
|
65 |
 |
Redwood
Capital and Liquidity
|
| · |
Our
liquidity position was strong at the beginning of the quarter and
even
stronger at the end of the quarter. We had $322 million net liquidity
at
September 30, 2007.
|
| · |
We
had $298 million excess capital at September 30, 2007, an increase
from
$158 million at the beginning of the quarter. Our excess capital
increased
as a result of two successful Sequoia securitizations of prime
residential
whole loans, sales of most of our AAA-rated securities that were
funded
with debt, and sales of delinquent
loans.
|
| · | We believe our strengthened liquidity and capital positions provide us with options and flexibility. We are well positioned to build our franchise and make good long-term investments in our core residential and commercial credit-enhancement business. |
| · | Our rate of excess capital utilization will depend on future market conditions. In this market, large and attractive investment opportunities may arise suddenly. We expect that our current excess capital will be absorbed during the next one to three quarters. |
| 66 |
|
The
Redwood
Review
3rd
Quarter
2007
|
|
|
Redwood
Capital and
Liquidity
|
|
Capital
|
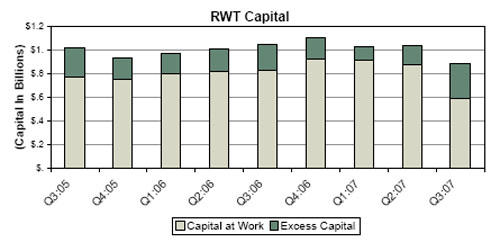
| Ø |
Our
net liquidity at September 30, 2007 totaled $322 million and included
$310
unrestricted cash, $6 million residential real estate loans, and
$45
million AAA-rated securities, less $39 million of Redwood
debt.
|
| Ø |
Duringthe
quarter, we took several actions to improve our overall liquidity
position, including increasing cash levels and decreasing our reliance
on
short-term borrowing (which have become unstable). We increased
our net
liquidity during the third quarter primarily as a result of two
residential securitizations, and the sale of most of our AAA-rated
securities and remaining residential
loans.
|
| Ø |
At
September 30, 2007, we had $298 million of excess capital, an increase
from the $158 million excess capital we had at June 30, 2007 and
the $183
million with which we began the year. We derive our excess capital
figures
by calculating the amount of cash we have available for investment
if we
fully leveraged our loans and securities in accordance with our
internal
risk-adjusted capital policies and deducted from the resulting
cash
balances an amount we believe is sufficient to fund operations,
working
capital, and provide for any liquidity risks. We include long-term
subordinated notes as part of our capital base
calculations.
|
| Ø |
Uses
of capital during the third quarter included acquisitions ($19
million)
and dividends ($22 million). Sources of capital included sales
($43
million), net recycling of capital through securitization ($78
million),
equity issuance ($7 million), and net cash flows received from
our
portfolio after operating costs ($53
million).
|
| Ø |
Capital
employed decreased in the third quarter from $877 million to $585
million
primarily as a result of decreases in market values on our investments.
Market declines do not have a large effect on excess capital, since,
for
the most part, asset value declines result in an equal reduction
of both
total capital and also of capital required under our internal
risk-adjusted capital guidelines.
|
| Ø |
Our
total capital base declined from $1.0 billion at June 30, 2007
to $0.9
billion at September 30, 2007. The primary reason was the decline
in
market values on our investments. Our total capital base equals
capital at
work plus excess capital.
|
|
The
Redwood
Review
3rd
Quarter
2007
|
|
67 |
|
|
Redwood
Debt
|
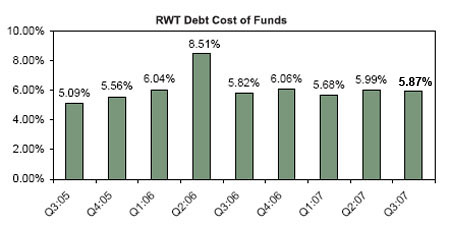
| 68 |
|
The
Redwood
Review
3rd
Quarter
2007
|
|
|
Redwood
Debt
|
|
Debt
|
| Ø |
During
the quarter, Redwood debt decreased from $0.9 billion at June 30,
2007 to
$39 million at quarter end. This primarily reflects our efforts
during the
quarter to free up capital invested in whole loans and AAA-rated
securities for deployment into higher yielding assets and reduce
our
exposure to short-term collateralized financing facilities, which
have
become unstable.
|
| Ø |
Redwood
debt balances were $39 million at the end of the third quarter
of 2007 and
collateralized by $45 million of AAA-rated
securities.
|
| Ø |
Interest
expense for Redwood debt was $6 million for the third quarter,
a decrease
from the $23 million expense in the previous quarter as we significantly
reduced our short term borrowings early in the third quarter of
2007.
|
| Ø |
The
cost of funds for Redwood’s debt was 5.87% for the third quarter and 5.99%
for the second quarter. Our debt expense varies, due to short-term
interest rates, the type of facility used, and the type of collateral
financed.
|
| Ø |
At
September 30, 2007, all Redwood debt was short-term debt collateralized
by
the pledge of assets. Maturities are generally one year or less,
and the
interest rate usually adjusts to market levels each
month.
|
| Ø |
When
we fund fixed-rate or hybrid-rate assets with Redwood debt, we
may use
interest rate agreements to reduce the interest rate mismatch between
the
asset and the liability.
|
| Ø |
In
the past, we have issued commercial paper (CP) of the highest CP
rating of
A1+P1 under our Madrona program. We stopped using this facility
in July
2007. Given the subsequent events in the mortgage financing markets
and
issues with others’ structured investment vehicles, we are not certain at
this time when, or if, we will be able to rely on this form of
financing
again.
|
|
The
Redwood
Review
3rd
Quarter
2007
|
|
69 |
 |
Acacia
CDO ABS Issued
|
| · |
The
market for new issuance CDO ABS securities remains in a distressed
state.
New issuance activity in the third quarter was minimal. Dealers
maintained
high levels of inventory and pricing on all securities has remained
in a
state of severe dislocation as a result of the lack of demand and
increased risk associated with deals backed by 2006 and 2007 vintage
assets.
|
| · |
CDO
ABS issuance comprised of commercial, mezzanine, and high grade
backed
collateral virtually ground to a halt during the third quarter.
Total
issuance decreased by 69% over the previous quarter, with issuance
in the
mezzanine and CRE CDO sector being impacted most dramatically and
posting
a 69% and 86%, decrease respectively, when compared to the second
quarter.
|
| · |
The
continued dislocation within the mortgage sector, poor performance
of 2006
and 2007 vintage subprime collateral, and lack of any discernible
market
for new issue CDO ABS has caused us to suspend any new CDO ABS
issuance
through the remainder of 2007. However, we believe that once the
market
stabilizes and investor confidence returns we should be able to
continue
to leverage our competitive advantages in the CDO business and
maintain
our status as a market participant and quality issuer in the CDO
ABS
markets.
|
| · |
Within
our Acacia CDOs, we limited our exposure to the riskier 2006 and
2007
vintage subprime collateral and in the limited incidents where
we did
acquire subprime securities issued in 2006 and 2007, we focused
our
purchases in AA and A rated securities, with small exposure to
BBB and
BBB- rated securities. However, even with these efforts, the decline
in
credit quality of the underlying subprime and CDO collateral within
Acacia
has exceeded our original estimates and there is the possibility
that
investments we made in A and AA rated securities could be at risk
for
ratings downgrades and possibly for eventual losses.
|
| 70 |
|
The
Redwood
Review
3rd
Quarter
2007
|
|
|
Acacia
CDO ABS Issued
|
|
ABS
Issued
|
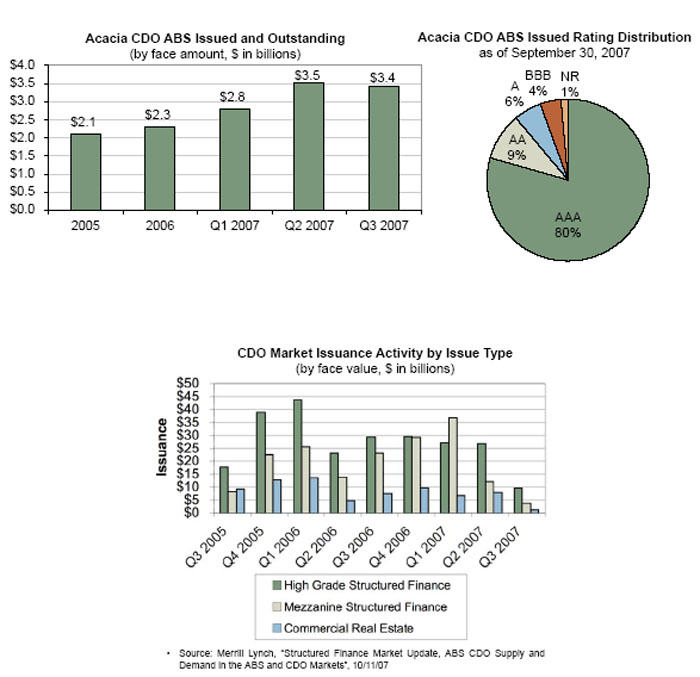
|
The
Redwood
Review
3rd
Quarter
2007
|
|
71 |
|
|
Acacia
CDO ABS Issued
|
| Ø |
Acacia
CDO ABS outstanding remained at $3.4 billion during the third quarter
of
2007, as we did not issue any new CDO ABS during the quarter.
|
| Ø |
The
cost of funds of issued Acacia CDO ABS was 6.19% in the third quarter
of
2007 as compared to 6.00% for the second quarter of 2007. Interest
expense, net of interest rate agreements, for Acacia ABS issued
was $53
million for the third quarter of
2007.
|
| Ø |
At
September 30, 2007, the credit ratings for Acacia bonds outstanding
were
$2.7 billion AAA, $320 million AA, $193 million A, and $145 million
BBB.
In addition, Acacia has sold a portion of its unrated CDO CES (CDO
equity)
to third parties, of which $23 million was outstanding at September
30,
2007.
|
| Ø |
Through
September 30, 2007, we have had 156 securities whose ratings
were upgraded
and 24 securities whose ratings were downgraded within the existing
Acacia
program. During the third quarter, Acacias 10, 11, 12, and OA
1 experienced
the greatest number of securities to be downgraded. Conversely,
our
earlier issued Acacias (5 through 9 and Acacia CRE) contained
the majority
of securities that received rating upgrades. Subsequent to September
30,
2007, the rating agencies have continued to issue downgrade actions
related primarily to subprime and CDO collateral of the 2006
and 2007
vintage.
|
| 72 |
|
The
Redwood
Review
3rd
Quarter
2007
|
|
|
Acacia
CDO ABS Issued
|
|
ABS
Issued
|
| Ø |
For
managing the outstanding Acacia transactions, Redwood’s taxable asset
management subsidiaries earned $2 million of asset management
fees during
the third quarter of 2007. This income was sourced from the
assets owned
by Acacia, and these assets are consolidated on our GAAP balance
sheet.
Thus, for GAAP purposes we include this asset management income
as part of
interest income.
|
| Ø |
Additional
information about Acacia CDO ABS issued can be found in Table
21 of the
Appendix.
|
|
Acacia
Ratings Upgrade/Downgrade Summary
|
|||||||||||
|
as
of
September 30, 2007
|
|||||||||||
|
|
Acacia
|
Acacia
|
Acacia
|
Acacia
|
Acacia
|
Acacia
|
Acacia
|
Acacia
|
Acacia
|
Acacia
|
All
Acacias
|
|
|
5
|
6
|
7
|
8
|
CRE1
|
9
|
10
|
11
|
OA1
|
12
|
thru
Sept. 07 *
|
|
Issuance
Date
|
Jul-04
|
Nov-04
|
Mar-05
|
Jul-05
|
Dec-05
|
Mar-06
|
Aug-06
|
Feb-07
|
May-07
|
Jun-07
|
|
|
Upgrades
|
51
|
30
|
20
|
14
|
7
|
11
|
11
|
10
|
0
|
2
|
156
|
|
Downgrades
|
2
|
1
|
1
|
2
|
1
|
0
|
7
|
6
|
0
|
4
|
24
|
|
Positive
Watch
|
4
|
2
|
0
|
0
|
0
|
0
|
0
|
0
|
0
|
1
|
7
|
|
Negative
Watch
|
0
|
0
|
0
|
0
|
0
|
0
|
1
|
1
|
0
|
1
|
3
|
|
Up/Down
Ratio
|
51
to
2
|
30
to
1
|
20
to
1
|
14
to
2
|
7
to
1
|
11
to
0
|
11
to
7
|
10
to
6
|
0
to
0
|
2
to
4
|
156
to 24
|
|
*
Does not
include Acacia 1, 2, 3, and 4 as each exercised their optional
redemptions.
|
|||||||||||
|
The
Redwood
Review
3rd
Quarter
2007
|
|
73 |
|
|
Sequoia
ABS Issued
|
| · |
We
completed two Sequoia securitizations in the third quarter of
2007.
|
| · |
Sequoia
ABS issued are backed by prime hybrid and ARM
mortgages.
|
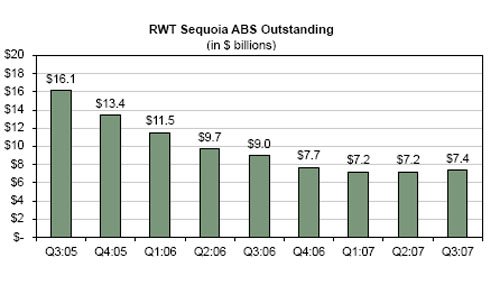
| 74 |
|
The
Redwood
Review
3rd
Quarter
2007
|
|
|
Sequoia
ABS Issued
|
|
ABS
Issued
|
| Ø |
Sequoia
ABS issued and outstanding increased from $7.2 billion to $7.4
billion
during the third quarter. In the third quarter, the CPR for the
loans
owned by Sequoia entities was 37%.
|
| Ø |
We
completed two securitizations during the third quarter, financing
$415
million prime hybrid mortgages and $496 million prime ARM mortgages.
In
conjunction with the securitization, Sequoia issued $818 million
AAA-rated
ABS and another $21 million of investment-grade ABS. The ABS had
similar
interest rate characteristics to the underlying loans, thus minimizing
our
interest rate risk. The current cost of funds on the newly issued
ABS was
5.71%.
|
| Ø |
Interest
expense for Sequoia ABS issued was $103 million for the third quarter
for
a cost of funds of 5.54%.
|
| Ø |
Redwood’s
economic risk with respect to Sequoia’s assets and liabilities is
generally limited to the value of Sequoia ABS we have acquired,
which at
September 30, included $32 million market value IO securities
rated AAA,
$46 million CES, and $16 million IGS. For GAAP accounting purposes,
we
account for Sequoia transactions as financings, so the assets
owned by
Sequoia are consolidated with our assets and the ABS bonds issued
by
Sequoia are consolidated with our liabilities. As a result, the
Sequoia
ABS we acquire do not appear on our GAAP balance sheet, but rather
are
implicitly represented as the excess of consolidated Sequoia
assets over
consolidated Sequoia
liabilities.
|
| Ø |
Additional
information about Sequoia ABS issued can be found in Tables 19
and 20 of
the Appendix.
|
|
The
Redwood
Review
3rd
Quarter
2007
|
|
75 |
|
|
Glossary
|
| 76 |
|
The
Redwood
Review
3rd
Quarter
2007
|
|
|
Glossary
|
|
The
Redwood
Review
3rd
Quarter
2007
|
|
77 |
|
|
Glossary
|
| 78 |
|
The
Redwood
Review
3rd
Quarter
2007
|
|
|
Glossary
|
|
The
Redwood
Review
3rd
Quarter
2007
|
|
79 |
|
|
Glossary
|
| 80 |
|
The
Redwood
Review
3rd
Quarter
2007
|
|
|
Glossary
|
|
The
Redwood
Review
3rd
Quarter
2007
|
|
81 |
|
|
Glossary
|
| 82 |
|
The
Redwood
Review
3rd
Quarter
2007
|
|
|
|
Financial
Tables
3rd
Quarter 2007
|
|
|
|
|
|
|
Nine
|
Nine
|
|||||||||||||||||||||||||||||||||
|
2007
|
2007
|
2007
|
2006
|
2006
|
2006
|
2006
|
2005
|
2005
|
Months
|
Months
|
||||||||||||||||||||||||
|
Q3
|
Q2
|
Q1
|
Q4
|
Q3
|
Q2
|
Q1
|
Q4
|
Q3
|
2007
|
2006
|
||||||||||||||||||||||||
|
|
|
|||||||||||||||||||||||||||||||||
|
Interest
income
|
$205,748
|
$208,039
|
$207,906
|
$213,504
|
$217,504
|
$214,544
|
$224,795
|
$234,531
|
$246,810
|
$621,693
|
$656,843
|
|||||||||||||||||||||||
|
Net
securities
discount amortization income
|
20,514
|
23,849
|
20,268
|
18,665
|
17,842
|
13,234
|
13,245
|
10,971
|
11,523
|
64,631
|
44,321
|
|||||||||||||||||||||||
|
Other
real
estate investment interest income
|
1,275
|
669
|
2,465
|
-
|
-
|
-
|
-
|
-
|
-
|
4,409
|
-
|
|||||||||||||||||||||||
|
Non
real
estate investment interest income
|
1,143
|
464
|
-
|
-
|
-
|
-
|
-
|
-
|
-
|
1,607
|
-
|
|||||||||||||||||||||||
|
Net
loan
premium amortization expense
|
(8,349
|
)
|
(10,863
|
)
|
(11,705
|
)
|
(13,272
|
)
|
(11,232
|
)
|
(12,046
|
)
|
(11,982
|
)
|
(13,486
|
)
|
(14,507
|
)
|
(30,917
|
)
|
(35,260
|
)
|
||||||||||||
|
(Provision
for) reversal of credit reserve
|
(1,507
|
)
|
(2,500
|
)
|
(3,829
|
)
|
(1,506
|
)
|
(465
|
)
|
2,506
|
(176
|
)
|
(877
|
)
|
805
|
(7,836
|
)
|
1,865
|
|||||||||||||||
|
Total
GAAP
interest income
|
218,824
|
219,658
|
215,105
|
217,391
|
223,649
|
218,238
|
225,882
|
231,139
|
244,631
|
653,587
|
667,769
|
|||||||||||||||||||||||
|
Interest
expense on Redwood debt
|
(5,858
|
)
|
(22,700
|
)
|
(31,094
|
)
|
(16,520
|
)
|
(9,422
|
)
|
(1,822
|
)
|
(2,072
|
)
|
(3,521
|
)
|
(3,789
|
)
|
(59,652
|
)
|
(13,316
|
)
|
||||||||||||
|
ABS
interest
expense consolidated from trusts
|
(155,661
|
)
|
(140,512
|
)
|
(131,391
|
)
|
(152,043
|
)
|
(165,177
|
)
|
(171,659
|
)
|
(178,183
|
)
|
(186,433
|
)
|
(190,996
|
)
|
(427,564
|
)
|
(515,019
|
)
|
||||||||||||
|
ABS
issuance
expense amortization
|
(4,616
|
)
|
(5,681
|
)
|
(7,068
|
)
|
(7,897
|
)
|
(5,786
|
)
|
(6,079
|
)
|
(5,907
|
)
|
(6,069
|
)
|
(5,162
|
)
|
(17,365
|
)
|
(17,772
|
)
|
||||||||||||
|
ABS
interest
rate agreement income
|
1,959
|
3,358
|
1,646
|
2,497
|
3,317
|
3,678
|
2,980
|
3,573
|
623
|
6,963
|
9,975
|
|||||||||||||||||||||||
|
ABS
issuance
premium amortization income
|
2,096
|
2,294
|
1,869
|
1,529
|
2,395
|
2,363
|
2,527
|
2,793
|
2,733
|
6,259
|
7,285
|
|||||||||||||||||||||||
|
Total
consolidated ABS expense
|
(156,222
|
)
|
(140,541
|
)
|
(134,944
|
)
|
(155,914
|
)
|
(165,251
|
)
|
(171,697
|
)
|
(178,583
|
)
|
(186,136
|
)
|
(192,802
|
)
|
(431,707
|
)
|
(515,531
|
)
|
||||||||||||
|
Subordinated
notes interest expense
|
(3,150
|
)
|
(2,516
|
)
|
(2,057
|
)
|
(423
|
)
|
-
|
-
|
-
|
-
|
-
|
(7,723
|
)
|
-
|
||||||||||||||||||
|
GAAP
net
interest income
|
$53,594
|
$53,901
|
$47,010
|
$44,534
|
$48,976
|
$44,719
|
$45,227
|
$41,481
|
$48,040
|
$154,505
|
$138,922
|
|||||||||||||||||||||||
|
Fixed
compensation expense
|
(4,560
|
)
|
(4,286
|
)
|
(4,616
|
)
|
(3,688
|
)
|
(3,437
|
)
|
(3,310
|
)
|
(3,437
|
)
|
(2,879
|
)
|
(2,802
|
)
|
(13,462
|
)
|
(10,184
|
)
|
||||||||||||
|
Variable
compensation expense
|
1,096
|
(198
|
)
|
(2,251
|
)
|
(1,666
|
)
|
(2,630
|
)
|
(1,900
|
)
|
(1,514
|
)
|
(2,110
|
)
|
(1,980
|
)
|
(1,353
|
)
|
(6,044
|
)
|
|||||||||||||
|
Equity
compensation expense
|
(2,593
|
)
|
(3,540
|
)
|
(3,349
|
)
|
(3,233
|
)
|
(2,579
|
)
|
(2,991
|
)
|
(2,694
|
)
|
(2,793
|
)
|
(2,145
|
)
|
(9,482
|
)
|
(8,264
|
)
|
||||||||||||
|
Severance
expense
|
0
|
0
|
(2,380
|
)
|
0
|
0
|
0
|
0
|
0
|
0
|
(2,380
|
)
|
0
|
|||||||||||||||||||||
|
Other
operating expense
|
(5,455
|
)
|
(4,670
|
)
|
(4,479
|
)
|
(4,732
|
)
|
(4,425
|
)
|
(5,149
|
)
|
(4,505
|
)
|
(4,685
|
)
|
(4,362
|
)
|
(14,604
|
)
|
(14,079
|
)
|
||||||||||||
|
Due
diligence
expenses
|
(220
|
)
|
(78
|
)
|
(707
|
)
|
(532
|
)
|
(384
|
)
|
(2,687
|
)
|
(432
|
)
|
(298
|
)
|
(1,075
|
)
|
(1,005
|
)
|
(3,503
|
)
|
||||||||||||
|
Total
GAAP
operating expenses
|
(11,732
|
)
|
(12,772
|
)
|
(17,782
|
)
|
(13,851
|
)
|
(13,455
|
)
|
(16,037
|
)
|
(12,582
|
)
|
(12,765
|
)
|
(12,364
|
)
|
(42,286
|
)
|
(42,074
|
)
|
||||||||||||
|
Realized
gains
(losses) on sales
|
(1,460
|
)
|
1,428
|
303
|
5,308
|
4,968
|
8,241
|
1,062
|
14,815
|
23,053
|
271
|
14,271
|
||||||||||||||||||||||
|
Realized
gains
on calls
|
3,284
|
1,310
|
843
|
1,511
|
722
|
747
|
0
|
4,265
|
2,914
|
5,437
|
1,469
|
|||||||||||||||||||||||
|
Unrealized
market valuation adjustments
|
(102,766
|
)
|
(29,430
|
)
|
(10,264
|
)
|
(1,404
|
)
|
(5,257
|
)
|
(2,995
|
)
|
(2,932
|
)
|
(1,205
|
)
|
(1,051
|
)
|
(142,460
|
)
|
(11,184
|
)
|
||||||||||||
|
Net
gains and
valuation adjustments
|
(100,942
|
)
|
(26,692
|
)
|
(9,118
|
)
|
5,415
|
433
|
5,993
|
(1,870
|
)
|
17,875
|
24,916
|
(136,752
|
)
|
4,556
|
||||||||||||||||||
|
Provision
for
income taxes
|
(1,837
|
)
|
(3,021
|
)
|
(1,801
|
)
|
(407
|
)
|
(3,538
|
)
|
(3,265
|
)
|
(2,760
|
)
|
(4,097
|
)
|
(4,693
|
)
|
(6,659
|
)
|
(9,563
|
)
|
||||||||||||
|
GAAP
net
income (loss)
|
($60,917
|
)
|
$11,416
|
$18,309
|
$35,691
|
$32,416
|
$31,410
|
$28,015
|
$42,495
|
$55,899
|
($31,192
|
)
|
$91,841
|
|||||||||||||||||||||
|
Diluted
average shares
|
27,892
|
28,165
|
27,684
|
27,122
|
26,625
|
26,109
|
25,703
|
25,311
|
25,314
|
27,388
|
26,132
|
|||||||||||||||||||||||
|
GAAP
earnings
per share
|
($2.18
|
)
|
$0.41
|
$0.66
|
$1.32
|
$1.22
|
$1.20
|
$1.09
|
$1.68
|
$2.21
|
($1.14
|
)
|
$3.51
|
|||||||||||||||||||||
|
The
Redwood
Review
3rd
Quarter
2007
|
Appendix
Table
1 - GAAP
Earnings
|
85 |
|
|
Table
2: Core Earnings ($ in thousands, except per share
data)
|
|
|
|
|
|
|
|
|
|
|
|
|
|
|
|
|
|
|
|
|
|
|
|
|
|
|||||||||||
|
|
|
|
|
|
|
|
|
|
|
|
|
|
|
|
|
|
|
|
|
Nine
|
|
Nine
|
|
|||||||||||
|
|
|
2007
|
|
2007
|
|
2007
|
|
2006
|
|
2006
|
|
2006
|
|
2006
|
|
2005
|
|
2005
|
|
Months
|
|
Months
|
|
|||||||||||
|
|
|
Q3
|
|
Q2
|
|
Q1
|
|
Q4
|
|
Q3
|
|
Q2
|
|
Q1
|
|
Q4
|
|
Q3
|
|
2007
|
|
2006
|
|
|||||||||||
|
|
|
|
|
|
|
|
|
|
|
|
|
|
|
|
|
|
|
|
|
|
|
|
|
|||||||||||
|
GAAP
net
income (loss)
|
|
|
$(60,917
|
)
|
|
$11,416
|
|
|
$18,309
|
|
|
$35,691
|
|
|
$32,416
|
|
|
$31,410
|
|
|
$28,015
|
|
|
$42,495
|
|
|
$55,899
|
|
|
$(31,192
|
)
|
|
$91,841
|
|
|
|
|
|
|
|
|
|
|
|
|
|
|
|
|
|
|
|
|
|
|
|
|
|
|
|
|
|
|
|
|
|
||||
|
Not
included
in core earnings
|
|
|
|
|
|
|
|
|
|
|
|
|
|
|
|
|
|
|
|
|
|
|
|
|
|
|
|
|
|
|
||||
|
Severance
expense
|
|
|
-
|
|
|
-
|
|
|
(2,380
|
)
|
|
-
|
|
|
-
|
|
|
-
|
|
|
-
|
|
|
-
|
|
|
-
|
|
|
(2,380
|
)
|
|
-
|
|
|
Realized
gains
on sales
|
|
|
(1,460
|
)
|
|
1,428
|
|
|
303
|
|
|
5,308
|
|
|
4,968
|
|
|
8,241
|
|
|
1,062
|
|
|
14,815
|
|
|
23,053
|
|
|
271
|
|
|
14,271
|
|
|
Realized
gains
on calls
|
|
|
3,284
|
|
|
1,310
|
|
|
843
|
|
|
1,511
|
|
|
722
|
|
|
747
|
|
|
-
|
|
|
4,265
|
|
|
2,914
|
|
|
5,437
|
|
|
1,469
|
|
|
Unrealized
market valuation adjustments
|
|
|
(102,766
|
)
|
|
(29,430
|
)
|
|
(10,264
|
)
|
|
(1,404
|
)
|
|
(5,257
|
)
|
|
(2,995
|
)
|
|
(2,932
|
)
|
|
(1,205
|
)
|
|
(1,051
|
)
|
|
(142,460
|
)
|
|
(11,184
|
)
|
|
Variable
stock
option market value change
|
|
|
-
|
|
|
-
|
|
|
-
|
|
|
-
|
|
|
-
|
|
|
-
|
|
|
-
|
|
|
25
|
|
|
16
|
|
|
-
|
|
|
-
|
|
|
Total
GAAP /
core earnings differences
|
|
|
(100,942
|
)
|
|
(26,692
|
)
|
|
(11,498
|
)
|
|
5,415
|
|
|
433
|
|
|
5,993
|
|
|
(1,870
|
)
|
|
17,900
|
|
|
24,932
|
|
|
(139,132
|
)
|
|
4,556
|
|
|
|
|
|
|
|
|
|
|
|
|
|
|
|
|
|
|
|
|
|
|
|
|
|
|
|
|
|||||||||
|
Core
earnings
|
|
|
$40,025
|
|
|
$38,108
|
|
|
$29,807
|
|
|
$30,276
|
|
|
$31,983
|
|
|
$25,417
|
|
|
$29,885
|
|
|
$24,594
|
|
|
$30,967
|
|
|
$107,940
|
|
|
$87,285
|
|
|
|
|
|
|
|
|
|
|
|
|
|
|
|
|
|
|
|
|
|
|
|
|
|
|
|
|
|
|
|
|
|
||||
|
Per
share
analysis
|
|
|
|
|
|
|
|
|
|
|
|
|
|
|
|
|
|
|
|
|
|
|
|
|
|
|
|
|
|
|
||||
|
GAAP
earnings
(loss) per share
|
|
|
($2.18
|
)
|
|
$0.41
|
|
|
$0.66
|
|
|
$1.32
|
|
|
$1.22
|
|
|
$1.20
|
|
|
$1.09
|
|
|
$1.68
|
|
|
$2.21
|
|
|
($1.14
|
)
|
|
$3.51
|
|
|
|
|
|
|
|
|
|
|
|
|
|
|
|
|
|
|
|
|
|
|
|
|
|
|
|
|
|
|
|
|
|
||||
|
Not
included
in core earnings
|
|
|
|
|
|
|
|
|
|
|
|
|
|
|
|
|
|
|
|
|
|
|
|
|
|
|
|
|
|
|
||||
|
Severance
expense
|
|
|
-
|
|
|
-
|
|
|
(0.09
|
)
|
|
-
|
|
|
-
|
|
|
-
|
|
|
-
|
|
|
-
|
|
|
-
|
|
|
(0.09
|
)
|
|
-
|
|
|
Realized
gains
on sales
|
|
|
(0.05
|
)
|
|
0.05
|
|
|
0.01
|
|
|
0.20
|
|
|
0.19
|
|
|
0.32
|
|
|
0.04
|
|
|
0.59
|
|
|
0.91
|
|
|
0.01
|
|
|
0.55
|
|
|
Realized
gains
on calls
|
|
|
0.13
|
|
|
0.05
|
|
|
0.03
|
|
|
0.05
|
|
|
0.03
|
|
|
0.03
|
|
|
-
|
|
|
0.17
|
|
|
0.12
|
|
|
0.20
|
|
|
0.06
|
|
|
Valuation
adjustments
|
|
|
(3.69
|
)
|
|
(1.04
|
)
|
|
(0.37
|
)
|
|
(0.05
|
)
|
|
(0.20
|
)
|
|
(0.11
|
)
|
|
(0.11
|
)
|
|
(0.05
|
)
|
|
(0.04
|
)
|
|
(5.20
|
)
|
|
(0.43
|
)
|
|
Variable
stock
option market value change
|
|
|
-
|
|
|
-
|
|
|
-
|
|
|
-
|
|
|
-
|
|
|
-
|
|
|
-
|
|
|
-
|
|
|
-
|
|
|
-
|
|
|
-
|
|
|
GAAP
/ Core
earnings differences per share
|
|
|
(3.61
|
)
|
|
(0.94
|
)
|
|
(0.42
|
)
|
|
0.20
|
|
|
0.02
|
|
|
0.23
|
|
|
(0.07
|
)
|
|
0.71
|
|
|
0.98
|
|
|
(5.08
|
)
|
|
0.17
|
|
|
|
|
|
|
|
|
|
|
|
|
|
|
|
|
|
|
|
|
|
|
|
|
|
|
|
|
|||||||||
|
Core
earnings per share
|
|
|
$1.43
|
|
|
$1.35
|
|
|
$1.08
|
|
|
$1.12
|
|
|
$1.20
|
|
|
$0.97
|
|
|
$1.16
|
|
|
$0.97
|
|
|
$1.22
|
|
|
$3.94
|
|
|
$3.34
|
|
|
The
Redwood
Review
3rd
Quarter
2007
|
Appendix
Table
2 - Core
Earnings
|
86 |
|
|
Estimated
|
Actual
|
Actual
|
Estimated
|
Estimated
|
|||||||||||||||||||||||||||||
|
|
|
|
Nine
|
Nine
|
||||||||||||||||||||||||||||||
|
|
2007
|
2007
|
2007
|
2006
|
2006
|
2006
|
2006
|
2005
|
2005
|
Months
|
Months
|
|||||||||||||||||||||||
|
|
Q3
|
Q2
|
Q1
|
Q4
|
Q3
|
Q2
|
Q1
|
Q4
|
Q3
|
2007
|
2006
|
|||||||||||||||||||||||
|
|
|
|
|
|
|
|
||||||||||||||||||||||||||||
|
GAAP
net
income (loss)
|
$(60,917
|
)
|
$11,416
|
$18,309
|
$35,691
|
$32,416
|
$31,410
|
$28,015
|
$42,495
|
$55,899
|
$(31,192
|
)
|
$91,841
|
|||||||||||||||||||||
|
Difference
in Taxable Income Calculations
|
||||||||||||||||||||||||||||||||||
|
Amortization
and credit losses (net interest income)
|
10,426
|
10,298
|
10,417
|
13,740
|
12,558
|
12,779
|
4,939
|
(1,314
|
)
|
202
|
31,141
|
30,276
|
||||||||||||||||||||||
|
Operating
expense differences
|
(2,080
|
)
|
(2,921
|
)
|
(1,713
|
)
|
(12,079
|
)
|
2,545
|
(288
|
)
|
1,604
|
396
|
576
|
(6,714
|
)
|
3,861
|
|||||||||||||||||
|
Realized
gains
on calls and sales
|
(3,073
|
)
|
(4,735
|
)
|
2,100
|
(5,499
|
)
|
(1,141
|
)
|
(699
|
)
|
(613
|
)
|
(5,959
|
)
|
(8,582
|
)
|
(5,708
|
)
|
(2,453
|
)
|
|||||||||||||
|
Unrealized
market valuation adjustments
|
102,766
|
30,576
|
9,118
|
6,571
|
484
|
2,305
|
3,226
|
1,772
|
2,048
|
142,460
|
6,015
|
|||||||||||||||||||||||
|
Income
tax
provisions
|
1,523
|
1,662
|
1,800
|
405
|
4,123
|
3,265
|
(703
|
)
|
4,096
|
5,013
|
4,985
|
6,685
|
||||||||||||||||||||||
|
Total
differences in GAAP / Tax income
|
109,562
|
34,880
|
21,722
|
3,138
|
18,569
|
17,362
|
8,453
|
(1,009
|
)
|
(743
|
)
|
166,164
|
44,384
|
|||||||||||||||||||||
|
Taxable
Income
|
$48,645
|
$46,296
|
$40,031
|
$38,829
|
$50,985
|
$48,772
|
$36,468
|
$41,486
|
$55,156
|
$134,972
|
$136,225
|
|||||||||||||||||||||||
|
|
||||||||||||||||||||||||||||||||||
|
REIT
taxable
income
|
$48,591
|
$45,233
|
$35,112
|
$41,555
|
$45,751
|
$45,040
|
$35,382
|
$39,793
|
$47,118
|
$128,936
|
$126,173
|
|||||||||||||||||||||||
|
Taxable
income
in taxable subsidiaries
|
54
|
1,063
|
4,919
|
(2,727
|
)
|
5,234
|
3,732
|
1,086
|
1,694
|
8,038
|
6,036
|
10,052
|
||||||||||||||||||||||
|
Total
taxable
income
|
$48,645
|
$46,296
|
$40,031
|
$38,828
|
$50,985
|
$48,772
|
$36,468
|
$41,487
|
$55,156
|
$134,972
|
$136,225
|
|||||||||||||||||||||||
|
|
||||||||||||||||||||||||||||||||||
|
After-Tax
|
||||||||||||||||||||||||||||||||||
|
Retained
REIT
taxable income
|
$2,675
|
$2,490
|
$1,933
|
$2,010
|
$2,500
|
$2,166
|
$1,313
|
$1,895
|
$1,164
|
$7,098
|
$5,979
|
|||||||||||||||||||||||
|
Retained
taxable income in taxable subsidiaries
|
34
|
663
|
3,068
|
(1,175
|
)
|
3,156
|
2,032
|
556
|
1,238
|
4,386
|
3,765
|
5,744
|
||||||||||||||||||||||
|
Total
retained
taxable income
|
$2,709
|
$3,153
|
$5,001
|
$835
|
$5,656
|
$4,198
|
$1,869
|
$3,133
|
$5,550
|
$10,863
|
$11,723
|
|||||||||||||||||||||||
|
|
||||||||||||||||||||||||||||||||||
|
Shares
used
for taxable EPS calculation
|
27,986
|
27,816
|
27,129
|
26,733
|
26,053
|
25,668
|
25,382
|
25,133
|
24,764
|
27,986
|
26,053
|
|||||||||||||||||||||||
|
|
||||||||||||||||||||||||||||||||||
|
REIT
taxable
income per share
|
$1.74
|
$1.63
|
$1.29
|
$1.55
|
$1.76
|
$1.75
|
$1.39
|
$1.58
|
$1.90
|
$4.66
|
$4.90
|
|||||||||||||||||||||||
|
Taxable
income
in taxable subsidiaries per share
|
$0.00
|
$0.03
|
$0.19
|
($0.10
|
)
|
$0.20
|
$0.16
|
$0.04
|
$0.07
|
$0.32
|
$0.22
|
$0.40
|
||||||||||||||||||||||
|
Total
taxable
income per share
|
$1.74
|
$1.66
|
$1.48
|
$1.45
|
$1.96
|
$1.91
|
$1.44
|
$1.65
|
$2.23
|
$4.88
|
$5.31
|
|||||||||||||||||||||||
|
|
||||||||||||||||||||||||||||||||||
|
Total
retained
taxable income (after-tax)
|
$0.10
|
$0.11
|
$0.18
|
$0.03
|
$0.22
|
$0.16
|
$0.07
|
$0.12
|
$0.22
|
$0.39
|
$0.45
|
|||||||||||||||||||||||
|
The
Redwood
Review
3rd
Quarter
2007
|
Appendix
Table
3 -
Taxable Income and GAAP / Tax Differneces
|
87 |
|
|
Estimated
|
Actual
|
Actual
|
Estimated
|
Estimated
|
|||||||||||||||||||||||||||||
|
|
|
|
|
|
Nine
|
Nine
|
||||||||||||||||||||||||||||
|
|
2007
|
2007
|
2007
|
2006
|
2006
|
2006
|
2006
|
2005
|
2005
|
Months
|
Months
|
|||||||||||||||||||||||
|
|
Q3
|
Q2
|
Q1
|
Q4
|
Q3
|
Q2
|
Q1
|
Q4
|
Q3
|
2007
|
2006
|
|||||||||||||||||||||||
|
Dividends
declared
|
$20,989
|
$20,862
|
$20,347
|
$97,665
|
$18,237
|
$17,967
|
$17,767
|
$92,150
|
$17,335
|
$62,198
|
$53,971
|
|||||||||||||||||||||||
|
Dividend
deduction on stock issued through DRIP
|
81
|
933
|
660
|
812
|
177
|
239
|
176
|
263
|
128
|
1,674
|
592
|
|||||||||||||||||||||||
|
Total
dividend
deductions
|
$21,070
|
$21,795
|
$21,007
|
$98,477
|
$18,414
|
$18,206
|
$17,943
|
$92,413
|
$17,463
|
$63,872
|
$54,563
|
|||||||||||||||||||||||
|
|
||||||||||||||||||||||||||||||||||
|
Regular
dividend per share
|
$0.75
|
$0.75
|
$0.75
|
$0.70
|
$0.70
|
$0.70
|
$0.70
|
$0.70
|
$0.70
|
$2.25
|
$2.10
|
|||||||||||||||||||||||
|
Special
dividend per share
|
-
|
-
|
-
|
3.00
|
-
|
-
|
-
|
3.00
|
-
|
-
|
-
|
|||||||||||||||||||||||
|
Total
dividends per share
|
$0.75
|
$0.75
|
$0.75
|
$3.70
|
$0.70
|
$0.70
|
$0.70
|
$3.70
|
$0.70
|
$2.25
|
$2.10
|
|||||||||||||||||||||||
|
|
||||||||||||||||||||||||||||||||||
|
Undistributed
REIT taxable income at beginning of period (pre-tax):
|
$80,394
|
$61,253
|
$50,484
|
$111,411
|
$88,420
|
$65,850
|
$51,731
|
$106,719
|
$80,166
|
$50,484
|
$51,731
|
|||||||||||||||||||||||
|
REIT
taxable
income (pre-tax)
|
48,591
|
45,233
|
35,112
|
41,555
|
45,751
|
45,040
|
35,382
|
39,956
|
47,118
|
128,936
|
126,173
|
|||||||||||||||||||||||
|
Permanently
retained (pre-tax)
|
(4,616
|
)
|
(4,297
|
)
|
(3,336
|
)
|
(4,005
|
)
|
(4,346
|
)
|
(4,263
|
)
|
(3,320
|
)
|
(2,531
|
)
|
(3,102
|
)
|
(12,249
|
)
|
(11,929
|
)
|
||||||||||||
|
Dividend
of
2004 income
|
-
|
-
|
-
|
-
|
-
|
-
|
-
|
-
|
(2,710
|
)
|
-
|
-
|
||||||||||||||||||||||
|
Dividend
of
2005 income
|
-
|
-
|
-
|
-
|
(15,581
|
)
|
(18,207
|
)
|
(17,943
|
)
|
(92,413
|
)
|
(14,753
|
)
|
-
|
(51,731
|
)
|
|||||||||||||||||
|
Dividend
of
2006 income
|
(7,682
|
)
|
(21,795
|
)
|
(21,007
|
)
|
(98,477
|
)
|
(2,833
|
)
|
-
|
-
|
-
|
-
|
(50,484
|
)
|
(2,833
|
)
|
||||||||||||||||
|
Dividend
of
2007 income
|
(13,388
|
)
|
-
|
-
|
-
|
-
|
-
|
-
|
-
|
-
|
(13,388
|
)
|
-
|
|||||||||||||||||||||
|
|
||||||||||||||||||||||||||||||||||
|
Undistributed
REIT taxable income at period end (pre-tax):
|
$103,299
|
$80,394
|
$61,253
|
$50,484
|
$111,411
|
$88,420
|
$65,850
|
$51,731
|
$106,719
|
$103,299
|
$111,411
|
|||||||||||||||||||||||
|
|
||||||||||||||||||||||||||||||||||
|
Undistributed
REIT taxable income (pre-tax) at period end
|
||||||||||||||||||||||||||||||||||
|
From
2005's
income
|
$0
|
$0
|
$0
|
$0
|
$0
|
$15,581
|
$33,788
|
$51,731
|
$106,719
|
$0
|
$0
|
|||||||||||||||||||||||
|
From
2006's
income
|
-
|
7,682
|
29,477
|
50,484
|
111,411
|
72,839
|
32,062
|
-
|
-
|
-
|
111,411
|
|||||||||||||||||||||||
|
From
2007's
income
|
103,299
|
72,712
|
31,776
|
-
|
-
|
-
|
-
|
-
|
-
|
103,299
|
-
|
|||||||||||||||||||||||
|
Total
|
$103,299
|
$80,394
|
$61,253
|
$50,484
|
$111,411
|
$88,420
|
$65,850
|
$51,731
|
$106,719
|
$103,299
|
$111,411
|
|||||||||||||||||||||||
|
|
||||||||||||||||||||||||||||||||||
|
Shares
outstanding at period end
|
27,986
|
27,816
|
27,129
|
26,733
|
26,053
|
25,668
|
25,382
|
25,133
|
24,764
|
27,986
|
26,053
|
|||||||||||||||||||||||
|
Undistributed
REIT taxable income (pre-tax)
|
||||||||||||||||||||||||||||||||||
|
per
share
outstanding at period end
|
$3.69
|
$2.89
|
$2.26
|
$1.89
|
$4.28
|
$3.44
|
$2.59
|
$2.06
|
$4.31
|
$3.69
|
$4.28
|
|||||||||||||||||||||||
|
The
Redwood
Review
3rd
Quarter
2007
|
Appendix
Table
4 -
Retention
and Distribution of Taxable Income
|
88 |
|
|
Table
5: Assets ($ in
millions)
|
|
|
|
|
|
|
|
|
|
|
|
|||||||||||||||||||
|
|
2007
|
2007
|
2007
|
2006
|
2006
|
2006
|
2006
|
2005
|
2005
|
|||||||||||||||||||
|
|
Q3
|
Q2
|
Q1
|
Q4
|
Q3
|
Q2
|
Q1
|
Q4
|
Q3
|
|||||||||||||||||||
|
Residential
CES owned by Redwood
|
$177
|
$259
|
$256
|
$230
|
$291
|
$403
|
$303
|
$309
|
$338
|
|||||||||||||||||||
|
Residential
CES consolidated from Acacia
|
356
|
486
|
496
|
492
|
424
|
274
|
292
|
284
|
305
|
|||||||||||||||||||
|
Total
GAAP residential CES
|
$533
|
$745
|
$752
|
$722
|
$715
|
$677
|
$595
|
$593
|
$643
|
|||||||||||||||||||
|
|
||||||||||||||||||||||||||||
|
Residential
loans owned by Redwood
|
$6
|
$878
|
$1,256
|
$1,339
|
$520
|
$351
|
$87
|
$45
|
$17
|
|||||||||||||||||||
|
Residential
loans consolidated from Sequoia
|
7,624
|
7,473
|
7,424
|
7,985
|
9,323
|
10,102
|
11,903
|
13,830
|
16,539
|
|||||||||||||||||||
|
Total
GAAP residential loans
|
$7,630
|
$8,351
|
$8,680
|
$9,324
|
$9,843
|
$10,453
|
$11,990
|
$13,875
|
$16,556
|
|||||||||||||||||||
|
|
||||||||||||||||||||||||||||
|
Residential
IGS owned by Redwood
|
$61
|
$204
|
$106
|
$318
|
$105
|
$206
|
$42
|
$151
|
$139
|
|||||||||||||||||||
|
Residential
IGS consolidated from Acacia
|
1,641
|
1,958
|
1,920
|
1,379
|
1,369
|
1,184
|
1,305
|
1,109
|
1,140
|
|||||||||||||||||||
|
Total
GAAP residential IGS
|
$1,702
|
$2,162
|
$2,026
|
$1,697
|
$1,474
|
$1,390
|
$1,347
|
$1,260
|
$1,279
|
|||||||||||||||||||
|
|
||||||||||||||||||||||||||||
|
Commercial
CES owned by Redwood
|
$157
|
$180
|
$189
|
$224
|
$156
|
$93
|
$68
|
$59
|
$98
|
|||||||||||||||||||
|
Commercial
CES consolidated from Acacia
|
238
|
271
|
246
|
224
|
224
|
178
|
156
|
160
|
89
|
|||||||||||||||||||
|
Total
GAAP commercial CES
|
$395
|
$451
|
$435
|
$448
|
$380
|
$271
|
$224
|
$219
|
$187
|
|||||||||||||||||||
|
|
||||||||||||||||||||||||||||
|
Commercial
loans owned by Redwood
|
$0
|
$0
|
$0
|
$2
|
$2
|
$2
|
$2
|
$7
|
$21
|
|||||||||||||||||||
|
Commercial
loans consolidated from securitization
|
26
|
26
|
26
|
26
|
30
|
36
|
53
|
53
|
35
|
|||||||||||||||||||
|
Total
GAAP commercial loans
|
$26
|
$26
|
$26
|
$28
|
$32
|
$38
|
$55
|
$60
|
$56
|
|||||||||||||||||||
|
|
||||||||||||||||||||||||||||
|
Commercial
IGS owned by Redwood
|
$2
|
$6
|
$9
|
$0
|
$0
|
$1
|
$3
|
$6
|
$23
|
|||||||||||||||||||
|
Commercial
IGS consolidated from Acacia
|
103
|
105
|
107
|
120
|
135
|
130
|
182
|
179
|
200
|
|||||||||||||||||||
|
Total
GAAP commercial IGS
|
$105
|
$111
|
$116
|
$120
|
$135
|
$131
|
$185
|
$185
|
$223
|
|||||||||||||||||||
|
|
||||||||||||||||||||||||||||
|
CDO
CES owned by Redwood
|
$4
|
$8
|
$4
|
$9
|
$10
|
$5
|
$5
|
$5
|
$12
|
|||||||||||||||||||
|
CDO
CES consolidated from Acacia
|
13
|
13
|
12
|
13
|
13
|
10
|
9
|
7
|
0
|
|||||||||||||||||||
|
Total
GAAP CDO CES
|
$17
|
$21
|
$16
|
$22
|
$23
|
$15
|
$14
|
$12
|
$12
|
|||||||||||||||||||
|
|
||||||||||||||||||||||||||||
|
CDO
IGS owned by Redwood
|
$5
|
$16
|
$20
|
$14
|
$2
|
$17
|
$4
|
$6
|
$5
|
|||||||||||||||||||
|
CDO
IGS consolidated from Acacia
|
170
|
219
|
234
|
210
|
183
|
160
|
160
|
145
|
141
|
|||||||||||||||||||
|
Total
GAAP CDO IGS
|
$175
|
$235
|
$254
|
$224
|
$185
|
$177
|
$164
|
$151
|
$146
|
|||||||||||||||||||
|
|
||||||||||||||||||||||||||||
|
Other
real estate investments owned by Redwood
|
$24
|
$32
|
$47
|
$0
|
$0
|
$0
|
$0
|
$0
|
$0
|
|||||||||||||||||||
|
Other
real estate investments consolidated from Acacia
|
1
|
2
|
3
|
0
|
0
|
0
|
0
|
0
|
0
|
|||||||||||||||||||
|
Total
other real estate investments
|
$25
|
$34
|
$50
|
$0
|
$0
|
$0
|
$0
|
$0
|
$0
|
|||||||||||||||||||
|
|
||||||||||||||||||||||||||||
|
Non-real
estate investments owned by Redwood
|
$0
|
$0
|
$0
|
$0
|
$0
|
$0
|
$0
|
$0
|
$0
|
|||||||||||||||||||
|
Non-real
estate investments consolidated from Acacia
|
80
|
80
|
0
|
0
|
0
|
0
|
0
|
0
|
0
|
|||||||||||||||||||
|
Total
non-real estate investments
|
$80
|
$80
|
$0
|
$0
|
$0
|
$0
|
$0
|
$0
|
$0
|
|||||||||||||||||||
|
|
||||||||||||||||||||||||||||
|
Cash
owned by Redwood
|
$310
|
$83
|
$92
|
$168
|
$113
|
$106
|
$85
|
$176
|
$163
|
|||||||||||||||||||
|
Restricted
cash consolidated from entities
|
137
|
207
|
340
|
112
|
139
|
86
|
131
|
72
|
59
|
|||||||||||||||||||
|
Accrued
interest receivable
|
50
|
57
|
65
|
71
|
67
|
67
|
73
|
76
|
80
|
|||||||||||||||||||
|
Principal
receivable
|
2
|
4
|
7
|
4
|
1
|
1
|
2
|
0
|
2
|
|||||||||||||||||||
|
Derivative
assets
|
20
|
41
|
18
|
27
|
30
|
54
|
48
|
31
|
25
|
|||||||||||||||||||
|
Deferred
tax asset
|
6
|
5
|
6
|
5
|
3
|
5
|
5
|
5
|
8
|
|||||||||||||||||||
|
Deferred
asset-backed security issuance costs
|
47
|
49
|
41
|
42
|
47
|
46
|
52
|
54
|
56
|
|||||||||||||||||||
|
Other
assets
|
23
|
19
|
23
|
16
|
13
|
13
|
10
|
8
|
10
|
|||||||||||||||||||
|
Total
GAAP assets
|
$11,283
|
$12,681
|
$12,947
|
$13,030
|
$13,200
|
$13,530
|
$14,979
|
$16,777
|
$19,505
|
|||||||||||||||||||
|
|
||||||||||||||||||||||||||||
|
Residential
CES owned by Redwood
|
$177
|
$259
|
$256
|
$230
|
$291
|
$403
|
$303
|
$309
|
$338
|
|||||||||||||||||||
|
Residential
loans owned by Redwood
|
6
|
878
|
1,256
|
1,339
|
520
|
351
|
87
|
45
|
17
|
|||||||||||||||||||
|
Residential
IGS owned by Redwood
|
61
|
204
|
106
|
318
|
105
|
206
|
42
|
151
|
139
|
|||||||||||||||||||
|
Commercial
CES owned by Redwood
|
157
|
180
|
189
|
224
|
156
|
93
|
68
|
59
|
98
|
|||||||||||||||||||
|
Commercial
loans owned by Redwood
|
0
|
0
|
0
|
2
|
2
|
2
|
2
|
7
|
21
|
|||||||||||||||||||
|
Commercial
IGS owned by Redwood
|
2
|
6
|
9
|
0
|
0
|
1
|
3
|
6
|
23
|
|||||||||||||||||||
|
CDO
CES owned by Redwood
|
4
|
8
|
4
|
9
|
10
|
5
|
5
|
5
|
12
|
|||||||||||||||||||
|
CDO
IGS owned by Redwood
|
5
|
16
|
20
|
14
|
2
|
17
|
4
|
6
|
5
|
|||||||||||||||||||
|
|
||||||||||||||||||||||||||||
|
Other
real estate investments owned by Redwood
|
24
|
32
|
47
|
0
|
0
|
0
|
0
|
0
|
0
|
|||||||||||||||||||
|
Cash
owned by Redwood
|
310
|
83
|
92
|
168
|
113
|
106
|
85
|
176
|
163
|
|||||||||||||||||||
|
Total
assets owned by Redwood
|
746
|
1,666
|
1,979
|
2,304
|
1,199
|
1,184
|
599
|
764
|
816
|
|||||||||||||||||||
|
Assets
of securitizations for GAAP
|
10,252
|
10,633
|
10,468
|
10,449
|
11,701
|
12,074
|
14,060
|
15,767
|
18,449
|
|||||||||||||||||||
|
ABS
liabilities of entities for GAAP
|
(10,803
|
)
|
(10,675
|
)
|
(9,947
|
)
|
(9,979
|
)
|
(11,554
|
)
|
(11,898
|
)
|
(13,930
|
)
|
(15,585
|
)
|
(18,237
|
)
|
||||||||||
|
Redwood
earning assets - GAAP basis
|
$195
|
$1,624
|
$2,500
|
$2,774
|
$1,346
|
$1,360
|
$729
|
$946
|
$1,028
|
|||||||||||||||||||
|
The
Redwood
Review
3rd
Quarter
2007
|
Appendix
Table
5
- Assets
|
89 |
|
|
Table
6: Liabilities and Equity ($ in
millions)
|
|
2007
|
2007
|
2007
|
2006
|
2006
|
2006
|
2006
|
2005
|
2005
|
||||||||||||||||||||
|
Q3
|
Q2
|
Q1
|
Q4
|
Q3
|
Q2
|
Q1
|
Q4
|
Q3
|
||||||||||||||||||||
|
Redwood
debt
|
$39
|
$658
|
$1,630
|
$1,556
|
$510
|
$529
|
$0
|
$170
|
$162
|
|||||||||||||||||||
|
Madrona
commercial paper
|
0
|
191
|
250
|
300
|
0
|
0
|
0
|
0
|
0
|
|||||||||||||||||||
|
Total
Redwood debt
|
39
|
849
|
1,880
|
1,856
|
510
|
529
|
0
|
170
|
162
|
|||||||||||||||||||
|
ABS
issued, consolidated from entities
|
10,773
|
10,630
|
9,890
|
9,907
|
11,466
|
11,775
|
13,788
|
15,422
|
18,049
|
|||||||||||||||||||
|
Unamortized
IO issuance premium
|
43
|
51
|
62
|
75
|
90
|
106
|
124
|
143
|
163
|
|||||||||||||||||||
|
Unamortized
ABS issuance premium (discount)
|
(13
|
)
|
(6
|
)
|
(5
|
)
|
(3
|
)
|
(2
|
)
|
17
|
18
|
20
|
25
|
||||||||||||||
|
ABS
obligations of entities
|
10,803
|
10,675
|
9,947
|
9,979
|
11,554
|
11,898
|
13,930
|
15,585
|
18,237
|
|||||||||||||||||||
|
Subordinated
notes
|
150
|
150
|
100
|
100
|
0
|
0
|
0
|
0
|
0
|
|||||||||||||||||||
|
Accrued
interest payable
|
63
|
48
|
52
|
50
|
51
|
47
|
43
|
41
|
42
|
|||||||||||||||||||
|
Interest
rate agreements
|
28
|
6
|
7
|
6
|
6
|
4
|
0
|
1
|
1
|
|||||||||||||||||||
|
Accrued
expenses and other liabilities
|
30
|
56
|
17
|
17
|
18
|
29
|
21
|
28
|
30
|
|||||||||||||||||||
|
Dividends
payable
|
21
|
21
|
20
|
19
|
18
|
18
|
18
|
17
|
17
|
|||||||||||||||||||
|
Total
GAAP liabilities
|
11,134
|
11,805
|
12,023
|
12,027
|
12,157
|
12,525
|
14,012
|
15,842
|
18,489
|
|||||||||||||||||||
|
Common
stock and paid-in capital
|
975
|
965
|
928
|
904
|
875
|
854
|
839
|
825
|
808
|
|||||||||||||||||||
|
Accumulated
other comprehensive income
|
(735
|
)
|
(81
|
)
|
(6
|
)
|
93
|
95
|
91
|
82
|
74
|
117
|
||||||||||||||||
|
Cumulative
GAAP earnings
|
778
|
839
|
827
|
809
|
773
|
740
|
709
|
681
|
639
|
|||||||||||||||||||
|
Cumulative
distributions to shareholders
|
(869
|
)
|
(847
|
)
|
(825
|
)
|
(803
|
)
|
(700
|
)
|
(681
|
)
|
(663
|
)
|
(645
|
)
|
(548
|
)
|
||||||||||
|
GAAP
stockholders' equity
|
149
|
876
|
924
|
1,003
|
1,043
|
1,004
|
967
|
935
|
1,016
|
|||||||||||||||||||
|
Total
GAAP liabilities and equity
|
$11,283
|
$12,681
|
$12,947
|
$13,030
|
$13,200
|
$13,530
|
$14,979
|
$16,777
|
$19,505
|
|||||||||||||||||||
|
Total
Redwood debt
|
$39
|
$849
|
$1,880
|
$1,856
|
$510
|
$529
|
$0
|
$170
|
$162
|
|||||||||||||||||||
|
Subordinated
notes
|
150
|
150
|
100
|
100
|
0
|
0
|
0
|
0
|
0
|
|||||||||||||||||||
|
Redwood
obligations
|
$189
|
$999
|
$1,980
|
$1,956
|
$510
|
$529
|
$0
|
$170
|
$162
|
|||||||||||||||||||
|
GAAP
stockholders' equity
|
$149
|
$876
|
$924
|
$1,003
|
$1,043
|
$1,004
|
$967
|
$935
|
$1,016
|
|||||||||||||||||||
|
Redwood
obligations to equity
|
1.3
|
1.1
|
2.1
|
2.0
|
0.5
|
0.5
|
0.0
|
0.2
|
0.2
|
|||||||||||||||||||
|
Redwood
obligations to (equity + Redwood obligations)
|
56
|
%
|
53
|
%
|
68
|
%
|
66
|
%
|
33
|
%
|
35
|
%
|
0
|
%
|
15
|
%
|
14
|
%
|
||||||||||
|
Redwood
obligations
|
$189
|
$999
|
$1,980
|
$1,956
|
$510
|
$529
|
$0
|
$170
|
$162
|
|||||||||||||||||||
|
ABS
obligations of consolidated entities
|
10,803
|
10,675
|
9,947
|
9,979
|
11,554
|
11,898
|
13,930
|
15,585
|
18,237
|
|||||||||||||||||||
|
GAAP
debt
|
$10,992
|
$11,674
|
$11,927
|
$11,935
|
$12,064
|
$12,427
|
$13,930
|
$15,755
|
$18,399
|
|||||||||||||||||||
|
GAAP
debt to equity
|
73.8
|
13.3
|
12.9
|
11.9
|
11.6
|
12.4
|
14.4
|
16.9
|
18.1
|
|||||||||||||||||||
|
GAAP
debt to (equity + GAAP debt)
|
99
|
%
|
93
|
%
|
93
|
%
|
92
|
%
|
92
|
%
|
93
|
%
|
94
|
%
|
94
|
%
|
95
|
%
|
||||||||||
|
The
Redwood
Review
3rd
Quarter
2007
|
Appendix
Table
6 -
Liabilities
and Equity
|
90 |
|
|
Table
7: Book Value and Profitability Ratios ($ in thousands,
except per share
data)
|
|
|
|
|
|
|
|
|
|
|
|
|
|
|
|
|
|
|
|
|
|
|
|
|
||||||||||||
|
|
|
|
|
|
|
|
|
|
|
|
|
|
|
|
|
|
|
|
|
Nine
|
|
Nine
|
||||||||||||
|
|
|
2007
|
|
2007
|
|
2007
|
|
2006
|
|
2006
|
|
2006
|
|
2006
|
|
2005
|
|
2005
|
|
Months
|
|
Months
|
||||||||||||
|
|
|
Q3
|
|
Q2
|
|
Q1
|
|
Q4
|
|
Q3
|
|
Q2
|
|
Q1
|
|
Q4
|
|
Q3
|
|
2007
|
|
2006
|
||||||||||||
|
|
|
|
|
|
|
|
|
|
|
|
|
|
|
|
|
|
|
|
|
|
|
|
||||||||||||
|
GAAP
stockholders' equity
|
|
|
$148,792
|
|
|
$876,084
|
|
|
$924,040
|
|
|
$1,002,690
|
|
|
$1,042,661
|
|
|
$1,004,265
|
|
|
$967,333
|
|
|
$934,960
|
|
|
$1,016,065
|
|
|
$148,792
|
|
|
$1,042,661
|
|
|
Balance
sheet mark-to-market adjustments
|
|
|
(735,082
|
)
|
|
(80,913
|
)
|
|
(6,183
|
)
|
|
93,158
|
|
|
94,780
|
|
|
90,937
|
|
|
81,591
|
|
|
73,731
|
|
|
117,043
|
|
|
(735,082
|
)
|
|
94,780
|
|
|
Core
equity
|
|
|
$883,874
|
|
|
$956,997
|
|
|
$930,223
|
|
|
$909,532
|
|
|
$947,881
|
|
|
$913,328
|
|
|
$885,742
|
|
|
$861,229
|
|
|
$899,022
|
|
|
$883,874
|
|
|
$947,881
|
|
|
|
|
|
|
|
|
|
|
|
|
|
|
|
|
|
|
|
|
|
|
|
|
|
|
|
|
|
|
|
|
|
|
|
|
|
|
Shares
outstanding at quarter end
|
|
|
27,986
|
|
|
27,816
|
|
|
27,129
|
|
|
26,733
|
|
|
26,053
|
|
|
25,668
|
|
|
25,382
|
|
|
25,133
|
|
|
24,764
|
|
|
27,986
|
|
|
26,053
|
|
|
|
|
|
|
|
|
|
|
|
|
|
|
|
|
|
|
|
|
|
|
|
|
|
|
|
|
|
|
|
|
|
|
|
|
|
|
GAAP
equity per share
|
|
|
$5.32
|
|
|
$31.50
|
|
|
$34.06
|
|
|
$37.51
|
|
|
$40.02
|
|
|
$39.13
|
|
|
$38.11
|
|
|
$37.20
|
|
|
$41.03
|
|
|
5.32
|
|
|
$40.02
|
|
|
Core
equity per share
|
|
|
$31.58
|
|
|
$34.40
|
|
|
$34.29
|
|
|
$34.02
|
|
|
$36.38
|
|
|
$35.58
|
|
|
$34.90
|
|
|
$34.27
|
|
|
$36.30
|
|
|
31.58
|
|
|
$36.38
|
|
|
|
|
|
|
|
|
|
|
|
|
|
|
|
|
|
|
|
|
|
|
|
|
|
|
|
|
|
|
|
|
|
|
|
|
|
|
Net
interest income
|
|
|
$53,594
|
|
|
$53,901
|
|
|
$47,010
|
|
|
$44,534
|
|
|
$48,976
|
|
|
$44,719
|
|
|
$45,227
|
|
|
$41,481
|
|
|
$48,040
|
|
|
$154,505
|
|
|
$138,922
|
|
|
Net
interest income / average core equity
|
|
|
22.48
|
%
|
|
22.66
|
%
|
|
20.33
|
%
|
|
19.28
|
%
|
|
21.02
|
%
|
|
19.91
|
%
|
|
20.62
|
%
|
|
18.85
|
%
|
|
21.82
|
%
|
|
32.76
|
%
|
|
20.52
|
%
|
|
|
|
|
|
|
|
|
|
|
|
|
|
|
|
|
|
|
|
|
|
|
|
|
|
|
|
|
|
|
|
|
|
|
|
|
|
Operating
expenses (excluding severance expense)
|
|
|
$11,732
|
|
|
$12,772
|
|
|
$15,402
|
|
|
$13,851
|
|
|
$13,455
|
|
|
$16,037
|
|
|
$12,582
|
|
|
$12,765
|
|
|
$12,364
|
|
|
$39,906
|
|
|
$42,074
|
|
|
|
|
|
|
|
|
|
|
|
|
|
|
|
|
|
|
|
|
|
|
|
|
|
|
|
|
|
|
|
|
|
|
|
|
|
|
Average
total assets
|
|
|
$12,232,304
|
|
|
$12,688,468
|
|
|
$12,865,979
|
|
|
$13,041,794
|
|
|
$13,480,361
|
|
|
$14,168,755
|
|
|
$15,839,483
|
|
|
$18,348,681
|
|
|
$20,991,299
|
|
|
$12,594,827
|
|
|
$14,487,557
|
|
|
Average
total equity
|
|
|
$851,869
|
|
|
$946,454
|
|
|
$1,008,688
|
|
|
$1,008,863
|
|
|
$1,011,609
|
|
|
$980,402
|
|
|
$952,230
|
|
|
$999,313
|
|
|
$1,014,329
|
|
|
$934,845
|
|
|
$981,632
|
|
|
|
|
|
|
|
|
|
|
|
|
|
|
|
|
|
|
|
|
|
|
|
|
|
|
|
|
|
|
|
|
|
|
|
|
|
|
Operating
expenses / net interest income
|
|
|
21.89
|
%
|
|
23.70
|
%
|
|
32.76
|
%
|
|
31.10
|
%
|
|
27.47
|
%
|
|
35.86
|
%
|
|
27.82
|
%
|
|
30.77
|
%
|
|
25.74
|
%
|
|
25.83
|
%
|
|
30.29
|
%
|
|
Operating
expenses / average total assets
|
|
|
0.38
|
%
|
|
0.40
|
%
|
|
0.48
|
%
|
|
0.42
|
%
|
|
0.40
|
%
|
|
0.45
|
%
|
|
0.32
|
%
|
|
0.28
|
%
|
|
0.24
|
%
|
|
0.42
|
%
|
|
0.39
|
%
|
|
Operating
expenses / average total equity
|
|
|
5.51
|
%
|
|
5.40
|
%
|
|
6.11
|
%
|
|
5.49
|
%
|
|
5.32
|
%
|
|
6.54
|
%
|
|
5.29
|
%
|
|
5.11
|
%
|
|
4.88
|
%
|
|
5.69
|
%
|
|
5.71
|
%
|
|
|
|
|
|
|
|
|
|
|
|
|
|
|
|
|
|
|
|
|
|
|
|
|
|
|
|
|
|
|
|
|
|
|
|
|
|
GAAP
net income (loss)
|
|
|
($60,917
|
)
|
|
$11,416
|
|
|
$18,309
|
|
|
$35,691
|
|
|
$32,416
|
|
|
$31,410
|
|
|
$28,015
|
|
|
$42,495
|
|
|
$55,899
|
|
|
($31,192
|
)
|
|
$91,841
|
|
|
GAAP
net income (loss)/ average total assets
|
|
|
-1.99
|
%
|
|
0.36
|
%
|
|
0.57
|
%
|
|
1.09
|
%
|
|
0.96
|
%
|
|
0.89
|
%
|
|
0.71
|
%
|
|
0.93
|
%
|
|
1.07
|
%
|
|
-0.33
|
%
|
|
0.85
|
%
|
|
GAAP
net income (loss)/ average equity (GAAP ROE)
|
|
|
-28.60
|
%
|
|
4.82
|
%
|
|
7.26
|
%
|
|
14.15
|
%
|
|
12.44
|
%
|
|
12.51
|
%
|
|
11.58
|
%
|
|
18.18
|
%
|
|
22.01
|
%
|
|
-4.45
|
%
|
|
12.47
|
%
|
|
GAAP
net income / average core equity (adjusted ROE)
|
|
|
-25.55
|
%
|
|
4.80
|
%
|
|
7.92
|
%
|
|
15.45
|
%
|
|
13.91
|
%
|
|
13.98
|
%
|
|
12.77
|
%
|
|
19.31
|
%
|
|
25.39
|
%
|
|
-4.41
|
%
|
|
13.56
|
%
|
|
|
|
|
|
|
|
|
|
|
|
|
|
|
|
|
|
|
|
|
|
|
|
|
|
|
|
|
|
|
|
|
|
|
|
|
|
Core
earnings
|
|
|
$40,025
|
|
|
$38,108
|
|
|
$29,807
|
|
|
$30,276
|
|
|
$31,983
|
|
|
$25,417
|
|
|
$29,885
|
|
|
$24,594
|
|
|
$30,967
|
|
|
$107,940
|
|
|
$87,285
|
|
|
Average
core equity
|
|
|
$953,602
|
|
|
$951,378
|
|
|
$925,128
|
|
|
$923,856
|
|
|
$932,030
|
|
|
$898,409
|
|
|
$877,212
|
|
|
$880,329
|
|
|
$880,482
|
|
|
$943,367
|
|
|
$902,752
|
|
|
Core
earnings / average core equity (core ROE)
|
|
|
16.79
|
%
|
|
16.02
|
%
|
|
12.89
|
%
|
|
13.11
|
%
|
|
13.73
|
%
|
|
11.32
|
%
|
|
13.63
|
%
|
|
11.18
|
%
|
|
14.07
|
%
|
|
15.26
|
%
|
|
12.89
|
%
|
|
|
|
|
|
|
|
|
|
|
|
|
|
|
|
|
|
|
|
|
|
|
|
|
|
|
|
|
|
|
|
|
||||
|
Interest
income
|
|
|
$218,824
|
|
|
$219,658
|
|
|
$215,105
|
|
|
$217,391
|
|
|
$223,649
|
|
|
$218,238
|
|
|
$225,882
|
|
|
$231,139
|
|
|
$244,631
|
|
|
$653,587
|
|
|
$667,769
|
|
|
Average
consolidated earning assets
|
|
|
$12,193,242
|
|
|
$12,301,562
|
|
|
$12,279,814
|
|
|
$12,498,889
|
|
|
$12,860,488
|
|
|
$13,581,710
|
|
|
$15,229,790
|
|
|
$17,542,352
|
|
|
$20,085,392
|
|
|
$12,258,453
|
|
|
$13,881,983
|
|
|
Asset
yield
|
|
|
7.18
|
%
|
|
7.14
|
%
|
|
7.01
|
%
|
|
6.96
|
%
|
|
6.96
|
%
|
|
6.43
|
%
|
|
5.93
|
%
|
|
5.27
|
%
|
|
4.87
|
%
|
|
7.11
|
%
|
|
6.41
|
|
|
|
|
|
|
|
|
|
|
|
|
|
|
|
|
|
|
|
|
|
|
|
|
|
|
|
|
|
|
|
|
|
|
|
|
|
|
Interest
expense
|
|
|
($165,230
|
)
|
|
($165,757
|
)
|
|
($168,095
|
)
|
|
($172,434
|
)
|
|
($174,673
|
)
|
|
($173,519
|
)
|
|
($180,655
|
)
|
|
($189,657
|
)
|
|
($196,591
|
)
|
|
($499,082
|
)
|
|
($528,847
|
|
|
Average
consolidated interest-bearing liabilities
|
|
|
$11,376,762
|
|
|
$11,580,196
|
|
|
$11,623,627
|
|
|
$11,836,717
|
|
|
$12,332,390
|
|
|
$13,055,417
|
|
|
$14,800,315
|
|
|
$17,194,545
|
|
|
$19,840,201
|
|
|
$11,527,275
|
|
|
$13,387,000
|
|
|
Cost
of funds
|
|
|
5.81
|
%
|
|
5.73
|
%
|
|
5.78
|
%
|
|
5.83
|
%
|
|
5.67
|
%
|
|
5.32
|
%
|
|
4.88
|
%
|
|
4.41
|
%
|
|
3.96
|
%
|
|
5.77
|
%
|
|
5.27
|
%
|
|
Asset
yield
|
|
|
7.18
|
%
|
|
7.14
|
%
|
|
7.01
|
%
|
|
6.96
|
%
|
|
6.96
|
%
|
|
6.43
|
%
|
|
5.93
|
%
|
|
5.27
|
%
|
|
4.87
|
%
|
|
7.11
|
%
|
|
6.41
|
%
|
|
Cost
of funds
|
|
|
-5.81
|
%
|
|
-5.73
|
%
|
|
-5.78
|
%
|
|
-5.84
|
%
|
|
-5.67
|
%
|
|
-5.32
|
%
|
|
-4.88
|
%
|
|
-4.41
|
%
|
|
-3.96
|
%
|
|
-5.77
|
%
|
|
-5.27
|
%
|
|
Interest
rate spread
|
|
|
1.37
|
%
|
|
1.42
|
%
|
|
1.22
|
%
|
|
1.12
|
%
|
|
1.29
|
%
|
|
1.11
|
%
|
|
1.05
|
%
|
|
0.86
|
%
|
|
0.91
|
%
|
|
1.34
|
%
|
|
1.15
|
%
|
|
|
|
|
|
|
|
|
|
|
|
|
|
|
|
|
|
|
|
|
|
|
|
|
|
|
|
|
|
|
|
|
|
|
|
|
|
Net
interest income
|
|
|
$53,594
|
|
|
$53,901
|
|
|
$47,010
|
|
|
$44,534
|
|
|
$48,976
|
|
|
$44,719
|
|
|
$45,227
|
|
|
$41,481
|
|
|
$48,040
|
|
|
$154,505
|
|
|
$138,922
|
|
|
Average
consolidated earning assets
|
|
|
$12,193,242
|
|
|
$12,301,562
|
|
|
$12,279,814
|
|
|
$12,498,889
|
|
|
$12,860,488
|
|
|
$13,581,710
|
|
|
$15,229,790
|
|
|
$17,542,352
|
|
|
$20,085,392
|
|
|
$12,258,453
|
|
|
$13,881,983
|
|
|
Net
interest margin
|
|
|
1.76
|
%
|
|
1.75
|
%
|
|
1.53
|
%
|
|
1.43
|
%
|
|
1.52
|
%
|
|
1.32
|
%
|
|
1.19
|
%
|
|
0.95
|
%
|
|
0.96
|
%
|
|
1.68
|
%
|
|
1.33
|
%
|
|
The
Redwood
Review
3rd
Quarter
2007
|
Appendix
Table
7 -
Book
Value and Profitability Ratios
|
91 |
|
|
Table
8: Average Balance Sheet ($ in
thousands)
|
|
|
|
|
|
|
|
|
|
|
|
|
|
|||||||||||||||||||||||
|
|
|
|
|
|
|
|
|
|
|
Nine
|
Nine
|
|||||||||||||||||||||||
|
|
2007
|
2007
|
2007
|
2006
|
2006
|
2006
|
2006
|
2005
|
2005
|
Months
|
Months
|
|||||||||||||||||||||||
|
|
Q3
|
Q2
|
Q1
|
Q4
|
Q3
|
Q2
|
Q1
|
Q4
|
Q3
|
2007
|
2006
|
|||||||||||||||||||||||
|
Average
GAAP balances
|
|
|
|
|
|
|
|
|
|
|
|
|||||||||||||||||||||||
|
Residential
CES
|
$698,711
|
$695,709
|
$673,114
|
$654,909
|
$641,694
|
$573,253
|
$516,962
|
$517,138
|
$567,689
|
$689,272
|
$577,563
|
|||||||||||||||||||||||
|
Residential
loans
|
7,873,324
|
8,232,476
|
8,704,147
|
9,212,346
|
9,947,068
|
10,789,275
|
12,542,519
|
14,821,587
|
17,597,906
|
8,266,966
|
11,083,447
|
|||||||||||||||||||||||
|
Residential
IGS
|
2,211,298
|
2,119,280
|
1,795,130
|
1,513,794
|
1,404,281
|
1,358,453
|
1,299,933
|
1,263,277
|
1,219,034
|
2,043,427
|
1,354,833
|
|||||||||||||||||||||||
|
Commercial
CES
|
474,813
|
456,039
|
426,121
|
364,405
|
328,211
|
253,429
|
215,769
|
191,586
|
152,641
|
452,503
|
265,923
|
|||||||||||||||||||||||
|
Commercial
loans
|
25,787
|
25,846
|
28,186
|
29,571
|
32,194
|
42,912
|
56,777
|
59,049
|
47,703
|
26,597
|
43,871
|
|||||||||||||||||||||||
|
Commercial
IGS
|
115,844
|
118,231
|
122,099
|
106,902
|
128,355
|
132,154
|
181,549
|
188,445
|
215,109
|
118,702
|
147,419
|
|||||||||||||||||||||||
|
CDO
CES
|
23,053
|
18,365
|
18,348
|
19,539
|
20,999
|
13,950
|
14,709
|
12,231
|
11,892
|
19,940
|
16,560
|
|||||||||||||||||||||||
|
CDO
IGS
|
253,131
|
262,005
|
230,684
|
198,749
|
174,363
|
171,687
|
157,570
|
149,660
|
138,996
|
248,689
|
167,949
|
|||||||||||||||||||||||
|
Other
real estate investments
|
31,187
|
44,061
|
37,169
|
-
|
-
|
-
|
-
|
-
|
-
|
37,450
|
-
|
|||||||||||||||||||||||
|
Non
real Estate Investments
|
80,000
|
38,681
|
-
|
-
|
-
|
-
|
-
|
-
|
-
|
39,853
|
-
|
|||||||||||||||||||||||
|
Cash
and cash equivalents
|
406,094
|
290,869
|
244,816
|
398,674
|
183,323
|
246,597
|
244,002
|
339,379
|
134,422
|
315,054
|
224,418
|
|||||||||||||||||||||||
|
Earning
assets
|
12,193,242
|
12,301,562
|
12,279,814
|
12,498,889
|
12,860,488
|
13,581,710
|
15,229,790
|
17,542,352
|
20,085,392
|
12,258,453
|
13,881,983
|
|||||||||||||||||||||||
|
Other
assets
|
39,062
|
386,906
|
586,165
|
542,905
|
619,873
|
587,045
|
609,693
|
806,329
|
905,907
|
336,374
|
605,574
|
|||||||||||||||||||||||
|
Total
assets
|
$12,232,304
|
$12,688,468
|
$12,865,979
|
$13,041,794
|
$13,480,361
|
$14,168,755
|
$15,839,483
|
$18,348,681
|
$20,991,299
|
$12,594,827
|
$14,487,557
|
|||||||||||||||||||||||
|
|
||||||||||||||||||||||||||||||||||
|
Redwood
debt
|
$399,068
|
$1,515,988
|
$2,188,561
|
$1,090,480
|
$647,978
|
$85,616
|
$137,181
|
$253,302
|
$297,788
|
$1,361,136
|
$292,129
|
|||||||||||||||||||||||
|
Subordinated
notes
|
145,813
|
117,934
|
97,013
|
21,401
|
-
|
-
|
-
|
-
|
-
|
120,432
|
-
|
|||||||||||||||||||||||
|
ABS
obligations of entities
|
10,831,881
|
9,946,274
|
9,338,053
|
10,724,837
|
11,684,412
|
12,969,801
|
14,663,134
|
16,941,243
|
19,542,413
|
10,045,707
|
13,094,871
|
|||||||||||||||||||||||
|
Other
liabilities
|
3,673
|
161,819
|
233,664
|
196,214
|
136,362
|
132,936
|
86,938
|
154,823
|
136,769
|
132,707
|
118,925
|
|||||||||||||||||||||||
|
Total
liabilities
|
11,380,435
|
11,742,015
|
11,857,291
|
12,032,931
|
12,468,752
|
13,188,353
|
14,887,253
|
17,349,368
|
19,976,970
|
11,659,982
|
13,505,925
|
|||||||||||||||||||||||
|
|
||||||||||||||||||||||||||||||||||
|
Core
equity
|
953,602
|
951,378
|
925,128
|
923,856
|
932,030
|
898,409
|
877,212
|
880,329
|
880,482
|
943,367
|
902,752
|
|||||||||||||||||||||||
|
Balance
sheet mark-to-market adjustments
|
(101,733
|
)
|
(4,924
|
)
|
83,560
|
85,007
|
79,579
|
81,993
|
75,018
|
118,984
|
133,847
|
(8,522
|
)
|
78,880
|
||||||||||||||||||||
|
Total
equity
|
851,869
|
946,454
|
1,008,688
|
1,008,863
|
1,011,609
|
980,402
|
952,230
|
999,313
|
1,014,329
|
934,845
|
981,632
|
|||||||||||||||||||||||
|
Total
liabilities and equity
|
$12,232,304
|
$12,688,468
|
$12,865,979
|
$13,041,794
|
$13,480,361
|
$14,168,755
|
$15,839,483
|
$18,348,681
|
$20,991,299
|
$12,594,827
|
$14,487,557
|
|||||||||||||||||||||||
|
The
Redwood
Review
3rd
Quarter
2007
|
Appendix
Table
8 -
Average
Balance Sheet
|
92 |
|
|
Table
9 - Balances & Yields by Portfolio ($ in
thousands)
|
|
|
|
2007
|
|
2007
|
|
2007
|
|
2006
|
|
2006
|
|
2006
|
|
2006
|
|
2005
|
|
2005
|
|
|||||||||
|
|
|
Q3
|
|
Q2
|
|
Q1
|
|
Q4
|
|
Q3
|
|
Q2
|
|
Q1
|
|
Q4
|
|
Q3
|
||||||||||
|
Residential
IGS
|
||||||||||||||||||||||||||||
|
Current
face
|
$2,186,258
|
$2,276,704
|
$2,094,494
|
$1,708,607
|
$1,484,095
|
$1,406,195
|
$1,361,245
|
$1,273,985
|
$1,282,132
|
|||||||||||||||||||
|
Unamortized
discount
|
(40,139
|
)
|
(32,187
|
)
|
(19,617
|
)
|
(16,382
|
)
|
(17,362
|
)
|
(18,788
|
)
|
(19,874
|
)
|
(11,595
|
)
|
(13,970
|
)
|
||||||||||
|
Credit
protection
|
(42,806
|
)
|
-
|
-
|
-
|
-
|
-
|
-
|
-
|
-
|
||||||||||||||||||
|
Unrealized
market value gains/(losses)
|
(401,080
|
)
|
(81,571
|
)
|
(49,027
|
)
|
5,025
|
8,270
|
2,609
|
5,304
|
(2,300
|
)
|
11,082
|
|||||||||||||||
|
Net
book value
|
$1,702,233
|
$2,162,946
|
$2,025,850
|
$1,697,250
|
$1,475,002
|
$1,390,016
|
$1,346,675
|
$1,260,090
|
$1,279,244
|
|||||||||||||||||||
|
Average
balance
|
$2,211,298
|
$2,119,280
|
$1,795,130
|
$1,513,794
|
$1,404,281
|
$1,358,453
|
$1,299,933
|
$1,263,277
|
$1,219,034
|
|||||||||||||||||||
|
Interest
income
|
$37,360
|
$36,061
|
$29,420
|
$25,626
|
$24,961
|
$22,287
|
$20,180
|
$18,148
|
$16,942
|
|||||||||||||||||||
|
Yield
|
6.75
|
%
|
6.80
|
%
|
6.56
|
%
|
6.77
|
%
|
7.11
|
%
|
6.56
|
%
|
6.21
|
%
|
5.75
|
%
|
5.56
|
%
|
||||||||||
|
Residential
CES
|
||||||||||||||||||||||||||||
|
Current
face
|
$1,269,576
|
$1,291,193
|
$1,259,446
|
$1,180,605
|
$1,183,142
|
$1,168,602
|
$1,034,069
|
$1,013,793
|
$1,029,786
|
|||||||||||||||||||
|
Unamortized
discount
|
(127,079
|
)
|
(125,948
|
)
|
(158,664
|
)
|
(144,842
|
)
|
(140,585
|
)
|
(116,702
|
)
|
(108,371
|
)
|
(121,824
|
)
|
(84,084
|
)
|
||||||||||
|
Credit
protection
|
(450,839
|
)
|
(453,076
|
)
|
(392,768
|
)
|
(372,247
|
)
|
(384,397
|
)
|
(425,578
|
)
|
(373,781
|
)
|
(354,610
|
)
|
(382,862
|
)
|
||||||||||
|
Unrealized
market value gains/(losses)
|
(159,213
|
)
|
32,806
|
44,263
|
58,015
|
57,495
|
50,854
|
43,522
|
55,193
|
80,867
|
||||||||||||||||||
|
Net
book value
|
$532,445
|
$744,975
|
$752,277
|
$721,531
|
$715,655
|
$677,176
|
$595,439
|
$592,552
|
$643,707
|
|||||||||||||||||||
|
Average
balance
|
$698,711
|
$695,709
|
$673,114
|
$654,909
|
$641,694
|
$573,253
|
$516,962
|
$517,138
|
$567,689
|
|||||||||||||||||||
|
Interest
income
|
$38,917
|
$40,885
|
$37,664
|
$35,650
|
$34,585
|
$28,059
|
$26,245
|
$22,556
|
$23,640
|
|||||||||||||||||||
|
Yield
|
22.28
|
%
|
23.51
|
%
|
22.38
|
%
|
21.77
|
%
|
21.56
|
%
|
19.58
|
%
|
20.31
|
%
|
17.45
|
%
|
16.66
|
%
|
||||||||||
|
Other
Real Estate Investments
|
||||||||||||||||||||||||||||
|
Current
face
|
$29,383
|
$33,340
|
$38,670
|
-
|
-
|
-
|
-
|
-
|
-
|
|||||||||||||||||||
|
Unamortized
discount
|
-
|
-
|
-
|
-
|
-
|
-
|
-
|
-
|
-
|
|||||||||||||||||||
|
Credit
protection
|
-
|
-
|
-
|
-
|
-
|
-
|
-
|
-
|
-
|
|||||||||||||||||||
|
Unrealized
market value gains/(losses)
|
(4,083
|
)
|
828
|
11,387
|
-
|
-
|
-
|
-
|
-
|
-
|
||||||||||||||||||
|
Net
book value
|
$25,300
|
$34,168
|
$50,057
|
-
|
-
|
-
|
-
|
-
|
-
|
|||||||||||||||||||
|
Average
balance
|
$31,187
|
$44,061
|
$37,169
|
-
|
-
|
-
|
-
|
-
|
-
|
|||||||||||||||||||
|
Interest
income
|
$1,275
|
$669
|
$2,465
|
-
|
-
|
-
|
-
|
-
|
-
|
|||||||||||||||||||
|
Yield
|
16.36
|
%
|
6.07
|
%
|
26.53
|
%
|
-
|
-
|
-
|
-
|
-
|
-
|
||||||||||||||||
|
Residential
Real Estate Loans
|
||||||||||||||||||||||||||||
|
Current
face
|
$7,553,156
|
$8,269,306
|
$8,582,964
|
$9,212,002
|
$9,718,985
|
$10,318,641
|
$11,846,454
|
$13,719,242
|
$16,386,833
|
|||||||||||||||||||
|
Unamortized
premium
|
92,309
|
98,757
|
117,477
|
132,052
|
143,135
|
155,101
|
166,134
|
178,206
|
191,513
|
|||||||||||||||||||
|
Credit
protection
|
(15,195
|
)
|
(16,416
|
)
|
(19,954
|
)
|
(20,119
|
)
|
(19,326
|
)
|
(19,450
|
)
|
(22,372
|
)
|
(22,656
|
)
|
(22,029
|
)
|
||||||||||
|
Unrealized
market value gains/(losses)
|
-
|
-
|
-
|
-
|
-
|
-
|
-
|
-
|
-
|
|||||||||||||||||||
|
Net
book value
|
$7,630,270
|
$8,351,647
|
$8,680,487
|
$9,323,935
|
$9,842,794
|
$10,454,292
|
$11,990,216
|
$13,874,792
|
$16,556,317
|
|||||||||||||||||||
|
Average
balance
|
$7,873,324
|
$8,232,476
|
$8,704,147
|
$9,212,346
|
$9,947,068
|
$10,789,275
|
$12,542,519
|
$14,821,587
|
$17,597,906
|
|||||||||||||||||||
|
Interest
income
|
$116,248
|
$119,157
|
$129,143
|
$137,568
|
$148,494
|
$154,160
|
$165,664
|
$176,599
|
$193,621
|
|||||||||||||||||||
|
Yield
|
5.91
|
%
|
5.79
|
%
|
5.93
|
%
|
5.97
|
%
|
5.97
|
%
|
5.72
|
%
|
5.28
|
%
|
4.77
|
%
|
4.40
|
%
|
||||||||||
|
The
Redwood
Review
3rd
Quarter
2007
|
Appendix
Table
9 -
Balances
and Yields by Portfolio
|
93 |
|
|
Table
9 - Balances & Yields by Portfolio ($ in
thousands)
|
|
2007
|
|
2007
|
|
2007
|
|
2006
|
|
2006
|
|
2006
|
|
2006
|
|
2005
|
|
2005
|
|
|||||||||||
|
|
|
Q3
|
|
Q2
|
|
Q1
|
|
Q4
|
|
Q3
|
|
Q2
|
|
Q1
|
|
Q4
|
|
Q3
|
||||||||||
|
Commercial
CES
|
||||||||||||||||||||||||||||
|
Current
face
|
$880,715
|
$880,987
|
$792,240
|
$793,743
|
$667,512
|
$486,622
|
$407,466
|
$383,334
|
$323,724
|
|||||||||||||||||||
|
Unamortized
discount
|
(95,968
|
)
|
(95,346
|
)
|
(71,455
|
)
|
(71,424
|
)
|
(48,712
|
)
|
(28,184
|
)
|
(20,473
|
)
|
(28,993
|
)
|
(2,428
|
)
|
||||||||||
|
Credit
protection
|
(310,498
|
)
|
(310,745
|
)
|
(294,466
|
)
|
(295,340
|
)
|
(258,382
|
)
|
(192,134
|
)
|
(167,772
|
)
|
(141,806
|
)
|
(138,530
|
)
|
||||||||||
|
Unrealized
market value gains/(losses)
|
(78,848
|
)
|
(23,955
|
)
|
9,063
|
21,081
|
19,449
|
4,939
|
4,081
|
6,321
|
4,462
|
|||||||||||||||||
|
Net
book value
|
$395,401
|
$450,941
|
$435,382
|
$448,060
|
$379,867
|
$271,243
|
$223,302
|
$218,856
|
$187,228
|
|||||||||||||||||||
|
Average
balance
|
$474,813
|
$456,039
|
$426,121
|
$364,405
|
$328,211
|
$253,429
|
$215,769
|
$191,586
|
$152,641
|
|||||||||||||||||||
|
Interest
income
|
$11,251
|
$11,119
|
$10,140
|
$8,170
|
$7,381
|
$5,581
|
$4,268
|
$3,927
|
$2,747
|
|||||||||||||||||||
|
Yield
|
9.47
|
%
|
9.75
|
%
|
9.52
|
%
|
8.97
|
%
|
9.00
|
%
|
8.81
|
%
|
7.91
|
%
|
8.20
|
%
|
7.20
|
%
|
||||||||||
|
Commercial
IGS
|
||||||||||||||||||||||||||||
|
Current
face
|
$120,097
|
$121,131
|
$121,737
|
$122,869
|
$133,361
|
$134,244
|
$182,041
|
$180,213
|
$209,524
|
|||||||||||||||||||
|
Unamortized
premium/ (discount)
|
(3,054
|
)
|
(3,103
|
)
|
(3,172
|
)
|
(3,367
|
)
|
701
|
727
|
5,295
|
8,100
|
13,303
|
|||||||||||||||
|
Credit
protection
|
-
|
-
|
-
|
-
|
-
|
-
|
-
|
-
|
-
|
|||||||||||||||||||
|
Unrealized
market value gains/(losses)
|
(12,647
|
)
|
(6,884
|
)
|
(2,071
|
)
|
111
|
577
|
(3,937
|
)
|
(2,936
|
)
|
(3,281
|
)
|
(44
|
)
|
||||||||||||
|
Net
book value
|
$104,396
|
$111,144
|
$116,494
|
$119,613
|
$134,639
|
$131,034
|
$184,400
|
$185,032
|
$222,783
|
|||||||||||||||||||
|
Average
balance
|
$115,844
|
$118,231
|
$122,099
|
$106,902
|
$128,355
|
$132,154
|
$181,549
|
$188,445
|
$215,109
|
|||||||||||||||||||
|
Interest
income
|
$1,796
|
$1,827
|
$1,875
|
$2,344
|
$2,342
|
$2,133
|
$2,880
|
$3,102
|
$3,398
|
|||||||||||||||||||
|
Yield
|
6.20
|
%
|
6.18
|
%
|
6.14
|
%
|
8.77
|
%
|
7.30
|
%
|
6.46
|
%
|
6.35
|
%
|
6.58
|
%
|
6.32
|
%
|
||||||||||
|
Commercial
Loans
|
||||||||||||||||||||||||||||
|
Current
face
|
$38,224
|
$38,311
|
$38,394
|
$38,360
|
$42,384
|
$46,959
|
$65,508
|
$70,091
|
$66,348
|
|||||||||||||||||||
|
Unamortized
discount
|
(1,970
|
)
|
(1,995
|
)
|
(2,022
|
)
|
(2,047
|
)
|
(2,073
|
)
|
(2,096
|
)
|
(2,200
|
)
|
(2,258
|
)
|
(2,105
|
)
|
||||||||||
|
Credit
protection
|
(10,489
|
)
|
(10,489
|
)
|
(10,489
|
)
|
(8,141
|
)
|
(8,141
|
)
|
(8,141
|
)
|
(8,141
|
)
|
(8,141
|
)
|
(8,141
|
)
|
||||||||||
|
Unrealized
market value gains/(losses)
|
-
|
-
|
-
|
-
|
-
|
-
|
-
|
-
|
-
|
|||||||||||||||||||
|
Net
book value
|
$25,765
|
$25,827
|
$25,883
|
$28,172
|
$32,170
|
$36,722
|
$55,167
|
$59,692
|
$56,102
|
|||||||||||||||||||
|
Average
balance
|
$25,787
|
$25,846
|
$28,186
|
$29,571
|
$32,194
|
$42,912
|
$56,777
|
$59,049
|
$47,703
|
|||||||||||||||||||
|
Interest
(loss) income
|
$422
|
$419
|
(2,293
|
)
|
$409
|
$524
|
$812
|
$1,238
|
$1,281
|
$1,209
|
||||||||||||||||||
|
Yield
|
6.54
|
%
|
6.48
|
%
|
-32.54
|
%
|
5.53
|
%
|
6.51
|
%
|
7.57
|
%
|
8.72
|
%
|
8.68
|
%
|
10.14
|
%
|
||||||||||
|
CDO
CES
|
||||||||||||||||||||||||||||
|
Current
face
|
$36,440
|
$31,381
|
$23,731
|
$28,731
|
$29,231
|
$22,226
|
$23,226
|
$20,226
|
$20,226
|
|||||||||||||||||||
|
Unamortized
discount
|
(9,855
|
)
|
(9,955
|
)
|
(7,004
|
)
|
(6,889
|
)
|
(7,298
|
)
|
(7,978
|
)
|
(8,048
|
)
|
(8,004
|
)
|
(7,907
|
)
|
||||||||||
|
Credit
protection
|
(3,827
|
)
|
-
|
-
|
-
|
-
|
-
|
-
|
-
|
-
|
||||||||||||||||||
|
Unrealized
market value gains/(losses)
|
(6,000
|
)
|
(293
|
)
|
(575
|
)
|
122
|
326
|
470
|
(436
|
)
|
(484
|
)
|
144
|
||||||||||||||
|
Net
book value
|
$16,758
|
$21,133
|
$16,152
|
$21,964
|
$22,259
|
$14,718
|
$14,742
|
$11,738
|
$12,463
|
|||||||||||||||||||
|
Average
balance
|
$23,053
|
$18,365
|
$18,348
|
$19,539
|
$20,999
|
$13,950
|
$14,709
|
$12,231
|
$11,892
|
|||||||||||||||||||
|
Interest
income
|
$887
|
$660
|
$497
|
$570
|
$609
|
$236
|
$439
|
$125
|
$131
|
|||||||||||||||||||
|
Yield
|
15.40
|
%
|
14.38
|
%
|
10.84
|
%
|
11.67
|
%
|
11.60
|
%
|
6.77
|
%
|
11.94
|
%
|
4.09
|
%
|
4.41
|
%
|
||||||||||
|
The
Redwood
Review
3rd
Quarter
2007
|
Appendix
Table
9 -
Balances
and Yields by Portfolio
|
94 |
|
|
Table
9 - Balances & Yields by Portfolio ($ in
thousands)
|
|
2007
|
2007
|
2007
|
2006
|
2006
|
2006
|
2006
|
2005
|
2005
|
||||||||||||||||||||
|
Q3
|
Q2
|
|
Q1
|
|
Q4
|
|
Q3
|
|
Q2
|
|
Q1
|
|
Q4
|
Q3
|
||||||||||||||
|
CDO
IGS
|
||||||||||||||||||||||||||||
|
Current
face
|
$258,183
|
$262,881
|
$263,237
|
$222,413
|
$182,352
|
$175,586
|
$162,844
|
$149,812
|
$144,246
|
|||||||||||||||||||
|
Unamortized
premium/ (discount)
|
1,264
|
(879
|
)
|
(945
|
)
|
(238
|
)
|
(236
|
)
|
(241
|
)
|
(249
|
)
|
(257
|
)
|
(264
|
)
|
|||||||||||
|
Credit
protection
|
(14,966
|
)
|
(6,217
|
)
|
-
|
-
|
-
|
-
|
-
|
-
|
-
|
|||||||||||||||||
|
Unrealized
market value gains/(losses)
|
(69,326
|
)
|
(21,152
|
)
|
(7,985
|
)
|
2,174
|
2,826
|
1,718
|
944
|
1,092
|
2,362
|
||||||||||||||||
|
Net
book value
|
$175,155
|
$234,633
|
$254,307
|
$224,349
|
$184,942
|
$177,063
|
$163,539
|
$150,647
|
$146,344
|
|||||||||||||||||||
|
Average
balance
|
$253,131
|
$262,005
|
$230,684
|
$198,749
|
$174,363
|
$171,687
|
$157,570
|
$149,660
|
$138,996
|
|||||||||||||||||||
|
Interest
income
|
$4,565
|
$4,641
|
$3,862
|
$3,335
|
$2,881
|
$2,099
|
$2,491
|
$2,571
|
$1,953
|
|||||||||||||||||||
|
Yield
|
7.22
|
%
|
7.08
|
%
|
6.70
|
%
|
6.71
|
%
|
6.61
|
%
|
4.89
|
%
|
6.32
|
%
|
6.87
|
%
|
5.62
|
%
|
||||||||||
|
Non
Real Estate Investments
|
||||||||||||||||||||||||||||
|
Current
face
|
$80,000
|
$80,000
|
-
|
-
|
-
|
-
|
-
|
-
|
-
|
|||||||||||||||||||
|
Unamortized
premium/ (discount)
|
-
|
-
|
-
|
-
|
-
|
-
|
-
|
-
|
-
|
|||||||||||||||||||
|
Credit
protection
|
-
|
-
|
-
|
-
|
-
|
-
|
-
|
-
|
-
|
|||||||||||||||||||
|
Unrealized
market value gains/(losses)
|
-
|
-
|
-
|
-
|
-
|
-
|
-
|
-
|
-
|
|||||||||||||||||||
|
Net
book value
|
$80,000
|
$80,000
|
-
|
-
|
-
|
-
|
-
|
-
|
-
|
|||||||||||||||||||
|
Average
balance
|
$80,000
|
$38,681
|
$0
|
$0
|
$0
|
$0
|
$0
|
$0
|
$0
|
|||||||||||||||||||
|
Interest
income
|
$1,142
|
$464
|
$0
|
$0
|
$0
|
$0
|
$0
|
$0
|
$0
|
|||||||||||||||||||
|
Yield
|
5.71
|
%
|
4.80
|
%
|
0.00
|
%
|
0.00
|
%
|
0.00
|
%
|
0.00
|
%
|
0.00
|
%
|
0.00
|
%
|
0.00
|
%
|
||||||||||
|
Cash
& Equivalents
|
||||||||||||||||||||||||||||
|
Current
face
|
$309,544
|
$82,626
|
$91,656
|
$168,016
|
$112,926
|
$106,491
|
$85,466
|
$175,885
|
$163,160
|
|||||||||||||||||||
|
Unamortized
premium/ (discount)
|
-
|
-
|
-
|
-
|
-
|
-
|
-
|
-
|
-
|
|||||||||||||||||||
|
Credit
protection
|
-
|
-
|
-
|
-
|
-
|
-
|
-
|
-
|
-
|
|||||||||||||||||||
|
Unrealized
market value gains/(losses)
|
-
|
-
|
-
|
-
|
-
|
-
|
-
|
-
|
-
|
|||||||||||||||||||
|
Net
book value
|
$309,544
|
$82,626
|
$91,656
|
$168,016
|
$112,926
|
$106,491
|
$85,466
|
$175,885
|
$163,160
|
|||||||||||||||||||
|
Average
balance
|
$406,094
|
$290,869
|
$244,816
|
$398,674
|
$183,323
|
$246,597
|
$244,002
|
$339,379
|
$134,422
|
|||||||||||||||||||
|
Interest
income
|
$4,960
|
$3,756
|
$2,332
|
$3,719
|
$1,872
|
$2,871
|
$2,477
|
$2,830
|
$990
|
|||||||||||||||||||
|
Yield
|
4.89
|
%
|
5.17
|
%
|
3.81
|
%
|
3.73
|
%
|
4.08
|
%
|
4.66
|
%
|
4.06
|
%
|
3.34
|
%
|
2.95
|
%
|
||||||||||
|
Total
Earning Assets (GAAP)
|
||||||||||||||||||||||||||||
|
Current
face
|
$12,761,576
|
$13,367,860
|
$13,306,569
|
$13,475,346
|
$13,553,988
|
$13,865,566
|
$15,168,319
|
$16,986,581
|
$19,625,979
|
|||||||||||||||||||
|
Unamortized
premium/ (discount)
|
(184,492
|
)
|
(170,656
|
)
|
(129,027
|
)
|
(113,137
|
)
|
(72,430
|
)
|
(18,161
|
)
|
12,214
|
13,375
|
94,058
|
|||||||||||||
|
Credit
protection
|
(848,620
|
)
|
(796,943
|
)
|
(717,677
|
)
|
(695,847
|
)
|
(670,246
|
)
|
(645,303
|
)
|
(572,066
|
)
|
(527,213
|
)
|
(551,562
|
)
|
||||||||||
|
Unrealized
market value gains/(losses)
|
(731,197
|
)
|
(100,221
|
)
|
(11,320
|
)
|
86,528
|
88,943
|
56,653
|
50,479
|
56,541
|
98,873
|
||||||||||||||||
|
Net
book value
|
$10,997,267
|
$12,300,040
|
$12,448,545
|
$12,752,890
|
$12,900,255
|
$13,258,755
|
$14,658,946
|
$16,529,284
|
$19,267,348
|
|||||||||||||||||||
|
Average
balance
|
$12,193,242
|
$12,301,562
|
$12,279,814
|
$12,498,889
|
$12,860,487
|
$13,581,710
|
$15,229,790
|
$17,542,352
|
$20,085,392
|
|||||||||||||||||||
|
Interest
income
|
$218,823
|
$219,658
|
$215,105
|
$217,391
|
$223,649
|
$218,238
|
$225,882
|
$231,139
|
$244,631
|
|||||||||||||||||||
|
Yield
|
7.18
|
%
|
7.14
|
%
|
7.01
|
%
|
6.96
|
%
|
6.96
|
%
|
6.43
|
%
|
5.93
|
%
|
5.27
|
%
|
4.87
|
%
|
||||||||||
|
The
Redwood
Review
3rd
Quarter
2007
|
Appendix
Table
9 -
Balances
and Yields by Portfolio
|
95 |
|
|
Table
10: Portfolio Activity (in
thousands)
|
|
|
2007
|
2007
|
2007
|
2006
|
2006
|
2006
|
2006
|
2005
|
2005
|
|||||||||||||||||||
|
|
Q3
|
Q2
|
Q1
|
Q4
|
Q3
|
Q2
|
Q1
|
Q4
|
Q3
|
|||||||||||||||||||
|
Residential
IGS
|
||||||||||||||||||||||||||||
|
Beginning
balance
|
$2,162,946
|
$2,025,850
|
$1,697,250
|
$1,475,002
|
$1,390,015
|
$1,346,674
|
$1,260,089
|
$1,279,243
|
$1,193,293
|
|||||||||||||||||||
|
Acquisitions
|
153,191
|
267,695
|
535,346
|
352,292
|
120,316
|
179,115
|
80,970
|
116,987
|
114,699
|
|||||||||||||||||||
|
Upgrades
/ downgrades
|
(16,857
|
)
|
-
|
-
|
-
|
-
|
-
|
30,667
|
-
|
-
|
||||||||||||||||||
|
Transfer
to other portfolios
|
-
|
-
|
(13,816
|
)
|
-
|
-
|
-
|
-
|
-
|
-
|
||||||||||||||||||
|
Sales
|
(177,947
|
)
|
(52,217
|
)
|
(108,372
|
)
|
(97,124
|
)
|
(12,669
|
)
|
(104,442
|
)
|
(3,984
|
)
|
(95,328
|
)
|
4,000
|
|||||||||||
|
Principal
payments
|
(46,874
|
)
|
(45,857
|
)
|
(32,248
|
)
|
(31,398
|
)
|
(29,997
|
)
|
(31,136
|
)
|
(25,445
|
)
|
(29,834
|
)
|
(27,627
|
)
|
||||||||||
|
Discount
amortization
|
1,901
|
2,449
|
1,321
|
1,023
|
1,943
|
1,446
|
853
|
790
|
761
|
|||||||||||||||||||
|
Net
mark-to-market adjustment
|
(374,127
|
)
|
(34,974
|
)
|
(53,631
|
)
|
(2,545
|
)
|
5,394
|
(1,642
|
)
|
3,524
|
(11,769
|
)
|
(5,883
|
)
|
||||||||||||
|
Ending
Balance
|
$1,702,233
|
$2,162,946
|
$2,025,850
|
$1,697,250
|
$1,475,002
|
$1,390,015
|
$1,346,674
|
$1,260,089
|
$1,279,243
|
|||||||||||||||||||
|
Residential
CES
|
||||||||||||||||||||||||||||
|
Beginning
balance
|
$744,975
|
$752,277
|
$721,531
|
$715,655
|
$677,176
|
$595,439
|
$592,552
|
$643,707
|
$683,807
|
|||||||||||||||||||
|
Acquisitions
|
1,261
|
39,381
|
73,725
|
20,870
|
87,305
|
89,217
|
52,822
|
54,664
|
57,479
|
|||||||||||||||||||
|
Upgrades
/ downgrades
|
16,857
|
-
|
-
|
-
|
-
|
-
|
(30,667
|
)
|
-
|
-
|
||||||||||||||||||
|
Transfer
to other portfolios
|
-
|
-
|
(4,480
|
)
|
-
|
-
|
-
|
-
|
-
|
-
|
||||||||||||||||||
|
Sales
|
-
|
(3,292
|
)
|
(5,214
|
)
|
(962
|
)
|
(47,585
|
)
|
(4,035
|
)
|
(9,650
|
)
|
(81,292
|
)
|
(98,775
|
)
|
|||||||||||
|
Principal
payments
|
(42,380
|
)
|
(43,556
|
)
|
(35,672
|
)
|
(32,639
|
)
|
(28,835
|
)
|
(23,302
|
)
|
(14,110
|
)
|
(21,523
|
)
|
(17,013
|
)
|
||||||||||
|
Discount
amortization
|
18,435
|
21,065
|
18,892
|
17,412
|
15,917
|
11,684
|
12,391
|
10,098
|
10,766
|
|||||||||||||||||||
|
Net
mark-to-market adjustment
|
(206,703
|
)
|
(20,900
|
)
|
(16,505
|
)
|
1,195
|
11,677
|
8,173
|
(7,899
|
)
|
(13,102
|
)
|
7,443
|
||||||||||||||
|
Ending
balance
|
$532,445
|
$744,975
|
$752,277
|
$721,531
|
$715,655
|
$677,176
|
$595,439
|
$592,552
|
$643,707
|
|||||||||||||||||||
|
Other
Real Estate Investments
|
||||||||||||||||||||||||||||
|
Beginning
balance
|
$34,168
|
$50,057
|
$0
|
$0
|
$0
|
$0
|
$0
|
$0
|
$0
|
|||||||||||||||||||
|
Acquisitions
|
-
|
-
|
40,790
|
-
|
-
|
-
|
-
|
-
|
-
|
|||||||||||||||||||
|
Upgrades
/ downgrades
|
-
|
-
|
-
|
-
|
-
|
-
|
-
|
-
|
-
|
|||||||||||||||||||
|
Transfer
from other portfolios
|
-
|
-
|
18,296
|
-
|
-
|
-
|
-
|
-
|
-
|
|||||||||||||||||||
|
Sales
|
-
|
(2,237
|
)
|
-
|
-
|
-
|
-
|
-
|
-
|
-
|
||||||||||||||||||
|
Principal
payments
|
(3,957
|
)
|
(5,301
|
)
|
(3,079
|
)
|
-
|
-
|
-
|
-
|
-
|
-
|
||||||||||||||||
|
Premium
amortization
|
(2,102
|
)
|
(2,104
|
)
|
(532
|
)
|
-
|
-
|
-
|
-
|
-
|
-
|
||||||||||||||||
|
Net
mark-to-market adjustment
|
(2,809
|
)
|
(6,247
|
)
|
(5,418
|
)
|
-
|
-
|
-
|
-
|
-
|
-
|
||||||||||||||||
|
Ending
balance
|
$25,300
|
$34,168
|
$50,057
|
$0
|
$0
|
$0
|
$0
|
$0
|
$0
|
|||||||||||||||||||
|
Real
Estate Loans
|
||||||||||||||||||||||||||||
|
Beginning
balance
|
$8,351,647
|
$8,680,487
|
$9,323,935
|
$9,842,794
|
$10,454,292
|
$11,990,216
|
$13,874,792
|
$16,556,317
|
$19,630,565
|
|||||||||||||||||||
|
Acquisitions
|
81,527
|
674,932
|
415,283
|
725,695
|
966,673
|
272,627
|
52,691
|
271,875
|
332,049
|
|||||||||||||||||||
|
Sales
|
(13,263
|
)
|
(2,191
|
)
|
-
|
-
|
-
|
-
|
-
|
(240,987
|
)
|
(263,079
|
)
|
|||||||||||||||
|
Principal
payments
|
(783,077
|
)
|
(994,230
|
)
|
(1,047,170
|
)
|
(1,230,462
|
)
|
(1,567,041
|
)
|
(1,799,408
|
)
|
(1,925,476
|
)
|
(2,698,500
|
)
|
(3,129,492
|
)
|
||||||||||
|
Premium
amortization
|
(8,375
|
)
|
(10,889
|
)
|
(11,726
|
)
|
(13,298
|
)
|
(11,254
|
)
|
(12,073
|
)
|
(12,075
|
)
|
(13,334
|
)
|
(14,438
|
)
|
||||||||||
|
Credit
provision
|
(1,507
|
)
|
(2,500
|
)
|
(1,481
|
)
|
(1,505
|
)
|
(465
|
)
|
2,507
|
(141
|
)
|
(877
|
)
|
805
|
||||||||||||
|
Net
charge-offs / (recoveries)
|
2,728
|
6,038
|
1,646
|
711
|
589
|
423
|
425
|
250
|
125
|
|||||||||||||||||||
|
Net
mark-to-market adjustment
|
590
|
-
|
-
|
-
|
-
|
-
|
-
|
48
|
(218
|
)
|
||||||||||||||||||
|
Ending
balance
|
$7,630,270
|
$8,351,647
|
$8,680,487
|
$9,323,935
|
$9,842,794
|
$10,454,292
|
$11,990,216
|
$13,874,792
|
$16,556,317
|
|||||||||||||||||||
|
The
Redwood
Review
3rd
Quarter
2007
|
Appendix
Table
10 -
Portfolio
Activity
|
96 |
|
|
Table
10: Portfolio Activity (in
thousands)
|
|
|
2007
|
2007
|
2007
|
2006
|
2006
|
2006
|
2006
|
2005
|
2005
|
|||||||||||||||||||
|
|
Q3
|
Q2
|
Q1
|
Q4
|
Q3
|
Q2
|
Q1
|
Q4
|
Q3
|
|||||||||||||||||||
|
Commercial
CES
|
||||||||||||||||||||||||||||
|
Beginning
balance
|
$450,941
|
$435,382
|
$448,060
|
$379,867
|
$271,243
|
$223,302
|
$218,856
|
$187,228
|
$138,029
|
|||||||||||||||||||
|
Acquisitions
|
-
|
49,177
|
2,743
|
76,496
|
99,065
|
51,978
|
11,130
|
30,293
|
55,941
|
|||||||||||||||||||
|
Upgrades
/ downgrades
|
-
|
-
|
(3,501
|
)
|
-
|
-
|
-
|
(3,966
|
)
|
-
|
-
|
|||||||||||||||||
|
Sales
|
-
|
-
|
-
|
(9,914
|
)
|
(4,216
|
)
|
(2,820
|
)
|
-
|
-
|
-
|
||||||||||||||||
|
Principal
payments
|
-
|
-
|
-
|
(13
|
)
|
(9
|
)
|
(9
|
)
|
(10
|
)
|
(9
|
)
|
(8
|
)
|
|||||||||||||
|
Discount
/ (premium) amortization
|
65
|
200
|
(9
|
)
|
(289
|
)
|
(451
|
)
|
(257
|
)
|
(564
|
)
|
(276
|
)
|
(416
|
)
|
||||||||||||
|
Net
mark-to-market adjustment
|
(55,605
|
)
|
(33,818
|
)
|
(11,911
|
)
|
1,913
|
14,235
|
(951
|
)
|
(2,144
|
)
|
1,620
|
(6,318
|
)
|
|||||||||||||
|
Ending
Balance
|
$395,401
|
$450,941
|
$435,382
|
$448,060
|
$379,867
|
$271,243
|
$223,302
|
$218,856
|
$187,228
|
|||||||||||||||||||
|
Commercial
IGS
|
||||||||||||||||||||||||||||
|
Beginning
balance
|
$111,144
|
$116,494
|
$119,613
|
$134,639
|
$131,034
|
$184,400
|
$185,032
|
$222,783
|
$217,848
|
|||||||||||||||||||
|
Acquisitions
|
1,990
|
-
|
2,964
|
8,999
|
(3
|
)
|
-
|
2,177
|
29,684
|
17,179
|
||||||||||||||||||
|
Upgrades
/ downgrades
|
-
|
-
|
3,501
|
-
|
-
|
-
|
3,966
|
-
|
-
|
|||||||||||||||||||
|
Sales
|
-
|
-
|
(6,464
|
)
|
(24,007
|
)
|
-
|
(51,501
|
)
|
-
|
(56,292
|
)
|
(4,000
|
)
|
||||||||||||||
|
Principal
payments
|
(3,034
|
)
|
(607
|
)
|
(938
|
)
|
(737
|
)
|
(883
|
)
|
(998
|
)
|
(5,006
|
)
|
(8,560
|
)
|
(4,174
|
)
|
||||||||||
|
Discount
/ (premium) amortization
|
60
|
69
|
67
|
51
|
(14
|
)
|
(90
|
)
|
(159
|
)
|
(145
|
)
|
(269
|
)
|
||||||||||||||
|
Net
mark-to-market adjustment
|
(5,764
|
)
|
(4,812
|
)
|
(2,249
|
)
|
668
|
4,505
|
(777
|
)
|
(1,610
|
)
|
(2,438
|
)
|
(3,801
|
)
|
||||||||||||
|
Ending
Balance
|
$104,396
|
$111,144
|
$116,494
|
$119,613
|
$134,639
|
$131,034
|
$184,400
|
$185,032
|
$222,783
|
|||||||||||||||||||
|
Commercial
Loans
|
||||||||||||||||||||||||||||
|
Beginning
balance
|
$25,827
|
$25,883
|
$28,172
|
$32,170
|
$36,722
|
$55,167
|
$59,692
|
$56,102
|
$41,794
|
|||||||||||||||||||
|
Acquisitions
|
-
|
-
|
-
|
-
|
-
|
-
|
-
|
4,248
|
14,219
|
|||||||||||||||||||
|
Sales
|
-
|
-
|
-
|
-
|
-
|
(8,408
|
)
|
-
|
-
|
(17
|
)
|
|||||||||||||||||
|
Principal
payments
|
(88
|
)
|
(82
|
)
|
38
|
(4,024
|
)
|
(4,574
|
)
|
(10,049
|
)
|
(4,583
|
)
|
(506
|
)
|
158
|
||||||||||||
|
Discount
/ (premium) amortization
|
26
|
26
|
21
|
26
|
22
|
27
|
93
|
(152
|
)
|
(69
|
)
|
|||||||||||||||||
|
Credit
provision
|
-
|
-
|
(2,348
|
)
|
-
|
-
|
-
|
(35
|
)
|
-
|
-
|
|||||||||||||||||
|
Net
mark-to-market adjustment
|
-
|
-
|
-
|
-
|
-
|
(14
|
)
|
-
|
-
|
17
|
||||||||||||||||||
|
Ending
Balance
|
$25,765
|
$25,827
|
$25,883
|
$28,172
|
$32,170
|
$36,722
|
$55,167
|
$59,692
|
$56,102
|
|||||||||||||||||||
|
CDO
CES
|
||||||||||||||||||||||||||||
|
Beginning
balance
|
$21,133
|
$16,152
|
$21,964
|
$22,259
|
$14,718
|
$14,742
|
$11,738
|
$12,463
|
$2,765
|
|||||||||||||||||||
|
Acquisitions
|
-
|
4,804
|
(149
|
)
|
-
|
7,714
|
(87
|
)
|
3,000
|
(97
|
)
|
9,970
|
||||||||||||||||
|
Upgrades
/ downgrades
|
5,822
|
-
|
(5,000
|
)
|
-
|
-
|
-
|
-
|
-
|
-
|
||||||||||||||||||
|
Sales
|
-
|
-
|
-
|
-
|
(722
|
)
|
-
|
-
|
-
|
-
|
||||||||||||||||||
|
Principal
payments
|
(756
|
)
|
(105
|
)
|
-
|
(769
|
)
|
(29
|
)
|
(1,017
|
)
|
(44
|
)
|
-
|
42
|
|||||||||||||
|
Discount
amortization
|
(2
|
)
|
-
|
-
|
-
|
-
|
-
|
-
|
-
|
36
|
||||||||||||||||||
|
Net
mark-to-market adjustment
|
(9,439
|
)
|
282
|
(663
|
)
|
474
|
578
|
1,080
|
48
|
(628
|
)
|
(350
|
)
|
|||||||||||||||
|
Ending
Balance
|
$16,758
|
$21,133
|
$16,152
|
$21,964
|
$22,259
|
$14,718
|
$14,742
|
$11,738
|
$12,463
|
|||||||||||||||||||
|
CDO
IGS
|
||||||||||||||||||||||||||||
|
Beginning
balance
|
$234,633
|
$254,307
|
$224,349
|
$184,942
|
$177,063
|
$163,539
|
$150,647
|
$146,344
|
$148,684
|
|||||||||||||||||||
|
Acquisitions
|
6,000
|
-
|
35,496
|
45,388
|
7,000
|
13,000
|
13,500
|
5,900
|
9,553
|
|||||||||||||||||||
|
Upgrades
/ downgrades
|
(5,822
|
)
|
-
|
5,000
|
-
|
-
|
-
|
-
|
-
|
-
|
||||||||||||||||||
|
Sales
|
-
|
-
|
-
|
(5,350
|
)
|
-
|
-
|
-
|
-
|
-
|
||||||||||||||||||
|
Principal
payments
|
(2,698
|
)
|
(356
|
)
|
(376
|
)
|
(338
|
)
|
(235
|
)
|
(257
|
)
|
(468
|
)
|
(335
|
)
|
(11,240
|
)
|
||||||||||
|
Discount
/ (premium) amortization
|
60
|
66
|
(3
|
)
|
9
|
5
|
7
|
8
|
7
|
10
|
||||||||||||||||||
|
Net
mark-to-market adjustment
|
(57,018
|
)
|
(19,384
|
)
|
(10,159
|
)
|
(302
|
)
|
1,109
|
774
|
(148
|
)
|
(1,269
|
)
|
(663
|
)
|
||||||||||||
|
Ending
Balance
|
$175,155
|
$234,633
|
$254,307
|
$224,349
|
$184,942
|
$177,063
|
$163,539
|
$150,647
|
$146,344
|
|||||||||||||||||||
|
The
Redwood
Review
3rd
Quarter
2007
|
Appendix
Table
10 -
Portfolio
Activity
|
97 |
|
|
Table
11A: Managed Residential Loans Credit Performance
($ in
thousands)
|
|
|
|
|
|
|
|
|
|
|
|
|
|
|
|
|
|
|
|
|
|
|
|
|
|
|
|
||||||||||||
|
|
|
|
|
Managed
Loans
|
|
Internally-Designated
Credit Reserve
|
|
External
Credit Enhancement
|
|
Total
Credit Protection (1)
|
|
Total
Credit Protection as % of Loans (2)
|
|
Seriously
Delinquent Loans
|
|
Seriously
Delinquent Loan % of Current Balance
|
|
Total
Credit Losses
|
|
Losses
To Securities Junior to Redwood's Interest
|
|
Redwood's
Share of Net Charge-offs/ (Recoveries)
|
|
Total
Credit Losses As % of Loans (Annualized)
|
|
||||||||||||
|
|
|
|
|
|
|
|
|
|
|
|
|
|
|
|
|
|
|
|
|
|
|
|
|
|
|
||||||||||||
|
Total
Managed
|
|
|
Q3:
2005
|
|
|
$192,368,457
|
|
|
$404,891
|
|
|
$133,080
|
|
|
$537,971
|
|
|
0.28
|
%
|
|
$268,341
|
|
|
0.14
|
%
|
|
$1,812
|
|
|
$220
|
|
|
$1,592
|
|
|
<0.01
|
%
|
|
Residential
|
|
|
Q4:
2005
|
|
|
190,570,193
|
|
|
377,266
|
|
|
139,129
|
|
|
516,395
|
|
|
0.27
|
%
|
|
349,068
|
|
|
0.18
|
%
|
|
1,175
|
|
|
-
|
|
|
1,175
|
|
|
<0.01
|
%
|
|
Portfolio
|
|
|
2005
|
|
|
190,570,193
|
|
|
377,266
|
|
|
139,129
|
|
|
516,395
|
|
|
0.27
|
%
|
|
349,068
|
|
|
0.18
|
%
|
|
5,104
|
|
|
416
|
|
|
4,688
|
|
|
<0.01
|
%
|
|
|
|
|
Q1:
2006
|
|
|
198,252,684
|
|
|
396,153
|
|
|
126,376
|
|
|
522,529
|
|
|
0.26
|
%
|
|
467,352
|
|
|
0.24
|
%
|
|
3,002
|
|
|
-
|
|
|
3,002
|
|
|
0.01
|
%
|
|
|
|
Q2:
2006
|
|
|
227,928,505
|
|
|
445,028
|
|
|
126,264
|
|
|
571,292
|
|
|
0.25
|
%
|
|
441,430
|
|
|
0.19
|
%
|
|
1,464
|
|
|
-
|
|
|
1,464
|
|
|
<0.01
|
%
|
|
|
|
|
Q3:
2006
|
|
|
235,127,925
|
|
|
403,723
|
|
|
215,285
|
|
|
619,008
|
|
|
0.26
|
%
|
|
658,262
|
|
|
0.28
|
%
|
|
2,748
|
|
|
155
|
|
|
2,593
|
|
|
<0.01
|
%
|
|
|
|
|
Q4:
2006
|
|
|
219,178,838
|
|
|
392,365
|
|
|
302,072
|
|
|
694,437
|
|
|
0.32
|
%
|
|
842,746
|
|
|
0.39
|
%
|
|
5,058
|
|
|
196
|
|
|
4,862
|
|
|
0.01
|
%
|
|
|
|
|
2006
|
|
|
219,178,838
|
|
|
392,365
|
|
|
302,072
|
|
|
694,437
|
|
|
0.32
|
%
|
|
842,746
|
|
|
0.39
|
%
|
|
12,272
|
|
|
351
|
|
|
11,921
|
|
|
0.01
|
%
|
|
|
|
|
Q1:
2007
|
|
|
245,080,031
|
|
|
412,717
|
|
|
355,855
|
|
|
768,572
|
|
|
0.31
|
%
|
|
1,075,683
|
|
|
0.44
|
%
|
|
5,776
|
|
|
325
|
|
|
5,451
|
|
|
0.01
|
%
|
|
|
|
|
Q2:
2007
|
|
|
227,973,546
|
|
|
469,492
|
|
|
356,374
|
|
|
825,866
|
|
|
0.36
|
%
|
|
1,431,963
|
|
|
0.63
|
%
|
|
12,157
|
|
|
471
|
|
|
11,686
|
|
|
0.02
|
%
|
|
|
|
|
Q3:
2007
|
|
|
$219,465,992
|
|
|
$466,034
|
|
|
$335,699
|
|
|
$801,733
|
|
|
0.37
|
%
|
|
$2,234,644
|
|
|
1.02
|
%
|
|
$17,553
|
|
|
$8,682
|
|
|
$8,871
|
|
|
0.03
|
%
|
|
|
|
|
|
|
|
|
|
|
|
|
|
|
|
|
|
|
|
|
|
|
|
|
|
|
|
|
|
|
|
|
|
|
|
|
|
|
|
|
|
Residential
Real
|
|
|
Q3:
2005
|
|
|
$16,386,833
|
|
|
$22,029
|
|
|
$0
|
|
|
$22,029
|
|
|
0.13
|
%
|
|
$22,956
|
|
|
0.14
|
%
|
|
$90
|
|
|
$0
|
|
|
$90
|
|
|
<0.01
|
%
|
|
Estate
Loans
|
|
|
Q4:
2005
|
|
|
13,719,242
|
|
|
22,656
|
|
|
-
|
|
|
22,656
|
|
|
0.17
|
%
|
|
37,335
|
|
|
0.27
|
%
|
|
251
|
|
|
-
|
|
|
251
|
|
|
<0.01
|
%
|
|
|
|
2005
|
|
|
13,719,242
|
|
|
22,656
|
|
|
-
|
|
|
22,656
|
|
|
0.17
|
%
|
|
37,335
|
|
|
0.27
|
%
|
|
461
|
|
|
-
|
|
|
461
|
|
|
<0.01
|
%
|
|
|
|
|
Q1:
2006
|
|
|
11,846,454
|
|
|
22,372
|
|
|
-
|
|
|
22,372
|
|
|
0.19
|
%
|
|
48,677
|
|
|
0.41
|
%
|
|
425
|
|
|
-
|
|
|
425
|
|
|
<0.01
|
%
|
|
|
|
|
Q2:
2006
|
|
|
10,318,641
|
|
|
19,450
|
|
|
-
|
|
|
19,450
|
|
|
0.19
|
%
|
|
47,162
|
|
|
0.46
|
%
|
|
423
|
|
|
-
|
|
|
423
|
|
|
<0.01
|
%
|
|
|
|
|
Q3:
2006
|
|
|
9,718,985
|
|
|
19,326
|
|
|
-
|
|
|
19,326
|
|
|
0.20
|
%
|
|
61,447
|
|
|
0.63
|
%
|
|
589
|
|
|
-
|
|
|
589
|
|
|
0.02
|
%
|
|
|
|
|
Q4:
2006
|
|
|
9,212,002
|
|
|
20,119
|
|
|
-
|
|
|
20,119
|
|
|
0.22
|
%
|
|
65,071
|
|
|
0.79
|
%
|
|
711
|
|
|
-
|
|
|
711
|
|
|
0.02
|
%
|
|
|
|
|
2006
|
|
|
9,212,002
|
|
|
20,119
|
|
|
-
|
|
|
20,119
|
|
|
0.22
|
%
|
|
65,071
|
|
|
0.79
|
%
|
|
2,148
|
|
|
-
|
|
|
2,148
|
|
|
0.02
|
%
|
|
|
|
|
Q1:
2007
|
|
|
8,582,964
|
|
|
19,954
|
|
|
-
|
|
|
19,954
|
|
|
0.23
|
%
|
|
68,632
|
|
|
0.92
|
%
|
|
1,646
|
|
|
-
|
|
|
1,646
|
|
|
0.08
|
%
|
|
|
|
|
Q2:
2007
|
|
|
8,256,759
|
|
|
16,416
|
|
|
-
|
|
|
16,416
|
|
|
0.20
|
%
|
|
55,674
|
|
|
0.67
|
%
|
|
6,038
|
|
|
-
|
|
|
6,038
|
|
|
0.29
|
%
|
|
|
|
|
Q3:
2007
|
|
|
$7,546,529
|
|
|
$15,195
|
|
|
$0
|
|
|
$15,195
|
|
|
0.20
|
%
|
|
$56,068
|
|
|
0.74
|
%
|
|
$2,728
|
|
|
$0
|
|
|
$2,728
|
|
|
0.14
|
%
|
|
|
|
|
|
|
|
|
|
|
|
|
|
|
|
|
|
|
|
|
|
|
|
|
|
|
|
|
|
|
|
|
|
|
|
|
|
|
|
|
|
Residential
CES
|
|
|
Q3:
2005
|
|
|
$175,981,624
|
|
|
$382,862
|
|
|
$133,080
|
|
|
$515,942
|
|
|
0.29
|
%
|
|
$245,385
|
|
|
0.14
|
%
|
|
$1,722
|
|
|
$220
|
|
|
$1,502
|
|
|
<0.01
|
%
|
|
|
|
Q4:
2005
|
|
|
176,850,951
|
|
|
354,610
|
|
|
139,129
|
|
|
493,739
|
|
|
0.28
|
%
|
|
311,733
|
|
|
0.18
|
%
|
|
924
|
|
|
-
|
|
|
924
|
|
|
<0.01
|
%
|
|
|
|
|
2005
|
|
|
176,850,951
|
|
|
354,610
|
|
|
139,129
|
|
|
493,739
|
|
|
0.28
|
%
|
|
311,733
|
|
|
0.18
|
%
|
|
4,643
|
|
|
416
|
|
|
4,227
|
|
|
<0.01
|
%
|
|
|
|
|
Q1:
2006
|
|
|
186,406,230
|
|
|
373,781
|
|
|
126,376
|
|
|
500,157
|
|
|
0.27
|
%
|
|
418,675
|
|
|
0.22
|
%
|
|
2,577
|
|
|
-
|
|
|
2,577
|
|
|
<0.01
|
%
|
|
|
|
|
Q2:
2006
|
|
|
217,609,864
|
|
|
425,578
|
|
|
126,264
|
|
|
551,842
|
|
|
0.25
|
%
|
|
394,268
|
|
|
0.18
|
%
|
|
1,041
|
|
|
-
|
|
|
1,041
|
|
|
<0.01
|
%
|
|
|
|
|
Q3:
2006
|
|
|
225,408,940
|
|
|
384,397
|
|
|
215,285
|
|
|
599,682
|
|
|
0.27
|
%
|
|
596,815
|
|
|
0.26
|
%
|
|
2,159
|
|
|
155
|
|
|
2,004
|
|
|
<0.01
|
%
|
|
|
|
|
Q4:
2006
|
|
|
209,966,836
|
|
|
372,246
|
|
|
302,072
|
|
|
674,318
|
|
|
0.32
|
%
|
|
777,675
|
|
|
0.37
|
%
|
|
4,347
|
|
|
196
|
|
|
4,151
|
|
|
<0.01
|
%
|
|
|
|
|
2006
|
|
|
209,966,836
|
|
|
372,246
|
|
|
302,072
|
|
|
674,318
|
|
|
0.32
|
%
|
|
777,675
|
|
|
0.37
|
%
|
|
10,124
|
|
|
351
|
|
|
9,773
|
|
|
<0.01
|
%
|
|
|
|
|
Q1:
2007
|
|
|
236,497,067
|
|
|
392,763
|
|
|
355,855
|
|
|
748,618
|
|
|
0.32
|
%
|
|
1,007,051
|
|
|
0.43
|
%
|
|
4,130
|
|
|
325
|
|
|
3,805
|
|
|
<0.01
|
%
|
|
|
|
|
Q2:
2007
|
|
|
219,716,787
|
|
|
453,076
|
|
|
356,374
|
|
|
809,450
|
|
|
0.37
|
%
|
|
1,376,289
|
|
|
0.63
|
%
|
|
6,119
|
|
|
471
|
|
|
5,648
|
|
|
0.01
|
%
|
|
|
|
|
Q3:
2007
|
|
|
$211,919,463
|
|
|
$450,839
|
|
|
$335,699
|
|
|
$786,538
|
|
|
0.37
|
%
|
|
$2,178,576
|
|
|
1.03
|
%
|
|
$14,825
|
|
|
$8,682
|
|
|
6,143
|
|
|
0.03
|
%
|
|
|
(1)
The credit reserve on residential real estate loans is
only available to
absorb losses on our residential real estate loans. Internally-designated
credit reserves and external credit enhancement are only
available to
absorb losses on our residential
CES.
|
|
(2)
The credit enhancement balances shown above do not include
pari passu CES
owned by others. If we had included these amounts the total
credit protection would increase to 0.47% for the residential
CES compared
to the 0.37% shown in the table
above.
|
|
The
Redwood
Review
3rd
Quarter
2007
|
Appendix
Table
11 A -
Managed
Residential Loans Credit Performance
|
98 |
|
|
Table
11B: Managed Residential Loans & Non-Rated Securities ($ in
thousands)
|
|
Managed
Loans (1)
|
|
Internally-Designated
Credit Reserve
|
|
Total
Credit Reserve as % of Loans (2)
|
|
Seriously
Delinquent Loans
|
|
Seriously
Delinquent Loan % of Current Balance
|
|
Redwood's
Share of Losses
|
|
Total
Credit Losses As % of Loans (Annualized)
|
|||||||||||||
|
Total
Managed
|
Q3:
2005
|
$125,971,360
|
$404,191
|
0.32
|
%
|
$230,263
|
0.18
|
%
|
$1,592
|
0.00
|
%
|
||||||||||||||
|
Residential
Loans and
|
Q4:
2005
|
129,833,862
|
377,259
|
0.29
|
%
|
318,112
|
0.25
|
%
|
1,175
|
0.00
|
%
|
||||||||||||||
|
Non-Rated
Securities
|
2005
|
129,833,862
|
377,259
|
0.29
|
%
|
318,112
|
0.25
|
%
|
3,465
|
0.00
|
%
|
||||||||||||||
|
Q1:
2006
|
150,039,853
|
433,658
|
0.29
|
%
|
432,120
|
0.29
|
%
|
3,002
|
0.00
|
%
|
|||||||||||||||
|
Q2:
2006
|
159,800,662
|
444,323
|
0.28
|
%
|
402,617
|
0.25
|
%
|
1,464
|
0.00
|
%
|
|||||||||||||||
|
Q3:
2006
|
141,357,008
|
402,655
|
0.28
|
%
|
463,911
|
0.33
|
%
|
2,593
|
0.00
|
%
|
|||||||||||||||
|
Q4:
2006
|
134,696,897
|
392,366
|
0.29
|
%
|
540,695
|
0.40
|
%
|
4,862
|
0.00
|
%
|
|||||||||||||||
|
2006
|
134,696,897
|
392,366
|
0.29
|
%
|
540,695
|
0.40
|
%
|
11,921
|
0.01
|
%
|
|||||||||||||||
|
Q1:
2007
|
114,624,260
|
412,717
|
0.36
|
%
|
672,234
|
0.59
|
%
|
5,451
|
0.02
|
%
|
|||||||||||||||
|
Q2:
2007
|
115,584,033
|
460,152
|
0.40
|
%
|
816,092
|
0.71
|
%
|
11,687
|
0.04
|
%
|
|||||||||||||||
|
Q3:
2007
|
$109,856,434
|
$451,679
|
0.41
|
%
|
$1,196,253
|
1.09
|
%
|
$8,871
|
0.03
|
%
|
|||||||||||||||
|
|
|||||||||||||||||||||||||
|
Residential
Prime Non-Rated Securities
|
Q3:
2005
|
$94,968,711
|
$323,839
|
0.34
|
%
|
$172,609
|
0.18
|
%
|
$1,231
|
0.01
|
%
|
||||||||||||||
|
Q4:
2005
|
100,335,631
|
296,362
|
0.30
|
%
|
222,162
|
0.22
|
%
|
871
|
0.00
|
%
|
|||||||||||||||
|
2005
|
100,335,631
|
296,362
|
0.30
|
%
|
222,162
|
0.22
|
%
|
2,455
|
0.00
|
%
|
|||||||||||||||
|
Q1:
2006
|
122,532,955
|
343,209
|
0.28
|
%
|
296,802
|
0.24
|
%
|
2,403
|
0.01
|
%
|
|||||||||||||||
|
Q2:
2006
|
129,521,184
|
309,703
|
0.24
|
%
|
248,502
|
0.19
|
%
|
816
|
<0.01
|
%
|
|||||||||||||||
|
Q3:
2006
|
112,437,056
|
276,189
|
0.25
|
%
|
269,496
|
0.24
|
%
|
1,826
|
0.01
|
%
|
|||||||||||||||
|
Q4:
2006
|
107,357,542
|
256,932
|
0.24
|
%
|
288,159
|
0.27
|
%
|
2,840
|
0.01
|
%
|
|||||||||||||||
|
2006
|
107,357,542
|
256,932
|
0.24
|
%
|
288,159
|
0.27
|
%
|
7,886
|
0.01
|
%
|
|||||||||||||||
|
Q1:
2007
|
87,463,719
|
263,991
|
0.30
|
%
|
325,581
|
0.37
|
%
|
2,474
|
0.01
|
%
|
|||||||||||||||
|
Q2:
2007
|
87,747,140
|
292,935
|
0.33
|
%
|
384,267
|
0.44
|
%
|
3,241
|
0.01
|
%
|
|||||||||||||||
|
Q3:
2007
|
$82,672,812
|
$260,191
|
0.31
|
%
|
$555,257
|
0.67
|
%
|
$2,816
|
0.01
|
%
|
|||||||||||||||
|
|
|||||||||||||||||||||||||
|
Residential
Alt-A Non-Rated Securities
|
Q3:
2005
|
$14,615,816
|
$58,323
|
0.40
|
%
|
$34,698
|
0.24
|
%
|
$271
|
0.01
|
%
|
||||||||||||||
|
Q4:
2005
|
15,778,989
|
58,241
|
0.37
|
%
|
58,614
|
0.37
|
%
|
53
|
0.00
|
%
|
|||||||||||||||
|
2005
|
15,778,989
|
58,241
|
0.37
|
%
|
58,614
|
0.37
|
%
|
549
|
0.00
|
%
|
|||||||||||||||
|
Q1:
2006
|
15,660,444
|
68,077
|
0.43
|
%
|
86,641
|
0.55
|
%
|
174
|
0.00
|
%
|
|||||||||||||||
|
Q2:
2006
|
19,960,837
|
115,170
|
0.58
|
%
|
106,953
|
0.54
|
%
|
225
|
0.00
|
%
|
|||||||||||||||
|
Q3:
2006
|
19,200,967
|
107,140
|
0.56
|
%
|
132,968
|
0.69
|
%
|
178
|
0.00
|
%
|
|||||||||||||||
|
Q4:
2006
|
18,127,353
|
115,315
|
0.64
|
%
|
187,465
|
1.03
|
%
|
1,311
|
0.03
|
%
|
|||||||||||||||
|
2006
|
18,127,353
|
115,315
|
0.64
|
%
|
187,465
|
1.03
|
%
|
1,887
|
0.01
|
%
|
|||||||||||||||
|
Q1:
2007
|
18,577,577
|
128,772
|
0.69
|
%
|
278,021
|
1.50
|
%
|
1,331
|
0.03
|
%
|
|||||||||||||||
|
Q2:
2007
|
19,580,134
|
150,801
|
0.77
|
%
|
376,151
|
1.92
|
%
|
2,408
|
0.05
|
%
|
|||||||||||||||
|
Q3:
2007
|
$19,637,093
|
$176,293
|
0.90
|
%
|
$584,928
|
2.98
|
%
|
$3,327
|
0.07
|
%
|
|||||||||||||||
|
|
|||||||||||||||||||||||||
|
Residential
Real
|
Q3:
2005
|
$16,386,833
|
$22,029
|
0.13
|
%
|
$22,956
|
0.14
|
%
|
$90
|
<0.01
|
%
|
||||||||||||||
|
Estate
Loans
|
Q4:
2005
|
13,719,242
|
22,656
|
0.17
|
%
|
37,335
|
0.27
|
%
|
251
|
<0.01
|
%
|
||||||||||||||
|
2005
|
13,719,242
|
22,656
|
0.17
|
%
|
37,335
|
0.27
|
%
|
461
|
<0.01
|
%
|
|||||||||||||||
|
Q1:
2006
|
11,846,454
|
22,372
|
0.19
|
%
|
48,677
|
0.41
|
%
|
425
|
<0.01
|
%
|
|||||||||||||||
|
Q2:
2006
|
10,318,641
|
19,450
|
0.19
|
%
|
47,162
|
0.46
|
%
|
423
|
0.02
|
%
|
|||||||||||||||
|
Q3:
2006
|
9,718,985
|
19,326
|
0.20
|
%
|
61,447
|
0.63
|
%
|
589
|
0.02
|
%
|
|||||||||||||||
|
Q4:
2006
|
9,212,002
|
20,119
|
0.22
|
%
|
65,071
|
0.71
|
%
|
711
|
0.03
|
%
|
|||||||||||||||
|
2006
|
9,212,002
|
20,119
|
0.22
|
%
|
65,071
|
0.71
|
%
|
2,148
|
0.02
|
%
|
|||||||||||||||
|
Q1:
2007
|
8,582,964
|
19,954
|
0.23
|
%
|
68,632
|
0.80
|
%
|
1,646
|
0.08
|
%
|
|||||||||||||||
|
Q2:
2007
|
8,256,759
|
16,416
|
0.20
|
%
|
55,674
|
0.67
|
%
|
6,038
|
0.29
|
%
|
|||||||||||||||
|
Q3:
2007
|
$7,546,529
|
$15,195
|
0.20
|
%
|
$56,068
|
0.74
|
%
|
$2,728
|
0.14
|
%
|
|||||||||||||||
|
(1)
The credit reserve on residential real estate loans is only
available to
absorb losses on our residential real estate loan portfolio.
The managed
loans amount for residential CES prime and alt-a portfolios
represents the
loan balances for the securities where Redwood is first in
line to absorb
losses. The internally-designated credit reserve is established
to protect
Redwood against losses suffered from these underlying loan
balances.
|
|
(2)
The credit enhancement balances shown above do not include
pari passu CES
owned by others. If we had included these amounts the total
credit protection would be 0.44% for prime CES compared to
the 0.31% for
prime CES shown in the table above. For alt-a CES the total
credit protection would be 1.19% compared to the 0.90% shown
in the table
above.
|
|
The
Redwood
Review
3rd
Quarter
2007
|
Appendix
Table
11 B -
Managed
Residential Loans Credit Performance
|
99 |
|
|
Table
12A: Residential Prime CES and Underlying Loan Characteristics
($ in
thousands)
|
|
2007
|
|
2007
|
|
2007
|
|
2006
|
|
2006
|
|
2006
|
|
2006
|
|
2005
|
|
2005
|
|
|||||||||||
|
|
|
Q3
|
|
Q2
|
|
Q1
|
|
Q4
|
|
Q3
|
|
Q2
|
|
Q1
|
|
Q4
|
|
Q3
|
||||||||||
|
Residential
Prime CES
|
||||||||||||||||||||||||||||
|
Principal
value
|
$847,854
|
$915,731
|
$899,856
|
$871,984
|
$900,358
|
$925,212
|
$849,556
|
$858,999
|
$885,264
|
|||||||||||||||||||
|
Unamortized
premium
|
(94,077
|
)
|
(98,787
|
)
|
(115,563
|
)
|
(117,016
|
)
|
(113,398
|
)
|
(105,707
|
)
|
(52,906
|
)
|
(105,078
|
)
|
(76,264
|
)
|
||||||||||
|
Credit
protection
|
(260,191
|
)
|
(292,934
|
)
|
(263,991
|
)
|
(256,932
|
)
|
(276,189
|
)
|
(309,703
|
)
|
(343,209
|
)
|
(296,362
|
)
|
(323,839
|
)
|
||||||||||
|
Unrealized
market value
|
(84,954
|
)
|
45,779
|
50,847
|
57,333
|
57,459
|
51,733
|
43,276
|
55,293
|
74,925
|
||||||||||||||||||
|
Market
value (book value)
|
$408,632
|
$569,789
|
$571,149
|
$555,369
|
$568,230
|
$561,535
|
$496,717
|
$512,852
|
$560,086
|
|||||||||||||||||||
|
Market
value / principal value
|
$48.20
|
$62.22
|
$63.47
|
$63.69
|
$63.11
|
$60.69
|
$58.47
|
$59.70
|
$63.27
|
|||||||||||||||||||
|
Current
Rating
|
||||||||||||||||||||||||||||
|
BB
|
$230,147
|
$317,589
|
$315,865
|
$307,713
|
$314,279
|
$286,321
|
$255,488
|
$271,389
|
$270,770
|
|||||||||||||||||||
|
B
|
80,016
|
131,015
|
131,224
|
118,836
|
119,458
|
133,410
|
108,574
|
107,091
|
156,951
|
|||||||||||||||||||
|
Non
Rated
|
98,469
|
121,185
|
124,060
|
128,820
|
134,493
|
141,804
|
132,655
|
134,372
|
132,365
|
|||||||||||||||||||
|
Total
market value
|
$408,632
|
$569,789
|
$571,149
|
$555,369
|
$568,230
|
$561,535
|
$496,717
|
$512,852
|
$560,087
|
|||||||||||||||||||
|
Security
Type
|
||||||||||||||||||||||||||||
|
Option
ARM
|
$131,337
|
$238,728
|
$235,959
|
$226,014
|
$227,349
|
$202,377
|
$188,202
|
$197,411
|
$178,816
|
|||||||||||||||||||
|
ARM
|
36,392
|
44,470
|
48,424
|
48,610
|
53,596
|
72,806
|
65,937
|
76,658
|
93,613
|
|||||||||||||||||||
|
Hybrid
|
173,465
|
220,043
|
226,520
|
221,094
|
227,093
|
223,716
|
183,392
|
174,886
|
216,545
|
|||||||||||||||||||
|
Fixed
|
67,438
|
66,548
|
60,246
|
59,651
|
60,193
|
62,636
|
59,185
|
63,896
|
71,112
|
|||||||||||||||||||
|
Total
market value
|
$408,632
|
$569,789
|
$571,149
|
$555,369
|
$568,230
|
$561,535
|
$496,717
|
$512,852
|
$560,087
|
|||||||||||||||||||
|
Interest
income
|
$14,188
|
$13,973
|
$14,443
|
$13,776
|
$16,745
|
$14,629
|
$11,619
|
$10,535
|
$11,143
|
|||||||||||||||||||
|
Discount
amortization
|
15,247
|
16,926
|
15,644
|
14,084
|
13,987
|
10,205
|
10,957
|
9,523
|
10,311
|
|||||||||||||||||||
|
Total
interest income
|
$29,435
|
$30,899
|
$30,087
|
$27,860
|
$30,732
|
$24,834
|
$22,576
|
$20,058
|
$21,454
|
|||||||||||||||||||
|
Average
balance
|
$508,086
|
$510,835
|
$511,659
|
$491,576
|
$497,983
|
$466,605
|
$424,723
|
$439,171
|
$489,342
|
|||||||||||||||||||
|
Interest
income %
|
11.17
|
%
|
10.94
|
%
|
11.29
|
%
|
11.21
|
%
|
13.45
|
%
|
12.54
|
%
|
10.94
|
%
|
9.60
|
%
|
9.11
|
%
|
||||||||||
|
Discount
amortization %
|
12.00
|
%
|
13.25
|
%
|
12.23
|
%
|
11.46
|
%
|
11.23
|
%
|
8.75
|
%
|
10.32
|
%
|
8.67
|
%
|
8.43
|
%
|
||||||||||
|
Yield
|
23.17
|
%
|
24.19
|
%
|
23.52
|
%
|
22.67
|
%
|
24.69
|
%
|
21.29
|
%
|
21.26
|
%
|
18.27
|
%
|
17.54
|
%
|
||||||||||
|
Underlying
Loan Characteristics
|
||||||||||||||||||||||||||||
|
Number
of loans
|
538,681
|
554,494
|
600,406
|
551,613
|
569,884
|
559,587
|
508,003
|
464,904
|
451,718
|
|||||||||||||||||||
|
Total
loan face
|
$186,171,910
|
$195,757,045
|
$213,261,566
|
$186,501,498
|
$197,336,150
|
$197,813,355
|
$170,935,424
|
$161,295,244
|
$161,719,044
|
|||||||||||||||||||
|
Average
loan size
|
$346
|
$353
|
$355
|
$338
|
$346
|
$353
|
$336
|
$347
|
$358
|
|||||||||||||||||||
|
|
||||||||||||||||||||||||||||
|
Southern
CA
|
24
|
%
|
24
|
%
|
24
|
%
|
25
|
%
|
25
|
%
|
25
|
%
|
26
|
%
|
24
|
%
|
23
|
%
|
||||||||||
|
Northern
CA
|
21
|
%
|
21
|
%
|
21
|
%
|
22
|
%
|
22
|
%
|
22
|
%
|
24
|
%
|
21
|
%
|
20
|
%
|
||||||||||
|
Florida
|
6
|
%
|
6
|
%
|
6
|
%
|
6
|
%
|
6
|
%
|
6
|
%
|
5
|
%
|
5
|
%
|
5
|
%
|
||||||||||
|
New
York
|
6
|
%
|
5
|
%
|
5
|
%
|
5
|
%
|
5
|
%
|
5
|
%
|
5
|
%
|
5
|
%
|
5
|
%
|
||||||||||
|
Georgia
|
2
|
%
|
2
|
%
|
2
|
%
|
2
|
%
|
2
|
%
|
2
|
%
|
2
|
%
|
2
|
%
|
2
|
%
|
||||||||||
|
New
Jersey
|
3
|
%
|
3
|
%
|
3
|
%
|
3
|
%
|
4
|
%
|
4
|
%
|
3
|
%
|
4
|
%
|
4
|
%
|
||||||||||
|
Texas
|
3
|
%
|
3
|
%
|
3
|
%
|
3
|
%
|
3
|
%
|
3
|
%
|
3
|
%
|
3
|
%
|
3
|
%
|
||||||||||
|
Arizona
|
2
|
%
|
2
|
%
|
2
|
%
|
2
|
%
|
2
|
%
|
2
|
%
|
2
|
%
|
2
|
%
|
2
|
%
|
||||||||||
|
Illinois
|
3
|
%
|
3
|
%
|
3
|
%
|
3
|
%
|
3
|
%
|
3
|
%
|
3
|
%
|
3
|
%
|
3
|
%
|
||||||||||
|
Colorado
|
2
|
%
|
2
|
%
|
2
|
%
|
2
|
%
|
2
|
%
|
2
|
%
|
2
|
%
|
2
|
%
|
3
|
%
|
||||||||||
|
Virginia
|
4
|
%
|
4
|
%
|
4
|
%
|
4
|
%
|
4
|
%
|
4
|
%
|
4
|
%
|
4
|
%
|
4
|
%
|
||||||||||
|
Other
states
|
24
|
%
|
25
|
%
|
25
|
%
|
23
|
%
|
22
|
%
|
22
|
%
|
21
|
%
|
25
|
%
|
26
|
%
|
||||||||||
|
The
Redwood
Review
3rd
Quarter
2007
|
Appendix
Table
12 A -
Residential Prime
CES and
Underlying
Loan Characteristics
|
100 |
|
|
Table
12A: Residential Prime CES and Underlying Loan Characteristics
($ in
thousands)
|
|
2007
|
|
|
2007
|
|
|
2007
|
|
|
2006
|
|
|
2006
|
|
|
2006
|
|
|
2006
|
|
|
2005
|
|
|
2005
|
|
|||
|
|
|
|
Q3
|
|
|
Q2
|
|
|
Q1
|
|
|
Q4
|
|
|
Q3
|
|
|
Q2
|
|
|
Q1
|
|
|
Q4
|
|
|
Q3
|
|
|
Year
2007 origination
|
3
|
%
|
4
|
%
|
2
|
%
|
0
|
%
|
0
|
%
|
0
|
%
|
0
|
%
|
0
|
%
|
0
|
%
|
||||||||||
|
Year
2006 origination
|
15
|
%
|
20
|
%
|
20
|
%
|
11
|
%
|
14
|
%
|
11
|
%
|
1
|
%
|
0
|
%
|
0
|
%
|
||||||||||
|
Year
2005 origination
|
31
|
%
|
27
|
%
|
28
|
%
|
28
|
%
|
27
|
%
|
29
|
%
|
32
|
%
|
23
|
%
|
16
|
%
|
||||||||||
|
Year
2004 origination and earlier
|
51
|
%
|
48
|
%
|
50
|
%
|
61
|
%
|
59
|
%
|
60
|
%
|
67
|
%
|
77
|
%
|
84
|
%
|
||||||||||
|
Wtd
Avg Original LTV
|
68
|
%
|
68
|
%
|
68
|
%
|
68
|
%
|
68
|
%
|
68
|
%
|
68
|
%
|
67
|
%
|
67
|
%
|
||||||||||
|
Original
LTV: 0 - 50
|
13
|
%
|
13
|
%
|
13
|
%
|
14
|
%
|
13
|
%
|
13
|
%
|
14
|
%
|
14
|
%
|
14
|
%
|
||||||||||
|
Original
LTV: 50.01 - 60
|
12
|
%
|
12
|
%
|
12
|
%
|
12
|
%
|
12
|
%
|
12
|
%
|
12
|
%
|
13
|
%
|
13
|
%
|
||||||||||
|
Original
LTV: 60.01 - 70
|
22
|
%
|
22
|
%
|
22
|
%
|
22
|
%
|
22
|
%
|
22
|
%
|
22
|
%
|
23
|
%
|
23
|
%
|
||||||||||
|
Original
LTV: 70.01 - 80
|
50
|
%
|
50
|
%
|
50
|
%
|
49
|
%
|
50
|
%
|
50
|
%
|
49
|
%
|
47
|
%
|
47
|
%
|
||||||||||
|
Original
LTV: 80.01 - 90
|
2
|
%
|
2
|
%
|
2
|
%
|
2
|
%
|
2
|
%
|
2
|
%
|
2
|
%
|
2
|
%
|
2
|
%
|
||||||||||
|
Original
LTV: 90.01 - 100
|
1
|
%
|
1
|
%
|
1
|
%
|
1
|
%
|
1
|
%
|
1
|
%
|
1
|
%
|
1
|
%
|
1
|
%
|
||||||||||
|
Unknown
|
0
|
%
|
0
|
%
|
0
|
%
|
0
|
%
|
0
|
%
|
0
|
%
|
0
|
%
|
0
|
%
|
0
|
%
|
||||||||||
|
Wtd
Avg FICO
|
737
|
737
|
737
|
735
|
734
|
734
|
734
|
729
|
729
|
|||||||||||||||||||
|
FICO:
<= 600
|
1
|
%
|
1
|
%
|
1
|
%
|
1
|
%
|
1
|
%
|
1
|
%
|
1
|
%
|
0
|
%
|
0
|
%
|
||||||||||
|
FICO:
601 - 620
|
1
|
%
|
1
|
%
|
1
|
%
|
1
|
%
|
1
|
%
|
1
|
%
|
1
|
%
|
1
|
%
|
0
|
%
|
||||||||||
|
FICO:
621 - 640
|
2
|
%
|
2
|
%
|
2
|
%
|
2
|
%
|
2
|
%
|
2
|
%
|
2
|
%
|
2
|
%
|
2
|
%
|
||||||||||
|
FICO:
641 - 660
|
3
|
%
|
3
|
%
|
3
|
%
|
3
|
%
|
3
|
%
|
3
|
%
|
3
|
%
|
4
|
%
|
4
|
%
|
||||||||||
|
FICO:
661 - 680
|
6
|
%
|
6
|
%
|
6
|
%
|
6
|
%
|
7
|
%
|
6
|
%
|
6
|
%
|
7
|
%
|
7
|
%
|
||||||||||
|
FICO:
681 - 700
|
9
|
%
|
10
|
%
|
10
|
%
|
10
|
%
|
10
|
%
|
10
|
%
|
11
|
%
|
11
|
%
|
11
|
%
|
||||||||||
|
FICO:
701 - 720
|
13
|
%
|
13
|
%
|
12
|
%
|
12
|
%
|
13
|
%
|
13
|
%
|
12
|
%
|
12
|
%
|
13
|
%
|
||||||||||
|
FICO:
721 - 740
|
13
|
%
|
14
|
%
|
14
|
%
|
13
|
%
|
13
|
%
|
13
|
%
|
13
|
%
|
14
|
%
|
14
|
%
|
||||||||||
|
FICO:
741 - 760
|
15
|
%
|
15
|
%
|
15
|
%
|
15
|
%
|
15
|
%
|
15
|
%
|
15
|
%
|
15
|
%
|
15
|
%
|
||||||||||
|
FICO:
761 - 780
|
18
|
%
|
18
|
%
|
18
|
%
|
18
|
%
|
17
|
%
|
17
|
%
|
17
|
%
|
17
|
%
|
18
|
%
|
||||||||||
|
FICO:
781 - 800
|
14
|
%
|
14
|
%
|
14
|
%
|
14
|
%
|
13
|
%
|
13
|
%
|
13
|
%
|
13
|
%
|
12
|
%
|
||||||||||
|
FICO:
>= 801
|
5
|
%
|
5
|
%
|
4
|
%
|
4
|
%
|
4
|
%
|
4
|
%
|
4
|
%
|
3
|
%
|
3
|
%
|
||||||||||
|
Unknown
|
2
|
%
|
1
|
%
|
0
|
%
|
1
|
%
|
1
|
%
|
2
|
%
|
2
|
%
|
1
|
%
|
1
|
%
|
||||||||||
|
Conforming
at Origination %
|
31
|
%
|
31
|
%
|
31
|
%
|
34
|
%
|
34
|
%
|
33
|
%
|
35
|
%
|
25
|
%
|
23
|
%
|
||||||||||
|
>
$1 MM %
|
9
|
%
|
9
|
%
|
9
|
%
|
8
|
%
|
9
|
%
|
9
|
%
|
7
|
%
|
7
|
%
|
6
|
%
|
||||||||||
|
2nd
Home %
|
6
|
%
|
7
|
%
|
7
|
%
|
6
|
%
|
6
|
%
|
6
|
%
|
6
|
%
|
6
|
%
|
6
|
%
|
||||||||||
|
Investment
Home %
|
2
|
%
|
2
|
%
|
2
|
%
|
2
|
%
|
2
|
%
|
2
|
%
|
2
|
%
|
2
|
%
|
2
|
%
|
||||||||||
|
Purchase
|
42
|
%
|
42
|
%
|
42
|
%
|
39
|
%
|
39
|
%
|
39
|
%
|
38
|
%
|
36
|
%
|
36
|
%
|
||||||||||
|
Cash
Out Refi
|
27
|
%
|
27
|
%
|
27
|
%
|
27
|
%
|
29
|
%
|
30
|
%
|
28
|
%
|
27
|
%
|
26
|
%
|
||||||||||
|
Rate-Term
Refi
|
30
|
%
|
30
|
%
|
30
|
%
|
33
|
%
|
31
|
%
|
31
|
%
|
33
|
%
|
36
|
%
|
37
|
%
|
||||||||||
|
Construction
|
0
|
%
|
0
|
%
|
0
|
%
|
0
|
%
|
0
|
%
|
0
|
%
|
0
|
%
|
0
|
%
|
0
|
%
|
||||||||||
|
Other
|
1
|
%
|
1
|
%
|
1
|
%
|
1
|
%
|
1
|
%
|
0
|
%
|
1
|
%
|
1
|
%
|
1
|
%
|
||||||||||
|
Full
Doc
|
48
|
%
|
45
|
%
|
45
|
%
|
46
|
%
|
44
|
%
|
44
|
%
|
47
|
%
|
47
|
%
|
53
|
%
|
||||||||||
|
No
Doc
|
8
|
%
|
6
|
%
|
6
|
%
|
7
|
%
|
6
|
%
|
5
|
%
|
5
|
%
|
4
|
%
|
5
|
%
|
||||||||||
|
Other
Doc (Lim, Red, Stated, etc)
|
44
|
%
|
49
|
%
|
49
|
%
|
47
|
%
|
50
|
%
|
51
|
%
|
48
|
%
|
49
|
%
|
42
|
%
|
||||||||||
|
2-4
Family
|
2
|
%
|
2
|
%
|
2
|
%
|
2
|
%
|
2
|
%
|
2
|
%
|
2
|
%
|
2
|
%
|
2
|
%
|
||||||||||
|
Condo
|
9
|
%
|
9
|
%
|
9
|
%
|
8
|
%
|
8
|
%
|
8
|
%
|
8
|
%
|
4
|
%
|
3
|
%
|
||||||||||
|
Single
Family
|
88
|
%
|
88
|
%
|
88
|
%
|
89
|
%
|
89
|
%
|
89
|
%
|
89
|
%
|
55
|
%
|
56
|
%
|
||||||||||
|
Other
|
1
|
%
|
1
|
%
|
1
|
%
|
1
|
%
|
1
|
%
|
1
|
%
|
1
|
%
|
39
|
%
|
39
|
%
|
|
The
Redwood
Review
3rd
Quarter
2007
|
Appendix
Table
12 A -
Residential
Prime CES and
Underlying
Loan Characteristics
|
101 |
|
|
Table
12B: Residential Alt-A CES and Underlying Loan Characteristics
($ in
thousands)
|
|
|
|
2007
|
|
2007
|
|
2007
|
|
2006
|
|
2006
|
|
2006
|
|
2006
|
|
2005
|
|
2005
|
|
|||||||||
|
|
|
Q3
|
|
Q2
|
|
Q1
|
|
Q4
|
|
Q3
|
|
Q2
|
|
Q1
|
|
Q4
|
|
Q3
|
|
|||||||||
|
Residential
CES Alt A
|
||||||||||||||||||||||||||||
|
Principal
value
|
$382,698
|
$365,837
|
$348,371
|
$298,780
|
$272,957
|
$243,391
|
$184,513
|
$154,794
|
$144,521
|
|||||||||||||||||||
|
Unamortized
premium
|
(27,377
|
)
|
(30,054
|
)
|
(41,680
|
)
|
(26,440
|
)
|
(26,849
|
)
|
(11,700
|
)
|
(17,960
|
)
|
(16,752
|
)
|
(8,520
|
)
|
||||||||||
|
Credit
protection
|
(176,293
|
)
|
(150,801
|
)
|
(128,772
|
)
|
(115,315
|
)
|
(107,140
|
)
|
(115,170
|
)
|
(68,077
|
)
|
(58,241
|
)
|
(58,323
|
)
|
||||||||||
|
Unrealized
market value
|
(68,198
|
)
|
(12,626
|
)
|
(5,932
|
)
|
(166
|
)
|
52
|
(879
|
)
|
246
|
(99
|
)
|
5,942
|
|||||||||||||
|
Market
value (book value)
|
$110,830
|
$172,356
|
$171,987
|
$156,859
|
$139,020
|
$115,642
|
$98,722
|
$79,702
|
$83,620
|
|||||||||||||||||||
|
Market
value / principal value
|
$28.96
|
$47.11
|
$49.37
|
$52.50
|
$50.93
|
$47.51
|
$53.50
|
$51.49
|
$57.86
|
|||||||||||||||||||
|
Current
Rating
|
||||||||||||||||||||||||||||
|
BB
|
$68,713
|
$103,717
|
$100,895
|
$94,239
|
$85,874
|
$62,063
|
$63,244
|
$51,175
|
$55,065
|
|||||||||||||||||||
|
B
|
15,457
|
33,911
|
30,989
|
22,861
|
19,722
|
22,122
|
13,377
|
7,969
|
8,451
|
|||||||||||||||||||
|
Non
Rated
|
26,660
|
34,728
|
40,103
|
39,759
|
33,424
|
31,457
|
22,101
|
20,558
|
20,104
|
|||||||||||||||||||
|
Total
market value
|
$110,830
|
$172,356
|
$171,987
|
$156,859
|
$139,020
|
$115,642
|
$98,722
|
$79,702
|
$83,620
|
|||||||||||||||||||
|
Security
Type
|
||||||||||||||||||||||||||||
|
Option
ARM
|
$105,286
|
$162,924
|
$158,116
|
$133,411
|
$117,908
|
$92,209
|
$76,868
|
$60,635
|
$59,978
|
|||||||||||||||||||
|
ARM
|
592
|
720
|
837
|
990
|
4,483
|
7,318
|
6,457
|
2,671
|
6,823
|
|||||||||||||||||||
|
Hybrid
|
3,897
|
6,664
|
10,701
|
21,835
|
16,012
|
15,589
|
14,867
|
15,741
|
16,000
|
|||||||||||||||||||
|
Fixed
|
1,055
|
2,048
|
2,333
|
623
|
616
|
526
|
529
|
654
|
819
|
|||||||||||||||||||
|
Total
market value
|
$110,830
|
$172,356
|
$171,987
|
$156,859
|
$139,019
|
$115,642
|
$98,721
|
$79,701
|
$83,620
|
|||||||||||||||||||
|
Interest
income
|
$5,927
|
$5,632
|
$4,143
|
$4,312
|
$1,872
|
$1,746
|
$2,235
|
$1,926
|
$1,732
|
|||||||||||||||||||
|
Discount
amortization
|
3,417
|
4,013
|
3,197
|
3,307
|
1,915
|
1,479
|
1,434
|
575
|
455
|
|||||||||||||||||||
|
Total
interest income
|
$9,344
|
$9,645
|
$7,340
|
$7,619
|
$3,787
|
$3,225
|
$3,669
|
$2,501
|
$2,187
|
|||||||||||||||||||
|
Average
balance
|
$180,131
|
$176,130
|
$151,740
|
$154,988
|
$135,489
|
$106,648
|
$92,239
|
$70,315
|
$78,347
|
|||||||||||||||||||
|
Interest
income %
|
13.16
|
%
|
12.79
|
%
|
10.92
|
%
|
11.13
|
%
|
5.53
|
%
|
6.55
|
%
|
9.69
|
%
|
10.96
|
%
|
8.84
|
%
|
||||||||||
|
Discount
amortization %
|
7.59
|
%
|
9.11
|
%
|
8.43
|
%
|
8.53
|
%
|
5.65
|
%
|
5.55
|
%
|
6.22
|
%
|
3.27
|
%
|
2.32
|
%
|
||||||||||
|
Yield
|
20.75
|
%
|
21.90
|
%
|
19.35
|
%
|
19.66
|
%
|
11.18
|
%
|
12.10
|
%
|
15.91
|
%
|
14.23
|
%
|
11.17
|
%
|
||||||||||
|
Underlying
Loan Characteristics
|
||||||||||||||||||||||||||||
|
Number
of loans
|
58,299
|
59,767
|
58,960
|
54,599
|
67,132
|
60,471
|
50,168
|
49,596
|
46,682
|
|||||||||||||||||||
|
Total
loan face
|
$20,719,401
|
$20,523,349
|
$19,620,740
|
$18,026,078
|
$22,126,922
|
$19,796,509
|
$15,470,805
|
$15,555,706
|
$14,262,580
|
|||||||||||||||||||
|
Average
loan size
|
$355
|
$343
|
$333
|
$330
|
$330
|
$327
|
$308
|
$314
|
$306
|
|||||||||||||||||||
|
Southern
CA
|
33
|
%
|
31
|
%
|
31
|
%
|
32
|
%
|
31
|
%
|
34
|
%
|
35
|
%
|
35
|
%
|
35
|
%
|
||||||||||
|
Northern
CA
|
19
|
%
|
21
|
%
|
21
|
%
|
22
|
%
|
22
|
%
|
23
|
%
|
24
|
%
|
22
|
%
|
21
|
%
|
||||||||||
|
Florida
|
10
|
%
|
10
|
%
|
10
|
%
|
10
|
%
|
9
|
%
|
9
|
%
|
8
|
%
|
8
|
%
|
7
|
%
|
||||||||||
|
New
York
|
2
|
%
|
2
|
%
|
2
|
%
|
2
|
%
|
2
|
%
|
1
|
%
|
1
|
%
|
1
|
%
|
1
|
%
|
||||||||||
|
Georgia
|
1
|
%
|
1
|
%
|
1
|
%
|
1
|
%
|
1
|
%
|
1
|
%
|
1
|
%
|
1
|
%
|
1
|
%
|
||||||||||
|
New
Jersey
|
3
|
%
|
3
|
%
|
3
|
%
|
3
|
%
|
3
|
%
|
2
|
%
|
2
|
%
|
2
|
%
|
3
|
%
|
||||||||||
|
Texas
|
1
|
%
|
1
|
%
|
1
|
%
|
1
|
%
|
1
|
%
|
1
|
%
|
1
|
%
|
1
|
%
|
1
|
%
|
||||||||||
|
Arizona
|
4
|
%
|
4
|
%
|
4
|
%
|
4
|
%
|
4
|
%
|
3
|
%
|
3
|
%
|
2
|
%
|
2
|
%
|
||||||||||
|
Illinois
|
2
|
%
|
1
|
%
|
1
|
%
|
1
|
%
|
1
|
%
|
1
|
%
|
1
|
%
|
2
|
%
|
2
|
%
|
||||||||||
|
Colorado
|
3
|
%
|
3
|
%
|
3
|
%
|
3
|
%
|
3
|
%
|
3
|
%
|
3
|
%
|
3
|
%
|
4
|
%
|
||||||||||
|
Virginia
|
3
|
%
|
3
|
%
|
3
|
%
|
3
|
%
|
3
|
%
|
3
|
%
|
2
|
%
|
2
|
%
|
2
|
%
|
||||||||||
|
Other
states
|
19
|
%
|
20
|
%
|
20
|
%
|
18
|
%
|
20
|
%
|
19
|
%
|
19
|
%
|
21
|
%
|
21
|
%
|
||||||||||
|
The
Redwood
Review
3rd
Quarter
2007
|
Appendix
Table
12 B - Residentia
Alt-A CES and
Underlying
Loan Characteristics
|
102 |
|
|
Table
12B: Residential Alt-A CES and Underlying Loan Characteristics
($ in
thousands)
|
|
|
|
2007
|
|
2007
|
|
2007
|
|
2006
|
|
2006
|
|
2006
|
|
2006
|
|
2005
|
|
2005
|
|
|||||||||
|
|
|
Q3
|
|
Q2
|
|
Q1
|
|
Q4
|
|
Q3
|
|
Q2
|
|
Q1
|
|
Q4
|
|
Q3
|
||||||||||
|
Year
2007 origination
|
21
|
%
|
14
|
%
|
4
|
%
|
0
|
%
|
0
|
%
|
0
|
%
|
0
|
%
|
0
|
%
|
0
|
%
|
||||||||||
|
Year
2006 origination
|
21
|
%
|
23
|
%
|
25
|
%
|
21
|
%
|
19
|
%
|
9
|
%
|
1
|
%
|
0
|
%
|
0
|
%
|
||||||||||
|
Year
2005 origination
|
30
|
%
|
33
|
%
|
39
|
%
|
38
|
%
|
41
|
%
|
45
|
%
|
39
|
%
|
35
|
%
|
21
|
%
|
||||||||||
|
Year
2004 origination and earlier
|
28
|
%
|
30
|
%
|
32
|
%
|
41
|
%
|
40
|
%
|
46
|
%
|
60
|
%
|
65
|
%
|
79
|
%
|
||||||||||
|
Wtd
Avg Original LTV
|
75
|
%
|
75
|
%
|
75
|
%
|
75
|
%
|
75
|
%
|
75
|
%
|
74
|
%
|
75
|
%
|
75
|
%
|
||||||||||
|
Original
LTV: 0 - 50
|
4
|
%
|
4
|
%
|
4
|
%
|
4
|
%
|
4
|
%
|
4
|
%
|
5
|
%
|
4
|
%
|
5
|
%
|
||||||||||
|
Original
LTV: 50.01 - 60
|
6
|
%
|
6
|
%
|
6
|
%
|
6
|
%
|
6
|
%
|
6
|
%
|
7
|
%
|
6
|
%
|
6
|
%
|
||||||||||
|
Original
LTV: 60.01 - 70
|
16
|
%
|
15
|
%
|
15
|
%
|
16
|
%
|
16
|
%
|
16
|
%
|
16
|
%
|
15
|
%
|
16
|
%
|
||||||||||
|
Original
LTV: 70.01 - 80
|
62
|
%
|
61
|
%
|
61
|
%
|
61
|
%
|
58
|
%
|
59
|
%
|
59
|
%
|
62
|
%
|
60
|
%
|
||||||||||
|
Original
LTV: 80.01 - 90
|
9
|
%
|
10
|
%
|
10
|
%
|
9
|
%
|
11
|
%
|
10
|
%
|
9
|
%
|
8
|
%
|
8
|
%
|
||||||||||
|
Original
LTV: 90.01 - 100
|
3
|
%
|
4
|
%
|
4
|
%
|
4
|
%
|
5
|
%
|
5
|
%
|
4
|
%
|
5
|
%
|
5
|
%
|
||||||||||
|
Unknown
|
0
|
%
|
0
|
%
|
0
|
%
|
0
|
%
|
0
|
%
|
0
|
%
|
0
|
%
|
0
|
%
|
0
|
%
|
||||||||||
|
Wtd
Avg FICO
|
705
|
707
|
708
|
708
|
708
|
708
|
710
|
706
|
708
|
|||||||||||||||||||
|
FICO:
<= 600
|
1
|
%
|
1
|
%
|
2
|
%
|
1
|
%
|
3
|
%
|
2
|
%
|
2
|
%
|
0
|
%
|
0
|
%
|
||||||||||
|
FICO:
601 - 620
|
1
|
%
|
1
|
%
|
1
|
%
|
1
|
%
|
1
|
%
|
1
|
%
|
1
|
%
|
1
|
%
|
0
|
%
|
||||||||||
|
FICO:
621 - 640
|
5
|
%
|
5
|
%
|
5
|
%
|
5
|
%
|
5
|
%
|
5
|
%
|
5
|
%
|
5
|
%
|
5
|
%
|
||||||||||
|
FICO:
641 - 660
|
9
|
%
|
9
|
%
|
9
|
%
|
8
|
%
|
8
|
%
|
8
|
%
|
8
|
%
|
8
|
%
|
8
|
%
|
||||||||||
|
FICO:
661 - 680
|
14
|
%
|
14
|
%
|
14
|
%
|
14
|
%
|
13
|
%
|
13
|
%
|
12
|
%
|
13
|
%
|
12
|
%
|
||||||||||
|
FICO:
681 - 700
|
16
|
%
|
15
|
%
|
15
|
%
|
15
|
%
|
15
|
%
|
15
|
%
|
13
|
%
|
15
|
%
|
15
|
%
|
||||||||||
|
FICO:
701 - 720
|
14
|
%
|
14
|
%
|
13
|
%
|
13
|
%
|
13
|
%
|
13
|
%
|
12
|
%
|
14
|
%
|
15
|
%
|
||||||||||
|
FICO:
721 - 740
|
11
|
%
|
11
|
%
|
11
|
%
|
11
|
%
|
11
|
%
|
11
|
%
|
11
|
%
|
12
|
%
|
13
|
%
|
||||||||||
|
FICO:
741 - 760
|
9
|
%
|
9
|
%
|
9
|
%
|
10
|
%
|
10
|
%
|
10
|
%
|
9
|
%
|
11
|
%
|
11
|
%
|
||||||||||
|
FICO:
761 - 780
|
8
|
%
|
8
|
%
|
8
|
%
|
8
|
%
|
8
|
%
|
8
|
%
|
8
|
%
|
9
|
%
|
10
|
%
|
||||||||||
|
FICO:
781 - 800
|
4
|
%
|
4
|
%
|
5
|
%
|
5
|
%
|
5
|
%
|
5
|
%
|
5
|
%
|
5
|
%
|
5
|
%
|
||||||||||
|
FICO:
>= 801
|
1
|
%
|
1
|
%
|
1
|
%
|
1
|
%
|
1
|
%
|
1
|
%
|
1
|
%
|
1
|
%
|
1
|
%
|
||||||||||
|
Unknown
|
7
|
%
|
7
|
%
|
7
|
%
|
8
|
%
|
7
|
%
|
8
|
%
|
13
|
%
|
6
|
%
|
5
|
%
|
||||||||||
|
Conforming
at Origination %
|
44
|
%
|
47
|
%
|
49
|
%
|
52
|
%
|
53
|
%
|
53
|
%
|
56
|
%
|
46
|
%
|
49
|
%
|
||||||||||
|
>
$1 MM %
|
15
|
%
|
12
|
%
|
10
|
%
|
9
|
%
|
8
|
%
|
7
|
%
|
7
|
%
|
6
|
%
|
6
|
%
|
||||||||||
|
2nd
Home %
|
6
|
%
|
6
|
%
|
6
|
%
|
6
|
%
|
5
|
%
|
5
|
%
|
5
|
%
|
5
|
%
|
5
|
%
|
||||||||||
|
Investment
Home %
|
11
|
%
|
11
|
%
|
11
|
%
|
12
|
%
|
11
|
%
|
11
|
%
|
11
|
%
|
11
|
%
|
10
|
%
|
||||||||||
|
Purchase
|
35
|
%
|
35
|
%
|
37
|
%
|
41
|
%
|
42
|
%
|
40
|
%
|
41
|
%
|
45
|
%
|
47
|
%
|
||||||||||
|
Cash
Out Refi
|
43
|
%
|
43
|
%
|
41
|
%
|
39
|
%
|
38
|
%
|
40
|
%
|
38
|
%
|
37
|
%
|
34
|
%
|
||||||||||
|
Rate-Term
Refi
|
22
|
%
|
22
|
%
|
22
|
%
|
19
|
%
|
21
|
%
|
20
|
%
|
21
|
%
|
18
|
%
|
19
|
%
|
||||||||||
|
Construction
|
0
|
%
|
0
|
%
|
0
|
%
|
0
|
%
|
0
|
%
|
0
|
%
|
0
|
%
|
0
|
%
|
0
|
%
|
||||||||||
|
Other
|
0
|
%
|
0
|
%
|
0
|
%
|
0
|
%
|
0
|
%
|
0
|
%
|
0
|
%
|
0
|
%
|
0
|
%
|
||||||||||
|
Full
Doc
|
16
|
%
|
17
|
%
|
18
|
%
|
23
|
%
|
24
|
%
|
22
|
%
|
22
|
%
|
19
|
%
|
19
|
%
|
||||||||||
|
No
Doc
|
1
|
%
|
1
|
%
|
1
|
%
|
1
|
%
|
1
|
%
|
1
|
%
|
1
|
%
|
0
|
%
|
0
|
%
|
||||||||||
|
Other
Doc (Lim, Red, Stated, etc)
|
76
|
%
|
74
|
%
|
71
|
%
|
67
|
%
|
64
|
%
|
67
|
%
|
62
|
%
|
81
|
%
|
81
|
%
|
||||||||||
|
Unknown/Not
Categorized
|
7
|
%
|
8
|
%
|
10
|
%
|
9
|
%
|
11
|
%
|
10
|
%
|
15
|
%
|
0
|
%
|
0
|
%
|
||||||||||
|
2-4
Family
|
4
|
%
|
4
|
%
|
4
|
%
|
4
|
%
|
4
|
%
|
4
|
%
|
4
|
%
|
4
|
%
|
3
|
%
|
||||||||||
|
Condo
|
11
|
%
|
11
|
%
|
11
|
%
|
11
|
%
|
11
|
%
|
11
|
%
|
11
|
%
|
1
|
%
|
1
|
%
|
||||||||||
|
Single
Family
|
85
|
%
|
85
|
%
|
85
|
%
|
85
|
%
|
85
|
%
|
85
|
%
|
85
|
%
|
6
|
%
|
6
|
%
|
||||||||||
|
Other
|
0
|
%
|
0
|
%
|
0
|
%
|
0
|
%
|
0
|
%
|
0
|
%
|
0
|
%
|
89
|
%
|
90
|
%
|
||||||||||
|
The
Redwood
Review
3rd
Quarter
2007
|
Appendix
Table
12 B -
Residential Alt-A
CES and
Underlying
Loan Characteristics
|
103 |
|
|
Table
12C: Residential Subprime CES and Underlying Loan Characteristics
($ in
thousands)
|
|
|
2007
|
2007
|
2007
|
2006
|
2006
|
2006
|
2006
|
2005
|
2005
|
|||||||||||||||||||
|
|
Q3
|
Q2
|
Q1
|
Q4
|
Q3
|
Q2
|
Q1
|
Q4
|
Q3
|
|||||||||||||||||||
|
Residential
CES Subprime
|
||||||||||||||||||||||||||||
|
Principal
value
|
$39,025
|
$9,625
|
11,219
|
9,841
|
$9,841
|
-
|
-
|
-
|
-
|
|||||||||||||||||||
|
Unamortized
premium
|
(5,625
|
)
|
2,893
|
(1,426
|
)
|
(1,387
|
)
|
(1,407
|
)
|
-
|
-
|
-
|
-
|
|||||||||||||||
|
Credit
protection
|
(14,355
|
)
|
(9,341
|
)
|
0
|
0
|
0
|
-
|
-
|
-
|
-
|
|||||||||||||||||
|
Unrealized
market value
|
(6,062
|
)
|
(347
|
)
|
(652
|
)
|
849
|
(15
|
)
|
-
|
-
|
-
|
-
|
|||||||||||||||
|
Market
value (book value)
|
$12,983
|
$2,830
|
9,141
|
9,303
|
$8,419
|
-
|
-
|
-
|
-
|
|||||||||||||||||||
|
Market
value / principal value
|
$33.27
|
$29.40
|
$81.48
|
$94.53
|
$85.55
|
-
|
-
|
-
|
-
|
|||||||||||||||||||
|
Current
Rating
|
||||||||||||||||||||||||||||
|
AAA
|
$0
|
$0
|
$0
|
$0
|
$0
|
-
|
-
|
-
|
-
|
|||||||||||||||||||
|
AA
|
3,591
|
-
|
-
|
-
|
-
|
-
|
-
|
-
|
-
|
|||||||||||||||||||
|
A
|
5,863
|
-
|
-
|
-
|
-
|
-
|
-
|
-
|
-
|
|||||||||||||||||||
|
BBB
|
2,652
|
-
|
-
|
-
|
-
|
-
|
-
|
-
|
-
|
|||||||||||||||||||
|
BB
|
21
|
2,830
|
9,141
|
6,678
|
5,919
|
-
|
-
|
-
|
-
|
|||||||||||||||||||
|
B
|
100
|
-
|
-
|
-
|
-
|
-
|
-
|
-
|
-
|
|||||||||||||||||||
|
Non
Rated
|
756
|
-
|
-
|
2,625
|
2,500
|
-
|
-
|
-
|
-
|
|||||||||||||||||||
|
Total
market value
|
$12,983
|
$2,830
|
$9,141
|
$9,303
|
$8,419
|
-
|
-
|
-
|
-
|
|||||||||||||||||||
|
Security
Type
|
||||||||||||||||||||||||||||
|
Option
ARM
|
$0
|
$0
|
$0
|
$0
|
$0
|
-
|
-
|
-
|
-
|
|||||||||||||||||||
|
ARM
|
-
|
-
|
-
|
-
|
-
|
-
|
-
|
-
|
-
|
|||||||||||||||||||
|
Hybrid
|
2,481
|
400
|
1,013
|
4,127
|
4,064
|
-
|
-
|
-
|
-
|
|||||||||||||||||||
|
Fixed
|
10,502
|
2,430
|
8,128
|
5,176
|
4,355
|
-
|
-
|
-
|
-
|
|||||||||||||||||||
|
Total
market value
|
$12,983
|
$2,830
|
$9,141
|
$9,303
|
$8,419
|
-
|
-
|
-
|
-
|
|||||||||||||||||||
|
Interest
income
|
$367
|
$215
|
$186
|
$151
|
$51
|
-
|
-
|
-
|
-
|
|||||||||||||||||||
|
Discount
amortization
|
(229
|
)
|
126
|
51
|
22
|
15
|
-
|
-
|
-
|
-
|
||||||||||||||||||
|
Total
interest income
|
$138
|
$341
|
$237
|
$173
|
$66
|
-
|
-
|
-
|
-
|
|||||||||||||||||||
|
Average
balance
|
$10,494
|
$8,744
|
$9,715
|
$8,344
|
$8,223
|
-
|
-
|
-
|
-
|
|||||||||||||||||||
|
Interest
income %
|
13.99
|
%
|
9.84
|
%
|
7.66
|
%
|
7.24
|
%
|
2.48
|
%
|
-
|
-
|
-
|
-
|
||||||||||||||
|
Discount
amortization %
|
-8.73
|
%
|
5.76
|
%
|
2.10
|
%
|
1.05
|
%
|
0.73
|
%
|
-
|
-
|
-
|
-
|
||||||||||||||
|
Yield
|
5.26
|
%
|
15.60
|
%
|
9.76
|
%
|
8.29
|
%
|
3.21
|
%
|
-
|
-
|
-
|
-
|
||||||||||||||
|
Underlying
Loan Characteristics
|
||||||||||||||||||||||||||||
|
Number
of loans
|
47,114
|
23,662
|
25,560
|
31,788
|
34,749
|
-
|
-
|
-
|
-
|
|||||||||||||||||||
|
Total
loan face
|
$5,028,152
|
$3,436,393
|
$3,614,761
|
$5,439,260
|
$5,945,868
|
-
|
-
|
-
|
-
|
|||||||||||||||||||
|
Average
loan size
|
$107
|
$145
|
$141
|
$171
|
$171
|
-
|
-
|
-
|
-
|
|||||||||||||||||||
|
Southern
CA
|
19
|
%
|
19
|
%
|
19
|
%
|
19
|
%
|
19
|
%
|
-
|
-
|
-
|
-
|
||||||||||||||
|
Northern
CA
|
13
|
%
|
14
|
%
|
13
|
%
|
14
|
%
|
14
|
%
|
-
|
-
|
-
|
-
|
||||||||||||||
|
Florida
|
12
|
%
|
12
|
%
|
12
|
%
|
12
|
%
|
12
|
%
|
-
|
-
|
-
|
-
|
||||||||||||||
|
New
York
|
4
|
%
|
4
|
%
|
4
|
%
|
4
|
%
|
4
|
%
|
-
|
-
|
-
|
-
|
||||||||||||||
|
Georgia
|
2
|
%
|
1
|
%
|
1
|
%
|
1
|
%
|
1
|
%
|
-
|
-
|
-
|
-
|
||||||||||||||
|
New
Jersey
|
3
|
%
|
3
|
%
|
4
|
%
|
4
|
%
|
4
|
%
|
-
|
-
|
-
|
-
|
||||||||||||||
|
Texas
|
5
|
%
|
4
|
%
|
4
|
%
|
4
|
%
|
4
|
%
|
-
|
-
|
-
|
-
|
||||||||||||||
|
Arizona
|
4
|
%
|
5
|
%
|
5
|
%
|
4
|
%
|
4
|
%
|
-
|
-
|
-
|
-
|
||||||||||||||
|
Illinois
|
5
|
%
|
5
|
%
|
5
|
%
|
6
|
%
|
6
|
%
|
-
|
-
|
-
|
-
|
||||||||||||||
|
Colorado
|
2
|
%
|
2
|
%
|
2
|
%
|
2
|
%
|
2
|
%
|
-
|
-
|
-
|
-
|
||||||||||||||
|
Virginia
|
2
|
%
|
1
|
%
|
2
|
%
|
2
|
%
|
2
|
%
|
-
|
-
|
-
|
-
|
||||||||||||||
|
Other
states
|
29
|
%
|
29
|
%
|
29
|
%
|
28
|
%
|
28
|
%
|
-
|
-
|
-
|
-
|
||||||||||||||
|
The
Redwood
Review
3rd
Quarter
2007
|
Appendix
Table
12 C -
Residential
Subprime CES and
Underlying
Loan Characteristics
|
104 |
|
|
Table
12C: Residential Subprime CES and Underlying Loan
Characteristics ($ in
thousands)
|
|
|
2007
|
2007
|
2007
|
2006
|
2006
|
2006
|
2006
|
2005
|
2005
|
|||||||||||||||||||
|
|
Q3
|
Q2
|
Q1
|
Q4
|
Q3
|
Q2
|
Q1
|
Q4
|
Q3
|
|||||||||||||||||||
|
Year
2007 origination
|
1
|
%
|
2
|
%
|
2
|
%
|
0
|
%
|
0
|
%
|
-
|
-
|
-
|
-
|
||||||||||||||
|
Year
2006 origination
|
99
|
%
|
98
|
%
|
98
|
%
|
100
|
%
|
100
|
%
|
-
|
-
|
-
|
-
|
||||||||||||||
|
Year
2005 origination
|
0
|
%
|
0
|
%
|
0
|
%
|
0
|
%
|
0
|
%
|
-
|
-
|
-
|
-
|
||||||||||||||
|
Year
2004 origination and earlier
|
0
|
%
|
0
|
%
|
0
|
%
|
0
|
%
|
0
|
%
|
-
|
-
|
-
|
-
|
||||||||||||||
|
Wtd
Avg Original LTV (1)
|
86
|
%
|
83
|
%
|
84
|
%
|
82
|
%
|
82
|
%
|
-
|
-
|
-
|
-
|
||||||||||||||
|
Original
LTV: 0 - 50
|
15
|
%
|
2
|
%
|
2
|
%
|
2
|
%
|
2
|
%
|
-
|
-
|
-
|
-
|
||||||||||||||
|
Original
LTV: 50.01 - 60
|
2
|
%
|
3
|
%
|
3
|
%
|
3
|
%
|
3
|
%
|
-
|
-
|
-
|
-
|
||||||||||||||
|
Original
LTV: 60.01 - 70
|
5
|
%
|
6
|
%
|
6
|
%
|
6
|
%
|
7
|
%
|
-
|
-
|
-
|
-
|
||||||||||||||
|
Original
LTV: 70.01 - 80
|
36
|
%
|
44
|
%
|
43
|
%
|
47
|
%
|
47
|
%
|
-
|
-
|
-
|
-
|
||||||||||||||
|
Original
LTV: 80.01 - 90
|
18
|
%
|
24
|
%
|
24
|
%
|
25
|
%
|
24
|
%
|
-
|
-
|
-
|
-
|
||||||||||||||
|
Original
LTV: 90.01 - 100
|
24
|
%
|
21
|
%
|
22
|
%
|
17
|
%
|
17
|
%
|
-
|
-
|
-
|
-
|
||||||||||||||
|
Unknown
|
0
|
%
|
0
|
%
|
0
|
%
|
0
|
%
|
0
|
%
|
-
|
-
|
-
|
-
|
||||||||||||||
|
Wtd
Avg FICO
|
644
|
640
|
643
|
636
|
636
|
-
|
-
|
-
|
-
|
|||||||||||||||||||
|
FICO:
<= 600
|
19
|
%
|
24
|
%
|
23
|
%
|
25
|
%
|
25
|
%
|
-
|
-
|
-
|
-
|
||||||||||||||
|
FICO:
601 - 620
|
13
|
%
|
12
|
%
|
12
|
%
|
13
|
%
|
13
|
%
|
-
|
-
|
-
|
-
|
||||||||||||||
|
FICO:
621 - 640
|
16
|
%
|
17
|
%
|
16
|
%
|
17
|
%
|
17
|
%
|
-
|
-
|
-
|
-
|
||||||||||||||
|
FICO:
641 - 660
|
15
|
%
|
13
|
%
|
13
|
%
|
13
|
%
|
13
|
%
|
-
|
-
|
-
|
-
|
||||||||||||||
|
FICO:
661 - 680
|
12
|
%
|
10
|
%
|
10
|
%
|
10
|
%
|
10
|
%
|
-
|
-
|
-
|
-
|
||||||||||||||
|
FICO:
681 - 700
|
9
|
%
|
8
|
%
|
9
|
%
|
8
|
%
|
8
|
%
|
-
|
-
|
-
|
-
|
||||||||||||||
|
FICO:
701 - 720
|
6
|
%
|
6
|
%
|
6
|
%
|
5
|
%
|
5
|
%
|
-
|
-
|
-
|
-
|
||||||||||||||
|
FICO:
721 - 740
|
4
|
%
|
4
|
%
|
5
|
%
|
4
|
%
|
4
|
%
|
-
|
-
|
-
|
-
|
||||||||||||||
|
FICO:
741 - 760
|
3
|
%
|
3
|
%
|
3
|
%
|
2
|
%
|
2
|
%
|
-
|
-
|
-
|
-
|
||||||||||||||
|
FICO:
761 - 780
|
2
|
%
|
2
|
%
|
2
|
%
|
2
|
%
|
2
|
%
|
-
|
-
|
-
|
-
|
||||||||||||||
|
FICO:
781 - 800
|
1
|
%
|
1
|
%
|
1
|
%
|
1
|
%
|
1
|
%
|
-
|
-
|
-
|
-
|
||||||||||||||
|
FICO:
>= 801
|
0
|
%
|
0
|
%
|
0
|
%
|
0
|
%
|
0
|
%
|
-
|
-
|
-
|
-
|
||||||||||||||
|
Unknown
|
0
|
%
|
0
|
%
|
0
|
%
|
0
|
%
|
0
|
%
|
-
|
-
|
-
|
-
|
||||||||||||||
|
Conforming
at Origination %
|
82
|
%
|
77
|
%
|
78
|
%
|
75
|
%
|
75
|
%
|
-
|
-
|
-
|
-
|
||||||||||||||
|
>
$1 MM %
|
0
|
%
|
0
|
%
|
0
|
%
|
0
|
%
|
0
|
%
|
-
|
-
|
-
|
-
|
||||||||||||||
|
2nd
Home %
|
1
|
%
|
2
|
%
|
2
|
%
|
1
|
%
|
1
|
%
|
-
|
-
|
-
|
-
|
||||||||||||||
|
Investment
Home %
|
7
|
%
|
9
|
%
|
9
|
%
|
8
|
%
|
8
|
%
|
-
|
-
|
-
|
-
|
||||||||||||||
|
Purchase
|
60
|
%
|
52
|
%
|
52
|
%
|
50
|
%
|
50
|
%
|
-
|
-
|
-
|
-
|
||||||||||||||
|
Cash
Out Refi
|
37
|
%
|
44
|
%
|
44
|
%
|
47
|
%
|
47
|
%
|
-
|
-
|
-
|
-
|
||||||||||||||
|
Rate-Term
Refi
|
3
|
%
|
4
|
%
|
4
|
%
|
3
|
%
|
3
|
%
|
-
|
-
|
-
|
-
|
||||||||||||||
|
Construction
|
0
|
%
|
0
|
%
|
0
|
%
|
0
|
%
|
0
|
%
|
-
|
-
|
-
|
-
|
||||||||||||||
|
Other
|
0
|
%
|
0
|
%
|
0
|
%
|
0
|
%
|
0
|
%
|
-
|
-
|
-
|
-
|
||||||||||||||
|
Full
Doc
|
53
|
%
|
50
|
%
|
49
|
%
|
53
|
%
|
53
|
%
|
-
|
-
|
-
|
-
|
||||||||||||||
|
No
Doc
|
1
|
%
|
1
|
%
|
1
|
%
|
0
|
%
|
0
|
%
|
-
|
-
|
-
|
-
|
||||||||||||||
|
Other
Doc (Lim, Red, Stated, etc)
|
46
|
%
|
49
|
%
|
50
|
%
|
47
|
%
|
47
|
%
|
-
|
-
|
-
|
-
|
||||||||||||||
|
2-4
Family
|
7
|
%
|
8
|
%
|
8
|
%
|
8
|
%
|
8
|
%
|
-
|
-
|
-
|
-
|
||||||||||||||
|
Condo
|
8
|
%
|
7
|
%
|
7
|
%
|
7
|
%
|
7
|
%
|
-
|
-
|
-
|
-
|
||||||||||||||
|
Single
Family
|
85
|
%
|
85
|
%
|
85
|
%
|
85
|
%
|
85
|
%
|
-
|
-
|
-
|
-
|
||||||||||||||
|
Other
|
0
|
%
|
0
|
%
|
0
|
%
|
0
|
%
|
0
|
%
|
-
|
-
|
-
|
-
|
||||||||||||||
|
(1)
In order to more accurately reflect the risk of 2nd lien collateral,
we
are now using combined LTV in the weighted average calculation
for these
loans. This has the effect of raising the reported weighted average
LTV.
At the end of the third quarter 33% of subprime CES loans were
from 2nd
lien deals.
|
|
The
Redwood
Review
3rd
Quarter
2007
|
Appendix
Table
12 C -
Residential
Subprime CES and
Underlying
Loan Characteristics
|
105 |
|
|
Table
13 - Other Real Estate Investments and Underlying Characteristics
($ in
thousands)
|
|
2007
|
|
2007
|
|
2007
|
|
2006
|
|
2006
|
|
2006
|
|
2006
|
|
2005
|
|
2005
|
|
|||||||||||
|
|
|
Q3
|
|
Q2
|
|
Q1
|
|
Q4
|
|
Q3
|
|
Q2
|
|
Q1
|
|
Q4
|
|
Q3
|
||||||||||
|
Market
value
|
$25,300
|
$34,168
|
$50,057
|
-
|
-
|
-
|
-
|
-
|
-
|
|||||||||||||||||||
|
Current
Rating
|
||||||||||||||||||||||||||||
|
AAA
|
$1,960
|
$1,804
|
$2,038
|
-
|
-
|
-
|
-
|
-
|
-
|
|||||||||||||||||||
|
AA
|
-
|
-
|
-
|
-
|
-
|
-
|
-
|
-
|
-
|
|||||||||||||||||||
|
A
|
8,427
|
13,958
|
18,699
|
-
|
-
|
-
|
-
|
-
|
-
|
|||||||||||||||||||
|
BBB
|
2,953
|
4,437
|
5,729
|
-
|
-
|
-
|
-
|
-
|
-
|
|||||||||||||||||||
|
BB
|
1,757
|
3,775
|
4,185
|
-
|
-
|
-
|
-
|
-
|
-
|
|||||||||||||||||||
|
B
|
2,482
|
-
|
-
|
-
|
-
|
-
|
-
|
-
|
-
|
|||||||||||||||||||
|
Non-rated
|
7,721
|
10,194
|
19,406
|
-
|
-
|
-
|
-
|
-
|
-
|
|||||||||||||||||||
|
Total
market value
|
$25,300
|
$34,168
|
$50,057
|
-
|
-
|
-
|
-
|
-
|
-
|
|||||||||||||||||||
|
Security
Type
|
||||||||||||||||||||||||||||
|
ARM
|
$707
|
$398
|
$422
|
-
|
-
|
-
|
-
|
-
|
-
|
|||||||||||||||||||
|
Option
ARM
|
2,051
|
2,597
|
3,198
|
-
|
-
|
-
|
-
|
-
|
-
|
|||||||||||||||||||
|
Hybrid
|
20,771
|
29,245
|
43,969
|
-
|
-
|
-
|
-
|
-
|
-
|
|||||||||||||||||||
|
Fixed
|
1,771
|
1,928
|
2,468
|
-
|
-
|
-
|
-
|
-
|
-
|
|||||||||||||||||||
|
Total
market value
|
$25,300
|
$34,168
|
$50,057
|
-
|
-
|
-
|
-
|
-
|
-
|
|||||||||||||||||||
|
Interest
income
|
$1,275
|
$669
|
$2,465
|
-
|
-
|
-
|
-
|
-
|
-
|
|||||||||||||||||||
|
Average
balance
|
$31,187
|
$44,061
|
$37,169
|
-
|
-
|
-
|
-
|
-
|
-
|
|||||||||||||||||||
|
Yield
|
16.36
|
%
|
6.07
|
%
|
26.53
|
%
|
-
|
-
|
-
|
-
|
-
|
-
|
||||||||||||||||
|
The
Redwood
Review
3rd
Quarter
2007
|
Appendix
Table
13 -
Other
Real Estate Investment and
Underlying
Characteristics
|
106 |
|
|
Table
14: Residential Real Estate Loan Characteristics ($
in
thousands)
|
|
|
|
|
|
|
|
|
|
|
|
|||||||||||||||||||
|
|
2007
|
2007
|
2007
|
2006
|
2006
|
2006
|
2006
|
2005
|
2005
|
|||||||||||||||||||
|
|
Q3
|
Q2
|
Q1
|
Q4
|
Q3
|
Q2
|
Q1
|
Q4
|
Q3
|
|||||||||||||||||||
|
Residential
Loans
|
$7,546,529
|
$8,256,759
|
$8,582,964
|
$9,212,002
|
$9,718,985
|
$10,318,641
|
$11,846,454
|
$13,719,242
|
$16,386,833
|
|||||||||||||||||||
|
Number
of loans
|
21,981
|
24,452
|
25,579
|
27,695
|
31,744
|
34,013
|
37,458
|
33,863
|
51,593
|
|||||||||||||||||||
|
Average
loan size
|
$343
|
$338
|
$336
|
$333
|
$306
|
$303
|
$316
|
$405
|
$318
|
|||||||||||||||||||
|
Adjustable
%
|
69
|
%
|
71
|
%
|
79
|
%
|
85
|
%
|
89
|
%
|
99
|
%
|
99
|
%
|
98
|
%
|
100
|
%
|
||||||||||
|
Hybrid
%
|
31
|
%
|
29
|
%
|
20
|
%
|
15
|
%
|
11
|
%
|
1
|
%
|
1
|
%
|
2
|
%
|
0
|
%
|
||||||||||
|
Fixed
%
|
0
|
%
|
0
|
%
|
1
|
%
|
0
|
%
|
0
|
%
|
0
|
%
|
0
|
%
|
0
|
%
|
0
|
%
|
||||||||||
|
Amortizing
%
|
5
|
%
|
5
|
%
|
4
|
%
|
3
|
%
|
3
|
%
|
1
|
%
|
1
|
%
|
1
|
%
|
0
|
%
|
||||||||||
|
Interest-only
%
|
95
|
%
|
95
|
%
|
96
|
%
|
97
|
%
|
97
|
%
|
99
|
%
|
99
|
%
|
99
|
%
|
100
|
%
|
||||||||||
|
Negatively
amortizing %
|
0
|
%
|
0
|
%
|
0
|
%
|
0
|
%
|
0
|
%
|
0
|
%
|
0
|
%
|
0
|
%
|
0
|
%
|
||||||||||
|
Southern
California
|
15
|
%
|
14
|
%
|
14
|
%
|
13
|
%
|
12
|
%
|
11
|
%
|
11
|
%
|
11
|
%
|
11
|
%
|
||||||||||
|
Northern
California
|
10
|
%
|
11
|
%
|
10
|
%
|
10
|
%
|
10
|
%
|
10
|
%
|
10
|
%
|
12
|
%
|
11
|
%
|
||||||||||
|
Florida
|
12
|
%
|
12
|
%
|
13
|
%
|
12
|
%
|
12
|
%
|
13
|
%
|
12
|
%
|
13
|
%
|
12
|
%
|
||||||||||
|
New
York
|
6
|
%
|
6
|
%
|
6
|
%
|
6
|
%
|
6
|
%
|
6
|
%
|
6
|
%
|
5
|
%
|
5
|
%
|
||||||||||
|
Georgia
|
4
|
%
|
4
|
%
|
5
|
%
|
5
|
%
|
5
|
%
|
5
|
%
|
5
|
%
|
5
|
%
|
5
|
%
|
||||||||||
|
New
Jersey
|
4
|
%
|
4
|
%
|
4
|
%
|
4
|
%
|
4
|
%
|
4
|
%
|
4
|
%
|
4
|
%
|
4
|
%
|
||||||||||
|
Texas
|
5
|
%
|
5
|
%
|
5
|
%
|
5
|
%
|
5
|
%
|
5
|
%
|
5
|
%
|
4
|
%
|
4
|
%
|
||||||||||
|
Arizona
|
4
|
%
|
4
|
%
|
4
|
%
|
4
|
%
|
4
|
%
|
4
|
%
|
4
|
%
|
4
|
%
|
4
|
%
|
||||||||||
|
Illinois
|
3
|
%
|
3
|
%
|
3
|
%
|
3
|
%
|
3
|
%
|
2
|
%
|
2
|
%
|
2
|
%
|
3
|
%
|
||||||||||
|
Colorado
|
3
|
%
|
3
|
%
|
3
|
%
|
4
|
%
|
4
|
%
|
4
|
%
|
4
|
%
|
4
|
%
|
4
|
%
|
||||||||||
|
Virginia
|
3
|
%
|
3
|
%
|
3
|
%
|
3
|
%
|
3
|
%
|
3
|
%
|
3
|
%
|
3
|
%
|
3
|
%
|
||||||||||
|
Other
states (none greater than 3%)
|
31
|
%
|
31
|
%
|
30
|
%
|
31
|
%
|
32
|
%
|
33
|
%
|
34
|
%
|
33
|
%
|
34
|
%
|
||||||||||
|
Year
2007 origination
|
12
|
%
|
11
|
%
|
3
|
%
|
0
|
%
|
0
|
%
|
0
|
%
|
0
|
%
|
0
|
%
|
0
|
%
|
||||||||||
|
Year
2006 origination
|
19
|
%
|
18
|
%
|
19
|
%
|
17
|
%
|
10
|
%
|
0
|
%
|
0
|
%
|
0
|
%
|
0
|
%
|
||||||||||
|
Year
2005 origination
|
5
|
%
|
5
|
%
|
5
|
%
|
5
|
%
|
5
|
%
|
5
|
%
|
5
|
%
|
6
|
%
|
5
|
%
|
||||||||||
|
Year
2004 origination or earlier
|
64
|
%
|
66
|
%
|
73
|
%
|
78
|
%
|
85
|
%
|
95
|
%
|
95
|
%
|
94
|
%
|
95
|
%
|
||||||||||
|
Wtd
Avg Original LTV
|
68
|
%
|
68
|
%
|
68
|
%
|
68
|
%
|
68
|
%
|
68
|
%
|
68
|
%
|
69
|
%
|
68
|
%
|
||||||||||
|
Original
LTV: 0 - 50
|
15
|
%
|
15
|
%
|
15
|
%
|
16
|
%
|
15
|
%
|
15
|
%
|
15
|
%
|
13
|
%
|
14
|
%
|
||||||||||
|
Original
LTV: 50 - 60
|
11
|
%
|
11
|
%
|
12
|
%
|
12
|
%
|
12
|
%
|
12
|
%
|
12
|
%
|
11
|
%
|
11
|
%
|
||||||||||
|
Original
LTV: 60 - 70
|
19
|
%
|
20
|
%
|
20
|
%
|
20
|
%
|
20
|
%
|
21
|
%
|
21
|
%
|
21
|
%
|
20
|
%
|
||||||||||
|
Original
LTV: 70 - 80
|
48
|
%
|
47
|
%
|
46
|
%
|
45
|
%
|
46
|
%
|
45
|
%
|
45
|
%
|
48
|
%
|
46
|
%
|
||||||||||
|
Original
LTV: 80 - 90
|
2
|
%
|
2
|
%
|
2
|
%
|
2
|
%
|
2
|
%
|
2
|
%
|
2
|
%
|
2
|
%
|
2
|
%
|
||||||||||
|
Original
LTV: 90 - 100
|
5
|
%
|
5
|
%
|
5
|
%
|
5
|
%
|
5
|
%
|
5
|
%
|
5
|
%
|
5
|
%
|
7
|
%
|
||||||||||
|
Wtg
Avg FICO
|
732
|
732
|
727
|
733
|
730
|
730
|
730
|
731
|
731
|
|||||||||||||||||||
|
FICO:
<= 600
|
1
|
%
|
1
|
%
|
1
|
%
|
1
|
%
|
1
|
%
|
1
|
%
|
1
|
%
|
1
|
%
|
1
|
%
|
||||||||||
|
FICO:
601 -620
|
1
|
%
|
1
|
%
|
1
|
%
|
1
|
%
|
1
|
%
|
1
|
%
|
1
|
%
|
1
|
%
|
1
|
%
|
||||||||||
|
FICO:
621 - 640
|
2
|
%
|
2
|
%
|
2
|
%
|
1
|
%
|
1
|
%
|
1
|
%
|
2
|
%
|
1
|
%
|
1
|
%
|
||||||||||
|
FICO:
641 -660
|
3
|
%
|
3
|
%
|
3
|
%
|
3
|
%
|
3
|
%
|
3
|
%
|
3
|
%
|
3
|
%
|
3
|
%
|
||||||||||
|
FICO:
661 - 680
|
7
|
%
|
7
|
%
|
7
|
%
|
8
|
%
|
8
|
%
|
8
|
%
|
8
|
%
|
8
|
%
|
8
|
%
|
||||||||||
|
FICO:
681 - 700
|
12
|
%
|
12
|
%
|
12
|
%
|
12
|
%
|
12
|
%
|
12
|
%
|
12
|
%
|
12
|
%
|
12
|
%
|
||||||||||
|
FICO:
701 - 720
|
13
|
%
|
14
|
%
|
14
|
%
|
14
|
%
|
14
|
%
|
14
|
%
|
14
|
%
|
15
|
%
|
14
|
%
|
||||||||||
|
FICO:
721 - 740
|
13
|
%
|
13
|
%
|
13
|
%
|
13
|
%
|
14
|
%
|
13
|
%
|
13
|
%
|
13
|
%
|
14
|
%
|
||||||||||
|
FICO:
741 - 760
|
15
|
%
|
15
|
%
|
15
|
%
|
15
|
%
|
15
|
%
|
15
|
%
|
15
|
%
|
15
|
%
|
15
|
%
|
||||||||||
|
FICO:
761 - 780
|
17
|
%
|
17
|
%
|
17
|
%
|
17
|
%
|
17
|
%
|
17
|
%
|
17
|
%
|
17
|
%
|
17
|
%
|
||||||||||
|
FICO:
781 - 800
|
13
|
%
|
13
|
%
|
12
|
%
|
12
|
%
|
12
|
%
|
12
|
%
|
11
|
%
|
11
|
%
|
11
|
%
|
||||||||||
|
FICO:
>= 801
|
4
|
%
|
4
|
%
|
3
|
%
|
3
|
%
|
2
|
%
|
3
|
%
|
3
|
%
|
3
|
%
|
3
|
%
|
||||||||||
|
Conforming
balance at origination %
|
35
|
%
|
35
|
%
|
37
|
%
|
38
|
%
|
41
|
%
|
45
|
%
|
37
|
%
|
38
|
%
|
37
|
%
|
||||||||||
|
%
balance in loans > $1mm per loan
|
15
|
%
|
15
|
%
|
16
|
%
|
18
|
%
|
14
|
%
|
14
|
%
|
14
|
%
|
13
|
%
|
14
|
%
|
||||||||||
|
2nd
home %
|
11
|
%
|
11
|
%
|
11
|
%
|
11
|
%
|
11
|
%
|
11
|
%
|
11
|
%
|
10
|
%
|
10
|
%
|
||||||||||
|
Investment
home %
|
3
|
%
|
3
|
%
|
3
|
%
|
3
|
%
|
3
|
%
|
3
|
%
|
3
|
%
|
2
|
%
|
2
|
%
|
||||||||||
|
|
||||||||||||||||||||||||||||
|
Purchase
|
36
|
%
|
35
|
%
|
35
|
%
|
34
|
%
|
34
|
%
|
33
|
%
|
33
|
%
|
33
|
%
|
33
|
%
|
||||||||||
|
Cash
out refinance
|
32
|
%
|
32
|
%
|
31
|
%
|
32
|
%
|
32
|
%
|
32
|
%
|
34
|
%
|
34
|
%
|
34
|
%
|
||||||||||
|
Rate-term
refinance
|
31
|
%
|
31
|
%
|
32
|
%
|
32
|
%
|
32
|
%
|
34
|
%
|
32
|
%
|
32
|
%
|
32
|
%
|
||||||||||
|
Construction
|
0
|
%
|
0
|
%
|
0
|
%
|
0
|
%
|
0
|
%
|
0
|
%
|
0
|
%
|
0
|
%
|
0
|
%
|
||||||||||
|
Other
|
2
|
%
|
2
|
%
|
2
|
%
|
2
|
%
|
2
|
%
|
1
|
%
|
1
|
%
|
1
|
%
|
1
|
%
|
||||||||||
|
The
Redwood
Review
3rd
Quarter
2007
|
Appendix
Table
14 -
Residential
Real Estate Loan Characteristics
|
107 |
|
|
Table
15: Commercial Real Estate Loans Credit Performance
($ in
thousands)
|
|
|
Managed
Loans
|
|
Internally-Designated
Credit Reserve
|
|
External
Credit Enhancement
|
|
Total
Credit Protection (1)
|
|
Total
Credit Protection as % of Loans
|
|
Seriously
Delinquent Loans
|
|
Seriously
Delinquent Loan % of Current Balance
|
|
Total
Credit Losses
|
|
Third
Parties' Share of Net Charge-offs/ (Recoveries)
|
|
Redwood's
Share of Net Charge-offs/ (Recoveries)
|
|
Total
Credit Losses As % of Loans (Annualized)
|
||||||||||||||||
|
Total
Managed Commercial Portfolio
|
Q3:
2005
|
$40,081,879
|
$146,671
|
$706,532
|
$853,203
|
2.13
|
%
|
$20,690
|
0.05
|
%
|
$59
|
$59
|
$0
|
0.00
|
%
|
||||||||||||||||||||||
|
Q4:
2005
|
46,825,453
|
149,947
|
714,168
|
864,115
|
1.85
|
%
|
40,916
|
0.09
|
%
|
-
|
-
|
-
|
0.00
|
%
|
|||||||||||||||||||||||
|
2005
|
46,825,453
|
149,947
|
714,168
|
864,115
|
1.85
|
%
|
40,916
|
0.09
|
%
|
1,587
|
1,272
|
315
|
0.00
|
%
|
|||||||||||||||||||||||
|
Q1:
2006
|
48,366,213
|
175,913
|
645,675
|
821,588
|
1.70
|
%
|
38,124
|
0.08
|
%
|
90
|
55
|
35
|
0.00
|
%
|
|||||||||||||||||||||||
|
Q2:
2006
|
51,635,796
|
200,275
|
653,476
|
853,751
|
1.65
|
%
|
44,632
|
0.09
|
%
|
1,463
|
1,463
|
-
|
0.01
|
%
|
|||||||||||||||||||||||
|
Q3:
2006
|
58,106,355
|
266,523
|
678,489
|
945,012
|
1.63
|
%
|
70,586
|
0.12
|
%
|
2,167
|
1,705
|
462
|
0.01
|
%
|
|||||||||||||||||||||||
|
Q4:
2006
|
57,789,159
|
303,481
|
472,669
|
776,150
|
1.34
|
%
|
64,367
|
0.11
|
%
|
1,156
|
1,132
|
24
|
0.01
|
%
|
|||||||||||||||||||||||
|
2006
|
57,789,159
|
303,481
|
472,669
|
776,150
|
1.34
|
%
|
64,367
|
0.11
|
%
|
4,876
|
4,355
|
521
|
0.03
|
%
|
|||||||||||||||||||||||
|
Q1:
2007
|
57,450,042
|
304,955
|
551,917
|
856,872
|
1.49
|
%
|
77,726
|
0.14
|
%
|
2,688
|
1,417
|
1,271
|
0.02
|
%
|
|||||||||||||||||||||||
|
Q2:
2007
|
63,626,147
|
321,234
|
584,706
|
905,940
|
1.42
|
%
|
73,104
|
0.10
|
%
|
72
|
30
|
42
|
0.00
|
%
|
|||||||||||||||||||||||
|
Q3:
2007
|
$65,030,244
|
$320,987
|
$577,447
|
$898,434
|
1.38
|
%
|
$181,473
|
0.28
|
%
|
$680
|
$408
|
$272
|
0.00
|
%
|
|||||||||||||||||||||||
|
|
|||||||||||||||||||||||||||||||||||||
|
Commercial
Real Estate Loans
|
Q3:
2005
|
$66,348
|
$8,141
|
$0
|
$8,141
|
12.27
|
%
|
$0
|
0.00
|
%
|
$0
|
$0
|
$0
|
0.00
|
%
|
||||||||||||||||||||||
|
Q4:
2005
|
70,091
|
8,141
|
-
|
8,141
|
11.61
|
%
|
-
|
0.00
|
%
|
-
|
-
|
-
|
0.00
|
%
|
|||||||||||||||||||||||
|
2005
|
70,091
|
8,141
|
-
|
8,141
|
11.61
|
%
|
-
|
0.00
|
%
|
315
|
-
|
315
|
0.45
|
%
|
|||||||||||||||||||||||
|
Q1:
2006
|
65,508
|
8,141
|
-
|
8,141
|
12.43
|
%
|
-
|
0.00
|
%
|
35
|
-
|
35
|
0.21
|
%
|
|||||||||||||||||||||||
|
Q2:
2006
|
46,959
|
8,141
|
-
|
8,141
|
17.34
|
%
|
-
|
0.00
|
%
|
-
|
-
|
-
|
0.00
|
%
|
|||||||||||||||||||||||
|
Q3:
2006
|
42,384
|
8,141
|
-
|
8,141
|
19.21
|
%
|
-
|
0.00
|
%
|
-
|
-
|
-
|
0.00
|
%
|
|||||||||||||||||||||||
|
Q4:
2006
|
38,360
|
8,141
|
-
|
8,141
|
21.22
|
%
|
-
|
0.00
|
%
|
-
|
-
|
-
|
0.00
|
%
|
|||||||||||||||||||||||
|
2006
|
38,360
|
8,141
|
-
|
8,141
|
21.22
|
%
|
-
|
0.00
|
%
|
35
|
-
|
35
|
0.36
|
%
|
|||||||||||||||||||||||
|
Q1:
2007
|
38,394
|
10,489
|
-
|
10,489
|
27.32
|
%
|
-
|
0.00
|
%
|
-
|
-
|
-
|
0.00
|
%
|
|||||||||||||||||||||||
|
Q2:
2007
|
38,311
|
10,489
|
-
|
10,489
|
27.38
|
%
|
-
|
0.00
|
%
|
-
|
-
|
-
|
0.00
|
%
|
|||||||||||||||||||||||
|
Q3:
2007
|
$30,784
|
$10,489
|
$0
|
$10,489
|
34.07
|
%
|
$0
|
0.00
|
%
|
$0
|
$0
|
$0
|
0.00
|
%
|
|||||||||||||||||||||||
|
|
|||||||||||||||||||||||||||||||||||||
|
Commercial
CES
|
Q3:
2005
|
$40,015,531
|
$138,530
|
$706,532
|
$845,062
|
2.11
|
%
|
$20,690
|
0.05
|
%
|
$59
|
$59
|
$0
|
0.00
|
%
|
||||||||||||||||||||||
|
Q4:
2005
|
46,755,362
|
141,806
|
714,168
|
855,974
|
1.83
|
%
|
40,916
|
0.09
|
%
|
-
|
-
|
-
|
0.00
|
%
|
|||||||||||||||||||||||
|
2005
|
46,755,362
|
141,806
|
714,168
|
855,974
|
1.83
|
%
|
40,916
|
0.09
|
%
|
1,272
|
1,272
|
-
|
0.00
|
%
|
|||||||||||||||||||||||
|
Q1:
2006
|
48,300,705
|
167,772
|
645,675
|
813,447
|
1.68
|
%
|
38,124
|
0.08
|
%
|
55
|
55
|
-
|
0.00
|
%
|
|||||||||||||||||||||||
|
Q2:
2006
|
51,588,837
|
192,134
|
653,476
|
845,610
|
1.64
|
%
|
44,632
|
0.09
|
%
|
1,463
|
1,463
|
-
|
0.01
|
%
|
|||||||||||||||||||||||
|
Q3:
2006
|
58,063,971
|
258,382
|
678,489
|
936,871
|
1.61
|
%
|
70,586
|
0.12
|
%
|
2,167
|
1,705
|
462
|
0.01
|
%
|
|||||||||||||||||||||||
|
Q4:
2006
|
57,750,799
|
295,340
|
472,669
|
768,009
|
1.33
|
%
|
64,367
|
0.11
|
%
|
1,156
|
1,132
|
24
|
0.01
|
%
|
|||||||||||||||||||||||
|
2006
|
57,750,799
|
295,340
|
472,669
|
768,009
|
1.33
|
%
|
64,367
|
0.11
|
%
|
4,841
|
4,355
|
486
|
0.01
|
%
|
|||||||||||||||||||||||
|
Q1:
2007
|
57,411,648
|
294,466
|
551,917
|
846,383
|
1.47
|
%
|
77,726
|
0.14
|
%
|
2,688
|
1,417
|
1,271
|
0.02
|
%
|
|||||||||||||||||||||||
|
Q2:
2007
|
63,587,836
|
310,745
|
584,706
|
895,451
|
1.41
|
%
|
73,104
|
0.10
|
%
|
72
|
30
|
42
|
0.00
|
%
|
|||||||||||||||||||||||
|
Q3:
2007
|
$64,999,460
|
$310,498
|
$577,447
|
$887,945
|
1.37
|
%
|
$181,473
|
0.28
|
%
|
$680
|
$408
|
$272
|
0.00
|
%
|
|||||||||||||||||||||||
|
(1)
The credit reserve on commercial real estate loans is only
available to
absorb losses on our commercial real estate loan portfolio.
Internally-designated credit reserves and external credit enhancement
are
only available to absorb losses on the commercial CES. Much
of the
external credit enhancement will share loan losses with Redwood
rather
than protect Redwood from
losses.
|
|
The
Redwood
Review
3rd
Quarter
2007
|
Appendix
Table
15 -
Commercial
Real Estate Loans Credit Performance
|
108 |
|
|
Table
16: Commercial CES Underlying Loan Characteristics
(all $ in
thousands)
|
|
2007
|
|
2007
|
|
2007
|
|
2006
|
|
2006
|
|
2006
|
|
2006
|
|
2005
|
|
2005
|
|
|||||||||||
|
|
|
Q3
|
|
Q2
|
|
Q1
|
|
Q4
|
|
Q3
|
|
Q2
|
|
Q1
|
|
Q4
|
|
Q3
|
|
|||||||||
|
Commercial
CES Loans
|
$64,999,460
|
$63,587,836
|
$57,411,648
|
$57,750,799
|
$58,063,971
|
$51,588,837
|
$48,300,705
|
$46,755,362
|
$40,015,531
|
|||||||||||||||||||
|
Number
of loans
|
4,633
|
4,648
|
3,968
|
3,889
|
4,032
|
3,456
|
3,737
|
3,618
|
2,866
|
|||||||||||||||||||
|
Average
face value
|
$14,030
|
$13,681
|
$14,469
|
$14,850
|
$14,401
|
$14,927
|
$12,925
|
$12,923
|
$13,962
|
|||||||||||||||||||
|
State
Distribution
|
||||||||||||||||||||||||||||
|
CA
|
16
|
%
|
16
|
%
|
17
|
%
|
17
|
%
|
18
|
%
|
18
|
%
|
17
|
%
|
17
|
%
|
16
|
%
|
||||||||||
|
NY
|
13
|
%
|
13
|
%
|
13
|
%
|
13
|
%
|
11
|
%
|
12
|
%
|
12
|
%
|
13
|
%
|
13
|
%
|
||||||||||
|
TX
|
8
|
%
|
8
|
%
|
8
|
%
|
8
|
%
|
5
|
%
|
6
|
%
|
6
|
%
|
6
|
%
|
7
|
%
|
||||||||||
|
VA
|
5
|
%
|
4
|
%
|
4
|
%
|
4
|
%
|
2
|
%
|
2
|
%
|
2
|
%
|
2
|
%
|
3
|
%
|
||||||||||
|
FL
|
6
|
%
|
6
|
%
|
6
|
%
|
6
|
%
|
5
|
%
|
5
|
%
|
5
|
%
|
5
|
%
|
5
|
%
|
||||||||||
|
Other
|
52
|
%
|
52
|
%
|
52
|
%
|
52
|
%
|
59
|
%
|
57
|
%
|
58
|
%
|
57
|
%
|
56
|
%
|
||||||||||
|
Property
Type Distribution
|
||||||||||||||||||||||||||||
|
Office
|
39
|
%
|
38
|
%
|
35
|
%
|
37
|
%
|
30
|
%
|
36
|
%
|
32
|
%
|
37
|
%
|
39
|
%
|
||||||||||
|
Retail
|
30
|
%
|
30
|
%
|
30
|
%
|
31
|
%
|
32
|
%
|
32
|
%
|
33
|
%
|
33
|
%
|
34
|
%
|
||||||||||
|
Multi-family
|
14
|
%
|
15
|
%
|
12
|
%
|
12
|
%
|
11
|
%
|
11
|
%
|
16
|
%
|
12
|
%
|
10
|
%
|
||||||||||
|
Hospitality
|
7
|
%
|
7
|
%
|
7
|
%
|
7
|
%
|
6
|
%
|
5
|
%
|
7
|
%
|
3
|
%
|
5
|
%
|
||||||||||
|
Self-storage
|
2
|
%
|
2
|
%
|
3
|
%
|
3
|
%
|
0
|
%
|
0
|
%
|
0
|
%
|
0
|
%
|
0
|
%
|
||||||||||
|
Industrial
|
4
|
%
|
4
|
%
|
3
|
%
|
3
|
%
|
1
|
%
|
1
|
%
|
2
|
%
|
2
|
%
|
1
|
%
|
||||||||||
|
Other
|
4
|
%
|
4
|
%
|
10
|
%
|
7
|
%
|
20
|
%
|
15
|
%
|
10
|
%
|
13
|
%
|
11
|
%
|
||||||||||
|
Weighted
average LTV
|
70
|
%
|
70
|
%
|
68
|
%
|
69
|
%
|
69
|
%
|
69
|
%
|
68
|
%
|
68
|
%
|
68
|
%
|
||||||||||
|
Weighted
average debt service coverage ratio
|
1.65
|
1.59
|
1.73
|
1.60
|
1.72
|
1.75
|
1.99
|
2.05
|
1.88
|
|||||||||||||||||||
|
The
Redwood
Review
3rd
Quarter
2007
|
Appendix
Table
16 -
Commercial
CES
Underlying Loan Characteristics
|
109 |
|
|
Table
17: Commercial Real Estate Loan Characteristics ($ in
thousands)
|
|
2007
|
|
2007
|
|
2007
|
|
2006
|
|
2006
|
|
2006
|
|
2006
|
|
2005
|
|
2005
|
|
|||||||||||
|
|
|
Q3
|
|
Q2
|
|
Q1
|
|
Q4
|
|
Q3
|
|
Q2
|
|
Q1
|
|
Q4
|
|
Q3
|
||||||||||
|
Commercial
mortgage loans, reported value
|
$25,726
|
$25,827
|
$25,883
|
$28,172
|
$32,170
|
$36,722
|
$55,167
|
$59,692
|
$56,102
|
|||||||||||||||||||
|
Number
of loans
|
7
|
7
|
7
|
7
|
8
|
9
|
12
|
13
|
12
|
|||||||||||||||||||
|
Average
loan size
|
$3,675
|
$3,690
|
$3,698
|
$4,025
|
$4,021
|
$4,080
|
$4,597
|
$4,592
|
$4,675
|
|||||||||||||||||||
|
Seriously
delinquent loans
|
-
|
-
|
-
|
-
|
-
|
-
|
-
|
-
|
-
|
|||||||||||||||||||
|
Realized
credit losses
|
-
|
-
|
-
|
-
|
-
|
-
|
-
|
-
|
-
|
|||||||||||||||||||
|
California
% (based on reported value)
|
1
|
%
|
1
|
%
|
1
|
%
|
7
|
%
|
7
|
%
|
6
|
%
|
19
|
%
|
25
|
%
|
28
|
%
|
||||||||||
|
The
Redwood
Review
3rd
Quarter
2007
|
Appendix
Table
17 -
Commercial
Real Estate Loan Characteristics
|
110 |
|
|
Table
18: Securities Portfolios Credit Rating and Collateral
Type ($ in
millions)
|
|
CURRENT
RATING AT 9/30/2007
|
|||||||||||||||||||||||||
|
At
September 30, 2007:
|
Total
|
|
AAA
|
|
AA
|
|
A
|
|
BBB
|
|
BB
|
|
B
|
|
Unrated
|
||||||||||
|
Residential
prime
|
$1,082
|
$36
|
$176
|
$222
|
$239
|
$235
|
$85
|
$89
|
|||||||||||||||||
|
Residential
alt-a
|
815
|
250
|
104
|
192
|
158
|
68
|
16
|
27
|
|||||||||||||||||
|
Residential
sub-prime
|
338
|
18
|
127
|
106
|
74
|
4
|
8
|
1
|
|||||||||||||||||
|
Other
real estate investments
|
25
|
2
|
0
|
8
|
3
|
2
|
2
|
8
|
|||||||||||||||||
|
Commercial
|
499
|
11
|
2
|
21
|
70
|
200
|
85
|
110
|
|||||||||||||||||
|
CDO
|
192
|
61
|
22
|
39
|
53
|
14
|
0
|
3
|
|||||||||||||||||
|
Total
securities portfolio market value
|
$2,951
|
$378
|
$431
|
$588
|
$597
|
$523
|
$196
|
$238
|
|||||||||||||||||
|
CURRENT
RATING AT 6/30/2007
|
|||||||||||||||||||||||||
|
At
June 30, 2007:
|
Total
|
|
|
AAA
|
|
|
AA
|
|
|
A
|
|
|
BBB
|
|
|
BB
|
|
|
B
|
|
|
Unrated
|
|||
|
Residential
prime
|
$1,440
|
$153
|
$180
|
$255
|
$282
|
$318
|
$131
|
$121
|
|||||||||||||||||
|
Residential
alt-a
|
1,028
|
235
|
101
|
271
|
249
|
103
|
34
|
35
|
|||||||||||||||||
|
Residential
sub-prime
|
440
|
14
|
154
|
149
|
120
|
3
|
0
|
0
|
|||||||||||||||||
|
Other
real estate investments
|
34
|
2
|
0
|
14
|
4
|
4
|
0
|
10
|
|||||||||||||||||
|
Commercial
|
563
|
8
|
4
|
23
|
76
|
215
|
99
|
137
|
|||||||||||||||||
|
CDO
|
256
|
81
|
30
|
48
|
76
|
13
|
0
|
8
|
|||||||||||||||||
|
Total
securities portfolio market value
|
$3,760
|
$493
|
$469
|
$760
|
$807
|
$656
|
$264
|
$311
|
|||||||||||||||||
|
CURRENT
RATING AT 3/31/2007
|
|||||||||||||||||||||||||
|
At
March 31, 2007:
|
Total
|
|
|
AAA
|
|
|
AA
|
|
|
A
|
|
|
BBB
|
|
|
BB
|
|
|
B
|
|
|
Unrated
|
|||
|
Residential
prime
|
$1,361
|
$67
|
$180
|
$247
|
$295
|
$316
|
$132
|
$124
|
|||||||||||||||||
|
Residential
alt-a
|
938
|
207
|
92
|
225
|
243
|
101
|
30
|
40
|
|||||||||||||||||
|
Residential
sub-prime
|
480
|
8
|
152
|
173
|
138
|
9
|
0
|
0
|
|||||||||||||||||
|
Other
real estate investments
|
50
|
2
|
0
|
19
|
6
|
4
|
0
|
19
|
|||||||||||||||||
|
Commercial
|
551
|
9
|
4
|
24
|
79
|
222
|
89
|
124
|
|||||||||||||||||
|
CDO
|
270
|
86
|
27
|
57
|
84
|
13
|
0
|
3
|
|||||||||||||||||
|
Total
securities portfolio market value
|
$3,650
|
$379
|
$455
|
$745
|
$845
|
$665
|
$251
|
$310
|
|||||||||||||||||
|
CURRENT
RATING AT 12/31/2006
|
|||||||||||||||||||||||||
|
At
December 31, 2006:
|
Total
|
|
|
AAA
|
|
|
AA
|
|
|
A
|
|
|
BBB
|
|
|
BB
|
|
|
B
|
|
|
Unrated
|
|||
|
Residential
prime
|
$1,278
|
$14
|
$181
|
$243
|
$285
|
$307
|
$119
|
$129
|
|||||||||||||||||
|
Residential
alt-a
|
613
|
136
|
84
|
106
|
130
|
94
|
23
|
40
|
|||||||||||||||||
|
Residential
sub-prime
|
528
|
8
|
127
|
209
|
174
|
7
|
0
|
3
|
|||||||||||||||||
|
Commercial
|
568
|
9
|
2
|
16
|
93
|
224
|
90
|
134
|
|||||||||||||||||
|
CDO
|
246
|
66
|
30
|
52
|
76
|
14
|
0
|
8
|
|||||||||||||||||
|
Total
securities portfolio market value
|
$3,233
|
$233
|
$424
|
$626
|
$757
|
$648
|
$232
|
$313
|
|||||||||||||||||
|
The
Redwood
Review
3rd
Quarter
2007
|
Appendix
Table
18 -
Securities
Portfolios Credit Rating and Collateral Type
|
111 |
|
|
Table
19: Sequoia ABS Issued ($ in
thousands)
|
|
|
Original
|
Estimated
|
|
Outstanding
|
||||||||||||
|
Sequoia
|
Issue
|
Issue
|
|
Stated
|
|
Callable
|
|
Balance
|
||||||||
|
ABS
Issued
|
Date
|
|
Amount
|
|
Maturity
|
|
Date
|
|
September
30, 2007
|
|||||||
|
Sequoia
1
|
07/29/97
|
$534,347
|
2028
|
Called
|
$0
|
|||||||||||
|
Sequoia
2
|
11/06/97
|
749,160
|
2029
|
Called
|
0
|
|||||||||||
|
Sequoia
3
|
06/26/98
|
635,288
|
2028
|
Called
|
0
|
|||||||||||
|
Sequoia
1A
|
05/04/99
|
157,266
|
2028
|
Called
|
0
|
|||||||||||
|
Sequoia
4
|
03/21/00
|
377,119
|
2024
|
2007
|
53,958
|
|||||||||||
|
Sequoia
5
|
10/29/01
|
510,047
|
2026
|
2007
|
79,497
|
|||||||||||
|
Sequoia
6
|
04/26/02
|
506,142
|
2027
|
2007
|
77,485
|
|||||||||||
|
Sequoia
7
|
05/29/02
|
572,000
|
2032
|
Called
|
0
|
|||||||||||
|
Sequoia
8
|
07/30/02
|
642,998
|
2032
|
Called
|
0
|
|||||||||||
|
Sequoia
9
|
08/28/02
|
558,266
|
2032
|
2007
|
67,835
|
|||||||||||
|
Sequoia
10
|
09/26/02
|
1,041,600
|
2027
|
2008
|
168,723
|
|||||||||||
|
Sequoia
11
|
10/30/02
|
704,936
|
2032
|
2007
|
84,980
|
|||||||||||
|
Sequoia
12
|
12/19/02
|
1,096,891
|
2033
|
Called
|
0
|
|||||||||||
|
Sequoia
2003-1
|
02/27/03
|
1,012,321
|
2033
|
2007
|
154,149
|
|||||||||||
|
Sequoia
2003-2
|
04/29/03
|
815,080
|
2022
|
2007
|
125,450
|
|||||||||||
|
Sequoia
2003-3
|
06/26/03
|
538,452
|
2023
|
2007
|
88,507
|
|||||||||||
|
MLCC
2003-C
|
06/26/03
|
984,349
|
2023
|
2008
|
153,579
|
|||||||||||
|
MLCC
2003-D
|
07/29/03
|
1,003,591
|
2028
|
2008
|
171,767
|
|||||||||||
|
Sequoia
2003-4
|
07/29/03
|
504,273
|
2033
|
2007
|
128,441
|
|||||||||||
|
Sequoia
2003-5
|
08/27/03
|
840,248
|
2033
|
2007
|
106,311
|
|||||||||||
|
Sequoia
2003-6
|
10/29/03
|
649,999
|
2033
|
Called
|
0
|
|||||||||||
|
Sequoia
2003-7
|
11/25/03
|
811,707
|
2034
|
Called
|
0
|
|||||||||||
|
Sequoia
2003-8
|
12/23/03
|
964,238
|
2034
|
2007
|
151,642
|
|||||||||||
|
MLCC
2003-E
|
08/28/03
|
983,852
|
2028
|
2008
|
169,384
|
|||||||||||
|
MLCC
2003-F
|
09/25/03
|
1,297,913
|
2028
|
2007
|
219,294
|
|||||||||||
|
MLCC
2003-H
|
12/22/03
|
739,196
|
2029
|
2008
|
115,214
|
|||||||||||
|
Sequoia
2004-1
|
01/28/04
|
616,562
|
2034
|
2007
|
94,976
|
|||||||||||
|
Sequoia
2004-2
|
02/25/04
|
690,548
|
2034
|
Called
|
0
|
|||||||||||
|
Sequoia
2004-3
|
03/30/04
|
917,673
|
2034
|
2007
|
112,349
|
|||||||||||
|
Sequoia
2004-4
|
04/29/04
|
808,933
|
2010
|
2007
|
108,007
|
|||||||||||
|
Sequoia
2004-5
|
05/27/04
|
831,540
|
2012
|
2008
|
115,107
|
|||||||||||
|
Sequoia
2004-6
|
06/29/04
|
910,662
|
2012
|
2008
|
139,043
|
|||||||||||
|
SEMHT
2004-01
|
06/29/04
|
317,044
|
2014
|
2008
|
66,835
|
|||||||||||
|
Sequoia
2004-7
|
07/29/04
|
1,032,685
|
2034
|
2008
|
153,407
|
|||||||||||
|
Sequoia
2004-8
|
08/27/04
|
807,699
|
2034
|
2008
|
147,300
|
|||||||||||
|
Sequoia
2004-9
|
09/29/04
|
772,831
|
2034
|
2008
|
165,697
|
|||||||||||
|
Sequoia
2004-10
|
10/28/04
|
673,356
|
2034
|
2008
|
140,702
|
|||||||||||
|
Sequoia
2004-11
|
11/23/04
|
705,746
|
2034
|
2008
|
189,373
|
|||||||||||
|
Sequoia
2004-12
|
12/22/04
|
821,955
|
2035
|
2008
|
175,337
|
|||||||||||
|
Sequoia
2005-1
|
01/27/05
|
409,071
|
2035
|
2008
|
106,644
|
|||||||||||
|
Sequoia
2005-2
|
02/24/05
|
338,481
|
2035
|
2008
|
73,905
|
|||||||||||
|
Sequoia
2005-3
|
04/28/05
|
359,182
|
2035
|
2008
|
92,226
|
|||||||||||
|
Madrona
2005-A
|
08/25/05
|
5,400
|
2008
|
2008
|
5,400
|
|||||||||||
|
Sequoia
2005-4
|
09/29/05
|
324,576
|
2035
|
2009
|
182,218
|
|||||||||||
|
Sequoia
2006-1
|
08/30/06
|
742,507
|
2046
|
2011
|
575,436
|
|||||||||||
|
Sequoia
2007-1
|
03/30/07
|
864,089
|
2047
|
2015
|
797,942
|
|||||||||||
|
Sequoia
2007-2
|
05/25/07
|
1,018,484
|
2038
|
2017
|
947,161
|
|||||||||||
|
Sequoia
2007-3
|
07/27/07
|
650,375
|
2036
|
2015
|
697,969
|
|||||||||||
|
Sequoia
2007-4
|
08/30/07
|
129,713
|
2036
|
2017
|
127,414
|
|||||||||||
|
Total
Sequoia ABS Issuance
|
$33,980,391
|
$7,330,664
|
||||||||||||||
|
The
Redwood
Review
3rd
Quarter
2007
|
Appendix
Table
19 -
Sequoia
ABS Issued
|
112 |
|
|
Table
20: Sequoia IO ABS Issued ($ in
thousands)
|
|
|
|
|
|
Original
|
|
|
|
Estimated
|
|
Outstanding
|
|
|||||
|
Sequoia
ABS
|
|
Issue
|
|
Issue
|
|
Stated
|
|
Callable
|
|
Balance
At
|
|
|||||
|
IO's
Issued
|
|
Date
|
|
Amount
|
|
Maturity
|
|
Date
|
|
September
30, 2007
|
||||||
|
MLCC
2003-C X-A-2
|
06/26/03
|
$12,662
|
2007
|
2007
|
$0
|
|||||||||||
|
MLCC
2003-D X-A-1
|
07/29/03
|
22,371
|
2007
|
2007
|
0
|
|||||||||||
|
MLCC
2003-E X-A-1
|
08/28/03
|
16,550
|
2007
|
2007
|
0
|
|||||||||||
|
MLCC
2003-F X-A-1
|
09/25/03
|
18,666
|
2007
|
2007
|
0
|
|||||||||||
|
Sequoia
2003-6 X-1
|
10/29/03
|
8,220
|
2007
|
Called
|
0
|
|||||||||||
|
SMFC
2003A AX1
|
10/31/03
|
70,568
|
2007
|
2007
|
0
|
|||||||||||
|
Sequoia
2003-7 X-1
|
11/25/03
|
10,345
|
2007
|
Called
|
0
|
|||||||||||
|
Sequoia
2003-8 X-1
|
12/23/03
|
12,256
|
2007
|
2007
|
0
|
|||||||||||
|
Sequoia
2004-1 X-1
|
01/28/04
|
7,801
|
2007
|
2007
|
0
|
|||||||||||
|
Sequoia
2004-2 X-1
|
02/25/04
|
8,776
|
2007
|
Called
|
0
|
|||||||||||
|
SMFC
2004A AX1
|
02/26/04
|
10,626
|
2007
|
2007
|
159
|
|||||||||||
|
MLCC
2003-H X-A-1
|
12/22/03
|
10,430
|
2007
|
2007
|
168
|
|||||||||||
|
Sequoia
2004-4 X-1
|
05/28/04
|
9,789
|
2010
|
2007
|
0
|
|||||||||||
|
Sequoia
2004-5 X-1
|
05/27/04
|
3,371
|
2012
|
2008
|
37
|
|||||||||||
|
Sequoia
2004-6 X-A
|
06/29/04
|
10,884
|
2012
|
2008
|
2,144
|
|||||||||||
|
Sequoia
2004-7 X-A
|
07/29/04
|
12,145
|
2034
|
2008
|
2,943
|
|||||||||||
|
Sequoia
2004-8 X-A
|
08/27/04
|
18,270
|
2034
|
2008
|
4,303
|
|||||||||||
|
Sequoia
2004-9 X-A
|
09/29/04
|
16,951
|
2034
|
2008
|
4,751
|
|||||||||||
|
Sequoia
2004-10 X-A
|
10/28/04
|
14,735
|
2034
|
2008
|
4,108
|
|||||||||||
|
Sequoia
2004-11 X-A-1
|
11/23/04
|
12,603
|
2034
|
2008
|
4,130
|
|||||||||||
|
Sequoia
2004-11 X-A-2
|
11/23/04
|
4,697
|
2034
|
2008
|
1,755
|
|||||||||||
|
Sequoia
2004-12 X-A-1
|
12/22/04
|
14,453
|
2035
|
2008
|
4,421
|
|||||||||||
|
Sequoia
2004-12 X-A-2
|
12/22/04
|
5,081
|
2035
|
2008
|
5,080
|
|||||||||||
|
Sequoia
2005-1 X-A
|
01/27/05
|
9,669
|
2035
|
2008
|
3,282
|
|||||||||||
|
Sequoia
2005-2 X-A
|
02/24/05
|
7,484
|
2035
|
2008
|
2,345
|
|||||||||||
|
Sequoia
2005-3 X-A
|
04/28/05
|
8,183
|
2035
|
2008
|
3,062
|
|||||||||||
|
Total
Sequoia IO ABS Issuance
|
$357,586
|
$42,688
|
||||||||||||||
|
The
Redwood
Review
3rd
Quarter
2007
|
Appendix
Table
20 -
Sequoia
IO ABS Issued
|
113 |
|
|
Table
21: Acacia CDO ABS Issued ($ in thousands)
|
|
|
|
Original
|
|
|
|
Optional
|
|
Principal
|
|
|||||||
|
|
|
Issue
|
|
Issue
|
|
Stated
|
|
Redemption
|
|
Outstanding
At
|
|
|||||
|
CDO
Issuance
|
|
Date
|
|
Amount
|
|
Maturity
|
|
Date
|
|
September
30, 2007
|
||||||
|
Acacia
CDO 1
|
12/10/02
|
$285,000
|
2023
|
Called
|
$0
|
|||||||||||
|
Acacia
CDO 2
|
05/13/03
|
283,875
|
2023
|
Called
|
0
|
|||||||||||
|
Acacia
CDO 3
|
11/04/03
|
284,250
|
2038
|
Called
|
0
|
|||||||||||
|
Acacia
CDO 4
|
04/08/04
|
293,400
|
2039
|
Called
|
0
|
|||||||||||
|
Acacia
CDO 5
|
07/14/04
|
282,125
|
2039
|
2007
|
242,821
|
|||||||||||
|
Acacia
CDO 6
|
11/09/04
|
282,000
|
2040
|
2007
|
270,416
|
|||||||||||
|
Acacia
CDO 7
|
03/10/05
|
282,000
|
2045
|
2008
|
281,085
|
|||||||||||
|
Acacia
CDO 8
|
07/14/05
|
252,000
|
2045
|
2008
|
251,138
|
|||||||||||
|
Acacia
CRE 1
|
12/14/05
|
261,750
|
2045
|
2010
|
261,543
|
|||||||||||
|
Acacia
CDO 9
|
03/09/06
|
277,800
|
2046
|
2009
|
277,787
|
|||||||||||
|
Acacia
CDO 10
|
08/02/06
|
436,500
|
2046
|
2009
|
427,500
|
|||||||||||
|
Acacia
CDO 11
|
02/15/07
|
476,660
|
2047
|
2010
|
476,660
|
|||||||||||
|
Acacia
CDO 12
|
05/18/07
|
458,000
|
2047
|
2010
|
458,000
|
|||||||||||
|
Acacia
CDO OA 1
|
06/14/07
|
486,000
|
2052
|
2010
|
494,800
|
|||||||||||
|
Total
Acacia CDO Issuance
|
$4,641,360
|
$3,441,750
|
||||||||||||||
|
(1)
The principal outstanding for Acacia CDO OA 1 includes $8.8
million of
additional principal outstanding related to deal issuance
costs.
|
||||||||||||||||
|
The
Redwood
Review
3rd
Quarter
2007
|
Appendix
Table
21 -
Acacia
CDO ABS Issued
|
114 |
|
Executive
Officers:
George
E. Bull, III
Chairman
of the Board and
Chief
Executive Officer
Douglas
B. Hansen
President
Martin
S. Hughes
Chief
Financial Officer
Brett
D. Nicholas
Vice
President
Andrew
I. Sirkis
Vice
President
Harold
F. Zagunis
Vice
President
Stock
Listing:
The
Company’s common stock is traded on the
New
York Stock Exchange under the symbol
RWT
Corporate
Office:
One
Belvedere Place, Suite 300
Mill
Valley, California 94941
Telephone:
415-389-7373
Investor
Relations:
Lauren
Morgensen
IR
Hotline: 866-269-4976
Telephone:
415-389-7373
Email:
[email protected]
|
Directors:
George
E. Bull, III
Chairman
of the Board and
Chief
Executive
Douglas
B. Hansen
President
Richard
D. Baum
Executive
Director,
California
Commission for
Economic
Development
Thomas
C. Brown
CEO,
Urban Bay Properties, Inc.
Mariann
Byerwalter
Chairman,
JDN Corporate
Advisory,
LLC
Greg
H. Kubicek
President,
The Holt Group, Inc.
Georganne
C. Proctor
Executive
Vice President and
Chief
Financial Officer, TIAA-CREF
Charles
J. Toeniskoetter
Chairman,
Toeniskoetter & Breeding, Inc.
Development David
L. Tyler
Private
Investor
Transfer
Agent:
Computershare
2
North LaSalle Street
Chicago,
IL 60602
Telephone:
888-472-1955
|