
 |
|
|
|
|
TABLE
OF CONTENTS
|
|
Introduction
|
2
|
|||
|
Shareholder
Letter
|
3
|
|||
|
Quarterly
Overview
|
4
|
|||
|
Financial
Insights
|
8
|
|||
|
Financial
& Investments Modules
|
||||
|
Financial
|
13
|
|||
|
-
GAAP Income
& Core Earnings
|
13
|
|||
|
-
Taxable
Income
|
17
|
|||
|
-
Capital
& Liquidity
|
19
|
|||
|
-
Dividends
|
21
|
|||
|
Mark-to-Market
Adjustments
|
23
|
|||
|
Residential
Real Estate Securities
|
28
|
|||
|
Commercial
Real Estate Securities
|
39
|
|||
|
CDO
Securities
|
42
|
|||
|
Investments
in Sequoia
|
43
|
|||
|
Investments
in Acacia
|
47
|
|||
|
Appendix
|
||||
|
Accounting
Discussion
|
54
|
|||
|
Glossary
|
57
|
|||
|
Financial
Tables
|
65
|
|
THE
REDWOOD
REVIEW 1ST QUARTER 2008
|
1
|
|
|
|
|
|
INTRODUCTION
|
|
Quarter:
Year
|
GAAP
Income per Share |
Core
Earnings per Share |
Total
Taxable Earnings per
Share |
Adjusted
Return on Equity |
GAAP
Book
Value per Share |
Core
Book
Value per Share |
Total
Dividends per Share |
|
Q106
|
$1.09
|
$1.16
|
$1.44
|
13%
|
$38.11
|
$34.90
|
$0.70
|
|
Q206
|
$1.20
|
$0.97
|
$1.91
|
14%
|
$39.13
|
$35.58
|
$0.70
|
|
Q306
|
$1.22
|
$1.20
|
$1.96
|
14%
|
$40.02
|
$36.38
|
$0.70
|
|
Q406
|
$1.32
|
$1.12
|
$1.45
|
15%
|
$37.51
|
$34.02
|
$3.70
|
|
Q107
|
$0.66
|
$1.08
|
$1.48
|
8%
|
$34.06
|
$34.29
|
$0.75
|
|
Q207
|
$0.41
|
$1.35
|
$1.66
|
5%
|
$31.50
|
$34.40
|
$0.75
|
|
Q307
|
($2.18)
|
$1.43
|
$1.74
|
(26%)
|
$5.32
|
$31.58
|
$0.75
|
|
Q407*
|
($36.49)
|
$1.21
|
$0.91
|
(610%)
|
$23.18
|
$26.24
|
$2.75
|
|
Q108
|
($5.28)
|
$0.68**
|
$0.79
|
(83%)
|
$17.89
|
$20.74
|
$0.75
|
|
*
The book
values per share are after giving retroactive effect to the adoption
of
FAS 159 on January 1, 2008. Without giving retroactive effect to
FAS 159,
the GAAP book value per share and core book value per share were
a
negative $22.18 and a negative $4.46, respectively.
|
|
**
Core
earnings for this quarter are not directly comparable to core earnings
for
prior periods due to the adoption of FAS
159.
|
|
2
|
THE
REDWOOD
REVIEW 1ST QUARTER 2008
|
|
|
|
|
|
|
|
SHAREHOLDER
LETTER
|
 |
 |
|||
|
George
E.
Bull, II
|
Douglas
B.
Hansen
|
|||
|
Chairman
and CEO
|
President
|
|
THE
REDWOOD
REVIEW 1ST QUARTER 2008
|
3
|
|
|
|
|
|
QUARTERLY
OVERVIEW
|
|
4
|
THE
REDWOOD
REVIEW 1ST QUARTER 2008
|
|
|
|
|
|
|
|
QUARTERLY
OVERVIEW
|
|
THE
REDWOOD
REVIEW 1ST QUARTER 2008
|
5
|
|
|
|
|
|
QUARTERLY
OVERVIEW
|
|
6
|
THE
REDWOOD
REVIEW 1ST QUARTER 2008
|
|
|
|
|
|
|
|
QUARTERLY
OVERVIEW
|
 |
 |
|||
|
Martin
S.
Hughes
|
Brett
D.
Nicholas
|
|||
|
Chief
Financial Officer
Co-Chief
Operating Officer
|
Chief
Investment Officer
Co-Chief
Operating Officer
|
|
THE
REDWOOD
REVIEW 1ST QUARTER 2008
|
7
|
|
|
|
|
|
FINANCIAL
INSIGHTS
|
| ► |
The
following
supplemental non-GAAP balance sheet presents our assets and
liabilities as
calculated under GAAP and as adjusted to reflect our estimate
of economic
value. We show our investments in the Sequoia and Acacia securitization
entities in separate line items, similar to the equity method
of
accounting, reflecting the reality that the underlying assets
and
liabilities owned by these entities are legally not ours. We
own only the
securities that we have acquired from these entities. This
table, except
for our estimates of economic value, is derived from
the consolidating balance sheet presented on page 11.
|
|
Components
of Book Value
|
|||||||||
|
March
31, 2008
|
|||||||||
|
($
in millions, except per share data)
|
|||||||||
|
|
Management’s
Estimated
Economic
|
|||||||||
|
As
Reported
|
Adj
|
Value
|
||||||||
|
Real
estate
securities (excluding Sequoia and Acacia)
|
||||||||||
|
Residential
|
$
|
$126
|
$
|
126
|
||||||
|
Commercial
|
100
|
100
|
||||||||
|
CDO
|
42
|
42
|
||||||||
|
Subtotal
real
estate securities
|
268
|
268
|
||||||||
|
Cash
and cash
equivalents
|
257
|
257
|
||||||||
|
Investments
in
Sequoia
|
146
|
(54
|
)(a)
|
92
|
||||||
|
Investments
in
Acacia
|
68
|
(19
|
)(b)
|
49
|
||||||
|
Other
assets/liabilities, net (d)
|
(4
|
)
|
|
(4
|
)
|
|||||
|
Subordinated
notes
|
(150
|
)
|
78
|
(c) |
(72
|
)
|
||||
|
Stockholders'
Equity
|
$
|
585
|
$
|
590
|
||||||
|
Book
Value Per Share
|
$
|
17.89
|
$
|
18.04
|
||||||
| (a) |
Our
actual Sequoia investments consist of CES, IGS, and IOs acquired
by
Redwood from the Sequoia entities. We calculated the $92 million
estimate
of economic value for these securities using the same valuation
process
that we followed to fair value all other real estate securities.
In
contrast, the $146 million of GAAP carrying value of these investments
represents the difference between residential real estate loans
owned by
the Sequoia entities and the asset-backed securities (ABS) issued
by those
entities to third party investors. We account for these loans
and ABS
issued at cost, not at fair value. This is the primary reason
for the $54
million disparity between the GAAP carrying value and our estimate
of
economic value.
|
| (b) |
Our
actual Acacia investments consist of equity interests, and to
a lesser
extent ABS issued, that we acquired from the Acacia entities.
The $49
million estimate of economic value of our investment interests
in the
Acacia entities represents the net present value of projected
cash flows
from our Acacia investments and management fees discounted at
45%, except
for the CDO ABS that we recently repurchased at substantial discounts
from
face value, which are valued at cost. The reason for the difference
between economic and GAAP carrying values is complex and relates
to a
significant difference in valuation methodology. This difference
is
discussed in detail in the Investments in Acacia section in this
Review.
|
| (c) |
We
have
issued $150 million of 30-year subordinated notes at an interest
rate of
LIBOR plus 225 basis points. Under GAAP, these notes are carried
at cost.
Economic value is difficult to estimate with precision as the
market of
the notes is currently inactive. We estimated the $72 million
economic
value using the same valuation process used to fair value our
other
financial assets and liabilities. Estimated economic value is
$78 million
lower than our GAAP carrying value because given the significant
overall
contraction in credit availability and re-pricing of credit risk,
if we
had issued these subordinated notes at March 31, 2008, investors
would
have required a substantially higher interest rate.
|
| (d) |
Other
assets/liabilities, net are comprised of real estate loans of
$5 million,
restricted cash of $11 million, and other assets of $24 million,
less
Redwood debt of $2 million, dividend payable of $25 million,
and other
liabilities of $17
million.
|
|
8
|
THE
REDWOOD
REVIEW 1ST QUARTER 2008
|
|
|
|
|
|
|
|
FINANCIAL
INSIGHTS
|
| ► |
Total
real
estate securities (excluding our investments in Sequoia and Acacia)
were
$268 million at March 31, 2008, of which $232 million were held
at Redwood
and $36 million were held in the Opportunity Fund.
|
| ► |
The
table
below provides product type and vintage information regarding
the $232
million of securities at Redwood at March 31, 2008.
|
|
Real
Estate Securities at Redwood
|
||||||||||||||||||
|
Excludes
Investments in Sequoia and Acacia and Securities at Opportunity
Fund
|
||||||||||||||||||
|
March
31, 2008
|
||||||||||||||||||
|
($
in millions)
|
||||||||||||||||||
|
|
2004
&
|
|
|
|
|
|
|||||||||||||
|
|
Earlier
|
2005
|
2006
|
2007
|
2008
|
Total
|
|||||||||||||
|
Residential
|
|||||||||||||||||||
|
Prime
|
|||||||||||||||||||
|
IGS
|
$
|
4
|
$
|
1
|
$
|
9
|
$
|
-
|
$
|
6
|
$
|
20
|
|||||||
|
CES
|
48
|
15
|
5
|
8
|
2
|
78
|
|||||||||||||
|
Prime
Total
|
52
|
16
|
14
|
8
|
8
|
98
|
|||||||||||||
|
Alt-a
|
|||||||||||||||||||
|
IGS
|
-
|
-
|
1
|
4
|
-
|
5
|
|||||||||||||
|
CES
|
1
|
4
|
1
|
3
|
-
|
9
|
|||||||||||||
|
OREI
|
-
|
-
|
2
|
1
|
-
|
3
|
|||||||||||||
|
Alt-a
Total
|
1
|
4
|
4
|
8
|
-
|
17
|
|||||||||||||
|
Subprime
|
|||||||||||||||||||
|
IGS
|
1
|
-
|
-
|
-
|
-
|
1
|
|||||||||||||
|
CES
|
-
|
-
|
-
|
1
|
-
|
1
|
|||||||||||||
|
Subprime
Total
|
1
|
-
|
-
|
1
|
-
|
2
|
|||||||||||||
|
Residential
Total
|
$
|
54
|
$
|
20
|
$
|
18
|
$
|
17
|
$
|
8
|
$
|
117
|
|||||||
|
Commercial
CES
|
$
|
16
|
$
|
21
|
$
|
48
|
$
|
15
|
$
|
-
|
$
|
100
|
|||||||
|
CDO
IGS
|
$
|
7
|
$
|
7
|
$
|
-
|
$
|
1
|
$
|
-
|
$
|
15
|
|||||||
|
Total
at Redwood
|
$
|
77
|
$
|
48
|
$
|
66
|
$
|
33
|
$
|
8
|
$
|
232
|
|||||||
| ► |
In
the first
quarter, we acquired $38 million of securities for Redwood's
portfolio.
These included $10 million of prime residential credit-enhancement
securities (CES) and $28 million of prime residential investment
grade
securities (IGS). We acquired these securities at attractive
prices equal
to an average of 37% of face value.
|
| ► |
For
GAAP
balance sheet purposes, we are required to value securities using
bid-side
marks (an exit price). Bid/offer spreads are generally wide for
these
illiquid securities, and in today’s turbulent market, spreads are
particularly wide. We reduced the carrying (market) value of
the $38
million of our new investments by $11 million below our investment
cost at
March 31, 2008 primarily as a result of the bid/offer spread
difference.
|
| ► |
Over
80% of
our investments in real estate securities at March 31, 2008 were
residential and commercial CES. These securities bear most of
the credit
risk with respect to the underlying loans that were securitized.
We
acquire CES at a significant discount to principal value as credit
losses
could reduce or totally eliminate the principal value of these
bonds. Our
return on these investments is based on how much principal and
interest we
receive and how quickly we receive it. In an ideal environment
we would
experience fast prepayments and low credit losses allowing us
to recover a
substantial part of the discount as income. Conversely, in the
least
beneficial environment, we would experience slow prepayments
and high
credit losses.
|
|
THE
REDWOOD
REVIEW 1ST QUARTER 2008
|
9
|
|
|
|
|
|
FINANCIAL
INSIGHTS
|
| ► |
We
provide
additional discussion and analysis regarding the adequacy of
our credit
reserves and the potential earnings upside from an increase
in prepayments
in the residential and commercial real estate securities modules
that
follow.
|
| ► |
The
following
table presents the components of GAAP carrying value (which
equals fair
value determined in accordance with GAAP) for residential
and commercial
CES at Redwood.
|
|
Excludes
Investments in Sequoia and Acacia and Securities at Opportunity
Fund
|
||||||
|
March
31, 2008
|
||||||
|
($
in millions)
|
||||||
|
|
Residential
|
|
||||||||
|
|
Prime
|
Alt-a
|
Commercial
|
|||||||
|
Current
face
|
$
|
538
|
$
|
217
|
523
|
|||||
|
Unamortized
discount, net
|
(61
|
)
|
(1
|
) |
(37
|
)
|
||||
|
Discount
designated as credit reserve
|
(358
|
)
|
(205
|
)
|
(378
|
)
|
||||
|
Amortized
cost
|
119
|
11
|
108
|
|||||||
|
Unrealized
gains
|
3
|
0
|
2
|
|||||||
|
Unrealized
losses
|
(44
|
)
|
(2
|
)
|
(10
|
)
|
||||
|
Total
Carrying value of CES at Redwood
|
$
|
78
|
$
|
9
|
$
|
100
|
||||
|
Carrying
value as a percentage of face
|
14
|
%
|
4
|
%
|
19
|
%
|
||||
| ► | We also own $1 million subprime CES with a face value of $36 million. |
| ► |
The
table
below provides product type and vintage information regarding
the $36
million of securities held by the Opportunity Fund at March
31,
2008.
|
|
Securities
at Opportunity Fund
|
|||||||||
|
March
31, 2008
|
|||||||||
|
($
in millions)
|
|||||||||
|
|
2004
&
|
|
|
|||||||
|
|
Earlier
|
2005
|
Total
|
|||||||
|
Residential
Subprime IGS
|
$
|
9
|
$
|
-
|
$
|
9
|
||||
|
CDO
IGS
|
$
|
17
|
$
|
10
|
$
|
27
|
||||
|
Total
at Opportunity Fund
|
$
|
26
|
$
|
10
|
$
|
36
|
||||
| ► |
In
the first
quarter, we acquired $20 million of IGS for the Opportunity
Fund, which
included $12 million CDO IGS and $8 million in subprime IGS.
We acquired
these securities at an average price of 43% of face
value.
|
|
10
|
THE
REDWOOD
REVIEW 1ST QUARTER 2008
|
|
|
|
|
|
|
|
FINANCIAL
INSIGHTS
|
| ► |
GAAP
requires
us to produce a balance sheet that consolidates the assets
and liabilities
of the Sequoia and Acacia securitization entities (which
had a combined
$8.1 billion of assets and $7.9 billion of liabilities) even
though the
assets are owned by the securitization entities and the liabilities
are
obligations of the securitization entities payable only from
the cash
flows generated by the assets owned by the entities.
|
| ► |
The
table
below shows the consolidating components of our consolidated
balance sheet
at March 31, 2008. The purpose of this presentation is
to show the effect
each of the components had on our consolidated shareholders'
equity at
March 31, 2008. The Acacia and Sequoia components represent
investments and are not separate business
segments.
|
|
Consolidating
Balance Sheet
|
|
March
31, 2008
|
|
($
in millions)
|
|
Redwood
|
||||||||||||||||
|
and
|
Redwood
|
|||||||||||||||
|
Opportunity
Fund
|
Sequoia
|
Acacia
|
Intercompany
|
Consolidated
|
||||||||||||
|
Real
estate
loans
|
$
|
5
|
$
|
6,751
|
$
|
19
|
$
|
-
|
$
|
6,775
|
||||||
|
Real
estate
securities
|
268
|
-
|
1,014
|
(88
|
)
|
1,194
|
||||||||||
|
Non-real
estate investments
|
-
|
-
|
79
|
-
|
79
|
|||||||||||
|
Cash
and cash
equivalents
|
257
|
-
|
-
|
-
|
257
|
|||||||||||
|
Total
earning
assets
|
530
|
6,751
|
1,112
|
(88
|
)
|
8,305
|
||||||||||
|
Investment
in
Sequoia
|
146
|
-
|
-
|
(146
|
)
|
-
|
||||||||||
|
Investment
in
Acacia
|
68
|
-
|
-
|
(68
|
)
|
-
|
||||||||||
|
Other
assets
|
35
|
49
|
157
|
-
|
241
|
|||||||||||
|
Total
Assets
|
$
|
779
|
$
|
6,800
|
$
|
1,269
|
$
|
(302
|
)
|
$
|
8,546
|
|||||
|
Redwood
debt
|
$
|
2
|
$
|
-
|
$
|
-
|
$
|
-
|
$
|
2
|
||||||
|
Asset-backed
securities issued - Sequoia
|
-
|
6,632
|
-
|
(88
|
)
|
6,544
|
||||||||||
|
Asset-backed
securities issued - Acacia
|
-
|
-
|
1,046
|
-
|
1,046
|
|||||||||||
|
Other
liabilities
|
42
|
22
|
155
|
-
|
219
|
|||||||||||
|
Subordinated
notes
|
150
|
-
|
-
|
-
|
150
|
|||||||||||
|
Total
Liabilities
|
194
|
6,654
|
1,201
|
(88
|
)
|
7,961
|
||||||||||
|
Total
Stockholders’ Equity
|
585
|
146
|
68
|
(214
|
)
|
585
|
||||||||||
|
Total
Liabilities and Stockholders’ Equity
|
$
|
779
|
$
|
6,800
|
$
|
1,269
|
$
|
(302
|
)
|
$
|
8,546
|
|||||
|
THE
REDWOOD
REVIEW 1ST QUARTER 2008
|
11
|
|
|
|
|
|
FINANCIAL
INSIGHTS
|
| ► |
As
a
supplement to our Consolidated Statement of Cash Flows included
in our
Quarterly Report on Form 10-Q, we have included the table below
that
details the sources and uses of our cash for the first quarter.
This table
excludes the gross cash flows generated by our securitization
entities,
but does include the cash flow generated by our investments in
those
entities.
|
|
Redwood
|
||||
|
Sources
and Uses of Cash
|
||||
|
First
Quarter 2008 Activity
|
|
Sources:
|
||||
|
Cash
from
investments
|
$
|
70
|
||
|
Equity
raised
|
10
|
|||
|
Acacia
management fees
|
2
|
|||
|
3rd
party
funds (Opp Fund)
|
8
|
|||
|
Total
Sources
|
90
|
|||
|
Uses:
|
||||
|
Acquisitions
|
(65
|
)
|
||
|
Dividends
paid
|
(25
|
)
|
||
|
Operating
expenses paid
|
(15
|
)
|
||
|
Subordinated
notes interest expense
|
(3
|
)
|
||
|
Redwood debt
paydown
|
(6
|
)
|
||
|
Changes
in
working capital
|
(3
|
)
|
||
|
Restricted
cash held by Opp. Fund
|
(6
|
)
|
||
|
Total
Uses
|
(123
|
)
|
||
|
Net
Uses of Cash
|
$
|
(33
|
)
|
|
|
Beginning
Cash Balance at 12/31/07
|
$
|
290
|
||
|
Ending
Cash Balance at 03/31/08
|
$
|
257
|
| ► |
The
cash
generated by our investments is one of the financial metrics
on which we
focus. In the first quarter our investments generated cash
from principal
and interest payments of $70 million. The net investment
cash flow after
deducting subordinated note interest expense of $3 million
and cash
operating expenses of $15 million was $52 million.
|
| ► |
Our
investments at Redwood generated $40 million of cash,
and our direct
investments in Sequoia and Acacia generated $23 million
and $7 million of
cash, respectively.
|
| ► |
Other
sources
of cash included $10 million of equity sales
under our direct stock
purchase and dividend reinvestment plan, $2
million of management fees,
and $8 million from the Opportunity Fund’s third-party investors.
|
| ► |
The
primary
uses of cash this quarter were $65 million
for acquisitions and $25
million for the payment of
dividends.
|
|
12
|
THE
REDWOOD
REVIEW 1ST QUARTER 2008
|
|
|
|
|
|
|
|
GAAP
INCOME & CORE
EARNINGS
|
| ► |
The
GAAP loss
of $172 million for the first quarter, or $5.28 per share, was
primarily
due to $194 million ($5.96 per share) of negative market valuation
adjustments. Market valuation adjustments are discussed in detail
in the
Mark-to-Market Adjustments module later in this
Review.
|
| ► |
The
table
below provides a summary of our GAAP (loss) income for the first
quarter
of 2008, the fourth quarter of 2007, and the first quarter of
2007.
|
|
|
For
the Quarter Ended
|
|||||||||
|
GAAP
Income ($ millions)
|
Mar-08
|
Dec-07
|
Mar-07
|
|||||||
|
Interest
income
|
$
|
168
|
$
|
202
|
$
|
215
|
||||
|
Interest
expense
|
(128
|
)
|
(153
|
)
|
(168
|
)
|
||||
|
Net
interest
income before market valuation adjustments
|
40
|
49
|
47
|
|||||||
|
Market
valuation adjustments, net
|
(194
|
)
|
(1,119
|
)
|
(10
|
)
|
||||
|
Net
Interest
(loss) Income
|
(154
|
)
|
(1,070
|
)
|
37
|
|||||
|
Operating
expenses
|
(16
|
)
|
(16
|
)
|
(18
|
)
|
||||
|
Realized
gains
(losses) on sales
|
-
|
7
|
-
|
|||||||
|
Realized
gains
on calls
|
-
|
-
|
1
|
|||||||
|
Credit
(provision) for taxes
|
(2
|
)
|
2
|
(2
|
)
|
|||||
|
GAAP
(loss) income
|
$
|
(172
|
)
|
$
|
(1,077
|
)
|
$
|
18
|
||
|
GAAP
(loss)
income per share
|
$
|
(5.28
|
)
|
$
|
(36.49
|
)
|
$
|
0.66
|
||
| ► |
Net
interest
income before market valuation adjustments for the first quarter
decreased
by $9 million from the previous quarter. The decline resulted
from slower
prepayments on residential loans underlying our CES, increased
credit
provisions on loans owned by Sequoia, and the impact of our adoption
of a
new accounting standard, FAS 159, on January 1,
2008.
|
|
THE
REDWOOD
REVIEW 1ST QUARTER 2008
|
13
|
|
|
|
|
|
GAAP
INCOME & CORE EARNINGS
|
| ► |
Total
market
valuation adjustments were $194 million in the first quarter,
down
significantly from $1.1 billion in the fourth quarter. The
primary reason
for the reduction in the level of negative market valuation
adjustments
was the fair value option election under FAS 159 which now
permits us to
MTM both the assets and liabilities of
Acacia.
|
| ► |
Operating
expenses remained at the same level as in the prior quarter.
|
| ► |
We
accrue for
income taxes throughout the year based on our estimates of taxable
income
and our planned distribution and retention of this
income.
|
| ► |
The
following
tables detail the components of our consolidated income statements
for the
first quarter of 2008 and the fourth quarter of
2007.
|
|
Consolidating
Income Statement
|
||||||||||||||||
|
Three
Months Ended March 31, 2008
|
||||||||||||||||
|
($
in millions)
|
||||||||||||||||
|
|
|
|
Redwood
|
|||||||||||||||
|
|
Redwood
|
Sequoia
|
Acacia
|
Elimination
|
Consolidated
|
|||||||||||
|
Interest
income
|
$
|
24
|
$
|
94
|
$
|
48
|
$
|
(2
|
)
|
$
|
164
|
|||||
|
Net
discount
(premium) amortization
|
12
|
(7
|
)
|
-
|
-
|
5
|
||||||||||
|
Total
interest
income
|
36
|
87
|
48
|
(2
|
)
|
169
|
||||||||||
|
Management
fees
|
-
|
-
|
1
|
-
|
1
|
|||||||||||
|
Interest
expense
|
(3
|
)
|
(83
|
)
|
(45
|
)
|
2
|
(129
|
)
|
|||||||
|
Net
interest
income before market valuation adjustments
|
$
|
33
|
$
|
4
|
$
|
4
|
$
|
-
|
$
|
41
|
||||||
|
Market
valuation adjustments, net
|
(167
|
)
|
-
|
(27
|
)
|
-
|
(194
|
)
|
||||||||
|
Net
interest
(loss) income
|
(134
|
)
|
4
|
(23
|
)
|
-
|
(153
|
)
|
||||||||
|
Operating
expenses
|
(17
|
)
|
-
|
-
|
-
|
(17
|
)
|
|||||||||
|
Realized
gains
on sales and calls, net
|
-
|
-
|
-
|
-
|
-
|
|||||||||||
|
Income
from
Sequoia
|
4
|
-
|
-
|
(4
|
)
|
-
|
||||||||||
|
Loss
from
Acacia
|
(23
|
)
|
-
|
-
|
23
|
-
|
||||||||||
|
Provision
for
income taxes
|
(2
|
)
|
-
|
-
|
-
|
(2
|
)
|
|||||||||
|
Net
(Loss) Income
|
$
|
(172
|
)
|
$
|
4
|
$
|
(23
|
)
|
$
|
19
|
$
|
(172
|
)
|
|||
|
Consolidating
Income Statement
|
||||||||||||||||
|
Three
Months Ended December 31, 2007
|
||||||||||||||||
|
($
in millions)
|
||||||||||||||||
|
|
|
|
Redwood
|
|||||||||||||||
|
|
Redwood
|
Sequoia
|
Acacia
|
Elimination
|
Consolidated
|
|||||||||||
|
Interest
income
|
$
|
26
|
$
|
110
|
$
|
55
|
$
|
(2
|
)
|
$
|
189
|
|||||
|
Net
discount
(premium) amortization
|
11
|
(7
|
)
|
7
|
-
|
11
|
||||||||||
|
Total
interest
income
|
37
|
103
|
62
|
(2
|
)
|
200
|
||||||||||
|
Management
fees
|
-
|
-
|
2
|
-
|
2
|
|||||||||||
|
Interest
expense
|
(3
|
)
|
(96
|
)
|
(56
|
)
|
2
|
(153
|
)
|
|||||||
|
Net
interest
income before market valuation adjustments
|
34
|
7
|
8
|
-
|
49
|
|||||||||||
|
Market
valuation adjustments, net
|
(130
|
)
|
-
|
(989
|
)
|
-
|
(1,119
|
)
|
||||||||
|
Net
interest
(loss) income
|
(96
|
)
|
7
|
(981
|
)
|
-
|
(1,070
|
)
|
||||||||
|
Operating
expenses
|
(16
|
)
|
-
|
-
|
-
|
(16
|
)
|
|||||||||
|
Realized
gains
on sales and calls, net
|
9
|
-
|
(2
|
)
|
-
|
7
|
||||||||||
|
Income
from
Sequoia
|
7
|
-
|
-
|
(7
|
)
|
-
|
||||||||||
|
Loss
from
Acacia
|
(983
|
)
|
-
|
-
|
983
|
-
|
||||||||||
|
Provision
for
income taxes
|
2
|
-
|
-
|
-
|
2
|
|||||||||||
|
Net
(Loss) Income
|
$
|
(1,077
|
)
|
$
|
7
|
$
|
(983
|
)
|
$
|
976
|
$
|
(1,077
|
)
|
|||
|
14
|
THE
REDWOOD
REVIEW 1ST QUARTER 2008
|
|
|
|
|
|
|
|
GAAP
INCOME & CORE
EARNINGS
|
| ► |
Market
valuation adjustments were greater in the first quarter on
securities we
hold as available-for-sale (AFS) than the prior quarter as
credit
performance continued to deteriorate and we no longer believe
some of the
valuations will return to cost on many of these illiquid
securities within
a reasonable period. We expect the amount of future impairments
at Redwood
to decline since we have permanently impaired the majority
of our earning
assets. Our CES have been written down to 15% of face value
at March 31,
2008. More detailed information about our accounting impairments
is found
in the Mark-to-Mark Adjustments section of this Review.
|
| ► |
Market
valuation adjustments at Acacia were negative $27 million
in the first
quarter reflecting the net changes in the fair values of
the assets and
liabilities within these securitization entities. Under FAS
159
accounting, these changes flow through the income statement.
In the fourth
quarter of 2007, prior to the adoption of FAS 159, the market
valuation
adjustments of negative $1.0 billion consisted only of impairments
on
certain of Acacia's assets and did not reflect any offsetting
change in
value of the associated Acacia
liabilities.
|
| ► |
Net
interest
income from Sequoia securitization entities was $3 million
lower in the
first quarter than the prior quarter as a result of a $4
million increase
in provisions for credit losses partially offset by lower
premium
amortization from slower prepayment
speeds.
|
| ► |
For
Acacia,
net interest income before market valuation adjustments in
the first
quarter declined by $4 million from the previous quarter,
primarily as the
result of the adoption of FAS 159. We now only include the
cash coupon on
the assets less the cash expense on the ABS issued in net
interest income.
Previously, net interest income included discount amortization,
which in
the fourth quarter of 2007, totaled $7 million. Under FAS
159, this amount
is effectively included in the market valuation adjustments
of these
assets.
|
|
THE
REDWOOD
REVIEW 1ST QUARTER 2008
|
15
|
|
|
|
|
|
GAAP
INCOME & CORE EARNINGS
|
| ► |
The
table
below provides a summary of our core earnings for the first
quarter of
2008, the fourth quarter of 2007, and the first quarter of
2007.
|
|
|
For
the Quarter Ended
|
|||||||||
|
Core
Earnings
|
Mar-08
|
Dec-07
|
Mar-07
|
|||||||
|
Interest
income
|
$
|
168
|
$
|
202
|
$
|
215
|
||||
|
Interest
expense
|
(128
|
)
|
(153
|
)
|
(168
|
)
|
||||
|
Net
interest
income
|
40
|
49
|
47
|
|||||||
|
Market
valuation adjustments, net
|
-
|
-
|
-
|
|||||||
|
Net
interest
(loss) income
|
40
|
49
|
47
|
|||||||
|
Operating
expenses
|
(16
|
)
|
(15
|
)
|
(15
|
)
|
||||
|
Realized
gains
(losses) on sales
|
-
|
-
|
-
|
|||||||
|
Realized
gains
on calls
|
-
|
-
|
-
|
|||||||
|
Credit
(provision) for taxes
|
(2
|
)
|
2
|
(2
|
)
|
|||||
|
Core
earnings
|
$
|
22
|
$
|
36
|
$
|
30
|
||||
|
Core
earnings
per share
|
$
|
0.68
|
$
|
1.21
|
$
|
1.08
|
||||
| ► |
Our
first
quarter core earnings were $0.68 per share. The reasons for
the decrease
in the level of core earnings from prior periods include
the impact of the
adoption of FAS 159, higher loan loss provisions, and slower
prepayments
on residential loans underlying our CES.
|
| ► |
Core
earnings
for this quarter of 2008 are not directly comparable to
core earnings for
prior quarters due to the adoption of FAS 159 for Acacia
entities. Prior
to the first quarter, purchase discount amortization on
Acacia assets
($0.21 per share in the fourth quarter of 2007) was included
in core
income. This component of income is now excluded from core
income. We no
longer calculate purchase discount amortization for securities
in the
Acacia entities since it has become, in effect, one of
the components of
the FAS 159 mark-to-market
adjustments.
|
|
16
|
THE
REDWOOD
REVIEW 1ST QUARTER 2008
|
|
|
|
|
|
|
|
TAXABLE
INCOME
|
| ► |
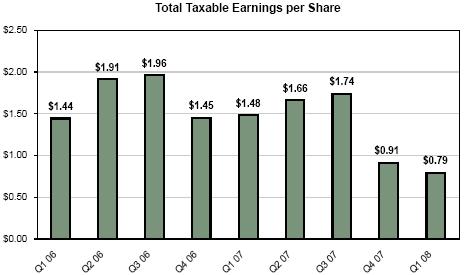
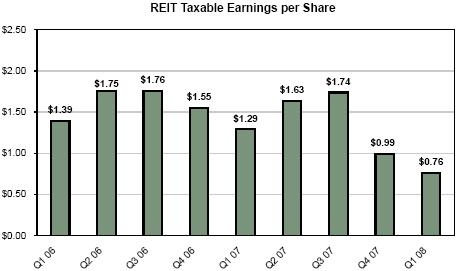
Total
taxable
income for the first quarter of 2008 was $26 million,
or $0.79 per share.
REIT taxable income was $25 million, or $0.76 per share,
in the first
quarter of 2008.
|
| ► |
Our
taxable
income decreased from the prior quarter by $3 million.
Our first quarter
taxable earnings included $14 million of charges related
to credit losses,
an increase of $9 million over the previous quarter.
In addition, discount
amortization for tax purposes decreased by $8 million
from the fourth
quarter to the first quarter primarily as the result
of slower prepayments
speeds. Offsetting these decreases in income was the
fact that the fourth
quarter included $14 million of write downs of assets for tax
purposes.
|
| ► |
Our
REIT
taxable income for 2008 will depend on, among other
things, our ability to
deploy our excess capital effectively and on the
level of realized credit
losses. We anticipate that credit losses, as measured
for tax purposes,
will increase substantially in 2008 relative to our
recent experience. If
the realization of credit losses becomes concentrated
in time, taxable
income alone in any one quarter or series of quarters
may be less than our
regular dividend rate.
|
| ► |
Our
taxable
income continues to be higher than our GAAP income
as we are not permitted
to establish credit reserves for tax purposes and
we do not generally
recognize changes in market values of assets for
tax purposes until the
asset is sold. As a result of these differences
at March 31, 2008, the tax
basis of our residential, commercial, and CDO CES
at Redwood was $377
million higher than our GAAP basis. Future credit
losses will have a more
significant impact on our taxable income than on
our GAAP income.
|
| ► |
The
tax basis
on Sequoia IOs we own is $55 million. Most of
the underlying pools of
loans have paid down or will pay down within
the next year to levels where
they are callable. When these are called, losses
on these IOs will be
incurred and our taxable income and dividend
distribution requirements
will decrease. The actual losses will depend
on the tax basis at the time
of any calls as the monthly cash flows received
on these IOs in the
interim will reduce their cost basis. At this
time, we do not anticipate
calling Sequoia deals in 2008.
|
|
THE
REDWOOD
REVIEW 1ST QUARTER 2008
|
17
|
|
|
|
|
|
TAXABLE
INCOME
|
| ► |
The
charts
below provide a summary of our total taxable income per
share and REIT
taxable income per share for each for the nine most recently
completed
fiscal quarters.
|
|
18
|
THE
REDWOOD
REVIEW 1ST QUARTER 2008
|
|
|
|
|
|
|
|
CAPITAL
& LIQUIDITY
|
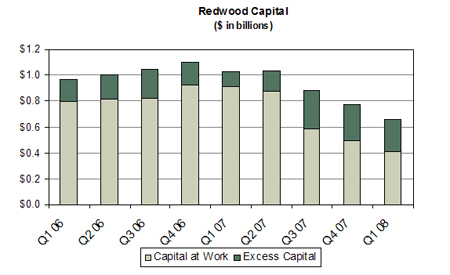
| ► |
At
March 31,
2008, we had $247 million of excess capital, a decrease
from $282 million
at December 31, 2007, and an increase from the $114 million
we had a year
ago. The decrease in excess capital over the past quarter
reflects our
investment activity in the first quarter.
|
| ► |
Our
net
liquid assets at March 31, 2008 totaled $263 million
and included $257 of
unrestricted cash, $4 million of unsecuritized
residential real estate
loans at fair value, and $4 million of AAA-rated
securities at fair value,
less $2 million of Redwood debt.
|
|
THE
REDWOOD
REVIEW 1ST QUARTER 2008
|
19
|
|
|
|
|
|
CAPITAL
& LIQUIDITY
|
| ► |
At
March 31,
2008, our total available capital, defined as the sum
of our excess
capital plus our invested capital, amounted to $660 million,
compared to
$793 million at January 1, 2008 upon the adoption of
FAS 159. The decline
reflects market value adjustments on our employed capital.
Our total
available capital of $660 million differs from our GAAP
capital (equity
plus long-term debt) of $735 million because we adjust
our GAAP capital
for "economic" value changes to our investments in Sequoia
and Acacia (as
discussed on page 8) and we deduct net other assets and
liabilities.
|
| ► |
Capital
employed decreased in the first quarter by $83
million to $413 million
mainly as a result of market value declines that were partially
offset by $65 million of new acquisitions.
|
| ► |
We
are
long-term investors and we fund most
of our investments with equity. We
acquire our securities at discounts,
and in many cases substantial
discounts to face value, and we model
a range of expected cash flows that
we expect to collect over the life of
each security. To the extent the
fair values of our investments are lower
or higher from time to time is of
little consequence to us provided the
cash flows remain within our range
of expectations.
|
| ► |
The
high
level of excess capital and liquidity
over the past several quarters
reflects our intention to maintain
a strong balance sheet during
a time of
market distress and our strategic
decision to sell lower yielding,
higher
rated assets to position us to
acquire higher yielding assets
with the
potential for more upside return.
Over time, we expect our excess
capital
and net liquidity to decline
as we fund new investments. However,
as most
of our investments are funded
with equity, we have less need
to maintain a
large liquidity position.
|
|
20
|
THE
REDWOOD
REVIEW 1ST QUARTER 2008
|
|
|
|
|
|
|
|
DIVIDENDS
|
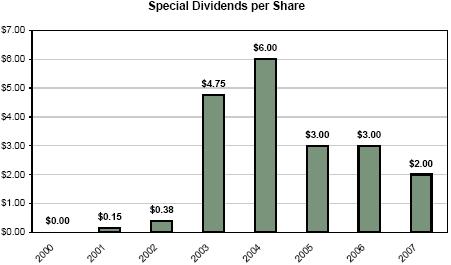
| ► |
On
March 5,
2008, we declared a regular dividend of $0.75 per share
for the second
quarter payable on April 21, 2008 to shareholders of
record on March 31,
2008.
|

|
*
Projected
|
|
THE
REDWOOD
REVIEW 1ST QUARTER 2008
|
21
|
|
|
|
|
|
DIVIDENDS
|
| ► |
Total
dividend
distributions over the last four quarters were $5.00
per share, which
included a $2.00 special dividend paid to shareholders on December
7,
2008.
|
| ► |
The
amount of
special dividends in 2008, if any, will
depend upon the level of taxable
income. With rising credit losses (for
which there are no credit reserves
for tax accounting), we do not currently
anticipate paying a special
dividend in 2008.
|
| ► |
Our
dividend
yield at the current regular
annual dividend rate of $3.00
per share at
the close of the market on May 1, 2008, was 8.26%.
|
| ► |
Over
the past
several years,
we have distributed
100% of REIT capital
gains income and
90% of REIT ordinary
income, retaining
10% of the ordinary
REIT income. We
retain 100% of
the after-tax income
we generate in
taxable subsidiaries.
All of our dividend
distributions in
2007 were ordinary
income and we do
not expect any
capital gain distributions
in
2008.
|
| ► |
As
in
prior
periods,
we
are
currently
planning
to
retain
a portion
and
defer
the
distribution
of
all
or
a portion
of
any
excess
REIT
taxable
income
earned
in
2008.
At
March
31,
2008,
we
had
$47
million
($1.43
per
outstanding
share)
of
undistributed
REIT
taxable
income
that
we
anticipate
distributing in
2008.
|
|
22
|
THE
REDWOOD
REVIEW 1ST QUARTER 2008
|
|
|
|
|
|
|
|
MARK-TO-MARKET
ADJUSTMENTS
|
| ► |
During
the
first quarter of 2008, residential and commercial real
estate prices
remained under pressure and borrower delinquencies
and defaults escalated.
Additionally, banks and Wall Street firms substantially
reduced their
extension of credit and slashed advance rates for collateralized
borrowings, even for repurchase borrowings backed by
Fannie Mae and
Freddie Mac securities. The combination of deteriorating
credit
fundamentals together with the contraction in market
liquidity caused
prices for real estate securities to record their steepest
quarterly
decline since the mortgage credit crisis began over
a year ago.
|
| ► |
The
capital
markets for non-agency residential and
commercial mortgages essentially
shut down during the quarter. New residential
non-agency securitizations
were at their lowest level in several
years and trading activity of
existing securities through the mortgage
capital markets remained
extremely light.
|
| ► |
Market unrest
peaked in early March.
The actions by the Fed
and the Treasury to reduce
systemic financial risk,
the 75 basis point rate
cut in the federal funds
rate, the opening of the
Fed discount window to
certain broker/dealers,
and the reduction in the
excess capital requirements
for Fannie Mae and
Freddie Mac appear to have
reduced the substantial
pressure that had built
up and restored some stability
to the markets. Trading
remains light, but
prices for real estate
securities seem to be holding.
We would caution
that it is still early
in this credit cycle and
this stability may be
temporary.
|
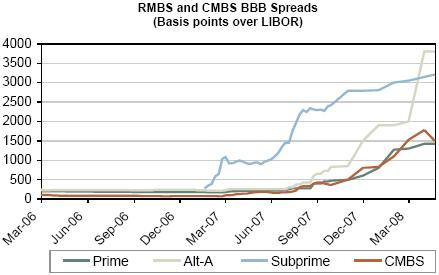
| ► |
The
table
below illustrates
the additional
interest
rate spread
that investors
have
required
to compensate
for the perceived
credit risk
of various
types of
residential
mortgage-backed
securities
(RMBS) and
commercial
mortgage-backed
securities
(CMBS).
|
| ► |
For
some
assets,
declines
in
fair
values
reflect
the
near-certainty
of
serious
credit
losses
being
realized.
For
others,
significant
future
losses
may
not
occur,
but
there
is
a
perceived
increase
in
the
risk
of
loss
resulting
in
a
lower
value.
Finally,
many
assets
are
not
at
serious
risk
of
loss
but
their
declining
value
largely
reflects
a
limited
number
of
observed
sales
in
the
market.
Many
of
the
sales
that
did
occur
were
by
distressed
sellers
resulting
in
further
downward
pressure
on
market
prices.
|
|
THE
REDWOOD
REVIEW 1ST QUARTER 2008
|
23
|
|
|
|
|
|
MARK-TO-MARKET
ADJUSTMENTS
|
| ► |
The
accounting
rules regarding MTM accounting are complex and may not
clearly reflect the
underlying economics. This topic is more fully discussed
in the Accounting
Discussion module in the Appendix.
|
| ► |
At
Redwood,
where we hold most of our securities as
available-for-sale for accounting
purposes, MTM changes that are other-than-temporary
flow through our
income statement while MTM changes that are temporary are charged
to
equity.
|
| ► |
For
accounting purposes, we consolidate
the balance sheets and income
statements of the Acacia
securitization entities.
On January 1, 2008, we
adopted a new accounting
standard, FAS 159, and elected
to fair value both
the assets and liabilities
of the Acacia entities. In
accordance with FAS
159, we recorded a one-time,
cumulative-effect adjustment
to our January
1, 2008 opening balance sheet
that decreased the carrying
value of Acacia
liabilities by $1.5 billion
and increased equity. This
new standard
significantly reduces the
disparity that existed between
GAAP carrying
value and our previous estimates
of economic value.
|
| ► |
For
Sequoia,
we are required
to consolidate
the assets
and liabilities,
which we report
at amortized
cost. Thus,
there was no
effect on our
financial statements
from changes
in fair values
of Sequoia's
loans or ABS
issued.
|
| ► |
Financial
Tables
19A,
19B,
and
19C
in
the
back
of
this
Review
detail
the
fair
value
of
residential,
commercial,
and
CDO
securities
at
Redwood,
the
Opportunity
Fund,
and
Acacia
as
a
percentage
of
their
face
value
as
of
March
31,
2008.
|
|
24
|
THE
REDWOOD
REVIEW 1ST QUARTER 2008
|
|
|
|
|
|
|
|
MARK-TO-MARKET
ADJUSTMENTS
|
| ► |
The
tables
below detail the MTM adjustments on securities held
at Redwood and the
Opportunity Fund (excluding Sequoia and Acacia) by
underlying collateral
type and by vintage. Net MTM adjustments were a negative
$146 million in
the first quarter of 2008.
|
|
Mark-To-Market
Adjustments on Securities
|
||||||||||||||||
|
at
Redwood and Opportunity Fund (Excluding
Sequoia and
Acacia)
|
||||||||||||||||
|
By
Underlying Collateral Type
|
||||||||||||||||
|
Three
Months Ended March 31, 2008
|
||||||||||||||||
|
($
in millions)
|
|
Loans,
OREI &
|
MTM
|
|||||||||||||||
|
IGS
|
CES
|
Derivatives
|
Total
|
Percent
(a)
|
||||||||||||
|
Residential
|
||||||||||||||||
|
Prime
|
$
|
(10
|
)
|
$
|
(56
|
)
|
$
|
(1
|
)
|
$
|
(67
|
)
|
(40
|
)%
|
||
|
Alt-a
|
(5
|
)
|
(13
|
)
|
(2
|
)
|
(20
|
)
|
(53
|
)%
|
||||||
|
Subprime
|
(1
|
)
|
(1
|
)
|
(1
|
)
|
(3
|
)
|
(21
|
)%
|
||||||
|
Residential
total
|
(16
|
)
|
(70
|
)
|
(4
|
)
|
(90
|
)
|
||||||||
|
Commercial
|
-
|
(47
|
)
|
-
|
(47
|
)
|
(32
|
)%
|
||||||||
|
CDO
|
(1
|
)
|
(2
|
)
|
-
|
(3
|
)
|
(6
|
)%
|
|||||||
|
Interest
rate
agreements & other derivatives
|
- | - |
(6
|
)
|
(6
|
)
|
||||||||||
|
Total
mark-to-market adjustments
|
$
|
(17
|
)
|
$
|
(119
|
)
|
$
|
(10
|
)
|
$
|
(146
|
)
|
||||
|
By
Vintage & Equity
|
||||||||||||||||||||||
|
Loans
&
|
||||||||||||||||||||||
|
<=
2004
|
2005
|
2006
|
2007
|
2008
|
Derivatives
|
Total
|
||||||||||||||||
|
Total
mark-to-market adjustments
|
$
|
(35
|
)
|
$
|
(22
|
)
|
$
|
(34
|
)
|
$
|
(38
|
)
|
$
|
(10
|
)
|
$
|
(7
|
)
|
$
|
(146
|
)
|
|
|
MTM
percent (a)
|
(22
|
)%
|
(22
|
)%
|
(27
|
)%
|
(34
|
)%
|
(43
|
)%
|
||||||||||||
| (a) |
This
percentage represents the MTMs taken as
a percentage of the reported fair
values at the beginning of the period,
or purchase price if acquired
during the period. It is intended to highlight
the price declines by
collateral type for the three months ended
March 31, 2008. These price
declines are specific to our portfolio
and may not be indicative of price
declines in the market in
general.
|
| ► |
Under
GAAP,
we value securities using bid-side markets (an exit
price). Bid/offer
spreads are generally wide for illiquid securities,
and in today's
turbulent market, spreads are especially wide. This
difference in
bid/offer spreads is the primary reason we recorded
$11 million of
negative MTM adjustments on purchases made in the first
quarter.
|
| ► | The following table shows the MTM impact on our balance sheet and income statement in the first quarter. |
|
Mark-to-Market
Adjustments on Securities
|
||||
|
at
Redwood and Opportunity Fund
(Excluding Sequoia and
Acacia)
|
||||
|
Balance
Sheet and Income Statement
Effect
|
||||
|
Three
Months Ended March 31, 2008
|
||||
|
($
in millions)
|
||||
|
|
Redwood
|
|||
|
Balance
Sheet Effect
|
||||
|
Adjustment
to
OCI
|
$
|
21
|
||
|
Income
Statement Effect
|
||||
|
Market
valuation adjustments
|
||||
|
FVO
assets
|
(13
|
)
|
||
|
Impairment
on
AFS securities
|
(144
|
)
|
||
|
Changes
in
fair value on trading instruments
|
(10
|
)
|
||
|
Total
income
statement effect
|
(167
|
)
|
||
|
Total
mark-to-market adjustments
|
$
|
(146
|
)
|
|
|
THE
REDWOOD
REVIEW 1ST QUARTER 2008
|
25
|
|
|
|
|
|
MARK-TO-MARKET
ADJUSTMENTS
|
| ► |
During
the
first quarter, there were gross negative market value
adjustments of $167
million, and net adjustments of negative $146 million
after reversing $21
million of prior period temporary adjustments from equity
(other
comprehensive income) as shown in the table above.
|
| ► |
The
table
below shows the first quarter MTM adjustments
for the assets and
liabilities at Acacia subesquent to the
adoption of FAS 159 on January 1,
2008.
|
|
MTM
Adjustments on Acacia Assets and Liabilities
|
|||||||
|
Three
Months Ended March 31, 2008
|
|||||||
|
($
in millions)
|
|||||||
|
|
|
Assets
|
||||
|
Real
estate
securities and Loans
|
$
|
(787
|
)
|
|
|
Interest
rate
agreements and other derivatives
|
(50
|
)
|
||
|
Liabilities
|
||||
|
ABS
issued
|
810
|
|||
|
Net
mark-to-market adjustments
|
$
|
(27
|
)
|
| ► |
During
the
first quarter, market prices for the assets collateralizing
our CDOs and
the related debt declined further due to elevating
credit concerns and a
market in which there was very light trading volume.
|
| ► |
At
Acacia,
the entire net negative $27 million
of MTM adjustments were reflected in
the income statement as required by
FAS 159.
|
| ► |
As
a result
of the measurement
techniques required
by FAS 159, we expect
to encounter
some MTM earnings volatility
in the future as a
result of the
consolidation of Acacia
entities. We expect
this volatility to
be
significantly less
than we encountered
in prior periods. This
complex
topic is more fully
discussed in the Investments
in Acacia module later
in
this Review.
|
|
26
|
THE
REDWOOD
REVIEW 1ST QUARTER 2008
|
|
|
|
|
|
|
|
MARK-TO-MARKET
ADJUSTMENTS
|
| ► |
The
fair values
we use for our assets and liabilities reflect what we believe
we would
realize if we chose to sell our securities or would have
to pay if we
chose to buy back our asset-backed securities (ABS) issued
liabilities.
Establishing fair values is inherently subjective and is
dependent upon
many market-based inputs, including observable trades,
information on
offered inventories, bid lists, and indications of value
obtained from
dealers. Obtaining fair values for securities is especially
difficult for
illiquid securities (such as ours), and is made more difficult
when there
is limited trading visibility, as was the case in recent
months. Where
there are observable sales, many of them are from distressed
sellers, and
their sales tend to further depress asset prices. For these
reasons, we
expect market valuations to continue to be highly
volatile.
|
| ► |
Fair
values for
our securities and ABS issued are dependent upon a number
of market-based
assumptions, including future interest rates, prepayment
rates, discount
rates, credit loss rates, and the timing of credit losses.
We use these
assumptions to generate cash flow estimates and internal
values for each
individual security.
|
| ► |
We
request
indications of value (marks) from dealers
every quarter to assist in the
valuation process. For March 31, 2008,
we received dealer marks on 71% of
the assets and 82% of our liabilities
on our consolidated balance sheet.
One major dealer that we have used
in prior periods provided no marks.
|
| ► |
One
of the
factors we consider
in our valuation
process is our assessment
of the
quality of the dealer
marks we receive.
Dealers remain inundated
with
requests for quarter-end
marks, and there
continues to be limited
observable trading
information for them
to rely upon. Thus,
their marks
were most likely
generated by their
own pricing models
for which they did
not share their inputs
and we had little
insight into their
assumptions.
|
| ► |
Furthermore,
the
dealers
continue
to
heavily
qualify
the
information
they
send
to
us.
The
qualifications
include
statements
to
the
effect
that
the
markets
are
very
volatile
and
are
characterized
by
limited
trading
volume
and
poor
price
transparency,
and
in
many
cases,
an
increasing
number
of
valuations
are
model-based
due
to
a
lack
of
observable
trades.
|
| ► |
Our
valuation
process
relied
on
our
internal
values
to
estimate
the
fair
values
of
our
securities
at
March
31,
2008.
In
the
aggregate,
our
internal
valuations
of
the
securities
on
which
we
received
dealer
marks
were
29%
lower
than
the
aggregate
dealer
marks
at
March
31,
2008.
Our
internal
valuations
of
our
ABS
issued
on
which
we
received
dealer
marks
were
14%
lower
than
the
aggregate
dealer
marks
at
March
31,
2008.
|
|
THE
REDWOOD
REVIEW 1ST QUARTER 2008
|
27
|
|
|
|
|
|
RESIDENTIAL
REAL ESTATE SECURITIES
|
| ► |
Our
residential securities portfolio declined by $48 million
(or 30%) from
$160 million to $112 million in the first quarter.This
decrease was
primarily due to negative market value adjustments partially
offset by $38
million of residential prime securities
acquisitions.
|
| ► |
From
a total
market perspective, new securitizations of prime
jumbo residential loans totaled $6 billion in the first quarter,
a
71% decline from the fourth quarter, and a 91% decline
from the year-ago
period. Despite market conditions, we successfully
worked with our banking
partners to provide liquidity on three new prime securitizations.
We
purchased all of the CES securities ($5 million invested)
and part of the
IGS securities ($10 million invested) from these securitizations.
Our
base case
returns, which assume no price appreciation or leverage,
fall within our
equity hurdle rate range of 12% to
18%.
|
| ► |
We
remained
active participants in the secondary
mortgage markets, although market
liquidity was hindered by forced
liquidations and systemic credit
concerns. We acquired $10 million
of prime CES and $7 million of
prime IGS
from seasoned vintages during
the quarter. We also acquired
$1 million of
prime CES and $10 million of
prime IGS from 2006 and 2007
vintages at
significant discounts to face
value. While we are focused on
building our
prime credit enhancement business,
we plan to accelerate our investments
in new and seasoned prime IGS.
|
| ► |
The
credit
performance
of our
residential
securities
worsened
during
the first
quarter.
Prime and
alt-a CES
originated
prior to
2005 continued
to perform
within
our range
of expectations,
while newer
vintage
CES (acquired
prior
to the
third quarter
of 2007)
continued
to perform
worse than
expected.
In
almost
all pools
of loans,
we are
experiencing
increases
in loan
delinquencies
and losses.
Our GAAP
credit
reserve
balances
are reassessed
quarterly
for changes
in our
loss
expectations.
|
|
28
|
THE
REDWOOD
REVIEW 1ST QUARTER 2008
|
|
|
|
|
|
|
|
RESIDENTIAL
REAL ESTATE
SECURITIES
|
| ► |
Turmoil
in
the housing markets remains a significant concern.
Home prices, as
measured by the S&P/Case-Shiller Home Price Index (composite-10), were
down 13.6% at the end of February from a year ago,
and the index has
declined for 20 consecutive months. Foreclosure filings
were up 57% in
March from a year ago, according to Realty Trac,
marking the 27th
consecutive month of year-over-year
increases.
|
| ► |
Prepayment
rates on the residential loans
in our portfolio declined or
remained at
low levels during the first
quarter. The overall slowdown
in refinancing
activity has been largely due
to increases in mortgage rates,
declines in
housing values, and tightening
in underwriting standards.
Prepayment
speeds on prime residential
ARMs and negative amortization
mortgages
declined to a 23% rate in the
first quarter, compared to
32% in the fourth
quarter. Prime residential
hybrid loans prepaid at a 12%
rate in the first
quarter, compared to 10% in
the fourth quarter. Prime residential
alt-a
option ARMs prepaid at a 16%
rate in the first quarter,
down from 21% in
the fourth quarter.
|
| ► |
The
new
agency
jumbo
loan
purchase
programs
(with
loan
limits
of up
to $729,750)
began
in April.
Fannie
Mae recently
announced
pricing
of its
jumbo
loan
product
at 39
basis
points
over
its conforming
rate,
as of
April
17, 2008.
This
is encouraging,
considering
that
recent
premiums
required
by
portfolio
lenders
have
been
about
150 basis
points
or more.
It is
still
too early
to assess
the impact
that
these
programs
will
have
on new
purchases
and refinancings,
however,
as jumbo
borrowers
will
face
tighter
underwriting
guidelines,
higher
documentation
standards,
and declining
home
prices
over
the coming
quarters.
|
|
THE
REDWOOD
REVIEW 1ST QUARTER 2008
|
29
|
|
|
|
|
|
RESIDENTIAL
REAL ESTATE SECURITIES
|
| ► | The following table presents the activity in our prime securities portfolio during the first quarter of 2008. |
|
First
Quarter Activity
|
||||
|
(by
market value, $ in millions)
|
||||
|
Market
Value at December 31, 2007
|
$
|
129
|
||
|
Acquisitions
|
38
|
|||
|
Transfers
to /
from other portfolios
|
1
|
|||
|
Principal
payments
|
(15
|
)
|
||
|
Discount
amortization
|
10
|
|||
|
Changes
in
fair value, net
|
(65
|
)
|
||
|
Market
Value at March 31, 2008
|
$
|
98
|
||
| ► |
Total
interest
income generated by our prime securities was $17 million
in the first
quarter. Annualized interest income over our average
amortized cost for
prime securities was 26%.
|
| ► |
At
March 31,
2008, our prime portfolio had
an amortized cost of 25% of principal
value
and a fair value as reported
on our balance sheet of 14% of
principal
value. The table below presents
rating and vintage information
of the
prime securities in our portfolio
at March 31, 2008.
|
|
Prime
Securities
at Redwood
|
||||||||||||||||||||||
|
By
Rating and
Vintage
|
||||||||||||||||||||||
|
March
31, 2008
|
||||||||||||||||||||||
|
(by
market value,
$ in millions)
|
||||||||||||||||||||||
|
|
|
<=2004
|
2005
|
2006
|
2007
|
2008
|
Total
|
|||||||||||||||
|
IGS
|
AAA
|
$
|
1
|
$
|
-
|
$
|
-
|
$
|
-
|
$
|
-
|
$
|
1
|
|||||||||
|
AA
|
1
|
-
|
-
|
-
|
3
|
4
|
||||||||||||||||
|
A
|
-
|
-
|
9
|
-
|
1
|
10
|
||||||||||||||||
|
BBB
|
2
|
1
|
-
|
-
|
2
|
5
|
||||||||||||||||
|
IGS
|
4
|
1
|
9
|
-
|
6
|
20
|
||||||||||||||||
|
CES
|
BB
|
12
|
7
|
2
|
3
|
1
|
25
|
|||||||||||||||
|
B
|
15
|
2
|
1
|
3
|
1
|
22
|
||||||||||||||||
|
NR
|
21
|
6
|
2
|
2
|
-
|
31
|
||||||||||||||||
|
CES
Total
|
|
48
|
15
|
5
|
8
|
2
|
78
|
|||||||||||||||
|
Total
|
$
|
52
|
$
|
16
|
$
|
14
|
$
|
8
|
$
|
8
|
$
|
98
|
||||||||||
|
By
Loan Type and
Vintage
|
|||||||||||||||||||
|
|
<=2004
|
2005
|
2006
|
2007
|
2008
|
Total
|
|||||||||||||
|
ARM
|
$
|
4
|
$
|
-
|
$
|
-
|
$
|
-
|
$
|
-
|
$
|
4
|
|||||||
|
Fixed
|
14
|
-
|
9
|
4
|
4
|
31
|
|||||||||||||
|
Hybrid
|
31
|
13
|
4
|
3
|
4
|
55
|
|||||||||||||
|
Option
Arm
|
3
|
3
|
1
|
1
|
-
|
8
|
|||||||||||||
|
Total
|
$
|
52
|
$
|
16
|
$
|
14
|
$
|
8
|
$
|
8
|
$
|
98
|
|||||||
|
30
|
THE
REDWOOD
REVIEW 1ST QUARTER 2008
|
|
|
|
|
|
|
|
RESIDENTIAL
REAL ESTATE
SECURITIES
|
| ► |
Our
prime CES
portfolio is generally concentrated in more seasoned
assets (62% of our
portfolio by
current
market value)
originated
in 2004 and earlier. Although delinquencies are
currently rising across
all vintages, our seasoned CES are still performing
within our original
expectations. Much of our invested principal has already been
returned on these securities, diminishing the impact
of rising loan
delinquencies on overall performance. For 2005
and later vintages (38% of
our portfolio), the performance of our investments
is
generally
worse than
our original
expectations. These securities have not benefited
from a period of high
principal repayments and appreciating home prices,
and are therefore more
exposed to rising delinquencies. The delinquency
chart on the following
page illustrates delinquency rates on our prime
CES by loan vintage.
|
| ► |
The
principal
value credit losses on
prime CES were $11 million
during the quarter and
were charged against our
designated credit reserve.
The losses were larger
than expected and resulted
from a combination of higher
loss severities on
foreclosed properties,
shorter foreclosure periods,
and increases in the
number of short sales.
The increase in short sales
had the effect of
accelerating losses, but
the realized loss severity
on short sales
averaged 20% compared to
32% from foreclosure
sales.
|
| ► |
For
tax
purposes,
losses
on
prime
securities
were
$4
million
($0.13
per
share).
This
deduction
is
less
than
the
principal
value
of
credit
losses
incurred
on
the
underlying
loans
as
we
own
most
of
our
credit
sensitive
assets
at
a
tax
basis
that
is
substantially
less
than
par
value.
|
| ► |
For
GAAP
purposes,
we
designate
credit
reserves
on
CES
that
we
classify
as
available-for-sale.
Our
designated
GAAP
credit
reserves
for
prime
CES
were
$357
million
($10.91
per
share)
at
March
31,
2008,
an
increase
of
$69
million
for
the
quarter.
This
increase
was
due
to
$23
million
new
acquisitions
and
$11
million
of
credit
losses,
and
$57
million
resulting
from
our
reassessment
of
credit
reserves
on
some
recent
vintage
prime
CES.
The
summary-level
information
below
presents
our
weighted-average
credit
reserve
balances
on
prime
CES,
as
designated
by
loan
vintage
and
credit
rating.
|
|
THE
REDWOOD
REVIEW 1ST QUARTER 2008
|
31
|
|
|
|
|
|
RESIDENTIAL
REAL ESTATE SECURITIES
|
|
Credit
Reserve Analysis - Prime CES at Redwood
|
||||||||||||||||||||||||||||||||||||||||
|
By
current rating, by vintage
|
||||||||||||||||||||||||||||||||||||||||
|
March
31, 2008
|
||||||||||||||||||||||||||||||||||||||||
|
($
in millions)
|
||||||||||||||||||||||||||||||||||||||||
|
|
||||||||||||||||||||||||||||||||||||||||
|
|
|
|
|
<=2004
|
|
2005
|
|
2006
|
|
2007
|
|
2008
|
|
Total
|
|
|||||||||||||||||||||||||
|
|
|
Amount
|
%
of loans
|
Amount
|
%
of loans
|
Amount
|
%
of loans
|
Amount
|
%
of loans
|
Amount
|
%
of loans
|
Amount
|
%
of loans
|
|||||||||||||||||||||||||||
|
BB
|
|
|||||||||||||||||||||||||||||||||||||||
|
Face
|
$
|
43
|
0.47
|
%
|
$
|
30
|
0.33
|
%
|
$
|
6
|
0.07
|
%
|
$
|
16
|
0.30
|
%
|
$
|
6
|
0.44
|
%
|
$
|
101
|
0.30
|
%
|
||||||||||||||||
|
Unamortized
discount
|
(13
|
)
|
(14
|
)
|
(1
|
)
|
3
|
(3
|
)
|
(28
|
)
|
|||||||||||||||||||||||||||||
|
Discount
designated as credit reserve
|
(6
|
)
|
0.07
|
%
|
0
|
0.00
|
%
|
(2
|
)
|
0.03
|
%
|
(15
|
)
|
0.29
|
%
|
0
|
0.02
|
%
|
(23
|
)
|
0.07
|
%
|
||||||||||||||||||
|
|
Unrealized
gains (losses)
|
|
(12
|
)
|
|
(9
|
)
|
|
(1
|
)
|
|
(1
|
)
|
|
(2
|
)
|
|
(25
|
)
|
|
||||||||||||||||||||
|
Market
value
|
$
|
12
|
$
|
7
|
$
|
2
|
$
|
3
|
$
|
1
|
$
|
25
|
||||||||||||||||||||||||||||
|
Overall
credit protection to BB CES
|
0.73
|
%
|
0.43
|
%
|
1.00
|
%
|
0.39
|
%
|
0.59
|
%
|
0.66
|
%
|
||||||||||||||||||||||||||||
|
|
||||||||||||||||||||||||||||||||||||||||
|
B
|
|
|||||||||||||||||||||||||||||||||||||||
|
Face
|
$
|
45
|
0.09
|
%
|
$
|
15
|
0.24
|
%
|
$
|
11
|
0.28
|
%
|
$
|
23
|
0.14
|
%
|
$
|
5
|
0.28
|
%
|
$
|
99
|
0.12
|
%
|
||||||||||||||||
|
Unamortized
discount
|
(11
|
)
|
(4
|
)
|
0
|
2
|
0
|
(13
|
)
|
|||||||||||||||||||||||||||||||
|
Discount
designated as credit reserve
|
(13
|
)
|
0.02
|
%
|
(8
|
)
|
0.14
|
%
|
(10
|
)
|
0.27
|
%
|
(22
|
)
|
0.13
|
%
|
(3
|
)
|
0.22
|
%
|
(56
|
)
|
0.07
|
%
|
||||||||||||||||
|
|
Unrealized
gains (losses)
|
|
(6
|
)
|
|
(1
|
)
|
|
0
|
|
0
|
|
(1
|
)
|
|
(8
|
)
|
|
||||||||||||||||||||||
|
Market
value
|
$
|
15
|
$
|
2
|
$
|
1
|
$
|
3
|
$
|
1
|
$
|
22
|
||||||||||||||||||||||||||||
|
Overall
credit
protection to B CES
|
0.28
|
%
|
0.23
|
%
|
0.45
|
%
|
0.36
|
%
|
0.31
|
%
|
0.30
|
%
|
||||||||||||||||||||||||||||
|
|
||||||||||||||||||||||||||||||||||||||||
|
Unrated
|
||||||||||||||||||||||||||||||||||||||||
|
Face
|
$
|
151
|
0.51
|
%
|
$
|
91
|
0.40
|
%
|
$
|
51
|
0.24
|
%
|
$
|
41
|
0.22
|
%
|
$
|
4
|
0.31
|
%
|
$
|
338
|
0.36
|
%
|
||||||||||||||||
|
Unamortized
discount
|
(25
|
)
|
1
|
2
|
2
|
0
|
(20
|
)
|
||||||||||||||||||||||||||||||||
|
Discount
designated as credit reserve
|
(100
|
)
|
0.34
|
%
|
(82
|
)
|
0.37
|
%
|
(51
|
)
|
0.24
|
%
|
(41
|
)
|
0.22
|
%
|
(4
|
)
|
0.31
|
%
|
(278
|
)
|
0.30
|
%
|
||||||||||||||||
|
|
Unrealized
(losses) gains
|
(5
|
)
|
|
(4
|
)
|
|
0
|
|
0
|
|
0
|
|
(9
|
)
|
|
||||||||||||||||||||||||
|
|
Market
value
|
$
|
21
|
|
$
|
6
|
|
$
|
2
|
|
$
|
2
|
|
$
|
-
|
|
$
|
31
|
|
|||||||||||||||||||||
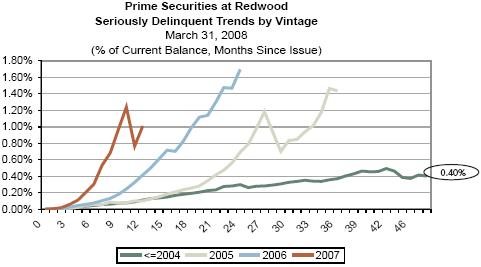
| ► |
The
above
charts can be used to analyze our credit reserves relative
to existing
credit trends. For example, the chart above shows that
serious
delinquencies on 2004 and prior vintage CES are currently
0.40% of
collateral loan balances. If we assume a default rate
of seriously
delinquent loans of 70% and a loss severity of 35%,
total expected credit
losses from these delinquencies would equal 0.10% of
current collateral
loan balances. Credit reserves on 2004 and prior vintage
unrated CES
currently total 0.34% of collateral balances (as shown
in the table
above). Under this scenario, our credit reserves could
absorb the losses
from the existing seriously delinquent loans at March
31, 2008, plus
another 0.24% of future losses.
|
|
32
|
THE
REDWOOD
REVIEW 1ST QUARTER 2008
|
|
|
|
|
|
|
|
RESIDENTIAL
REAL ESTATE
SECURITIES
|
| ► |
The
following
chart breaks out our prime portfolio loan types by
weighted average
interest rate, as well as our estimate of conforming
and non-conforming
(i.e., jumbo) balances as of March 31, 2008. This chart
illustrates how
our portfolio might be affected by refinancing activity
from a reduction
in interest rates, the temporary increases in GSE conforming
loan limits,
or a combination of both. The bottom two charts show
current interest
rates and are helpful when analyzing the loan rates
in our
portfolio. We estimate that approximately 40% of the principal
amount
of the jumbo loans in our portfolio will be eligible
for purchase by the
GSEs based only on the higher GSE conforming loan limit
and that half of
these would meet the underwriting criteria including
loan-to-value ratios.
The decision by these borrowers to refinance their
loans will largely be
dependent on their current mortgage rates relative
to the new rates
offered by the GSEs.
|
|
Prime
CES at Redwood
|
|||||||||||||||||||||||||||||||||||||
|
Composition
by Product Type, Vintage and Balance
|
|||||||||||||||||||||||||||||||||||||
|
March
31, 2008 (a)
|
|||||||||||||||||||||||||||||||||||||
|
|
<=
2004
|
2005
|
2006
|
2007
|
2008
|
Total
|
|||||||||||||||||||||||||||||||
|
Product
|
%
of Balance
|
Wtd
Avg Loan Rate
|
%
of Balance
|
Wtd
Avg Loan Rate
|
%
of Balance
|
Wtd
Avg Loan Rate
|
%
of Balance
|
Wtd
Avg Loan Rate
|
%
of Balance
|
Wtd
Avg Loan Rate
|
%
of Balance
|
Wtd
Avg Loan Rate
|
|||||||||||||||||||||||||
|
Hybrid
|
48%
|
|
4.79%
|
|
55%
|
|
5.38%
|
|
39%
|
|
6.14%
|
|
27%
|
|
6.33%
|
|
12%
|
|
6.35%
|
|
46%
|
|
5.17%
|
|
|||||||||||||
|
ARM(b)
|
7%
|
|
6.30%
|
|
<1%
|
|
6.28%
|
|
2%
|
|
5.52%
|
|
<1%
|
|
6.43%
|
|
--
|
--
|
4%
|
|
6.27%
|
|
|||||||||||||||
|
Fixed
|
5%
|
|
5.58%
|
|
7%
|
|
6.03%
|
|
11%
|
|
6.33%
|
|
43%
|
|
6.39%
|
|
88%
|
|
6.54%
|
|
11%
|
|
6.12%
|
|
|||||||||||||
|
Option-ARM
|
4%
|
|
6.63%
|
|
21%
|
|
6.84%
|
|
33%
|
|
7.09%
|
|
20%
|
|
7.32%
|
|
--
|
--
|
13%
|
|
6.96%
|
|
|||||||||||||||
|
Jumbo(c)
|
63%
|
|
84%
|
|
|
85%
|
|
|
91%
|
|
100%
|
|
73%
|
|
|||||||||||||||||||||||
|
Hybrid
|
17%
|
|
6.63%
|
|
11%
|
|
6.53%
|
|
6%
|
|
5.61%
|
|
1%
|
|
6.41%
|
|
--
|
--
|
13%
|
|
6.61%
|
|
|||||||||||||||
|
ARM(b)
|
6%
|
|
6.34%
|
|
<1%
|
|
6.01%
|
|
<1%
|
|
6.43%
|
|
<1%
|
|
6.47%
|
|
--
|
--
|
3%
|
|
6.32%
|
|
|||||||||||||||
|
Fixed
|
12%
|
|
6.39%
|
|
2%
|
|
6.48%
|
|
<1%
|
|
7.28%
|
|
2%
|
|
7.56%
|
|
--
|
--
|
7%
|
|
6.90%
|
|
|||||||||||||||
|
Option-ARM
|
2%
|
|
5.74%
|
|
3%
|
|
5.68%
|
|
8%
|
|
6.72%
|
|
6%
|
|
7.15%
|
|
--
|
--
|
3%
|
|
5.85%
|
|
|||||||||||||||
|
Conforming
|
37%
|
|
16%
|
|
15%
|
|
9%
|
|
--
|
27%
|
|
||||||||||||||||||||||||||
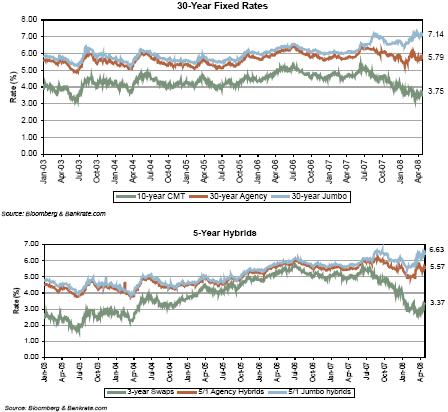
|
THE
REDWOOD
REVIEW 1ST QUARTER 2008
|
33
|
|
|
|
|
|
RESIDENTIAL
REAL ESTATE SECURITIES
|
| ► |
The
chart
below shows the trends in our residential prime CES
prepayment speeds,
which have been declining for our adjustable-rate
mortgages and remain at
low speeds for our fixed and hybrid loans.
|
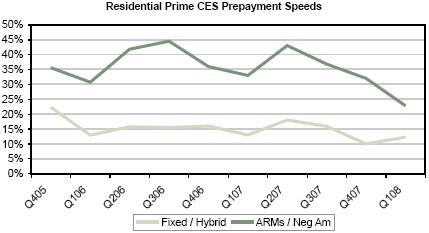
| ► |
The
degree of
refinancing activity is important to consider,
since our credit reserves
provide protection on securities that we have purchased
at a substantial
discount to principal face amounts. All things
being equal, faster
prepayments would benefit these investments by
accelerating the collection
of principal and potential recovery of credit reserves.
Any resulting
transfer of credit reserve amounts to unamortized
discount status has the
effect of increasing GAAP yields and interest income
over
time.
|
|
34
|
THE
REDWOOD
REVIEW 1ST QUARTER 2008
|
|
|
|
|
|
|
|
RESIDENTIAL
REAL ESTATE
SECURITIES
|
| ► |
We
believe
the loan characteristics of our prime portfolio
set forth below illustrate
the high quality of these loans, including relatively
low LTV ratios and
high FICO scores. As the following table also
illustrates, we have
geographically diverse pools of prime loans that
are generally seasoned
over three years.
|
|
Residential
Prime CES at Redwood
|
||||
|
Underlying
Loan Characteristics
|
||||
|
as
of March
31, 2008
|
||||
|
Number
of
loans
|
303,657
|
Wtd
Avg
FICO
|
736
|
|
|
Total
loan
face ($ in millions)
|
127,183
|
FICO:
621 -
660
|
4%
|
|
|
Average
loan
size ($ in 1000's)
|
$419
|
FICO:
661 -
700
|
15%
|
|
|
|
FICO:
701 -
740
|
27%
|
||
|
Southern
CA
|
26%
|
FICO:
>
740
|
51%
|
|
|
Northern
CA
|
23%
|
Unknown
|
3%
|
|
|
Florida
|
6%
|
|
||
|
New
York
|
6%
|
Conforming
at
origination %
|
25%
|
|
|
Georgia
|
2%
|
>
$1
MM
%
|
10%
|
|
|
New
Jersey
|
3%
|
|
||
|
Other
states
|
34%
|
2nd
home
%
|
6%
|
|
|
|
Investment
home %
|
2%
|
||
|
2008
origination
|
<1%
|
|
||
|
2007
origination
|
8%
|
Purchase
|
42%
|
|
|
2006
origination
|
14%
|
Cash
out
refi
|
25%
|
|
|
2005
origination
|
22%
|
Rate-term
refi
|
33%
|
|
|
2004
origination and earlier
|
56%
|
|
||
|
|
Full
doc
|
49%
|
||
|
Wtd
Avg
Original LTV
|
69%
|
No
doc
|
7%
|
|
|
Original
LTV:
0 - 50
|
13%
|
Other
(limited, etc)
|
41%
|
|
|
Original
LTV:
50 - 60
|
12%
|
Unknown
|
3%
|
|
|
Original
LTV:
60. - 70
|
22%
|
2-4
family
|
1%
|
|
|
Original
LTV:
70 - 80
|
50%
|
Condo
|
11%
|
|
|
Original
LTV:
80 - 90
|
2%
|
Single
family
|
88%
|
|
|
Original
LTV:
90 - 100
|
1%
|
|
||
|
THE
REDWOOD
REVIEW 1ST QUARTER 2008
|
35
|
|
|
|
|
|
RESIDENTIAL
REAL ESTATE SECURITIES
|
| ► |
The
following
table presents the activity in our alt-a securities
portfolio during the
first quarter of 2008.
|
|
Alt-a
Securities at Redwood
|
||||
|
First
Quarter Activity
|
||||
|
(by
market value, $ in millions)
|
||||
|
Market
Value at December 31, 2007
|
$
|
41
|
||
|
Acquisitions
|
-
|
|||
|
Principal
payments
|
(5
|
)
|
||
|
Discount
amortization
|
2
|
|||
|
Changes
in
fair value, net
|
(21
|
)
|
||
|
Market
Value at March 31, 2008
|
$
|
17
|
||
| ► |
Our
residential alt-a securities portfolio declined
to $14 million in the
first quarter, primarily due to negative market
value changes. We acquired
less than $1 million of alt-a securities during
the quarter.
|
| ► |
Total
interest income
generated by
our alt-a securities
was $8 million
in the
quarter, which
produced an annualized
yield of 85%
based on our
average
amortized cost
of the securities.
|
| ► |
At
March
31,
2008
our
alt-a
CES
portfolio
had
an
average
basis
amortized
cost
of
5%
of
principal
value
and
a
fair
value
as
reported
on
our
balance
sheet
of
4%
of
principal
value.
The
table
below
provides
information
on
the
alt-a
securities
in
our
portfolio.
|
|
Alt-a
Securities
at
Redwood
|
||||||||||||||||||||||
|
By
Rating
and
Vintage
|
||||||||||||||||||||||
|
March
31,
2008
|
||||||||||||||||||||||
|
(by
market
value,
$
in
millions)
|
||||||||||||||||||||||
|
|
|
<=2004
|
2005
|
2006
|
2007
|
2008
|
Total
|
|||||||||||||||
|
IGS
|
AAA
|
$
|
-
|
$
|
-
|
$
|
-
|
$
|
2
|
$
|
-
|
$
|
2
|
|||||||||
|
AA
|
-
|
-
|
-
|
-
|
-
|
-
|
||||||||||||||||
|
A
|
-
|
-
|
-
|
1
|
-
|
1
|
||||||||||||||||
|
BBB+
|
-
|
-
|
-
|
-
|
-
|
-
|
||||||||||||||||
|
BBB
|
-
|
-
|
1
|
-
|
-
|
1
|
||||||||||||||||
|
BBB-
|
-
|
-
|
-
|
1
|
-
|
1
|
||||||||||||||||
|
IGS
|
-
|
-
|
1
|
4
|
-
|
5
|
||||||||||||||||
|
CES
|
BB
|
-
|
-
|
-
|
-
|
-
|
-
|
|||||||||||||||
|
B
|
-
|
-
|
-
|
2
|
-
|
2
|
||||||||||||||||
|
NR
|
1
|
4
|
1
|
1
|
-
|
7
|
||||||||||||||||
|
CES
Total
|
1
|
4
|
1
|
3
|
-
|
9
|
||||||||||||||||
|
OREI
|
RES
|
-
|
-
|
-
|
1
|
-
|
1
|
|||||||||||||||
|
NIM
|
-
|
-
|
2
|
-
|
-
|
2
|
||||||||||||||||
|
OREI
|
|
-
|
-
|
2
|
1
|
-
|
3
|
|||||||||||||||
|
Total
|
|
$
|
1
|
$
|
4
|
$
|
4
|
$
|
8
|
$
|
-
|
$
|
17
|
|||||||||
|
By
Loan
Type
and
Vintage
|
|||||||||||||||||||
|
|
<=2004
|
2005
|
2006
|
2007
|
2008
|
Total
|
|||||||||||||
|
ARM
|
$
|
-
|
$
|
-
|
$
|
-
|
$
|
-
|
$
|
-
|
$
|
-
|
|||||||
|
Fixed
|
-
|
-
|
-
|
1
|
-
|
1
|
|||||||||||||
|
Hybrid
|
1
|
-
|
2
|
4
|
-
|
7
|
|||||||||||||
|
Option
Arm
|
-
|
4
|
2
|
3
|
-
|
9
|
|||||||||||||
|
Total
|
$
|
1
|
$
|
4
|
$
|
4
|
$
|
8
|
$
|
-
|
$
|
17
|
|||||||
|
36
|
THE
REDWOOD
REVIEW 1ST QUARTER 2008
|
|
|
|
|
|
|
|
RESIDENTIAL
REAL ESTATE
SECURITIES
|
| ► |
Seriously
delinquent loans underlying alt-a CES increased
during the quarter from
2.75% to 4.49% of original balances and 5.59%
to 9.51% of current
balances. Delinquency trends on alt-a CES continue
to increase at a rate
more severe than we originally anticipated. Our
credit reserves for these
securities reflect our current loss
assumptions.
|
| ► |
Principal
value credit losses on alt-a CES were $16 million
during the quarter and
were charged against our GAAP credit reserve.
For tax purposes, losses on
alt-a securities were $5 million ($0.15 per
share). This deduction is less
than the principal value of credit losses incurred
on the underlying loans
as we own most of our credit sensitive assets
at a tax basis that is
substantially less than par
value.
|
| ► |
Our
designated GAAP credit reserves for alt-a CES
was $206 million ($6.26 per
share) at March 31, 2008, a net increase of
$10 million for the quarter
due to the credit losses ($16 million) and
our reassessment of credit
reserves on some recent vintage alt-a CES ($26
million).
|
| ► |
The
summary-level information below presents weighted-average
credit reserve
balances by principal
value, segmented by loan vintage and credit rating.
Since credit reserves
are set on a security
level basis, poorly performing securities can
distort the aggregate
balances and averages.
|
|
Credit
Reserve Analysis - Alt-a Securities
at Redwood
|
||||||||||||||||||||||||||||||||||||||||
|
By
current rating, by vintage
|
||||||||||||||||||||||||||||||||||||||||
|
March
31, 2008
|
||||||||||||||||||||||||||||||||||||||||
|
($
in millions)
|
||||||||||||||||||||||||||||||||||||||||
|
|
||||||||||||||||||||||||||||||||||||||||
|
|
|
|
|
<=2004
|
|
2005
|
|
2006
|
|
2007
|
|
2008
|
|
Total
|
|
|||||||||||||||||||||||||
|
|
|
Amount
|
%
of loans
|
Amount
|
%
of loans
|
Amount
|
%
of loans
|
Amount
|
%
of loans
|
Amount
|
%
of loans
|
Amount
|
%
of loans
|
|||||||||||||||||||||||||||
|
BB
|
||||||||||||||||||||||||||||||||||||||||
|
Face
|
$
|
1
|
1.12
|
%
|
$
|
-
|
-
|
$
|
-
|
-
|
$
|
3
|
0.37
|
%
|
$
|
-
|
-
|
$
|
4
|
0.49
|
%
|
|||||||||||||||||||
|
Unamortized
discount
|
(1
|
)
|
0
|
0
|
0
|
0
|
(1
|
)
|
||||||||||||||||||||||||||||||||
|
Discount
designated as credit reserve
|
0
|
0.33
|
%
|
0
|
0
|
(3
|
)
|
0.37
|
%
|
0
|
(3
|
)
|
0.36
|
%
|
||||||||||||||||||||||||||
|
Unrealized
gains (losses)
|
|
0
|
0
|
-
|
0
|
-
|
0
|
-
|
0
|
-
|
0
|
|||||||||||||||||||||||||||||
|
Market
value
|
$
|
-
|
$
|
-
|
$
|
-
|
$
|
-
|
$
|
-
|
$
|
-
|
||||||||||||||||||||||||||||
|
|
||||||||||||||||||||||||||||||||||||||||
|
Overall
credit
protection to BB CES
|
1.92
|
%
|
-
|
-
|
2.57
|
%
|
-
|
2.47
|
%
|
|||||||||||||||||||||||||||||||
|
|
||||||||||||||||||||||||||||||||||||||||
|
B
|
|
|||||||||||||||||||||||||||||||||||||||
|
Face
|
$
|
-
|
-
|
$
|
2
|
0.94
|
%
|
$
|
16
|
1.34
|
%
|
$
|
39
|
0.54
|
%
|
$
|
-
|
-
|
$
|
57
|
0.67
|
%
|
||||||||||||||||||
|
Unamortized
discount
|
0
|
(1
|
)
|
0
|
1
|
0
|
0
|
|||||||||||||||||||||||||||||||||
|
Discount
designated as credit reserve
|
0
|
-
|
(1
|
)
|
0.39
|
%
|
(16
|
)
|
1.27
|
%
|
(39
|
)
|
0.54
|
%
|
0
|
-
|
(56
|
)
|
0.64
|
%
|
||||||||||||||||||||
|
Unrealized
gains (losses)
|
|
0
|
0
|
0
|
1
|
0
|
1
|
|||||||||||||||||||||||||||||||||
|
Market
value
|
$
|
-
|
$
|
-
|
$
|
-
|
$
|
2
|
$
|
-
|
$
|
2
|
||||||||||||||||||||||||||||
|
|
||||||||||||||||||||||||||||||||||||||||
|
Overall
credit
protection to B CES
|
-
|
2.28
|
%
|
1.40
|
%
|
1.44
|
%
|
-
|
1.45
|
%
|
||||||||||||||||||||||||||||||
|
|
||||||||||||||||||||||||||||||||||||||||
|
Unrated
|
||||||||||||||||||||||||||||||||||||||||
|
Face
|
$
|
20
|
0.60
|
%
|
$
|
38
|
0.63
|
%
|
$
|
40
|
1.11
|
%
|
$
|
58
|
0.67
|
%
|
$
|
-
|
-
|
$
|
156
|
0.72
|
%
|
|||||||||||||||||
|
Unamortized
discount
|
(3
|
)
|
1
|
0
|
1
|
0
|
(1
|
)
|
||||||||||||||||||||||||||||||||
|
Discount
designated as credit reserve
|
(16
|
)
|
0.48
|
%
|
(34
|
)
|
0.57
|
%
|
(39
|
)
|
1.07
|
%
|
(58
|
)
|
0.67
|
%
|
0
|
-
|
(147
|
)
|
0.68
|
%
|
||||||||||||||||||
|
Unrealized
(losses) gains
|
0
|
(1
|
)
|
0
|
0
|
0
|
(1
|
)
|
||||||||||||||||||||||||||||||||
|
Market
value
|
$
|
1
|
$
|
4
|
$
|
1
|
$
|
1
|
$
|
-
|
$
|
7
|
||||||||||||||||||||||||||||
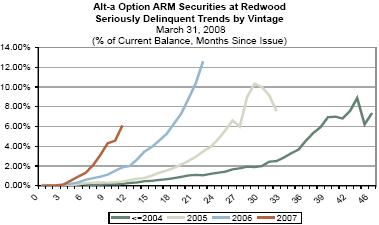
| ► |
Please
see
page 32 for an explanation of the table and chart
above.
|
|
THE
REDWOOD
REVIEW 1ST QUARTER 2008
|
37
|
|
|
|
|
|
RESIDENTIAL
REAL ESTATE SECURITIES
|
| ► |
Some
poorly
performing pools of loans underlying
some of our securities are
significantly increasing the aggregate
delinquencies. The amount of losses
that an alt-a security can absorb is
limited to the principal face amount
of that security. Since each pool of
loans is independent, high losses
from a particular pool will have no impact
on the other pools of loans
underlying other securities in our portfolio,
but could have a significant
impact on the aggregate delinquencies
shown in our
analysis.
|
| ► |
Prepayment
speeds for alt-a CES continued to decline in
the first quarter, as shown
in the following chart:
|
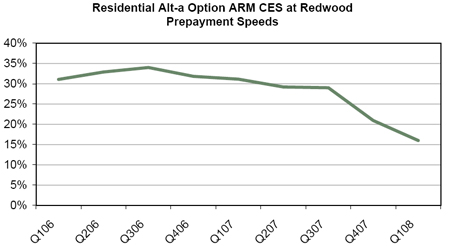
| ► |
Below
is a
table that details the characteristics
of the underlying alt-a loans that
we credit
enhance.
|
|
Residential
Alt-A CES at Redwood
|
||||
|
Underlying
Loan Characteristics
|
||||
|
as
of March
31, 2008
|
||||
|
Number
of
loans
|
44,860
|
Wtd
avg
FICO
|
705
|
|
|
Total
loan
face ($ in millions)
|
17,658
|
FICO:
<=
620
|
1%
|
|
|
Average
loan
size ($ in 1000's)
|
$394
|
FICO:
621 -
660
|
15%
|
|
|
|
FICO:
661 -
700
|
32%
|
||
|
Southern
CA
|
31%
|
FICO:
701 -
740
|
27%
|
|
|
Northern
CA
|
21%
|
FICO:
>
740
|
24%
|
|
|
Florida
|
11%
|
Unknown
|
1%
|
|
|
New
York
|
3%
|
|
||
|
Georgia
|
1%
|
Conforming
at
origination %
|
43%
|
|
|
New
Jersey
|
3%
|
>
$1
MM
%
|
16%
|
|
|
Other
states
|
30%
|
|
|
|
|
|
2nd
home
%
|
7%
|
||
|
2008
origination
|
0%
|
Investment
home %
|
11%
|
|
|
2007
origination
|
24%
|
|
|
|
|
2006
origination
|
24%
|
Purchase
|
35%
|
|
|
2005
origination
|
29%
|
Cash
out
refi
|
43%
|
|
|
2004
origination and earlier
|
23%
|
Rate-term
refi
|
22%
|
|
|
|
|
|
||
|
Wtd
avg
original LTV
|
78%
|
Full
doc
|
15%
|
|
|
Original
LTV:
0 - 50
|
3%
|
No
doc
|
1%
|
|
|
Original
LTV:
50 - 60
|
5%
|
Other
(limited, etc)
|
75%
|
|
|
Original
LTV:
60 - 70
|
16%
|
Unknown/not
categorized
|
9%
|
|
|
Original
LTV:
70 - 80
|
64%
|
|
|
|
|
Original
LTV:
80 - 90
|
9%
|
2-4
family
|
5%
|
|
|
Original
LTV:
90 - 100
|
3%
|
Condo
|
11%
|
|
|
|
Single
family
|
84%
|
||
|
38
|
THE
REDWOOD
REVIEW 1ST QUARTER 2008
|
|
|
|
|
|
|
|
COMMERCIAL
REAL ESTATE
SECURITIES
|
| ► |
Our
commercial securities portfolio declined
by $47 million (or 30%) from $147
million to $100 million in the first quarter
due to negative market value
changes. We did not purchase any commercial
securities in the first
quarter of 2008, or during the last three
quarters. We are carefully
monitoring developments and trends in commercial
real estate and
positioning ourselves to expand our commercial
business.
|
| ► |
The
commercial securitization market remained
largely inactive during the
first quarter, reflecting a substantial reduction
in liquidity and a
negative investor sentiment. Yields on fixed
rate AAA-rated CMBS continued
to rise through March, forcing issuers to
raise loan interest rates
offered to borrowers. A steady decline in
origination volume resulted in
new CMBS of less than $5 billion in the first
quarter of 2008, compared to
$61 billion in the first quarter of 2007.
|
| ► |
Financing
costs for property acquisitions have increased,
resulting in higher
capitalization rates and declining property
values. Stricter underwriting
standards and fewer refinance alternatives
will likely result in more
extensions and defaults on maturing loans.
On the positive side, our
commercial CES is primarily backed by longer
term fixed-rate loans, with
few loans scheduled to mature in the near
term.
|
| ► |
The
credit
performance of our commercial securities
generally remained stable during
the first quarter, but economic headwinds
lie ahead for borrowers and
corporate tenants. We experienced some deterioration
in expected cash
flows on commercial CES, as losses on certain
loans in 2006 and 2007
vintage securities are likely to occur sooner
than we originally expected.
|
| ► |
According
to
Fitch, serious delinquencies (60+ days) for
$562 billion of loans backing
rated securitizations in the U.S. increased
to 0.33% in March from a
record low of 0.27% in January. We expect
further increases in delinquency
levels throughout the year. Rating agency
downgrades outpaced upgrades in
February 2008 for the first time since February
2003, with 63 bonds
downgraded and 53 bonds upgraded. We believe
negative ratings actions will
continue throughout 2008 as the rating agencies
reassess collateral
performance for newer vintages.
|
|
THE
REDWOOD
REVIEW 1ST QUARTER 2008
|
39
|
|
|
|
|
|
COMMERCIAL REAL
ESTATE SECURITIES
|
| ► |
Our
commercial
securities portfolio consists of CES investments
that we fund with equity.
The types of loans backing these securities
are typically fixed-rate with
10-year average lives. The following table
presents our commercial
securities portfolio by credit rating and vintage.
The vintage shown is
the year the securitization was completed and
may include commercial real
estate loans originated in an earlier year.
|
|
Commercial
Securities at Redwood
|
|||||||||||||||||||
|
Rating
& Vintage
|
|||||||||||||||||||
|
March
31, 2008
|
|||||||||||||||||||
|
(by
market value in $ millions)
|
|||||||||||||||||||
|
|
<=
2004
|
2005
|
2006
|
2007
|
2008
|
Total
|
|||||||||||||
|
BB+
|
$
|
2
|
$
|
-
|
$
|
1
|
$
|
2
|
$
|
-
|
$
|
5
|
|||||||
|
BB
|
2
|
-
|
2
|
-
|
-
|
4
|
|||||||||||||
|
BB-
|
1
|
-
|
3
|
1
|
-
|
5
|
|||||||||||||
|
B+
|
-
|
-
|
3
|
2
|
-
|
5
|
|||||||||||||
|
B
|
-
|
-
|
1
|
1
|
-
|
2
|
|||||||||||||
|
B-
|
-
|
-
|
3
|
3
|
-
|
6
|
|||||||||||||
|
NR
|
11
|
21
|
35
|
6
|
-
|
73
|
|||||||||||||
|
Total
CES
|
$
|
16
|
$
|
21
|
$
|
48
|
$
|
15
|
$
|
-
|
$
|
100
|
|||||||
| ► | Total interest income generated by our commercial securities was $5 million for the first quarter, which resulted in an annualized yield on our average amortized cost of 10.9%. |
| ► |
The
overall
credit performance
of commercial
securities
portfolio weakened
slightly
during the
first quarter.
Total serious
delinquencies
(60 days+)
were $227
million, or
0.42% of the
$55 billion
of commercial
loans that
we credit
enhance, an
increase from
0.30% of the
current balance
at December
31,
2007. Included
in these delinquencies
are $129 million
of loans contained
within securities
with a cumulative
fair value
of $9
million.
|
| ► |
Principal
credit
losses
on
our
commercial
CES
of
$38,000
during
the
quarter
were
charged
against
our
credit
reserve.
For
tax
purposes,
realized
losses
on
commercial
securities
were
$14,000
in
the
first
quarter.
This
deduction
is
less
than
the
principal
value
of
credit
losses
incurred
on
the
underlying
loans,
as
we
own
our
commercial
CES
at
a
tax
basis
that
is
substantially
less
than
par
value.
|
| ► |
Our
GAAP
credit
reserve
for
commercial
CES
was
$378
million
($11.56
per
outstanding
share)
at
March
31,
2008,
an
increase
of
$60
million
for
the
quarter
due
to
the
reassessment
of
future
credit
losses
on
certain
securities.
|
|
40
|
THE
REDWOOD
REVIEW 1ST QUARTER 2008
|
|
|
|
|
|
|
|
COMMERCIAL
REAL ESTATE
SECURITIES
|
| ► |
When
assessing commercial credit reserves,
it is important to consider that
fixed rate commercial loans do not usually
prepay like residential loans
due to various early refinancing disincentives
for borrowers. These loans
typically perform very well in their
early stages, while experiencing a
greater risk of default near maturity
when borrowers are forced to obtain
new financing. Because of this dynamic,
we maintain our initial credit
reserve levels on commercial CES until
we are confident that late-term
defaults are highly unlikely. This leads
to reported GAAP yields in the
early years that may not accurately reflect
the economic returns that will
eventually be realized over the life
of these investments.
|
| ► |
The
summary-level information below presents
weighted-average credit reserve
balances by principal value, designated
by loan vintage and credit rating.
Please see page 32 for an explanation of the table and
chart
below.
|
|
Credit
Reserve Analysis
- Commercial CES
at Redwood
|
||||||||||||||||||||||||||||||||||||||||
|
By
current rating, by
vintage
|
||||||||||||||||||||||||||||||||||||||||
|
March
31, 2008
|
||||||||||||||||||||||||||||||||||||||||
|
($
in millions)
|
||||||||||||||||||||||||||||||||||||||||
|
|
||||||||||||||||||||||||||||||||||||||||
|
|
|
|
|
<=2004
|
|
2005
|
|
2006
|
|
2007
|
|
2008
|
|
Total
|
|
|||||||||||||||||||||||||
|
|
|
Amount
|
%
of loans
|
Amount
|
%
of loans
|
Amount
|
%
of loans
|
Amount
|
%
of loans
|
Amount
|
%
of loans
|
Amount
|
%
of loans
|
|||||||||||||||||||||||||||
|
BB
|
||||||||||||||||||||||||||||||||||||||||
|
Face
|
$
|
9
|
0.09
|
%
|
$
|
-
|
-
|
$
|
23
|
0.13
|
%
|
$
|
15
|
0.11
|
%
|
$
|
-
|
-
|
$
|
47
|
0.11
|
%
|
||||||||||||||||||
|
Unamortized
discount
|
(1
|
)
|
0
|
(17
|
)
|
(12
|
)
|
0
|
(30
|
)
|
||||||||||||||||||||||||||||||
|
Discount
designated as credit
reserve
|
0
|
-
|
0
|
-
|
0
|
-
|
0
|
-
|
0
|
-
|
0
|
0.00
|
%
|
|||||||||||||||||||||||||||
|
Unrealized
gains (losses)
|
|
(3
|
)
|
0
|
0
|
0
|
0
|
(3
|
)
|
|||||||||||||||||||||||||||||||
|
Market
value
|
$
|
5
|
$
|
-
|
$
|
6
|
$
|
3
|
$
|
-
|
$
|
14
|
||||||||||||||||||||||||||||
|
|
||||||||||||||||||||||||||||||||||||||||
|
Overall
credit
protection to BB
CES
|
3.37
|
%
|
-
|
2.14
|
%
|
2.00
|
%
|
-
|
2.36
|
%
|
||||||||||||||||||||||||||||||
|
|
||||||||||||||||||||||||||||||||||||||||
|
B
|
|
|||||||||||||||||||||||||||||||||||||||
|
Face
|
$
|
-
|
-
|
$
|
-
|
-
|
$
|
34
|
0.17
|
%
|
$
|
27
|
0.19
|
%
|
$
|
-
|
-
|
$
|
61
|
0.17
|
%
|
|||||||||||||||||||
|
Unamortized
discount
|
0
|
0
|
(27
|
)
|
(22
|
)
|
0
|
(49
|
)
|
|||||||||||||||||||||||||||||||
|
Discount
designated as credit
reserve
|
0
|
-
|
0
|
-
|
0
|
0.00
|
%
|
0
|
0.00
|
%
|
0
|
-
|
0
|
0.00
|
%
|
|||||||||||||||||||||||||
|
Unrealized
gains (losses)
|
|
0
|
0
|
0
|
1
|
0
|
1
|
|||||||||||||||||||||||||||||||||
|
Market
value
|
$
|
-
|
$
|
-
|
$
|
7
|
$
|
6
|
$
|
-
|
$
|
13
|
||||||||||||||||||||||||||||
|
|
||||||||||||||||||||||||||||||||||||||||
|
Overall
credit
protection to B CES
|
-
|
-
|
1.42
|
%
|
1.27
|
%
|
-
|
1.36
|
%
|
|||||||||||||||||||||||||||||||
|
|
||||||||||||||||||||||||||||||||||||||||
|
Unrated
|
|
|||||||||||||||||||||||||||||||||||||||
|
Face
|
$
|
49
|
0.58
|
%
|
$
|
124
|
0.61
|
%
|
$
|
204
|
1.10
|
%
|
$
|
37
|
1.01
|
%
|
$
|
-
|
-
|
$
|
414
|
0.81
|
%
|
|||||||||||||||||
|
Unamortized
discount
|
(2
|
)
|
4
|
34
|
6
|
0
|
42
|
|||||||||||||||||||||||||||||||||
|
Discount
designated as credit
reserve
|
(36
|
)
|
0.44
|
%
|
(102
|
)
|
0.50
|
%
|
(203
|
)
|
1.10
|
%
|
(37
|
)
|
1.01
|
%
|
0
|
-
|
(378
|
)
|
0.75
|
%
|
||||||||||||||||||
|
Unrealized
(losses) gains
|
0
|
(6
|
)
|
0
|
0
|
0
|
(6
|
)
|
||||||||||||||||||||||||||||||||
|
Market
value
|
$
|
11
|
$
|
20
|
$
|
35
|
$
|
6
|
$
|
-
|
$
|
72
|
||||||||||||||||||||||||||||
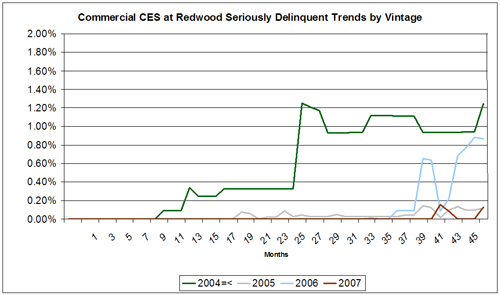
| ► |
As
noted
earlier, a few poorly performing loans
are significantly increasing the
aggregate delinquencies in our
portfolio.
|
|
THE
REDWOOD
REVIEW 1ST QUARTER 2008
|
41
|
|
|
|
|
|
CDO
SECURITIES
|
| ► |
We
did not
acquire any CDO securities for Redwood
in the first quarter. At the end of
the quarter, our CDO portfolio totaled
$15 million after we recorded $6
million of impairments in the quarter.
|
| ► |
Total
interest
income
generated
by
CDO
securities
was
$1
million
for
the
first
quarter
and
annualized
interest
income
over
our
average
amortized
cost
was 15%.
|
| ► |
New
issuance
and
secondary
market
trading
activity
was
virtually
nonexistent
during
the
quarter
for
asset-backed
securities
CDOs.
As
a
result,
market
pricing
transparency
for
CDOs
is
extremely
poor,
making
fair
values
for
our
CDO
portfolio
difficult
to
determine.
|
|
42
|
THE
REDWOOD
REVIEW 1ST QUARTER 2008
|
|
|
|
|
|
|
|
INVESTMENTS
IN SEQUOIA
|
| ► |
As
of March
31, 2008, we had 38
Sequoia
transactions outstanding.
|
| ► |
Due
to
the
turbulence
in
the
mortgage
markets
and
concerns
over
credit
performance,
AAA
buyers
are
now
requiring
a
much
higher
yield
to
compensate
for
actual
or
perceived
risk.
If
we
were
to
buy
loans
and
securitize
them
at
current
AAA
price
levels,
the
transaction
would
result
in
a
significant
loss.
Consequently,
since
July
2007,
we
have
not
acquired
loans
and
have
not
completed
new
Sequoia
securitizations.
We
do
believe
the
prime
non-agency
securitization
market
will
likely
be
one
of
the
first
structured
markets
to
return;
however,
until
the
market
stabilizes
and
the
AAA
bid
improves,
we
do
not
anticipate
completing
any
new
Sequoia
transactions.
|
| ► |
The
GAAP
carrying
value
of
Redwood’s
investments
in
Sequoia
is
$146
million
at
March
31,
2008.
This
is
reflected
on
our
balance
sheet
as
the
difference
between
residential
loans
of
$6.8
billion
and
ABS
issued
of
$6.6
billion.
Both
the
loans
and
ABS
issued
are
carried
at
their
cost
basis.
|
| ► |
Our
estimated
fair
value
of
Sequoia
securities
that
Redwood
owns
at
March
31,
2008
was
$92
million.
This
consists
of
$67
million
of
IOs,
$19
million
of
CES,
and
$6
million
of
IGS.
We
used
the
same
valuation
process
to
value
the
Sequoia
securities
as
we
did
for
third
party
securities
(as
described
on
page
27).
Our
IOs
are
all
rated
AAA,
the
IGS
we
own
are
mostly
AA-rated,
and
the
CES
are
rated
BB,
B,
and
unrated.
|
|
THE
REDWOOD
REVIEW 1ST QUARTER 2008
|
43
|
|
|
|
|
|
INVESTMENTS
IN SEQUOIA
|
| ► |
The
primary
difference between our GAAP carrying value
and the fair value of our
investments in Sequoia is that for several
years the loan premium
amortization expenses as calculated under
GAAP have not kept pace with
prepayments. For a portion of these loans,
our GAAP amortization method is
linked more closely to short-term interest
rates. As short-term interest
rates decline, which they did during the
quarter, we expect premium
amortization for this portion of the loan
portfolio to increase. Loan
premium amortization expenses, a component
of interest income, was $8
million in the first quarter. We ended
the quarter with a $6.8 billion
carrying value of loans and a principal
loan balance of $6.7 billion for
an average basis of 100.81%.
|
| ► |
Cash
generated by our investments
in Sequoia during this
quarter totaled $23
million.
|
| ► |
Net
interest
income
for
Sequoia
was
$4
million
in
the
first
quarter.
|
| ► |
Seriously
delinquent
loans
increased
from
$68
million
to
$84
million
in
the
first
quarter,
an
increase
from
0.96%
to
1.25%
of
current
balances.
The
largest
increases
in
delinquencies
were
from
loans
originated
in
2006
and
2007
as
displayed
in
the
chart
below.
We
expect
delinquencies
on
residential
loans
to
continue
to
increase.
|
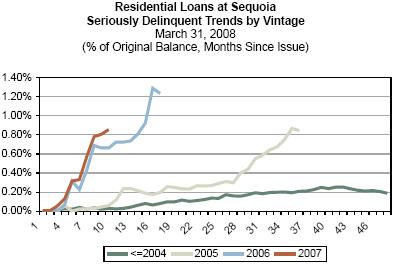
| ► |
At
March 31,
2008, our loan loss reserve was $24 million,
or 0.36% of the current loan
balance, an increase of $6 million in the
quarter. Our credit provision
for loans was $8 million in the first quarter
of 2008, compared to $5
million in the fourth quarter of 2007.
The increase in the credit
provision was attributable to higher delinquencies.
We had net charge-offs
of $2 million in each of the first quarter
of 2008 and the fourth quarter
of 2007.
|
| ► |
As
a result
of rising delinquencies
and concerns about future
performance, certain
of
the ABS issued by Sequoia
have been downgraded
by credit rating agencies.
Specifically, ABS issued
by two Sequoia entities
in 2006 and 2007 were
downgraded and two are on negative watch.
Redwood’s investment in
these affected Sequoia
entities totals $6
million.
|
|
44
|
THE
REDWOOD
REVIEW 1ST QUARTER 2008
|
|
|
|
|
|
|
|
INVESTMENTS
IN SEQUOIA
|
| ► |
Unlike
our
investments in Acacia, our investments
in Sequoia are not subject to cash
flow disruptions due to rating downgrades.
However, many of our
investments represent the first,
second, and third loss securities
and as
such will absorb the initial losses
in these pools of residential loans.
|
| ► |
ARM
loans
held by Sequoia entities,
representing 67%
of the aggregate
loan
portfolio, are indexed
to LIBOR. In the
first quarter, prepayment
rates on
these loans declined
to 25% constant prepayment
rate (CPR) from the
fourth
quarter rate of 27%
CPR.
|
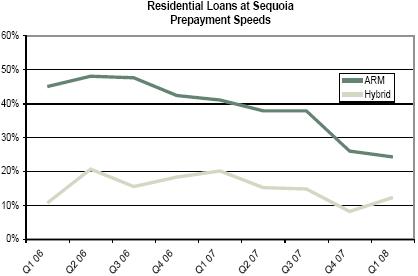
| ► |
Nearly
all of
the hybrid loans held by Sequoia entities,
representing 33% of the
aggregate loan portfolio, are still
in their initial fixed-rate period.
Prepayment rates on these loans increased
slightly to 12% CPR in the first
quarter from an average of 10% CPR
in the fourth quarter.
|
| ► |
For
tax
accounting, the Sequoia
securities we own are
treated like securities
we
purchase from third
parties. Due to tax
accounting rules, for
many years
we have not been able
to expense IO premiums
as quickly as the changes
to
their fair value. As
of March 31, 2008,
the tax basis of our
IOs was $55
million. In 2008, we
expect to recognize
little taxable income
from our
IOs. However, the basis
in these IOs will decline
over time as cash flows
are received and the
remainder of the basis
will be expensed at
the time
the IOs are
called.
|
|
THE
REDWOOD
REVIEW 1ST QUARTER 2008
|
45
|
|
|
|
|
|
INVESTMENTS
IN SEQUOIA
|
| ► |
We
hold call
option rights on all our Sequoia transactions.
The call option gives us
the right, but not the obligation, to retire
the ABS issued at par and
take possession of the underlying loans.
Currently we have 15 Sequoias
that are callable and one more will become
callable by the end of the
year. Given the current mortgage and securitization
markets, we do not
anticipate calling any Sequoias in the
near future, and thus, there will
likely be little economic or accounting
gains or losses during this
period.
|
| ► |
The
following
table summarizes the high-quality
characteristics of the
loans owned by
the Sequoia
entities.
|
|
Residential
Loans at Sequoia
|
||||
|
Underlying
Loan Characteristics
|
||||
|
as
of March
31, 2008
|
||||
|
Number
of
loans
|
19,801
|
Wtd
Avg
FICO
|
732
|
|
|
Total
loan
face ($ in millions)
|
6,703
|
FICO:
<=
620
|
2%
|
|
|
Average
loan
size ($ in 1000's)
|
$339
|
FICO:
621 -
660
|
5%
|
|
|
|
FICO:
661 -
700
|
19%
|
||
|
Southern
CA
|
15%
|
FICO:
701 -
740
|
26%
|
|
|
Northern
CA
|
11%
|
FICO:
>
741
|
48%
|
|
|
Florida
|
13%
|
|
||
|
New
York
|
6%
|
Conforming
at
origination %
|
34%
|
|
|
Georgia
|
4%
|
>
$1
MM
%
|
15%
|
|
|
New
Jersey
|
4%
|
|
||
|
Other
states
|
47%
|
2nd
home
%
|
11%
|
|
|
|
Investment
home %
|
3%
|
||
|
2008
origination
|
0%
|
|
||
|
2007
origination
|
13%
|
Purchase
|
36%
|
|
|
2006
origination
|
20%
|
Cash
out
refi
|
32%
|
|
|
2005
origination
|
5%
|
Rate-term
refi
|
30%
|
|
|
2004
origination and earlier
|
62%
|
Other
|
2%
|
|
|
|
|
|||
|
Wtd
Avg
Original LTV
|
69%
|
Hybrid
|
33%
|
|
|
Original
LTV:
0 - 50
|
15%
|
Adjustable
|
67%
|
|
|
Original
LTV:
50 - 60
|
11%
|
|
||
|
Original
LTV:
60. - 70
|
19%
|
Interest
only
|
95%
|
|
|
Original
LTV:
70 - 80
|
49%
|
Fully-amortizing
|
5%
|
|
|
Original
LTV:
80 - 90
|
2%
|
|
||
|
Original
LTV:
90 - 100
|
4%
|
|
||
|
46
|
THE
REDWOOD
REVIEW 1ST QUARTER 2008
|
|
|
|
|
|
|
|
INVESTMENTS
IN ACACIA
|
| ► |
As
of March
31, 2008, ten Acacia CDO entities were
outstanding. The market for new
issuance CDO ABS is effectively shut
down and will likely remain closed
for some time. We do not foresee issuing
new Acacia CDOs in
2008.
|
| ► |
During
the
first quarter, we
received investment
cash distributions
from Acacia
entities of $7 million.
We also received
$2 million in management
fees in
the first quarter,
the same amount we
received in the prior
quarter.
|
| ► |
We
invested
$7
million
in
the
first
quarter
to
acquire
a
portion
of
the
investment-grade
ABS
previously
issued
by
Acacia
entities.
We
invested
$4
million
to
acquire
a
portion
of
the
AA-rated
ABS
issued
in
2004
by
Acacia
6,
$1
million
to
acquire
a
portion
of
the
BBB-rated
ABS
issued
in
2005
by
Acacia
8,
and
$2
million
to
acquire
a
portion
of
the
A-
and
BBB-rated
ABS
issued
in
2005
by
Acacia
CRE1.
We
purchased
these
Acacia
ABS
issued
at
a
combined
weighted
average
of
21%
of
their
face
value.
The
collateral
performance
of
these
three
Acacia
entities
remains
strong.
Through
May
1,
2008,
the
underlying
collateral
owned
by
these
three
Acacia
entities
had
collectively
received
53
rating
upgrades
and
25
downgrades.
|
|
THE
REDWOOD
REVIEW 1ST QUARTER 2008
|
47
|
|
|
|
|
|
INVESTMENTS
IN ACACIA
|
| ► |
In
our
opinion, the best economic method of
assessing the value of our
investments in Acacia is to calculate
the net present value (NPV) of the
future expected cash flows of these investments.
In our calculation of
NPV, we use a 45% discount rate and adjust
for expected credit losses on
our equity investments and the receipt
of management fees. For the Acacia
ABS issued that we purchased from third
parties, we value those
investments at our cost. We believe our
valuation method is consistent
with how a potential buyer would likely
value our Acacia investments.
|
| ► |
Overall,
we
believe that
$49
million
is a
reasonable approximation
of the economic
value of our investments
in the
Acacia entities
at the end of the
quarter. We caution
that in this
environment it
is particularly
difficult to model
future cash flows
with
certainty given
the potential for
future rating agency
downgrades and
the
uncertainties around
credit performance.
Additionally, there
currently is
no active market
for CDO equity
and a limited market
for CDO ABS. Thus,
if
we were to sell
our investments
in Acacia, which
is not our intention,
we
would likely receive
substantially less
than the NPV calculated
in the
manner described
above.
|
| ► |
Our
estimate
of
the
economic
value
of
our
investment
in
the
Acacia
entities
of
$49
million
at
March
31,
2008
compares
to
an
estimate
of
$46
million
at
December
31,
2007.
This
increase
is
the
result
of
$7
million
in
new
investments
in
Acacias
6,
8,
and
CRE1,
and
a
$8
million
incraese
in
NPV
in
Acacias
5
–
8
and
CRE1
offset
by
$9
million
in
cash
distribution
and
a
$3
million
deterioration
in
NPVs
in
Acacia’s
9
–
12
and
OA1.
|
|
Gross
Expected Cash Flows and Net Present Values for Acacia
Entities
|
||||||||||||||||||||||||||||||||||
|
March
31, 2008
|
||||||||||||||||||||||||||||||||||
|
($
in millions)
|
||||||||||||||||||||||||||||||||||
|
|
||||||||||||||||||||||||||||||||||
|
|
|
Acacia
|
|
Acacia
|
|
Acacia
|
|
Acacia
|
|
Acacia
|
|
Acacia
|
|
Acacia
|
|
Acacia
|
|
Acacia
|
|
Acacia
|
|
Total
|
|
|||||||||||
|
|
|
5
|
|
6
|
|
7
|
|
8
|
|
CRE1
|
|
9
|
|
10
|
|
11
|
|
OA1
|
|
12
|
|
Acacia
|
|
|||||||||||
|
|
||||||||||||||||||||||||||||||||||
|
Gross
Expected Cash Flows (not discounted)
|
||||||||||||||||||||||||||||||||||
|
Management
fees
|
$
|
1
|
$
|
1
|
$
|
2
|
$
|
2
|
$
|
2
|
$
|
3
|
$
|
4
|
$
|
4
|
$
|
3
|
$
|
3
|
$
|
25
|
||||||||||||
|
ABS
retained
or acquired
|
22
|
49
|
12
|
42
|
38
|
-
|
-
|
-
|
-
|
-
|
$
|
163
|
||||||||||||||||||||||
|
Preference
shares
|
33
|
30
|
5
|
16
|
32
|
-
|
-
|
-
|
-
|
-
|
$
|
116
|
||||||||||||||||||||||
|
Total
Gross Expected Cash Flows
|
$
|
56
|
$
|
80
|
$
|
19
|
$
|
60
|
$
|
72
|
$
|
3
|
$
|
4
|
$
|
4
|
$
|
3
|
$
|
3
|
$
|
304
|
||||||||||||
|
Net
Present Values
|
||||||||||||||||||||||||||||||||||
|
Management
fees
|
$
|
-
|
$
|
-
|
$
|
1
|
$
|
-
|
$
|
1
|
$
|
1
|
$
|
1
|
$
|
1
|
$
|
1
|
$
|
1
|
$
|
7
|
||||||||||||
|
ABS
retained
or acquired
|
6
|
11
|
1
|
3
|
4
|
-
|
-
|
-
|
-
|
-
|
$
|
25
|
||||||||||||||||||||||
|
Preference
shares
|
4
|
3
|
3
|
3
|
4
|
-
|
-
|
-
|
-
|
-
|
$
|
17
|
||||||||||||||||||||||
|
Total
Net Present Value
|
$
|
10
|
$
|
14
|
$
|
5
|
$
|
6
|
$
|
9
|
$
|
1
|
$
|
1
|
$
|
1
|
$
|
1
|
$
|
1
|
$
|
49
|
||||||||||||
|
48
|
THE
REDWOOD
REVIEW 1ST QUARTER 2008
|
|
|
|
|
|
|
|
INVESTMENTS
IN ACACIA
|
| ► |
Our
net cash
investment in the Acacia entities
was $118 million at March 31, 2008.
The
following
tables show our cash investment,
cash distributions received, and
management fees for each of the
outstanding Acacia
entities.
|
|
Historical
Summary of Investment and Cash
Activity for Acacia
Entities
|
||||||||||||||||||||||||||||||||||
|
($
in millions)
|
||||||||||||||||||||||||||||||||||
|
|
||||||||||||||||||||||||||||||||||
|
|
Acacia
|
Acacia
|
Acacia
|
Acacia
|
Acacia
|
Acacia
|
Acacia
|
Acacia
|
Acacia
|
Acacia
|
Total
|
|||||||||||||||||||||||
|
|
5
|
6
|
7
|
8
|
CRE1
|
9
|
10
|
11
|
OA1
|
12
|
Acacia
|
|||||||||||||||||||||||
|
Investment:
|
||||||||||||||||||||||||||||||||||
|
Investment
as
of September 30, 2007
|
$
|
8
|
$
|
8
|
$
|
11
|
$
|
18
|
$
|
14
|
$
|
11
|
$
|
29
|
$
|
5
|
$
|
14
|
$
|
22
|
$
|
140
|
||||||||||||
|
Investment
3
months ended December 31, 2007
|
5
|
6
|
-
|
-
|
-
|
-
|
-
|
-
|
-
|
-
|
$
|
11
|
||||||||||||||||||||||
|
Investment
3
months ended March 31, 2008
|
4
|
1
|
2
|
$
|
7
|
|||||||||||||||||||||||||||||
|
Total
Investment
|
$
|
13
|
$
|
18
|
$
|
11
|
$
|
19
|
$
|
16
|
$
|
11
|
$
|
29
|
$
|
5
|
$
|
14
|
$
|
22
|
$
|
158
|
||||||||||||
|
Cash
Distributions Received:
|
||||||||||||||||||||||||||||||||||
|
2006
and
prior
|
$
|
(5
|
)
|
$
|
(4
|
)
|
$
|
(2
|
)
|
$
|
(3
|
)
|
$
|
(2
|
)
|
$
|
(1
|
)
|
$
|
-
|
$
|
-
|
$
|
-
|
$
|
-
|
$
|
(17
|
)
|
|||||
|
2007
*
|
(2
|
)
|
(3
|
)
|
(1
|
)
|
(2
|
)
|
-
|
(1
|
)
|
(3
|
)
|
(1
|
)
|
(2
|
)
|
(1
|
)
|
(16
|
)
|
|||||||||||||
|
3
months ended
March 31, 2008 **
|
(1
|
)
|
(1
|
)
|
(1
|
)
|
(1
|
)
|
(1
|
)
|
(1
|
)
|
(1
|
)
|
-
|
-
|
-
|
(7
|
)
|
|||||||||||||||
|
Total
Cash Received (ex. mgmt fees)
|
$
|
(8
|
)
|
$
|
(8
|
)
|
$
|
(4
|
)
|
$
|
(6
|
)
|
$
|
(3
|
)
|
$
|
(3
|
)
|
$
|
(4
|
)
|
$
|
(1
|
)
|
$
|
(2
|
)
|
$
|
(1
|
)
|
$
|
(40
|
)
|
|
|
Net
Cash Investment as of March 31,
2008
|
$
|
5
|
$
|
10
|
$
|
7
|
$
|
13
|
$
|
13
|
$
|
8
|
$
|
25
|
$
|
4
|
$
|
12
|
$
|
21
|
$
|
118
|
||||||||||||
|
*
Cash
distributions in 2007 included
$5 million in Q1, $5 miilion
in Q2, $5
miilion in Q3, and $7 million
in Q4.
|
|||||||||||
|
**
Includes a
one time distribution of $1 miilion
on Acacia 8.
|
|
Historical
Summary of Management Fees
|
||||||||||||||||||||||||||||||||||
|
($
in thousands)
|
||||||||||||||||||||||||||||||||||
|
|
||||||||||||||||||||||||||||||||||
|
|
Acacia
|
Acacia
|
Acacia
|
Acacia
|
Acacia
|
Acacia
|
Acacia
|
Acacia
|
Acacia
|
Acacia
|
Total
|
|||||||||||||||||||||||
|
|
5
|
6
|
7
|
8
|
CRE1
|
9
|
10
|
11
|
OA1
|
12
|
Acacia
|
|||||||||||||||||||||||
|
2006
and
prior
|
$
|
695
|
$
|
605
|
$
|
487
|
$
|
400
|
$
|
242
|
$
|
178
|
$
|
604
|
$
|
-
|
$
|
-
|
$
|
-
|
$
|
3,211
|
||||||||||||
|
2007
*
|
283
|
294
|
300
|
297
|
300
|
302
|
1,753
|
1,431
|
197
|
549
|
5,706
|
|||||||||||||||||||||||
|
3
months ended
March 31, 2008
|
65
|
72
|
75
|
74
|
75
|
75
|
386
|
435
|
126
|
187
|
1,570
|
|||||||||||||||||||||||
|
Cumulative
Management Fees
|
$
|
1,043
|
$
|
971
|
$
|
862
|
$
|
771
|
$
|
617
|
$
|
555
|
$
|
2,743
|
$
|
1,866
|
$
|
323
|
$
|
736
|
$
|
10,487
|
||||||||||||
|
*
Management
fees in 2007 included $0.9 million
in Q1, $1.5 miilion in Q2, $1.3
miilion
in Q3, and $2 million in Q4.
|
| ► |
Cash
distributions to the equity and
ABS issued of Acacia entities can
be
disrupted due to actual losses
or breaches of collateralization
and
interest coverage tests, which
are heavily impacted by negative
rating
agency actions. The severe rating downgrades
by
Moody's, S&P, and Fitch over the last several
quarters have placed
considerable negative
pressure on the collateralization
tests in Acacias 10, 11, OA1, and
12. In
fact, cash flows
on our
equity investment in Acacia 12
are now suspended; the equity cash
flows
have been diverted to pay
down the
most senior ABS issued. We expect
the cash flows on our equity investments
in Acacia 10, 11, and OA1 to be
suspended in the second quarter,
and we
expect the cash flow on our equity
investment in Acacia 9 to be suspended
within a year. We took these likely
events into consideration
when we calculated the gross cash
flows and NPV of our investments
in
Acacia.
|
|
THE
REDWOOD
REVIEW 1ST QUARTER 2008
|
49
|
|
|
|
|
|
INVESTMENTS
IN ACACIA
|
| ► |
The
following
table shows the Acacia consolidated income
statements for first quarter of
2008, fourth quarter of 2007, and first
quarter of 2007.
|
|
Acacia
Consolidated Income Statement
|
||||||||||||||||||||||
|
Three
Months Ended
|
||||||||||||||||||||||
|
($
in millions)
|
|
3/31/2008
|
12/31/2007
|
3/31/2007
|
||||||||
|
Interest
income (cash)
|
$
|
48
|
$
|
55
|
$
|
52
|
||||
|
Accretion
of
discount
|
-
|
7
|
8
|
|||||||
|
Total
interest
income
|
48
|
62
|
60
|
|||||||
|
Management
fees
|
1
|
2
|
1
|
|||||||
|
Interest
expense
|
(45
|
)
|
(56
|
)
|
(48
|
)
|
||||
|
Net
interest
income before MTM
|
4
|
8
|
13
|
|||||||
|
MTM
-
Assets
|
(837
|
)
|
(989
|
)
|
(3
|
)
|
||||
|
MTM
-
Liabilities
|
810
|
-
|
-
|
|||||||
|
Net
interest
income
|
(23
|
)
|
(981
|
)
|
10
|
|||||
|
Realized
(losses) gains on sales and calls,
net
|
-
|
(2
|
)
|
(1
|
)
|
|||||
|
Net
(Loss)
Income
|
$
|
(23
|
)
|
$
|
(983
|
)
|
$
|
9
|
||
| ► |
Cash
received
on assets within Acacia and cash paid
out on ABS issued declined due to
falling short-term interest rates.
|
| ► |
As
noted
earlier, under
FAS 159, there
is no longer an
accretion of discount
included in interest
income on Acacia
assets. In the
fourth quarter
of
2007, we recognized
$7 million of discount
accretion in our
interest
income. The amount
of discount accretion
we would have recorded
had we not
adopted FAS 159
is now reflected
as a component
in the change in
fair
value of the Acacia
assets.
|
| ► |
All
changes
in
the
fair
values
of
Acacia
assets
and
liabilities
flow
through
the
income
statement
subsequent
to
the
adoption
of
FAS
159.
As
more
fully
discussed
in
the
accounting
discussion
in
the
Appendix,
the
application
of
FAS
159
for
Acacia
assets
and liabilities
may
lead
to
significant
quarterly
MTM
earnings
volatility. In
prior
periods,
only
those
assets
deemed
permanently
impaired
under
GAAP
had
an
effect
on
Acacia’s
income.
|
| ► |
The
following
tables
show
the
individual
income
statement
contributions
of
each
of
the
Acacia
entities
for
the
three
months
ended
March
31,
2008.
|
|
Net
Interest
Income
Statement
for
Acacia
Entities
|
||||||||||||||||||||||||||||||||||
|
Three
Months
Ended
March
31,
2008
|
||||||||||||||||||||||||||||||||||
|
($
in
millions)
|
||||||||||||||||||||||||||||||||||
|
|
||||||||||||||||||||||||||||||||||
|
|
|
Acacia
|
|
Acacia
|
|
Acacia
|
|
Acacia
|
|
Acacia
|
|
Acacia
|
|
Acacia
|
|
Acacia
|
|
Acacia
|
|
Acacia
|
|
Acacia
Total
|
|
|||||||||||
|
|
|
5
|
|
6
|
|
7
|
|
8
|
|
CRE1
|
|
9
|
|
10
|
|
11
|
|
OA1
|
|
12
|
|
Consolidated
|
|
|||||||||||
|
Total
interest
income
|
$
|
2
|
$
|
4
|
$
|
4
|
$
|
4
|
$
|
4
|
$
|
4
|
$
|
7
|
$
|
6
|
$
|
6
|
$
|
6
|
$
|
47
|
||||||||||||
|
Management
fees
|
0.1
|
0.1
|
0.1
|
0.1
|
0.1
|
0.1
|
0.3
|
0.4
|
0.1
|
0.1
|
1.5
|
|||||||||||||||||||||||
|
Total
interest
expense
|
(2
|
)
|
(3
|
)
|
(3
|
)
|
(4
|
)
|
(4
|
)
|
(4
|
)
|
(7
|
)
|
(6
|
)
|
(6
|
)
|
(6
|
)
|
(45
|
)
|
||||||||||||
|
Net
interest
income
before
MVAs
|
0
|
1
|
1
|
0
|
0
|
0
|
0
|
0
|
0
|
0
|
4
|
|||||||||||||||||||||||
|
Market
valuation
adjustments,
net
|
1
|
23
|
3
|
(7
|
)
|
(34
|
)
|
19
|
(3
|
)
|
23
|
(37
|
)
|
(15
|
)
|
(27
|
)
|
|||||||||||||||||
|
Net
Interest
Income
(Loss)
|
$
|
1
|
$
|
24
|
$
|
4
|
$
|
(7
|
)
|
$
|
(34
|
)
|
$
|
19
|
$
|
(3
|
)
|
$
|
23
|
$
|
(37
|
)
|
$
|
(15
|
)
|
$
|
(23
|
)
|
||||||
| ► |
Acacias
5 –
8 and CRE1
continue to exceed our performance expectations.
In our most recent cash
flow modeling for these Acacia entities
at March 31, 2008, we did not
project future disruptions in cash flows.
|
| ► |
If
the cash
distributions on
our investments
in Acacia 9 –
11 and OA1 are
disrupted,
the net interest
income contribution
arising from our
investments in
these
entities will cease.
In anticipation
of the cash flows
being disrupted,
we
did not record
any net interest
income before market value
adjustments in
the first quarter
from these Acacia
entities.
|
|
50
|
THE
REDWOOD
REVIEW 1ST QUARTER 2008
|
|
|
|
|
|
|
|
INVESTMENTS
IN ACACIA
|
| ► |
The
following
table shows the individual balance
sheets of the Acacia entities
at March
31, 2008. It also reflects the
MTM impact of the most recent
quarter's
earnings in the retained earnings
section (whereas previously the
MTM was
in OCI) after the adoption of
FAS 159 on January 1, 2008.
|
|
Acacia
Balance Sheets
|
||||||||||||||||||||||||||||||||||
|
March
31, 2008
|
||||||||||||||||||||||||||||||||||
|
($
in millions)
|
||||||||||||||||||||||||||||||||||
|
|
||||||||||||||||||||||||||||||||||
|
|
Acacia
|
Acacia
|
Acacia
|
Acacia
|
Acacia
|
Acacia
|
Acacia
|
Acacia
|
Acacia
|
Acacia
|
|
|||||||||||||||||||||||
|
|
5
|
6
|
7
|
8
|
CRE1
|
9
|
10
|
11
|
OA1
|
12
|
Total
|
|||||||||||||||||||||||
|
Issue
Date
|
Jul-04
|
Nov-04
|
Mar-05
|
Jul-05
|
Dec-05
|
Mar-06
|
Aug-06
|
Feb-07
|
May-07
|
Jun-07
|
Acacia
|
|||||||||||||||||||||||
|
|
||||||||||||||||||||||||||||||||||
|
Real
estate
securities
|
||||||||||||||||||||||||||||||||||
|
Current
face
|
$
|
221
|
$
|
266
|
$
|
266
|
$
|
276
|
$
|
299
|
$
|
296
|
$
|
488
|
$
|
492
|
$
|
423
|
$
|
498
|
$
|
3,525
|
||||||||||||
|
Market
value
discount
|
(117
|
)
|
(130
|
)
|
(150
|
)
|
(194
|
)
|
(189
|
)
|
(219
|
)
|
(376
|
)
|
(372
|
)
|
(363
|
)
|
(382
|
)
|
(2,492
|
)
|
||||||||||||
|
Other
investments
|
-
|
-
|
-
|
-
|
-
|
-
|
-
|
-
|
79
|
-
|
79
|
|||||||||||||||||||||||
|
Securities
and
other investments
|
104
|
136
|
116
|
82
|
110
|
77
|
112
|
120
|
139
|
116
|
1,112
|
|||||||||||||||||||||||
|
Restricted
cash and other assets
|
11
|
15
|
39
|
26
|
8
|
12
|
15
|
9
|
(11
|
)
|
33
|
157
|
||||||||||||||||||||||
|
Total
Assets
|
$
|
115
|
$
|
151
|
$
|
155
|
$
|
108
|
$
|
118
|
$
|
89
|
$
|
127
|
$
|
129
|
$
|
128
|
$
|
149
|
$
|
1,269
|
||||||||||||
|
ABS
issued and
other liabilities
|
||||||||||||||||||||||||||||||||||
|
Current
face
|
200
|
229
|
281
|
248
|
248
|
278
|
427
|
477
|
458
|
494
|
3,340
|
|||||||||||||||||||||||
|
Market
value
discount
|
(97
|
)
|
(95
|
)
|
(138
|
)
|
(129
|
)
|
(149
|
)
|
(190
|
)
|
(332
|
)
|
(372
|
)
|
(369
|
)
|
(423
|
)
|
(2,294
|
)
|
||||||||||||
|
Other
liabilities
|
4
|
2
|
4
|
4
|
12
|
7
|
13
|
12
|
18
|
79
|
155
|
|||||||||||||||||||||||
|
Total
Liabilities
|
107
|
136
|
147
|
123
|
111
|
95
|
108
|
117
|
107
|
150
|
1,201
|
|||||||||||||||||||||||
|
Total
investment
|
13
|
18
|
11
|
19
|
16
|
11
|
29
|
5
|
14
|
22
|
158
|
|||||||||||||||||||||||
|
Retained
earnings
|
(4
|
)
|
(2
|
)
|
(3
|
)
|
(36
|
)
|
(3
|
)
|
(14
|
)
|
(1
|
)
|
14
|
14
|
(23
|
)
|
(58
|
)
|
||||||||||||||
|
Balance
sheet
MTM adjustments
|
(1
|
)
|
(1
|
)
|
-
|
2
|
(6
|
)
|
(3
|
)
|
(9
|
)
|
(7
|
)
|
(7
|
)
|
-
|
(32
|
)
|
|||||||||||||||
|
Total
Equity
|
8
|
15
|
8
|
(15
|
)
|
7
|
(6
|
)
|
19
|
12
|
21
|
(1
|
)
|
68
|
||||||||||||||||||||
|
Total
Liabilities and Equity
|
$
|
115
|
$
|
151
|
$
|
155
|
$
|
108
|
$
|
118
|
$
|
89
|
$
|
127
|
$
|
129
|
$
|
128
|
$
|
149
|
$
|
1,269
|
||||||||||||
| ► |
The
continued
divergence between our estimate
of economic value and GAAP carrying
values
even after the adoption of FAS
159 is highlighted by Acacia
8 and 10 in
the table above. Our calculation
of the economic value of Acacia
8 at
March 31, 2008 was $6 million
(see page 48). This compares
to a GAAP value
under FAS 159 of negative $15
million. In the worst case, the
value of our
investment cannot be worth less
than zero. On the other side
of the
spectrum, our calculation of
economic value in Acacia 10 is
$1 million
(which includes management fees),
while our net GAAP value under
FAS 159
is reported at $19 million.
|
|
THE
REDWOOD
REVIEW 1ST QUARTER 2008
|
51
|
|
|
|
|
|
INVESTMENTS
IN ACACIA
|
| ► |
The
following
tables detail the different collateral
types owned by Acacia entities and
respective rating actions through May
1, 2008. The cash flows generated by
the assets in each Acacia entity will
ultimately determine the cash flows
distributed to each ABS security (including
equity) issued by the Acacia
entity.
|
|
Securities
at Acacia Entities
|
||||||||||||||||||||||||||||||||||||||||||||||
|
Underlying
Collateral Type
|
||||||||||||||||||||||||||||||||||||||||||||||
|
March
31, 2008
|
||||||||||||||||||||||||||||||||||||||||||||||
|
(by
market value, $ in millions)
|
||||||||||||||||||||||||||||||||||||||||||||||
|
|
|
|
Acacia
|
Acacia
|
Acacia
|
Acacia
|
Acacia
|
Acacia
|
Acacia
|
Acacia
|
Acacia
|
Acacia
|
|
|||||||||||||||||||||||
|
|
5
|
6
|
7
|
8
|
CRE1
|
9
|
10
|
11
|
OA1
|
12
|
|
|||||||||||||||||||||||
|
Issue
Date
|
Jul-04
|
Nov-04
|
Mar-05
|
Jul-05
|
Dec-05
|
Mar-06
|
Aug-06
|
Feb-07
|
May-07
|
Jun-07
|
Total
|
|||||||||||||||||||||||
|
Resi
IGS
|
||||||||||||||||||||||||||||||||||
|
Prime
Sequoia
|
$
|
12
|
$
|
13
|
$
|
9
|
$
|
5
|
$
|
1
|
$
|
3
|
$
|
3
|
$
|
3
|
$
|
7
|
$
|
14
|
$
|
70
|
||||||||||||
|
Prime
Other
|
22
|
35
|
28
|
22
|
13
|
37
|
40
|
20
|
2
|
15
|
234
|
|||||||||||||||||||||||
|
Alt-a
|
13
|
9
|
5
|
7
|
1
|
6
|
19
|
50
|
43
|
52
|
205
|
|||||||||||||||||||||||
|
Subprime
|
26
|
53
|
45
|
4
|
-
|
6
|
1
|
6
|
1
|
8
|
150
|
|||||||||||||||||||||||
|
Resi
CES
|
||||||||||||||||||||||||||||||||||
|
Prime
Sequoia
|
2
|
3
|
3
|
5
|
-
|
2
|
3
|
-
|
-
|
-
|
18
|
|||||||||||||||||||||||
|
Prime
Other
|
11
|
7
|
4
|
11
|
-
|
7
|
24
|
8
|
-
|
5
|
77
|
|||||||||||||||||||||||
|
Alt-a
|
-
|
-
|
-
|
1
|
-
|
1
|
1
|
5
|
5
|
2
|
15
|
|||||||||||||||||||||||
|
Subprime
|
4
|
1
|
-
|
1
|
-
|
-
|
1
|
2
|
-
|
2
|
11
|
|||||||||||||||||||||||
|
COMM
IGS
|
6
|
6
|
5
|
8
|
32
|
2
|
-
|
-
|
-
|
3
|
62
|
|||||||||||||||||||||||
|
COMM
CES
|
1
|
3
|
9
|
13
|
46
|
7
|
14
|
12
|
-
|
8
|
113
|
|||||||||||||||||||||||
|
COMM
Loans
|
3
|
-
|
6
|
3
|
7
|
-
|
-
|
-
|
-
|
-
|
19
|
|||||||||||||||||||||||
|
CDO:
CMBS
|
2
|
3
|
1
|
-
|
10
|
5
|
5
|
12
|
2
|
4
|
44
|
|||||||||||||||||||||||
|
CDO:
RMBS
|
2
|
3
|
1
|
2
|
-
|
1
|
1
|
2
|
-
|
3
|
15
|
|||||||||||||||||||||||
|
GIC
|
-
|
-
|
-
|
-
|
-
|
-
|
-
|
-
|
79
|
-
|
79
|
|||||||||||||||||||||||
|
Totals
|
$
|
104
|
$
|
136
|
$
|
116
|
$
|
82
|
$
|
110
|
$
|
77
|
$
|
112
|
$
|
120
|
$
|
139
|
$
|
116
|
$
|
1,112
|
||||||||||||
|
Ratings
Upgrade/Downgrade Summary for Securities
at Acacia
Entities
|
|||||||||||||||||||||||||||||||
|
May
1, 2008
|
|||||||||||||||||||||||||||||||
|
|
|||||||||||||||||||||||||||||||
|
|
Acacia
|
Acacia
|
Acacia
|
Acacia
|
Acacia
|
Acacia
|
Acacia
|
Acacia
|
Acacia
|
Acacia
|
|||||||||||||||||||||
|
|
5
|
6
|
7
|
8
|
CRE1
|
9
|
10
|
11
|
OA1
|
12
|
|||||||||||||||||||||
|
Issuance
Date
|
Jul-04
|
|
|
Nov-04
|
|
|
Mar-05
|
|
|
Jul-05
|
|
|
Dec-05
|
|
|
Mar-06
|
|
|
Aug-06
|
|
|
Feb-07
|
|
|
May-07
|
|
|
Jun-07
|
|||
|
Upgrades
|
54
|
31
|
20
|
14
|
8
|
11
|
12
|
11
|
0
|
3
|
|||||||||||||||||||||
|
Downgrades
|
13
|
16
|
11
|
7
|
2
|
16
|
57
|
74
|
69
|
63
|
|||||||||||||||||||||
|
Positive
Watch
|
0
|
0
|
0
|
0
|
0
|
0
|
0
|
0
|
0
|
0
|
|||||||||||||||||||||
|
Negative
Watch
|
1
|
3
|
5
|
9
|
5
|
6
|
12
|
13
|
18
|
15
|
|||||||||||||||||||||
|
52
|
THE
REDWOOD
REVIEW 1ST QUARTER 2008
|
|

|
|
|
|
|
ACCOUNTING
DISCUSSION
|
| ► |
The
rules
regarding MTM accounting are
complex and may not clearly reflect
the
underlying economics. This accounting
discussion is intended to provide
investors with a better understanding
of the impact of MTM adjustments
on
our reported results.
|
| ► |
MTM
adjustments
can result
from changes
in fair
values
caused
either
by a
change
in expected
cash flows
(i.e. increased
credit
loss estimates
reduce
expected
cash flows),
or a change
in market
discount
rates (i.e.
the
market
requires
a greater
risk premium
and/or
interest
rates rise),
or a
combination
of both.
|
| ► |
All
changes
in
fair
value
for
securities,
derivatives,
or
liabilities
accounted
for
as
trading
instruments
or
under
the
fair
value
option
of
FAS
159
flow
through
the
income
statement.
These
adjustments
can
be
either
positive
or
negative
from
period
to
period.
|
| ► |
Our
CES
held
at
Redwood
and
the
real
estate
securities
held
by
the
Opportunity
Fund
are
accounted
for
as
available-for-sale
(AFS)
securities.
We
carry
AFS
securities
on
our
GAAP
balance
sheet
at
their
fair
value.
Positive
changes
in
the
fair
value
of
AFS
securities
from
period
to
period
are
always
accounted
for
as
increases
to
stockholders’
equity
and
do
not
flow
through
our
income
statement.
Accounting
for
negative
changes
in
the
fair
value
of
AFS
securities
from
period
to
period
requires
a
three-step
process
involving
a
combination
of
quantitative
and
judgmental
evaluations.
The
ultimate
purpose
of
this
process
is
to
determine
whether
negative
MTM
adjustments
represent
“other-than-temporary”
(permanent)
impairments,
which
flow
through
our
GAAP
income
statement,
or
represent
“temporary”
impairments,
which
are
recorded
as
a
reduction
of
stockholders’
equity
and
do
not
flow
through
our
income
statement.
|
| ► |
The
diagram
below
and
the
narrative
discussion
that
follows
address
the
three-step
process
for
evaluating
impairments
on
AFS
securities.
|
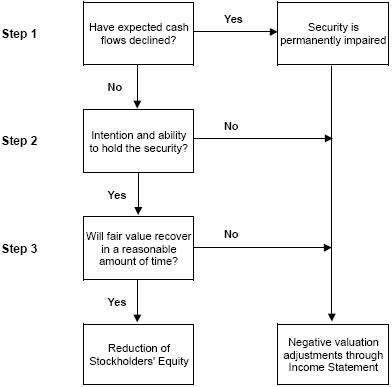
|
54
|
THE
REDWOOD
REVIEW 1ST QUARTER 2008
|
|
|
|
|
|
|
|
ACCOUNTING
DISCUSSION
|
| ► |
The
first
step is to determine whether
there has been an adverse
change in the
underlying cash flows generated
by the security. A security
is considered
permanently impaired even if the change
in projected cash flows
is
small relative to the resulting
MTM adjustment. It is difficult
to
separate with precision
how much of the change
in fair value is driven
by
changes in expected cash
flows versus changes in
market discount rates,
but during periods of market
illiquidity and uncertainty
(as we have
encountered since late
2007), the market discount
rate impact can be
significant.
|
| ► |
The
second
step
is
to
determine
whether
we
have
the
ability
and
intention
to
hold
the
security.
|
| ► |
The
third
step
requires
us
to
evaluate
whether
an
impaired
security
will
recover
in
value
within
a
reasonable
period
of
time.
This
step
is
very
subjective
and
time
consuming,
particularly
when
there
is
turmoil
and
uncertainty
in
the
capital
markets.
|
| ► |
AFS
securities
deemed
permanently
impaired
for
accounting
purposes
cannot
be
written
back
up
through
MTM
adjustments
in
our
income
statement.
This
does
not
mean
the
underlying
security
could
not
recover
in
value.
If
the
value
of
an
impaired
security
does
recover,
we
would
recognize
this
benefit
through
higher
interest
yields
over
time.
Therefore
some
of
the
securities
classified
as
permanently
impaired
during
the
first
quarter
of
2008
may
eventually
prove
to
have
significant
value
to
us.
|
| ► |
The
consolidated
Sequoia
assets
are
accounted
for
on
our
GAAP
balance
sheet
as
held-for-investment
and
are
carried
at
their
unpaid
principal
balances
adjusted
for
net
amortized
premiums
or
discounts
and
net
of
any
allowances
for
credit
losses.
The
consolidated
Sequoia
liabilities
are
accounted
for
at
their
unpaid
principal
balances
net
of
any
amortized
premiums
or
discounts.
|
| ► |
Prior
to
January
1,
2008,
we
accounted
for
the
consolidated
securities
held
at
Acacia
entities
(the
assets)
as
AFS
and
the
consolidated
ABS
issued
by
Acacia
entities
(the
liabilities)
at
cost.
In
our
opinion,
this
difference
in
accounting
treatment
led
to
a
significant
discrepancy
in
the
GAAP
carrying
value
for
our
investment
in
Acacia
entities
and
our
estimate
of
economic
value.
On
January
1,
2008,
we
adopted
a
new
accounting
standard,
FAS
159,
and
elected
to
fair
value
both
the
assets
and
liabilities
of
the
Acacia
entities.
In
accordance
with
FAS
159,
we
recorded
a
one-time,
cumulative-effect
adjustment
to
our
January
1,
2008
opening
balance
sheet
that
decreased
the
carrying
value
of
Acacia
liabilities
by
$1.5
billion
and
increased
equity.
This
new
standard
significantly
reduces
the
disparity
that
existed
between
GAAP
carrying
value
and
our
previous
estimates
of
economic
value.
|
| ► |
Under
FAS
159,
we
are
required
to
flow
through
our
quarterly
income
statement
any
net
change
in
the
fair
value
of
Acacia
assets
and
liabilities.
As
a
result
of
the
measurement
techniques
required
by
FAS
159,
we
still
expect
to
encounter
some
MTM
earnings
volatility
in
the
future
as
a
result
of
the
consolidation
of
Acacia
entities.
We
expect
this
volatility
to
be
significantly
less
than
we
encountered
in
prior
periods.
|
|
THE
REDWOOD
REVIEW 1ST QUARTER 2008
|
55
|
|
|
|
|
|
ACCOUNTING
DISCUSSION
|
| ► |
The
net GAAP
carrying value of our investments
in Acacia in our financial
statements is
derived by subtracting the
fair value of Acacia's liabilities
from the
fair value of Acacia’s assets. In theory, fair values
of Acacia’s assets
and liabilities should be reasonably
correlated as they are paired
within
the same legal structure ABS
issued by each Acacia entity
will be repaid
directly and solely from the
cash flows generated by the
assets owned by
that entity. However, at any
given moment, the capital markets
may use
different discount rates and
valuation parameters for Acacia’s collateral
assets relative to its ABS
issued. On March 31, 2008,
for instance, the
fair values of Acacia’s liabilities were, in our
view, depressed relative
to the paired collateral assets.
As a consequence of this market
condition, the derived net
GAAP carrying value of our
retained Acacia
investments was $68 million
at March 31, 2008. This value
is greater than
our $49 million estimate of
the fair value of our investments
in Acacia
based on the net present value
of expected cash
flows.
|
| ► |
As
a
consequence of adopting
FAS 159 as of January
1, 2008, we now also
flow
through our income
statements the relative
changes in the fair
values of
Acacia assets and
liabilities as measured
in their independent
markets.
During the first
quarter of 2008,
the fair value of
our assets and
derivatives declined
by $837 million and
the fair value of
our paired
liabilities declined
by $810 million,
for a net change
of a negative $27
million. In the first
quarter, the market
re-priced Acacia
assets downward
at a slightly faster
rate than the Acacia
liabilities.
|
|
56
|
THE
REDWOOD
REVIEW 1ST QUARTER 2008
|
|
|
|
|
|
|
|
GLOSSARY
|
|
THE
REDWOOD
REVIEW 1ST QUARTER 2008
|
57
|
|
|
|
|
|
GLOSSARY
|
|
58
|
THE
REDWOOD
REVIEW 1ST QUARTER 2008
|
|
|
|
|
|
|
|
GLOSSARY
|
|
THE
REDWOOD
REVIEW 1ST QUARTER 2008
|
59
|
|
|
|
|
|
GLOSSARY
|
|
60
|
THE
REDWOOD
REVIEW 1ST QUARTER 2008
|
|
|
|
|
|
|
|
GLOSSARY
|
|
THE
REDWOOD
REVIEW 1ST QUARTER 2008
|
61
|
|
|
|
|
|
GLOSSARY
|
|
62
|
THE
REDWOOD
REVIEW 1ST QUARTER 2008
|
|
|
|
|
|
|
|
GLOSSARY
|
|
THE
REDWOOD
REVIEW 1ST QUARTER 2008
|
63
|

|
|
Table
1: GAAP Earnings ($ in thousands, except per share
data)
|
66
|
|
Full
|
Full
|
|||||||||||||||||||||||||||||||||
|
2008
|
2007
|
2007
|
2007
|
2007
|
2006
|
2006
|
2006
|
2006
|
Year
|
Year
|
||||||||||||||||||||||||
|
Q1
|
Q4
|
Q3
|
Q2
|
Q1
|
Q4
|
Q3
|
Q2
|
Q1
|
2007
|
2006
|
||||||||||||||||||||||||
|
|
|
|||||||||||||||||||||||||||||||||
|
Interest
income
|
$169,885
|
$192,375
|
$205,748
|
$208,039
|
$207,906
|
$213,504
|
$217,504
|
$214,544
|
$224,795
|
$814,068
|
$870,347
|
|||||||||||||||||||||||
|
Net
securities
discount amortization income
|
10,864
|
18,869
|
20,514
|
23,849
|
20,268
|
18,665
|
17,842
|
13,234
|
13,245
|
83,500
|
62,986
|
|||||||||||||||||||||||
|
Other
real
estate investment interest income
|
2,092
|
1,353
|
1,275
|
669
|
2,465
|
-
|
-
|
-
|
-
|
5,762
|
-
|
|||||||||||||||||||||||
|
Non
real
estate investment interest income
|
732
|
984
|
1,143
|
464
|
-
|
-
|
-
|
-
|
-
|
2,591
|
-
|
|||||||||||||||||||||||
|
Net
loan
premium amortization expense
|
(7,509
|
)
|
(6,656
|
)
|
(8,349
|
)
|
(10,863
|
)
|
(11,705
|
)
|
(13,272
|
)
|
(11,232
|
)
|
(12,046
|
)
|
(11,982
|
)
|
(37,573
|
)
|
(48,532
|
)
|
||||||||||||
|
(Provision
for) reversal of credit reserve
|
(8,058
|
)
|
(4,972
|
)
|
(1,507
|
)
|
(2,500
|
)
|
(3,829
|
)
|
(1,506
|
)
|
(465
|
)
|
2,506
|
(176
|
)
|
(12,808
|
)
|
359
|
||||||||||||||
|
Total
GAAP
interest income
|
168,006
|
201,953
|
218,824
|
219,658
|
215,105
|
217,391
|
223,649
|
218,238
|
225,882
|
855,540
|
885,160
|
|||||||||||||||||||||||
|
Interest
expense on Redwood debt
|
(182
|
)
|
(377
|
)
|
(5,858
|
)
|
(22,700
|
)
|
(31,094
|
)
|
(16,520
|
)
|
(9,422
|
)
|
(1,822
|
)
|
(2,072
|
)
|
(60,029
|
)
|
(29,836
|
)
|
||||||||||||
|
ABS
interest
expense consolidated from trusts
|
(123,430
|
)
|
(147,799
|
)
|
(155,661
|
)
|
(140,512
|
)
|
(131,391
|
)
|
(152,043
|
)
|
(165,177
|
)
|
(171,659
|
)
|
(178,183
|
)
|
(575,363
|
)
|
(667,062
|
)
|
||||||||||||
|
ABS
issuance
expense amortization
|
(2,093
|
)
|
(4,644
|
)
|
(4,616
|
)
|
(5,681
|
)
|
(7,068
|
)
|
(7,897
|
)
|
(5,786
|
)
|
(6,079
|
)
|
(5,907
|
)
|
(22,009
|
)
|
(25,669
|
)
|
||||||||||||
|
ABS
interest
rate agreement income
|
(1,245
|
)
|
1,265
|
1,959
|
3,358
|
1,646
|
2,497
|
3,317
|
3,678
|
2,980
|
8,228
|
12,472
|
||||||||||||||||||||||
|
ABS
issuance
premium amortization income
|
2,183
|
1,930
|
2,096
|
2,294
|
1,869
|
1,529
|
2,395
|
2,363
|
2,527
|
8,189
|
8,814
|
|||||||||||||||||||||||
|
Total
consolidated ABS expense
|
(124,585
|
)
|
(149,248
|
)
|
(156,222
|
)
|
(140,541
|
)
|
(134,944
|
)
|
(155,914
|
)
|
(165,251
|
)
|
(171,697
|
)
|
(178,583
|
)
|
(580,955
|
)
|
(671,445
|
)
|
||||||||||||
|
Subordinated
notes interest expense
|
(2,533
|
)
|
(3,055
|
)
|
(3,150
|
)
|
(2,516
|
)
|
(2,057
|
)
|
(423
|
)
|
-
|
-
|
-
|
(10,778
|
)
|
(423
|
)
|
|||||||||||||||
|
GAAP
net
interest income before market valuation adjustments
|
40,706
|
49,273
|
53,594
|
53,901
|
47,010
|
44,534
|
48,976
|
44,719
|
45,227
|
203,778
|
183,456
|
|||||||||||||||||||||||
|
Market
valuation adjustments, net
|
(193,932
|
)
|
(1,118,989
|
)
|
(102,766
|
)
|
(29,430
|
)
|
(10,264
|
)
|
(1,404
|
)
|
(5,257
|
)
|
(2,995
|
)
|
(2,932
|
)
|
(1,261,449
|
)
|
(12,588
|
)
|
||||||||||||
|
Net
interest income
|
(153,226
|
)
|
(1,069,716
|
)
|
(49,172
|
)
|
24,471
|
36,746
|
43130
|
43,719
|
41724
|
42295
|
($1,057,671
|
)
|
$170,868
|
|||||||||||||||||||
|
Fixed
compensation expense
|
(5,674
|
)
|
(4,316
|
)
|
(4,560
|
)
|
(4,286
|
)
|
(4,616
|
)
|
(3,688
|
)
|
(3,437
|
)
|
(3,310
|
)
|
(3,437
|
)
|
(17,778
|
)
|
(13,872
|
)
|
||||||||||||
|
Variable
compensation expense
|
(1,857
|
)
|
(434
|
)
|
1,096
|
(198
|
)
|
(2,251
|
)
|
(1,666
|
)
|
(2,630
|
)
|
(1,900
|
)
|
(1,514
|
)
|
(1,787
|
)
|
(7,710
|
)
|
|||||||||||||
|
Equity
compensation expense
|
(3,306
|
)
|
(2,767
|
)
|
(2,593
|
)
|
(3,540
|
)
|
(3,349
|
)
|
(3,233
|
)
|
(2,579
|
)
|
(2,991
|
)
|
(2,694
|
)
|
(12,249
|
)
|
(11,497
|
)
|
||||||||||||
|
Severance
expense
|
-
|
(1,340
|
)
|
-
|
-
|
(2,380
|
)
|
-
|
-
|
-
|
-
|
(3,720
|
)
|
-
|
||||||||||||||||||||
|
Other
operating expense
|
(5,501
|
)
|
(7,337
|
)
|
(5,455
|
)
|
(4,670
|
)
|
(4,479
|
)
|
(4,732
|
)
|
(4,425
|
)
|
(5,149
|
)
|
(4,505
|
)
|
(21,941
|
)
|
(18,811
|
)
|
||||||||||||
|
Due
diligence
expenses
|
(10
|
)
|
(75
|
)
|
(220
|
)
|
(78
|
)
|
(707
|
)
|
(532
|
)
|
(384
|
)
|
(2,687
|
)
|
(432
|
)
|
(1,080
|
)
|
(4,035
|
)
|
||||||||||||
|
Total
GAAP
operating expenses
|
(16,348
|
)
|
(16,269
|
)
|
(11,732
|
)
|
(12,772
|
)
|
(17,782
|
)
|
(13,851
|
)
|
(13,455
|
)
|
(16,037
|
)
|
(12,582
|
)
|
(58,555
|
)
|
(55,925
|
)
|
||||||||||||
|
Realized
(losses) gains sales
|
(3
|
)
|
7,199
|
(1,460
|
)
|
1,428
|
303
|
5,308
|
4,968
|
8,241
|
1,062
|
7,470
|
19,579
|
|||||||||||||||||||||
|
Realized
gains
(losses) on calls
|
45
|
(126
|
)
|
3,284
|
1,310
|
843
|
1,511
|
722
|
747
|
0
|
5,311
|
2,980
|
||||||||||||||||||||||
|
Total
realized
gains, net
|
42
|
7,073
|
1,824
|
2,738
|
1,146
|
6,819
|
5,690
|
8,988
|
1,062
|
12,781
|
22,559
|
|||||||||||||||||||||||
|
Credit
(provision) for income taxes
|
(1,800
|
)
|
1,467
|
(1,837
|
)
|
(3,021
|
)
|
(1,801
|
)
|
(407
|
)
|
(3,538
|
)
|
(3,265
|
)
|
(2,760
|
)
|
(5,192
|
)
|
(9,970
|
)
|
|||||||||||||
|
Other
|
(255
|
)
|
-
|
-
|
-
|
-
|
-
|
-
|
-
|
-
|
-
|
-
|
||||||||||||||||||||||
|
GAAP
net (loss) income
|
($171,587
|
)
|
($1,077,445
|
)
|
($60,917
|
)
|
$11,416
|
$18,309
|
$35,691
|
$32,416
|
$31,410
|
$28,015
|
($1,108,637
|
)
|
$127,532
|
|||||||||||||||||||
|
Diluted
average shares
|
32,511
|
29,531
|
27,892
|
28,165
|
27,684
|
27,122
|
26,625
|
26,109
|
25,703
|
27,928
|
26,314
|
|||||||||||||||||||||||
|
GAAP
net (loss) income per share
|
($5.28
|
)
|
($36.49
|
)
|
($2.18
|
)
|
$0.41
|
$0.66
|
$1.32
|
$1.22
|
$1.20
|
$1.09
|
($39.70
|
)
|
$4.85
|
|||||||||||||||||||
|
THE
REDWOOD
REVIEW
1ST
QUARTER
2008
|
Table
1: GAAP
Earnings
|
|
|
|
Table
2: Core Earnings ($ in thousands, except per share
data)
|
|
|
Full
|
Full
|
|||||||||||||||||||||||||||||||||
|
2008
|
2007
|
2007
|
2007
|
2007
|
2006
|
2006
|
2006
|
2006
|
Year
|
Year
|
||||||||||||||||||||||||
|
Q1
|
Q4
|
Q3
|
Q2
|
Q1
|
Q4
|
Q3
|
Q2
|
Q1
|
2007
|
2006
|
||||||||||||||||||||||||
|
|
|
|||||||||||||||||||||||||||||||||
|
GAAP
net
(loss) income
|
$(171,587
|
)
|
$(1,077,445
|
)
|
$(60,917
|
)
|
$11,416
|
$18,309
|
$35,691
|
$32,416
|
$31,410
|
$28,015
|
$(1,108,637
|
)
|
$127,532
|
|||||||||||||||||||
|
Not
included
in core earnings
|
||||||||||||||||||||||||||||||||||
|
Severance
expense
|
-
|
(1,340
|
)
|
-
|
-
|
(2,380
|
)
|
-
|
-
|
-
|
-
|
(3,720
|
)
|
-
|
||||||||||||||||||||
|
Realized
(losses) gains on sales
|
(3
|
)
|
7,199
|
(1,460
|
)
|
1,428
|
303
|
5,308
|
4,968
|
8,241
|
1,062
|
7,470
|
19,579
|
|||||||||||||||||||||
|
Realized
gains
(losses) on calls
|
45
|
(126
|
)
|
3,284
|
1,310
|
843
|
1,511
|
722
|
747
|
0
|
5,311
|
2,980
|
||||||||||||||||||||||
|
Market
valuation adjustments, net
|
(193,932
|
)
|
(1,118,989
|
)
|
(102,766
|
)
|
(29,430
|
)
|
(10,264
|
)
|
(1,404
|
)
|
(5,257
|
)
|
(2,995
|
)
|
(2,932
|
)
|
(1,261,449
|
)
|
(12,588
|
)
|
||||||||||||
|
Total
GAAP /
core earnings differences
|
(193,890
|
)
|
(1,113,256
|
)
|
(100,942
|
)
|
(26,692
|
)
|
(11,498
|
)
|
5,415
|
433
|
5,993
|
(1,870
|
)
|
(1,252,388
|
)
|
9,971
|
||||||||||||||||
|
Core
earnings
|
$22,303
|
$35,811
|
$40,025
|
$38,108
|
$29,807
|
$30,276
|
$31,983
|
$25,417
|
$29,885
|
$143,751
|
$117,561
|
|||||||||||||||||||||||
|
Per
share
analysis
|
||||||||||||||||||||||||||||||||||
|
GAAP
net
(loss) income
|
($5.28
|
)
|
($36.49
|
)
|
$(2.18
|
)
|
$0.41
|
$0.66
|
$1.32
|
$1.22
|
$1.20
|
$1.09
|
$(39.70
|
)
|
$4.85
|
|||||||||||||||||||
|
Not
included
in core earnings
|
||||||||||||||||||||||||||||||||||
|
Severance
expense
|
-
|
(0.05
|
)
|
-
|
-
|
(0.09
|
)
|
-
|
-
|
-
|
-
|
(0.13
|
)
|
-
|
||||||||||||||||||||
|
Realized
(losses) gains on sales
|
-
|
0.25
|
(0.05
|
)
|
0.05
|
0.01
|
0.20
|
0.19
|
0.32
|
0.04
|
0.26
|
0.74
|
||||||||||||||||||||||
|
Realized
gains
(losses) on calls
|
-
|
-
|
0.13
|
0.05
|
0.03
|
0.05
|
0.03
|
0.03
|
-
|
0.19
|
0.11
|
|||||||||||||||||||||||
|
Market
valuation adjustments, net
|
(5.96
|
)
|
(37.90
|
)
|
(3.69
|
)
|
(1.04
|
)
|
(0.37
|
)
|
(0.05
|
)
|
(0.20
|
)
|
(0.11
|
)
|
(0.11
|
)
|
(45.17
|
)
|
(0.48
|
)
|
||||||||||||
|
GAAP
/ core
earnings differences per share
|
(5.96
|
)
|
(37.70
|
)
|
(3.61
|
)
|
(0.94
|
)
|
(0.42
|
)
|
0.20
|
0.02
|
0.23
|
(0.07
|
)
|
(44.85
|
)
|
0.38
|
||||||||||||||||
|
Core
earnings per share
|
$0.68
|
$1.21
|
$1.43
|
$1.35
|
$1.08
|
$1.12
|
$1.20
|
$0.97
|
$1.16
|
$5.16
|
$4.47
|
|||||||||||||||||||||||
|
THE
REDWOOD
REVIEW
1ST
QUARTER
2008
|
Table 2: Core
Earnings
|
67
|
|
|
Table
3: Taxable Income and GAAP / Tax
Differences
($
in thousands, except per share data)
|
68
|
|
Estimated
|
Estimated
|
Actual
|
Estimated
|
Actual
|
||||||||||||||||||||||||||||||
|
Full
|
Full
|
|||||||||||||||||||||||||||||||||
|
2008
|
2007
|
2007
|
2007
|
2007
|
2006
|
2006
|
2006
|
2006
|
Year
|
Year
|
||||||||||||||||||||||||
|
Q1
|
Q4
|
Q3
|
Q2
|
Q1
|
Q4
|
Q3
|
Q2
|
Q1
|
2007
|
2006
|
||||||||||||||||||||||||
|
|
|
|||||||||||||||||||||||||||||||||
|
GAAP
net
(loss) income
|
$(171,587
|
)
|
$(1,077,445
|
)
|
$(60,917
|
)
|
$11,416
|
$18,309
|
$35,691
|
$32,416
|
$31,410
|
$28,015
|
$(1,108,637
|
)
|
$127,532
|
|||||||||||||||||||
|
Difference
in taxable income calculations
|
||||||||||||||||||||||||||||||||||
|
Amortization
and credit losses
|
6,094
|
(14,330
|
)
|
10,426
|
10,298
|
10,417
|
13,740
|
12,558
|
12,779
|
4,939
|
16,811
|
44,016
|
||||||||||||||||||||||
|
Operating
expenses
|
1,491
|
9,409
|
(2,080
|
)
|
(2,921
|
)
|
(1,713
|
)
|
(12,079
|
)
|
2,545
|
(288
|
)
|
1,604
|
2,695
|
(8,218
|
)
|
|||||||||||||||||
|
Gross
realized
(gains) losses on calls and sales
|
(5,266
|
)
|
(5,089
|
)
|
(3,073
|
)
|
(4,735
|
)
|
2,100
|
(5,499
|
)
|
(1,141
|
)
|
(699
|
)
|
(613
|
)
|
(10,797
|
)
|
(7,952
|
)
|
|||||||||||||
|
Market
valuation adjustments, net
|
193,932
|
1,118,989
|
102,766
|
30,576
|
9,118
|
6,571
|
484
|
2,305
|
3,226
|
1,261,449
|
12,586
|
|||||||||||||||||||||||
|
(Credit)
provision for income taxes
|
1,158
|
(2,111
|
)
|
1,523
|
1,662
|
1,800
|
405
|
4,123
|
3,265
|
(703
|
)
|
2,874
|
7,090
|
|||||||||||||||||||||
|
Total
differences in GAAP and taxable income
|
197,409
|
1,106,868
|
109,562
|
34,880
|
21,722
|
3,138
|
18,569
|
17,362
|
8,453
|
1,273,032
|
47,522
|
|||||||||||||||||||||||
|
Taxable
income
|
$25,822
|
$29,423
|
$48,645
|
$46,296
|
$40,031
|
$38,829
|
$50,985
|
$48,772
|
$36,468
|
$164,395
|
$175,054
|
|||||||||||||||||||||||
|
REIT
taxable
income
|
$24,734
|
$32,028
|
$48,591
|
$45,233
|
$35,112
|
$41,555
|
$45,751
|
$45,040
|
$35,382
|
$160,964
|
$167,728
|
|||||||||||||||||||||||
|
Taxable
(loss)
income in taxable subsidiaries
|
1,088
|
(2,605
|
)
|
54
|
1,063
|
4,919
|
(2,727
|
)
|
5,234
|
3,732
|
1,086
|
3,431
|
7,325
|
|||||||||||||||||||||
|
Total
taxable
income
|
$25,822
|
$29,423
|
$48,645
|
$46,296
|
$40,031
|
$38,828
|
$50,985
|
$48,772
|
$36,468
|
$164,395
|
$175,053
|
|||||||||||||||||||||||
|
After-tax
|
||||||||||||||||||||||||||||||||||
|
Retained
REIT
taxable income
|
$1,207
|
$759
|
$2,675
|
$2,490
|
$1,933
|
$2,010
|
$2,500
|
$2,166
|
$1,313
|
$7,857
|
$7,989
|
|||||||||||||||||||||||
|
Retained
taxable (loss) income in taxable subsidiaries
|
633
|
(1,768
|
)
|
34
|
663
|
3,068
|
(1,175
|
)
|
3,156
|
2,032
|
556
|
1,997
|
4,569
|
|||||||||||||||||||||
|
Total
retained
taxable income
|
$1,841
|
$(1,008
|
)
|
$2,709
|
$3,153
|
$5,001
|
$835
|
$5,656
|
$4,198
|
$1,869
|
$9,855
|
$12,558
|
||||||||||||||||||||||
|
Shares
used
for taxable EPS calculation
|
|
|
32,710
|
|
|
32,385
|
|
|
27,986
|
|
|
27,816
|
|
|
27,129
|
|
|
26,733
|
|
|
26,053
|
|
|
25,668
|
|
|
25,382
|
|
|
28,392
|
|
|
25,934
|
|
|
REIT
taxable
income per share *
|
|
|
$0.76
|
|
|
$0.99
|
|
|
$1.74
|
|
|
$1.63
|
|
|
$1.29
|
|
|
$1.55
|
|
|
$1.76
|
|
|
$1.75
|
|
|
$1.39
|
|
|
$5.65
|
|
|
$6.45
|
|
|
Taxable
(loss)
income in taxable subsidiaries per share
|
$0.03
|
$(0.08
|
)
|
$0.00
|
$0.03
|
$0.19
|
$(0.10
|
)
|
$0.20
|
$0.16
|
$0.04
|
$0.14
|
$0.30
|
|||||||||||||||||||||
|
Total
taxable
income per share *
|
$0.79
|
$0.91
|
$1.74
|
$1.66
|
$1.48
|
$1.45
|
$1.96
|
$1.91
|
$1.44
|
$5.79
|
$6.75
|
|||||||||||||||||||||||
|
Total
retained
taxable (loss) income (after-tax)
|
$0.06
|
$(0.03
|
)
|
$0.10
|
$0.11
|
$0.18
|
$0.03
|
$0.22
|
$0.16
|
$0.07
|
$0.36
|
$0.48
|
||||||||||||||||||||||
|
THE
REDWOOD
REVIEW
1ST
QUARTER
2008
|
Table 3:
Taxable
Income and GAAP / Tax Differences
|
|
|
|
Table
4: Retention and Distribution of Taxable
Income
($
in thousands, except per share data)
|
|
|
Estimated
|
Estimated
|
Actual
|
Estimated
|
Actual
|
||||||||||||||||||||||||||||||
|
Full
|
Full
|
|||||||||||||||||||||||||||||||||
|
2008
|
2007
|
2007
|
2007
|
2007
|
2006
|
2006
|
2006
|
2006
|
Year
|
Year
|
||||||||||||||||||||||||
|
Q1
|
Q4
|
Q3
|
Q2
|
Q1
|
Q4
|
Q3
|
Q2
|
Q1
|
2007
|
2006
|
||||||||||||||||||||||||
|
Dividends
declared
|
$24,532
|
$80,496
|
$20,989
|
$20,862
|
$20,347
|
$97,665
|
$18,237
|
$17,967
|
$17,767
|
$142,694
|
$151,636
|
|||||||||||||||||||||||
|
Dividend
deductions on stock issued through DSPP
|
192
|
2,605
|
81
|
933
|
660
|
812
|
177
|
239
|
176
|
4,279
|
1,404
|
|||||||||||||||||||||||
|
Total
dividend
deductions
|
$24,724
|
$83,101
|
$21,070
|
$21,795
|
$21,007
|
$98,477
|
$18,414
|
$18,206
|
$17,943
|
$146,973
|
$153,040
|
|||||||||||||||||||||||
|
Regular
dividend per share
|
$0.75
|
$0.75
|
$0.75
|
$0.75
|
$0.75
|
$0.70
|
$0.70
|
$0.70
|
$0.70
|
$3.00
|
$2.80
|
|||||||||||||||||||||||
|
Special
dividend per share
|
-
|
2.00
|
-
|
-
|
-
|
3.00
|
-
|
-
|
-
|
2.00
|
3.00
|
|||||||||||||||||||||||
|
Total
dividends per share
|
$0.75
|
$2.75
|
$0.75
|
$0.75
|
$0.75
|
$3.70
|
$0.70
|
$0.70
|
$0.70
|
$5.00
|
$5.80
|
|||||||||||||||||||||||
|
Undistributed
REIT taxable income at beginning of period (pre-tax):
|
$49,182
|
$103,299
|
$80,394
|
$61,253
|
$50,484
|
$111,411
|
$88,420
|
$65,850
|
$51,731
|
$50,484
|
$51,731
|
|||||||||||||||||||||||
|
REIT
taxable
income (pre-tax)
|
24,733
|
32,028
|
48,591
|
45,233
|
35,112
|
41,555
|
45,751
|
45,040
|
35,382
|
160,964
|
167,728
|
|||||||||||||||||||||||
|
Permanently
retained (pre-tax)
|
(2,350
|
)
|
(3,044
|
)
|
(4,616
|
)
|
(4,297
|
)
|
(3,336
|
)
|
(4,005
|
)
|
(4,346
|
)
|
(4,263
|
)
|
(3,320
|
)
|
(15,293
|
)
|
(15,934
|
)
|
||||||||||||
|
Dividend
of
2005 income
|
-
|
-
|
-
|
-
|
-
|
-
|
(15,581
|
)
|
(18,207
|
)
|
(17,943
|
)
|
-
|
(51,731
|
)
|
|||||||||||||||||||
|
Dividend
of
2006 income
|
-
|
-
|
(7,682
|
)
|
(21,795
|
)
|
(21,007
|
)
|
(98,477
|
)
|
(2,833
|
)
|
-
|
-
|
(50,484
|
)
|
(101,310
|
)
|
||||||||||||||||
|
Dividend
of
2007 income
|
(24,724
|
)
|
(83,101
|
)
|
(13,388
|
)
|
-
|
-
|
-
|
-
|
-
|
-
|
(96,489
|
)
|
-
|
|||||||||||||||||||
|
Undistributed
REIT taxable income at period end (pre-tax):
|
$46,841
|
$49,182
|
$103,299
|
$80,394
|
$61,253
|
$50,484
|
$111,411
|
$88,420
|
$65,850
|
$49,182
|
$50,484
|
|||||||||||||||||||||||
|
Undistributed
REIT taxable income (pre-tax) at period end
|
||||||||||||||||||||||||||||||||||
|
From
2005's
income
|
$
-
|
$
-
|
$
-
|
$
-
|
$
-
|
$
-
|
$
-
|
$15,581
|
$33,788
|
$
-
|
$
-
|
|||||||||||||||||||||||
|
From
2006's
income
|
-
|
-
|
-
|
7,682
|
29,477
|
50,484
|
111,411
|
72,839
|
32,062
|
-
|
50,484
|
|||||||||||||||||||||||
|
From
2007's
income
|
24,458
|
49,182
|
103,299
|
72,712
|
31,776
|
-
|
-
|
-
|
-
|
49,182
|
-
|
|||||||||||||||||||||||
|
From
2008's
income
|
22,383
|
-
|
-
|
-
|
-
|
-
|
-
|
-
|
-
|
-
|
-
|
|||||||||||||||||||||||
|
Total
|
$46,841
|
$49,182
|
$103,299
|
$80,394
|
$61,253
|
$50,484
|
$111,411
|
$88,420
|
$65,850
|
$49,182
|
$50,484
|
|||||||||||||||||||||||
|
Shares
outstanding at period end
|
32,710
|
32,385
|
27,986
|
27,816
|
27,129
|
26,733
|
26,053
|
25,668
|
25,382
|
32,385
|
26,733
|
|||||||||||||||||||||||
|
Undistributed
REIT taxable income (pre-tax) per share outstanding at
period
end
|
$1.43
|
$1.52
|
$3.69
|
$2.89
|
$2.26
|
$1.89
|
$4.28
|
$3.44
|
$2.59
|
$1.52
|
$1.89
|
|||||||||||||||||||||||
|
THE
REDWOOD
REVIEW
1ST
QUARTER
2008
|
Table 4: Retention
and
Distribution of Taxable Income
|
69
|
|
|
Table
5: Components of Book Value ($
in millions)
|
70
|
|
2008
|
January
1,
|
2007
|
2007
|
2007
|
2007
|
||||||||||||||
|
Q1
|
2008
|
Q4
|
Q3
|
Q2
|
Q1
|
||||||||||||||
|
Assets
at Redwood
|
|||||||||||||||||||
|
Residential
CES
|
|||||||||||||||||||
|
Prime
|
$78
|
$128
|
$128
|
$132
|
$189
|
$181
|
|||||||||||||
|
Alt-A
|
9
|
22
|
22
|
44
|
68
|
72
|
|||||||||||||
|
Subprime
|
1
|
1
|
1
|
1
|
2
|
3
|
|||||||||||||
|
Total
Residential CES at Redwood
|
$88
|
$151
|
$151
|
$177
|
$259
|
$256
|
|||||||||||||
|
Residential
IGS
|
35
|
15
|
15
|
61
|
204
|
106
|
|||||||||||||
|
Commercial
CES
|
100
|
148
|
148
|
159
|
186
|
198
|
|||||||||||||
|
Real
estate
loans
|
5
|
4
|
4
|
6
|
878
|
1256
|
|||||||||||||
|
CDO
|
42
|
33
|
33
|
9
|
24
|
24
|
|||||||||||||
|
Other
real
estate investments
|
3
|
12
|
12
|
24
|
32
|
47
|
|||||||||||||
|
Total
securities & loans at Redwood
|
$273
|
$363
|
$363
|
$436
|
$1,583
|
$1,887
|
|||||||||||||
|
Cash
and cash
equivalents
|
257
|
290
|
$290
|
$310
|
$83
|
$92
|
|||||||||||||
|
Other
assets
(a)
|
35
|
67
|
67
|
118
|
109
|
120
|
|||||||||||||
|
Other
liabilities (b)
|
(42
|
)
|
(41
|
)
|
(41
|
)
|
(89
|
)
|
(88
|
)
|
(65
|
)
|
|||||||
|
Redwood
debt
|
(2
|
)
|
(8
|
)
|
(8
|
)
|
(39
|
)
|
(849
|
)
|
(1,880
|
)
|
|||||||
|
Madrona
commercial paper
|
-
|
-
|
-
|
(5
|
)
|
(5
|
)
|
(5
|
)
|
||||||||||
|
Total
Redwood debt
|
$(2
|
)
|
$(8
|
)
|
$(8
|
)
|
$(44
|
)
|
$(854
|
)
|
$(1,885
|
)
|
|||||||
|
Investments
in Sequoia
|
|||||||||||||||||||
|
Total
assets
|
6,800
|
7,205
|
7,205
|
$7,624
|
$7,473
|
$7,424
|
|||||||||||||
|
Total
liabilities
|
(6,654
|
)
|
(7,059
|
)
|
(7,059
|
)
|
(7,376
|
)
|
(7,238
|
)
|
(7,203
|
)
|
|||||||
|
Net
investments in Sequoia
|
$146
|
$146
|
$146
|
$248
|
$235
|
$221
|
|||||||||||||
|
Investments
in Acacia
|
|||||||||||||||||||
|
Total
assets
|
1,269
|
2,107
|
2,107
|
$2,795
|
$3,433
|
$3,424
|
|||||||||||||
|
Total
liabilities
|
(1,201
|
)
|
(2,023
|
)
|
(3,492
|
)
|
(3,475
|
)
|
(3,475
|
)
|
(2,770
|
)
|
|||||||
|
Net
investments in Acacia
|
68
|
84
|
(1,385
|
)
|
(680
|
)
|
(42
|
)
|
654
|
||||||||||
|
Subordinated
notes
|
(150
|
)
|
(150
|
)
|
(150
|
)
|
(150
|
)
|
(150
|
)
|
(100
|
)
|
|||||||
|
Total
GAAP equity
|
$585
|
$751
|
$(718
|
)
|
$149
|
$876
|
$924
|
||||||||||||
|
(a)
Other
assets includes DBIC, derivative assets, accrued interest
recievable,
deferred tax assets, restricted cash, and other assets.
|
|
(b)
Other
liabilities include derivative liabilities, accrued interest
payable,
dividends payable, and accrued expenses, and other
liabilities.
|
|
THE
REDWOOD
REVIEW
1ST
QUARTER
2008
|
Table 5:
Components
of
Book Value
|
|
|
|
Table
6 : Book Value and Other Ratios ($
in millions, except per share data)
|
|
|
2008
|
January
1,
|
2007
|
2007
|
2007
|
2007
|
2006
|
2006
|
2006
|
2006
|
||||||||||||||||||||||
|
Q1
|
2008
(1)
|
Q4
|
Q3
|
Q2
|
Q1
|
Q4
|
Q3
|
Q2
|
Q1
|
||||||||||||||||||||||
|
Total
Redwood
debt
|
$2
|
$8
|
$8
|
$39
|
$849
|
$1,880
|
$1,856
|
$510
|
$529
|
$
-
|
|||||||||||||||||||||
|
Subordinated
notes
|
150
|
150
|
150
|
150
|
150
|
100
|
100
|
-
|
-
|
-
|
|||||||||||||||||||||
|
Redwood
obligations
|
$152
|
$158
|
$158
|
$189
|
$999
|
$1,980
|
$1,956
|
$510
|
$529
|
$
-
|
|||||||||||||||||||||
|
GAAP
stockholders' equity
|
$585
|
$751
|
$(718
|
)
|
$149
|
$876
|
$924
|
$1,003
|
$1,043
|
$1,004
|
$967
|
||||||||||||||||||||
|
Redwood
obligations to equity
|
0.3x
|
0.2x
|
(0.2)x
|
1.3x
|
1.1x
|
2.1x
|
2.0x
|
0.5x
|
0.5x
|
0.0x
|
|||||||||||||||||||||
|
Redwood
obligations to (equity + Redwood obligations)
|
21
|
%
|
17
|
%
|
-28
|
%
|
56
|
%
|
53
|
%
|
68
|
%
|
66
|
%
|
33
|
%
|
35
|
%
|
0
|
%
|
|||||||||||
|
Redwood
obligations
|
$152
|
$158
|
$158
|
$189
|
$999
|
$1,980
|
$1,956
|
$510
|
$529
|
$
-
|
|||||||||||||||||||||
|
ABS
obligations of consolidated entities
|
7,591
|
8,839
|
10,329
|
10,803
|
10,675
|
9,947
|
9,979
|
11,554
|
11,898
|
13,930
|
|||||||||||||||||||||
|
GAAP
debt
|
$7,743
|
$8,997
|
$10,487
|
$10,992
|
$11,674
|
$11,927
|
$11,935
|
$12,064
|
$12,427
|
$13,930
|
|||||||||||||||||||||
|
GAAP
debt to
equity
|
13.2x
|
12.0x
|
(14.6)x
|
73.8x
|
13.3x
|
12.9x
|
11.9x
|
11.6x
|
12.4x
|
14.4x
|
|||||||||||||||||||||
|
GAAP
debt to
(equity + GAAP debt)
|
93
|
%
|
92
|
%
|
107
|
%
|
99
|
%
|
93
|
%
|
93
|
%
|
92
|
%
|
92
|
%
|
93
|
%
|
94
|
%
|
|||||||||||
|
GAAP
stockholders' equity
|
$585
|
$751
|
$(718
|
)
|
$149
|
$876
|
$924
|
$1,003
|
$1,043
|
$1,004
|
$967
|
||||||||||||||||||||
|
Balance
sheet
mark-to-market adjustments
|
(93
|
)
|
(99
|
)
|
(574
|
)
|
(735
|
)
|
(81
|
)
|
(6
|
)
|
93
|
95
|
91
|
82
|
|||||||||||||||
|
Core
equity
|
$678
|
$850
|
$(145
|
)
|
$884
|
$957
|
$930
|
$910
|
$948
|
$913
|
$886
|
||||||||||||||||||||
|
Shares
outstanding at period end
|
32,710
|
32,385
|
32,385
|
27,986
|
27,816
|
27,129
|
26,733
|
26,053
|
25,668
|
25,382
|
|||||||||||||||||||||
|
GAAP
equity
per share (2)
|
$17.89
|
$23.18
|
$(22.18
|
)
|
$5.32
|
$31.50
|
$34.06
|
$37.51
|
$40.02
|
$39.13
|
$38.11
|
||||||||||||||||||||
|
Core
equity
per share
|
$20.74
|
$26.24
|
$(4.46
|
)
|
$31.58
|
$34.40
|
$34.29
|
$34.02
|
$36.38
|
$35.58
|
$34.90
|
||||||||||||||||||||
|
(1)
On January
1, 2008 we elected the fair value option for the assets
and liabilities of
Acacia and certain other assets.
|
|||||
|
(2)
At March
31, 2008 we estimate the economic book value was $590 million,
or $18.04
per share. This is the GAAP book value of $585 million
($17.89 per share)
adjusted for our estimates of fair value of our investments
in Acacia and
Sequoia of negative $73 million (negative $2.23 per share),
and an
adjustment to the fair value of the subordinated notes
issued of positive
$78 million (positive $2.38 per share). This is reconciled
to GAAP in the
table on page 8 of this
Review.
|
|
THE
REDWOOD
REVIEW
1ST
QUARTER
2008
|
Table 6
: Book
Value
and Other Ratios
|
71
|
|
|
Table
7: Profitability Ratios ($
in thousands, except per share data)
|
72
|
|
Full
|
Full
|
|||||||||||||||||||||||||||||||||
|
2008
|
2007
|
2007
|
2007
|
2007
|
2006
|
2006
|
2006
|
2006
|
Year
|
Year
|
||||||||||||||||||||||||
|
Q1
|
Q4
|
Q3
|
Q2
|
Q1
|
Q4
|
Q3
|
Q2
|
Q1
|
2007
|
2006
|
||||||||||||||||||||||||
|
|
|
|||||||||||||||||||||||||||||||||
|
Interest
income
|
$168,006
|
$201,952
|
$218,824
|
$219,658
|
$215,105
|
$217,391
|
$223,649
|
$218,238
|
$225,882
|
$855,540
|
$885,160
|
|||||||||||||||||||||||
|
Average
consolidated earning assets
|
$9,101,313
|
$11,521,330
|
$12,193,242
|
$12,301,562
|
$12,279,814
|
$12,498,889
|
$12,860,488
|
$13,581,710
|
$15,229,790
|
$12,072,657
|
$13,533,367
|
|||||||||||||||||||||||
|
Asset
yield
|
7.38
|
%
|
7.01
|
%
|
7.18
|
%
|
7.14
|
%
|
7.01
|
%
|
6.96
|
%
|
6.96
|
%
|
6.43
|
%
|
5.93
|
%
|
7.09
|
%
|
6.54
|
%
|
||||||||||||
|
Interest
expense
|
$(128,762
|
)
|
$(152,679
|
)
|
$(165,230
|
)
|
$(165,757
|
)
|
$(168,095
|
)
|
$(172,857
|
)
|
$(174,673
|
)
|
$(173,519
|
)
|
$(180,655
|
)
|
$(651,762
|
)
|
$(701,704
|
)
|
||||||||||||
|
Average
consolidated interest-bearing liabilities
|
$8,383,296
|
$10,716,433
|
$11,376,762
|
$11,580,196
|
$11,623,627
|
$11,836,717
|
$12,332,390
|
$13,055,417
|
$14,800,315
|
$11,322,898
|
$12,996,244
|
|||||||||||||||||||||||
|
Cost
of
funds
|
6.14
|
%
|
5.70
|
%
|
5.81
|
%
|
5.73
|
%
|
5.78
|
%
|
5.84
|
%
|
5.67
|
%
|
5.32
|
%
|
4.88
|
%
|
5.76
|
%
|
5.40
|
%
|
||||||||||||
|
|
||||||||||||||||||||||||||||||||||
|
Asset
yield
|
7.38
|
%
|
7.01
|
%
|
7.18
|
%
|
7.14
|
%
|
7.01
|
%
|
6.96
|
%
|
6.96
|
%
|
6.43
|
%
|
5.93
|
%
|
7.09
|
%
|
6.54
|
%
|
||||||||||||
|
Cost
of
funds
|
(6.14
|
)%
|
(5.70
|
)%
|
(5.81
|
)%
|
(5.73
|
)%
|
(5.78
|
)%
|
(5.84
|
)%
|
(5.67
|
)%
|
(5.32
|
)%
|
(4.88
|
)%
|
(5.76
|
)%
|
(5.40
|
)%
|
||||||||||||
|
Interest
rate
spread
|
1.24
|
%
|
1.31
|
%
|
1.37
|
%
|
1.41
|
%
|
1.22
|
%
|
1.12
|
%
|
1.29
|
%
|
1.11
|
%
|
1.05
|
%
|
1.33
|
%
|
1.14
|
%
|
||||||||||||
|
|
||||||||||||||||||||||||||||||||||
|
Net
interest
income before market valuation adjustments
|
$40,726
|
$49,273
|
$53,594
|
$53,901
|
$47,010
|
$44,534
|
$48,976
|
$44,719
|
$45,227
|
$203,778
|
$183,456
|
|||||||||||||||||||||||
|
Average
consolidated earning assets
|
$9,101,313
|
$11,521,330
|
$12,193,242
|
$12,301,562
|
$12,279,814
|
$12,498,889
|
$12,860,488
|
$13,581,710
|
$15,229,790
|
$12,072,657
|
$13,533,367
|
|||||||||||||||||||||||
|
Net
interest
margin
|
1.79
|
%
|
1.71
|
%
|
1.76
|
%
|
1.75
|
%
|
1.75
|
%
|
1.43
|
%
|
1.52
|
%
|
1.32
|
%
|
1.19
|
%
|
1.69
|
%
|
1.36
|
%
|
||||||||||||
|
Net
interest
income before market valuation adjustments
|
$40,726
|
$49,273
|
$53,594
|
$53,901
|
$47,010
|
$44,534
|
$48,976
|
$44,719
|
$45,227
|
$203,778
|
$183,456
|
|||||||||||||||||||||||
|
Annualized
net
interest income / average core equity
|
19.66
|
%
|
27.91
|
%
|
22.48
|
%
|
22.66
|
%
|
20.33
|
%
|
19.28
|
%
|
21.02
|
%
|
19.91
|
%
|
20.62
|
%
|
23.06
|
%
|
20.32
|
%
|
||||||||||||
|
Operating
expenses (excluding severance expense)
|
$16,368
|
$14,929
|
$11,732
|
$12,772
|
$15,402
|
$13,851
|
$13,455
|
$16,037
|
$12,582
|
$54,835
|
$55,925
|
|||||||||||||||||||||||
|
Average
total
assets
|
$9,222,284
|
$10,866,153
|
$12,232,304
|
$12,688,468
|
$12,865,979
|
$13,041,794
|
$13,480,361
|
$14,168,755
|
$15,839,483
|
$12,177,451
|
$14,123,149
|
|||||||||||||||||||||||
|
Average
total
equity
|
$710,010
|
$97,534
|
$851,869
|
$946,454
|
$1,008,688
|
$1,008,863
|
$1,011,609
|
$980,402
|
$952,230
|
$723,807
|
$988,495
|
|||||||||||||||||||||||
|
Operating
expenses / net interest income
|
40.19
|
%
|
30.30
|
%
|
21.89
|
%
|
23.70
|
%
|
32.76
|
%
|
31.10
|
%
|
27.47
|
%
|
35.86
|
%
|
27.82
|
%
|
26.91
|
%
|
30.48
|
%
|
||||||||||||
|
Operating
expenses / average total assets
|
0.71
|
%
|
0.55
|
%
|
0.38
|
%
|
0.40
|
%
|
0.48
|
%
|
0.42
|
%
|
0.40
|
%
|
0.45
|
%
|
0.32
|
%
|
0.45
|
%
|
0.40
|
%
|
||||||||||||
|
Operating
expenses / average total equity annualized
|
9.22
|
%
|
61.23
|
%
|
5.51
|
%
|
5.40
|
%
|
6.11
|
%
|
5.49
|
%
|
5.32
|
%
|
6.54
|
%
|
5.29
|
%
|
7.58
|
%
|
5.66
|
%
|
||||||||||||
|
GAAP
net
(loss) income
|
$(171,587
|
)
|
$(1,077,445
|
)
|
$(60,917
|
)
|
$11,416
|
$18,309
|
$35,691
|
$32,416
|
$31,410
|
$28,015
|
$(1,108,637
|
)
|
$127,532
|
|||||||||||||||||||
|
GAAP
net
(loss) income / average total assets
|
(7.44
|
)%
|
(39.66
|
)%
|
(1.99
|
)%
|
0.36
|
%
|
0.57
|
%
|
1.09
|
%
|
0.96
|
%
|
0.89
|
%
|
0.71
|
%
|
(9.10
|
)%
|
0.90
|
%
|
||||||||||||
|
GAAP
net
(loss) income / average equity (GAAP ROE)
|
(96.67
|
)%
|
(4418.75
|
)%
|
(28.60
|
)%
|
4.82
|
%
|
7.26
|
%
|
14.15
|
%
|
12.82
|
%
|
12.82
|
%
|
11.77
|
%
|
(153.17
|
)%
|
12.90
|
%
|
||||||||||||
|
GAAP
net
(loss) income / average core equity (adjusted ROE)
|
(82.83
|
)%
|
(610.31
|
)%
|
(25.55
|
)%
|
4.80
|
%
|
7.92
|
%
|
15.45
|
%
|
13.91
|
%
|
13.98
|
%
|
12.77
|
%
|
(125.47
|
)%
|
14.04
|
%
|
||||||||||||
|
Core
earnings
|
$22,303
|
$35,811
|
$40,025
|
$38,108
|
$29,807
|
$30,276
|
$31,983
|
$25,417
|
$29,885
|
$143,751
|
$117,561
|
|||||||||||||||||||||||
|
Average
core
equity
|
$828,618
|
$706,167
|
$953,602
|
$951,378
|
$925,128
|
$923,856
|
$932,030
|
$898,409
|
$877,212
|
$883,590
|
$908,071
|
|||||||||||||||||||||||
|
Core
earnings
/ average core equity (core ROE)
|
10.77
|
%
|
20.28
|
%
|
16.79
|
%
|
16.02
|
%
|
12.89
|
%
|
13.11
|
%
|
13.73
|
%
|
11.32
|
%
|
13.63
|
%
|
16.27
|
%
|
12.95
|
%
|
||||||||||||
|
THE
REDWOOD
REVIEW
1ST
QUARTER
2008
|
Table 7:
Profitability
Ratios
|
|
|
|
Table
8: Average Balance Sheet ($
in thousands)
|
|
|
Full
|
|||||||||||||||||||
|
2008
|
2007
|
2007
|
2007
|
2007
|
Year
|
||||||||||||||
|
Q1
|
Q4
|
Q3
|
Q2
|
Q1
|
2007
|
||||||||||||||
|
Amortized
Cost at Redwood
|
|||||||||||||||||||
|
Residential
CES
|
|||||||||||||||||||
|
Prime
|
$164,621
|
$159,699
|
$133,552
|
$141,226
|
$124,513
|
$139,747
|
|||||||||||||
|
Alt-A
|
24,637
|
37,882
|
79,139
|
70,431
|
66,606
|
63,515
|
|||||||||||||
|
Subprime
|
1,712
|
906
|
1,550
|
4,017
|
6,312
|
3,196
|
|||||||||||||
|
Residential
CES at Redwood
|
190,970
|
198,487
|
214,241
|
215,675
|
197,431
|
206,458
|
|||||||||||||
|
Residential
IGS
|
37,632
|
35,998
|
136,148
|
156,171
|
138,398
|
116,679
|
|||||||||||||
|
Commercial
CES
|
183,446
|
184,491
|
185,358
|
188,672
|
199,302
|
189,456
|
|||||||||||||
|
Commercial
loans
|
250
|
91
|
2,602
|
2,603
|
2,603
|
1,975
|
|||||||||||||
|
Residential
loans
|
4,507
|
74,722
|
127,983
|
901,168
|
1,708,160
|
698,819
|
|||||||||||||
|
CDO
|
21,297
|
30,501
|
20,424
|
25,854
|
33,576
|
27,589
|
|||||||||||||
|
Other
real
estate investments
|
5,836
|
17,679
|
28,152
|
47,567
|
23,736
|
29,283
|
|||||||||||||
|
Real
estate assets at Redwood
|
$443,938
|
$541,968
|
$714,908
|
$1,537,710
|
$2,303,207
|
$1,270,259
|
|||||||||||||
|
Earning
assets
at Acacia
|
1,439,913
|
3,339,339
|
3,326,899
|
3,141,675
|
2,735,805
|
3,137,798
|
|||||||||||||
|
Earning
assets
at Sequoia
|
6,895,529
|
7,254,340
|
7,745,341
|
7,331,308
|
6,995,987
|
7,331,744
|
|||||||||||||
|
Earning
assets
at Opportunity Fund
|
33,180
|
-
|
-
|
-
|
-
|
-
|
|||||||||||||
|
Cash
and cash
equivalents
|
402,584
|
385,683
|
406,094
|
290,869
|
244,816
|
332,856
|
|||||||||||||
|
Earning
assets
|
9,215,144
|
11,521,330
|
12,193,242
|
12,301,562
|
12,279,814
|
12,072,657
|
|||||||||||||
|
Balance
sheet
mark-to-market adjustments
|
(113,832
|
)
|
(608,634
|
)
|
(101,733
|
)
|
(4,924
|
)
|
83,560
|
(195,757
|
)
|
||||||||
|
Earning
assets
- reported value
|
9,101,312
|
10,912,696
|
12,091,509
|
12,296,638
|
12,363,374
|
11,876,900
|
|||||||||||||
|
Other
assets
|
120,971
|
(46,543
|
)
|
140,795
|
391,830
|
502,605
|
300,550
|
||||||||||||
|
Total
assets
|
$9,222,283
|
$10,866,153
|
$12,232,304
|
$12,688,468
|
$12,865,979
|
$12,177,450
|
|||||||||||||
|
Redwood
debt
|
$21,477
|
$26,871
|
$399,068
|
$1,515,988
|
$2,188,561
|
$1,024,829
|
|||||||||||||
|
Sequoia
ABS
issued
|
6,745,556
|
7,161,634
|
7,430,521
|
7,125,947
|
6,845,355
|
7,143,651
|
|||||||||||||
|
Acacia
ABS
issued
|
1,456,506
|
3,381,924
|
3,401,359
|
2,820,328
|
2,492,698
|
3,027,541
|
|||||||||||||
|
Other
liabilities
|
142,491
|
52,187
|
3,673
|
161,819
|
233,664
|
130,745
|
|||||||||||||
|
'Subordinated
notes
|
146,242
|
146,004
|
145,813
|
117,934
|
97,013
|
126,877
|
|||||||||||||
|
Total
liabilities
|
8,512,272
|
10,768,620
|
11,380,435
|
11,742,015
|
11,857,291
|
11,453,643
|
|||||||||||||
|
Core
equity
|
823,843
|
706,167
|
953,602
|
951,378
|
925,128
|
883,590
|
|||||||||||||
|
Balance
sheet
mark-to-market adjustments
|
(113,832
|
)
|
(608,634
|
)
|
(101,733
|
)
|
(4,924
|
)
|
83,560
|
(159,783
|
)
|
||||||||
|
Total
equity
|
714,786
|
97,533
|
851,869
|
946,454
|
1,008,688
|
723,807
|
|||||||||||||
|
Total
liabilities and equity
|
$9,222,283
|
$10,866,153
|
$12,232,304
|
$12,688,469
|
$12,865,979
|
$12,177,450
|
|||||||||||||
|
THE
REDWOOD
REVIEW
1ST
QUARTER
2008
|
Table 8:
Average
Balance Sheet
|
73
|
|
|
Table
9A - Balances & Yields by Securities Portfolio at
Redwood
($
in thousands)
|
74
|
|
2008
|
2007
|
||||||
|
Q1
|
Q4
|
||||||
|
Residential
Prime CES
|
|||||||
|
Current
face
|
$537,214
|
$528,745
|
|||||
|
Unamortized
discount
|
(60,335
|
)
|
(76,633
|
)
|
|||
|
Discount
designated as credit reserve
|
(358,334
|
)
|
(287,716
|
)
|
|||
|
Unrealized
losses
|
(40,739
|
)
|
(36,784
|
)
|
|||
|
Reported
value
|
$77,806
|
$127,612
|
|||||
|
Average
amortized cost
|
$164,621
|
$159,699
|
|||||
|
Interest
income
|
$16,600
|
$19,534
|
|||||
|
Annualized
interest income / average amortized cost
|
40.34
|
%
|
48.93
|
%
|
|||
|
Residential
Alt-A CES
|
|||||||
|
Current
face
|
$217,109
|
$234,785
|
|||||
|
Unamortized
discount
|
(1,401
|
)
|
(15,158
|
)
|
|||
|
Discount
designated as credit reserve
|
(204,681
|
)
|
(194,544
|
)
|
|||
|
Unrealized
losses
|
(1,914
|
)
|
(3,117
|
)
|
|||
|
Reported
value
|
$9,113
|
$21,966
|
|||||
|
Average
amortized cost
|
$24,637
|
$37,882
|
|||||
|
Interest
income
|
$5,210
|
$4,769
|
|||||
|
Annualized
interest income / average amortized cost
|
84.59
|
%
|
50.36
|
%
|
|||
|
Residential
Subprime CES
|
|||||||
|
Current
face
|
$23,888
|
$27,899
|
|||||
|
Unamortized
discount
|
37
|
1,349
|
|||||
|
Discount
designated as credit reserve
|
(23,139
|
)
|
(27,872
|
)
|
|||
|
Unrealized
gains
|
152
|
55
|
|||||
|
Reported
value
|
$938
|
$1,431
|
|||||
|
Average
amortized cost
|
$1,135
|
$906
|
|||||
|
Interest
income
|
$85
|
$478
|
|||||
|
Annualized
interest income / average amortized cost
|
29.96
|
%
|
211.04
|
%
|
|||
|
Residential
IGS
|
|||||||
|
Current
face
|
$56,494
|
$56,125
|
|||||
|
Unamortized
discount
|
(22,014
|
)
|
(17,660
|
)
|
|||
|
Discount
designated as credit reserve
|
(20
|
)
|
(12,013
|
)
|
|||
|
Unrealized
gains
|
(7,034
|
)
|
99
|
||||
|
Reported
value
|
$27,426
|
$26,551
|
|||||
|
Average
amortized cost
|
$15,794
|
$35,999
|
|||||
|
Interest
income
|
$629
|
$1,065
|
|||||
|
Annualized
interest income / average amortized cost
|
15.94
|
%
|
11.83
|
%
|
|||
|
|
|
||||||
|
Commercial
CES
|
|||||||
|
Current
face
|
$523,118
|
$523,156
|
|||||
|
Unamortized
discount
|
(36,955
|
)
|
(17,867
|
)
|
|||
|
Discount
designated as credit reserve
|
(378,388
|
)
|
(318,456
|
)
|
|||
|
Unrealized
losses
|
(8,252
|
)
|
(38,325
|
)
|
|||
|
Reported
value
|
$99,523
|
$148,508
|
|||||
|
Average
amortized cost
|
$183,446
|
$184,491
|
|||||
|
Interest
income
|
$5,000
|
$4,955
|
|||||
|
Annualized
interest income / average amortized cost
|
10.90
|
%
|
10.74
|
%
|
|||
|
CDO
CES
|
|||||||
|
Current
face
|
$26,562
|
$26,501
|
|||||
|
Unamortized
discount
|
(3,513
|
)
|
(3,096
|
)
|
|||
|
Discount
designated as credit reserve
|
(22,374
|
)
|
(21,855
|
)
|
|||
|
Unrealized
losses
|
10
|
822
|
|||||
|
Reported
value
|
$685
|
$2,372
|
|||||
|
Average
amortized cost
|
$1,576
|
$1,678
|
|||||
|
Interest
income
|
$140
|
$129
|
|||||
|
Annualized
interest income / average amortized cost
|
35.53
|
%
|
30.75
|
%
|
|||
|
CDO
IGS
|
|||||||
|
Current
face
|
$89,645
|
$121,800
|
|||||
|
Unamortized
discount
|
(58,959
|
)
|
(55,776
|
)
|
|||
|
Discount
designated as credit reserve
|
|||||||
|
Unrealized
losses
|
(4,146
|
)
|
(35,499
|
)
|
|||
|
Reported
value
|
$26,540
|
$30,525
|
|||||
|
Average
amortized cost
|
$27,743
|
$28,823
|
|||||
|
Interest
income
|
$1,357
|
$807
|
|||||
|
Annualized
interest income / average amortized cost
|
19.57
|
%
|
11.20
|
%
|
|||
|
Securities
Reported at Fair Value
(1)
|
|||||||
|
Reported
fair
value
|
$23,371
|
$-
|
|||||
|
Average
fair
value
|
$47,572
|
-
|
|||||
|
Interest
income
|
$2,099
|
-
|
|||||
|
Annualized
interest income / average fair value
|
17.65
|
%
|
-
|
||||
|
THE
REDWOOD
REVIEW
1ST
QUARTER
2008
|
Table 9A
- Balances & Yields by Securities Portfolio at
Redwood
|
|
|
|
Table
9B - Balances & Yields by Securities Portfolio at
Acacia
($
in thousands)
|
|
|
2008
|
||||
|
Q1
|
||||
|
Residential
Prime CES
|
||||
|
Reported
fair
value
|
$77,414
|
|||
|
Average
fair
value
|
$135,694
|
|||
|
Interest
income
|
$5,877
|
|||
|
Annualized
interest income / average fair-value
|
17.32
|
%
|
||
|
Residential
Alt-A CES
|
||||
|
Reported
fair
value
|
$14,633
|
|||
|
Average
fair
value
|
$31,243
|
|||
|
Interest
income
|
$2,940
|
|||
|
Annualized
interest income / average fair-value
|
37.64
|
%
|
||
|
Residential
Subprime CES
|
||||
|
Reported
fair
value
|
$10,877
|
|||
|
Average
fair
value
|
$13,116
|
|||
|
Interest
income
|
$1,629
|
|||
|
Annualized
interest income / average fair-value
|
49.68
|
%
|
||
|
Residential
IGS
|
||||
|
Reported
fair
value
|
$588,738
|
|||
|
Average
fair
value
|
$857,763
|
|||
|
Interest
income
|
$23,967
|
|||
|
Annualized
interest income / average fair-value
|
11.18
|
%
|
||
|
|
||||
|
Commercial
IGS
|
||||
|
Reported
fair
value
|
$62,781
|
|||
|
Average
fair
value
|
$73,878
|
|||
|
Interest
income
|
$1,431
|
|||
|
Annualized
interest income / average fair-value
|
7.75
|
%
|
||
|
Commercial
CES
|
||||
|
Reported
fair
value
|
$112,554
|
|||
|
Average
fair
value
|
$150,421
|
|||
|
Interest
income
|
$4,542
|
|||
|
Annualized
interest income / average fair-value
|
12.08
|
%
|
||
|
CDO
IGS
|
||||
|
Reported
fair
value
|
$52,743
|
|||
|
Average
fair
value
|
$69,991
|
|||
|
Interest
income
|
$2,527
|
|||
|
Annualized
interest income / average fair-value
|
14.44
|
%
|
||
|
CDO
CES
|
||||
|
Reported
fair
value
|
$6,027
|
|||
|
Average
fair
value
|
$7,096
|
|||
|
Interest
income
|
$401
|
|||
|
Annualized
interest income / average fair-value
|
22.63
|
%
|
||
|
THE
REDWOOD
REVIEW
1ST
QUARTER
2008
|
Table 9B
- Balances & Yields by Securities Portfolio at
Acacia
|
75
|
|
|
Table
10A: Securities Portfolio Activity at
Redwood (in
thousands)
|
76
|
|
2008
|
2007
|
||||||
|
Q1
|
Q4
|
||||||
|
Residential
Prime
|
|||||||
|
Beginning
balance
|
$128,971
|
$134,624
|
|||||
|
Acquisitions
|
38,207
|
63,663
|
|||||
|
Transfer
between portfolios
|
1,183
|
(624
|
)
|
||||
|
Sales
|
-
|
-
|
|||||
|
Principal
payments
|
(14,810
|
)
|
(14,702
|
)
|
|||
|
Discount
amortization
|
9,554
|
12,544
|
|||||
|
Changes
in
fair value, net
|
(65,125
|
)
|
(66,534
|
)
|
|||
|
Ending
Balance
|
$97,980
|
$128,971
|
|||||
|
Residential
Alt-A
|
|||||||
|
Beginning
balance
|
$31,353
|
$89,668
|
|||||
|
Acquisitions
|
451
|
-
|
|||||
|
Transfer
between portfolios
|
2,874
|
(13,951
|
)
|
||||
|
Sales
|
-
|
(18,255
|
)
|
||||
|
Principal
payments
|
(3,646
|
)
|
(3,410
|
)
|
|||
|
Discount
amortization
|
2,423
|
1,167
|
|||||
|
Changes
in
fair value, net
|
(18,607
|
)
|
(23,866
|
)
|
|||
|
Ending
balance
|
$14,850
|
$31,353
|
|||||
|
Residential
Subprime
|
|||||||
|
Beginning
balance
|
$6,036
|
$13,089
|
|||||
|
Acquisitions
|
7,221
|
6,303
|
|||||
|
Transfer
between portfolios
|
-
|
-
|
|||||
|
Sales
|
-
|
-
|
|||||
|
Principal
payments
|
(1,170
|
)
|
(1,417
|
)
|
|||
|
Discount
amortization
|
(25
|
)
|
173
|
||||
|
Changes
in
fair value, net
|
(1,745
|
)
|
(12,112
|
)
|
|||
|
Ending
balance
|
$10,317
|
$6,036
|
|||||
|
Other
Real Estate Investments
|
|||||||
|
Beginning
balance
|
$11,521
|
$25,300
|
|||||
|
Acquisitions
|
-
|
-
|
|||||
|
Transfer
between portfolios
|
(4,379
|
)
|
-
|
||||
|
Sales
|
-
|
-
|
|||||
|
Principal
payments
|
(1,008
|
)
|
(3,349
|
)
|
|||
|
Premium
amortization
|
-
|
(1,217
|
)
|
||||
|
Changes
in
fair value, net
|
(2,697
|
)
|
(9,213
|
)
|
|||
|
Ending
balance
|
$3,437
|
$11,521
|
|||||
|
|
|
||||||
|
Residential
Real Estate Loans
|
|||||||
|
Beginning
balance
|
$4,533
|
$6,049
|
|||||
|
Acquisitions
|
-
|
||||||
|
Principal
payments
|
(16
|
)
|
(343
|
)
|
|||
|
Premium
amortization
|
-
|
(779
|
)
|
||||
|
Credit
provision
|
-
|
-
|
|||||
|
Transfers
to
REO
|
-
|
-
|
|||||
|
Changes
in
fair value, net
|
(74
|
)
|
(394
|
)
|
|||
|
Ending
balance
|
$4,443
|
$4,533
|
|||||
|
Commercial
|
|||||||
|
Beginning
balance
|
$148,508
|
$158,750
|
|||||
|
Acquisitions
|
-
|
-
|
|||||
|
Transfer
between portfolios
|
-
|
20,835
|
|||||
|
Sales
|
-
|
(4,542
|
)
|
||||
|
Principal
payments
|
-
|
-
|
|||||
|
Premium
amortization
|
(1,523
|
)
|
(1,579
|
)
|
|||
|
Changes
in
fair value, net
|
(47,462
|
)
|
(24,956
|
)
|
|||
|
Ending
Balance
|
$99,523
|
$148,508
|
|||||
|
Commercial
Real Estate Loans
|
|||||||
|
Beginning
balance
|
$253
|
$249
|
|||||
|
Acquisitions
|
-
|
-
|
|||||
|
Principal
payments
|
(2
|
)
|
(2
|
)
|
|||
|
Discount
(premium) amortization
|
1
|
6
|
|||||
|
Credit
provision
|
-
|
-
|
|||||
|
Changes
in
fair value, net
|
-
|
-
|
|||||
|
Ending
Balance
|
$252
|
$253
|
|||||
|
CDO
|
|||||||
|
Beginning
balance
|
$32,897
|
$9,359
|
|||||
|
Acquisitions
|
12,336
|
42,113
|
|||||
|
Upgrades
/
downgrades
|
-
|
-
|
|||||
|
Transfer
between portfolios
|
-
|
(1,526
|
)
|
||||
|
Sales
|
-
|
-
|
|||||
|
Principal
payments
|
20
|
(317
|
)
|
||||
|
Discount
amortization
|
435
|
-
|
|||||
|
Changes
in
fair value, net
|
(2,957
|
)
|
(16,732
|
)
|
|||
|
Ending
Balance
|
$42,731
|
$32,897
|
|||||
|
THE
REDWOOD
REVIEW
1ST
QUARTER
2008
|
Table 10A:
Securities Portfolio Activity at Redwood
|
|
|
|
Table
10B: Portfolio Activity at Acacia (in
thousands)
|
|
|
2008
|
2007
|
||||||
|
Q1
|
Q4
|
||||||
|
Residential
Prime
|
|||||||
|
$707,722
|
$947,475
|
||||||
|
Acquisitions
|
-
|
11,075
|
|||||
|
Transfer
between portfolios
|
227
|
624
|
|||||
|
Sales
|
-
|
(3,159
|
)
|
||||
|
Principal
payments
|
(23,932
|
)
|
(23,000
|
)
|
|||
|
Discount
amortization
|
-
|
4,205
|
|||||
|
Changes
in
fair value, net
|
(372,984
|
)
|
(229,498
|
)
|
|||
|
Ending
Balance
|
$311,033
|
$707,722
|
|||||
|
Residential
Alt-a
|
|||||||
|
Beginning
balance
|
$465,387
|
$724,896
|
|||||
|
Acquisitions
|
0
|
30,175
|
|||||
|
Transfer
between portfolios
|
-
|
13,958
|
|||||
|
Sales
|
-
|
(1,056
|
)
|
||||
|
Principal
payments
|
(7,021
|
)
|
(9,222
|
)
|
|||
|
Discount
amortization
|
-
|
1,597
|
|||||
|
Changes
in
fair value, net
|
(238,842
|
)
|
(294,961
|
)
|
|||
|
Ending
balance
|
$219,524
|
$465,387
|
|||||
|
Residential
Subprime
|
|||||||
|
Beginning
balance
|
$219,941
|
$324,926
|
|||||
|
Acquisitions
|
-
|
-
|
|||||
|
Transfer
between portfolios
|
95
|
(6
|
)
|
||||
|
Sales
|
-
|
-
|
|||||
|
Principal
payments
|
(22,364
|
)
|
(11,341
|
)
|
|||
|
Discount
amortization
|
-
|
(771
|
)
|
||||
|
Changes
in
fair value, net
|
(36,566
|
)
|
(92,867
|
)
|
|||
|
Ending
balance
|
$161,106
|
$219,941
|
|||||
|
|
|
||||||
|
Commercial
|
|||||||
|
Beginning
balance
|
$278,003
|
$341,047
|
|||||
|
Acquisitions
|
-
|
-
|
|||||
|
Transfer
between portfolios
|
(5,482
|
)
|
(20,836
|
)
|
|||
|
Sales
|
-
|
-
|
|||||
|
Principal
payments
|
(658
|
)
|
(5,121
|
)
|
|||
|
Discount
(premium) amortization
|
-
|
1,669
|
|||||
|
Changes
in
fair value, net
|
(96,527
|
)
|
(38,757
|
)
|
|||
|
Ending
Balance
|
$175,336
|
$278,003
|
|||||
|
CDO
|
|||||||
|
Beginning
balance
|
$91,263
|
$182,554
|
|||||
|
Acquisitions
|
-
|
-
|
|||||
|
Transfer
between portfolios
|
5,482
|
1,525
|
|||||
|
Sales
|
-
|
-
|
|||||
|
Principal
payments
|
(647
|
)
|
(6,379
|
)
|
|||
|
Premium
amortization
|
-
|
(133
|
)
|
||||
|
Changes
in
fair value, net
|
(37,328
|
)
|
(86,304
|
)
|
|||
|
Ending
Balance
|
$58,770
|
$91,263
|
|||||
|
Commercial
Real Estate Loans
|
|||||||
|
Beginning
balance
|
$25,426
|
$25,517
|
|||||
|
Acquisitions
|
-
|
-
|
|||||
|
Transfer
between portfolios
|
-
|
-
|
|||||
|
Principal
payments
|
(115
|
)
|
(111
|
)
|
|||
|
Discount
(premium) amortization
|
-
|
20
|
|||||
|
Credit
provision
|
-
|
-
|
|||||
|
Changes
in
fair value, net
|
(6,509
|
)
|
-
|
||||
|
Ending
Balance
|
$18,802
|
$25,426
|
|||||
|
THE
REDWOOD
REVIEW
1ST
QUARTER
2008
|
Table 10B:
Portfolio Activity at Acacia
|
77
|
|
|
Table
10C: Portfolio Activity at Sequoia (in
thousands)
|
78
|
|
2008
|
2007
|
||||||
|
Q1
|
Q4
|
||||||
|
Residential
Real Estate Loans
|
|||||||
|
Beginning
balance
|
$7,173,940
|
$7,624,222
|
|||||
|
Acquisitions
|
-
|
-
|
|||||
|
Principal
payments
|
(399,711
|
)
|
(430,612
|
)
|
|||
|
Premium
amortization
|
(7,510
|
)
|
(6,683
|
)
|
|||
|
Credit
provision
|
(8,058
|
)
|
(4,973
|
)
|
|||
|
Transfers
to
REO
|
(7,170
|
)
|
(8,014
|
)
|
|||
|
Changes
in
fair value, net
|
-
|
-
|
|||||
|
Ending
balance
|
$6,751,491
|
$7,173,940
|
|||||
|
THE
REDWOOD
REVIEW
1ST
QUARTER
2008
|
Table 10C:
Portfolio Activity at Sequoia
|
|
|
|
Table
11A: Managed Residential Loans Credit
Performance
($
in thousands)
|
|
|
Managed
Loans
|
Internally-Designated
Credit Reserve
|
External
Credit Enhancement
|
Total
Credit Protection
|
Total
Credit Protection as % of Loans (1)
|
Seriously
Delinquent Loans (2)
|
Seriously
Delinquent Loan % of Current Balance
|
Total
Credit Losses
|
Losses
To Securities Junior to Redwood's Interest
|
Redwood's
Share of Net Charge-offs/ (Recoveries)
|
Redwood
Credit Losses As % of Loans (Annualized)
|
|||||||||||||||||||||||||||
|
Total
Managed
|
Q1:
2006
|
$198,252,684
|
$396,153
|
$126,376
|
$522,529
|
0.26
|
%
|
$467,352
|
0.24
|
%
|
$3,002
|
-
|
$3,002
|
0.01
|
%
|
||||||||||||||||||||||
|
Residential
|
Q2:
2006
|
227,928,505
|
445,028
|
126,264
|
571,292
|
0.25
|
%
|
441,430
|
0.19
|
%
|
1,464
|
-
|
1,464
|
<0.01
|
%
|
||||||||||||||||||||||
|
Portfolio
|
Q3:
2006
|
235,127,925
|
403,723
|
215,285
|
619,008
|
0.26
|
%
|
658,262
|
0.28
|
%
|
2,748
|
155
|
2,593
|
<0.01
|
%
|
||||||||||||||||||||||
|
|
Q4:
2006
|
219,178,838
|
392,365
|
302,072
|
694,437
|
0.32
|
%
|
842,746
|
0.39
|
%
|
5,058
|
196
|
4,862
|
0.01
|
%
|
||||||||||||||||||||||
|
|
2006
|
219,178,838
|
392,365
|
302,072
|
694,437
|
0.32
|
%
|
842,746
|
0.39
|
%
|
12,272
|
351
|
11,921
|
0.01
|
%
|
||||||||||||||||||||||
|
|
Q1:
2007
|
245,080,031
|
412,717
|
355,855
|
768,572
|
0.31
|
%
|
1,075,683
|
0.44
|
%
|
5,776
|
325
|
5,451
|
0.01
|
%
|
||||||||||||||||||||||
|
|
Q2:
2007
|
227,973,546
|
469,492
|
356,374
|
825,866
|
0.36
|
%
|
1,431,963
|
0.63
|
%
|
12,157
|
471
|
11,686
|
0.02
|
%
|
||||||||||||||||||||||
|
|
Q3:
2007
|
219,465,992
|
466,034
|
335,699
|
801,733
|
0.37
|
%
|
2,234,644
|
1.02
|
%
|
17,553
|
8,682
|
8,871
|
0.03
|
%
|
||||||||||||||||||||||
|
|
Q4:
2007
|
256,923,033
|
695,130
|
342,009
|
1,037,139
|
0.40
|
%
|
7,536,293
|
2.93
|
%
|
44,529
|
32,533
|
11,996
|
0.07
|
%
|
||||||||||||||||||||||
|
|
2007
|
256,923,033
|
695,130
|
342,009
|
1,037,139
|
0.40
|
%
|
7,536,293
|
2.93
|
%
|
$80,015
|
42,011
|
38,004
|
0.03
|
%
|
||||||||||||||||||||||
|
|
Q1:
2008
(3)
|
$157,481,973
|
$610,598
|
$89,472
|
$700,070
|
0.44
|
%
|
$4,698,037
|
2.98
|
%
|
$57,354
|
$24,746
|
$32,608
|
0.15
|
%
|
||||||||||||||||||||||
|
Residential
Real
|
Q1:
2006
|
$11,846,454
|
$22,372
|
-
|
$22,372
|
0.19
|
%
|
48,677
|
0.41
|
%
|
$425
|
-
|
$425
|
<0.01
|
%
|
||||||||||||||||||||||
|
Estate
Loans
|
Q2:
2006
|
10,318,641
|
19,450
|
-
|
19,450
|
0.19
|
%
|
47,162
|
0.46
|
%
|
423
|
-
|
423
|
<0.01
|
%
|
||||||||||||||||||||||
|
|
Q3:
2006
|
9,718,985
|
19,326
|
-
|
19,326
|
0.20
|
%
|
61,447
|
0.63
|
%
|
589
|
-
|
589
|
0.02
|
%
|
||||||||||||||||||||||
|
|
Q4:
2006
|
9,212,002
|
20,119
|
-
|
20,119
|
0.22
|
%
|
65,071
|
0.79
|
%
|
711
|
-
|
711
|
0.02
|
%
|
||||||||||||||||||||||
|
|
2006
|
9,212,002
|
20,119
|
-
|
20,119
|
0.22
|
%
|
65,071
|
0.79
|
%
|
2,148
|
-
|
2,148
|
0.02
|
%
|
||||||||||||||||||||||
|
|
Q1:
2007
|
8,582,964
|
19,954
|
-
|
19,954
|
0.23
|
%
|
68,632
|
0.92
|
%
|
1,646
|
-
|
1,646
|
0.08
|
%
|
||||||||||||||||||||||
|
|
Q2:
2007
|
8,256,759
|
16,416
|
-
|
16,416
|
0.20
|
%
|
55,674
|
0.67
|
%
|
6,038
|
-
|
6,038
|
0.29
|
%
|
||||||||||||||||||||||
|
|
Q3:
2007
|
7,546,529
|
15,195
|
-
|
15,195
|
0.20
|
%
|
56,068
|
0.74
|
%
|
2,728
|
-
|
2,728
|
0.14
|
%
|
||||||||||||||||||||||
|
|
Q4:
2007
|
7,106,018
|
18,282
|
-
|
18,282
|
0.26
|
%
|
67,984
|
0.96
|
%
|
1,886
|
-
|
1,886
|
0.11
|
%
|
||||||||||||||||||||||
|
|
2007
|
7,106,018
|
18,282
|
-
|
18,282
|
0.26
|
%
|
67,984
|
0.96
|
%
|
12,298
|
-
|
12,298
|
0.17
|
%
|
||||||||||||||||||||||
|
|
Q1:
2008
(3)
|
$6,697,241
|
$24,444
|
-
|
$24,444
|
0.36
|
%
|
$83,966
|
1.25
|
%
|
$1,896
|
-
|
$1,896
|
0.11
|
%
|
||||||||||||||||||||||
|
Residential
CES
|
Q1:
2006
|
$186,406,230
|
$373,781
|
$126,376
|
$500,157
|
-
|
$418,675
|
0.22
|
%
|
$2,577
|
-
|
$2,577
|
<0.01
|
%
|
|||||||||||||||||||||||
|
|
Q2:
2006
|
217,609,864
|
425,578
|
126,264
|
551,842
|
0.25
|
%
|
394,268
|
0.18
|
%
|
1,041
|
-
|
1,041
|
<0.01
|
%
|
||||||||||||||||||||||
|
|
Q3:
2006
|
225,408,940
|
384,397
|
215,285
|
599,682
|
0.27
|
%
|
596,815
|
0.26
|
%
|
2,159
|
155
|
2,004
|
<0.01
|
%
|
||||||||||||||||||||||
|
|
Q4:
2006
|
209,966,836
|
372,246
|
302,072
|
674,318
|
0.32
|
%
|
777,675
|
0.37
|
%
|
4,347
|
196
|
4,151
|
<0.01
|
%
|
||||||||||||||||||||||
|
|
2006
|
209,966,836
|
372,246
|
302,072
|
674,318
|
0.32
|
%
|
777,675
|
0.37
|
%
|
10,124
|
351
|
9,773
|
<0.01
|
%
|
||||||||||||||||||||||
|
|
Q1:
2007
|
236,497,067
|
392,763
|
355,855
|
748,618
|
0.32
|
%
|
1,007,051
|
0.43
|
%
|
4,130
|
325
|
3,805
|
<0.01
|
%
|
||||||||||||||||||||||
|
|
Q2:
2007
|
219,716,787
|
453,076
|
356,374
|
809,450
|
0.37
|
%
|
1,376,289
|
0.63
|
%
|
6,119
|
471
|
5,648
|
0.01
|
%
|
||||||||||||||||||||||
|
|
Q3:
2007
|
211,919,463
|
450,839
|
335,699
|
786,538
|
0.37
|
%
|
2,178,576
|
1.03
|
%
|
14,825
|
8,682
|
6,143
|
0.01
|
%
|
||||||||||||||||||||||
|
|
Q4:
2007
|
249,817,015
|
676,848
|
342,009
|
1,018,857
|
0.41
|
%
|
7,468,309
|
2.99
|
%
|
42,643
|
32,533
|
10,110
|
0.02
|
%
|
||||||||||||||||||||||
|
|
2007
|
249,817,015
|
676,848
|
342,009
|
1,018,857
|
0.41
|
%
|
7,468,309
|
2.99
|
%
|
67,717
|
42,011
|
25,706
|
0.01
|
%
|
||||||||||||||||||||||
|
|
Q1:
2008
(3)
|
$150,784,732
|
$586,154
|
$89,472
|
$675,626
|
0.45
|
%
|
$4,614,071
|
3.06
|
%
|
55,458
|
$24,746
|
$30,712
|
0.08
|
%
|
||||||||||||||||||||||
|
(1)
The credit
reserve on residential real estate loans is only
available to absorb
losses on our residential real estate loans. Internally-designated
credit
reserves and external credit enhancement are only
available to absorb
losses on our residential CES. The credit enhancement
balances shown above
do not include pari passu CES owned by others.
If we had included these
amounts, the total credit protection would increase
to 0.54% for
residential CES compared to the 0.45% shown in
the table
above.
|
||||||||
|
(2)
The
seriously delinquent loans amount for residential
real estate loans
excludes loans in REO which is included in our
consolidated other assets.
At March 31, 2008, REO totaled $16 million.
|
||||||||
|
(3)
As of
Q108, balances only include CES and loans held
at Redwood and loans held
by Sequoia.
|
|
THE
REDWOOD
REVIEW
1ST
QUARTER
2008
|
Table 11A:
Managed Residential Loans Credit Performance
|
79
|
|
|
Table
11B: Managed Residential Loans Underlying Unrated
CES at
Redwood
($
in thousands)
|
80
|
|
Managed
Loans (1)
|
Internally-Designated
Credit Reserve
|
Total
Credit Reserve as % of Loans (2)
|
Seriously
Delinquent Loans
|
Seriously
Delinquent Loan % of Current Balance
|
Redwood's
Share of Losses
|
Total
Credit Losses As % of Loans (Annualized)
|
|||||||||||||||||||
|
Total
managed residential
|
2005
|
$116,114,620
|
$354,603
|
0.31
|
%
|
$280,777
|
0.24
|
%
|
$3,004
|
0.00
|
%
|
||||||||||||||
|
loans
underlying unrated
|
Q1:
2006
|
138,193,399
|
411,286
|
0.30
|
%
|
383,443
|
0.28
|
%
|
2,577
|
0.01
|
%
|
||||||||||||||
|
CES
at Redwood
|
Q2:
2006
|
149,482,021
|
424,873
|
0.28
|
%
|
355,455
|
0.24
|
%
|
1,041
|
0.00
|
%
|
||||||||||||||
|
|
Q3:
2006
|
131,638,023
|
383,329
|
0.29
|
%
|
402,464
|
0.31
|
%
|
2,004
|
0.01
|
%
|
||||||||||||||
|
|
Q4:
2006
|
125,484,895
|
372,247
|
0.30
|
%
|
475,624
|
0.38
|
%
|
4,151
|
0.01
|
%
|
||||||||||||||
|
|
2006
|
125,484,895
|
372,247
|
0.30
|
%
|
475,624
|
0.38
|
%
|
9,773
|
0.01
|
%
|
||||||||||||||
|
|
Q1:
2007
|
106,041,296
|
392,763
|
0.37
|
%
|
603,602
|
0.57
|
%
|
3,805
|
0.01
|
%
|
||||||||||||||
|
|
Q2:
2007
|
107,327,274
|
443,736
|
0.41
|
%
|
760,418
|
0.71
|
%
|
5,649
|
0.02
|
%
|
||||||||||||||
|
|
Q3:
2007
|
102,309,905
|
436,484
|
0.43
|
%
|
1,140,185
|
1.11
|
%
|
6,143
|
0.02
|
%
|
||||||||||||||
|
|
Q4:
2007
|
105,346,188
|
482,260
|
0.46
|
%
|
1,925,858
|
1.83
|
%
|
9,795
|
0.04
|
%
|
||||||||||||||
|
|
2007
|
105,346,188
|
482,260
|
0.46
|
%
|
1,925,858
|
1.83
|
%
|
25,392
|
0.02
|
%
|
||||||||||||||
|
|
Q1:
2008
|
$104,143,788
|
$563,015
|
0.54
|
%
|
$3,078,034
|
2.96
|
%
|
$26,701
|
0.10
|
%
|
||||||||||||||
|
Residential
loans
|
2005
|
$100,335,631
|
$296,362
|
0.30
|
%
|
$222,162
|
0.22
|
%
|
$2,455
|
0.00
|
%
|
||||||||||||||
|
underlying
prime unrated
|
Q1:
2006
|
122,532,955
|
343,209
|
0.28
|
%
|
296,802
|
0.24
|
%
|
2,403
|
0.01
|
%
|
||||||||||||||
|
CES
at Redwood
|
Q2:
2006
|
129,521,184
|
309,703
|
0.24
|
%
|
248,502
|
0.19
|
%
|
816
|
<0.01
|
%
|
||||||||||||||
|
|
Q3:
2006
|
112,437,056
|
276,189
|
0.25
|
%
|
269,496
|
0.24
|
%
|
1,826
|
0.01
|
%
|
||||||||||||||
|
|
Q4:
2006
|
107,357,542
|
256,932
|
0.24
|
%
|
288,159
|
0.27
|
%
|
2,840
|
0.01
|
%
|
||||||||||||||
|
|
2006
|
107,357,542
|
256,932
|
0.24
|
%
|
288,159
|
0.27
|
%
|
7,886
|
0.01
|
%
|
||||||||||||||
|
|
Q1:
2007
|
87,463,719
|
263,991
|
0.30
|
%
|
325,581
|
0.37
|
%
|
2,474
|
0.01
|
%
|
||||||||||||||
|
|
Q2:
2007
|
87,747,140
|
292,935
|
0.33
|
%
|
384,267
|
0.44
|
%
|
3,241
|
0.01
|
%
|
||||||||||||||
|
|
Q3:
2007
|
82,672,812
|
260,191
|
0.31
|
%
|
555,257
|
0.67
|
%
|
2,816
|
0.01
|
%
|
||||||||||||||
|
|
Q4:
2007
|
86,979,610
|
287,716
|
0.33
|
%
|
898,336
|
1.03
|
%
|
4,418
|
0.02
|
%
|
||||||||||||||
|
|
2007
|
86,979,610
|
287,716
|
0.33
|
%
|
898,336
|
1.03
|
%
|
12,949
|
0.01
|
%
|
||||||||||||||
|
|
Q1:
2008
|
$86,486,014
|
$358,334
|
0.41
|
%
|
$1,399,063
|
1.62
|
%
|
$11,129
|
0.05
|
%
|
||||||||||||||
|
Residential
loans
|
2005
|
$15,778,989
|
$58,241
|
0.37
|
%
|
$58,614
|
0.37
|
%
|
$549
|
0.00
|
%
|
||||||||||||||
|
underlying
alt - a unrated
|
Q1:
2006
|
15,660,444
|
68,077
|
0.43
|
%
|
86,641
|
0.55
|
%
|
174
|
0.00
|
%
|
||||||||||||||
|
CES
at Redwood
|
Q2:
2006
|
19,960,837
|
115,170
|
0.58
|
%
|
106,953
|
0.54
|
%
|
225
|
0.00
|
%
|
||||||||||||||
|
|
Q3:
2006
|
19,200,967
|
107,140
|
0.56
|
%
|
132,968
|
0.69
|
%
|
178
|
0.00
|
%
|
||||||||||||||
|
|
Q4:
2006
|
18,127,353
|
115,315
|
0.64
|
%
|
187,465
|
1.03
|
%
|
1,311
|
0.03
|
%
|
||||||||||||||
|
|
2006
|
18,127,353
|
115,315
|
0.64
|
%
|
187,465
|
1.03
|
%
|
1,887
|
0.01
|
%
|
||||||||||||||
|
|
Q1:
2007
|
18,577,577
|
128,772
|
0.69
|
%
|
278,021
|
1.50
|
%
|
1,331
|
0.03
|
%
|
||||||||||||||
|
|
Q2:
2007
|
19,580,134
|
150,801
|
0.77
|
%
|
376,151
|
1.92
|
%
|
2,408
|
0.05
|
%
|
||||||||||||||
|
|
Q3:
2007
|
19,637,093
|
176,293
|
0.90
|
%
|
584,928
|
2.98
|
%
|
3,327
|
0.07
|
%
|
||||||||||||||
|
|
Q4:
2007
|
18,366,578
|
194,544
|
1.06
|
%
|
1,027,522
|
5.59
|
%
|
5,377
|
0.12
|
%
|
||||||||||||||
|
|
2007
|
18,366,578
|
194,544
|
1.06
|
%
|
1,027,522
|
5.59
|
%
|
12,443
|
0.07
|
%
|
||||||||||||||
|
|
Q1:
2008
|
$17,657,774
|
$204,681
|
1.16
|
%
|
$1,678,971
|
9.51
|
%
|
$15,572
|
0.35
|
%
|
||||||||||||||
|
(1)
The credit
reserve on residential real estate loans
is only available to absorb
losses on our residential real estate loan
portfolio. The managed loans
amount for residential CES prime and alt-a
portfolios represents the loan
balances for the securities where Redwood
is first in line to absorb
losses. The internally-designated credit
reserve is established to protect
Redwood against losses suffered from these
underlying loan balances.
|
|
(2)
The credit
enhancement balances shown above do not
include pari passu CES owned by
others. If we had included these amounts,
the total credit protection
would be 0.53% for prime CES compared to
0.41% for prime CES shown in the
table above. For alt-a CES, the total credit
protection would be 1.43%
compared to the 1.16% shown in the table
above.
|
|
THE
REDWOOD
REVIEW
1ST
QUARTER
2008
|
Table 11B:
Managed Residential Loans Underlying Unrated
CES at
Redwood
|
|
|
|
Table
12A: Residential Prime CES and Underlying Loan Characteristics
at
Redwood
($
in thousands)
|
|
|
2008
|
2007
|
||||||
|
Q1
|
Q4
|
||||||
|
AFS:
Residential Prime CES
|
|||||||
|
Principal
value
|
$537,214
|
$528,745
|
|||||
|
Unamortized
discount
|
$(60,335
|
)
|
$(76,633
|
)
|
|||
|
Discount
designated as credit reserve
|
$(358,334
|
)
|
$(287,716
|
)
|
|||
|
Unrealized
(loss) gain
|
$(40,739
|
)
|
$(36,784
|
)
|
|||
|
Market
value
(reported value)
|
$77,806
|
$127,612
|
|||||
|
Market
value /
principal value
|
14.5
|
%
|
24.1
|
%
|
|||
|
|
|||||||
|
FVO:
Residential Prime CES
|
|||||||
|
Market
value
|
$
-
|
$
-
|
|||||
|
|
|||||||
|
Total
Market Value (reported value)
|
$77,806
|
$127,612
|
|||||
|
|
|||||||
|
Current
Rating
|
|||||||
|
BB
|
$24,647
|
$49,935
|
|||||
|
B
|
21,538
|
41,150
|
|||||
|
Unrated
|
31,621
|
36,527
|
|||||
|
Total
market
value
|
$77,806
|
$127,612
|
|||||
|
|
|||||||
|
Security
Type
|
|||||||
|
Option
ARM
|
$6,841
|
$16,827
|
|||||
|
ARM
|
4,370
|
16,180
|
|||||
|
Hybrid
|
47,858
|
72,704
|
|||||
|
Fixed
|
18,737
|
21,901
|
|||||
|
Total
market
value
|
$77,806
|
$127,612
|
|||||
|
|
|||||||
|
AFS:
Residential Prime CES
|
|||||||
|
Coupon
income
|
$7,110
|
$7,013
|
|||||
|
Discount
amortization
|
9,490
|
12,521
|
|||||
|
Total
interest
income
|
$16,600
|
$19,534
|
|||||
|
|
|||||||
|
Average
amortized cost
|
$164,621
|
$159,699
|
|||||
|
|
|||||||
|
Coupon
income
%
|
17.27
|
%
|
17.57
|
%
|
|||
|
Discount
amortization %
|
23.06
|
%
|
31.36
|
%
|
|||
|
Annualized
interest income / avg. amt. cost
|
40.34
|
%
|
48.93
|
%
|
|||
|
|
|||||||
|
FVO:
Residential Prime CES
|
|||||||
|
Coupon
income
|
$
-
|
$
-
|
|||||
|
Average
fair-value
|
$
-
|
$
-
|
|||||
|
Annualized
interest income / avg. fair-value
|
-
|
-
|
|||||
|
|
|||||||
|
Underlying
Loan Characteristics (Total)
|
|||||||
|
|
|||||||
|
Number
of
loans
|
303,657
|
305,272
|
|||||
|
Total
loan
face
|
$127,183,501
|
$126,820,985
|
|||||
|
Average
loan
size
|
$419
|
$415
|
|||||
|
|
|||||||
|
Year
2008
origination
|
0
|
%
|
0
|
%
|
|||
|
Year
2007
origination
|
8
|
%
|
7
|
%
|
|||
|
Year
2006
origination
|
13
|
%
|
13
|
%
|
|||
|
Year
2005
origination
|
22
|
%
|
23
|
%
|
|||
|
Year
2004
origination and earlier
|
56
|
%
|
57
|
%
|
|||
|
Southern
CA
|
26
|
%
|
26
|
%
|
|||
|
Northern
CA
|
23
|
%
|
23
|
%
|
|||
|
Florida
|
6
|
%
|
6
|
%
|
|||
|
New
York
|
6
|
%
|
6
|
%
|
|||
|
Georgia
|
2
|
%
|
2
|
%
|
|||
|
New
Jersey
|
3
|
%
|
3
|
%
|
|||
|
Texas
|
2
|
%
|
2
|
%
|
|||
|
Arizona
|
2
|
%
|
2
|
%
|
|||
|
Illinois
|
3
|
%
|
3
|
%
|
|||
|
Colorado
|
2
|
%
|
2
|
%
|
|||
|
Virginia
|
4
|
%
|
4
|
%
|
|||
|
Other
states
|
22
|
%
|
21
|
%
|
|||
|
Wtd
Avg
Original LTV
|
69
|
%
|
69
|
%
|
|||
|
Original
LTV:
0 - 50
|
13
|
%
|
13
|
%
|
|||
|
Original
LTV:
50.01 - 60
|
12
|
%
|
12
|
%
|
|||
|
Original
LTV:
60.01 - 70
|
22
|
%
|
22
|
%
|
|||
|
Original
LTV:
70.01 - 80
|
50
|
%
|
50
|
%
|
|||
|
Original
LTV:
80.01 - 90
|
2
|
%
|
2
|
%
|
|||
|
Original
LTV:
90.01 - 100
|
1
|
%
|
1
|
%
|
|||
|
Unknown
|
0
|
%
|
0
|
%
|
|||
|
|
|||||||
|
Wtd
Avg
FICO
|
736
|
736
|
|||||
|
FICO:
<=
600
|
0
|
%
|
0
|
%
|
|||
|
FICO:
601 -
620
|
0
|
%
|
0
|
%
|
|||
|
FICO:
621 -
640
|
1
|
%
|
1
|
%
|
|||
|
FICO:
641 -
660
|
3
|
%
|
3
|
%
|
|||
|
FICO:
661 -
680
|
5
|
%
|
7
|
%
|
|||
|
FICO:
681 -
700
|
10
|
%
|
10
|
%
|
|||
|
FICO:
701 -
720
|
13
|
%
|
13
|
%
|
|||
|
FICO:
721 -
740
|
14
|
%
|
14
|
%
|
|||
|
FICO:
741 -
760
|
16
|
%
|
16
|
%
|
|||
|
FICO:
761 -
780
|
18
|
%
|
18
|
%
|
|||
|
FICO:
781 -
800
|
13
|
%
|
14
|
%
|
|||
|
FICO:
>=
801
|
4
|
%
|
4
|
%
|
|||
|
Unknown
|
3
|
%
|
0
|
%
|
|||
|
|
|||||||
|
Conforming
at
Origination %
|
25
|
%
|
26
|
%
|
|||
|
>
$1
MM
%
|
10
|
%
|
10
|
%
|
|||
|
|
|||||||
|
2nd
Home
%
|
6
|
%
|
7
|
%
|
|||
|
Investment
Home %
|
2
|
%
|
2
|
%
|
|||
|
|
|||||||
|
Purchase
|
42
|
%
|
42
|
%
|
|||
|
Cash
Out
Refi
|
24
|
%
|
25
|
%
|
|||
|
Rate-Term
Refi
|
33
|
%
|
32
|
%
|
|||
|
Construction
|
0
|
%
|
0
|
%
|
|||
|
Other
|
0
|
%
|
1
|
%
|
|||
|
|
|||||||
|
Full
Doc
|
49
|
%
|
52
|
%
|
|||
|
No
Doc
|
7
|
%
|
7
|
%
|
|||
|
Other
Doc
(Lim, Red, Stated, etc)
|
41
|
%
|
41
|
%
|
|||
|
Unknown
|
3
|
%
|
|||||
|
2-4
Family
|
1
|
%
|
0
|
%
|
|||
|
Condo
|
11
|
%
|
2
|
%
|
|||
|
Single
Family
|
87
|
%
|
11
|
%
|
|||
|
Other
|
0
|
%
|
87
|
%
|
|
THE
REDWOOD
REVIEW
1ST
QUARTER
2008
|
Table 12A:
Residential Prime CES and Underlying Loan Characteristics
at
Redwood
|
81
|
|
|
Table
12B: Residential Alt-A CES and Underlying Loan Characteristics
at
Redwood
($
in thousands)
|
82
|
|
|
2008
|
2007
|
|||||
|
Q1
|
Q4
|
||||||
|
AFS:
Residential CES Alt A
|
|||||||
|
Principal
value
|
$217,109
|
$234,785
|
|||||
|
Unamortized
discount
|
(1,401
|
)
|
(15,158
|
)
|
|||
|
Discount
designated as credit reserve
|
(204,681
|
)
|
(194,544
|
)
|
|||
|
Unrealized
(loss) gain
|
(1,914
|
)
|
(3,117
|
)
|
|||
|
Market
value
(reported value)
|
$9,113
|
$21,966
|
|||||
|
Market
value /
principal value
|
4.2
|
%
|
9.4
|
%
|
|||
|
|
|||||||
|
FVO:
Residential CES Alt A
|
|||||||
|
Market
value
|
$
-
|
$
-
|
|||||
|
|
|||||||
|
Total
market value (reported value)
|
$9,113
|
$21,966
|
|||||
|
|
|||||||
|
Current
Rating
|
|||||||
|
BB
|
$427
|
$2,901
|
|||||
|
B
|
2,130
|
7,531
|
|||||
|
Unrated
|
6,556
|
11,534
|
|||||
|
Total
market
value
|
$9,113
|
$21,966
|
|||||
|
|
|||||||
|
Security
Type
|
|||||||
|
Option
ARM
|
$7,798
|
$19,644
|
|||||
|
ARM
|
116
|
151
|
|||||
|
Hybrid
|
822
|
1,660
|
|||||
|
Fixed
|
377
|
511
|
|||||
|
Total
market
value
|
$9,113
|
$21,966
|
|||||
|
|
|||||||
|
AFS:
Residential CES Alt A
|
|||||||
|
Coupon
income
|
$2,787
|
$3,588
|
|||||
|
Discount
amortization
|
2,423
|
1,181
|
|||||
|
Total
interest
income
|
$5,210
|
$4,769
|
|||||
|
|
|||||||
|
Average
amortized cost
|
$24,637
|
$37,882
|
|||||
|
|
|||||||
|
Coupon
income
%
|
45.25
|
%
|
37.89
|
%
|
|||
|
Discount
amortization %
|
39.34
|
%
|
12.47
|
%
|
|||
|
Annualized
interest income / avg. amt. cost
|
84.59
|
%
|
50.36
|
%
|
|||
|
|
|||||||
|
FVO:
Residential CES Alt A
|
|||||||
|
Coupon
income
|
$
-
|
$
-
|
|||||
|
Average
fair-value
|
$
-
|
$
-
|
|||||
|
Annualized
interest income / avg. fair-value
|
-
|
-
|
|||||
|
|
|||||||
|
Underlying
Loan Characteristics
|
|||||||
|
|
|||||||
|
Number
of
loans
|
44,860
|
47,588
|
|||||
|
Total
loan
face
|
$17,657,774
|
$18,366,578
|
|||||
|
Average
loan
size
|
$393,622
|
$386
|
|||||
|
|
|||||||
|
Year
2008
origination
|
0
|
%
|
0
|
%
|
|||
|
Year
2007
origination
|
24
|
%
|
24
|
%
|
|||
|
Year
2006
origination
|
24
|
%
|
24
|
%
|
|||
|
Year
2005
origination
|
29
|
%
|
29
|
%
|
|||
|
Year
2004
origination and earlier
|
22
|
%
|
23
|
%
|
|||
|
2008
|
2007
|
||||||
|
Q1
|
Q4
|
||||||
|
Southern
CA
|
31
|
%
|
30
|
%
|
|||
|
Northern
CA
|
21
|
%
|
20
|
%
|
|||
|
Florida
|
11
|
%
|
11
|
%
|
|||
|
New
York
|
3
|
%
|
3
|
%
|
|||
|
Georgia
|
1
|
%
|
1
|
%
|
|||
|
New
Jersey
|
3
|
%
|
3
|
%
|
|||
|
Texas
|
1
|
%
|
1
|
%
|
|||
|
Arizona
|
4
|
%
|
4
|
%
|
|||
|
Illinois
|
1
|
%
|
1
|
%
|
|||
|
Colorado
|
2
|
%
|
2
|
%
|
|||
|
Virginia
|
3
|
%
|
3
|
%
|
|||
|
Other
states
|
20
|
%
|
21
|
%
|
|||
|
Wtd
Avg
Original LTV
|
78
|
%
|
76
|
%
|
|||
|
Original
LTV:
0 - 50
|
3
|
%
|
4
|
%
|
|||
|
Original
LTV:
50.01 - 60
|
5
|
%
|
6
|
%
|
|||
|
Original
LTV:
60.01 - 70
|
16
|
%
|
16
|
%
|
|||
|
Original
LTV:
70.01 - 80
|
64
|
%
|
62
|
%
|
|||
|
Original
LTV:
80.01 - 90
|
9
|
%
|
9
|
%
|
|||
|
Original
LTV:
90.01 - 100
|
3
|
%
|
3
|
%
|
|||
|
Unknown
|
0
|
%
|
0
|
%
|
|||
|
|
|||||||
|
Wtd
Avg
FICO
|
705
|
705
|
|||||
|
FICO:
<=
600
|
0
|
%
|
0
|
%
|
|||
|
FICO:
601 -
620
|
1
|
%
|
1
|
%
|
|||
|
FICO:
621 -
640
|
5
|
%
|
5
|
%
|
|||
|
FICO:
641 -
660
|
10
|
%
|
9
|
%
|
|||
|
FICO:
661 -
680
|
16
|
%
|
16
|
%
|
|||
|
FICO:
681 -
700
|
17
|
%
|
16
|
%
|
|||
|
FICO:
701 -
720
|
15
|
%
|
14
|
%
|
|||
|
FICO:
721 -
740
|
12
|
%
|
11
|
%
|
|||
|
FICO:
741 -
760
|
10
|
%
|
9
|
%
|
|||
|
FICO:
761 -
780
|
8
|
%
|
7
|
%
|
|||
|
FICO:
781 -
800
|
5
|
%
|
4
|
%
|
|||
|
FICO:
>=
801
|
1
|
%
|
1
|
%
|
|||
|
Unknown
|
1
|
%
|
7
|
%
|
|||
|
|
|||||||
|
Conforming
at
Origination %
|
43
|
%
|
44
|
%
|
|||
|
>
$1
MM
%
|
16
|
%
|
16
|
%
|
|||
|
|
|||||||
|
2nd
Home
%
|
7
|
%
|
7
|
%
|
|||
|
Investment
Home %
|
11
|
%
|
11
|
%
|
|||
|
|
|||||||
|
Purchase
|
35
|
%
|
35
|
%
|
|||
|
Cash
Out
Refi
|
43
|
%
|
43
|
%
|
|||
|
Rate-Term
Refi
|
22
|
%
|
22
|
%
|
|||
|
Construction
|
0
|
%
|
0
|
%
|
|||
|
Other
|
0
|
%
|
0
|
%
|
|||
|
|
|||||||
|
Full
Doc
|
15
|
%
|
18
|
%
|
|||
|
No
Doc
|
1
|
%
|
1
|
%
|
|||
|
Other
Doc
(Lim, Red, Stated, etc)
|
75
|
%
|
74
|
%
|
|||
|
Unknown/Not
Categorized
|
9
|
%
|
7
|
%
|
|||
|
|
|||||||
|
2-4
Family
|
5
|
%
|
0
|
%
|
|||
|
Condo
|
11
|
%
|
5
|
%
|
|||
|
Single
Family
|
84
|
%
|
11
|
%
|
|||
|
Other
|
0
|
%
|
84
|
%
|
|||
|
THE
REDWOOD
REVIEW
1ST
QUARTER
2008
|
Table 12B:
Residential Alt-A CES and Underlying Loan Characteristics
at
Redwood
|
|
|
|
Table
12C: Residential Subprime CES and Underlying Loan Characteristics
at
Redwood
($
in thousands)
|
|
|
`
|
2008
|
2007
|
|||||
|
Q1
|
Q4
|
||||||
|
Residential
CES Subprime
|
|||||||
|
Principal
value
|
$23,888
|
$27,899
|
|||||
|
Unamortized
premium (discount)
|
37
|
1,349
|
|||||
|
Discount
designated as credit reserve
|
(23,139
|
)
|
(27,872
|
)
|
|||
|
Unrealized
gain (loss)
|
152
|
55
|
|||||
|
Market
value
(reported value)
|
$938
|
$1,431
|
|||||
|
Market
value /
principal value
|
3.9
|
%
|
5.1
|
%
|
|||
|
|
|||||||
|
FVO:
Residential CES Subprime
|
|||||||
|
Market
value
|
$341
|
$
-
|
|||||
|
|
|||||||
|
Total
market value (reported value)
|
$1,279
|
$1,431
|
|||||
|
|
|||||||
|
Current
Rating
|
|||||||
|
BB
|
$
-
|
$
-
|
|||||
|
B
|
90
|
111
|
|||||
|
Unrated
|
1,189
|
1,320
|
|||||
|
Total
market
value
|
$1,279
|
$1,431
|
|||||
|
|
|||||||
|
Security
Type
|
|||||||
|
Option
ARM
|
$
-
|
$
-
|
|||||
|
ARM
|
-
|
-
|
|||||
|
Hybrid
|
1,140
|
1,243
|
|||||
|
Fixed
|
139
|
188
|
|||||
|
Total
market
value
|
$1,279
|
$1,431
|
|||||
|
|
|||||||
|
AFS:
Residential CES Subprime
|
|||||||
|
Coupon
income
|
$429
|
$506
|
|||||
|
(Premium)
discount amortization
|
(344
|
)
|
(28
|
)
|
|||
|
Total
net
interest income
|
$85
|
$478
|
|||||
|
|
|||||||
|
Average
amortized cost
|
$1,135
|
$906
|
|||||
|
|
|||||||
|
Interest
income %
|
151.19
|
%
|
223.40
|
%
|
|||
|
(Premium)
discount amortization %
|
-121.23
|
%
|
-12.36
|
%
|
|||
|
Annualized
net
interest income / avg. amt. cost
|
29.96
|
%
|
211.04
|
%
|
|||
|
|
|||||||
|
FVO:
Residential CES Subprime
|
|||||||
|
Coupon
income
|
$128
|
$-
|
|||||
|
Average
fair-value
|
$576
|
$-
|
|||||
|
Annualized
interest income / avg. fair-value
|
88.89
|
%
|
-
|
|
|||
|
|
|||||||
|
Underlying
Loan Characteristics
|
|||||||
|
|
|||||||
|
Number
of
loans
|
29,441
|
26,070
|
|||||
|
Total
loan
face
|
$5,943,456
|
$4,529,364
|
|||||
|
Average
loan
size
|
$201,876
|
$174
|
|||||
|
|
|||||||
|
Year
2008
origination
|
0
|
%
|
0
|
%
|
|||
|
Year
2007
origination
|
55
|
%
|
33
|
%
|
|||
|
Year
2006
origination
|
44
|
%
|
66
|
%
|
|||
|
Year
2005
origination
|
0
|
%
|
0
|
%
|
|||
|
Year
2004
origination and earlier
|
0
|
%
|
1
|
%
|
|||
|
2008
|
2007
|
||||||
|
Q1
|
Q4
|
||||||
|
Southern
CA
|
18
|
%
|
21
|
%
|
|||
|
Northern
CA
|
13
|
%
|
16
|
%
|
|||
|
Florida
|
11
|
%
|
11
|
%
|
|||
|
New
York
|
6
|
%
|
4
|
%
|
|||
|
Georgia
|
2
|
%
|
1
|
%
|
|||
|
New
Jersey
|
3
|
%
|
3
|
%
|
|||
|
Texas
|
5
|
%
|
5
|
%
|
|||
|
Arizona
|
3
|
%
|
4
|
%
|
|||
|
Illinois
|
4
|
%
|
4
|
%
|
|||
|
Colorado
|
2
|
%
|
2
|
%
|
|||
|
Virginia
|
1
|
%
|
2
|
%
|
|||
|
Other
states
|
32
|
%
|
27
|
%
|
|||
|
Wtd
Avg
Original LTV
|
89
|
%
|
88
|
%
|
|||
|
Original
LTV:
0 - 50
|
2
|
%
|
2
|
%
|
|||
|
Original
LTV:
50.01 - 60
|
2
|
%
|
3
|
%
|
|||
|
Original
LTV:
60.01 - 70
|
5
|
%
|
6
|
%
|
|||
|
Original
LTV:
70.01 - 80
|
53
|
%
|
48
|
%
|
|||
|
Original
LTV:
80.01 - 90
|
25
|
%
|
26
|
%
|
|||
|
Original
LTV:
90.01 - 100
|
13
|
%
|
15
|
%
|
|||
|
Unknown
|
0
|
%
|
0
|
%
|
|||
|
|
|||||||
|
Wtd
Avg
FICO
|
637
|
638
|
|||||
|
FICO:
<=
600
|
23
|
%
|
23
|
%
|
|||
|
FICO:
601 -
620
|
14
|
%
|
13
|
%
|
|||
|
FICO:
621 -
640
|
17
|
%
|
17
|
%
|
|||
|
|
|||||||
|
FICO:
641 -
660
|
15
|
%
|
15
|
%
|
|||
|
FICO:
661 -
680
|
11
|
%
|
11
|
%
|
|||
|
FICO:
681 -
700
|
8
|
%
|
8
|
%
|
|||
|
FICO:
701 -
720
|
5
|
%
|
5
|
%
|
|||
|
FICO:
721 -
740
|
3
|
%
|
3
|
%
|
|||
|
FICO:
741 -
760
|
2
|
%
|
2
|
%
|
|||
|
FICO:
761 -
780
|
1
|
%
|
2
|
%
|
|||
|
FICO:
781 -
800
|
1
|
%
|
1
|
%
|
|||
|
FICO:
>=
801
|
0
|
%
|
0
|
%
|
|||
|
Unknown
|
0
|
%
|
0
|
%
|
|||
|
|
|||||||
|
Conforming
at
Origination %
|
72
|
%
|
72
|
%
|
|||
|
>
$1
MM
%
|
0
|
%
|
0
|
%
|
|||
|
|
|||||||
|
2nd
Home
%
|
1
|
%
|
2
|
%
|
|||
|
Investment
Home %
|
6
|
%
|
8
|
%
|
|||
|
|
|||||||
|
Purchase
|
48
|
%
|
44
|
%
|
|||
|
Cash
Out
Refi
|
45
|
%
|
48
|
%
|
|||
|
Rate-Term
Refi
|
7
|
%
|
8
|
%
|
|||
|
Construction
|
0
|
%
|
0
|
%
|
|||
|
Other
|
0
|
%
|
0
|
%
|
|||
|
|
|||||||
|
Full
Doc
|
61
|
%
|
55
|
%
|
|||
|
No
Doc
|
0
|
%
|
1
|
%
|
|||
|
Other
Doc
(Lim, Red, Stated, etc)
|
39
|
%
|
44
|
%
|
|||
|
|
|||||||
|
2-4
Family
|
8
|
%
|
0
|
%
|
|||
|
Condo
|
6
|
%
|
8
|
%
|
|||
|
Single
Family
|
86
|
%
|
7
|
%
|
|||
|
Other
|
0
|
%
|
85
|
%
|
|||
|
THE
REDWOOD
REVIEW
1ST
QUARTER
2008
|
Table 12C:
Residential Subprime CES and Underlying Loan Characteristics
at
Redwood
|
83
|
|
|
Table
12D: Residential Prime CES and Underlying Loan Characteristics
at
Acacia
($
in thousands)
|
84
|
|
2008
|
||||
|
Q1
|
||||
|
FVO:
Residential Prime CES
|
||||
|
Market
value
|
$77,414
|
|||
|
|
||||
|
Current
Rating
|
||||
|
BB
|
$64,280
|
|||
|
B
|
11,758
|
|||
|
Unrated
|
1,376
|
|||
|
Total
market
value
|
$77,414
|
|||
|
|
||||
|
Security
Type
|
||||
|
Option
ARM
|
$20,475
|
|||
|
ARM
|
5,321
|
|||
|
Hybrid
|
33,629
|
|||
|
Fixed
|
17,989
|
|||
|
Total
market
value
|
$77,414
|
|||
|
|
||||
|
FVO:
Residential Prime CES
|
||||
|
Coupon
income
|
$5,877
|
|||
|
Average
fair-value
|
$135,694
|
|||
|
Annualized
interest income / avg. fair-value
|
17.32
|
%
|
||
|
|
||||
|
Underlying
Loan Characteristics
|
||||
|
Number
of
loans
|
447,407
|
|||
|
Total
loan
face
|
$152,209,076
|
|||
|
Average
loan
size
|
$340,203
|
|||
|
|
||||
|
Southern
CA
|
23
|
%
|
||
|
Northern
CA
|
21
|
%
|
||
|
Florida
|
6
|
%
|
||
|
New
York
|
5
|
%
|
||
|
Georgia
|
2
|
%
|
||
|
New
Jersey
|
3
|
%
|
||
|
Texas
|
3
|
%
|
||
|
Arizona
|
2
|
%
|
||
|
Illinois
|
3
|
%
|
||
|
Colorado
|
2
|
%
|
||
|
Virginia
|
4
|
%
|
||
|
Other
states
|
26
|
%
|
||
|
|
||||
|
Year
2008
origination
|
0
|
%
|
||
|
Year
2007
origination
|
2
|
%
|
||
|
Year
2006
origination
|
22
|
%
|
||
|
Year
2005
origination
|
31
|
%
|
||
|
Year
2004
origination and earlier
|
45
|
%
|
||
|
2008
|
||||
|
Q1
|
||||
|
Wtd
Avg
Original LTV
|
69
|
%
|
||
|
Original
LTV:
0 - 50
|
13
|
%
|
||
|
Original
LTV:
50.01 - 60
|
12
|
%
|
||
|
Original
LTV:
60.01 - 70
|
22
|
%
|
||
|
Original
LTV:
70.01 - 80
|
51
|
%
|
||
|
Original
LTV:
80.01 - 90
|
2
|
%
|
||
|
Original
LTV:
90.01 - 100
|
1
|
%
|
||
|
Unknown
|
0
|
%
|
||
|
|
||||
|
Wtd
Avg
FICO
|
738
|
|||
|
FICO:
<=
600
|
0
|
%
|
||
|
FICO:
601 -
620
|
1
|
%
|
||
|
FICO:
621 -
640
|
2
|
%
|
||
|
|
||||
|
FICO:
641 -
660
|
3
|
%
|
||
|
FICO:
661 -
680
|
6
|
%
|
||
|
FICO:
681 -
700
|
9
|
%
|
||
|
FICO:
701 -
720
|
12
|
%
|
||
|
FICO:
721 -
740
|
13
|
%
|
||
|
FICO:
741 -
760
|
15
|
%
|
||
|
FICO:
761 -
780
|
18
|
%
|
||
|
FICO:
781 -
800
|
14
|
%
|
||
|
FICO:
>=
801
|
5
|
%
|
||
|
Unknown
|
1
|
%
|
||
|
|
||||
|
Conforming
at
Origination %
|
32
|
%
|
||
|
>
$1
MM
%
|
8
|
%
|
||
|
|
||||
|
2nd
Home
%
|
6
|
%
|
||
|
Investment
Home %
|
2
|
%
|
||
|
|
||||
|
Purchase
|
42
|
%
|
||
|
Cash
Out
Refi
|
27
|
%
|
||
|
Rate-Term
Refi
|
29
|
%
|
||
|
Construction
|
0
|
%
|
||
|
Other
|
0
|
%
|
||
|
|
||||
|
Full
Doc
|
47
|
%
|
||
|
No
Doc
|
6
|
%
|
||
|
Other
Doc
(Lim, Red, Stated, etc)
|
44
|
%
|
||
|
Unknown
|
|
|
3
|
%
|
|
|
||||
|
2-4
Family
|
2
|
%
|
||
|
Condo
|
9
|
%
|
||
|
Single
Family
|
89
|
%
|
||
|
Other
|
0
|
%
|
||
|
THE
REDWOOD
REVIEW
1ST
QUARTER
2008
|
Table 12D:
Residential Prime CES and Underlying Loan Characteristics
at
Acacia
|
|
|
|
Table
12E: Residential Prime Alt-A and Underlying Loan Characteristics
at
Acacia
($
in thousands)
|
|
|
2008
|
||||
|
Q1
|
||||
|
FVO:
Residential Prime CES
|
||||
|
Market
value
|
$14,633
|
|||
|
|
||||
|
Current
Rating
|
||||
|
BB
|
$11,758
|
|||
|
B
|
2,808
|
|||
|
Unrated
|
67
|
|||
|
Total
market
value
|
$14,633
|
|||
|
|
||||
|
Security
Type
|
||||
|
Option
ARM
|
$13,322
|
|||
|
ARM
|
138
|
|||
|
Hybrid
|
733
|
|||
|
Fixed
|
440
|
|||
|
Total
market
value
|
$14,633
|
|||
|
|
||||
|
FVO:
Residential Prime CES
|
||||
|
Coupon
income
|
$2,940
|
|||
|
Average
fair-value
|
$31,243
|
|||
|
Annualized
interest income / avg. fair-value
|
37.64
|
%
|
||
|
|
||||
|
Underlying
Loan Characteristics
|
||||
|
Number
of
loans
|
64,507
|
|||
|
Total
loan
face
|
$25,671,374
|
|||
|
Average
loan
size
|
$397,960
|
|||
|
|
||||
|
Southern
CA
|
32
|
%
|
||
|
Northern
CA
|
21
|
%
|
||
|
Florida
|
13
|
%
|
||
|
New
York
|
2
|
%
|
||
|
Georgia
|
1
|
%
|
||
|
New
Jersey
|
2
|
%
|
||
|
Texas
|
1
|
%
|
||
|
Arizona
|
4
|
%
|
||
|
Illinois
|
1
|
%
|
||
|
Colorado
|
2
|
%
|
||
|
Virginia
|
3
|
%
|
||
|
Other
states
|
18
|
%
|
||
|
|
||||
|
Year
2008
origination
|
0
|
%
|
||
|
Year
2007
origination
|
18
|
%
|
||
|
Year
2006
origination
|
58
|
%
|
||
|
Year
2005
origination
|
14
|
%
|
||
|
Year
2004
origination and earlier
|
10
|
%
|
||
|
2008
|
||||
|
Q1
|
||||
|
Wtd
Avg
Original LTV
|
79
|
%
|
||
|
Original
LTV:
0 - 50
|
3
|
%
|
||
|
Original
LTV:
50.01 - 60
|
5
|
%
|
||
|
Original
LTV:
60.01 - 70
|
16
|
%
|
||
|
Original
LTV:
70.01 - 80
|
66
|
%
|
||
|
Original
LTV:
80.01 - 90
|
8
|
%
|
||
|
Original
LTV:
90.01 - 100
|
3
|
%
|
||
|
Unknown
|
0
|
%
|
||
|
|
||||
|
Wtd
Avg
FICO
|
702
|
|||
|
FICO:
<=
600
|
0
|
%
|
||
|
FICO:
601 -
620
|
1
|
%
|
||
|
FICO:
621 -
640
|
6
|
%
|
||
|
FICO:
641 -
660
|
10
|
%
|
||
|
FICO:
661 -
680
|
17
|
%
|
||
|
FICO:
681 -
700
|
18
|
%
|
||
|
FICO:
701 -
720
|
14
|
%
|
||
|
FICO:
721 -
740
|
12
|
%
|
||
|
FICO:
741 -
760
|
9
|
%
|
||
|
FICO:
761 -
780
|
7
|
%
|
||
|
FICO:
781 -
800
|
4
|
%
|
||
|
FICO:
>=
801
|
1
|
%
|
||
|
Unknown
|
1
|
%
|
||
|
|
||||
|
Conforming
at
Origination %
|
44
|
%
|
||
|
>
$1
MM
%
|
13
|
%
|
||
|
|
||||
|
2nd
Home
%
|
6
|
%
|
||
|
Investment
Home %
|
11
|
%
|
||
|
|
||||
|
Purchase
|
29
|
%
|
||
|
Cash
Out
Refi
|
47
|
%
|
||
|
Rate-Term
Refi
|
23
|
%
|
||
|
Construction
|
0
|
%
|
||
|
Other
|
0
|
%
|
||
|
|
||||
|
Full
Doc
|
13
|
%
|
||
|
No
Doc
|
3
|
%
|
||
|
Other
Doc
(Lim, Red, Stated, etc)
|
83
|
%
|
||
| Unknown | 1 | % | ||
|
|
||||
|
2-4
Family
|
6
|
%
|
||
|
Condo
|
10
|
%
|
||
|
Single
Family
|
84
|
%
|
||
|
Other
|
0
|
%
|
||
|
THE
REDWOOD
REVIEW
1ST
QUARTER
2008
|
Table 12E:
Residential Prime Alt-A and Underlying Loan Characteristics
at
Acacia
|
85
|
|
|
Table
12F: Residential Subprime and Underlying Loan Characteristics
at
Acacia
($
in thousands)
|
86
|
|
2008
|
||||
|
Q1
|
||||
|
FVO:
Residential Subprime CES
|
||||
|
Market
value
|
$10,877
|
|||
|
|
||||
|
Current
Rating
|
||||
|
BB
|
$4,670
|
|||
|
B
|
291
|
|||
|
Unrated
|
5,916
|
|||
|
Total
market
value
|
$10,877
|
|||
|
|
||||
|
Security
Type
|
||||
|
Option
ARM
|
$
-
|
|||
|
ARM
|
-
|
|||
|
Hybrid
|
8,158
|
|||
|
Fixed
|
2,719
|
|||
|
Total
market
value
|
$10,877
|
|||
|
|
||||
|
FVO:
Residential Subprime CES
|
||||
|
Coupon
income
|
$1,629
|
|||
|
Average
fair-value
|
$13,116
|
|||
|
Annualized
interest income / avg. fair-value
|
49.68
|
%
|
||
|
|
||||
|
Underlying
Loan Characteristics
|
||||
|
Number
of
loans
|
153,344
|
|||
|
Total
loan
face
|
$22,306,420
|
|||
|
Average
loan
size
|
$145,467
|
|||
|
|
||||
|
Southern
CA
|
17
|
%
|
||
|
Northern
CA
|
10
|
%
|
||
|
Florida
|
12
|
%
|
||
|
New
York
|
6
|
%
|
||
|
Georgia
|
2
|
%
|
||
|
New
Jersey
|
4
|
%
|
||
|
Texas
|
5
|
%
|
||
|
Arizona
|
3
|
%
|
||
|
Illinois
|
3
|
%
|
||
|
Colorado
|
2
|
%
|
||
|
Virginia
|
2
|
%
|
||
|
Other
states
|
33
|
%
|
||
|
|
||||
|
Year
2008
origination
|
0
|
%
|
||
|
Year
2007
origination
|
3
|
%
|
||
|
Year
2006
origination
|
90
|
%
|
||
|
Year
2005
origination
|
3
|
%
|
||
|
Year
2004
origination and earlier
|
4
|
%
|
||
|
Wtd
Avg
Original LTV
|
89
|
%
|
||
|
Original
LTV:
0 - 50
|
2
|
%
|
||
|
Original
LTV:
50.01 - 60
|
3
|
%
|
||
|
Original
LTV:
60.01 - 70
|
7
|
%
|
||
|
Original
LTV:
70.01 - 80
|
41
|
%
|
||
|
Original
LTV:
80.01 - 90
|
23
|
%
|
||
|
Original
LTV:
90.01 - 100
|
24
|
%
|
||
|
Unknown
|
0
|
%
|
||
|
|
||||
|
Wtd
Avg
FICO
|
633
|
|||
|
FICO:
<=
600
|
27
|
%
|
||
|
FICO:
601 -
620
|
14
|
%
|
||
|
FICO:
621 -
640
|
15
|
%
|
||
|
FICO:
641 -
660
|
15
|
%
|
||
|
FICO:
661 -
680
|
11
|
%
|
||
|
FICO:
681 -
700
|
7
|
%
|
||
|
FICO:
701 -
720
|
5
|
%
|
||
|
FICO:
721 -
740
|
3
|
%
|
||
|
FICO:
741 -
760
|
2
|
%
|
||
|
FICO:
761 -
780
|
1
|
%
|
||
|
FICO:
781 -
800
|
1
|
%
|
||
|
FICO:
>=
801
|
0
|
%
|
||
|
Unknown
|
0
|
%
|
||
|
|
||||
|
Conforming
at
Origination %
|
79
|
%
|
||
|
>
$1
MM
%
|
1
|
%
|
||
|
|
||||
|
2nd
Home
%
|
1
|
%
|
||
|
Investment
Home %
|
5
|
%
|
||
|
|
||||
|
Purchase
|
49
|
%
|
||
|
Cash
Out
Refi
|
46
|
%
|
||
|
Rate-Term
Refi
|
5
|
%
|
||
|
Construction
|
0
|
%
|
||
|
Other
|
0
|
%
|
||
|
|
||||
|
Full
Doc
|
60
|
%
|
||
|
No
Doc
|
0
|
%
|
||
|
Other
Doc
(Lim, Red, Stated, etc)
|
40
|
%
|
||
|
|
||||
|
2-4
Family
|
7
|
%
|
||
|
Condo
|
7
|
%
|
||
|
Single
Family
|
86
|
%
|
||
|
Other
|
0
|
%
|
|
THE
REDWOOD
REVIEW
1ST
QUARTER
2008
|
Table 12F:
Residential Subprime and Underlying Loan Characteristics
at
Acacia
|
|
|
|
Table
13A - Other Real Estate Investments and Underlying Characteristics
at
Redwood
($
in thousands)1
|
|
|
2008
|
2007
|
2007
|
2007
|
2007
|
||||||||||||
|
|
Q1
|
Q4
|
Q3
|
Q2
|
Q1
|
|||||||||||
|
|
||||||||||||||||
|
Market
value
|
$3,437
|
$11,199
|
$24,100
|
$32,204
|
$47,443
|
|||||||||||
|
|
||||||||||||||||
|
Current
Rating
|
||||||||||||||||
|
AAA
|
$
-
|
$1,386
|
$1,720
|
$1,667
|
$1,892
|
|||||||||||
|
AA
|
-
|
-
|
-
|
-
|
-
|
|||||||||||
|
A
|
-
|
1,061
|
7,468
|
12,131
|
16,260
|
|||||||||||
|
BBB
|
-
|
1,610
|
2,953
|
4,437
|
5,700
|
|||||||||||
|
BB
|
1,220
|
1,730
|
1,757
|
3,775
|
4,185
|
|||||||||||
|
B
|
771
|
2,639
|
2,482
|
-
|
-
|
|||||||||||
|
Non-rated
|
1,446
|
2,773
|
7,720
|
10,194
|
19,406
|
|||||||||||
|
Total
market
value
|
$3,437
|
$11,199
|
$24,100
|
$32,204
|
$47,443
|
|||||||||||
|
|
||||||||||||||||
|
Security
Type
|
||||||||||||||||
|
ARM
|
$
-
|
$438
|
$466
|
$261
|
$276
|
|||||||||||
|
Option
ARM
|
-
|
1,488
|
2,051
|
2,597
|
3,198
|
|||||||||||
|
Hybrid
|
2,613
|
8,409
|
19,812
|
27,418
|
41,501
|
|||||||||||
|
Fixed
|
824
|
864
|
1,771
|
1,928
|
2,468
|
|||||||||||
|
Total
market
value
|
$3,437
|
$11,199
|
$24,100
|
$32,204
|
$47,443
|
|||||||||||
|
|
||||||||||||||||
|
Interest
income
|
$2,092
|
$1,307
|
$1,236
|
$618
|
$2,336
|
|||||||||||
|
|
||||||||||||||||
|
Average
amortized cost
|
$5,836
|
$22,006
|
$29,708
|
$41,528
|
$35,228
|
|||||||||||
|
|
||||||||||||||||
|
Annualized
interest income / avg amt cost
|
143.38
|
%
|
23.76
|
%
|
16.64
|
%
|
5.95
|
%
|
26.53
|
%
|
||||||
|
THE
REDWOOD
REVIEW
1ST
QUARTER
2008
|
Table 13A
- Other Real Estate Investments and Underlying Characteristics
at
Redwood
|
87
|
|
|
Table
13B- Other Real Estate Investments and Underlying Characteristics
at
Acacia
($
in thousands)1
|
88
|
|
2007
|
2007
|
2007
|
2007
|
||||||||||
|
|
Q4
|
Q3
|
Q2
|
Q1
|
|||||||||
|
|
|||||||||||||
|
Market
value
|
$322
|
$1,200
|
$1,964
|
$2,614
|
|||||||||
|
|
|||||||||||||
|
Current
Rating
|
|||||||||||||
|
AAA
|
$227
|
$241
|
$138
|
$146
|
|||||||||
|
AA
|
-
|
-
|
-
|
-
|
|||||||||
|
A
|
-
|
959
|
1,826
|
2,468
|
|||||||||
|
BBB
|
-
|
-
|
-
|
-
|
|||||||||
|
BB
|
-
|
-
|
-
|
-
|
|||||||||
|
B
|
95
|
-
|
-
|
-
|
|||||||||
|
Non-rated
|
-
|
-
|
-
|
||||||||||
|
Total
market
value
|
$322
|
$1,200
|
$1,964
|
$2,614
|
|||||||||
|
|
|||||||||||||
|
Security
Type
|
|||||||||||||
|
ARM
|
$227
|
$241
|
$138
|
$146
|
|||||||||
|
Option
ARM
|
-
|
-
|
-
|
-
|
|||||||||
|
Hybrid
|
95
|
959
|
1,826
|
2,468
|
|||||||||
|
Fixed
|
-
|
-
|
-
|
-
|
|||||||||
|
Total
market
value
|
$322
|
$1,200
|
$1,964
|
$2,614
|
|||||||||
|
|
|||||||||||||
|
Interest
income
|
$46
|
$39
|
$51
|
$129
|
|||||||||
|
|
|||||||||||||
|
Average
amortized cost
|
$633
|
$1,479
|
$2,533
|
$1,941
|
|||||||||
|
|
|||||||||||||
|
Annualized
interest income / avg amt cost
|
29.08
|
%
|
10.55
|
%
|
8.05
|
%
|
26.53
|
%
|
|||||
|
THE
REDWOOD
REVIEW
1ST
QUARTER
2008
|
Table 13B-
Other Real Estate Investments and Underlying Characteristics
at
Acacia
|
|
|
|
Table
14: Residential Real Estate Loan Characteristics
($
in thousands)
|
|
|
2008
|
2007
|
2007
|
2007
|
2007
|
2006
|
2006
|
2006
|
2006
|
||||||||||||||||||||
|
Q1
|
Q4
|
Q3
|
Q2
|
Q1
|
Q4
|
Q3
|
Q2
|
Q1
|
||||||||||||||||||||
|
Residential
Loans
|
$6,702,726
|
$7,106,018
|
$7,546,529
|
$8,256,759
|
$8,582,964
|
$9,212,002
|
$9,718,985
|
$10,318,641
|
$11,846,454
|
|||||||||||||||||||
|
Number
of
loans
|
19,801
|
21,000
|
21,981
|
24,452
|
25,579
|
27,695
|
31,744
|
34,013
|
37,458
|
|||||||||||||||||||
|
Average
loan
size
|
$338,504
|
$338
|
$343
|
$338
|
$336
|
$333
|
$306
|
$303
|
$316
|
|||||||||||||||||||
|
Adjustable
%
|
67
|
%
|
68
|
%
|
69
|
%
|
71
|
%
|
79
|
%
|
85
|
%
|
89
|
%
|
99
|
%
|
99
|
%
|
||||||||||
|
Hybrid
%
|
33
|
%
|
32
|
%
|
31
|
%
|
29
|
%
|
20
|
%
|
15
|
%
|
11
|
%
|
1
|
%
|
1
|
%
|
||||||||||
|
Fixed
%
|
0
|
%
|
0
|
%
|
0
|
%
|
0
|
%
|
1
|
%
|
0
|
%
|
0
|
%
|
0
|
%
|
0
|
%
|
||||||||||
|
Amortizing
%
|
5
|
%
|
5
|
%
|
5
|
%
|
5
|
%
|
4
|
%
|
3
|
%
|
3
|
%
|
1
|
%
|
1
|
%
|
||||||||||
|
Interest-only
%
|
95
|
%
|
95
|
%
|
95
|
%
|
95
|
%
|
96
|
%
|
97
|
%
|
97
|
%
|
99
|
%
|
99
|
%
|
||||||||||
|
Negatively
amortizing %
|
0
|
%
|
0
|
%
|
0
|
%
|
0
|
%
|
0
|
%
|
0
|
%
|
0
|
%
|
0
|
%
|
0
|
%
|
||||||||||
|
Southern
California
|
15
|
%
|
14
|
%
|
15
|
%
|
14
|
%
|
14
|
%
|
13
|
%
|
12
|
%
|
11
|
%
|
11
|
%
|
||||||||||
|
Northern
California
|
11
|
%
|
10
|
%
|
10
|
%
|
11
|
%
|
10
|
%
|
10
|
%
|
10
|
%
|
10
|
%
|
10
|
%
|
||||||||||
|
Florida
|
13
|
%
|
13
|
%
|
12
|
%
|
12
|
%
|
13
|
%
|
12
|
%
|
12
|
%
|
13
|
%
|
12
|
%
|
||||||||||
|
New
York
|
6
|
%
|
6
|
%
|
6
|
%
|
6
|
%
|
6
|
%
|
6
|
%
|
6
|
%
|
6
|
%
|
6
|
%
|
||||||||||
|
Georgia
|
4
|
%
|
4
|
%
|
4
|
%
|
4
|
%
|
5
|
%
|
5
|
%
|
5
|
%
|
5
|
%
|
5
|
%
|
||||||||||
|
New
Jersey
|
4
|
%
|
4
|
%
|
4
|
%
|
4
|
%
|
4
|
%
|
4
|
%
|
4
|
%
|
4
|
%
|
4
|
%
|
||||||||||
|
Texas
|
4
|
%
|
5
|
%
|
5
|
%
|
5
|
%
|
5
|
%
|
5
|
%
|
5
|
%
|
5
|
%
|
5
|
%
|
||||||||||
|
Arizona
|
3
|
%
|
4
|
%
|
4
|
%
|
4
|
%
|
4
|
%
|
4
|
%
|
4
|
%
|
4
|
%
|
4
|
%
|
||||||||||
|
Illinois
|
3
|
%
|
3
|
%
|
3
|
%
|
3
|
%
|
3
|
%
|
3
|
%
|
3
|
%
|
2
|
%
|
2
|
%
|
||||||||||
|
Colorado
|
3
|
%
|
3
|
%
|
3
|
%
|
3
|
%
|
3
|
%
|
4
|
%
|
4
|
%
|
4
|
%
|
4
|
%
|
||||||||||
|
Virginia
|
3
|
%
|
3
|
%
|
3
|
%
|
3
|
%
|
3
|
%
|
3
|
%
|
3
|
%
|
3
|
%
|
3
|
%
|
||||||||||
|
Other
states
(none greater than 3%)
|
30
|
%
|
31
|
%
|
31
|
%
|
31
|
%
|
30
|
%
|
31
|
%
|
32
|
%
|
33
|
%
|
34
|
%
|
||||||||||
|
Year
2008
origination
|
0
|
%
|
0
|
%
|
0
|
%
|
0
|
%
|
0
|
%
|
0
|
%
|
0
|
%
|
0
|
%
|
0
|
%
|
||||||||||
|
Year
2007
origination
|
13
|
%
|
13
|
%
|
12
|
%
|
11
|
%
|
3
|
%
|
0
|
%
|
0
|
%
|
0
|
%
|
0
|
%
|
||||||||||
|
Year
2006
origination
|
20
|
%
|
20
|
%
|
19
|
%
|
18
|
%
|
19
|
%
|
17
|
%
|
10
|
%
|
0
|
%
|
0
|
%
|
||||||||||
|
Year
2005
origination
|
5
|
%
|
5
|
%
|
5
|
%
|
5
|
%
|
5
|
%
|
5
|
%
|
5
|
%
|
5
|
%
|
5
|
%
|
||||||||||
|
Year
2004
origination or earlier
|
62
|
%
|
62
|
%
|
64
|
%
|
66
|
%
|
73
|
%
|
78
|
%
|
85
|
%
|
95
|
%
|
95
|
%
|
||||||||||
|
Wtd
Avg
Original LTV
|
69
|
%
|
69
|
%
|
68
|
%
|
68
|
%
|
68
|
%
|
68
|
%
|
68
|
%
|
68
|
%
|
68
|
%
|
||||||||||
|
Original
LTV:
0 - 50
|
15
|
%
|
15
|
%
|
15
|
%
|
15
|
%
|
15
|
%
|
16
|
%
|
15
|
%
|
15
|
%
|
15
|
%
|
||||||||||
|
Original
LTV:
50 - 60
|
11
|
%
|
11
|
%
|
11
|
%
|
11
|
%
|
12
|
%
|
12
|
%
|
12
|
%
|
12
|
%
|
12
|
%
|
||||||||||
|
Original
LTV:
60 - 70
|
19
|
%
|
19
|
%
|
19
|
%
|
20
|
%
|
20
|
%
|
20
|
%
|
20
|
%
|
21
|
%
|
21
|
%
|
||||||||||
|
Original
LTV:
70 - 80
|
49
|
%
|
48
|
%
|
48
|
%
|
47
|
%
|
46
|
%
|
45
|
%
|
46
|
%
|
45
|
%
|
45
|
%
|
||||||||||
|
Original
LTV:
80 - 90
|
2
|
%
|
2
|
%
|
2
|
%
|
2
|
%
|
2
|
%
|
2
|
%
|
2
|
%
|
2
|
%
|
2
|
%
|
||||||||||
|
Original
LTV:
90 - 100
|
4
|
%
|
5
|
%
|
5
|
%
|
5
|
%
|
5
|
%
|
5
|
%
|
5
|
%
|
5
|
%
|
5
|
%
|
||||||||||
|
Wtg
Avg FICO
|
732
|
732
|
732
|
732
|
727
|
733
|
730
|
730
|
730
|
|||||||||||||||||||
|
FICO:
<=
600
|
1
|
%
|
1
|
%
|
1
|
%
|
1
|
%
|
1
|
%
|
1
|
%
|
1
|
%
|
1
|
%
|
1
|
%
|
||||||||||
|
FICO:
601 -620
|
1
|
%
|
1
|
%
|
1
|
%
|
1
|
%
|
1
|
%
|
1
|
%
|
1
|
%
|
1
|
%
|
1
|
%
|
||||||||||
|
FICO:
621 -
640
|
2
|
%
|
1
|
%
|
2
|
%
|
2
|
%
|
2
|
%
|
1
|
%
|
1
|
%
|
1
|
%
|
2
|
%
|
||||||||||
|
FICO:
641 -660
|
3
|
%
|
3
|
%
|
3
|
%
|
3
|
%
|
3
|
%
|
3
|
%
|
3
|
%
|
3
|
%
|
3
|
%
|
||||||||||
|
FICO:
661 -
680
|
7
|
%
|
7
|
%
|
7
|
%
|
7
|
%
|
7
|
%
|
8
|
%
|
8
|
%
|
8
|
%
|
8
|
%
|
||||||||||
|
FICO:
681 -
700
|
12
|
%
|
12
|
%
|
12
|
%
|
12
|
%
|
12
|
%
|
12
|
%
|
12
|
%
|
12
|
%
|
12
|
%
|
||||||||||
|
FICO:
701 -
720
|
13
|
%
|
14
|
%
|
13
|
%
|
14
|
%
|
14
|
%
|
14
|
%
|
14
|
%
|
14
|
%
|
14
|
%
|
||||||||||
|
FICO:
721 -
740
|
13
|
%
|
13
|
%
|
13
|
%
|
13
|
%
|
13
|
%
|
13
|
%
|
14
|
%
|
13
|
%
|
13
|
%
|
||||||||||
|
FICO:
741 -
760
|
15
|
%
|
15
|
%
|
15
|
%
|
15
|
%
|
15
|
%
|
15
|
%
|
15
|
%
|
15
|
%
|
15
|
%
|
||||||||||
|
FICO:
761 -
780
|
17
|
%
|
17
|
%
|
17
|
%
|
17
|
%
|
17
|
%
|
17
|
%
|
17
|
%
|
17
|
%
|
17
|
%
|
||||||||||
|
FICO:
781 -
800
|
13
|
%
|
13
|
%
|
13
|
%
|
13
|
%
|
12
|
%
|
12
|
%
|
12
|
%
|
12
|
%
|
11
|
%
|
||||||||||
|
FICO:
>=
801
|
4
|
%
|
3
|
%
|
4
|
%
|
4
|
%
|
3
|
%
|
3
|
%
|
2
|
%
|
3
|
%
|
3
|
%
|
||||||||||
|
Conforming
balance at origination %
|
34
|
%
|
34
|
%
|
35
|
%
|
35
|
%
|
37
|
%
|
38
|
%
|
41
|
%
|
45
|
%
|
37
|
%
|
||||||||||
|
%
balance in
loans > $1mm per loan
|
15
|
%
|
15
|
%
|
15
|
%
|
15
|
%
|
16
|
%
|
18
|
%
|
14
|
%
|
14
|
%
|
14
|
%
|
||||||||||
|
2nd
home %
|
11
|
%
|
11
|
%
|
11
|
%
|
11
|
%
|
11
|
%
|
11
|
%
|
11
|
%
|
11
|
%
|
11
|
%
|
||||||||||
|
Investment
home %
|
3
|
%
|
3
|
%
|
3
|
%
|
3
|
%
|
3
|
%
|
3
|
%
|
3
|
%
|
3
|
%
|
3
|
%
|
||||||||||
|
Purchase
|
36
|
%
|
36
|
%
|
36
|
%
|
35
|
%
|
35
|
%
|
34
|
%
|
34
|
%
|
33
|
%
|
33
|
%
|
||||||||||
|
Cash
out
refinance
|
32
|
%
|
32
|
%
|
32
|
%
|
32
|
%
|
31
|
%
|
32
|
%
|
32
|
%
|
32
|
%
|
34
|
%
|
||||||||||
|
Rate-term
refinance
|
30
|
%
|
30
|
%
|
31
|
%
|
31
|
%
|
32
|
%
|
32
|
%
|
32
|
%
|
34
|
%
|
32
|
%
|
||||||||||
|
Construction
|
0
|
%
|
0
|
%
|
0
|
%
|
0
|
%
|
0
|
%
|
0
|
%
|
0
|
%
|
0
|
%
|
0
|
%
|
||||||||||
|
Other
|
2
|
%
|
2
|
%
|
2
|
%
|
2
|
%
|
2
|
%
|
2
|
%
|
2
|
%
|
1
|
%
|
1
|
%
|
||||||||||
|
THE
REDWOOD
REVIEW
1ST
QUARTER
2008
|
Table 14:
Residential Real Estate Loan Characteristics
|
89
|
|
|
Table
15: Commercial Real Estate Loans Credit
Performance ($
in thousands)
|
|
|
Managed
Loans
|
Internally-Designated
Credit Reserve
|
External
Credit Enhancement
|
Total
Credit Protection (2)
|
Total
Credit Protection as % of Loans
|
Seriously
Delinquent Loans
|
Seriously
Delinquent Loan % of Current Balance
|
Total
Credit Losses
|
Third
Parties' Share of Net Charge-offs/ (Recoveries)
|
Redwood's
Share of Net Charge-offs/ (Recoveries)
|
Total
Credit Losses As % of Loans (Annualized)
|
|||||||||||||||||||||||||||
|
Total
Managed Commercial Portfolio
|
2005
|
$
|
46,825,453
|
$
|
149,947
|
$
|
714,168
|
$
|
864,115
|
1.85
|
%
|
40,916
|
0.09
|
%
|
$
|
1,587
|
$
|
1,272
|
$
|
315
|
0.00
|
%
|
|||||||||||||||
|
Q1:
2006
|
48,366,213
|
175,913
|
645,675
|
821,588
|
1.70
|
%
|
38,124
|
0.08
|
%
|
90
|
55
|
35
|
0.00
|
%
|
|||||||||||||||||||||||
|
Q2:
2006
|
51,635,796
|
200,275
|
653,476
|
853,751
|
1.65
|
%
|
44,632
|
0.09
|
%
|
1,463
|
1,463
|
-
|
0.01
|
%
|
|||||||||||||||||||||||
|
Q3:
2006
|
58,106,355
|
266,523
|
678,489
|
945,012
|
1.63
|
%
|
70,586
|
0.12
|
%
|
2,167
|
1,705
|
462
|
0.01
|
%
|
|||||||||||||||||||||||
|
Q4:
2006
|
57,789,159
|
303,481
|
472,669
|
776,150
|
1.34
|
%
|
64,367
|
0.11
|
%
|
1,156
|
1,132
|
24
|
0.01
|
%
|
|||||||||||||||||||||||
|
2006
|
57,789,159
|
303,481
|
472,669
|
776,150
|
1.34
|
%
|
64,367
|
0.11
|
%
|
4,876
|
4,355
|
521
|
0.03
|
%
|
|||||||||||||||||||||||
|
Q1:
2007
|
57,450,042
|
304,955
|
551,917
|
856,872
|
1.49
|
%
|
77,726
|
0.14
|
%
|
2,688
|
1,417
|
1,271
|
0.02
|
%
|
|||||||||||||||||||||||
|
Q2:
2007
|
63,626,147
|
321,234
|
584,706
|
905,940
|
1.42
|
%
|
73,104
|
0.10
|
%
|
72
|
30
|
42
|
0.00
|
%
|
|||||||||||||||||||||||
|
Q3:
2007
|
65,030,244
|
320,987
|
577,447
|
898,434
|
1.38
|
%
|
181,473
|
0.28
|
%
|
680
|
408
|
272
|
0.00
|
%
|
|||||||||||||||||||||||
|
Q4:
2007
|
61,776,102
|
328,945
|
427,868
|
756,813
|
1.23
|
%
|
183,093
|
0.30
|
%
|
1,952
|
1,171
|
781
|
0.01
|
%
|
|||||||||||||||||||||||
|
2007
|
$
|
61,776,102
|
$
|
328,945
|
$
|
427,868
|
$
|
756,813
|
1.23
|
%
|
$
|
183,093
|
0.30
|
%
|
$
|
5,392
|
$
|
3,026
|
$
|
2,366
|
0.01
|
%
|
|||||||||||||||
|
Q1:
2008(1)
|
|
$
|
54,746,581
|
$
|
389,014
|
$
|
63,299
|
$
|
452,313
|
0.83
|
%
|
$
|
227,494
|
0.42
|
%
|
$
|
42
|
$
|
4
|
$
|
38
|
0.00
|
%
|
||||||||||||||
|
Commercial
Real Estate Loans
|
2005
|
$
|
70,091
|
$
|
8,141
|
$
|
0
|
$
|
8,141
|
11.61
|
%
|
-
|
0.00
|
%
|
$
|
315
|
$
|
0
|
$
|
315
|
0.45
|
%
|
|||||||||||||||
|
Q1:
2006
|
65,508
|
8,141
|
-
|
8,141
|
12.43
|
%
|
-
|
0.00
|
%
|
35
|
-
|
35
|
0.21
|
%
|
|||||||||||||||||||||||
|
Q2:
2006
|
46,959
|
8,141
|
-
|
8,141
|
17.34
|
%
|
-
|
0.00
|
%
|
-
|
-
|
-
|
0.00
|
%
|
|||||||||||||||||||||||
|
Q3:
2006
|
42,384
|
8,141
|
-
|
8,141
|
19.21
|
%
|
-
|
0.00
|
%
|
-
|
-
|
-
|
0.00
|
%
|
|||||||||||||||||||||||
|
Q4:
2006
|
38,360
|
8,141
|
-
|
8,141
|
21.22
|
%
|
-
|
0.00
|
%
|
-
|
-
|
-
|
0.00
|
%
|
|||||||||||||||||||||||
|
2006
|
38,360
|
8,141
|
-
|
8,141
|
21.22
|
%
|
-
|
0.00
|
%
|
35
|
-
|
35
|
0.36
|
%
|
|||||||||||||||||||||||
|
Q1:
2007
|
38,394
|
10,489
|
-
|
10,489
|
27.32
|
%
|
-
|
0.00
|
%
|
-
|
-
|
-
|
0.00
|
%
|
|||||||||||||||||||||||
|
Q2:
2007
|
38,311
|
10,489
|
-
|
10,489
|
27.38
|
%
|
-
|
0.00
|
%
|
-
|
-
|
-
|
0.00
|
%
|
|||||||||||||||||||||||
|
Q3:
2007
|
38,224
|
10,489
|
-
|
10,489
|
34.07
|
%
|
-
|
0.00
|
%
|
-
|
-
|
-
|
0.00
|
%
|
|||||||||||||||||||||||
|
Q4:
2007
|
38,111
|
10,489
|
-
|
10,489
|
27.52
|
%
|
-
|
0.00
|
%
|
-
|
-
|
-
|
0.00
|
%
|
|||||||||||||||||||||||
|
2007
|
$
|
38,111
|
$
|
10,489
|
$
|
0
|
$
|
10,489
|
27.52
|
%
|
$
|
0
|
0.00
|
%
|
$
|
0
|
$
|
0
|
$
|
0
|
0.00
|
%
|
|||||||||||||||
|
Q1:
2008(1)
|
|
$
|
10,645
|
$
|
10,626
|
$
|
0
|
$
|
10,626
|
99.82
|
%
|
$
|
0
|
0.00
|
%
|
$
|
0
|
$
|
0
|
$
|
0
|
0.00
|
%
|
||||||||||||||
|
Commercial
CES
|
2005
|
$
|
46,755,362
|
$
|
141,806
|
$
|
714,168
|
$
|
855,974
|
1.83
|
%
|
40,916
|
0.09
|
%
|
$
|
1,272
|
$
|
1,272
|
$
|
0
|
0.00
|
%
|
|||||||||||||||
|
Q1:
2006
|
48,300,705
|
167,772
|
645,675
|
813,447
|
1.68
|
%
|
38,124
|
0.08
|
%
|
55
|
55
|
-
|
0.00
|
%
|
|||||||||||||||||||||||
|
Q2:
2006
|
51,588,837
|
192,134
|
653,476
|
845,610
|
1.64
|
%
|
44,632
|
0.09
|
%
|
1,463
|
1,463
|
-
|
0.01
|
%
|
|||||||||||||||||||||||
|
Q3:
2006
|
58,063,971
|
258,382
|
678,489
|
936,871
|
1.61
|
%
|
70,586
|
0.12
|
%
|
2,167
|
1,705
|
462
|
0.01
|
%
|
|||||||||||||||||||||||
|
Q4:
2006
|
57,750,799
|
295,340
|
472,669
|
768,009
|
1.33
|
%
|
64,367
|
0.11
|
%
|
1,156
|
1,132
|
24
|
0.01
|
%
|
|||||||||||||||||||||||
|
2006
|
57,750,799
|
295,340
|
472,669
|
768,009
|
1.33
|
%
|
64,367
|
0.11
|
%
|
4,841
|
4,355
|
486
|
0.01
|
%
|
|||||||||||||||||||||||
|
Q1:
2007
|
57,411,648
|
294,466
|
551,917
|
846,383
|
1.47
|
%
|
77,726
|
0.14
|
%
|
2,688
|
1,417
|
1,271
|
0.02
|
%
|
|||||||||||||||||||||||
|
Q2:
2007
|
63,587,836
|
310,745
|
584,706
|
895,451
|
1.41
|
%
|
73,104
|
0.10
|
%
|
72
|
30
|
42
|
0.00
|
%
|
|||||||||||||||||||||||
|
Q3:
2007
|
64,999,460
|
310,498
|
577,447
|
887,945
|
1.37
|
%
|
181,473
|
0.28
|
%
|
680
|
408
|
272
|
0.00
|
%
|
|||||||||||||||||||||||
|
Q4:
2007
|
61,737,991
|
318,456
|
427,868
|
746,324
|
1.21
|
%
|
183,093
|
0.30
|
%
|
1,952
|
1,171
|
781
|
0.01
|
%
|
|||||||||||||||||||||||
|
2007
|
$
|
61,737,991
|
$
|
318,456
|
$
|
427,868
|
$
|
746,324
|
1.21
|
%
|
$
|
183,093
|
0.30
|
%
|
$
|
5,392
|
$
|
3,026
|
$
|
2,366
|
0.01
|
%
|
|||||||||||||||
|
Q1:
2008(1)
|
|
$
|
54,735,936
|
$
|
378,388
|
$
|
63,299
|
$
|
441,687
|
0.81
|
%
|
$
|
227,494
|
0.42
|
%
|
$
|
42
|
$
|
4
|
$
|
38
|
0.00
|
%
|
||||||||||||||
|
THE
REDWOOD
REVIEW
1ST
QUARTER
2008
|
Table 15:
Commercial Real Estate Loans Credit Performance
|
90
|
|
|
Table
16A: Commercial CES Underlying Loan Characteristics at Redwood
(all
$ in thousands) 1
|
91
|
|
2008
|
||||
|
Q1
|
||||
|
Commercial
CES
Loans
|
$54,735,936
|
|||
|
Number
of
loans
|
3,407
|
|||
|
Average
face
value
|
$14,629
|
|||
|
State
Distribution
|
||||
|
CA
|
15
|
%
|
||
|
NY
|
13
|
%
|
||
|
TX
|
9
|
%
|
||
|
VA
|
5
|
%
|
||
|
FL
|
6
|
%
|
||
|
Other
|
52
|
%
|
||
|
Property
Type Distribution
|
||||
|
Office
|
39
|
%
|
||
|
Retail
|
28
|
%
|
||
|
Multi-family
|
16
|
%
|
||
|
Hospitality
|
7
|
%
|
||
|
Self-storage
|
3
|
%
|
||
|
Industrial
|
4
|
%
|
||
|
Other
|
4
|
%
|
||
|
Weighted
average LTV
|
70
|
%
|
||
|
Weighted
average debt service coverage ratio
|
1.60
|
|||
|
THE
REDWOOD
REVIEW
1ST
QUARTER
2008
|
Table 16A:
Commercial CES Underlying Loan Characteristics at Redwood
|
|
|
|
Table
16B: Commercial CES Underlying Loan
Characteristics
|
|
|
2007
|
2007
|
2007
|
2007
|
2006
|
2006
|
2006
|
2006
|
||||||||||||||||||
|
Q4
|
Q3
|
Q2
|
Q1
|
Q4
|
Q3
|
Q2
|
Q1
|
||||||||||||||||||
|
Commercial
CES
Loans
|
$61,737,991
|
$64,999,460
|
$63,587,836
|
$57,411,648
|
$57,750,799
|
$58,063,971
|
$51,588,837
|
$48,300,705
|
|||||||||||||||||
|
Number
of
loans
|
4,091
|
4,633
|
4,648
|
3,968
|
3,889
|
4,032
|
3,456
|
3,737
|
|||||||||||||||||
|
Average
face
value
|
$14,398
|
$14,030
|
$13,681
|
$14,469
|
$14,850
|
$14,401
|
$14,927
|
$12,925
|
|||||||||||||||||
|
State
Distribution
|
|||||||||||||||||||||||||
|
CA
|
16
|
%
|
16
|
%
|
16
|
%
|
17
|
%
|
17
|
%
|
18
|
%
|
18
|
%
|
17
|
%
|
|||||||||
|
NY
|
13
|
%
|
13
|
%
|
13
|
%
|
13
|
%
|
13
|
%
|
11
|
%
|
12
|
%
|
12
|
%
|
|||||||||
|
TX
|
8
|
%
|
8
|
%
|
8
|
%
|
8
|
%
|
8
|
%
|
5
|
%
|
6
|
%
|
6
|
%
|
|||||||||
|
VA
|
5
|
%
|
5
|
%
|
4
|
%
|
4
|
%
|
4
|
%
|
2
|
%
|
2
|
%
|
2
|
%
|
|||||||||
|
FL
|
6
|
%
|
6
|
%
|
6
|
%
|
6
|
%
|
6
|
%
|
5
|
%
|
5
|
%
|
5
|
%
|
|||||||||
|
Other
|
52
|
%
|
52
|
%
|
52
|
%
|
52
|
%
|
52
|
%
|
59
|
%
|
57
|
%
|
58
|
%
|
|||||||||
|
Property
Type Distribution
|
|||||||||||||||||||||||||
|
Office
|
38
|
%
|
39
|
%
|
38
|
%
|
35
|
%
|
37
|
%
|
30
|
%
|
36
|
%
|
32
|
%
|
|||||||||
|
Retail
|
30
|
%
|
30
|
%
|
30
|
%
|
30
|
%
|
31
|
%
|
32
|
%
|
32
|
%
|
33
|
%
|
|||||||||
|
Multi-family
|
16
|
%
|
14
|
%
|
15
|
%
|
12
|
%
|
12
|
%
|
11
|
%
|
11
|
%
|
16
|
%
|
|||||||||
|
Hospitality
|
7
|
%
|
7
|
%
|
7
|
%
|
7
|
%
|
7
|
%
|
6
|
%
|
5
|
%
|
7
|
%
|
|||||||||
|
Self-storage
|
2
|
%
|
2
|
%
|
2
|
%
|
3
|
%
|
3
|
%
|
0
|
%
|
0
|
%
|
0
|
%
|
|||||||||
|
Industrial
|
4
|
%
|
4
|
%
|
4
|
%
|
3
|
%
|
3
|
%
|
1
|
%
|
1
|
%
|
2
|
%
|
|||||||||
|
Other
|
3
|
%
|
4
|
%
|
4
|
%
|
10
|
%
|
7
|
%
|
20
|
%
|
15
|
%
|
10
|
%
|
|||||||||
|
Weighted
average LTV
|
70
|
%
|
70
|
%
|
70
|
%
|
68
|
%
|
69
|
%
|
69
|
%
|
69
|
%
|
68
|
%
|
|||||||||
|
Weighted
average debt service coverage ratio
|
1.62
|
1.65
|
1.59
|
1.73
|
1.60
|
1.72
|
1.75
|
1.99
|
|||||||||||||||||
|
THE
REDWOOD
REVIEW
1ST
QUARTER
2008
|
Table 16B:
Commercial CES Underlying Loan Characteristics
|
92
|
|
|
Table
17: Commercial Real Estate Loan Characteristics ($
in thousands)
|
93
|
|
Redwood
|
|||||||
|
2008
|
2007
|
||||||
|
Q1
|
Q4
|
||||||
|
Commercial
mortgage loans, reported value
|
$252
|
$93
|
|||||
|
Number
of
loans
|
2
|
2
|
|||||
|
Average
loan
size
|
$126
|
$47
|
|||||
|
Seriously
delinquent loans
|
-
|
-
|
|||||
|
Realized
credit losses
|
-
|
-
|
|||||
|
California
%
(based on reported value)
|
100
|
%
|
100
|
%
|
|||
|
Acacia
|
|||||||
|
2008
|
2007
|
||||||
|
|
Q1 |
Q4
|
|||||
|
Commercial
mortgage loans, reported value
|
$18,801
|
$25,585
|
|||||
|
Number
of
loans
|
5
|
5
|
|||||
|
Average
loan
size
|
$3,760
|
$5,117
|
|||||
|
Seriously
delinquent loans
|
-
|
-
|
|||||
|
Realized
credit losses
|
-
|
-
|
|||||
|
California
%
(based on reported value)
|
0
|
%
|
0
|
%
|
|||
|
THE
REDWOOD
REVIEW
1ST
QUARTER
2008
|
Table 17:
Commercial Real Estate Loan Characteristics
|
|
|
|
Table
18A: Securities Portfolios Credit Rating and Collateral
Type at Redwood
($
in millions)
|
|
|
Redwood
|
CURRENT
RATING AT 3/31/2008
|
||||||||||||||||||||||||
|
At
March 31, 2008:
|
Total
|
AAA
|
AA
|
A
|
BBB
|
BB
|
B
|
Unrated
|
|||||||||||||||||
|
Residential
prime
|
$98
|
$1
|
$4
|
$10
|
$5
|
$25
|
$22
|
$31
|
|||||||||||||||||
|
Residential
alt-a
|
14
|
2
|
-
|
1
|
2
|
-
|
2
|
7
|
|||||||||||||||||
|
Residential
sub-prime
|
2
|
-
|
-
|
-
|
1
|
-
|
-
|
1
|
|||||||||||||||||
|
Other
real
estate investments
|
3
|
-
|
-
|
-
|
-
|
1
|
1
|
1
|
|||||||||||||||||
|
Commercial
|
100
|
-
|
-
|
-
|
-
|
14
|
13
|
73
|
|||||||||||||||||
|
CDO
|
15
|
7
|
7
|
-
|
1
|
-
|
-
|
-
|
|||||||||||||||||
|
Total
securities portfolio market value
|
$232
|
$10
|
$11
|
$11
|
$9
|
$40
|
$38
|
$113
|
|||||||||||||||||
|
Redwood
|
CURRENT
RATING AT 12/31/2007
|
||||||||||||||||||||||||
|
At
December 31, 2007:
|
Total
|
AAA
|
AA
|
A
|
BBB
|
BB
|
B
|
Unrated
|
|||||||||||||||||
|
Residential
prime
|
$128
|
$0
|
$1
|
$0
|
$0
|
$50
|
$40
|
$37
|
|||||||||||||||||
|
Residential
alt-a
|
32
|
9
|
-
|
-
|
-
|
3
|
8
|
12
|
|||||||||||||||||
|
Residential
sub-prime
|
3
|
-
|
-
|
-
|
2
|
-
|
-
|
1
|
|||||||||||||||||
|
Other
real
estate investments
|
12
|
1
|
-
|
1
|
2
|
2
|
3
|
3
|
|||||||||||||||||
|
Commercial
|
148
|
-
|
-
|
-
|
-
|
26
|
24
|
98
|
|||||||||||||||||
|
CDO
|
21
|
12
|
6
|
-
|
1
|
1
|
-
|
1
|
|||||||||||||||||
|
Total
securities portfolio market value
|
$344
|
$22
|
$7
|
$1
|
$5
|
$82
|
$75
|
$152
|
|||||||||||||||||
|
THE
REDWOOD
REVIEW
1ST
QUARTER
2008
|
Table 18A:
Securities Portfolios Credit Rating and Collateral
Type at
Redwood
|
94
|
|
|
Table
18B: Securities Portfolios Credit Rating and Collateral Type
at
Acacia
($
in millions)
|
95
|
|
Acacia
|
CURRENT
RATING AT 3/31/2008
|
||||||||||||||||||||||||
|
At
March 31, 2007:
|
Total
|
AAA
|
AA
|
A
|
BBB
|
BB
|
B
|
Unrated
|
|||||||||||||||||
|
Residential
prime
|
$311
|
$26
|
$63
|
$74
|
$71
|
$64
|
$12
|
$1
|
|||||||||||||||||
|
Residential
alt-a
|
220
|
126
|
23
|
34
|
22
|
12
|
3
|
-
|
|||||||||||||||||
|
Residential
sub-prime
|
161
|
12
|
64
|
48
|
26
|
4
|
-
|
7
|
|||||||||||||||||
|
Other
real
estate investments
|
-
|
-
|
-
|
-
|
-
|
-
|
-
|
-
|
|||||||||||||||||
|
Commercial
|
175
|
10
|
1
|
14
|
37
|
80
|
28
|
5
|
|||||||||||||||||
|
CDO
|
59
|
10
|
4
|
14
|
25
|
5
|
-
|
1
|
|||||||||||||||||
|
Total
securities portfolio market value
|
$926
|
$184
|
$155
|
$184
|
$181
|
$165
|
$43
|
$14
|
|||||||||||||||||
|
Acacia
|
CURRENT
RATING AT 12/31/2007
|
||||||||||||||||||||||||
|
At
December 31, 2007:
|
Total
|
AAA
|
AA
|
A
|
BBB
|
BB
|
B
|
Unrated
|
|||||||||||||||||
|
Residential
prime
|
$708
|
$31
|
$151
|
$172
|
$160
|
$158
|
$35
|
$1
|
|||||||||||||||||
|
Residential
alt-a
|
465
|
204
|
68
|
87
|
58
|
43
|
5
|
-
|
|||||||||||||||||
|
Residential
sub-prime
|
220
|
15
|
90
|
64
|
42
|
1
|
5
|
3
|
|||||||||||||||||
|
Other
real
estate investments
|
-
|
-
|
-
|
-
|
-
|
-
|
-
|
-
|
|||||||||||||||||
|
Commercial
|
427
|
11
|
1
|
18
|
60
|
162
|
77
|
98
|
|||||||||||||||||
|
CDO
|
124
|
35
|
23
|
23
|
33
|
8
|
1
|
1
|
|||||||||||||||||
|
Total
securities portfolio market value
|
$1,944
|
$296
|
$333
|
$364
|
$353
|
$372
|
$123
|
$103
|
|||||||||||||||||
|
THE
REDWOOD
REVIEW
1ST
QUARTER
2008
|
Table 18B:
Securities Portfolios Credit Rating and Collateral Type at
Acacia
|
|
|
|
Table
18C: Securities Portfolios Collateral Type at the Opportunity
Fund
($
in millions)
|
|
|
Opportunity
Fund
|
||||
|
At
March 31, 2008:
|
|
|||
|
Residential
prime
|
$
|
0
|
||
|
Residential
alt-a
|
-
|
|||
|
Residential
sub-prime
|
9
|
|||
|
Other
real
estate investments
|
-
|
|||
|
Commercial
|
-
|
|||
|
CDO
|
27
|
|||
|
Total
securities portfolio market value
|
$
|
36
|
||
|
Opportunity
Fund
|
||||
|
At
December 31, 2007:
|
|
|||
|
Residential
prime
|
$
|
0
|
||
|
Residential
alt-a
|
-
|
|||
|
Residential
sub-prime
|
3
|
|||
|
Other
real
estate investments
|
-
|
|||
|
Commercial
|
-
|
|||
|
CDO
|
12
|
|||
|
Total
securities portfolio market value
|
$
|
15
|
||
|
THE
REDWOOD
REVIEW
1ST
QUARTER
2008
|
Table 18C:
Securities Portfolios Credit Rating and Collateral
Type at the Opportunity
Fund
|
96
|
|
|
Table
19A - Securities at Redwood excluding Acacia Market Value as
a % of
Principal
March
31, 2008 ($
in millions)
|
97
|
|
|
<=2004
|
|
|
2005
|
|
2006
|
|
2007
|
|
2008
|
|
Total
|
|
||||||||||||||||||||||||
|
|
Value
|
%
|
Value
|
%
|
Value
|
%
|
Value
|
%
|
Value
|
%
|
Value
|
%
|
|||||||||||||||||||||||||
|
Prime
|
|||||||||||||||||||||||||||||||||||||
|
Resi
-
IGS
|
|||||||||||||||||||||||||||||||||||||
|
AAA
|
$1
|
89
|
%
|
-
|
-
|
-
|
-
|
-
|
-
|
-
|
-
|
1
|
89
|
%
|
|||||||||||||||||||||||
|
AA
|
1
|
65
|
%
|
-
|
-
|
-
|
-
|
-
|
-
|
3
|
55
|
%
|
4
|
56
|
%
|
||||||||||||||||||||||
|
A
|
-
|
-
|
-
|
-
|
9
|
50
|
%
|
-
|
-
|
1
|
40
|
%
|
10
|
49
|
%
|
||||||||||||||||||||||
|
BBB
|
2
|
35
|
%
|
1
|
21
|
%
|
-
|
-
|
-
|
-
|
2
|
32
|
%
|
5
|
29
|
%
|
|||||||||||||||||||||
|
Resi
-
IGS Total
|
4
|
50
|
%
|
1
|
24
|
%
|
9
|
50
|
%
|
-
|
-
|
6
|
44
|
%
|
20
|
44
|
%
|
||||||||||||||||||||
|
Resi
-
CES
|
|||||||||||||||||||||||||||||||||||||
|
BB
|
12
|
29
|
%
|
7
|
22
|
%
|
2
|
28
|
%
|
3
|
17
|
%
|
1
|
18
|
%
|
25
|
24
|
%
|
|||||||||||||||||||
|
B
|
15
|
33
|
%
|
2
|
15
|
%
|
1
|
9
|
%
|
3
|
12
|
%
|
1
|
14
|
%
|
22
|
22
|
%
|
|||||||||||||||||||
|
NR
|
21
|
14
|
%
|
6
|
6
|
%
|
2
|
5
|
%
|
2
|
6
|
%
|
-
|
0
|
%
|
31
|
9
|
%
|
|||||||||||||||||||
|
Resi
-
CES Total
|
48
|
20
|
%
|
15
|
11
|
%
|
5
|
8
|
%
|
8
|
10
|
%
|
2
|
15
|
%
|
78
|
14
|
%
|
|||||||||||||||||||
|
Total
Prime
|
$52
|
21
|
%
|
16
|
11
|
%
|
14
|
16
|
%
|
8
|
10
|
%
|
8
|
28
|
%
|
98
|
17
|
%
|
|||||||||||||||||||
|
Alt-A
|
|||||||||||||||||||||||||||||||||||||
|
Resi
-
IGS
|
|||||||||||||||||||||||||||||||||||||
|
AAA
|
$
-
|
-
|
-
|
-
|
-
|
-
|
2
|
30
|
%
|
-
|
-
|
2
|
30
|
%
|
|||||||||||||||||||||||
|
A
|
-
|
-
|
-
|
-
|
-
|
-
|
1
|
95
|
%
|
-
|
-
|
1
|
95
|
%
|
|||||||||||||||||||||||
|
BBB
|
-
|
-
|
-
|
-
|
1
|
60
|
%
|
1
|
27
|
%
|
-
|
-
|
2
|
34
|
%
|
||||||||||||||||||||||
|
Resi
-
IGS Total
|
-
|
-
|
-
|
-
|
1
|
60
|
%
|
4
|
33
|
%
|
-
|
-
|
5
|
35
|
%
|
||||||||||||||||||||||
|
Resi
-
CES
|
|||||||||||||||||||||||||||||||||||||
|
B
|
-
|
-
|
-
|
-
|
-
|
-
|
2
|
3
|
%
|
-
|
-
|
2
|
4
|
%
|
|||||||||||||||||||||||
|
NR
|
1
|
5
|
%
|
4
|
9
|
%
|
1
|
2
|
%
|
1
|
2
|
%
|
-
|
-
|
7
|
4
|
%
|
||||||||||||||||||||
|
Resi
-
CES Total
|
1
|
5
|
%
|
4
|
9
|
%
|
1
|
2
|
%
|
3
|
3
|
%
|
-
|
-
|
9
|
4
|
%
|
||||||||||||||||||||
|
OREI
|
-
|
-
|
-
|
-
|
2
|
1
|
%
|
1
|
10
|
%
|
-
|
-
|
3
|
1
|
%
|
||||||||||||||||||||||
|
Total
Alt-A
|
$1
|
5
|
%
|
4
|
9
|
%
|
4
|
8
|
%
|
8
|
7
|
%
|
-
|
-
|
17
|
8
|
%
|
||||||||||||||||||||
|
Subprime
|
|||||||||||||||||||||||||||||||||||||
|
Resi
-
IGS
|
|||||||||||||||||||||||||||||||||||||
|
BBB
|
1
|
50
|
%
|
-
|
-
|
-
|
-
|
-
|
-
|
-
|
-
|
1
|
50
|
%
|
|||||||||||||||||||||||
|
Resi
-
IGS Total
|
1
|
50
|
%
|
-
|
-
|
-
|
-
|
-
|
-
|
-
|
-
|
1
|
50
|
%
|
|||||||||||||||||||||||
|
Resi
-
CES
|
|||||||||||||||||||||||||||||||||||||
|
NR
|
-
|
-
|
-
|
-
|
-
|
-
|
1
|
4
|
%
|
-
|
-
|
1
|
4
|
%
|
|||||||||||||||||||||||
|
Resi
-
CES Total
|
-
|
-
|
-
|
-
|
-
|
-
|
1
|
4
|
%
|
-
|
-
|
1
|
4
|
%
|
|||||||||||||||||||||||
|
Total
Subprime
|
$1
|
50
|
%
|
-
|
-
|
-
|
-
|
1
|
4
|
%
|
-
|
-
|
2
|
18
|
%
|
||||||||||||||||||||||
|
CDO
|
|||||||||||||||||||||||||||||||||||||
|
CDO
-
IGS
|
|||||||||||||||||||||||||||||||||||||
|
AAA
|
$
-
|
-
|
7
|
36
|
%
|
-
|
-
|
-
|
-
|
-
|
-
|
7
|
36
|
%
|
|||||||||||||||||||||||
|
AA
|
7
|
54
|
%
|
-
|
-
|
-
|
-
|
-
|
-
|
-
|
-
|
7
|
54
|
%
|
|||||||||||||||||||||||
|
BBB
|
-
|
-
|
-
|
-
|
-
|
-
|
1
|
5
|
%
|
-
|
-
|
1
|
5
|
%
|
|||||||||||||||||||||||
|
CDO
-
IGS Total
|
7
|
54
|
%
|
7
|
36
|
%
|
-
|
-
|
1
|
5
|
%
|
-
|
-
|
15
|
25
|
%
|
|||||||||||||||||||||
|
Total
CDO
|
$7
|
54
|
%
|
7
|
36
|
%
|
-
|
-
|
1
|
5
|
%
|
-
|
-
|
15
|
25
|
%
|
|||||||||||||||||||||
|
CMBS
|
|||||||||||||||||||||||||||||||||||||
|
Comm
-
CES
|
|||||||||||||||||||||||||||||||||||||
|
BB
|
5
|
54
|
%
|
-
|
-
|
6
|
26
|
%
|
3
|
22
|
%
|
-
|
-
|
14
|
30
|
%
|
|||||||||||||||||||||
|
B
|
-
|
-
|
-
|
-
|
7
|
22
|
%
|
6
|
19
|
%
|
-
|
-
|
13
|
21
|
%
|
||||||||||||||||||||||
|
NR
|
11
|
22
|
%
|
21
|
17
|
%
|
35
|
17
|
%
|
6
|
17
|
%
|
-
|
-
|
73
|
18
|
%
|
||||||||||||||||||||
|
Total
CMBS
|
$16
|
27
|
%
|
21
|
17
|
%
|
48
|
18
|
%
|
15
|
19
|
%
|
-
|
-
|
100
|
19
|
%
|
||||||||||||||||||||
|
THE
REDWOOD
REVIEW
1ST
QUARTER
2008
|
Table 19A -
Securities at Redwood excluding Acacia Market Value as a
% of Principal
March 31, 2008
|
|
|
|
Table
19B - Securities at Acacia Market Value as a % of Principal
March 31,
2008
($
in millions)
|
|
|
|
<=2004
|
|
2005
|
|
2006
|
|
2007
|
|
2008
|
|
Total
|
|
|||||||||||||||||||||||||
|
|
Value
|
%
|
Value
|
%
|
Value
|
%
|
Value
|
%
|
Value
|
%
|
Value
|
%
|
|||||||||||||||||||||||||
|
Prime
|
|||||||||||||||||||||||||||||||||||||
|
Resi
-
IGS
|
|||||||||||||||||||||||||||||||||||||
|
AAA
|
$9
|
94
|
%
|
$12
|
83
|
%
|
$5
|
68
|
%
|
$
-
|
-
|
$
-
|
-
|
$26
|
83
|
%
|
|||||||||||||||||||||
|
AA
|
33
|
53
|
%
|
18
|
23
|
%
|
10
|
26
|
%
|
2
|
20
|
%
|
-
|
-
|
63
|
33
|
%
|
||||||||||||||||||||
|
A
|
23
|
44
|
%
|
31
|
24
|
%
|
17
|
30
|
%
|
3
|
29
|
%
|
-
|
-
|
74
|
30
|
%
|
||||||||||||||||||||
|
BBB
|
12
|
36
|
%
|
33
|
23
|
%
|
10
|
19
|
%
|
16
|
27
|
%
|
-
|
-
|
71
|
25
|
%
|
||||||||||||||||||||
|
Resi
-
IGS Total
|
77
|
49
|
%
|
94
|
26
|
%
|
42
|
27
|
%
|
21
|
26
|
%
|
-
|
-
|
234
|
31
|
%
|
||||||||||||||||||||
|
Resi
-
CES
|
|||||||||||||||||||||||||||||||||||||
|
BB
|
29
|
26
|
%
|
20
|
21
|
%
|
12
|
14
|
%
|
3
|
17
|
%
|
-
|
-
|
64
|
21
|
%
|
||||||||||||||||||||
|
B
|
3
|
22
|
%
|
5
|
11
|
%
|
4
|
13
|
%
|
-
|
-
|
-
|
-
|
12
|
13
|
%
|
|||||||||||||||||||||
|
NR
|
-
|
-
|
-
|
-
|
1
|
9
|
%
|
-
|
-
|
-
|
-
|
1
|
9
|
%
|
|||||||||||||||||||||||
|
Resi
-
CES Total
|
32
|
25
|
%
|
25
|
17
|
%
|
17
|
13
|
%
|
3
|
17
|
%
|
-
|
-
|
77
|
18
|
%
|
||||||||||||||||||||
|
Total
Prime
|
$109
|
38
|
%
|
$119
|
23
|
%
|
$59
|
21
|
%
|
$24
|
25
|
%
|
$
-
|
-
|
$311
|
27
|
%
|
||||||||||||||||||||
|
Alt-A
|
|||||||||||||||||||||||||||||||||||||
|
Resi
-
IGS
|
|||||||||||||||||||||||||||||||||||||
|
AAA
|
$6
|
58
|
%
|
$2
|
40
|
%
|
$75
|
59
|
%
|
$43
|
52
|
%
|
$
-
|
-
|
$126
|
56
|
%
|
||||||||||||||||||||
|
AA
|
6
|
39
|
%
|
2
|
18
|
%
|
9
|
19
|
%
|
6
|
16
|
%
|
-
|
-
|
23
|
21
|
%
|
||||||||||||||||||||
|
A
|
1
|
12
|
%
|
-
|
-
|
19
|
13
|
%
|
14
|
12
|
%
|
-
|
-
|
34
|
12
|
%
|
|||||||||||||||||||||
|
BBB
|
1
|
26
|
%
|
2
|
7
|
%
|
11
|
24
|
%
|
8
|
23
|
%
|
-
|
-
|
22
|
22
|
%
|
||||||||||||||||||||
|
Resi
-
IGS Total
|
14
|
35
|
%
|
6
|
15
|
%
|
114
|
26
|
%
|
71
|
22
|
%
|
-
|
-
|
205
|
24
|
%
|
||||||||||||||||||||
|
Resi
-
CES
|
|||||||||||||||||||||||||||||||||||||
|
BB
|
2
|
8
|
%
|
1
|
7
|
%
|
5
|
7
|
%
|
4
|
7
|
%
|
-
|
-
|
12
|
7
|
%
|
||||||||||||||||||||
|
B
|
-
|
8
|
%
|
1
|
3
|
%
|
2
|
4
|
%
|
-
|
5
|
%
|
-
|
-
|
3
|
4
|
%
|
||||||||||||||||||||
|
NR
|
-
|
-
|
-
|
-
|
-
|
-
|
-
|
4
|
%
|
-
|
-
|
-
|
4
|
%
|
|||||||||||||||||||||||
|
Resi
-
CES Total
|
2
|
8
|
%
|
2
|
5
|
%
|
7
|
6
|
%
|
4
|
7
|
%
|
-
|
-
|
15
|
6
|
%
|
||||||||||||||||||||
|
Total
Alt-A
|
$16
|
23
|
%
|
$8
|
11
|
%
|
$121
|
22
|
%
|
$75
|
19
|
%
|
$
-
|
-
|
$220
|
20
|
%
|
||||||||||||||||||||
|
Subprime
|
|||||||||||||||||||||||||||||||||||||
|
Resi
-
IGS
|
|||||||||||||||||||||||||||||||||||||
|
AAA
|
$
-
|
-
|
$4
|
72
|
%
|
$
-
|
-
|
$8
|
78
|
%
|
$
-
|
-
|
$12
|
76
|
%
|
||||||||||||||||||||||
|
AA
|
25
|
57
|
%
|
34
|
77
|
%
|
3
|
39
|
%
|
2
|
15
|
%
|
-
|
-
|
64
|
59
|
%
|
||||||||||||||||||||
|
A
|
35
|
61
|
%
|
12
|
44
|
%
|
1
|
16
|
%
|
-
|
-
|
-
|
-
|
48
|
50
|
%
|
|||||||||||||||||||||
|
BBB
|
23
|
65
|
%
|
-
|
-
|
2
|
11
|
%
|
1
|
6
|
%
|
-
|
-
|
26
|
42
|
%
|
|||||||||||||||||||||
|
Resi
-
IGS Total
|
83
|
61
|
%
|
50
|
65
|
%
|
6
|
20
|
%
|
11
|
28
|
%
|
-
|
-
|
150
|
53
|
%
|
||||||||||||||||||||
|
Resi
-
CES
|
|||||||||||||||||||||||||||||||||||||
|
BB
|
4
|
49
|
%
|
-
|
-
|
-
|
-
|
-
|
-
|
-
|
-
|
4
|
49
|
%
|
|||||||||||||||||||||||
|
B
|
-
|
-
|
-
|
-
|
-
|
-
|
-
|
-
|
-
|
-
|
-
|
0
|
%
|
||||||||||||||||||||||||
|
NR
|
-
|
-
|
-
|
-
|
5
|
5
|
%
|
2
|
6
|
%
|
-
|
-
|
7
|
5
|
%
|
||||||||||||||||||||||
|
Resi
-
CES Total
|
4
|
49
|
%
|
-
|
-
|
5
|
5
|
%
|
2
|
6
|
%
|
-
|
-
|
11
|
8
|
%
|
|||||||||||||||||||||
|
Total
Subprime
|
$87
|
60
|
%
|
$50
|
65
|
%
|
$11
|
8
|
%
|
$13
|
18
|
%
|
$
-
|
-
|
$161
|
38
|
%
|
||||||||||||||||||||
|
CDO
|
|||||||||||||||||||||||||||||||||||||
|
CDO
-
IGS
|
|||||||||||||||||||||||||||||||||||||
|
AAA
|
$4
|
37
|
%
|
$4
|
28
|
%
|
$
-
|
-
|
$2
|
23
|
%
|
$
-
|
-
|
$10
|
30
|
%
|
|||||||||||||||||||||
|
AA
|
3
|
19
|
%
|
-
|
-
|
-
|
-
|
1
|
20
|
%
|
-
|
-
|
4
|
19
|
%
|
||||||||||||||||||||||
|
A
|
11
|
34
|
%
|
2
|
22
|
%
|
1
|
13
|
%
|
-
|
-
|
-
|
-
|
14
|
26
|
%
|
|||||||||||||||||||||
|
BBB
|
14
|
43
|
%
|
2
|
14
|
%
|
7
|
26
|
%
|
2
|
30
|
%
|
-
|
-
|
25
|
31
|
%
|
||||||||||||||||||||
|
CDO
-
IGS Total
|
32
|
34
|
%
|
8
|
21
|
%
|
8
|
23
|
%
|
5
|
19
|
%
|
-
|
-
|
53
|
28
|
%
|
||||||||||||||||||||
|
CDO
-
CES
|
|||||||||||||||||||||||||||||||||||||
|
BB
|
1
|
9
|
%
|
3
|
30
|
%
|
1
|
11
|
%
|
-
|
-
|
-
|
-
|
5
|
13
|
%
|
|||||||||||||||||||||
|
NR
|
-
|
-
|
-
|
-
|
1
|
3
|
%
|
-
|
-
|
-
|
-
|
1
|
3
|
%
|
|||||||||||||||||||||||
|
CDO
-
CES Total
|
1
|
9
|
%
|
3
|
30
|
%
|
2
|
5
|
%
|
-
|
-
|
-
|
-
|
6
|
9
|
%
|
|||||||||||||||||||||
|
Total
CDO
|
$33
|
32
|
%
|
$11
|
22
|
%
|
$10
|
14
|
%
|
$5
|
19
|
%
|
$0
|
0
|
%
|
$59
|
23
|
%
|
|||||||||||||||||||
|
CMBS
|
|||||||||||||||||||||||||||||||||||||
|
Comm
- IGS
|
|||||||||||||||||||||||||||||||||||||
|
AAA
|
$
-
|
-
|
$8
|
91
|
%
|
$2
|
88
|
%
|
$
-
|
-
|
$
-
|
-
|
$10
|
90
|
%
|
||||||||||||||||||||||
|
AA
|
1
|
65
|
%
|
-
|
-
|
-
|
-
|
-
|
-
|
-
|
-
|
1
|
65
|
%
|
|||||||||||||||||||||||
|
A
|
12
|
69
|
%
|
2
|
49
|
%
|
-
|
-
|
-
|
-
|
-
|
-
|
14
|
65
|
%
|
||||||||||||||||||||||
|
BBB
|
13
|
70
|
%
|
23
|
47
|
%
|
1
|
40
|
%
|
-
|
-
|
-
|
-
|
37
|
53
|
%
|
|||||||||||||||||||||
|
Comm
-
IGS Total
|
26
|
69
|
%
|
33
|
53
|
%
|
3
|
62
|
%
|
-
|
-
|
-
|
-
|
62
|
59
|
%
|
|||||||||||||||||||||
|
Comm
-
CES
|
|||||||||||||||||||||||||||||||||||||
|
BB
|
20
|
43
|
%
|
29
|
37
|
%
|
29
|
29
|
%
|
2
|
22
|
%
|
0
|
-
|
80
|
34
|
%
|
||||||||||||||||||||
|
B
|
3
|
35
|
%
|
12
|
32
|
%
|
13
|
25
|
%
|
-
|
-
|
-
|
-
|
28
|
29
|
%
|
|||||||||||||||||||||
|
NR
|
-
|
-
|
-
|
-
|
5
|
24
|
%
|
-
|
-
|
-
|
-
|
5
|
24
|
%
|
|||||||||||||||||||||||
|
Comm
-
CES Total
|
23
|
42
|
%
|
41
|
36
|
%
|
47
|
27
|
%
|
2
|
22
|
%
|
-
|
-
|
113
|
32
|
%
|
||||||||||||||||||||
|
Total
CMBS
|
$49
|
53
|
%
|
$74
|
42
|
%
|
$50
|
28
|
%
|
$2
|
22
|
%
|
$0
|
0
|
%
|
$175
|
38
|
%
|
|||||||||||||||||||
|
THE
REDWOOD
REVIEW
1ST
QUARTER
2008
|
Table 19B -
Securities at Acacia Market Value as a % of Principal
March
31,
2008
|
98
|
|
|
Table
19C - Securities at Opportunity Fund Market Value as a % of
Principal
March
31, 2008 ($
in millions)
|
99
|
|
|
|||||||||||||||||||||||||||||||||||||
|
|
<=2004
|
|
2005
|
|
2006
|
|
2007
|
|
2008
|
|
Total
|
|
|||||||||||||||||||||||||
|
|
Value
|
%
|
Value
|
%
|
Value
|
%
|
Value
|
%
|
Value
|
%
|
Value
|
%
|
|||||||||||||||||||||||||
|
Total
Subprime - IGS
|
$9
|
71
|
%
|
$
-
|
-
|
$
-
|
-
|
$
-
|
-
|
$
-
|
-
|
$9
|
71
|
%
|
|||||||||||||||||||||||
|
Total
CDO - IGS
|
$17
|
30
|
%
|
$10
|
30
|
%
|
$
-
|
-
|
$
-
|
-
|
$
-
|
-
|
$27
|
30
|
%
|
||||||||||||||||||||||
|
THE
REDWOOD
REVIEW
1ST
QUARTER
2008
|
Table 19C -
Securities at Opportunity Fund Market Value as a % of Principal March
31, 2008
|
|
|
|
Table 20:
Sequoia ABS Issued ($
in thousands)
|
|
|
|
|
Original
|
|
Estimated
|
Outstanding
|
|||||||||||
|
Sequoia
|
Issue
|
Issue
|
Stated
|
Callable
|
Balance
|
|||||||||||
|
ABS
Issued
|
Date
|
Amount
|
Maturity
|
Date
|
March
31, 2008
|
|||||||||||
|
|
|
|
|
|
|
|||||||||||
|
Sequoia
1
|
07/29/97
|
$534,347
|
2029
|
Called
|
$
- -
|
|||||||||||
|
Sequoia
2
|
11/06/97
|
749,160
|
2024
|
Called
|
-
|
|||||||||||
|
Sequoia
3
|
06/26/98
|
635,288
|
2028
|
Called
|
-
|
|||||||||||
|
Sequoia
1A
|
05/04/99
|
157,266
|
2028
|
Called
|
-
|
|||||||||||
|
Sequoia
4
|
03/21/00
|
377,119
|
2024
|
2007
|
45,778
|
|||||||||||
|
Sequoia
5
|
10/29/01
|
510,047
|
2026
|
2007
|
70,014
|
|||||||||||
|
Sequoia
6
|
04/26/02
|
506,142
|
2027
|
2007
|
71,223
|
|||||||||||
|
Sequoia
7
|
05/29/02
|
572,000
|
2032
|
Called
|
-
|
|||||||||||
|
Sequoia
8
|
07/30/02
|
642,998
|
2032
|
Called
|
-
|
|||||||||||
|
Sequoia
9
|
08/28/02
|
558,266
|
2032
|
2007
|
57,694
|
|||||||||||
|
Sequoia
10
|
09/26/02
|
1,041,600
|
2027
|
2008
|
141,529
|
|||||||||||
|
Sequoia
11
|
10/30/02
|
704,936
|
2032
|
2007
|
69,290
|
|||||||||||
|
Sequoia
12
|
12/19/02
|
1,096,891
|
2033
|
Called
|
-
|
|||||||||||
|
Sequoia
2003-1
|
02/27/03
|
1,012,321
|
2033
|
2007
|
139,225
|
|||||||||||
|
Sequoia
2003-2
|
04/29/03
|
815,080
|
2033
|
2007
|
108,989
|
|||||||||||
|
Sequoia
2003-3
|
06/26/03
|
538,452
|
2033
|
2007
|
79,833
|
|||||||||||
|
MLCC
2003-C
|
06/26/03
|
984,349
|
2028
|
2008
|
126,232
|
|||||||||||
|
MLCC
2003-D
|
07/29/03
|
1,003,591
|
2028
|
2008
|
144,088
|
|||||||||||
|
Sequoia
2003-4
|
07/29/03
|
504,273
|
2033
|
2007
|
108,768
|
|||||||||||
|
Sequoia
2003-5
|
08/27/03
|
840,248
|
2033
|
2007
|
91,369
|
|||||||||||
|
Sequoia
2003-6
|
10/29/03
|
649,999
|
2033
|
Called
|
-
|
|||||||||||
|
Sequoia
2003-7
|
11/25/03
|
811,707
|
2034
|
Called
|
-
|
|||||||||||
|
Sequoia
2003-8
|
12/23/03
|
964,238
|
2034
|
2007
|
133,579
|
|||||||||||
|
MLCC
2003-E
|
08/28/03
|
983,852
|
2028
|
2008
|
148,660
|
|||||||||||
|
MLCC
2003-F
|
09/25/03
|
1,297,913
|
2028
|
2007
|
181,739
|
|||||||||||
|
MLCC
2003-H
|
12/22/03
|
739,196
|
2029
|
2008
|
102,059
|
|||||||||||
|
Sequoia
2004-1
|
01/28/04
|
616,562
|
2034
|
2007
|
83,598
|
|||||||||||
|
Sequoia
2004-2
|
02/25/04
|
690,548
|
2034
|
Called
|
-
|
|||||||||||
|
Sequoia
2004-3
|
03/30/04
|
917,673
|
2034
|
2007
|
96,517
|
|||||||||||
|
Sequoia
2004-4
|
04/29/04
|
808,933
|
2034
|
2007
|
95,416
|
|||||||||||
|
Sequoia
2004-5
|
05/27/04
|
831,540
|
2034
|
2008
|
101,225
|
|||||||||||
|
Sequoia
2004-6
|
06/29/04
|
910,662
|
2034
|
2008
|
117,904
|
|||||||||||
|
SEMHT
2004-01
|
06/29/04
|
317,044
|
2014
|
2008
|
61,788
|
|||||||||||
|
Sequoia
2004-7
|
07/29/04
|
1,032,685
|
2034
|
2008
|
125,966
|
|||||||||||
|
Sequoia
2004-8
|
08/27/04
|
807,699
|
2034
|
2008
|
131,706
|
|||||||||||
|
Sequoia
2004-9
|
09/29/04
|
772,831
|
2034
|
2008
|
141,417
|
|||||||||||
|
Sequoia
2004-10
|
10/28/04
|
673,356
|
2034
|
2008
|
115,437
|
|||||||||||
|
Sequoia
2004-11
|
11/23/04
|
705,746
|
2034
|
2008
|
150,692
|
|||||||||||
|
Sequoia
2004-12
|
12/22/04
|
821,955
|
2035
|
2008
|
145,540
|
|||||||||||
|
Sequoia
2005-1
|
01/27/05
|
409,071
|
2035
|
2008
|
91,072
|
|||||||||||
|
Sequoia
2005-2
|
02/24/05
|
338,481
|
2035
|
2008
|
63,416
|
|||||||||||
|
Sequoia
2005-3
|
04/28/05
|
359,182
|
2035
|
2008
|
80,033
|
|||||||||||
|
Madrona
2005-A
|
08/25/05
|
5,400
|
2008
|
Called
|
-
|
|||||||||||
|
Sequoia
2005-4
|
09/29/05
|
324,576
|
2035
|
2009
|
164,340
|
|||||||||||
|
Sequoia
2006-1
|
08/30/06
|
742,507
|
2046
|
2011
|
539,250
|
|||||||||||
|
Sequoia
2007-1
|
03/30/07
|
864,089
|
2047
|
2015
|
755,566
|
|||||||||||
|
Sequoia
2007-2
|
05/25/07
|
1,018,484
|
2038
|
2017
|
872,474
|
|||||||||||
|
Sequoia
2007-3
|
07/27/07
|
650,375
|
2037
|
2015
|
636,389
|
|||||||||||
|
Sequoia
2007-4
|
08/30/07
|
129,713
|
2047
|
2017
|
121,334
|
|||||||||||
|
|
||||||||||||||||
|
Total
Sequoia ABS Issuance
|
$33,980,391
|
$6,511,149
|
||||||||||||||
|
|
||||||||||||||||
|
THE
REDWOOD
REVIEW
1ST
QUARTER
2008
|
Table 20:
Sequoia ABS Issued
|
100
|
|
|
Table
21: Sequoia IO ABS Issued ($
in thousands)
|
101
|
|
Original
|
Estimated
|
Outstanding
|
||||||||||||||
|
Sequoia
ABS
|
Issue
|
Issue
|
Stated
|
Callable
|
Balance
At
|
|||||||||||
|
IO's
Issued
|
Date
|
Amount
|
Maturity
|
Date
|
March
31, 2008
|
|||||||||||
|
|
|
|
||||||||||||||
|
MLCC
2003-C
X-A-2
|
06/26/03
|
$12,662
|
2007
|
Matured
|
$0
|
|||||||||||
|
MLCC
2003-D
X-A-1
|
07/29/03
|
22,371
|
2007
|
Matured
|
-
|
|||||||||||
|
MLCC
2003-E
X-A-1
|
08/28/03
|
16,550
|
2007
|
Matured
|
-
|
|||||||||||
|
MLCC
2003-F
X-A-1
|
09/25/03
|
18,666
|
2007
|
Matured
|
-
|
|||||||||||
|
Sequoia
2003-6
X-1
|
10/29/03
|
8,220
|
2007
|
Called
|
-
|
|||||||||||
|
SMFC
2003A AX1
|
10/31/03
|
70,568
|
2007
|
Called
|
-
|
|||||||||||
|
Sequoia
2003-7
X-1
|
11/25/03
|
10,345
|
2007
|
Called
|
-
|
|||||||||||
|
Sequoia
2003-8
X-1
|
12/23/03
|
12,256
|
2007
|
Matured
|
-
|
|||||||||||
|
Sequoia
2004-1
X-1
|
01/28/04
|
7,801
|
2007
|
Matured
|
-
|
|||||||||||
|
Sequoia
2004-2
X-1
|
02/25/04
|
8,776
|
2007
|
Called
|
-
|
|||||||||||
|
MLCC
2003-H
X-A-1
|
12/22/03
|
10,430
|
2007
|
Matured
|
-
|
|||||||||||
|
SMFC
2004A AX1
|
02/26/04
|
10,626
|
2008
|
2008
|
||||||||||||
|
Sequoia
2004-4
X-1
|
05/28/04
|
9,789
|
2010
|
Matured
|
-
|
|||||||||||
|
Sequoia
2004-5
X-1
|
05/27/04
|
3,371
|
2012
|
Matured
|
-
|
|||||||||||
|
Sequoia
2004-6
X-A
|
06/29/04
|
10,884
|
2012
|
2008
|
1,018
|
|||||||||||
|
Sequoia
2004-7
X-A
|
07/29/04
|
12,145
|
2034
|
2008
|
1,672
|
|||||||||||
|
Sequoia
2004-8
X-A
|
08/27/04
|
18,270
|
2034
|
2008
|
2,558
|
|||||||||||
|
Sequoia
2004-9
X-A
|
09/29/04
|
16,951
|
2034
|
2008
|
3,082
|
|||||||||||
|
Sequoia
2004-10 X-A
|
10/28/04
|
14,735
|
2034
|
2008
|
2,606
|
|||||||||||
|
Sequoia
2004-11 X-A-1
|
11/23/04
|
12,603
|
2034
|
2008
|
2,987
|
|||||||||||
|
Sequoia
2004-11 X-A-2
|
11/23/04
|
4,697
|
2034
|
2008
|
1,287
|
|||||||||||
|
Sequoia
2004-12 X-A-1
|
12/22/04
|
14,453
|
2035
|
2008
|
3,058
|
|||||||||||
|
Sequoia
2004-12 X-A-2
|
12/22/04
|
5,081
|
2035
|
2008
|
5,081
|
|||||||||||
|
Sequoia
2005-1
X-A
|
01/27/05
|
9,669
|
2035
|
2008
|
2,376
|
|||||||||||
|
Sequoia
2005-2
X-A
|
02/24/05
|
7,484
|
2035
|
2008
|
1,569
|
|||||||||||
|
Sequoia
2005-3
X-A
|
04/28/05
|
8,183
|
2035
|
2008
|
2,222
|
|||||||||||
|
Total
Sequoia IO ABS Issuance
|
$357,586
|
$29,516
|
||||||||||||||
|
THE
REDWOOD
REVIEW
1ST
QUARTER
2008
|
Table 21:
Sequoia IO ABS Issued
|
|
|
|
Table 22: Acacia
CDO ABS Issued ($
in thousands)
|
|
|
Original
|
Optional
|
Principal
|
||||||||||||||
|
Issue
|
Issue
|
Stated
|
Redemption
|
Outstanding
At
|
||||||||||||
|
CDO
Issuance
|
Date
|
Amount
|
Maturity
|
Date
|
March
31, 2008
|
|||||||||||
|
Acacia
CDO 1
|
12/10/02
|
$285,000
|
2023
|
Called
|
$0
|
|||||||||||
|
Acacia
CDO 2
|
05/13/03
|
283,875
|
2023
|
Called
|
-
|
|||||||||||
|
Acacia
CDO 3
|
11/04/03
|
284,250
|
2038
|
Called
|
-
|
|||||||||||
|
Acacia
CDO 4
|
04/08/04
|
293,400
|
2039
|
Called
|
-
|
|||||||||||
|
Acacia
CDO 5
|
07/14/04
|
282,125
|
2039
|
2007
|
200,070
|
|||||||||||
|
Acacia
CDO 6
|
11/09/04
|
282,000
|
2040
|
2007
|
229,480
|
|||||||||||
|
Acacia
CDO 7
|
03/10/05
|
282,000
|
2045
|
2008
|
280,815
|
|||||||||||
|
Acacia
CDO 8
|
07/14/05
|
252,000
|
2045
|
2008
|
247,838
|
|||||||||||
|
Acacia
CRE 1
|
12/14/05
|
261,750
|
2045
|
2010
|
247,543
|
|||||||||||
|
Acacia
CDO 9
|
03/09/06
|
277,800
|
2046
|
2009
|
277,787
|
|||||||||||
|
Acacia
CDO 10
|
08/02/06
|
436,500
|
2046
|
2009
|
427,208
|
|||||||||||
|
Acacia
CDO 11
|
02/15/07
|
476,660
|
2047
|
2010
|
476,660
|
|||||||||||
|
Acacia
CDO 12
|
05/18/07
|
458,000
|
2047
|
2010
|
458,000
|
|||||||||||
|
Acacia
CDO OA
1
|
06/14/07
|
486,000
|
2052
|
2010
|
494,182
|
(1) | ||||||||||
|
Total
Acacia CDO Issuance
|
$4,641,360
|
$3,339,583
|
||||||||||||||
|
THE
REDWOOD
REVIEW
1ST
QUARTER
2008
|
Table 22:
Acacia CDO ABS Issued
|
102
|