 |
||
 |
 |
 |
|
The
Redwood Review
4th
Quarter 2007
|
||
|
|
||
|
|
Table
of Contents
|
|
Introduction
|
|
|
2
|
|
|
Shareholder
Letter
|
|
|
3
|
|
|
Quarterly
Overview
|
|
|
5
|
|
|
Balance
Sheet Insight
|
|
|
10
|
|
|
|
|
|
|
|
|
Financial
and Investment Modules
|
|
|
|
|
|
|
|
|
|
|
|
•
Financial
|
|
|
14
|
|
|
•
Market-to-Market Adjustments
|
|
|
21
|
|
|
•
Residential
Real Estate Securities
|
|
|
27
|
|
|
•
Commercial
Real Estate Securities
|
|
|
37
|
|
|
•
CDO
Securities
|
|
|
40
|
|
|
•
Investments
in Sequoia
|
|
|
41
|
|
|
•
Investments
in Acacia
|
|
|
44
|
|
|
|
|
|
|
|
|
Appendix
|
|
|
|
|
|
•
Glossary
|
|
|
52
|
|
|
•
Financial
Tables
|
|
|
59
|
|
|
The
Redwood
Review
4th Quarter
2007
|
|
1 |
 |
Introduction
|
Note
to
Readers:
We
file annual
reports (on Form 10-K) and quarterly reports (on Form 10-Q) with
the Securities
and Exchange Commission. These filings and our earnings press releases
provide
information about our financial results in accordance with Generally
Accepted
Accounting Principles (GAAP). We urge you to review these documents
which are
available through our web site, www.redwoodtrust.com.
This
document,
called the Redwood Review, provides supplemental information about
Redwood
through a discussion of many GAAP as well as non-GAAP metrics,
such as core
earnings and taxable income. We believe that these figures provide
additional
insight into Redwood’s business and future prospects. In each case in which we
discuss a non-GAAP metric, you will find an explanation of how
it has been
calculated and why we think the figure is important. In the Appendix,
you will
find reconciliations between GAAP and non-GAAP figures. We hope
you find the
Redwood Review to be helpful to your understanding of our business.
The
form and
content of the Redwood Review will likely continue to change over
time. We
welcome your input and suggestions.
|
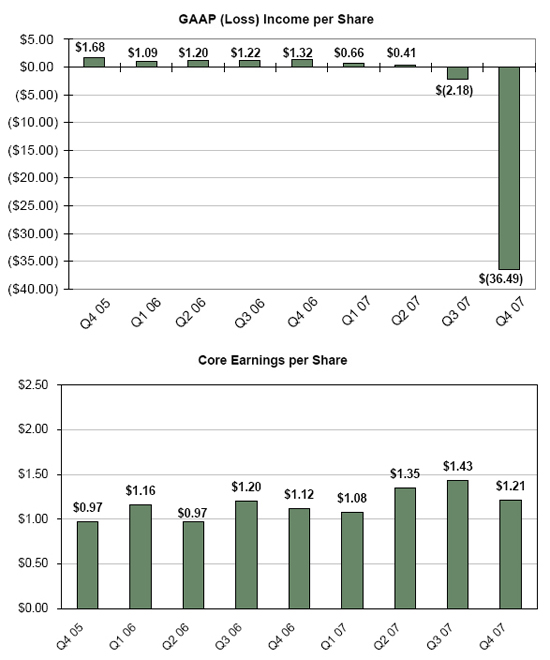
Selected
Financial Highlights
|
|||||||
|
Quarter:Year
|
GAAP Income
per Share
|
Core
Earnings per Share
|
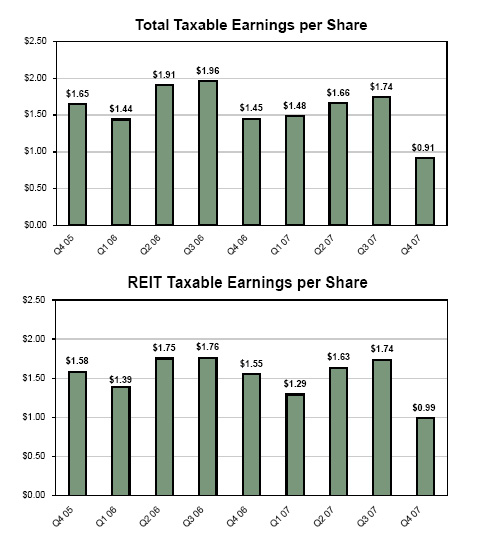
Total
Taxable Earnings per Share
|
Adjusted
Return on Equity
|
GAAP
Book Value per Share
|
Core
Book Value per Share
|
Total
Dividends per Share
|
|
Q405
|
$1.68
|
$0.97
|
$1.65
|
19%
|
$37.20
|
$34.27
|
$3.70
|
|
Q106
|
$1.09
|
$1.16
|
$1.44
|
13%
|
$38.11
|
$34.90
|
$0.70
|
|
Q206
|
$1.20
|
$0.97
|
$1.91
|
14%
|
$39.13
|
$35.58
|
$0.70
|
|
Q306
|
$1.22
|
$1.20
|
$1.96
|
14%
|
$40.02
|
$36.38
|
$0.70
|
|
Q406
|
$1.32
|
$1.12
|
$1.45
|
15%
|
$37.51
|
$34.02
|
$3.70
|
|
Q107
|
$0.66
|
$1.08
|
$1.48
|
8%
|
$34.06
|
$34.29
|
$0.75
|
|
Q207
|
$0.41
|
$1.35
|
$1.66
|
5%
|
$31.50
|
$34.40
|
$0.75
|
|
Q307
|
($2.18)
|
$1.43
|
$1.74
|
(26%)
|
$5.32
|
$31.58
|
$0.75
|
|
Q407
|
($36.49)
|
$1.21
|
$0.91
|
(610%)
|
($22.18)
|
($4.46)
|
$2.75
|
|
1/1/2008
*
|
$23.18
|
$26.24
|
|||||
CAUTIONARY
STATEMENT: This Redwood Review contains forward-looking statements
within the meaning of the safe harbor provisions of the Private
Securities
Litigation Reform Act of 1995. Forward-looking statements involve
numerous risks
and uncertainties. Our actual results may differ from our expectations,
estimates, and projections and, consequently, you should not rely
on these
forward-looking statements as predictions of future events. Forward-looking
statements are not historical in nature and can be identified by
words such as
“anticipate,” “estimate,” “will,” “should,” “expect,” “believe,” “intend,”
“seek,” “plan” and similar expressions or their negative forms, or by references
to strategy, plans, or intentions. These forward-looking statements
are subject
to risks and uncertainties, including, among other things, those
described in
our Annual Report on Form 10-K for the year ended December 31,
2007 under the
caption “Risk Factors.” Other risks, uncertainties, and factors that could cause
actual results to differ materially from those projected are described
below and
may be described from time to time in reports we file with the
Securities and
Exchange Commission (SEC), including reports on Forms 10-K, 10-Q,
and 8-K. We
undertake no obligation to update or revise any forward-looking
statements,
whether as a result of new information, future events, or otherwise.
Important
factors, among others, that may affect our actual results include:
changes in
interest rates; changes in prepayment rates; general economic conditions,
particularly as they affect the price of earning assets and the
credit status of
borrowers; the availability of high quality assets for purchase
at attractive
prices; declines in home prices; increases in mortgage payment
delinquencies;
changes in the level of liquidity in the capital markets which
may adversely
affect our ability to finance our real estate asset portfolio;
changes in
liquidity in the market for real estate securities, the re-pricing
of credit
risk in the capital markets, rating agency downgrades of securities
and
increases in the supply of real estate securities available for
sale, each of
which may adversely affect the values of securities we own; the
extent of
changes in the values of securities we own and the impact of adjustments
reflecting those changes on our income statement and balance sheet,
including
our stockholders’ equity; our ability to maintain the positive stockholders’
equity necessary to enable us to pay the dividends required to
maintain our
status as a real estate investment trust for tax purposes; and
other factors not
presently identified. This Review may contain statistics and other
data that in
some cases have been obtained from or compiled from information
made available
by servicers and other third-party service
providers.
| 2 |
|
The
Redwood
Review
4th
Quarter
2007
|
|
|
Shareholder
Letter
|
Dear
Fellow
Shareholders:
The
well publicized
mortgage credit and liquidity crisis extended its reach during the
fourth
quarter, driving market values for residential, commercial, and CDO
real estate
securities to deeply discounted levels. In many cases, these declines
were
warranted in our opinion, as the likelihood or near-certainty of
credit losses
significantly diminished the intrinsic value of future expected cash
flows. In
other cases, we believe the general lack of liquidity and increased
risk
premiums have caused the market value for select assets to fall well
below
intrinsic value. To us, this market condition represents a buying
opportunity.
After
spending the
last couple of quarters largely on the sidelines, we were active
investors in
the fourth quarter, putting $123 million of capital to work.
We
did not deploy
this capital under the presumption that conditions in the housing
market have
improved or that the credit contagion has ended. Rather, we purchased
high
quality long-term assets at prices that provide us with a margin
of safety
against further deterioration, while at the same time offer significant
upside
potential. We expect these investments to create long-term value
for
shareholders in spite of continued pressure on market pricing levels
that will
likely persist over the coming months or even quarters.
We
ended 2007 with $282 million of excess capital and look forward to
putting this
capital to work in 2008.
We
are first and
foremost a credit driven company. We rely on our independent analysis
and views
on real estate. As such, we are proud of our track record over the
past fourteen
years. We hold ourselves to high performance standards. The credit
performance
of our 2005 and prior investments in residential and CDO assets and
our
commercial investments, in total representing 85% of our invested
capital,
continues to meet or exceed our initial expectations. We are, however,
disappointed with many of our residential and CDO investments originated
during
2006 and the first half of 2007.
We
have been
publicly bearish on residential credit investing since late 2005,
believing that
the high asset prices were out of line with the steady deterioration
in
underwriting and overall loan quality. We sold many of our riskier
residential
credit assets beginning later that year. We were cautious investors
in 2006 and
the first half of 2007, and in many cases our credit loss modeling
assumptions
were two to three times more severe than market estimates. Unfortunately,
based
on the very poor early credit results from 2006 and 2007 loan vintages,
especially for non-prime loans, it is now clear that we were not
bearish enough.
These 2006 and 2007 residential CES (including Sequoia) and CDO investments
(including Acacia) represented approximately 15% of our total capital
base at
December 31, 2007.
In
our view, recent efforts by the federal government – lower interest rates,
steeper yield curve, temporarily higher residential jumbo limits
for Freddie Mac
and Fannie Mae loans, mortgage interest rate renegotiations, fiscal
stimulus,
etc. – won’t hurt but probably won’t make a big difference either, in our
investment returns.
Despite
the bad
news in the real estate and capital markets that has been revealed
so far, we
believe there remains considerable complacency regarding the probable
severity
and duration of the real estate and capital markets correction the
U.S. is
facing. The bad news is not over. There is no short-term or easy
fix, and the
magnitude of the possible downside scenarios should not be
underestimated.
|
The
Redwood
Review
4th
Quarter
2007
|
|
3 |
|
|
Shareholder
Letter
|
On
the positive
side for Redwood, the real estate and capital markets excesses
of the past
continue to get wrung out of the system, making for a positive
longer-run future
for us. Real estate is beginning to return to sound fundamentals,
competition
has been reduced, and there are some prospects for new forms
of
credit-enhancement to arise in the future where we could be competitive.
Additionally, asset prices continue to fall, and assets are beginning
to change
hands after a market freeze of several months, so our search
for new acquisition
opportunities is becoming more interesting.
After
a painful
year for our industry, we have emerged from 2007 as one of the
companies best
positioned to capitalize on the opportunities that lay ahead.
The strength of
our balance sheet allowed us to weather the current liquidity
crisis and build
for the future. Overall, we believe the long-term outlook for
Redwood is
favorable, although the near and medium-term will likely remain
difficult. As a
survivor and a leader, we will have an opportunity to define
the new operating
models in our space in the future.
Sincerely,
 |
 |
|
|
George
E.
Bull, III
|
Douglas
B.
Hansen
|
|
|
Chairman
and CEO
|
President
|
| 4 |
|
The
Redwood
Review
4th
Quarter
2007
|
|
|
Quarterly
Overview
|
Fourth Quarter
2007
The
perfect storm
that has hit the real estate and capital markets has left no industry
participant unaffected. The capital markets model for mortgages
that flourished
for the past several years is now broken. The dislocations caused
by the storm
are deep and complex and it may take years for the market to adjust
to the new
reality. Our plan is to take advantage of the near-term buying
opportunities and
at the same time continue to develop strategies that ensure Redwood
is an
integral part of the evolving long-term solution.
Our
excess capital
position was $282 million at December 31, 2007, a slight decrease
from the $298
million we had at the end of the third quarter. During the quarter,
we raised
$131 million from stock issuance, $49 million from portfolio cash
flows in
excess of our operating costs, and $7 million from asset sales.
During the
quarter, we used $123 million of capital for new investments and
$80 million of
capital for dividend payments.
Our
year-end
liquidity position remained strong at $297 million. Redwood debt
(short-term
debt not included in capital) was $8 million at the end of the
quarter and $39
million at the beginning of the quarter. We continue to have no
liquidity issues
or need to sell assets, and have commenced using our excess capital
to invest in
new long-term assets. The calculation of our excess capital and
liquidity
position is detailed in the Capital and Liquidity module that follows
later in
this Review.
The
fourth quarter
was a big quarter for acquisitions and capital deployment. The
$123 million of
asset acquisitions we made this quarter were financed solely with
capital.
During the quarter, we invested $64 million in prime credit-enhancement
securities (CES), of which 78% were issued from 2003 to 2005. Additionally,
we
invested $42 million in distressed CDO securities, and $6 million
in distressed
subprime-backed securities. These distressed investments consisted
predominantly
of AAA and AA-rated securities from 2004 and 2005 vintages. We
made $22 million
of these investments through a newly formed Opportunity Fund discussed
in more
detail below. We also used $11 million to acquire a portion of
the AAA and
AA-rated ABS issued in 2004 by Acacia 5 and Acacia 6. We purchased these Acacia
securities at 53% of their principal value. Through February 29,
2008, the
underlying collateral owned by these two Acacia entities was performing
well and
had collectively received 85 rating upgrades and 13 downgrades.
Turning
to the
numbers –
our reported GAAP
loss for the fourth quarter of 2007 was $1.1 billion (negative
$36.49 per
share). This loss includes $1.1 billion ($37.90 per share) of net
negative
mark-to-market (MTM) valuation adjustments. Core earnings were
$36 million
(positive $1.21 per share). Estimated taxable earnings were $29
million
(positive $0.91 per share). Details and caveats regarding the use
and
determination of these calculations are found later in this Review.
The
wide variation
between our different earnings metrics makes it especially difficult
for an
investor to assess our financial performance for the fourth quarter.
We believe
a simple “cigar box” – where
did we start and where did we end – method of calculating
economic
results may give the most balanced short-term view. Our estimate
of the economic
book value, which is reconciled to GAAP book value in the Balance
Sheet Insights
module later in this Review, of our common stock at the beginning
of the fourth
quarter was $28.01 per share. During the quarter, we paid $2.75
per share of
dividends and raised book value by $0.27 per share through accretive
stock
offerings. We ended the quarter with an estimated economic book
value of $22.29.
The reduction in our economic book value due to short-term market
value
movements, after offset by net interest income, was $3.24 per share.
We would
caution that this measure of economic performance is heavily influenced
by
short-term movements in market prices. Long-term cash flow generation
remains
our ultimate goal, and it is difficult to measure progress towards
this goal by
looking at short-term market value movements, especially in this
market.
|
The
Redwood
Review
4th
Quarter
2007
|
|
5 |
|
|
Quarterly
Overview
|
Fourth
Quarter 2007 (continued)
Our
GAAP book value
of $23.18 per share on January 1, 2008 was slightly higher than our
year-end
estimate of economic book value. This GAAP book value reflects the
adoption of
FAS 159, a new fair value accounting standard that permits us to MTM
both the
assets and liabilities of consolidated Acacia CDO entities. Adopting
FAS 159
corrected a serious anomaly in our GAAP balance sheet presentation
that was
created by the unequal MTM treatment of Acacia’s assets and liabilities before
FAS 159 became effective. For GAAP book value on our December 31, 2007
balance
sheet, for instance, we recorded cumulative fair market value declines
for
Acacia’s assets of $ 1.6 billion, but were not permitted to record $1.5 billion
of market value declines for Acacia’s paired liabilities – the result was a
reported net GAAP book value of negative $22.18 per share at December
31, 2007.
This anomaly was corrected the next day to create an opening balance
sheet for
2008 that is more representative of economic reality, in our view.
The
Mark-to-Market Adjustments module of this Review discusses this complex
accounting change in detail, as well as its financial statement impact.
The
credit
performance of our residential credit-enhancement securities (CES)
and
residential loans was mixed during the fourth quarter, with performance
trends
varying significantly by loan vintage and underlying collateral type.
Our
realized credit losses for tax remained low at $4 million, slightly
higher than
the quarterly average for 2007 of $3 million.
The
majority of our
residential CES were originated in 2005 or prior, and these securities
continue
to perform in line with or better than our original expectations. The
prime and
alt-a loans backing these seasoned CES have generally exhibited strong
payment
histories and declining loan-to-value ratios due to principal pay-downs
and home
price appreciation in the earlier years of those loans. In contrast,
our
residential CES originated in 2006 and 2007, are performing worse than
our
original expectations. We have closely assessed our exposure to these
vintages
($48 million or 30% of total residential CES) and believe we were adequately
reserved for credit losses as of December 31, 2007.
Our
commercial CES
portfolio continues to perform well in the context of weakening fundamentals
for
this asset class in general. Serious delinquencies on commercial loans
underlying CES are still near industry historic lows. However, we expect
industry default rates to increase toward 1% during 2008, a higher
projection
than that of most market participants. As expected with diverse CMBS
collateral
pools, we continue to experience isolated defaults that have not been
indicative
of overall performance trends to date. We believe that our credit reserves
adequately provide for expected losses on all of our credit-sensitive
commercial
securities as of December 31, 2007.
We
think that the
residential securitization markets will adapt to the contagion that
has gripped
the real estate markets and create new opportunities for us as investors
and
securitizers of prime jumbo loans. We have identified new and innovative
ways to
be part of this capital markets solution, and are fostering new business
relationships that seemed unlikely only a few months ago. Future increases
in
loan refinancing activity combined with tighter underwriting standards
will help
create an environment where we can continue to thrive and grow our
residential
CES investment platform. The results look promising, as we have begun
putting
money to work in new prime residential CES in the first quarter of
2008.
|
6
|
|
The
Redwood
Review
4th
Quarter
2007
|
|
|
Quarterly
Overview
|
Fourth
Quarter 2007 (continued)
While
the near-term
growth potential for residential investments looks fair, commercial
real estate
securitization activity continues to languish, leaving limited financing
options
for borrowers. Life insurance companies and other balance-sheet lenders
have
taken back a sizeable chunk of commercial loan production activity
from the
capital markets, resulting in substantially lower CMBS securitization
volume.
The possibility of a national recession and the spillover from subprime
losses
at banks has caused many market participants to become bearish on this
sector.
We are not currently making credit-sensitive commercial real estate
investments,
but we are hiring new staff and continuing to build our investment
and
surveillance capabilities in expectation of future investment opportunities
in
this large real estate sector.
A
third asset type,
asset-backed collateralized debt obligations (ABS CDOs), has experienced
severe
distress from price declines, credit losses, and market contagion,
thus offering
substantial upside to investment managers like Redwood with a strong
platform
and track record of analyzing and selectively investing in these
securities. Credit losses and additional ratings agency downgrades
will likely
lead to an increasing number of forced CDO asset liquidations.
Our
ABS CDO
structuring and investment expertise gives us a competitive advantage
in
evaluating these distressed investments. We think this offers us a
great
opportunity to invest in distressed investments during 2008 through
our newly
created Redwood Opportunity Fund, LP. We committed $50 million of our
capital to
this fund, which is managed by our wholly-owned subsidiary, Redwood
Asset
Management, Inc. We are in the process of raising third-party capital
to
increase the size of the fund. The fund is designed to generate attractive
investment returns as well as asset management fees to Redwood.
In
the near-term we
expect GAAP earnings to remain volatile and unfortunately, confusing.
In
particular, we believe MTM adjustments will continue to pressure earnings.
The
factors influencing MTM adjustments are complex and explained in detail
in the
Mark-to-Market Adjustments and Investment in Acacia modules.
Real
estate
securities prices have continued to fall during the first quarter of
2008, which
could lead to more MTM adjustments. The unrealized MTM loss on residential,
commercial, and CDO CES at Redwood was $94 million at the end of the
fourth
quarter. An adverse change in the expected cash flows from these securities
in
2008 may require us to “impair” a portion or all of this unrecognized MTM loss
for accounting purposes and recognize the losses as expenses in our
income
statement. It is important to note that income statement impairment
charges will
not impact our GAAP book value as these unrecognized MTM losses were
already
deducted from stockholders’ equity at December 31, 2007.
We
also expect to
experience MTM income statement volatility from the consolidation of
Acacia
entities as a result of the valuation methodology changes required
by FAS 159.
Under FAS 159, we will be required to reflect Acacia MTM changes in
our income
statement rather than on our balance sheet. However, we expect this
income
statement volatility to be significantly less than the balance sheet
volatility
we encountered in 2007, as we will be able under FAS 159 to MTM both
the assets
and the liabilities of the consolidated Acacia entities.
In
addition to the
MTM earnings volatility from Acacia, our GAAP earnings will also be
affected by
net interest income generated through our Acacia investments. Interest
cash
flows due to us as equity investors in Acacia look healthy in sum,
but are
likely to be zero for some of the more recent Acacias, as the equity
cash flows
will likely be cut off in 2008 due to deteriorating collateral credit
ratings
and performance. Our earnings and cash flow outlook for Acacia is discussed
in
detail in the Investment in Acacia module in this Review.
|
The
Redwood
Review
4th
Quarter
2007
|
|
7 |
|
|
Quarterly
Overview
|
Fourth
Quarter 2007 (continued)
One
of several
potential positive offsets to future MTM write-downs is the earnings
upside we
could realize over time if our future credit performance is not as
severe as we
anticipated. As of December 31, 2007, we feel that we were adequately
reserved
for expected losses in our CES portfolio. Lower interest rates, higher
residential prepayments rates, avoiding a severe and prolonged recession,
and
other factors could help the outlook and performance of our investments
going
forward.
We
also expect that
an economic stimulus package recently passed by Congress, which raises
conforming limits for Freddie Mac and Fannie Mae eligible loans,
will have a
modest positive impact on our credit-enhancement portfolio. The long-term
impact, however, remains unclear. We discuss this stimulus package
in greater
detail in the Residential Securities module later in this Review.
We
believe our tax
earnings going forward will be less volatile than our GAAP earnings,
as earnings
for tax are not impacted by MTM adjustments. Since we are not permitted
to
establish credit reserves for tax however, the timing and severity
of actual
credit losses will be a major determinant of future taxable income.
Actual
credit losses reduced both total taxable income and REIT taxable
income by $5
million ($0.14 per share) during the fourth quarter of 2007 and $11
million
($0.40 per share) for all of 2007. We anticipate that credit losses
as measured
for tax will increase substantially in 2008 relative to our recent
experience.
The
most
appropriate expectation we can provide over the next year is that
credit losses
will escalate to a greater degree than our other operating fundamentals
improve,
thus reducing the amount of our special dividend distributions. If
the
realization of losses is concentrated in a short period of time,
taxable income
alone may be less than our regular dividend rate. Given the overall
earning
power of our existing assets, we believe we would most likely see
this as a
timing issue that we would not expect to persist.
Our
outlook for
capital deployment in 2008 is one of caution, but with tremendous
long-term
earnings potential. We are closely surveying the unwinding of aggressive
risk
positions and weak balance sheets in the capital markets. We see
extraordinary
opportunities to make new investments. Price levels for many real
estate assets
are now at historic lows, providing substantial cushion against future
losses.
Although we are by no means calling a market bottom, we have begun
to see
compelling long-term value in many new and seasoned assets, in spite
of the
price volatility that we and other market participants will continue
to
experience over the near term.
Although
the fourth
quarter was a big one for capital deployment ($123 million), our
rate of capital
deployment could increase in 2008. The velocity of forced liquidations
of
seasoned assets at depressed values by many financial institutions
is
increasing, and we expect new opportunities to arise to credit-enhance
new loans
originated to much higher-quality standards. We expect to continue
financing
these types of credit-sensitive investments with capital, either
on our own or
with third-party capital sourced through opportunity funds or other
asset
management vehicles. Given the opportunities in front of us, we will
likely seek
to raise additional Redwood capital in 2008, assuming capital can
be raised in a
manner that is accretive to book value and earnings, given our planned
capital uses.
|
8
|
|
The
Redwood
Review
4th
Quarter
2007
|
|
|
Quarterly
Overview
|
Fourth
Quarter 2007 (continued)
Our
business model
is and will continue to evolve rapidly, but the strategy
remains the same—to be
a leading provider of capital to credit-enhance real estate
loans and
securities. We believe there are attractive returns available
to those willing
to assume the credit risk of real estate loans, if done
in a disciplined and
responsible manner with the right people and the right
platform. Redwood is a
proven survivor. We believe we are one of the few remaining
companies that has
the capital and investment expertise to take advantage
of the extraordinary
opportunities that lie ahead. Our experience and entrepreneurial
spirit,
grounded by a sound risk management philosophy, position
us well for the future.
 |
 |
|
|
Martin
S.
Hughes
|
Brett
D.
Nicholas
|
|
|
Chief
Financial Officer
|
Chief
Investment Officer
|
|
|
Co-Chief
Operating Officer
|
Co-Chief
Operating Officer
|
|
The
Redwood
Review
4th
Quarter
2007
|
|
9 |
|
|
Balance
Sheet Insights
|
Components
of Book Value
The
following
supplemental non-GAAP presentation highlights our financial assets
and
liabilities by asset type and illustrates the difference between the
values used
in composition of our GAAP balance sheets and our estimates of economic
values.
We show our investments in the securitization entities in separate
line items
(similar to the equity method of accounting) reflecting the reality
that the
underlying assets and liabilities owned by these entities are legally
not ours,
and that we own only the securities we have acquired from these entities.
This
table, except for our estimates of economic value, is derived from
the Redwood
parent only balance sheet presented on page 13. This table also illustrates
the
initial balance sheet impact of a new accounting standard, FAS 159,
which we
adopted on January 1, 2008.
|
Components
of Book Value
|
|||||||||||||
|
($
in millions)
|
|||||||||||||
|
GAAP
|
GAAP
After
|
|
Economic
|
||||||||||
|
As
Reported
|
FAS
159
|
|
Value
|
||||||||||
|
12/31/07
|
1/1/08
|
Adj.
|
12/31/07
|
||||||||||
|
Real
estate
securities (excluding Sequoia and Acacia)
|
|||||||||||||
|
Residential
|
$
|
178
|
$
|
178
|
$
|
178
|
|||||||
|
Commercial
|
148
|
148
|
148
|
||||||||||
|
CDO
|
33
|
33
|
33
|
||||||||||
|
Subtotal
real
estate securities
|
359
|
359
|
359
|
||||||||||
|
Cash
and cash
equivalents
|
290
|
290
|
290
|
||||||||||
|
Investment
in
Sequoia
|
146
|
146
|
(47)
|
(a)
|
99
|
||||||||
|
Investment
in
Acacia
|
(1,385
|
)
|
84
|
(38)
|
(b)
|
46
|
|||||||
|
Other
assets/liabilities, net (d)
|
22
|
22
|
22
|
||||||||||
|
Subordinated
notes
|
(150
|
)
|
(150
|
)
|
56
|
(c)
|
(94
|
)
|
|||||
|
Stockholders’
Equity
|
$
|
(718
|
)
|
$
|
751
|
$
|
722
|
||||||
|
|
|||||||||||||
|
Book
value per Share
|
$
|
(22.18
|
)
|
$
|
23.18
|
$
|
22.29
|
||||||
(a)
Our actual
Sequoia investments consist of CES, IGS, and IOs acquired by Redwood
from the
Sequoia entities. We calculated the $99 million estimate of economic
value for
these securities using the same MTM valuation process that we followed
to fair
value all other real estate securities. In contrast, the $146 million
of GAAP
carrying value of these investments represents the difference between
residential real estate loans owned by the Sequoia entities and the
asset-backed
securities (ABS) issued by those entities to third party investors.
We account
for these loans and ABS issued at cost, not at fair value. GAAP carrying
value
is $47 million higher than our estimate of economic value primarily
because the
accounting method we use to amortize a portion of our loan acquisition
premiums
has not kept pace with loan prepayments.
(b)
Our actual
Acacia investments consist of equity interests, and to a lesser extent
ABS
issued, that we acquired from the Acacia entities. The $46 million
estimate of
economic value of our investment interests in the Acacia entities at
December
31, 2007 represents the net present value of projected cash flows from
our
Acacia investments and management fees discounted at 45%. In contrast,
the
negative $1.4 billion and $84 million of GAAP carrying values of our
Acacia
investments at December 31, 2007 and January 1, 2008, respectively,
represent
the difference between the securities owned by the Acacia entities
and ABS
issued by the Acacia entities to third party investors. The reason
for the
difference between economic and GAAP carrying values is complex and
relates to a
significant difference in valuation methodology. This difference is
discussed in
detail in the Investment in Acacia section in this Review.
(c)
We issued
$150 million of 30-year subordinated notes (trust preferred securities
or TruPS)
at an interest rate of LIBOR plus 225 basis points. Under GAAP, the
TruPS are
carried at cost at both December 31, 2007 and January 1, 2008. Economic
value is
difficult to estimate with precision as the TruPS market is currently
inactive.
We calculated the $94 million estimate of economic value using the
same MTM
valuation process used to fair value our other financial liabilities.
Estimated
economic value is $56 million lower than our GAAP carrying value because
given
the significant overall contraction in credit availability and re-pricing
of
credit risk, if we had issued these subordinated notes at December
31, 2007,
investors would have required a substantially higher interest rate.
(d)
Other
assets/liabilities, net are comprised of real estate loans of $4 million,
restricted cash of $5 million, and other assets of $62 million, less
Redwood
debt of $8 million and other liabilities of $41 million.
|
10
|
|
The
Redwood
Review
4th
Quarter
2007
|
|
|
Balance
Sheet Insights
|
Real
Estate Securities
|
The
table
below provides product type and vintage information regarding
the $359
million of securities owned by Redwood and the Opportunity
Fund, excluding
our investments in Acacia or Sequoia (or securities owned by
those
securitization entities).
|
|
Securities
at Redwood (a)
|
||||||||||||||||
|
Excludes
Investment in Sequoia and Acacia
|
||||||||||||||||
|
December
31, 2007
|
||||||||||||||||
|
($
millions)
|
||||||||||||||||
|
2004
&
|
||||||||||||||||
|
Earlier
|
2005
|
2006
|
2007
|
Total
|
||||||||||||
|
Residential
|
||||||||||||||||
|
Prime
|
||||||||||||||||
|
IGS
|
$
|
1
|
$
|
-
|
$
|
-
|
$
|
-
|
$
|
1
|
||||||
|
CES
|
73
|
28
|
10
|
16
|
127
|
|||||||||||
|
OREI
|
1
|
-
|
-
|
-
|
1
|
|||||||||||
|
Prime
Total
|
75
|
28
|
10
|
16
|
129
|
|||||||||||
|
Alt-a
|
||||||||||||||||
|
IGS
|
-
|
-
|
-
|
9
|
9
|
|||||||||||
|
CES
|
3
|
7
|
6
|
7
|
23
|
|||||||||||
|
OREI
|
-
|
-
|
7
|
2
|
9
|
|||||||||||
|
Alt-a
Total
|
3
|
7
|
13
|
18
|
41
|
|||||||||||
|
Subprime
IGS Total
|
4
|
-
|
2
|
2
|
8
|
|||||||||||
|
Residential
Total
|
82
|
35
|
25
|
36
|
178
|
|||||||||||
|
Commercial
CES Total
|
20
|
32
|
69
|
27
|
148
|
|||||||||||
|
CDO
IGS
|
12
|
12
|
-
|
7
|
31
|
|||||||||||
|
CDO
CES
|
1
|
-
|
1
|
-
|
2
|
|||||||||||
|
CDO
Total
|
13
|
12
|
1
|
7
|
33
|
|||||||||||
|
Total
at Redwood
|
$
|
115
|
$
|
79
|
$
|
95
|
$
|
70
|
$
|
359
|
||||||
(a)
Includes CDO and subprime securities held by Redwood Opportunity Fund,
LP.
|
In
the fourth
quarter, we acquired $64 million of mostly seasoned prime residential
CES,
$42 million of distressed AAA and AA-rated CDO securities,
and $6 million
in distressed subprime securities. We acquired $22 million
of these
distressed assets on behalf of a newly formed opportunity fund,
which is
discussed in more detail later in this review. We believe we
acquired
these investments at attractive prices and that they will prove
to be
excellent long-term investments. For GAAP balance sheet purposes,
we value
these securities each quarter using bid-side marks (an exit
price).
Bid/offer spreads are generally wide for these illiquid securities,
and in
today’s turbulent market, spreads are especially wide. We reduced
the
carrying (market) value of these new investments by $19 million
below our
investment cost primarily as a result of the bid/offer spread
difference.
|
|
Over
90% of
our investments in real estate securities at December 31, 2007
were
residential and commercial CES. We acquire CES at a significant
discount
to their principal value as credit losses could reduce or totally
eliminate the principal value of these bonds. Our return on
these
investments is based on how much principal and interest we
receive, and
how quickly it comes in. In an ideal environment we would experience
fast
prepayments and low credit losses allowing us to recover a
substantial
part of the discount as income. Conversely, the least beneficial
environment would be slow prepayments and high credit losses.
|
|
The
Redwood
Review
4th
Quarter
2007
|
|
11 |
|
|
Balance
Sheet
Insights
|
Real
Estate Securities (Continued)
|
In
the first
quarter of 2008, residential mortgage refinance applications
increased
over fourth quarter levels. Further actions by the Federal
Reserve to
reduce the federal funds rate may lead to additional reductions
in
mortgage rates and higher levels of refinance activity. Prepayment
rates
may also increase as a result of the new economic stimulus
package which
provides for an increase in the GSE conforming loan limits.
As a result,
some jumbo residential borrowers may now be able to refinance
into a lower
interest rate GSE loan.
|
|
We
provide
additional discussion and analysis regarding the adequacy
of our credit
reserves and the potential earnings upside from an increase
in prepayments
in the residential and commercial real estate securities
modules.
|
|
The
following
table presents the components of GAAP carrying value (which
equals fair
value) for residential and commercial CES (excluding our
investments in
Sequoia and Acacia).
|
|
Credit
Enhancement Securities at Redwood
|
||||||||||
|
Excludes
Investment in Sequoia and Acacia
|
||||||||||
|
December
31, 2007
|
||||||||||
|
($
in millions)
|
||||||||||
|
Residential
|
||||||||||
|
Prime
|
Alt-a
|
Commercial
|
||||||||
|
Current
face
|
$
|
528
|
$
|
235
|
$
|
522
|
||||
|
Unamortized
discount, net
|
(76
|
)
|
(14
|
)
|
(18
|
)
|
||||
|
Discount
designated as credit reserve
|
(288
|
)
|
(195
|
)
|
(318
|
)
|
||||
|
Amortized
cost
|
164
|
26
|
186
|
|||||||
|
Unrealized
gains
|
11
|
-
|
5
|
|||||||
|
Unrealized
losses
|
(48
|
)
|
(3
|
)
|
(43
|
)
|
||||
|
Carrying
value
|
$
|
127
|
$
|
23
|
$
|
148
|
||||
|
Carrying
value as a percentage of face
|
24
|
%
|
10
|
%
|
28
|
%
|
||||
|
12
|
|
The
Redwood
Review
4th
Quarter
2007
|
|
|
Balance
Sheet
Insights
|
Consolidating
Balance Sheet
The
table below
shows the components of our consolidated balance sheet at December
31, 2007.
This presentation highlights the negative impact that Acacia entities
had on our
consolidated stockholders’ equity at year end.
|
Consolidating
Balance Sheet
|
||||||||||||||||
|
December
31, 2007
|
||||||||||||||||
|
($
in millions)
|
||||||||||||||||
|
Redwood
Parent
Only
|
Sequoia
|
Acacia
|
Intercompany
|
Redwood
Consolidated
|
||||||||||||
|
Real
estate loans
|
$
|
4
|
$
|
7,174
|
$
|
26
|
$
|
-
|
$
|
7,204
|
||||||
|
Real
estate and other securities
|
359
|
-
|
1,935
|
(93
|
)
|
2,201
|
||||||||||
|
Cash
and cash equivalents
|
290
|
-
|
-
|
-
|
290
|
|||||||||||
|
Total
earning assets
|
653
|
7,174
|
1,961
|
(93
|
)
|
9,695
|
||||||||||
|
Investment
in Sequoia
|
146
|
-
|
-
|
(146
|
)
|
-
|
||||||||||
|
Investment
in Acacia
|
(1,385
|
)
|
-
|
-
|
1,385
|
-
|
||||||||||
|
Restricted
cash
|
5
|
-
|
113
|
-
|
118
|
|||||||||||
|
Other
assets
|
62
|
31
|
38
|
(5
|
)
|
126
|
||||||||||
|
Total
Assets
|
$
|
(519
|
)
|
$
|
7,205
|
$
|
2,112
|
$
|
1,141
|
$
|
9,939
|
|||||
|
Redwood
debt
|
$
|
8
|
$
|
-
|
$
|
-
|
$
|
-
|
$
|
8
|
||||||
|
Asset-backed
securities issued
|
-
|
7,039
|
3,383
|
(93
|
)
|
10,329
|
||||||||||
|
Other
liabilities
|
41
|
20
|
114
|
(5
|
)
|
170
|
||||||||||
| Subordinated notes |
150
|
-
|
-
|
-
|
150
|
|||||||||||
|
Total
Liabilities
|
199
|
7,059
|
3,497
|
(98
|
)
|
10,657
|
||||||||||
|
Total
Stockholders’ Equity
|
(718
|
)
|
146
|
(1,385
|
)
|
1,239
|
(718
|
)
|
||||||||
|
Total
Liabilities and Stockholders’ Equity
|
$
|
(519
|
)
|
$
|
7,205
|
$
|
2,112
|
$
|
1,141
|
$
|
9,939
|
|||||
The
table below
shows the components of our consolidated balance sheet at January 1,
2008 after
giving effect to the adoption of a new accounting standard, FAS 159.
This new
accounting standard is discussed under Mark-to-Market Adjustments later
in this
Review.
|
Consolidating
Balance Sheet
|
||||||||||||||||
|
January
1, 2008
|
||||||||||||||||
|
Redwood
Parent
Only
|
Sequoia
|
Acacia
|
Intercompany
|
Redwood
Consolidated
|
||||||||||||
|
Real
estate loans
|
$
|
4
|
$
|
7,174
|
$
|
26
|
$
|
-
|
$
|
7,204
|
||||||
|
Real
estate and other securities
|
359
|
-
|
1,935
|
(93
|
)
|
2,201
|
||||||||||
|
Cash
and cash equivalents
|
290
|
-
|
-
|
-
|
290
|
|||||||||||
|
Total
earning assets
|
653
|
7,174
|
1,961
|
(93
|
)
|
9,695
|
||||||||||
|
Investment
in Sequoia
|
146
|
-
|
-
|
(146
|
)
|
-
|
||||||||||
|
Investment
in Acacia
|
84
|
-
|
-
|
(84
|
)
|
-
|
||||||||||
|
Restricted
cash
|
5
|
-
|
113
|
-
|
118
|
|||||||||||
|
Other
assets
|
62
|
31
|
17
|
(5
|
)
|
105
|
||||||||||
|
Total
Assets
|
$
|
950
|
$
|
7,205
|
$
|
2,091
|
$
|
(328
|
)
|
$
|
9,918
|
|||||
|
Redwood
debt
|
$
|
8
|
$
|
-
|
$
|
-
|
$
|
-
|
$
|
8
|
||||||
|
Asset-backed
securities issued
|
-
|
7,039
|
1,893
|
(93
|
)
|
8,839
|
||||||||||
|
Other
liabilities
|
41
|
20
|
114
|
(5
|
)
|
170
|
||||||||||
|
Subordinated
notes
|
150
|
-
|
-
|
-
|
150
|
|||||||||||
|
Total
Liabilities
|
199
|
7,059
|
2,007
|
(98
|
)
|
9,167
|
||||||||||
|
Total
Stockholders’ Equity
|
751
|
146
|
84
|
(230
|
)
|
751
|
||||||||||
|
Total
Liabilities and Stockholders’ Equity
|
$
|
950
|
$
|
7,205
|
$
|
2,091
|
$
|
(328
|
)
|
$
|
9,918
|
|||||
|
The
Redwood
Review
4th
Quarter
2007
|
|
13 |
 |
GAAP
Income and Core
Earnings
|
Summary
What
is
this?
GAAP
income is
income calculated under Generally Accepted Accounting Principles (GAAP)
in the
United States.
Core
earnings
is a profitability measure that highlights earnings that we believe
are more
likely to be ongoing in nature. In calculating core earnings, we start
with GAAP
income and then exclude realized gains and losses on calls and sales,
unrealized
market value adjustments, and one-time items that are unlikely to be
repeated.
Table 2 in the Appendix shows a reconciliation of core earnings to
GAAP
income.
Quarterly
Update
| Ø |
GAAP
loss of
$1.1 billion for the fourth quarter, or $36.49 per share,
was primarily
due to $1.1 billion ($37.90 per share) of negative unrealized
mark-to-market valuation
adjustments.
|
| Ø |
For
the past
two and a half years, quarterly core earnings have
ranged from $0.97 to
$1.43 per share. Our fourth quarter core earnings
of $1.21 per share
continued to be in this
range.
|
| Ø |
The
table
below provides a summary of our GAAP (loss) income
and core earnings for
the fourth quarter of 2007, the previous quarter,
and the fourth quarter
of 2006.
|
|
For
the Quarter Ended
|
||||||||||
|
GAAP
Income
|
Dec-07
|
Sep-07
|
Dec-06
|
|||||||
|
Interest
income
|
$
|
202
|
$
|
219
|
$
|
217
|
||||
|
Interest
expense
|
(153
|
)
|
(165
|
)
|
(172
|
)
|
||||
|
Net
interest income
|
49
|
54
|
45
|
|||||||
|
|
||||||||||
|
Operating
expenses
|
(16
|
)
|
(12
|
)
|
(14
|
)
|
||||
|
Realized
gains (losses) on sales
|
7
|
(1
|
)
|
5
|
||||||
|
Realized
gains on calls
|
-
|
3
|
2
|
|||||||
|
Market
valuation adjustments, net
|
(1,119
|
)
|
(103
|
)
|
(1
|
)
|
||||
|
Credit
(provision) for taxes
|
2
|
(2
|
)
|
(1
|
)
|
|||||
|
GAAP
(loss) income
|
$
|
(1,077
|
)
|
$
|
(61
|
)
|
$
|
36
|
||
|
GAAP
(loss) income per share
|
$
|
(36.49
|
)
|
$
|
(2.18
|
)
|
$
|
1.32
|
||
|
For
the Quarter Ended
|
||||||||||
|
Core
Earnings
|
Dec-07
|
Sep-07
|
Dec-06
|
|||||||
|
Interest
income
|
$
|
202
|
$
|
219
|
$
|
217
|
||||
|
Interest
expense
|
(153
|
)
|
(165
|
)
|
(172
|
)
|
||||
|
Net
interest income
|
49
|
54
|
45
|
|||||||
|
|
||||||||||
|
Operating
expenses
|
(15
|
)
|
(12
|
)
|
(14
|
)
|
||||
|
Realized
gains (losses) on sales
|
-
|
-
|
-
|
|||||||
|
Realized
gains on calls
|
-
|
-
|
-
|
|||||||
|
Market
valuation adjustments, net
|
-
|
-
|
-
|
|||||||
|
Credit
(provision) for taxes
|
2
|
(2
|
)
|
(1
|
)
|
|||||
|
|
||||||||||
|
Core
earnings
|
$
|
36
|
$
|
40
|
$
|
31
|
||||
|
Core
earnings per share
|
$
|
1.21
|
$
|
1.43
|
$
|
1.12
|
||||
|
14
|
|
The
Redwood
Review
4th
Quarter
2007
|
|
|
GAAP
Income and Core
Earnings
|
Quarterly
Update (continued)
| Ø |
Valuation
adjustments are discussed in detail in the Mark-to-Market
Adjustments
module later in this
Review.
|
| Ø |
Net
interest
income for the fourth quarter decreased by $5 million
from the previous
quarter. Net interest income from Acacia securitization
entities was $4
million lower due to lower discount amortization
and timing differences on
assets and liabilities interest rate resets. Net
interest income from
Sequoia securitization entities was $1 million
lower as a result of a $3
million increase in provisions for credit losses
partially offset by lower
premium amortization from slower prepayment
speeds.
|
| Ø |
Operating
expenses increased by $4 million over the
prior quarter. This increase
resulted from $1 million of severance charges,
and $1 million from the
accelerated write-off of deferred IT system
costs. Additionally, the third
quarter benefited from the reversal of
$2 million bonus accruals
established during the first and second
quarters.
|
| Ø |
We
accrue for
income taxes throughout the year
based on our estimates of taxable
income.
In the fourth quarter, we revised
our estimates (see Taxable Income)
which
resulted in a credit for income
taxes this
quarter.
|
|
The
Redwood
Review
4th
Quarter
2007
|
|
15 |
|
|
GAAP
Income and Core
Earnings
|
Quarterly Update (continued)
| Ø |
In
the table
below, we detail the components of our consolidated
income statement for
the three months and year ended December 31,
2007. This table highlights
the significant negative impact that Acacia had
on fourth quarter and 2007
earnings.
|
|
Pro
Forma Consolidating Income Statement (a)
|
|||||||||||||
|
Three
Months Ended December 31, 2007
|
|||||||||||||
|
($
in millions)
|
|||||||||||||
|
Redwood
(b)
|
Sequoia
|
Acacia
|
Consolidated
|
||||||||||
|
Net
interest income
|
$
|
34
|
$
|
7
|
$
|
8
|
$
|
49
|
|||||
|
Operating
expenses
|
(16
|
)
|
-
|
-
|
(16
|
)
|
|||||||
|
Realized
gains (losses) on sales and calls
|
9
|
-
|
(2
|
)
|
7
|
||||||||
|
Market
valuation adjustments, net
|
(130
|
)
|
-
|
(989
|
)
|
(1,119
|
)
|
||||||
|
Credit
for income taxes
|
2
|
-
|
-
|
2
|
|||||||||
|
Net
(loss) income
|
$
|
(101
|
)
|
$
|
7
|
$
|
(983
|
)
|
$
|
(1,077
|
)
|
||
|
Year
Ended December 31, 2007
|
|||||||||||||
|
Redwood
|
|||||||||||||
|
Redwood
(b)
|
Sequoia
|
Acacia
|
Consolidated
|
||||||||||
|
Net
interest income
|
$
|
133
|
$
|
29
|
$
|
42
|
$
|
204
|
|||||
|
Operating
expenses
|
(59
|
)
|
-
|
-
|
(59
|
)
|
|||||||
|
Realized
gains (losses) on sales and calls
|
15
|
-
|
(2
|
)
|
13
|
||||||||
|
Market
valuation adjustments, net
|
(174
|
)
|
-
|
(1,087
|
)
|
(1,261
|
)
|
||||||
|
Credit
for income taxes
|
(5
|
)
|
-
|
-
|
(5
|
)
|
|||||||
|
Net
(loss) income
|
$
|
(90
|
)
|
$
|
29
|
$
|
(1,047
|
)
|
$
|
(1,108
|
)
|
||
| (a) |
The
purpose of this pro forma presentation is to show the consolidating
components to our income statement for the three months and
year ended
December 31, 2007.
|
| (b) |
The
Redwood column reflects Redwood without any investment in Sequoia
and
Acacia. This is a non-GAAP presentation. In a GAAP presentation,
the
Redwood income statement column would have reflected the income
from
Sequoia and the loss from
Acacia.
|
| Ø |
Looking
out
into 2008, it is very difficult to project GAAP
earnings due to the likely
continuing negative impact of MTM adjustments.
The potential factors that
could cause MTM adjustments in 2008 are discussed
in the Mark-to-Market
Adjustments and Investments in Acacia modules
later in this
Review.
|
|
16
|
|
The
Redwood
Review
4th
Quarter
2007
|
|
|
Taxable
Income
|
Summary
What
is
this?
Total
taxable
income is our pre-tax income as calculated for tax purposes. Total
taxable
income differs materially from GAAP income. Table 3 in the Appendix
reconciles
these two profitability measures.
REIT
taxable
income is the primary determinant of the minimum amount of dividends
we must
distribute in order to maintain our tax status as a real estate investment
trust
(REIT). REIT taxable income is pre-tax profit, as calculated for tax
purposes,
excluding taxable income earned at our non-REIT taxable subsidiaries.
Over time,
we must distribute at least 90% of our REIT taxable income as dividends.
A
reconciliation of GAAP income to REIT taxable income appears in Table
3 of the
Appendix.
Quarterly
Update
| Ø |
Total
taxable
income for the fourth quarter of 2007 was
$29 million, or $0.91 per share.
REIT taxable income was $32 million, or $0.99
per share, in the fourth
quarter of 2007.
|
| Ø |
Our
taxable
income decreased from the prior quarter by
$19 million. This decrease
represents a $5 million ($0.15 per share)
increase in credit losses on
CES, $10 million ($0.30 per share) related
to the write-off of unamortized
interest only securities (IOs) tax basis
resulting from the call of
Sequoia transactions earlier in 2007, and
$4 million ($0.12 per share) for
losses on commercial assets held at Redwood.
In earlier estimates of
taxable income for 2007, we had anticipated
that the losses from the IOs
and the commercial assets would be capital
losses. We now expect these
losses to be treated as ordinary losses.
Furthermore, in the fourth
quarter, we issued over 4 million shares,
an increase of 16%, which had a
dilutive effect ($0.14 per share) on taxable
earnings.
|
| Ø |
Looking
out
into 2008, our best estimate at this time is
that REIT taxable income for
the year will continue to exceed our regular
annual dividend rate of $3.00
per share. Our REIT taxable income, however, will depend,
among other
things, on our ability to deploy effectively our $282 million of
excess capital and the level of credit losses
during 2008. We expect
credit losses on our residential CES to increase
substantially in 2008
relative to our recent
experience.
|
|
The
Redwood
Review
4th
Quarter
2007
|
|
17 |
|
|
Taxable
Income
|
Quarterly Update (continued)
| Ø |
As
discussed
further under Investment in Sequoia, the
tax basis on Sequoia IOs we own
is $75 million. Most of the underlying pools
of loans have paid down or
will pay down within the next year to levels
where they are callable. When
these are called, losses on these IOs will
be incurred and our taxable
income and dividend distribution requirements
will decrease. The actual
losses will depend on the tax basis at the
time of any calls as the
monthly cash flows received on these IOs
in the interim will reduce their
cost basis. At this time, we do not anticipate
calling any Sequoia deals
in 2008.
|
| Ø |
Our
taxable
income continues to be higher than
our GAAP income as we are not permitted
to establish credit reserves for
tax and we do not generally recognize
changes in market values of assets
for tax until the asset is sold.
As a
result of these differences in
accounting, at December 31, 2007,
the tax
basis on our residential, commercial,
and CDO CES at Redwood is $242
million higher than our GAAP basis.
Future credit losses will have
a more
significant impact on our taxable
income than on our GAAP
income.
|
|
18
|
|
The
Redwood
Review
4th
Quarter
2007
|
|
|
Capital
& Liquidity
|
Summary
What
is
this?
We
use capital
to fund our operations, invest in earning assets which are primarily
credit
sensitive and illiquid investments, fund working capital, and to meet
lender
capital requirements with respect to collateralized
borrowings.
Through
our
internal risk-adjusted capital policies, we estimate the amount of
capital we
need to manage our current book of business, and to set aside a prudent
level of
reserve capital to meet liquidity needs that may arise. Any capital
that exceeds
our risk-adjusted capital guideline amount is excess capital that can
be used to
support business growth.
Our
capital
base includes common equity plus $150 million subordinated notes (trust
preferreds).
Quarterly
Update
| · |
Our
net
liquid assets at December 31, 2007 totaled $297 million and
included $290
unrestricted cash, $5 million residential real estate loans,
and $10
million AAA-rated securities, less $8 million of Redwood
debt.
|
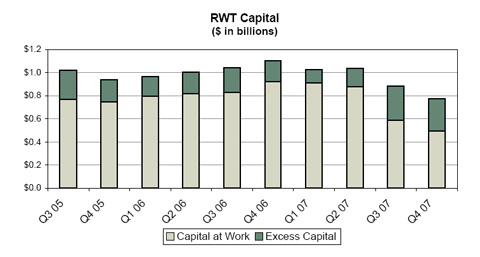
| · |
Our
total
capital base declined from $0.9 billion at September 30,
2007 to $0.8
billion at December 31, 2007. The primary reason was the
decline in market
values of our investments.
|
| · |
At
December
31, 2007, we had $282 million of excess capital, a slight
decrease from
the $298 million excess capital we had at September 30, 2007
and an
increase from the $183 million with which we began the year.
Sources of
capital included sales ($7 million), equity issuance ($131
million), and
net cash flows received from our portfolio after operating
costs ($49
million). Uses of capital during the fourth quarter included
acquisitions
($123 million) and dividends ($80 million).
|
| · |
Capital
employed decreased in the fourth quarter from $585 million
to $496 million
primarily as a result of decreases in market values on our
investments.
Market value declines do not have a large effect on excess
capital, as
asset value declines generally reduce equally both total
capital and
capital required for these investments under our internal
risk-adjusted
capital guidelines.
|
|
The
Redwood
Review
4th
Quarter
2007
|
|
19 |
|
|
Dividends
|
Summary
What
is
this?
We
have
established a regular quarterly dividend rate at a level we believe
is likely to
be sustainable unless realized credit losses rise dramatically or our
business
economics decline materially for some other reason. Distributions in
excess of
the regular dividend rate, if any, are typically paid in a fourth quarter
special dividend.
Quarterly
Update
| · |
Our
current
regular dividend rate for 2007 was $0.75 per share per quarter.
We have
announced that our board of directors intends to maintain
the regular
dividend at $0.75 per quarter for
2008.
|
| · |
We
paid a
special dividend of $2.00 per share in the fourth quarter
of
2007.
|

| · |
Total
dividend distributions over the last four quarters were $5.00
per share.
Assuming the February 29, 2008 Redwood stock price of $33.42,
the
indicated dividend yield would be 15.0% based on the last
twelve months of
dividends and would be 9.0% based on the current regular
dividend rate of
$3.00 per share.
|
| · |
We
generally
distribute 100% of REIT capital gains income and 90% of REIT
ordinary
income, retaining 10% of the ordinary REIT income. We generally
retain
100% of the after-tax income we generate in taxable subsidiaries.
All of
our dividend distributions in 2007 were ordinary
income.
|
| · |
As
in prior
years, we deferred the distribution of a portion of REIT
taxable income
earned in 2007 until 2008. At December 31, 2007, we had $49
million ($1.52
per share) of undistributed REIT taxable income that we anticipate
distributing in 2008. Based on the number of currently outstanding
shares,
we expect this to equal two quarters of regular quarterly
dividends.
|
|
20
|
|
The
Redwood
Review
4th
Quarter
2007
|
|
|
Mark-to-Market
Adjustments
|
Market
Conditions
| Ø |
The
broad
re-evaluation of residential and commercial mortgage credit
risk and the
subsequent reduction in market values that began earlier
in the year
continued unabated through the end of the fourth quarter
of 2007 and into
the first quarter of 2008. The most dramatic negative price
adjustments
involved residential mortgage-backed securities (RMBS) and
CDO securities
backed by subprime and alt-a mortgages originated in 2006
and 2007. The
table below illustrates the additional interest rate spread
that investors
have required to compensate for the perceived credit risk
of various types
of RMBS and commercial mortgage-backed securities
(CMBS).
|
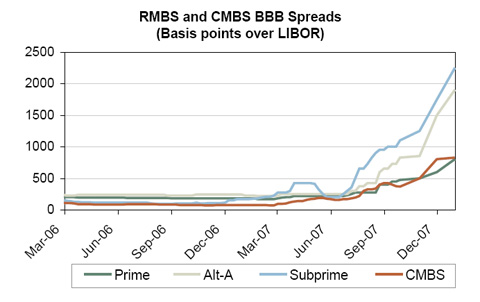
| Ø |
Factors
fueling the broad re-pricing include declines in home prices
and the
values of commercial properties, a rapid increase in the
number of
delinquent residential mortgage loans, the reduced willingness
of
investors to acquire commercial paper or other short-term
debt backed by
mortgage collateral, credit-rating downgrades by rating
agencies of
numerous mortgage-related securities and of bond insurers,
the overall
contraction in market liquidity, forced selling, the impact
of speculation
in credit derivatives markets, and the general unwillingness
of buyers to
acquire assets in a falling
market.
|
| Ø |
For
some
assets, market value declines reflect the near-certainty
of serious credit
losses being realized. For others, significant future losses
may not
occur, but there is a perceived increase in the risk of
loss resulting in
a lower market value. Finally, many assets are not at serious
risk of loss
but their market value has declined nevertheless due to
a loss of
liquidity and an increase in general market risk premiums.
|
| Ø |
Market
trading activity during the second half of 2007 was unusually
light as
uncertainty related to future loss estimates made it difficult
for willing
buyers and sellers to agree on price.
|
| Ø |
New
securitization activity remained at low levels into the
first quarter of
2008. Sales of distressed and seasoned assets, however,
began to increase
largely as a result of CDO and hedge fund liquidations.
Prices for
residential, commercial, and CDO securities have continued
to
decline.
|
|
The
Redwood
Review
4th
Quarter
2007
|
|
21 |
 |
Mark-to-Market
Adjustments
|
Accounting
Discussion
| Ø |
The
rules
regarding MTM accounting are complex and may not clearly
reflect the
underlying economics. This accounting discussion is intended
to provide
investors with a better understanding of the impact of
MTM adjustments on
our reported results.
|
| Ø |
MTM
adjustments can result from changes in fair values caused
either by a
change in expected cash flows (i.e. increased credit
loss estimates reduce
expected cash flows), or a change in market discount
rates (i.e. the
market requires a greater risk premium and/or interest
rates rise), or a
combination of both.
|
| Ø |
All
changes
in fair value for securities or derivatives accounted
for as trading
instruments flow through the income statement. These
adjustments can be
either positive or negative from period to
period.
|
|
Ø
|
The
vast
majority of real estate securities held by Redwood and consolidated
Acacia
entities at December 31, 2007 were accounted for as available-for-sale
(AFS) securities. We carry AFS securities in our GAAP balance
sheet at
their fair value. Positive changes in the fair value of AFS
securities
from period to period are always accounted for as increases
to
stockholders’ equity and do not flow through our income statement.
Accounting for negative changes in the fair value of AFS
securities from
period to period requires a three-step process involving
a combination of
quantitative and judgmental evaluations. The ultimate purpose
of this
process is to determine whether negative MTM adjustments
represent
“other-than-temporary” (permanent) impairments, which flow through our
GAAP income statement, or represent “temporary” impairments, which are
recorded as a reduction of stockholders’ equity and do not flow through
our income statement.
|
|
Ø
|
The
diagram
below and the narrative discussion that follow addresses
the three-step
process for evaluating impairments on AFS
securities.
|
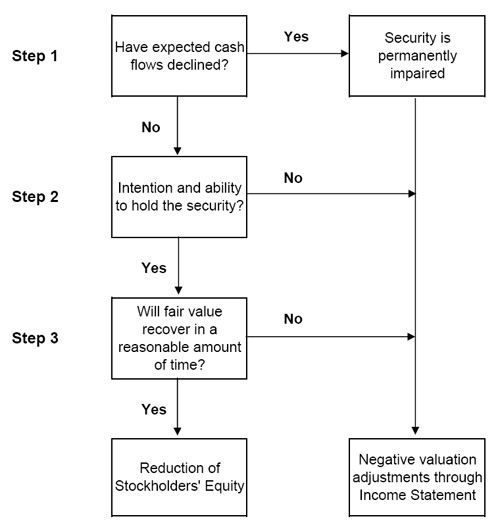
|
22
|
|
The
Redwood
Review
4th
Quarter
2007
|
|
|
Mark-to-Market
Adjustments
|
Accounting
Discussion (continued)
|
Ø
|
The
first
step is to determine whether there has been an adverse change
in the
underlying cash flows generated by the security. A security
is considered
impaired even if the change in projected cash flows is small
relative to
the resulting MTM adjustment. It is difficult to separate
with precision
how much of the change in fair value is driven by changes
in expected cash
flows versus changes in market discount rates, but during
periods of
market illiquidity and uncertainty (as we encountered in
late 2007), the
market discount rate impact can be significant.
|
|
Ø
|
The
second
step is to determine whether we have the ability and intention
to hold the
security.
|
|
Ø
|
The
third
step requires us to evaluate whether an impaired security
will recover in
value within a reasonable period of time. This step is very
subjective and
proved especially difficult this quarter in light of turmoil
and
uncertainty in the capital markets. We needed additional
time to complete
this step, and thus we requested a fifteen-day extension
of the filing
date of our annual report on Form 10-K. Over 70% of the permanent
impairments we recorded during the fourth quarter resulted
from this third
step of the process.
|
| Ø |
AFS
securities deemed permanently impaired for accounting
purposes cannot be
written back up through MTM adjustments in our income
statement. This does
not mean the underlying security could not recover in
value. If the value
of an impaired security does recover, we would recognize
this benefit
through higher interest yields over time. Therefore,
some of our
securities classified as permanently impaired for accounting
purposes
during the fourth quarter and in 2007 may eventually
prove to have
significant economic value to
us.
|
| Ø |
For
accounting purposes, we consolidate the balance sheet
and income statement
of the Acacia securitization entities. As a consequence,
in 2007 we were
required for financial statement purposes to MTM all
of the AFS securities
held by Acacia entities (the assets) but were not permitted
to MTM paired
asset-backed securities issued (the liabilities). On
January 1, 2008, we
adopted a new accounting standard, FAS 159, and elected
to fair value both
the assets and liabilities of the Acacia entities.
In accordance with FAS
159, we recorded a one-time, cumulative-effect adjustment
to our balance
sheet that decreased the carrying value of Acacia liabilities
by $1.5
billion and increased stockholders’ equity by that amount in our January
1, 2008 opening balance sheet. This new standard significantly
reduces the
disparity that existed between GAAP carrying value
and our estimate of
economic value.
|
| Ø |
In
2008, we
will be required to flow through our quarterly income
statement any net
change in the fair value of Acacia assets and liabilities.
Therefore, we
will no longer account for Acacia assets as AFS securities.
As a result of
the measurement techniques required by FAS 159, we
expect to encounter
continued MTM earnings volatility in the future as
a result of the
consolidation of Acacia entities. Overall, we expect
this volatility to be
less than we encountered in 2007, as we will be able
to MTM both the
assets and liabilities of Acacia entities. This is
a complex topic that is
more fully discussed in the Investment in Acacia
module.
|
| Ø |
We
will
continue to account for our CES held at Redwood on
December 31, 2007 as
AFS
securities.
|
|
The
Redwood
Review
4th
Quarter
2007
|
|
23 |
|
|
Mark-to-Market
Adjustments
|
Impact
on Redwood
| Ø |
The
tables
below detail the total MTM adjustments by underlying collateral
type for
the securities we hold on a consolidated basis and between
Redwood and
Acacia.
|
|
Total
Mark-To-Market Adjustments
|
||||||||||||||||
|
By
Underlying Collateral Type
|
||||||||||||||||
|
Three
Months Ended December 31, 2007
|
||||||||||||||||
|
($
in millions)
|
||||||||||||||||
|
OREI
&
|
MTM
|
|||||||||||||||
|
IGS
|
CES
|
Derivatives
|
Total
|
Percent
(a)
|
||||||||||||
|
Residential
|
||||||||||||||||
|
Prime
|
$
|
(152
|
)
|
$
|
(144
|
)
|
$
|
-
|
$
|
(296
|
)
|
(26
|
)%
|
|||
|
Alt-a
|
(233
|
)
|
(83
|
)
|
(39
|
)
|
(355
|
)
|
(39
|
)%
|
||||||
|
Subprime
|
(64
|
)
|
(41
|
)
|
(5
|
)
|
(110
|
)
|
(32
|
)%
|
||||||
|
Residential
total
|
(449
|
)
|
(268
|
)
|
(44
|
)
|
(761
|
)
|
||||||||
|
Commercial
|
(7
|
)
|
(55
|
)
|
-
|
(62
|
)
|
(13
|
)%
|
|||||||
|
CDO
|
(81
|
)
|
(22
|
)
|
-
|
(103
|
)
|
(45
|
)%
|
|||||||
|
Derivatives
|
-
|
-
|
(30
|
)
|
(30
|
)
|
||||||||||
|
Total
mark-to-market adjustments
|
$
|
(537
|
)
|
$
|
(345
|
)
|
$
|
(74
|
)
|
$
|
(956
|
)
|
||||
|
By
Vintage & Entity
|
||||||||||||||||
|
|
<=
2004
|
2005
|
2006
|
2007
|
Total
|
|||||||||||
|
Acacia
|
$
|
(94
|
)
|
$
|
(166
|
)
|
$
|
(353
|
)
|
$
|
(189
|
)
|
$
|
(802
|
)
|
|
|
Redwood
|
(38
|
)
|
(29
|
)
|
(40
|
)
|
(47
|
)
|
(154
|
)
|
||||||
|
Total
mark-to-market adjustments
|
$
|
(132
|
)
|
$
|
(195
|
)
|
$
|
(393
|
)
|
$
|
(236
|
)
|
$
|
(956
|
)
|
|
|
MTM
percent (a)
|
(17
|
)%
|
(24
|
)%
|
(40
|
)%
|
(44
|
)%
|
||||||||
|
Total
Mark-To-Market Adjustments
|
||||||||||||||||
|
By
Underlying Collateral Type
|
||||||||||||||||
|
Year
Ended December 31, 2007
|
||||||||||||||||
|
($
in millions)
|
||||||||||||||||
|
|
OREI
&
|
MTM
|
||||||||||||||
|
IGS
|
CES
|
Derivatives
|
Total
|
Percent(a)
|
|
|||||||||||
|
Residential
|
||||||||||||||||
|
Prime
|
$
|
(252
|
)
|
$
|
(290
|
)
|
$
|
1
|
$
|
(541
|
)
|
(39
|
)%
|
|||
|
Alt-a
|
(467
|
)
|
(168
|
)
|
(67
|
)
|
(702
|
)
|
(56
|
)%
|
||||||
|
Subprime
|
(192
|
)
|
(59
|
)
|
(11
|
)
|
(262
|
)
|
(53
|
)%
|
||||||
|
Residential
total
|
(911
|
)
|
(517
|
)
|
(77
|
)
|
(1,505
|
)
|
% | |||||||
|
Commercial
|
(20
|
)
|
(156
|
)
|
-
|
(176
|
)
|
(29
|
)%
|
|||||||
|
CDO
|
(167
|
)
|
(33
|
)
|
-
|
(200
|
)
|
(62
|
)%
|
|||||||
|
Derivatives
|
-
|
-
|
(44
|
)
|
(44
|
)
|
||||||||||
|
Total
mark-to-market adjustments
|
$
|
(1,098
|
)
|
$
|
(706
|
)
|
$
|
(121
|
)
|
$
|
(1,925
|
)
|
||||
|
By
Vintage &
Entity
|
||||||||||||||||
|
|
<=
2004
|
2005
|
2006
|
2007
|
Total
|
|||||||||||
|
Acacia
|
$
|
(200
|
)
|
$
|
(315
|
)
|
$
|
(742
|
)
|
$
|
(339
|
)
|
$
|
(1,596
|
)
|
|
|
Redwood
|
(65
|
)
|
(52
|
)
|
(108
|
)
|
(104
|
)
|
(329
|
)
|
||||||
|
Total
mark-to-market adjustments
|
$
|
(265
|
)
|
$
|
(367
|
)
|
$
|
(850
|
)
|
$
|
(443
|
)
|
$
|
(1,925
|
)
|
|
|
MTM
percent (a)
|
(30
|
)%
|
(38
|
)%
|
(59
|
)%
|
(60
|
)%
|
||||||||
(a)
This
percentage represents the MTMs taken as a percentage of the reported
fair values
at the beginning of the period, or purchase price if acquired during
the period.
It is intended to highlight the price declines by collateral type
for the three
months and year ended December 31, 2007. These price declines are
specific to
our portfolio and may not be indicative of price declines in the
market in
general.
| Ø |
The
table
below shows the impact of MTM adjustments after giving effect
to FAS 159
on January 1, 2008. This presentation shows the effective
MTM impact from
Acacia entities was $106 million for 2007. This impact is
substantially
less than the negative $1.6 billion that was reported in
our GAAP
financial statements.
|
|
January
1, 2008
|
||||||||||
|
After
giving effect of FAS 159
|
||||||||||
|
Redwood
|
||||||||||
|
Redwood
|
Acacia
|
Consolidated
|
||||||||
|
Mark-to-market
adjustments on assets in 2007
|
$
|
(329
|
)
|
$
|
(1,596
|
)
|
$
|
(1,925
|
)
|
|
|
Cummulative
effect of adjustments on Jan 1, 2008
|
1,490
|
1,490
|
||||||||
|
Effective
mark-to-market adjustments
|
$
|
(329
|
)
|
$
|
(106
|
)
|
$
|
(435
|
)
|
|
| 24 |
|
The
Redwood
Review
4th
Quarter
2007
|
|
|
Mark-to-Market
Adjustments
|
Impact on Redwood (continued)
| Ø |
The
tables
below presents the fourth quarter and full year MTM
adjustments on our
securities as reflected in our consolidated balance
sheet and income
statement, and between Redwood and
Acacia.
|
|
Pro
Forma Balance Sheet and Income Statement
Information
|
||||||||||
|
Mark-to-Market
Adjustments on Securities
|
||||||||||
|
Three
Months Ended December 31, 2007
|
||||||||||
|
($
in millions)
|
||||||||||
|
|
Redwood
|
|||||||||
|
Redwood
|
Acacia
|
Consolidated
|
||||||||
|
Balance
Sheet Impact
|
||||||||||
|
Reduction
in stockholders’
equity
|
$
|
(26
|
)
|
$
|
(187
|
)
|
$
|
(161
|
)
|
|
|
Income
Statement Impact
|
||||||||||
|
Market
valuation adjustments
|
||||||||||
|
Impairment
on AFS securities
|
(116
|
)
|
(952
|
)
|
(1,068
|
)
|
||||
|
Changes
in fair value on trading instruments
|
(12
|
)
|
(37
|
)
|
(49
|
)
|
||||
|
Total
income statement impact
|
(128
|
)
|
(989
|
)
|
(1,117
|
)
|
||||
|
Total
mark-to-market adjustments
|
$
|
(154
|
)
|
$
|
(802
|
)
|
$
|
(956
|
)
|
|
|
Year
Ended December 31, 2007
|
||||||||||
|
|
Redwood
|
|||||||||
|
|
Redwood
|
Acacia
|
Consolidated
|
|||||||
|
Balance
Sheet Impact
|
||||||||||
|
Reduction
in stockholders’
equity
|
$
|
(158
|
)
|
$
|
(509
|
)
|
$
|
(667
|
)
|
|
|
Income
Statement Impact
|
||||||||||
|
Market
valuation adjustments
|
||||||||||
|
Impairment
on AFS securities
|
(144
|
)
|
(1,031
|
)
|
(1,175
|
)
|
||||
|
Changes
in fair value on trading instruments
|
(27
|
)
|
(56
|
)
|
(83
|
)
|
||||
|
Total
income statement impact
|
(171
|
)
|
(1,087
|
)
|
(1,258
|
)
|
||||
|
Total
mark-to-market adjustments
|
$
|
(329
|
)
|
$
|
(1,596
|
)
|
$
|
(1,925
|
)
|
|
The
purpose of
this pro forma presentation is to show the consolidating components
of total
mark-to-market adjustments for the three months and year ended December
31,
2007. These mark-to-market adjustments are further detailed by the
balance sheet
(stockholders’ equity) and income statement impact. This is a non-GAAP
presentation. The total stockholders’ equity impact of $161 million and $667
million for the three months and year ended December 31, 2007, respectively,
agree with our consolidated balance sheets at these dates. The total
income
statement impact of $1.1 billion and $1.3 billion for the three months
and year
ended December 31, 2007, respectively, agree with our consolidated
income
statement for these periods.
| Ø |
In
our
opinion, the recognition of impairments does not
necessarily reflect the
real overall economic change that occurred during
the period. For example,
in the fourth quarter of 2007, of the $1.1 billion
of impairment charges
we recognized on a consolidated basis, $519 million
were previously
recorded as negative MTM adjustments and were deducted
from stockholders’
equity as of the beginning of the
quarter.
|
| Ø |
Net
negative
MTM adjustments that were temporarily impaired
and reflected as a
reduction of stockholders’ equity at December 31, 2007 (that is, gross
unrealized losses that have not flowed through
our income
statement) were $51 million for residential CES and
$43 million for
commercial CES at Redwood. If credit conditions
continue to deteriorate in
2008, causing an adverse change in the expected
cash flows from these
securities, we could be required to flow
through our income statement an
impairment charge for a portion or for all
of these negative MTM
adjustments. It is important to note that
any such impairment charges
would not impact our book value as these
amounts had already been deducted
from stockholders’ equity at December 31, 2007, but it would
reduce our
GAAP income in
2008.
|
| Ø |
We
added two
new tables in the Financial Tables
section of this Review, 19A and 19B,
which detail the fair value of residential,
commercial, and CDO securities
at Redwood and Acacia as a percentage
of their face value. These tables
show the breakdown by vintage and
rating.
|
|
The
Redwood
Review
4th
Quarter
2007
|
|
25 |
|
|
Mark-to-Market
Adjustments
|
Mark-to-market
Valuation Process
| Ø |
The
fair
values we use in our mark-to-market process reflect
what we believe we
would realize if we chose to sell our securities
or would have to pay if
we chose to buy back our asset-backed securities
(ABS) issued
(liabilities). Establishing fair values is inherently
subjective and is
dependent upon many market-based inputs, including
observable trades,
information on offered inventories, bid lists, and
indications of value
obtained from dealers. Valuations are especially
difficult for more
illiquid securities, such as ours, and when there
is limited trading
visibility, as was the case in recent months. For
these reasons, we expect
market valuations to continue to be highly
volatile.
|
| Ø |
Fair
values
for our securities and ABS issued are dependent
upon a number of
market-based assumptions including future interest
rates, prepayment
rates, discount rates, credit loss rates, and
the timing of credit losses.
We then use these assumptions to generate cash
flow estimates and internal
values for each individual
security.
|
| Ø |
We
request
indications of value (marks) from dealers
every quarter to assist in the
valuation process. For December 31, 2007,
we received dealer marks on 87%
of the assets and liabilities on our balance
sheet and did not receive
marks for the remaining 13%.
|
| Ø |
One
of the
factors we consider in our valuation
process is our assessment of the
quality of the dealer marks we receive.
Dealers were overwhelmed with
requests for 2007 year-end marks, and
there was little observable trading
information for them to rely upon. Thus,
their marks were most likely
generated by their own pricing models
for which they did not share their
inputs and we had little insight into
their
assumptions.
|
| Ø |
Furthermore,
the dealers now heavily qualify the
information they send to us. The
qualifications include the
following:
|
|
-
|
Credit
markets have been characterized by significant volatility
and very limited
liquidity
|
| - |
The
sharp
downturn in trading levels for many securities has resulted
in poor price
transparency
|
| - |
Valuations
have become especially dependent on assumptions used in valuation
models
rather than observable inputs
|
| - |
Valuations
are indicative only and may not reflect the actual prices
or spread levels
at which the securities could be
sold
|
| - |
Valuations
do
not necessarily reflect the values that would be produced
by other pricing
models or methods
|
| Ø |
Our
valuation
process relied on our internal values to
estimate the fair values of our
securities at December 31, 2007. In the aggregate,
our internal valuations
of the securities on which we received dealer
marks were $298 million, or
14%, lower than the aggregate dealer marks
at December 31, 2007. Our
internal valuations of our ABS issued on
which we received dealer marks
were $3 million, or less than 1%, lower than
the aggregate dealer marks at
December 31, 2007.
|
| 26 |
|
The
Redwood
Review
4th
Quarter
2007
|
 |
Residential
Real Estate Securities
|
Summary
What
is this?
Redwood
invests
in securities that are backed by pools of residential real estate
loans. These
include credit-enhancement securities (CES), investment grade securities
(IGS),
and other real estate investments (OREI). Most of our investments
in residential
real estate securities are backed by prime residential loans. Some
are backed by
alt-a and subprime loans. The following discussion refers only to
the
residential securities owned by Redwood, exclusive of the loans and
securities
owned by Sequoia and Acacia and Redwood’s investment in Sequoia and
Acacia.
Quarterly
Update
| Ø |
Our
residential securities portfolio declined
by $84 million (or 33%) from
$261 million to $177 million in the
fourth quarter. This decrease was
primarily due to negative market value
changes partially offset by $70
million of acquisitions.
|
| Ø |
The
credit
performance of our residential securities
has been mixed, with loan
vintage tiering emerging as a primary
credit distinction. Residential
prime and alt-a CES originated prior
to 2006 have consistently performed
at or above our original modeling
expectations, while newer vintage
CES
have performed worse than expected.
|
| Ø |
Prepayment
rates slowed dramatically across
prime and alt-a sectors during
the second
half of 2007. Prepayment rates
on non-agency mortgages have slowed
substantially since the end of
2005. The overall slowdown in refinancing
activity has been largely due to
increases in mortgage rates, declines
in
housing values, and tightened underwriting
standards.
|
| Ø |
An
economic
stimulus package has been approved
by Congress that will temporarily
increase Freddie Mac and Fannie
Mae conforming loan limits up
to $729,750
depending on geographic area.
The increase is set to expire
on December
31, 2008, and is estimated to
make a significant portion of
existing jumbo
mortgages eligible for agency-backed
refinancing. We expect the agencies
to price these newly qualified
mortgages at higher interest
rates than
existing conforming loans, but
at rates lower than those currently
available for jumbo loans.
|
We
believe the
short term impact of this legislation to our residential CES portfolio
is
positive. At December 31, 2007, we estimate that 28% of the jumbo
prime loans
collateralizing our CES will become newly conforming based on size.
Although
these jumbo borrowers will have an incentive to refinance, their
ability to
obtain financing is still dependent upon the agencies’ underwriting guidelines,
which require strict documentation standards and permit only specific
loan
product types.
While
refinancings
will benefit our residential CES portfolio overall, it is likely
to have minimal
impact on our 2006 and 2007 vintage unrated CES. Based on the level
of
delinquencies, we anticipate losses in the underlying pools will
be absorbed by
these unrated securities, regardless of the refinancings in the pool.
| Ø |
Underwriting
standards for alt-a loans continue
to tighten, which has caused a
significant decline in alt-a issuance
levels. A potential increase in
liquidity brought about by the higher
Freddie Mac and Fannie Mae
conforming loan limits might benefit
our alt-a CES investments, but to
a
lesser extent than our prime CES
as many alt-a borrowers would not
meet
the current underwriting requirements
of the agencies.
|
|
The
Redwood
Review
4th
Quarter
2007
|
|
27 |
|
|
Residential
Real Estate
Securities
|
Prime
Securities Portfolio
What
is
this?
Prime
securities are mortgage-backed securities backed by high-credit quality
residential loans. The borrowers typically have high FICO credit scores.
The
loans have relatively low loan-to-value (LTV) ratios. The following
discussion
refers only to the prime securities at Redwood, exclusive of any prime
securities owned by Acacia and Redwood’s investments in
Sequoia.
Quarterly
Update
| Ø |
During
the
quarter, we invested $64 million
into our prime CES portfolio. Of
these
new investments, $50 million (or
78%) are seasoned assets. The remaining
$14 million of prime CES acquisitions
are backed by more recent vintages
purchased at discounted pricing
levels that provide us with a significant
cushion against future
defaults.
|
| Ø |
The
following
chart presents prime securities
portfolio activity during the
fourth
quarter.
|
|
Prime
Securities at Redwood
|
||||
|
Fourth
Quarter Activity
|
||||
|
(by
market value, $ in millions)
|
||||
|
Market
Value at September 30, 2007
|
$
|
136
|
||
|
Acquisitions
|
64
|
|||
|
Sales
|
-
|
|||
|
Principal
payments
|
(16
|
)
|
||
|
Discount
amortization
|
12
|
|||
|
Realized
gains (losses) on sales and calls
|
-
|
|||
|
Changes
in fair value, net
|
(67
|
)
|
||
|
Market
Value at December 31, 2007
|
$
|
129
|
||
| Ø |
Total
interest income generated
by prime securities was
$20 million for the
fourth quarter and annualized interest income
over our
average amortized cost
for prime securities was
48.51%.
|
| 28 |
|
The
Redwood
Review
4th
Quarter
2007
|
|
|
Residential
Real Estate Securities
|
Prime
Securities Portfolio
Quarterly
Update (continued)
| Ø |
At
December
31, 2007, our prime CES portfolio
had an amortized cost of 31%
of
principal value and a fair value
as reported on our balance sheet
of 24%
of principal value. The table
below presents rating and vintage
information of the prime securities
in our portfolio at December
31,
2007.
|
|
Prime
Securities at Redwood
|
|||||||||||||||||||
|
By
Rating and Vintage
|
|||||||||||||||||||
|
December
31, 2007
|
|||||||||||||||||||
|
(by
market value, $ in millions)
|
|||||||||||||||||||
|
<=2004
|
2005
|
2006
|
2007
|
Total
|
|||||||||||||||
|
IGS
|
1
|
-
|
-
|
-
|
1
|
||||||||||||||
|
CES
|
BB
|
27
|
15
|
3
|
5
|
50
|
|||||||||||||
|
|
B
|
24
|
6
|
3
|
7
|
40
|
|||||||||||||
|
|
NR
|
22
|
7
|
4
|
4
|
37
|
|||||||||||||
|
CES
Total
|
73
|
28
|
10
|
16
|
127
|
||||||||||||||
|
OREI
|
1
|
-
|
-
|
-
|
1
|
||||||||||||||
|
Total
|
$
|
75
|
$
|
28
|
$
|
10
|
$
|
16
|
$
|
129
|
|||||||||
|
By
Loan Type and Vintage
|
|||||||||||||||||||
|
|
<=2004
|
2005
|
2006
|
2007
|
Total
|
||||||||||||||
|
ARM
|
$
|
14
|
$
|
1
|
$
|
-
|
$
|
-
|
$
|
15
|
|||||||||
|
Fixed
|
14
|
-
|
1
|
8
|
23
|
||||||||||||||
|
Hybrid
|
39
|
21
|
8
|
6
|
74
|
||||||||||||||
|
Option
Arm
|
8
|
6
|
1
|
2
|
17
|
||||||||||||||
|
Total
|
$
|
75
|
$
|
28
|
$
|
10
|
$
|
16
|
$
|
129
|
|||||||||
| Ø |
Seriously
delinquent loans underlying
prime CES increased during
the quarter from
0.26% to 0.39% of original
balances and 0.55% to 0.82%
of current
balances. Delinquency trends
on 2006 and 2007 vintage
prime CES have been
more severe than we anticipated.
Most seasoned prime CES originated
during
2005 and earlier periods
continue to perform better
than our original
modeling
expectations.
|
| Ø |
Principal
value credit losses on
prime CES were $4 million
during the quarter and
were charged against
our credit reserve. For
tax purposes, losses
on prime
securities were $2 million
($0.06 per share). This
deduction is less than
the principal value of
credit losses incurred
on the underlying loans
as
we own most of our credit
sensitive assets at a
tax basis that is
substantially less than
par
value.
|
| Ø |
Our
GAAP
credit reserves for
prime CES were $288
million ($8.89 per
share) at
December 31, 2007,
an increase of $80
million for the quarter
due to new
acquisitions and
the reassessment
of credit reserves
on some of our more
recent vintage prime
CES.
|
|
The
Redwood
Review
4th
Quarter
2007
|
|
29 |
|
|
Residential
Real Estate
Securities
|
Prime
Securities Portfolio
Quarterly
Update (continued)
| Ø |
The
summary-level information
below presents weighted-average
credit reserve
balances by principal
value, segmented by
loan vintage and credit
rating.
Since credit reserves
are set on a security
level basis, poorly
performing
loan pools can distort
the aggregate balances
and
averages.
|
|
Credit
Reserve Analysis - Prime Portfolio
|
||||||||||
|
By
current rating, by vintage
|
||||||||||
|
December
31, 2007
|
||||||||||
|
($
in millions)
|
||||||||||
|
<=2004
|
2005
|
2006
|
2007
|
Total
|
||||||
|
Amount
|
%
of loans
|
Amount
|
%
of loans
|
Amount
|
%
of loans
|
Amount
|
%
of loans
|
Amount
|
%
of loans
|
|
|
BB
|
||||||||||
|
Face
|
$44
|
0.46%
|
$30
|
0.32%
|
$4
|
0.05%
|
$15
|
0.25%
|
$93
|
0.28%
|
|
Accretable
discount
|
(12)
|
(13)
|
(2)
|
(3)
|
(30)
|
|||||
|
Discount
designated as credit reserve
|
(7)
|
0.07%
|
(1)
|
0.01%
|
0
|
0.00%
|
(2)
|
0.03%
|
(10)
|
0.03%
|
|
Unrealized
gains (losses)
|
1
|
0
|
0
|
(4)
|
(3)
|
|||||
|
Market
value
|
$26
|
$16
|
$2
|
$6
|
$50
|
|||||
|
Overall
credit
protection to BB CES
|
71
|
0.74%
|
39
|
0.42%
|
81
|
1.01%
|
38
|
0.63%
|
229
|
0.69%
|
|
B
|
||||||||||
|
Face
|
$43
|
0.14%
|
$14
|
0.23%
|
$13
|
0.26%
|
$25
|
0.14%
|
$95
|
0.16%
|
|
Accretable
discount
|
(9)
|
(1)
|
(1)
|
(1)
|
(12)
|
|||||
|
Discount
designated as credit reserve
|
(9)
|
0.03%
|
(5)
|
0.08%
|
(8)
|
0.16%
|
(13)
|
0.07%
|
(35)
|
0.06%
|
|
Unrealized
gains (losses)
|
0
|
(2)
|
(1)
|
(4)
|
(7)
|
|||||
|
Market
value
|
$25
|
$6
|
$3
|
$7
|
$41
|
|||||
|
Overall
credit
protection to B CES
|
109
|
0.37%
|
14
|
0.23%
|
18
|
0.35%
|
56
|
0.31%
|
197
|
0.33%
|
|
Unrated
|
||||||||||
|
Face
|
$160
|
0.55%
|
$94
|
0.40%
|
$48
|
0.25%
|
$38
|
0.21%
|
$340
|
0.38%
|
|
Accretable
discount
|
(35)
|
(6)
|
3
|
4
|
(34)
|
|||||
|
Discount
designated as credit reserve*
|
(92)
|
0.32%
|
(69)
|
0.29%
|
(45)
|
0.23%
|
(37)
|
0.21%
|
(243)
|
0.27%
|
|
Unrealized
gains (losses)
|
(11)
|
(13)
|
(1)
|
(2)
|
(27)
|
|||||
|
Market
value
|
$22
|
|
$6
|
|
$5
|
|
$3
|
|
$36
|
|
*
See below for example.
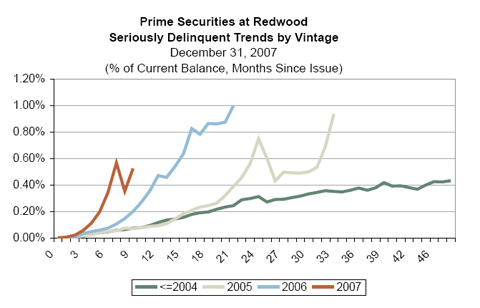
| Ø |
As
an
example,
serious delinquencies
on 2004 and
prior vintage
CES are currently
0.41% of
collateral
loan balances
(see chart
above). If
we assume
a
default rate
of seriously
delinquent
loans of
70% and a
loss severity
of
35%, total
expected
credit losses
from these
delinquencies
would equal
0.10% of
current collateral
loan balances.
Credit reserves
on 2004 vintage
unrated CES
currently
total 0.32%
of collateral
balances
(see table
above). Under
this scenario,
our credit
reserves
could absorb
the losses
from the
serious delinquent
loans at
year end
plus another
0.22% of
future
losses.
|
| 30 |
|
The
Redwood
Review
4th
Quarter
2007
|
|
|
Residential
Real Estate Securities
|
Prime
Securities Portfolio
Quarterly
Update (continued)
| Ø |
The
following
chart breaks out our
prime portfolio loan
types by weighted average
interest rate, as well
as our estimate of
conforming and non-conforming
(i.e., jumbo) balances
as of December 31,
2007. The objective
of this
chart is to illustrate
how our portfolio might
be affected by refinancing
activity from a reduction
in interest rates,
proposed increases
in GSE
conforming loan limits,
or a combination of
both.
|
|
RWT
Prime CES Portfolio
|
|||||||||||||||||||||||||||||||
|
Composition
by Product Type, Vintage and Balance
|
|||||||||||||||||||||||||||||||
|
December
31, 2007 (a)
|
|||||||||||||||||||||||||||||||
|
<=
2004
|
2005
|
2006
|
2007
|
Total
|
|||||||||||||||||||||||||||
|
Product
|
%
of Balance
|
Wtd
Avg Loan Rate
|
%
of Balance
|
Wtd
Avg Loan Rate
|
%
of Balance
|
Wtd
Avg Loan Rate
|
%
of Balance
|
Wtd
Avg Loan Rate
|
%
of Balance
|
Wtd
Avg Loan Rate
|
|||||||||||||||||||||
|
Hybrid
|
49
|
%
|
4.81
|
%
|
54
|
%
|
5.41
|
%
|
49
|
%
|
6.16
|
%
|
23
|
%
|
6.23
|
%
|
48
|
%
|
5.20
|
%
|
|||||||||||
|
ARM(b)
|
7
|
%
|
6.82
|
%
|
<1
|
%
|
6.85
|
%
|
1
|
%
|
6.15
|
%
|
<1
|
%
|
6.43
|
%
|
4
|
%
|
6.78
|
%
|
|||||||||||
|
Fixed
|
4
|
%
|
5.74
|
%
|
4
|
%
|
6.02
|
%
|
11
|
%
|
6.35
|
%
|
42
|
%
|
6.41
|
%
|
8
|
%
|
6.18
|
%
|
|||||||||||
|
Option-ARM
|
4
|
%
|
7.34
|
%
|
18
|
%
|
7.34
|
%
|
25
|
%
|
7.42
|
%
|
23
|
%
|
7.66
|
%
|
12
|
%
|
7.42
|
%
|
|||||||||||
|
Jumbo(c)
|
64
|
%
|
77
|
%
|
86
|
%
|
89
|
%
|
72
|
%
|
|||||||||||||||||||||
|
Hybrid
|
19
|
%
|
4.98
|
%
|
13
|
%
|
5.49
|
%
|
8
|
%
|
6.16
|
%
|
2
|
%
|
6.31
|
%
|
14
|
%
|
5.18
|
%
|
|||||||||||
|
ARM(b)
|
6
|
%
|
7.03
|
%
|
<1
|
%
|
6.94
|
%
|
<1
|
%
|
6.22
|
%
|
<1
|
%
|
6.42
|
%
|
3
|
%
|
7.02
|
%
|
|||||||||||
|
Fixed
|
10
|
%
|
6.46
|
%
|
<1
|
%
|
5.95
|
%
|
<1
|
%
|
6.41
|
%
|
2
|
%
|
6.50
|
%
|
6
|
%
|
6.45
|
%
|
|||||||||||
|
Option-ARM
|
2
|
%
|
7.38
|
%
|
10
|
%
|
7.27
|
%
|
6
|
%
|
7.61
|
%
|
7
|
%
|
7.89
|
%
|
5
|
%
|
7.43
|
%
|
|||||||||||
|
Conforming
|
36
|
%
|
23
|
%
|
14
|
%
|
11
|
%
|
28
|
%
|
|||||||||||||||||||||
|
Totals
|
100
|
%
|
100
|
%
|
100
|
%
|
100
|
%
|
100
|
%
|
|||||||||||||||||||||
(a)
The product
percentages differ from other tables as the table above
represents our exposure
on a loan balance basis and others are on a market
value basis.
(b)
ARMs are indexed
to one or six month LIBOR and have a weighted average
margin of
1.72%.
(c)
We estimate that
28% of the jumbo bucket consists of loans that would
become newly conforming
based on size under the economic stimulus plan.
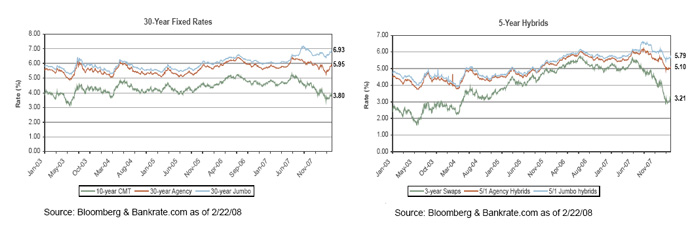
| Ø |
Historically,
increases in jumbo
refinancing activity
have occurred due to
several
factors. The most significant
factor is lower mortgage
interest rates,
which drove prepayments
from 2001-2003. Mortgage
rates on jumbos can
fall
when interest rates
fall or when jumbo
mortgage spreads move
closer to
agency mortgage spreads.
Current interest rates
are at their lowest
since
2003-2004 but jumbo
mortgage spreads are
at the highest levels
in recent
history. Should jumbo
mortgage spreads fall
back to previous levels,
many
borrowers from the
last three years will
have an incentive to
refinance.
Increases in the conforming
loan limits are yet
another factor. Other
economic factors may
affect borrower behavior
as
well.
|
|
The
Redwood
Review
4th
Quarter
2007
|
|
31 |
|
|
Residential
Real Estate
Securities
|
Prime
Securities Portfolio
Quarterly
Update (continued)
| Ø |
The
degree of
refinancing activity is an important factor to
consider since our credit
reserves provide protection on securities that
we have purchased at a
substantial discount to principal face amounts.
All things being equal,
faster prepayments would benefit these investments
by accelerating the
collection of principal. A secondary effect could
be the potential
recovery of credit reserves which could subsequently
increase GAAP yields
on CES through transfers of credit reserve amounts
to unamortized discount
status.
|
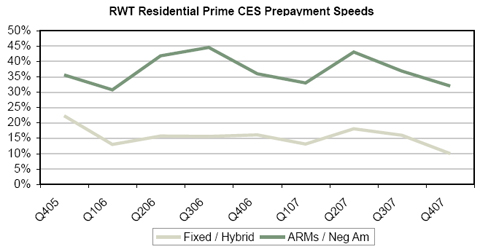
| Ø |
We
believe
the loan characteristics of our prime portfolio
illustrate the high
quality of these loans, including relatively low
LTV ratios and high FICO
scores. As the following table also illustrates,
we have geographically
diverse pools of loans that are generally seasoned
over two
years.
|
Prime
CES at
Redwood
Underlying
Loan Characteristics
December
31,
2007
|
Number
of
loans
|
305,272
|
Wtd
Avg
FICO
|
736
|
|
|
Total
loan
face ($ in millions)
|
126,821
|
FICO:
<=
620
|
<1%
|
|
|
Average
loan
size ($ in 1000's)
|
$415
|
FICO:
621 -
660
|
4%
|
|
|
|
FICO:
661 -
700
|
16%
|
||
|
Southern
CA
|
26%
|
FICO:
701 -
740
|
27%
|
|
|
Northern
CA
|
23%
|
FICO:
>
740
|
51%
|
|
|
Florida
|
6%
|
Unknown
|
<1%
|
|
|
New
York
|
6%
|
|
||
|
Georgia
|
2%
|
Conforming
at
origination %
|
26%
|
|
|
New
Jersey
|
3%
|
>
$1
MM
%
|
10%
|
|
|
Other
states
|
34%
|
|
|
|
|
2nd
home
%
|
7%
|
|||
|
2007
origination
|
7%
|
Investment
home %
|
2%
|
|
|
2006
origination
|
14%
|
|
|
|
|
2005
origination
|
23%
|
Purchase
|
42%
|
|
|
2004
origination and earlier
|
57%
|
Cash
out
refi
|
25%
|
|
|
Rate-term
refi
|
32%
|
|||
|
Wtd
Avg
Original LTV
|
69%
|
Other
|
1%
|
|
|
Original
LTV:
0 - 50
|
13%
|
|||
|
Original
LTV:
50 - 60
|
12%
|
Full
doc
|
52%
|
|
|
Original
LTV:
60. - 70
|
22%
|
No
doc
|
7%
|
|
|
Original
LTV:
70 - 80
|
51%
|
Other
(limited, etc)
|
41%
|
|
|
Original
LTV:
80 - 90
|
2%
|
|
||
|
Original
LTV:
90 - 100
|
1%
|
2-4
family
|
2%
|
|
|
Condo
|
11%
|
|||
|
Single
family
|
87%
|
| 32 |
|
The
Redwood
Review
4th
Quarter
2007
|
|
|
Residential
Real Estate Securities
|
Alt-a
Securities Portfolio
What
is
this?
Alt-a
securities are residential mortgage-backed securities backed
by loans that
generally have higher credit quality characteristics than
subprime, but lower
credit quality characteristics than prime. The following
discussion reflects
only to the alt-a securities at Redwood, exclusive of any
alt-a securities owned
by Acacia.
Quarterly
Update
| Ø |
During
the
fourth quarter we did not acquire any alt-a
securities.
|
| Ø |
The
following
chart presents alt-a portfolio activity during
the fourth quarter.
|
|
Alt-a
Securities at Redwood
|
|||
|
Fourth
Quarter Activity
|
|||
|
(by
market value, $ in millions)
|
|||
|
Alt-a
|
|||
|
Market
Value at September 30, 2007
|
$
|
106
|
|
|
Acquisitions
|
-
|
||
|
Transfers
to /
from other portfolios
|
(14)
|
||
|
Sales
|
(18)
|
||
|
Principal
payments
|
(5)
|
||
|
Discount
amortization
|
-
|
||
|
Gains
on
sales/calls
|
(2)
|
||
|
Net
mark-to-market adjustment
|
(26)
|
||
|
Market
Value at December 31, 2007
|
$
|
41
|
|
| Ø |
Total
interest income generated by alt-a securities was
$5 million for the
fourth quarter and annualized interest income over our average
amortized cost for alt-a securities was 32.11%.
|
|
The
Redwood
Review
4th
Quarter
2007
|
|
33 |
|
|
Residential
Real Estate Securities
|
Alt-a
Securities Portfolio
| Ø |
At
December
31, 2007 our alt-a CES portfolio had an average basis amortized
cost of
15% of principal value and a fair value as reported on our
balance sheet
of 10% of principal value. The table below provides information
on the
alt-a securities in our portfolio.
|
|
Alt-a
Securities at Redwood
|
||||||||||||||||
|
Composition
by Rating and Vintage
|
||||||||||||||||
|
Redwood
Excluding Acacia and Sequoia
|
||||||||||||||||
|
December
31, 2007
|
||||||||||||||||
|
(by
market value, $ in millions)
|
||||||||||||||||
|
<=2004
|
2005
|
2006
|
2007
|
Total
|
||||||||||||
|
IGS
|
AAA
|
$
|
-
|
$
|
-
|
$
|
-
|
$
|
9
|
$
|
9
|
|||||
|
IGS
Total
|
-
|
-
|
-
|
9
|
9
|
|||||||||||
|
CES
|
BB
|
1
|
-
|
-
|
2
|
3
|
||||||||||
|
B
|
-
|
1
|
4
|
3
|
8
|
|||||||||||
|
NR
|
2
|
6
|
2
|
2
|
12
|
|||||||||||
|
CES
Total
|
3
|
7
|
6
|
7
|
23
|
|||||||||||
|
OREI
|
RES
|
-
|
-
|
2
|
1
|
3
|
||||||||||
|
NIM
|
-
|
-
|
5
|
1
|
6
|
|||||||||||
|
OREI
Total
|
-
|
-
|
7
|
2
|
9
|
|||||||||||
|
Grand
Total
|
$
|
3
|
$
|
7
|
$
|
13
|
$
|
18
|
$
|
41
|
||||||
|
Composition
by Loan Type and Vintage
|
||||||||||||||||
|
<=2004
|
2005
|
2006
|
2007
|
Total
|
||||||||||||
|
Fixed
|
-
|
-
|
-
|
1
|
1
|
|||||||||||
|
Hybrid
|
2
|
-
|
5
|
10
|
17
|
|||||||||||
|
Option
Arm
|
1
|
7
|
8
|
7
|
23
|
|||||||||||
|
Total
|
$
|
3
|
$
|
7
|
$
|
13
|
$
|
18
|
$
|
41
|
||||||
| Ø |
Seriously
delinquent loans underlying alt-a CES increased during the
quarter from
1.54% to 2.75% of original balances and 2.97% to 5.59% of
current
balances. Delinquency trends on 2006 and 2007 vintage alt-a
CES have been
more severe than we anticipated. Most seasoned alt-a CES
originated during
2005 and earlier periods continue to perform within our original
modeling
expectations.
|
| Ø |
Principal
value credit losses on alt-a CES were $5 million during the
quarter and
were charged against our credit reserve. For tax purposes,
losses on alt-a
securities were $2 million ($0.06 per share). This deduction
is less than
the principal value of credit losses incurred on the underlying
loans as
we own most of our credit sensitive assets at a tax basis
that is
substantially less than par value.
|
| Ø |
Our
GAAP
credit reserves for alt-a CES were $195 million ($6.02 per
share) at
December 31, 2007, an increase of $19 million for the quarter
due to the
reassessment of credit reserves required for our alt-a
securities.
|
| 34 |
|
The
Redwood
Review
4th
Quarter
2007
|
|
|
Residential
Real Estate Securities
|
Alt-a
Securities Portfolio
Quarterly
Update (continued)
| Ø |
The
summary-level information below presents weighted-average
credit reserve
balances by principal value, segmented by loan
vintage and credit rating.
Since credit reserves are set on a security level
basis, poorly performing
securities can distort the aggregate balances and
averages.
|
|
Credit
Reserve Analysis - Alt-A Portfolio
|
|||||||||||||||
|
By
current rating, by vintage
|
|||||||||||||||
|
December
31, 2007
|
|||||||||||||||
|
($
in millions)
|
|||||||||||||||
|
<=2004
|
2005
|
2006
|
2007
|
Total
|
|||||||||||
|
Amount
|
%
of loans
|
|
Amount
|
%
of loans
|
|
Amount
|
%
of loans
|
|
Amount
|
%
of loans
|
Amount
|
%
of loans
|
|||
|
BB
|
|||||||||||||||
|
Face
|
$2
|
1.40%
|
$0
|
N/A
|
$0
|
N/A
|
$16
|
0.37%
|
$18
|
0.41%
|
|||||
|
Accretable
discount
|
0
|
0
|
0
|
(5)
|
(5)
|
||||||||||
|
Discount
designated as credit reserve
|
0
|
0.00%
|
0
|
N/A
|
0
|
N/A
|
(9)
|
-0.21%
|
(9)
|
-0.20%
|
|||||
|
Unrealized
(losses) gains
|
(1)
|
0
|
0
|
0
|
(1)
|
||||||||||
|
Market
value
|
$1
|
$0
|
$0
|
$2
|
$3
|
||||||||||
|
Overall
credit
protection to BB CES
|
3
|
1.88%
|
-
|
N/A
|
-
|
N/A
|
78
|
1.84%
|
81
|
1.84%
|
|||||
|
B
|
|||||||||||||||
|
Face
|
$0
|
N/A
|
$2
|
0.97%
|
$17
|
1.17%
|
$34
|
0.52%
|
$53
|
0.64%
|
|||||
|
Accretable
discount
|
0
|
0
|
(4)
|
0
|
(4)
|
||||||||||
|
Discount
designated as credit reserve
|
0
|
N/A
|
0
|
0.00%
|
(10)
|
-0.69%
|
(31)
|
-0.44%
|
(41)
|
-0.47%
|
|||||
|
Unrealized
(losses) gains
|
0
|
0
|
0
|
0
|
(5)
|
||||||||||
|
Market
value
|
$0
|
|
|
$2
|
|
|
$3
|
|
|
$3
|
|
|
$8
|
||
|
Overall
credit
protection to B CES
|
-
|
N/A
|
5
|
2.24%
|
19
|
1.30%
|
80
|
1.21%
|
104
|
1.25%
|
|||||
|
Unrated
|
|||||||||||||||
|
Face
|
$25
|
0.69%
|
$47
|
0.77%
|
$42
|
1.17%
|
$50
|
0.86%
|
$164
|
0.86%
|
|||||
|
Accretable
discount
|
(5)
|
(2)
|
0
|
2
|
(5)
|
||||||||||
|
Discount
designated as credit reserve
|
(17)
|
-0.47%
|
(39)
|
-0.64%
|
(39)
|
-1.08%
|
(50)
|
-0.86%
|
(145)
|
-0.76%
|
|||||
|
Unrealized
(losses) gains
|
(1)
|
(1)
|
0
|
0
|
(2)
|
||||||||||
|
Market
value
|
$2
|
|
|
$5
|
|
|
$3
|
|
|
$2
|
|
|
$12
|
||
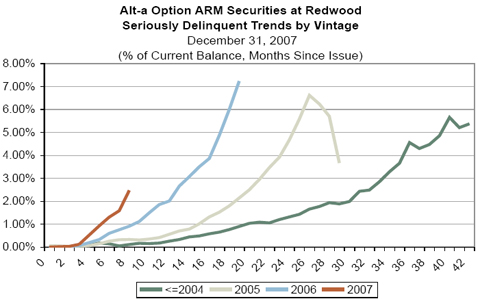
| Ø |
Please
see
page 30 for an explanation of the table and chart
above.
|
| Ø |
Some
poorly
performing pools of loans underlying some of our
securities are
significantly increasing the aggregate delinquencies.
The amount of losses
that our securities can absorb is limited to the
principal face amount of
that security. Since each pool of loans is independent,
high losses from a
particular pool will have no impact on the other
pools of loans underlying
other securities in our portfolio, but could have
a great impact on the
aggregate
delinquencies.
|
|
The
Redwood
Review
4th
Quarter
2007
|
|
35 |
|
|
Residential
Real Estate Securities
|
Alt-a
Securities Portfolio
Quarterly
Update (continued)
| Ø |
Prepayment
speeds for alt-a CES slowed significantly during the fourth
quarter as
mortgage rates for these borrowers increased dramatically,
housing values
decreased, and underwriting standards
tightened.
|
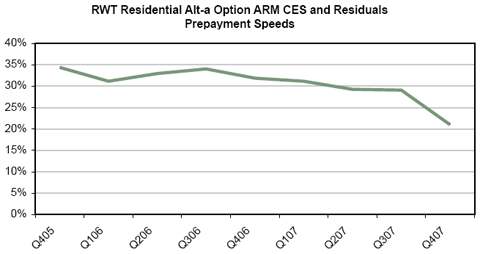
| Ø |
Below
is a
table that details the characteristics of the underlying
alt-a loans that
we credit enhance.
|
Alt-a
Securities at Redwood
Underlying
Loan Characteristics
December
31, 2007
|
Number
of loans
|
47,588
|
Wtd
avg FICO
|
705
|
|
|
Total
loan face ($ in millions)
|
18,367
|
FICO:
<= 620
|
<1%
|
|
|
Average
loan size ($ in 1000's)
|
$386
|
FICO:
621 - 660
|
14%
|
|
|
FICO:
661 - 700
|
32%
|
|||
|
Southern
CA
|
30%
|
FICO:
701 - 740
|
25%
|
|
|
Northern
CA
|
20%
|
FICO:
> 740
|
22%
|
|
|
Florida
|
11%
|
Unknown
|
7%
|
|
|
New
York
|
3%
|
|
||
|
Georgia
|
1%
|
Conforming
at origination %
|
44%
|
|
|
New
Jersey
|
3%
|
>
$1 MM %
|
16%
|
|
|
Other
states
|
32%
|
|
|
|
|
2nd
home %
|
7%
|
|||
|
2007
origination
|
24%
|
Investment
home %
|
11%
|
|
|
2006
origination
|
24%
|
|
|
|
|
2005
origination
|
29%
|
Purchase
|
35%
|
|
|
2004
origination and earlier
|
24%
|
Cash
out refi
|
43%
|
|
|
Rate-term
refi
|
22%
|
|||
|
Wtd
avg original LTV
|
76%
|
|
|
|
|
Original
LTV: 0 - 50
|
4%
|
Full
doc
|
18%
|
|
|
Original
LTV: 50 - 60
|
6%
|
No
doc
|
<1%
|
|
|
Original
LTV: 60 - 70
|
16%
|
Other
(limited, etc)
|
75%
|
|
|
Original
LTV: 70 - 80
|
63%
|
Unknown/not
categorized
|
7%
|
|
|
Original
LTV: 80 - 90
|
9%
|
|
|
|
|
Original
LTV: 90 - 100
|
3%
|
2-4
family
|
5%
|
|
|
Condo
|
11%
|
|||
|
Single
family
|
84%
|
| 36 |
|
The
Redwood
Review
4th
Quarter
2007
|
 |
Commercial
Real Estate Securities
|
Commercial Securities Portfolio
What
is
this?
We
invest in
securities that are backed by pools of commercial real estate loans.
The
following discussion refers only to the commercial securities owned by
Redwood,
exclusive of any commercial securities owned by Acacia.
Quarterly
Update
| Ø |
We
have not
committed to significant purchases of commercial real estate
assets since
2006. Our plan is to resume investing in commercial real estate
securities
once underwriting has improved and the outlook for the sector
becomes more
certain. We continue to build out our platform and position
ourselves to
invest in and manage new commercial
assets.
|
| Ø |
The
CMBS
issuance market finished the year in step with other structured
mortgage
products, as new originations slowed and prices have reached
historically
low levels. Fixed-rate BBB-rated CMBS were offered at spread
levels near
1000 basis points in December 2007, versus 70 basis points
offered during
February 2007.
|
| Ø |
Liquidity
in
the commercial secondary markets remained low during the fourth
quarter,
as market participants feared rises in delinquencies and possible
credit
rating downgrades over the coming months. Skepticism over loan
quality has
created market tiering based on seasoning and payment history.
Investors
maintain a strong preference for CMBS originated prior to 2006,
with
seasoned securities trading at much tighter levels than newer
production.
|
| Ø |
The
following
chart presents commercial portfolio activity during the fourth
quarter.
|
|
RWT
Commercial Portfolio
|
||||||||||
|
Fourth
Quarter Activity
|
||||||||||
|
(by
market value, $ in millions)
|
||||||||||
|
|
IGS
|
CES
|
Total
|
|||||||
|
Market
Value at September 30, 2007
|
$
|
2
|
$
|
157
|
$
|
159
|
||||
|
Acquisitions
|
-
|
-
|
-
|
|||||||
|
Transfers
to / from other portfolios
|
-
|
21
|
21
|
|||||||
|
Sales
|
(2
|
)
|
(3
|
)
|
(5
|
)
|
||||
|
Principal
payments
|
-
|
-
|
-
|
|||||||
|
Discount
amortization
|
-
|
(2
|
)
|
(2
|
)
|
|||||
|
Gains
on sales/calls
|
-
|
(1
|
)
|
(1
|
)
|
|||||
|
Net
mark-to-market adjustment
|
-
|
(24
|
)
|
(24
|
)
|
|||||
|
Market
Value at December 31, 2007
|
$
|
-
|
$
|
148
|
$
|
148
|
||||
| Ø |
The
market
value of our commercial securities declined by $11 million
during the
fourth quarter.
|
| Ø |
Total
net
interest income generated by commercial securities was $5 million
for the
fourth quarter and annualized interest income over our average
amortized
cost for commercial securities was 10.74%.
|
|
The
Redwood
Review
4th
Quarter
2007
|
|
37 |
|
|
Commercial
Real Estate
Securities
|
Commercial
Securities Portfolio (continued)
Quarterly
Update
| Ø |
Our
commercial securities portfolio consists of CES investments
that we fund
with equity. The types of loans backing these securities
are typically
fixed rate with 10-year average lives. The following table
presents our
commercial securities portfolio by credit rating and vintage.
The vintage
shown is the year the securitization was completed and
may include
commercial real estate loans originated in an earlier
year.
|
|
RWT
Commercial Securities at Redwood
|
||||||||||||||||
|
Rating
& Vintage
|
||||||||||||||||
|
December
31, 2007
|
||||||||||||||||
|
(by
market value in $ millions)
|
||||||||||||||||
|
<=
2004
|
|
2005
|
|
2006
|
|
2007
|
|
Total
|
||||||||
|
BB+
|
$
|
3
|
$
|
-
|
$
|
2
|
$
|
5
|
$
|
10
|
||||||
|
BB
|
3
|
-
|
4
|
1
|
8
|
|||||||||||
|
BB-
|
1
|
-
|
5
|
2
|
8
|
|||||||||||
|
B+
|
-
|
-
|
5
|
4
|
9
|
|||||||||||
|
B
|
-
|
-
|
2
|
2
|
4
|
|||||||||||
|
B-
|
-
|
-
|
6
|
5
|
11
|
|||||||||||
|
NR
|
13
|
32
|
45
|
8
|
98
|
|||||||||||
|
Total
CES
|
$
|
20
|
$
|
32
|
$
|
69
|
$
|
27
|
$
|
148
|
||||||
| Ø |
The
overall
credit performance of commercial securities remains stable,
with serious
delinquencies at low levels across major property types.
Total serious
delinquencies (60 days or more delinquent) were $183 million,
or 0.30%, of
the $62 billion of commercial loans that we credit enhance.
Of this
amount, $48 million is contained in a security that we
had written off
through our GAAP income statement during a prior period.
An additional $81
million loan is in default and contained in a separate
security that we
wrote down to fair value through our GAAP income statement
during the
fourth quarter. The loan default was due to a borrower
bankruptcy and poor
management; the cash flows generated by the property continue
to be
reasonable. We have taken steps to ensure that a new property
management
team is in place and the bankruptcy proceedings move swiftly.
We are
anticipating a $4 million credit loss upon liquidation
of the secured
property, which will be absorbed by existing GAAP credit
reserves.
|
| Ø |
Principal
credit losses on commercial CES were less than $1 million
during the
quarter and charged against our credit reserve. For tax
purposes, realized
losses on commercial securities were $0.3 million ($0.01
per share) in the
fourth quarter. This deduction is less than the principal
value of credit
losses incurred on the underlying loans, as we own commercial
CES at a tax
basis that is substantially less than par
value.
|
| Ø |
Our
GAAP
credit reserves for commercial CES were $318 million ($9.82
per share) at
December 31, 2007, an increase of $8 million for the quarter
due to the
reassessment of future credit losses on certain securities.
|
| 38 |
|
The
Redwood
Review
4th
Quarter
2007
|
|
|
Commercial
Real Estate Securities
|
Commercial
Securities Portfolio (continued)
Quarterly
Update (continued)
| Ø |
When
assessing commercial credit reserves, it is important to
consider
commercial real estate loans backing CMBS typically perform
very well in
their early stages due to stabilized occupancy levels,
various escrow
reserves, and other underwriting enhancements. The fixed
interest rates on
these loans also protect borrowers from interest rate fluctuations
that
could adversely affect debt service coverage levels. As
loans season,
tenant rollover and market rents become more volatile,
thus increasing the
risk of potential default. These loans generally experience
the greatest
risk of default at their maturity date, when the borrower
must obtain new
financing regardless of the property’s fundamentals or prevailing market
conditions. It is also important to note that commercial
loans do not
prepay like residential loans. As a result of these dynamics,
we maintain
our initial credit reserve levels on our commercial CES
until we can
reassess the likelihood of credit losses and make appropriate
changes to
our credit reserves. This leads to reported GAAP yields
in the early years
that may not accurately reflect the actual economic returns
that will
eventually be recognized over the life of these commercial
CES.
|
| Ø |
The
summary-level information below presents weighted-average
credit reserve
balances by principal value, segmented by loan vintage
and credit rating.
Please see page 30 for an explanation of the table and
chart
below.
|
|
Credit
Reserve Analysis - Commercial Portfolio
|
|||||||||||
|
By
current rating, by vintage
|
|||||||||||
|
December
31, 2007
|
|||||||||||
|
($
in millions)
|
|||||||||||
|
<=2004
|
|
2005
|
|
2006
|
|
2007
|
|
Total
|
|
||
|
|
|
Amount
|
%
of collat
|
Amount
|
%
of collat
|
Amount
|
%
of collat
|
Amount
|
%
of collat
|
Amount
|
%
of collat
|
|
BB
|
|||||||||||
|
Face
|
$9
|
0.09%
|
$0
|
-
|
$23
|
0.13%
|
$16
|
0.11%
|
$48
|
0.11%
|
|
|
Accretable
discount
|
(1)
|
0
|
(5)
|
(3)
|
(9)
|
||||||
|
Discount
designated as credit reserve
|
0
|
0.00%
|
0
|
-
|
0
|
0.00%
|
0
|
0.00%
|
0
|
0.00%
|
|
|
Unrealized
(losses) gains
|
(1)
|
0
|
(7)
|
(5)
|
(13)
|
||||||
|
Market
value
|
$7
|
0.07%
|
$0
|
-
|
$11
|
0.06%
|
$8
|
0.06%
|
$26
|
0.06%
|
|
|
Overall
credit protection to BB CES
|
313
|
3.3%
|
-
|
-
|
384
|
2.1%
|
287
|
2.0%
|
984
|
2%
|
|
|
B
|
|||||||||||
|
Face
|
$0
|
-
|
$0
|
-
|
$35
|
0.14%
|
$27
|
0.18%
|
$62
|
0.16%
|
|
|
Accretable
discount
|
0
|
0
|
(14)
|
(10)
|
(24)
|
||||||
|
Discount
designated as credit reserve
|
0
|
-
|
0
|
-
|
0
|
0.00%
|
0
|
0.00%
|
0
|
0.00%
|
|
|
Unrealized
(losses) gains
|
0
|
0
|
(8)
|
(6)
|
(14)
|
||||||
|
Market
value
|
$0
|
-
|
$0
|
-
|
$13
|
0.05%
|
$11
|
0.08%
|
$24
|
0.06%
|
|
|
Overall
credit protection to B CES
|
-
|
0.0%
|
-
|
0.0%
|
354
|
1.4%
|
185
|
1.3%
|
539
|
1.4%
|
|
|
Unrated
|
|||||||||||
|
Face
|
$49
|
0.57%
|
$125
|
1.45%
|
$205
|
1.37%
|
$37
|
1.00%
|
$416
|
0.87%
|
|
|
Accretable
discount
|
(5)
|
4
|
10
|
1
|
10
|
||||||
|
Discount
designated as credit reserve
|
(34)
|
-0.39%
|
(98)
|
-1.13%
|
(159)
|
-1.06%
|
(27)
|
-0.73%
|
(318)
|
-0.67%
|
|
|
Unrealized
gains (losses)
|
3
|
1
|
(10)
|
(4)
|
(10)
|
||||||
|
Market
value
|
$13
|
0.15%
|
$32
|
0.37%
|
$46
|
$7
|
$98
|
0.21%
|
|||
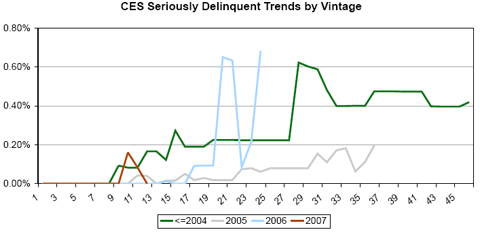
| Ø |
As
noted
earlier, a few poorly performing loans are significantly
increasing the
aggregate
delinquencies.
|
|
The
Redwood
Review
4th
Quarter
2007
|
|
39 |
 |
CDO
Securities
|
CDO
Securities
What
is
this?
We
invest in
securities issued from collateralized debt obligation (CDO) securitizations
sponsored by third parties. Typically, the collateral pool underlying
these
securities consists of a mixture of residential and commercial
investment-grade
securities and near IGS. CDO securities from third parties are
primarily owned
by our Acacia entities, and, on a going forward basis, will be
acquired for the
Opportunity Fund; however, Redwood does, on occasion, and may continue
to
acquire certain CDO securities.
Quarterly
Update
| Ø |
In
the fourth
quarter, we acquired $42 million AAA and AA-rated CDO
securities of
varying vintages. We acquired $22 million of these securities
for Redwood,
and $18 million for the newly formed Opportunity Fund.
We acquired these
at significant discounts to par value (average purchase
price 40% of
principal) and we funded them with equity.
|
|
RWT
CDO Portfolio
|
||||||||||
|
Fourth
Quarter Activity
|
||||||||||
|
(by
market value, $ in millions)
|
||||||||||
|
|
|
IGS
|
CES
|
Total
|
||||||
|
Market
Value at September 30, 2007
|
$
|
5
|
$
|
4
|
$
|
9
|
||||
|
Acquisitions
|
42
|
-
|
42
|
|||||||
|
Transfers
to / from other portfolios
|
(1
|
)
|
1
|
-
|
||||||
|
Sales
|
(1
|
)
|
-
|
(1
|
)
|
|||||
|
Net
mark-to-market adjustment
|
(14
|
)
|
(3
|
)
|
(17
|
)
|
||||
|
Market
Value at December 31, 2007
|
$
|
31
|
$
|
2
|
$
|
33
|
||||
| Ø |
Total
interest income generated by CDO securities was $1 million for the
fourth quarter and annualized interest income over our average
amortized cost was 12.28%.
|
| Ø |
New
issuance
and secondary market trading activity was virtually nonexistent
during the
quarter for ABS CDOs. As a result, market pricing transparency
for CDOs is
extremely poor, making fair value discovery for our CDO
portfolio
difficult to determine.
|
| Ø |
The
prices at
which we can acquire these illiquid securities is generally
significantly
higher than the price at which we can initially sell
them (i.e., the
bid/ask spread is wide). Thus, the reported value of
these securities on
our balance sheet was lower than our purchase price even
though there has
been no deterioration in cash flows or our estimated
future cash
flows.
|
|
RWT
CDO Portfolio
|
||||||||||||||||
|
Composition
by Rating and Vintage
|
||||||||||||||||
|
Redwood
Excluding Acacia and Sequoia
|
||||||||||||||||
|
December
31, 2007
|
||||||||||||||||
|
(by
market value, $ in millions)
|
||||||||||||||||
|
<=2004
|
2005
|
2006
|
2007
|
Total
|
||||||||||||
|
IGS
|
AAA
|
$
|
6
|
$
|
6
|
$
|
-
|
$
|
6
|
$
|
18
|
|||||
|
AA
|
6
|
6
|
-
|
-
|
12
|
|||||||||||
|
BBB
|
-
|
-
|
-
|
1
|
1
|
|||||||||||
|
IGS
Total
|
12
|
12
|
-
|
7
|
31
|
|||||||||||
|
CES
Total
|
1
|
-
|
1
|
-
|
2
|
|||||||||||
|
Grand
Total
|
$
|
13
|
$
|
12
|
$
|
1
|
$
|
7
|
$
|
33
|
||||||
| 40 |
|
The
Redwood
Review
4th
Quarter
2007
|
 |
Investments
in Sequoia
|
Summary
What
is
this?
Sequoia
entities are independent securitization entities that acquire residential
mortgage loans and create and issue asset-backed securities (ABS) backed
by
these loans. Most of the loans that Sequoia entities acquire are prime-quality
loans. Most of the investment-grade rated ABS created by Sequoia are
sold to
third party investors. Redwood usually acquires most of the credit-enhancement
securities (CES) and occasionally acquires the interest-only securities
(IOs).
Acacia may also acquire some Sequoia CES, IOs, and IGS. Although Redwood’s
investment in Sequoia entities is relatively small and limited, the
loans and
ABS issued by Sequoia are shown on our consolidated financial statements.
Redwood’s investments in these entities do not appear on our balance sheet
as an
asset - rather it is reflected as the difference between the consolidated
assets
of Sequoia less the consolidated Sequoia ABS issued to third
parties.
Redwood’s
credit risk is limited to its investment in the CES Redwood acquires
from the
Sequoia entities. Each Sequoia entity is independent from the others,
thus the
performance of any one Sequoia will not affect any other
Sequoia.
Quarterly
Update
| Ø |
As
of
December 31, 2007, we had 39 Sequoia transactions outstanding.
Over the
years, Sequoia securitizations have created significant profits
for
Redwood. These profits have two underlying economic components:
the profit
or loss created at the time of securitization on those ABS
sold to
investors and the returns earned over time on the securities
that we
retained as investments. For GAAP purposes, both of these
components are
recognized over time through net interest income.
|
| Ø |
For
the past
several years we have generally sold approximately 97% of
the Sequoia ABS
to third parties, while 2% were sold to Acacia and 1% were
retained at
Redwood. As a result, the primary factor in the overall profitability
of
our loan acquisition and Sequoia securitization activity
is our ability to
sell AAA and AA-rated securities to third parties at favorable
prices.
|
| Ø |
Due
to the
turbulence in the mortgage markets and concerns over credit
performance,
AAA buyers are now requiring a much higher yield to compensate
for actual
or perceived risk. If we were to buy loans and securitize
them at current
AAA price levels, the transaction would result in a significant
loss.
Consequently, in the fourth quarter of 2007, we did not acquire
loans and
did not complete a new Sequoia securitization. While we do
believe the
prime non-agency securitization market will likely be one
of the first
structured markets to return, until the market stabilizes
and the AAA bid
improves, we do not anticipate completing any Sequoia
transactions.
|
|
The
Redwood
Review
4th
Quarter
2007
|
|
41 |
|
|
Investments
in Sequoia
|
Quarterly
Update (continued)
| Ø |
The
GAAP
carrying value of our investments in Sequoia is $146 million
at December
31, 2007. This is expressed on our balance sheet as the
difference between
residential loans of $7.2 billion and ABS issued of $7.1
billion. Both the
loans and ABS issued are carried at their cost
basis.
|
| Ø |
The
estimated
market value of Sequoia securities that Redwood owns at
December 31, 2007
was $99 million. This consists of $58 million IOs, $29
million CES, and
$12 million IGS. We used the same valuation process to
value the Sequoia
securities as we did for third party securities (as described
on page 26).
Our IOs are all rated AAA, the IGS we own are mostly AA-rated,
and the CES
are rated BB, B, and unrated.
|
| Ø |
The
primary
reason that our GAAP carrying value of Sequoia investments
exceeds their
market value is that for several years loan premium amortization
expenses
as calculated under GAAP have not kept pace with prepayments.
For a
portion of these loans, our GAAP amortization method is
linked more
closely to short-term interest rates. As short-term interest
rates
decline, which they have early into the first quarter of
2008, we expect
premium amortization for this portion of the loan portfolio
to increase.
Loan premium amortization expenses, a component of interest
income, were
$7 million for the fourth quarter. We ended the quarter
with $7.2 billion
carrying value of loans and a principal loan balance of
$7.1 billion for
an average basis of 100.96%.
|
| Ø |
Net
interest
income for Sequoia was $7 million in the fourth quarter,
the same as the
previous quarter. For the year, net interest income was
$29
million.
|
| Ø |
Seriously
delinquent loans increased from $56 million to $68 million
in the fourth
quarter, an increase from 0.74% to 0.96% of current balances.
The largest
increases in delinquencies were from loans originated in
2006 and 2007. We
expect delinquencies on the residential loans owned by
Sequoia to continue
to increase.
|
| Ø |
At
December
31, 2007, our loan loss reserve was $18 million or 0.26%
of the current
loan balance, an increase of $3 million from the end of
the third quarter
balance of $15 million. Our credit provision expense for
loans was $5
million in the fourth quarter compared to $2 million in
the third quarter.
The increase in the credit provision expense in the fourth
quarter was
attributable to higher delinquencies. Net charge-offs decreased
to $2
million from $3 million the previous
quarter.
|
| Ø |
Sequoia’s
ARM
loans, representing 68% of the loan portfolio, are primarily
indexed to
LIBOR. In the fourth quarter, prepayment rates on these
loans declined to
27% CPR from the third quarter rate of 40% CPR.
|
| Ø |
Nearly
all of
Sequoia’s hybrid loans, representing 32% of the loan portfolio,
are still
in their initial fixed-rate period. Prepayment rates on
these loans slowed
to 10% CPR in the fourth quarter from an average of 15%
CPR in the third
quarter.
|
| Ø |
For
tax
accounting, the Sequoia securities we own are treated like
securities we
purchase from third parties. Due to tax accounting rules,
for many years
we have not been able to expense IO premium as quickly
as the change to
their fair value. As of December 31, 2007 the tax basis
on our IOs was $75
million and was higher than the estimated fair value. In
2008, we expect
to recognize little taxable income from our IOs. As discussed
under
Taxable Income, the basis in these IOs will decline over
time as cash
flows are received and the remainder of the basis will
be expensed at the
time the IOs are called.
|
| 42 |
|
The
Redwood
Review
4th
Quarter
2007
|
|
|
Investments
in Sequoia
|
Quarterly
Update (continued)
| Ø |
We
hold call
option rights on all our Sequoia transactions. The call option
gives us
the right, but not the obligation, to retire the ABS issued
at par and
take possession of the underlying loans. Currently we have
eleven Sequoias
that are callable and it is likely that fifteen more will become
callable
in the next two years. Given the current mortgage and securitization
markets, we do not anticipate calling any Sequoias in the near
future, and
thus, there will likely be little economic or accounting impact
in
2008.
|
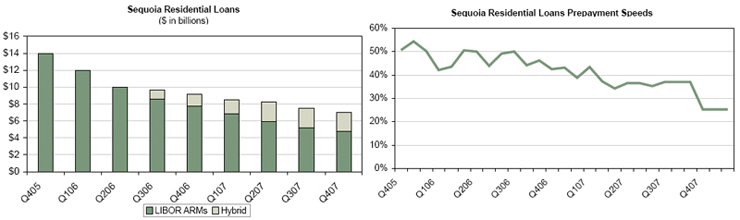
| Ø |
The
following
table summarizes the high-quality characteristics of the loans
owned by
the Sequoia entities.
|
Sequoia
Residential Loan Portfolio
Loan
Characteristics
December
31, 2007
|
Number
of loans
|
21,000
|
Wtd
Avg FICO
|
732
|
|
|
Total
loan face ($ in millions)
|
7,106
|
FICO:
<= 620
|
1%
|
|
|
Average
loan size ($ in 1000's)
|
$338
|
FICO:
621 - 660
|
5%
|
|
|
|
FICO:
661 - 700
|
19%
|
||
|
Southern
CA
|
14%
|
|
FICO:
701 - 740
|
27%
|
|
Northern
CA
|
10%
|
FICO:
> 740
|
48%
|
|
|
Florida
|
13%
|
|
|
|
|
New
York
|
6%
|
Conforming
at origination %
|
34%
|
|
|
Georgia
|
4%
|
>
$1 MM %
|
15%
|
|
|
New
Jersey
|
4%
|
|
|
|
|
Other
states
|
49%
|
2nd
home %
|
11%
|
|
|
|
Investment
home %
|
3%
|
||
|
2007
origination
|
13%
|
|
|
|
|
2006
origination
|
20%
|
Purchase
|
36%
|
|
|
2005
origination
|
5%
|
Cash
out refi
|
32%
|
|
|
2004
origination and earlier
|
62%
|
Rate-term
refi
|
30%
|
|
|
|
Other
|
2%
|
||
|
Wtd
avg original LTV
|
69%
|
|
|
|
|
Original
LTV: 0 - 50
|
15%
|
|
Hybrid
|
68%
|
|
Original
LTV: 50 - 60
|
11%
|
Adjustable
|
32%
|
|
|
Original
LTV: 60 - 70
|
19%
|
Interest
only
|
95%
|
|
|
Original
LTV: 70 - 80
|
48%
|
Fully-amortizing
|
5%
|
|
|
Original
LTV: 80 - 90
|
2%
|
|
||
|
Original
LTV: 90 - 100
|
5%
|
|
The
Redwood
Review
4th
Quarter
2007
|
|
43 |
|
|
Investments
in Acacia
|
Summary
What
is
this?
Under
our Acacia
program, we re-securitize real estate securities using bankruptcy remote
collateralized debt obligation (CDO) entities that sell asset-backed
securities
(ABS) to independent third-party investors. We typically retain an
equity
interest in the Acacia CDOs and receive asset management fees from
these
entities. We may also retain some of the other securities created by
the Acacia
entities. Our asset management fees typically equal ten basis points
of the
outstanding balance of Acacia assets. These fees are paid to us in
a first or
senior priority from the cash flows of Acacia assets. Our equity interests
in
Acacia entities are entitled to the net cash flows (i.e., the net cash
flows
generated by the assets after deducting asset management and other
fees and the
money owed to the ABS debt holders) of the Acacia entities. Our credit
risk is
limited to the amount we invested in our net equity interests, with
the
remainder of any losses borne by the holders of the more senior securities
issued by Acacia. Cash distributions to our Acacia equity interests
can be
disrupted based on rating agency downgrades of the underlying collateral
or due
to a deterioration in collateral performance. Our
investment in
each of these transactions is separate and independent, thus diminished
performance for one of our CDO equity interests
would have no
effect on our other CDO equity interests.
Quarterly
Update
| Ø |
As
of
December 31, 2007, ten Acacia CDO entities were outstanding.
The market
for new issuance CDO ABS is effectively shut down and will
likely remain
closed for some time. We do not foresee issuing new Acacia
CDOs in
2008.
|
| Ø |
During
the
fourth quarter, we received equity investment cash distributions
from
Acacia entities of $7 million and management fees of $2
million.
|
| Ø |
During
the
fourth quarter, we invested $11 million to acquire a portion
of the AAA
and AA-rated ABS issued in 2004 by Acacia 5 and 6. We purchased
these
Acacia ABS issued at 53% of their face value. The collateral
performance of these Acacia entities remains strong. Through
February 29,
2008, the underlying collateral owned by these two Acacia
entities had
collectively received 85 rating upgrades and 13
downgrades.
|
| 44 |
|
The
Redwood
Review
4th
Quarter
2007
|
 |
Investments
in Acacia
|
Economic
Value of our Investments in Acacia Entities
| Ø |
In
our
opinion, the best economic method to assess the value of our
investments
in Acacia is to calculate the net present value (NPV) of future
expected
cash flows of these investments (adjusted for credit losses).
This is how
a potential buyer would value our retained Acacia CDO equity
and debt
investments. Our December 31, 2007 estimate of the total sum
of future
expected cash flows from our investments in Acacia securities
we own was
$244 million. The net present value of these cash flows (NPV)
discounted
at 45% was $46 million.
|
| Ø |
Overall,
we
believe that $46 million is a reasonable approximation of the
fair value
of our investments in the Acacia entities at year end. We caution
that in
this environment it is particularly difficult to model future
cash flows
with certainty given the potential for future rating agency
downgrades and
the uncertainties around credit performance. Additionally,
there currently
is no active market for CDO equity and a limited market for
CDO ABS. Thus,
if we were to sell our investments in Acacia, which is not
our current
intention, we would likely receive substantially less than
the NPV
calculated in the manner described
above.
|
|
Summary
of Gross Expected Cash Flows & Net Present Value
(NPV)
|
||||||||||||
|
December
31, 2007
|
||||||||||||
|
($
in millions)
|
||||||||||||
|
Acacia
|
Acacia
|
Acacia
|
Acacia
|
Acacia
|
Acacia
|
Acacia
|
Acacia
|
Acacia
|
Acacia
|
Total
|
||
|
|
|
5
|
6
|
7
|
8
|
CRE1
|
9
|
10
|
11
|
OA1
|
12
|
Acacia
|
|
Gross
Expected Cash Flows (not discounted)
|
||||||||||||
|
Management
fees
|
$
1
|
$
1
|
$
2
|
$
2
|
$
3
|
$
3
|
$
5
|
$
4
|
$
2
|
$
4
|
$
27
|
|
|
ABS
retained
or acquired
|
23
|
23
|
16
|
37
|
22
|
1
|
1
|
-
|
-
|
-
|
123
|
|
|
Preference
shares
|
25
|
16
|
11
|
4
|
34
|
2
|
1
|
-
|
1
|
-
|
94
|
|
|
Total
Gross Expected Cash Flows
|
$
49
|
$
40
|
$
29
|
$
43
|
$
59
|
$
6
|
$
7
|
$
4
|
$
3
|
$
4
|
$
244
|
|
|
Net
Present Values
|
||||||||||||
|
Management
fees
|
$
-
|
$
-
|
$
1
|
$
1
|
$
1
|
$
1
|
$
2
|
$
1
|
$
1
|
$
1
|
$
9
|
|
|
ABS
retained
or acquired
|
6
|
7
|
1
|
1
|
1
|
-
|
-
|
-
|
-
|
-
|
16
|
|
|
Preference
shares
|
4
|
3
|
3
|
3
|
4
|
1
|
1
|
1
|
1
|
-
|
21
|
|
|
Total
Net Present Value
|
$
10
|
$
10
|
$
5
|
$
5
|
$
6
|
$
2
|
$
3
|
$
2
|
$
2
|
$
1
|
$
46
|
|
| Ø |
During
the
fourth quarter, the NPV of future expected cash flows from
our investments
in Acacia (assuming a constant 45% discount rate) decreased
from $55
million to $46 million. This decrease is the result of a $20
million net
deterioration in the NPV of future expected cash flows from
existing
investments, partially offset by $11 million of new investments
in Acacias
5 and 6.
|
|
The
Redwood
Review
4th
Quarter
2007
|
|
45 |
|
|
Investments
in Acacia
|
Valuation
Methodology - Economic Versus GAAP
| Ø |
If
we were permitted for accounting purposes to use the economic
method described above, our financial statements and disclosures
would be
a lot less complicated. Unfortunately, it is not that simple.
|
| Ø |
We
are
required for accounting purposes to consolidate the Acacia
CDO entities.
As a result, the net GAAP carrying value of our investments
in Acacia in
our financial statements is expressed as the difference
between the
carrying value of Acacia’s assets and the carrying value of Acacia’s
liabilities (ABS issued to third parties). Under the MTM
accounting rules
in place at December 31, 2007, we were required to MTM
Acacia’s assets,
but were not permitted to MTM Acacia’s liabilities, even though the assets
and liabilities are directly paired. Consequently, the
GAAP net carrying
value of our investment in Acacia’s securities was negative $1.4 billion
at December 31, 2007, a value that is impossible economically
(as the
economic value of our investments cannot be less than zero)
and
significantly understates our estimate of the fair value
of our Acacia
investments at that time.
|
| Ø |
As
previously
discussed in the Mark-To-Market Adjustments module, effective
January 1,
2008, we adopted a new accounting standard (FAS 159) that
allows us to MTM
both the consolidated assets and liabilities of Acacia
going forward. The
new accounting standard also provides for a one-time cumulative-effect
adjustment to the opening balance of retained earnings
on January 1, 2008
for the unrealized gains or losses on Acacia assets and
liabilities at
that time. This new accounting standard significantly improves
the
substantial disparity that existed between the Acacia GAAP
presentation
and economics at December 31, 2007. To our disappointment,
however,
discrepancies between the GAAP presentation and economic
valuation will
persist even under FAS 159. Discrepancies will arise as
a result of market
dynamics and the limitations on the measurement techniques
required by
this new standard.
|
| Ø |
Discrepancies
will continue to occur under FAS 159 because the cash economic
value of
our investments is not taken into account in determining
their carrying
value under FAS 159. Instead, GAAP carrying value is derived
by
subtracting the fair value of the Acacias liabilities from
the fair value
of Acacia’s assets. For accounting purposes, Acacia’s assets and
liabilities are valued separately in their independent
markets. In theory,
changes in the current market values of Acacia’s assets and liabilities
should be reasonably correlated as they are paired within
the same legal
structure - ABS issued by each Acacia entity will be repaid
directly and
solely from the cash flows generated by the assets owned
by that entity.
However, at any given moment, the capital markets may use
different
discount rates and valuation parameters for Acacia’s collateral assets
relative to its ABS issued to third parties. On January
1, 2008, for
instance, the market values for Acacia’s liabilities were, in our view,
depressed relative to the paired collateral asset values.
As a consequence
of this market condition, when we fair valued the assets
and liabilities
of the Acacia entities under FAS 159 at January 1, 2008,
the derived net
GAAP carrying value of our retained Acacia investments
was $84 million.
This result exceeds our $46 million estimate of the fair
value of our
investments in Acacia based on the net present value of
expected cash
flows.
|
As
a consequence of
adopting FAS 159, we will be required in the future to flow through
our
quarterly income statements the relative changes in the fair values
of Acacia
assets and liabilities as measured in their independent markets.
There is no way
to anticipate these relative changes from quarter to quarter. As
a consequence,
our earnings will vary as these values fluctuate over time. In particular,
if
Acacia liability values increase from the low levels at December
31, 2007, all
or a portion of our estimates of the excess GAAP carrying value at
January 1,
2008 of $38 million ($84 million less $46 million) will flow through
our income
statement as negative MTM adjustments. There is no scheduled time
frame when
this excess may be absorbed. It could happen gradually over time,
or it could
happen in a single quarter.
| 46 |
|
The
Redwood
Review
4th
Quarter
2007
|
|
|
Investments
in Acacia
|
Cash
Activity
| Ø |
Our
net cash
investment in the Acacia entities was $118 million at December
31, 2007.
The
following
table shows historical cash flow activity for each of the Acacia
entities
outstanding.
|
|
Historical
Summary of Investment and Cash Activity
|
||||||||||||
|
($
in millions)
|
||||||||||||
|
Acacia
|
Acacia
|
Acacia
|
Acacia
|
Acacia
|
Acacia
|
Acacia
|
Acacia
|
Acacia
|
Acacia
|
Total
|
||
|
|
5
|
6
|
7
|
8
|
CRE1
|
9
|
10
|
11
|
OA1
|
12
|
Acacia
|
|
|
Investment:
|
||||||||||||
|
Investment
as of Setember 30, 2007
|
$8
|
$8
|
$11
|
$18
|
$14
|
$11
|
$29
|
$5
|
$14
|
$22
|
$140
|
|
|
Investment
3 months ended December 31, 2007
|
5
|
6
|
-
|
-
|
-
|
-
|
-
|
-
|
-
|
-
|
11
|
|
|
Total
Investment
|
$13
|
$14
|
$11
|
$18
|
$14
|
$11
|
$29
|
$5
|
$14
|
$22
|
$151
|
|
|
Cash
Distributions Received:
|
-
|
-
|
-
|
-
|
-
|
-
|
-
|
-
|
-
|
-
|
-
|
|
|
2006
and prior
|
$(5)
|
$(4)
|
$(2)
|
$(3)
|
$(2)
|
$(1)
|
$-
|
$-
|
$-
|
$-
|
$(17)
|
|
|
9
months ended September 30, 2007
|
(1)
|
(2)
|
(1)
|
(1)
|
-
|
(1)
|
(2)
|
(1)
|
-
|
-
|
(9)
|
|
|
3
months ended December 31, 2007
|
(1)
|
(1)
|
-
|
(1)
|
-
|
-
|
(1)
|
-
|
(2)
|
(1)
|
(7)
|
|
|
Total
Cash Received (ex. mgmt fees)
|
$(7)
|
$(7)
|
$(3)
|
$(5)
|
$(2)
|
$(2)
|
$(3)
|
$(1)
|
$(2)
|
$(1)
|
$(33)
|
|
|
Net
Cash Investment as of 12/31/07
|
$6
|
$7
|
$8
|
$13
|
$12
|
$9
|
$26
|
$4
|
$12
|
$21
|
$118
|
|
|
Historical
Summary of Management Fees
|
||||||||||||
|
($
in thousands)
|
||||||||||||
|
Acacia
|
Acacia
|
Acacia
|
Acacia
|
Acacia
|
Acacia
|
Acacia
|
Acacia
|
Acacia
|
Acacia
|
Total
|
||
|
|
|
5
|
6
|
7
|
8
|
CRE1
|
9
|
10
|
11
|
OA1
|
12
|
Acacia
|
|
2006
and prior
|
$
695
|
$
605
|
$
487
|
$
400
|
$
242
|
$
178
|
$
604
|
$
-
|
$
-
|
$
-
|
$
3,211
|
|
|
9
months ended September 30, 2007
|
208
|
219
|
225
|
223
|
225
|
226
|
1,314
|
877
|
-
|
-
|
3,517
|
|
|
3
months ended December 31, 2007
|
75
|
75
|
75
|
74
|
75
|
76
|
439
|
554
|
197
|
549
|
2,189
|
|
|
Cumulative
Management Fees
|
$
978
|
$
899
|
$
787
|
$
697
|
$
542
|
$
480
|
$
2,357
|
$
1,431
|
$
197
|
$
549
|
$
8,917
|
|
| Ø |
Cash
distributions to the equity and ABS issued of Acacia entities
can be
disrupted due to actual losses or breaches of collateralization
and
interest coverage tests. Recent rating agency downgrades and
continued
deterioration in collateral performance on the five Acacia
entities that
issued ABS since March 2006 (Acacia 9 - 12 and OA1) have resulted
in a
strong likelihood that cash flows on our equity investments
in these
Acacia entities will be disrupted. This disruption is likely
to occur in
the first or second quarter of 2008 for Acacias 10, 11, 12,
and OA1, and
could occur within a year for Acacia 9. In our projected cash
flows, we
took these likely events into consideration.
|
Income
Statements
| Ø |
The
following
tables show the individual income statement contributions
of each of the
Acacia entities for the three months and year ended December
31,
2007.
|
|
Income
Statement
|
||||||||||||||||||||||||||||||||||
|
Three
Months Ended December 31, 2007
|
||||||||||||||||||||||||||||||||||
|
($
in millions)
|
||||||||||||||||||||||||||||||||||
|
Acacia
|
Acacia
|
Acacia
|
Acacia
|
Acacia
|
Acacia
|
Acacia
|
Acacia
|
Acacia
|
Acacia
|
Acacia
Total
|
||||||||||||||||||||||||
|
|
5
|
6
|
7
|
8
|
CRE1
|
9
|
10
|
11
|
OA1
|
12
|
Consolidated
|
|||||||||||||||||||||||
|
Management
fees
|
$
|
-
|
$
|
-
|
$
|
-
|
$
|
-
|
$
|
-
|
$
|
-
|
$
|
-
|
$
|
1
|
$
|
-
|
$
|
1
|
$
|
2
|
||||||||||||
|
Interest
income
|
4
|
5
|
5
|
6
|
5
|
5
|
10
|
7
|
8
|
7
|
62
|
|||||||||||||||||||||||
|
Interest
expense
|
(3
|
)
|
(4
|
)
|
(4
|
)
|
(4
|
)
|
(5
|
)
|
(4
|
)
|
(8
|
)
|
(8
|
)
|
(8
|
)
|
(8
|
)
|
(56
|
)
|
||||||||||||
|
Net
interest income
|
1
|
1
|
1
|
2
|
-
|
1
|
2
|
-
|
-
|
-
|
8
|
|||||||||||||||||||||||
|
Market
valuation adjustments, net, and realized losses
|
(36
|
)
|
(42
|
)
|
(32
|
)
|
(30
|
)
|
(19
|
) |
(44
|
)
|
(96
|
)
|
(185
|
)
|
(330
|
)
|
(177
|
)
|
(991
|
)
|
||||||||||||
|
Net
(Loss) Income
|
($35
|
)
|
($41
|
)
|
($31
|
)
|
($28
|
)
|
$
|
19
|
($43
|
)
|
($94
|
)
|
($185
|
)
|
($330
|
)
|
($177
|
)
|
($983
|
)
|
||||||||||||
|
Year
Ended December 31, 2007
|
||||||||||||||||||||||||||||||||||
|
Acacia
|
|
Acacia
|
|
Acacia
|
|
Acacia
|
|
Acacia
|
|
Acacia
|
|
Acacia
|
|
Acacia
|
|
Acacia
|
|
Acacia
|
|
Acacia
Total
|
|
|||||||||||||
|
|
|
5
|
|
6
|
|
7
|
|
8
|
|
CRE1
|
|
9
|
|
10
|
|
11
|
|
OA1
|
|
12
|
|
Consolidated
|
||||||||||||
|
Management
fees
|
$
|
-
|
$
|
-
|
$
|
-
|
$
|
-
|
$
|
-
|
$
|
-
|
$
|
2
|
$
|
1
|
$
|
-
|
$
|
1
|
$
|
6
|
||||||||||||
|
Interest
income
|
20
|
20
|
20
|
24
|
20
|
22
|
38
|
33
|
26
|
25
|
246
|
|||||||||||||||||||||||
|
Interest
expense
|
(16
|
)
|
(17
|
)
|
(17
|
)
|
(16
|
)
|
(17
|
)
|
(17
|
)
|
(31
|
)
|
(29
|
)
|
(26
|
)
|
(24
|
)
|
(210
|
)
|
||||||||||||
|
Net
interest income
|
4
|
3
|
3
|
8
|
3
|
5
|
9
|
5
|
-
|
2
|
42
|
|||||||||||||||||||||||
|
Market
valuation adjustments, net, and realized losses
|
(36
|
)
|
(45
|
)
|
(33
|
)
|
(32
|
)
|
(19
|
) |
(43
|
)
|
(114
|
)
|
(216
|
)
|
(351
|
)
|
(200
|
)
|
(1,089
|
)
|
||||||||||||
|
Net
(Loss) Income
|
|
($32
|
)
|
($42
|
)
|
($30
|
)
|
|
($24
|
)
|
|
($16
|
)
|
($38
|
)
|
($105
|
)
|
($211
|
)
|
($351
|
)
|
($198
|
)
|
($1,047
|
)
|
|||||||||
| Ø |
Acacias
5 - 8
and CRE1 continue to exceed our performance expectations. In
our most
recent cash flow modeling for these Acacia entities at December
31, 2007,
we did not project future disruptions in cash
flows.
|
| Ø |
If
the cash
distributions on our investments in Acacia 9 - 12 and OA1 are
disrupted,
the net interest income contribution arising from our investments
in these
entities will cease. In the three months and year ended December
31, 2007,
we recorded $3 million and $21 million of net interest income
from these
Acacia entities,
respectively.
|
|
The
Redwood
Review
4th
Quarter
2007
|
|
47 |
|
|
Investments in Acacia |
Balance
Sheets
| Ø |
The
following
table shows the individual balance sheets of the Acacia entities
at
December 31, 2007.
|
|
Acacia
Balance Sheets
|
||||||||||||
|
December
31, 2007
|
||||||||||||
|
($
in millions)
|
||||||||||||
|
Acacia
|
Acacia
|
Acacia
|
Acacia
|
Acacia
|
Acacia
|
Acacia
|
Acacia
|
Acacia
|
Acacia
|
|
||
|
|
|
5
|
6
|
7
|
8
|
CRE1
|
9
|
10
|
11
|
OA1
|
12
|
Total
|
|
Issue
Date
|
Jul-04
|
Nov-04
|
Mar-05
|
Jul-05
|
Dec-05
|
Mar-06
|
Aug-06
|
Feb-07
|
May-07
|
Jun-07
|
Acacia
|
|
|
Real
estate
securities
|
||||||||||||
|
Current
face
|
$231
|
$282
|
$278
|
$284
|
$300
|
$300
|
$498
|
$499
|
$424
|
$499
|
$3,595
|
|
|
Unamortized
discount, net
|
(41)
|
(46)
|
(34)
|
(44)
|
(50)
|
(48)
|
(84)
|
106
|
(296)
|
(161)
|
(966)
|
|
|
Designated
credit reserve
|
(2)
|
(8)
|
(8)
|
(6)
|
-
|
(8)
|
(84)
|
(83)
|
(5)
|
(75)
|
(279)
|
|
|
Unrealized
(losses)
|
(24)
|
(26)
|
(41)
|
(61)
|
(65)
|
(75)
|
(86)
|
(307)
|
(2)
|
(49)
|
(468)
|
|
|
Other
investments
|
-
|
-
|
-
|
-
|
-
|
-
|
-
|
-
|
79
|
-
|
79
|
|
|
Securities
and
other investments
|
164
|
202
|
195
|
173
|
185
|
169
|
244
|
215
|
200
|
214
|
1,961
|
|
|
Restricted
cash and other assets
|
16
|
12
|
30
|
21
|
9
|
11
|
12
|
11
|
15
|
14
|
151
|
|
|
Total
Assets
|
$180
|
$214
|
$225
|
$194
|
$194
|
$180
|
$256
|
$226
|
$215
|
$228
|
$2,112
|
|
|
ABS
issued and other liabilities
|
218
|
263
|
284
|
255
|
266
|
283
|
426
|
480
|
555
|
467
|
3,497
|
|
|
Total
investment
|
13
|
14
|
11
|
18
|
14
|
11
|
29
|
5
|
14
|
22
|
151
|
|
|
Retained
earnings
|
(26)
|
(36)
|
(30)
|
(20)
|
(14)
|
(36)
|
(103)
|
55
|
(352)
|
(205)
|
(1,035)
|
|
|
Balance
sheet
MTM adjustments
|
(25)
|
(27)
|
(40)
|
(59)
|
(72)
|
(78)
|
(96)
|
(314)
|
(2)
|
(56)
|
(501)
|
|
|
Total
Equity
|
(38)
|
(49)
|
(59)
|
(61)
|
(72)
|
(103)
|
(170)
|
(254)
|
(340)
|
(239)
|
(1,385)
|
|
|
Total
Liabilities and Equity
|
$180
|
$214
|
$225
|
$194
|
$194
|
$180
|
$256
|
$226
|
$215
|
$228
|
$2,112
|
|
| Ø |
The
following
table shows the individual balance sheets of the Acacia entities
at
January 1, 2008, after the adoption of FAS
159.
|
|
January
1, 2008
|
||||||||||||
|
Acacia
|
Acacia
|
Acacia
|
Acacia
|
Acacia
|
Acacia
|
Acacia
|
Acacia
|
Acacia
|
Acacia
|
|
||
|
|
|
5
|
6
|
7
|
8
|
CRE1
|
9
|
10
|
11
|
OA1
|
12
|
Total
|
|
Issue
Date
|
Jul-04
|
Nov-04
|
Mar-05
|
Jul-05
|
Dec-05
|
Mar-06
|
Aug-06
|
Feb-07
|
May-07
|
Jun-07
|
Acacia
|
|
|
Securities
and
other investments
|
164
|
202
|
195
|
173
|
185
|
169
|
244
|
215
|
200
|
214
|
1,961
|
|
|
Restricted
cash and other assets
|
16
|
13
|
29
|
20
|
6
|
9
|
9
|
7
|
12
|
9
|
130
|
|
|
Total
Assets
|
$180
|
$215
|
$224
|
$193
|
$191
|
$178
|
$253
|
$222
|
$212
|
$223
|
$2,091
|
|
|
ABS
issued and other liabilities
|
173
|
230
|
217
|
202
|
151
|
204
|
234
|
234
|
173
|
189
|
2,007
|
|
|
Total
investment
|
13
|
14
|
11
|
18
|
14
|
11
|
29
|
5
|
14
|
22
|
151
|
|
|
Retained
earnings
|
(6)
|
(29)
|
(4)
|
(27)
|
26
|
(37)
|
(10)
|
(17)
|
25
|
12
|
(67)
|
|
|
Total
Equity
|
7
|
(15)
|
7
|
(9)
|
40
|
(26)
|
19
|
(12)
|
39
|
34
|
84
|
|
|
Total
Liabilities and Equity
|
$180
|
$215
|
$224
|
$193
|
$191
|
$178
|
$253
|
$222
|
$212
|
$223
|
$2,091
|
|
| Ø |
The
continued
divergence between our estimate of economic value and GAAP
carrying values
even after the adoption of FAS 159 is highlighted by Acacia
6 and OA1 in
the table above. Our calculation of the economic value of
Acacia 6 at
December 31, 2007 was $10 million (see page 45). This compares
to a GAAP
value under FAS 159 of negative $15 million. In the worst
case, the value
of our investment cannot be worth less than zero. On the
other side of the
spectrum, our calculation of economic value in Acacia OA1
is $2 million,
while our net GAAP value under FAS 159 is reported at $39
million.
|
| 48 |
|
The
Redwood
Review
4th
Quarter
2007
|
|
|
Investments
in Acacia
|
Acacia
Collateral Detail
| Ø |
The
following
tables detail Acacia’s exposure to different collateral types owned by
Acacia entities and respective rating actions through February
29, 2008.
The cash flows generated by the assets in each Acacia will
ultimately
determine the cash flows distributed to each ABS security (including
equity) issued by each
Acacia.
|
|
Acacia
Balance Sheet Information
|
||||||||||||
|
Underlying
Collateral Type
|
||||||||||||
|
December
31, 2007
|
||||||||||||
|
(by
market value, $ in millions)
|
||||||||||||
|
Acacia
|
Acacia
|
Acacia
|
Acacia
|
Acacia
|
Acacia
|
Acacia
|
Acacia
|
Acacia
|
Acacia
|
|
||
|
|
|
5
|
6
|
7
|
8
|
CRE1
|
9
|
10
|
11
|
OA1
|
12
|
|
|
Issue
Date
|
Jul-04
|
Nov-04
|
Mar-05
|
Jul-05
|
Dec-05
|
Mar-06
|
Aug-06
|
Feb-07
|
May-07
|
Jun-07
|
Total
|
|
|
Resi
IGS
|
||||||||||||
|
Prime
Sequoia
|
$12
|
$14
|
$10
|
$5
|
$1
|
$3
|
$4
|
$3
|
$8
|
$15
|
$75
|
|
|
Prime
Other
|
37
|
54
|
64
|
60
|
36
|
97
|
90
|
38
|
7
|
31
|
514
|
|
|
Alt-a
|
23
|
15
|
17
|
17
|
3
|
13
|
38
|
87
|
93
|
111
|
417
|
|
|
Subprime
|
45
|
74
|
53
|
4
|
-
|
8
|
3
|
9
|
1
|
14
|
211
|
|
|
Resi
CES
|
||||||||||||
|
Prime
Sequoia
|
2
|
4
|
3
|
5
|
-
|
2
|
2
|
-
|
-
|
-
|
18
|
|
|
Prime
Other
|
22
|
18
|
12
|
33
|
-
|
17
|
67
|
16
|
-
|
9
|
194
|
|
|
Alt-a
|
1
|
2
|
2
|
11
|
-
|
3
|
3
|
16
|
8
|
2
|
48
|
|
|
Subprime
|
1
|
-
|
-
|
2
|
-
|
-
|
2
|
3
|
-
|
1
|
9
|
|
|
COMM
IGS
|
7
|
11
|
6
|
9
|
50
|
3
|
1
|
-
|
-
|
3
|
90
|
|
|
COMM
CES
|
1
|
4
|
12
|
20
|
74
|
14
|
25
|
23
|
-
|
16
|
189
|
|
|
COMM
Loans
|
4
|
-
|
9
|
4
|
9
|
-
|
-
|
-
|
-
|
-
|
26
|
|
|
CDO:
CMBS
|
2
|
1
|
2
|
-
|
12
|
7
|
7
|
13
|
4
|
7
|
55
|
|
|
CDO:
RMBS
|
7
|
5
|
5
|
3
|
-
|
2
|
2
|
7
|
-
|
5
|
36
|
|
|
GIC
|
-
|
-
|
-
|
-
|
-
|
-
|
-
|
-
|
79
|
-
|
79
|
|
|
Totals
|
$164
|
$202
|
$195
|
$173
|
$185
|
$169
|
$244
|
$215
|
$200
|
$214
|
$1,961
|
|
|
Acacia
Ratings Upgrade/Downgrade Summary
|
|||||||||||
|
February
29, 2008
|
|||||||||||
|
Acacia
|
Acacia
|
Acacia
|
Acacia
|
Acacia
|
Acacia
|
Acacia
|
Acacia
|
Acacia
|
Acacia
|
||
|
|
|
5
|
6
|
7
|
8
|
CRE1
|
9
|
10
|
11
|
OA1
|
12
|
|
Issuance
Date
|
Jul-04
|
Nov-04
|
Mar-05
|
Jul-05
|
Dec-05
|
Mar-06
|
Aug-06
|
Feb-07
|
May-07
|
Jun-07
|
|
|
Upgrades
|
54
|
31
|
19
|
14
|
8
|
11
|
12
|
11
|
0
|
2
|
|
|
Downgrades
|
6
|
7
|
2
|
4
|
1
|
12
|
31
|
34
|
37
|
36
|
|
|
Positive
Watch
|
0
|
0
|
0
|
0
|
0
|
0
|
0
|
0
|
0
|
1
|
|
|
Negative
Watch
|
2
|
4
|
5
|
5
|
0
|
4
|
12
|
28
|
32
|
24
|
|
|
The
Redwood
Review
4th
Quarter
2007
|
|
49 |
|
|
Appendix
|
APPENDIX
|
The
Redwood
Review
4th
Quarter
2007
|
|
51 |
|
|
Glossary
|
NOTE:
Not all
companies and analysts calculate non-GAAP measures in the same
fashion. As a
result, certain measures as calculated by Redwood may not be comparable
to
similarly titled measures reported by other companies.
ACACIA
Acacia
is the brand
name for the collateralized debt obligation (CDO) securitizations
Redwood
sponsors. The underlying pool of assets for these CDO securitizations
generally
consists of IGS and, in some pools, some below-investment-grade
rated
securities. The securities are backed by residential prime, alt-a,
and subprime
real estate loans, and commercial real estate loans. Acacia also
owns related
assets such as CDO securities issued by other real estate oriented
CDOs,
corporate debt issued by equity REITs, commercial real estate loans,
and
synthetic assets derived from real estate assets. Redwood typically
acquires a
portion of the CDO credit-enhancement (or “equity”) securities issued by Acacia;
these are the securities that are in the first-loss (highest risk)
position with
respect to absorbing any credit losses that may occur within the
assets owned by
the Acacia entities. Redwood may also retain or acquire Acacia
ABS issued.
Redwood also earns asset management fees for ongoing management
of the Acacia
entities.
ADJUSTABLE-RATE
MORTGAGES (ARMs)
Adjustable-rate
mortgages are loans that have coupons that adjust at least once
per year. We
make a distinction between ARMs (loans with a rate adjustment at
least annually)
and hybrids (loans that have a fixed-rate period of two to ten
years and then
become adjustable-rate).
ALT-A
SECURITIES
Alt-a
securities
are residential mortgage-backed securities backed by loans that
have higher
credit quality than subprime and lower credit quality than prime.
Alt-a
originally represented loans with alternative documentation, but
the definition
has shifted over time to include loans with additional risk characteristics
and
a higher percentage of investor loans. In an alt-a loan, the borrower’s income
may not be verified, and in some cases, may not be disclosed on
the loan
application. Alt-a loans may also have expanded criteria that allow
for higher
debt-to-income ratios with higher accompanying loan-to-value ratios
than would
otherwise be permissible for prime loans.
ASSET-BACKED
SECURITIES (ABS)
ABS
are securities
backed by financial assets that generate cash flows. Each ABS issued
from a
securitization entity has a unique priority with respect to receiving
principal
and interest cash flows and absorbing any credit losses from the
assets owned by
the entity.
BOOK
VALUE
Book
value is the
value of our common equity. As measured for GAAP, through December
31, 2007,
reported book value generally incorporates mark-to-market adjustments
for
securities and interest rate agreements, but not for loans or liabilities.
Beginning January 1, 2008, book value as measured for GAAP will
include
mark-to-market adjustments on certain assets and liabilities. We
may also report
the estimated fair value of our book value which is management’s estimate of the
fair value of its investments net of liabilities.
| 52 |
|
The
Redwood
Review
4th
Quarter
2007
|
|
|
Glossary
|
COLLATERALIZED
DEBT OBLIGATION (CDO) SECURITIZATIONS
The
securitization
of a diverse pool of assets. See “Acacia”.
CDO
EQUITY
SECURITIES
CDO
equity
securities (or CDO CES) are credit-enhancement securities that
bear the initial
credit losses of the assets owned by CDO securitization entities.
COMMERCIAL
B-NOTE LOANS
Commercial
b-note
loans are structured loans that are subordinated to the more senior
portions of
loans secured by the same commercial real estate property.
COMMERCIAL
MEZZANINE LOANS
Commercial
mezzanine loans are junior subordinated loans that are not secured
by a lien on
commercial real estate; rather, they are secured by a pledge from
an entity by
its equity interests in commercial real estate.
COMMERCIAL
WHOLE LOANS
Commercial
whole
loans are unsecuritized first-lien loans that are secured by commercial
real
estate.
CONDUIT
An
entity that
acquires closed loans from originators, accumulates loans over
a period, and
sells these loans, seeking to generate a gain on sale. Sales are
usually made
via securitization, but also can be made through bulk whole loan
sales.
CORE
EARNINGS
Core
earnings is
not a measure of earnings in accordance with GAAP. In calculating
core earnings,
we attempt to strip some of the elements out of GAAP income that
we believe are
temporary, one-time, or non-economic in nature, or that primarily
relate to the
past with little relevance to the future. In calculating core earnings,
we are
trying to show the trend of underlying ongoing earnings. For example,
we sell
assets from time to time as part of our ongoing portfolio management
activities.
These sales can produce material gains and losses that can obscure
the
underlying trend of our long-term portfolio earnings. Thus, we
exclude realized
gains and losses resulting from asset sales and calls that are
included in GAAP
income. Similarly, we exclude gains from calls of residential credit-enhancement
securities, as these are essentially sales of assets. GAAP income
also includes
mark-to-market income and expenses for some of our assets and interest
rate
agreements. These are unrealized fair value fluctuations, and we
exclude them
from core earnings. Core earnings also exclude other one-time expenses
such as
severance.
Management
believes
that core earnings provide relevant and useful information regarding
results
from operations. This information can be used in conjunction with
and in
addition to GAAP measures of performance. Core earnings can be
useful, in part,
because market valuation adjustments on only a portion of our assets
and none of
our liabilities are recognized through the income statement under
GAAP. Thus,
GAAP valuation adjustments may not be fully indicative of changes
in market
values on the balance sheet as a whole and may not be a reliable
guide to
current operating performance. Furthermore, gains or losses realized
upon sales
of assets vary based on portfolio management decisions; a sale
of an asset for a
gain or a loss may or may not affect ongoing earnings from operations.
A
reconciliation of core earnings to GAAP income appears in Table
2 in the
Appendix.
|
The
Redwood
Review
4th
Quarter
2007
|
|
53 |
|
|
Glossary
|
CORE
EQUITY
(CORE BOOK VALUE)
Core
equity is not
a measure calculated in accordance with GAAP. GAAP equity includes
mark-to-market adjustments for some of our assets and interest rate
agreements
(“accumulated other comprehensive income”). Core equity excludes these
mark-to-market adjustments. Core equity in some ways approximates
what our
equity value would be if we used historical amortized cost accounting
exclusively. A reconciliation of core equity to GAAP equity appears
in Table 7
of the Appendix.
CONSTANT
(OR CONDITIONAL) PREPAYMENT RATE (CPR)
Constant
(or
conditional) prepayment rate (CPR) is an industry-standard measure
of the speed
at which mortgage loans prepay. It approximates the annual percentage
rate at
which a pool of loans is paying down due to principal prepayments.
CREDIT-ENHANCEMENT
SECURITIES (CES)
Credit-enhancement
securities (CES) absorb the initial credit losses generated by a
pool of
securitized assets. As a result, the more senior securities issued
from that
securitization are credit-enhanced because they carry less credit
risk. Our
definition of CES includes all the below investment-grade rated bonds
issued
from a securitization. These securities are also referred to as subordinated
securities or B-pieces. For a typical securitization of prime residential
loans,
there are three CES: the first-loss, second-loss, and third-loss
bonds. The
first-loss security takes the initial risk of credit loss. If credit
losses
within the securitized asset pool exceed the principal value of the
first-loss
security, the second-loss security is at risk. If cumulative losses
exceed the
principal value of the first- and second-loss securities, then the
third-loss
security is at risk. Generally, for these securitizations, the third-loss
security has a credit rating of BB, the second-loss security has
a credit rating
of B, and the first-loss security is unrated. Other types of securitizations,
such as commercial, CDO, subprime residential, and some alt-a residential
transactions, may be structured differently. Nevertheless, the non-investment
rated securities issued from these securitizations function as
credit-enhancement securities in these transactions.
GAAP
Generally
Accepted
Accounting Principles in the United States.
GSEs
(GOVERNMENT-SPONSORED ENTERPRISES)
GSEs
are
government-sponsored enterprises, including the Federal National
Mortgage
Association (Fannie Mae) and the Federal Home Loan and Mortgage Corporation
(Freddie Mac).
INTEREST-ONLY
SECURITIES (IOs)
Interest-only
securities (IOs) are specialized securities created by securitization
entities
where the projected cash flows generated by the underlying assets
exceed the
cash flows projected to be paid to the ABS issue that have principal
balances.
They receive interest payments calculated by a formula wherein cash
flows on IOs
vary as a function of interest payments generated by the underlying
assets
within a securitization or as a function of the spread between the
yield on the
loans owned by a securitization entity and the cost of funds of the
securities
issued by that entity. Typically, IOs do not have a principal balance
and they
will not receive principal payments. Interest payments to IOs usually
equal an
interest rate formula multiplied by a “notional” principal balance. The notional
principal balances for IOs are typically reduced over time as the
actual
principal balances of the underlying pools of assets pay down, thus
reducing the
cash flows to the IOs over time. Cash flows on IOs are typically
reduced more
quickly if asset prepayments accelerate.
| 54 |
|
The
Redwood
Review
4th
Quarter
2007
|
|
|
Glossary
|
LEVERAGE
RATIOS
We
use
collateralized debt to finance the accumulation of assets prior to
sale to a
securitization entity and to finance investments in high-quality loans
and IGS.
We currently have very low levels of recourse debt. However, because
of the
consolidation of independent securitization entities, it appears on
our GAAP
consolidated financial statements that Redwood is highly leveraged,
with total
consolidated liabilities significantly greater than equity. The obligations
of
these securitization entities are not obligations of Redwood. When
determining
Redwood’s financial leverage, traditional leverage ratios may be misleading
in
some respects if consolidated ABS issued from securitization entities
are
included as part of Redwood’s obligations when calculating this or similar
ratios.
MARK-TO-MARKET
ACCOUNTING
Mark-to-market
accounting uses estimated fair values of assets, liabilities, and hedges.
Many
of our assets are carried on our balance sheet at their fair value
rather than
historical amortized cost. Through December 31, 2007, changes in the
fair value
of some of our assets and hedges are reported through our income statement.
Beginning January 1, 2008, we will use mark-to-market accounting for
income
statement purposes for a wider variety of assets and liabilities. This
will
likely make quarter-to-quarter GAAP income trends more volatile. Taxable
income
is generally not affected by market valuation adjustments.
NEGATIVE
AMORTIZATION ADJUSTABLE-RATE MORTGAGES (NEG AM ARMS, OPTION ARMS, OR
MTA
ARMS)
Negative
amortization ARMs (neg am ARMs, option ARMs, pay option ARMs, or monthly
treasury average (MTA) ARMs) are adjustable-rate mortgages that allow
the
borrower to choose between different payment options. These options
allow the
borrower to make minimum payments, or other payments that are less
than the
interest accrued on the mortgage during that period. As a result of
this
feature, the borrower’s loan balance may increase causing negative amortization
of the loan balance.
NET
INTEREST MARGIN SECURITIES (NIMs)
Net
interest margin
securities (NIMs) are securities backed by cash flows that otherwise
would be
payable to the residual security. Through a new securitization, cash
flows are
diverted from the residual to pay the NIM principal in addition to
paying a
coupon on the NIM, and thus, NIMs tend to have short-averaged lives.
Ratings on
NIMs can range from AAA down to single-B.
|
The
Redwood
Review
4th
Quarter
2007
|
|
55 |
|
|
Glossary
|
OPTION
ARMS
See
negative
amortization adjustable-rate mortgages
OTHER
REAL
ESTATE INVESTMENTS
Other
real estate
investments (OREI) include IOs, NIMs, and residuals. We have elected
to classify
these investments as trading instruments under GAAP. These assets
are reported
at fair value with changes in fair values recognized in our income
statements.
PRIME
RESIDENTIAL REAL ESTATE LOANS
Prime
loans are
residential loans with high quality credit characteristics, such
as borrowers
with high FICO credit scores, lower loan-to-value ratios, lower debt-to-income
ratios, greater levels of other assets, and more documentation.
PRIME
SECURITIES
Prime
securities
are residential mortgage-backed securities backed by high credit-quality
loans,
generally with balances greater than conforming loan limits. Prime
securities
are typically backed by loans that have relatively high weighted
average FICO
scores (700 or higher), low weighted average LTVs (75% or less),
limited
concentrations of investor properties, and low percentages of loans
with low
FICO or high LTV.
PROFITABILITY
RATIOS
Many
financial
institution analysts use asset-based profitability ratios such as
interest rate
spread and interest rate margin when analyzing financial institutions.
These are
asset-based measures. Because we consolidate the assets and liabilities
of
securitization entities for GAAP purposes, our total GAAP assets
and liabilities
may vary over time, and may not be comparable in economic reality
to assets
typically used in profitability calculations for other financial
institutions.
As a result, we believe equity-based profitability ratios may be
more
appropriate than asset-based measures for analyzing Redwood’s operations. We
believe, for example, that net interest income as a percentage of
equity is a
useful measure of profitability. For operating expenses, we believe
useful
measures are operating efficiency ratio (operating expenses as a
percentage of
net interest income) and operating expenses as a percentage of
equity.
REAL
ESTATE
INVESTMENT TRUST (REIT)
A
REIT is an entity
that makes a tax election to be taxed as a REIT, invests in real
estate assets,
and meets other REIT qualifications, including the distribution as
dividends of
at least 90% of REIT taxable income. A REIT’s profits are not taxed at the
corporate level to the extent that these profits are distributed
as dividends to
stockholders providing an operating cost savings. On the other hand,
the
requirement to pay out as dividends most of the REIT profits means
it can be
harder for a REIT to grow if using only internally-generated funds
(as opposed
to issuing new stock).
| 56 |
|
The
Redwood
Review
4th
Quarter
2007
|
|
|
Glossary
|
REDWOOD
DEBT
Redwood
debt is all
the debt that is an obligation of Redwood, with the exception of
junior
subordinated notes that we treat as part of our capital base. We
obtain this
debt from a variety of Wall Street firms, banks, and other institutions.
As
another form of Redwood debt, we have issued collateralized commercial
paper in
the past and may issue other forms of Redwood debt in the future.
REIT
RETAINED TAXABLE INCOME
REIT
retained
taxable income is not a measure calculated in accordance with GAAP.
REIT
retained taxable income is the taxable income earned at the REIT
after dividend
distributions to our shareholders, less corporate income taxes paid
at the REIT
level. A reconciliation of REIT retained taxable income to GAAP income
appears
in Table 3 in the Appendix.
REIT
SUBSIDIARY
A
REIT subsidiary is a subsidiary of a REIT that is taxed as a REIT.
REIT
TAXABLE INCOME
REIT
taxable income
is not a measure calculated in accordance with GAAP. REIT taxable
income is
pre-tax income calculated for tax purposes at Redwood including only
its REIT
subsidiaries (i.e., excluding its taxable subsidiaries). REIT taxable
income is
an important measure as it is the basis of our dividend distribution
requirements. We must distribute at least 90% of REIT taxable income
as
dividends to shareholders over time. As a REIT, we are not subject
to corporate
income taxes on the REIT taxable income we distribute. We pay income
tax on the
REIT taxable income we retain (up to 10% of total REIT taxable income).
A
reconciliation of REIT taxable income to GAAP income appears in Table
3 in the
Appendix.
RESIDUALS
Residuals
are
first-loss securities that are not rated by a rating agency. Residuals
are
called such because they get the last (or residual) claim on the
cash flow from
a securitization after ABS debt interest expense, losses, and servicing
fees
have been deducted from the interest paid by the underlying assets.
The value of
residual securities can vary greatly and is highly dependent on prepayment
speeds. The value is also dependent on the level and timing of credit
losses,
but often is not as sensitive to losses as it is to prepayment speeds.
These
securities perform poorly when prepayments are fast and losses are
higher than
expected.
RETURN
ON
EQUITY (ROE) AND ADJUSTED RETURN ON EQUITY
ROE
is the amount
of profit we generate each year per dollar of equity capital and
equals GAAP
income divided by GAAP equity. Adjusted ROE is GAAP income divided
by core
equity. Core equity excludes balance sheet mark-to-market adjustments.
Thus,
only those market value changes that are included in our income statement
will
affect adjusted ROE. A reconciliation of ROE to adjusted ROE appears
in Table 7
in the Appendix.
SEQUOIA
Sequoia
is the
brand name for securitizations of residential real estate loans Redwood
sponsors.
|
The
Redwood
Review
4th
Quarter
2007
|
|
57 |
|
|
Glossary
|
SUBPRIME
SECURITIES
Subprime
securities
are residential mortgage-backed securities backed by loans to borrowers
who have
impaired credit histories, and who appear to exhibit the ability
to repay the
current loan. Typically, these borrowers have lower credit scores
and/or other
credit deficiencies that prevent them from qualifying for prime or
alt-a
mortgages and may have experienced credit problems in the past, such
as late
payments or bankruptcies. To compensate for the greater risks and
higher costs
to service the loans, subprime borrowers pay higher interest rates,
points, and
origination fees.
Typical
characteristics of subprime loan pools include more than 60% of loans
with FICO
scores below 680, weighted average LTVs over 85%, more than 70% of
loans with
LTVs over 75%, and loans with LTVs over 80% with no mortgage
insurance.
TAXABLE
SUBSIDIARY
A
taxable
subsidiary is a subsidiary of a REIT that is not taxed as a REIT
and thus pays
taxes on its income. A taxable subsidiary is not limited to investing
in real
estate and it can choose to retain all of its after-tax profits.
TOTAL
RETAINED TAXABLE INCOME
Total
retained
taxable income is not a measure calculated in accordance with GAAP.
Total
retained taxable income is the taxable income earned at the REIT
after dividend
distributions to shareholders and taxes. It also includes all of
the taxable
income earned at our taxable subsidiaries, less corporate income
taxes paid as
we generally retain the after-tax income at the subsidiary level.
A
reconciliation of total retained taxable income to GAAP income appears
in Table
3 in the Appendix.
TOTAL
TAXABLE INCOME
Total
taxable
income is not a measure calculated in accordance with GAAP. Total
taxable income
is pre-tax income for Redwood and all its subsidiaries as calculated
for tax
purposes. Taxable income calculations differ significantly from GAAP
income
calculations. A reconciliation of total taxable income to GAAP income
appears in
Table 3 in the Appendix.
| 58 |
|
The
Redwood
Review
4th
Quarter
2007
|
|
|
|
Financial
Tables
4th
Quarter 2007
|
|
|
|
|
|
Page
Intentionally Left Blank
|
Table
1: GAAP Earnings ($ in thousands, except per share
data)
|
|
2007
Q4
|
2007
Q3
|
2007
Q2
|
2007
Q1
|
2006
Q4
|
2006
Q3
|
2006
Q2
|
2006
Q1
|
2005
Q4
|
Full
Year
2007
|
Full
Year
2006
|
||||||||||||||||||||||||
|
Interest
income
|
$192,375
|
$205,748
|
$208,039
|
$207,906
|
$213,504
|
$217,504
|
$214,544
|
$224,795
|
$234,531
|
$814,068
|
$870,347
|
|||||||||||||||||||||||
|
Net
securities
discount amortization income
|
18,869
|
20,514
|
23,849
|
20,268
|
18,665
|
17,842
|
13,234
|
13,245
|
10,971
|
83,500
|
62,986
|
|||||||||||||||||||||||
|
Other
real
estate investment interest income
|
1,353
|
1,275
|
669
|
2,465
|
-
|
-
|
-
|
-
|
-
|
5,762
|
-
|
|||||||||||||||||||||||
|
Non
real
estate investment interest income
|
984
|
1,143
|
464
|
-
|
-
|
-
|
-
|
-
|
-
|
2,591
|
-
|
|||||||||||||||||||||||
|
Net
loan
premium amortization expense
|
(6,656
|
)
|
(8,349
|
)
|
(10,863
|
)
|
(11,705
|
)
|
(13,272
|
)
|
(11,232
|
)
|
(12,046
|
)
|
(11,982
|
)
|
(13,486
|
)
|
(37,573
|
)
|
(48,532
|
)
|
||||||||||||
|
(Provision
for) reversal of credit reserve
|
(4,972
|
)
|
(1,507
|
)
|
(2,500
|
)
|
(3,829
|
)
|
(1,506
|
)
|
(465
|
)
|
2,506
|
(176
|
)
|
(877
|
)
|
(12,808
|
)
|
359
|
||||||||||||||
|
Total
GAAP
interest income
|
201,953
|
218,824
|
219,658
|
215,105
|
217,391
|
223,649
|
218,238
|
225,882
|
231,139
|
855,540
|
885,160
|
|||||||||||||||||||||||
|
Interest
expense on Redwood debt
|
(377
|
)
|
(5,858
|
)
|
(22,700
|
)
|
(31,094
|
)
|
(16,520
|
)
|
(9,422
|
)
|
(1,822
|
)
|
(2,072
|
)
|
(3,521
|
)
|
(60,029
|
)
|
(29,836
|
)
|
||||||||||||
|
ABS
interest
expense consolidated from trusts
|
(147,799
|
)
|
(155,661
|
)
|
(140,512
|
)
|
(131,391
|
)
|
(152,043
|
)
|
(165,177
|
)
|
(171,659
|
)
|
(178,183
|
)
|
(186,433
|
)
|
(575,363
|
)
|
(667,062
|
)
|
||||||||||||
|
ABS
issuance
expense amortization
|
(4,644
|
)
|
(4,616
|
)
|
(5,681
|
)
|
(7,068
|
)
|
(7,897
|
)
|
(5,786
|
)
|
(6,079
|
)
|
(5,907
|
)
|
(6,069
|
)
|
(22,009
|
)
|
(25,669
|
)
|
||||||||||||
|
ABS
interest
rate agreement income
|
1,265
|
1,959
|
3,358
|
1,646
|
2,497
|
3,317
|
3,678
|
2,980
|
3,573
|
8,228
|
12,472
|
|||||||||||||||||||||||
|
ABS
issuance
premium amortization income
|
1,930
|
2,096
|
2,294
|
1,869
|
1,529
|
2,395
|
2,363
|
2,527
|
2,793
|
8,189
|
8,814
|
|||||||||||||||||||||||
|
Total
consolidated ABS expense
|
(149,248
|
)
|
(156,222
|
)
|
(140,541
|
)
|
(134,944
|
)
|
(155,914
|
)
|
(165,251
|
)
|
(171,697
|
)
|
(178,583
|
)
|
(186,136
|
)
|
(580,955
|
)
|
(671,445
|
)
|
||||||||||||
|
Subordinated
notes interest expense
|
(3,055
|
)
|
(3,150
|
)
|
(2,516
|
)
|
(2,057
|
)
|
(423
|
)
|
-
|
-
|
-
|
-
|
(10,778
|
)
|
(423
|
)
|
||||||||||||||||
|
GAAP
net
interest income
|
49,273
|
53,594
|
53,901
|
47,010
|
44,534
|
48,976
|
44,719
|
45,227
|
41,481
|
203,778
|
183,456
|
|||||||||||||||||||||||
|
Fixed
compensation expense
|
(4,316
|
)
|
(4,560
|
)
|
(4,286
|
)
|
(4,616
|
)
|
(3,688
|
)
|
(3,437
|
)
|
(3,310
|
)
|
(3,437
|
)
|
(2,879
|
)
|
(17,778
|
)
|
(13,872
|
)
|
||||||||||||
|
Variable
compensation expense
|
(434
|
)
|
1,096
|
(198
|
)
|
(2,251
|
)
|
(1,666
|
)
|
(2,630
|
)
|
(1,900
|
)
|
(1,514
|
)
|
(2,110
|
)
|
(1,787
|
)
|
(7,710
|
)
|
|||||||||||||
|
Equity
compensation expense
|
(2,767
|
)
|
(2,593
|
)
|
(3,540
|
)
|
(3,349
|
)
|
(3,233
|
)
|
(2,579
|
)
|
(2,991
|
)
|
(2,694
|
)
|
(2,793
|
)
|
(12,249
|
)
|
(11,497
|
)
|
||||||||||||
|
Severance
expense
|
(1,340
|
)
|
-
|
-
|
(2,380
|
)
|
-
|
-
|
-
|
-
|
-
|
(3,720
|
)
|
-
|
||||||||||||||||||||
|
Other
operating expense
|
(7,337
|
)
|
(5,455
|
)
|
(4,670
|
)
|
(4,479
|
)
|
(4,732
|
)
|
(4,425
|
)
|
(5,149
|
)
|
(4,505
|
)
|
(4,685
|
)
|
(21,941
|
)
|
(18,811
|
)
|
||||||||||||
|
Due
diligence
expenses
|
(75
|
)
|
(220
|
)
|
(78
|
)
|
(707
|
)
|
(532
|
)
|
(384
|
)
|
(2,687
|
)
|
(432
|
)
|
(298
|
)
|
(1,080
|
)
|
(4,035
|
)
|
||||||||||||
|
Total
GAAP
operating expenses
|
(16,269
|
)
|
(11,732
|
)
|
(12,772
|
)
|
(17,782
|
)
|
(13,851
|
)
|
(13,455
|
)
|
(16,037
|
)
|
(12,582
|
)
|
(12,765
|
)
|
(58,555
|
)
|
(55,925
|
)
|
||||||||||||
|
Realized
gains (losses) sales
|
7,199
|
(1,460
|
)
|
1,428
|
303
|
5,308
|
4,968
|
8,241
|
1,062
|
14,815
|
7,470
|
19,579
|
||||||||||||||||||||||
|
Realized
(losses) gains on calls
|
(126
|
)
|
3,284
|
1,310
|
843
|
1,511
|
722
|
747
|
0
|
4,265
|
5,311
|
2,980
|
||||||||||||||||||||||
|
Market
valuation adjustments, net
|
(1,118,989
|
)
|
(102,766
|
)
|
(29,430
|
)
|
(10,264
|
)
|
(1,404
|
)
|
(5,257
|
)
|
(2,995
|
)
|
(2,932
|
)
|
(1,205
|
)
|
(1,261,449
|
)
|
(12,588
|
)
|
||||||||||||
|
Net
gains and
valuation adjustments
|
(1,111,916
|
)
|
(100,942
|
)
|
(26,692
|
)
|
(9,118
|
)
|
5,415
|
433
|
5,993
|
(1,870
|
)
|
17,875
|
(1,248,668
|
)
|
9,971
|
|||||||||||||||||
|
Credit
(provision) for income taxes
|
1,467
|
(1,837
|
)
|
(3,021
|
)
|
(1,801
|
)
|
(407
|
)
|
(3,538
|
)
|
(3,265
|
)
|
(2,760
|
)
|
(4,097
|
)
|
(5,192
|
)
|
(9,970
|
)
|
|||||||||||||
|
GAAP
net (loss) income
|
($1,077,445
|
)
|
($60,917
|
)
|
$11,416
|
$18,309
|
$35,691
|
$32,416
|
$31,410
|
$28,015
|
$42,495
|
($1,108,637
|
)
|
$127,532
|
||||||||||||||||||||
|
Diluted
average shares
|
29,531
|
27,892
|
28,165
|
27,684
|
27,122
|
26,625
|
26,109
|
25,703
|
25,311
|
27,928
|
26,314
|
|||||||||||||||||||||||
|
GAAP
earnings
per share
|
($36.49
|
)
|
($2.18
|
)
|
$0.41
|
$0.66
|
$1.32
|
$1.22
|
$1.20
|
$1.09
|
$1.68
|
($39.70
|
)
|
$4.85
|
||||||||||||||||||||
|
The
Redwood
Review -
4th
Quarter
2007
|
APPENDIX
- Table 1 -
GAAP
Earnings
|
61
|