
 |
 |
|
TABLE
OF CONTENTS
|
|
Introduction
|
2
|
|
Shareholder
Letter
|
3
|
|
Quarterly
Overview
|
4
|
|
Financial
Insights
|
8
|
|
Financial
& Investments Modules
|
|
|
Financial
|
16
|
|
-
GAAP Income
|
16
|
|
-
Taxable Income
|
19
|
|
-
Capital & Liquidity
|
21
|
|
-
Dividends
|
23
|
|
Mark-to-Market
Adjustments
|
24
|
|
|
|
|
Residential
Real Estate Securities
|
28
|
|
Commercial
Real Estate Securities
|
40
|
|
Investments
in Sequoia
|
43
|
|
Investments
in Acacia
|
47
|
|
Appendix
|
|
|
Accounting
Discussion
|
52
|
|
Glossary
|
55
|
|
Financial
Tables
|
62
|
THE
REDWOOD REVIEW 2ND QUARTER 2008 1
|
|
|
|
INTRODUCTION
|
Note
to
Readers:
We
file annual
reports (on Form 10-K) and quarterly reports (on Form 10-Q)
with the Securities
and Exchange Commission. These filings and our earnings press
releases provide
information about our financial results in accordance with
generally accepted
accounting principles (GAAP). We urge you to review these
documents which are
available through our web site, www.redwoodtrust.com.
This
document,
called the Redwood Review, provides supplemental information
about Redwood
through a discussion of many GAAP as well as non-GAAP metrics,
such as taxable
income and economic book value. We believe that these figures
provide additional
insight into Redwood’s business and future prospects. In each case in which we
discuss a non-GAAP metric, you will find an explanation of
how it has been
calculated and why we think the figure is important, and
a reconciliation
between the GAAP and non-GAAP figures. We hope you find the
Redwood Review to be
helpful to your understanding of our business.
The
form and
content of the Redwood Review will likely continue to change
over time. We
welcome your input and suggestions.
|
Selected
Financial Highlights
|
|||||||||||||||||||
|
Quarter:Year
|
GAAP
Income per Share
|
Total
Taxable Earnings per Share
|
Adjusted
Return on Equity
|
GAAP
Book Value per Share
|
Core
Book Value per Share
|
Total
Dividends per Share
|
|||||||||||||
|
Q206
|
$
|
1.20
|
$
|
1.91
|
14
|
%
|
$
|
39.13
|
$
|
35.58
|
$
|
0.70
|
|||||||
|
Q306
|
$
|
1.22
|
$
|
1.96
|
14
|
%
|
$
|
40.02
|
$
|
36.38
|
$
|
0.70
|
|||||||
|
Q406
|
$
|
1.32
|
$
|
1.45
|
15
|
%
|
$
|
37.51
|
$
|
34.02
|
$
|
3.70
|
|||||||
|
Q107
|
$
|
0.66
|
$
|
1.48
|
8
|
%
|
$
|
34.06
|
$
|
34.29
|
$
|
0.75
|
|||||||
|
Q207
|
$
|
0.41
|
$
|
1.66
|
5
|
%
|
$
|
31.50
|
$
|
34.40
|
$
|
0.75
|
|||||||
|
Q307
|
$
|
(2.18
|
)
|
$
|
1.74
|
(26
|
%)
|
$
|
5.32
|
$
|
31.58
|
$
|
0.75
|
||||||
|
Q407*
|
$
|
(36.49
|
)
|
$
|
0.91
|
(610
|
%)
|
$
|
23.18
|
$
|
26.24
|
$
|
2.75
|
||||||
|
Q108
|
$
|
(5.28
|
)
|
$
|
0.79
|
(83
|
%)
|
$
|
17.89
|
$
|
20.74
|
$
|
0.75
|
||||||
|
Q208
|
$
|
(1.40
|
)
|
$
|
0.11
|
(28
|
%)
|
$
|
17.00
|
$
|
19.05
|
$
|
0.75
|
||||||
|
*
The book
values per share are after giving retroactive effect
to the adoption of
FAS 159 on January 1, 2008.
|
|||||||||||||||||||
|
Without
giving
retroactive effect to FAS 159, the GAAP book value
per share and core book
value per share were a negative $22.18 and a negative
$4.46,
respectively.
|
|||||||||||||||||||
CAUTIONARY
STATEMENT: This Redwood Review contains forward-looking statements
within the
meaning of the safe harbor provisions of the Private Securities
Litigation
Reform Act of 1995. Forward-looking statements involve numerous
risks and
uncertainties. Our actual results may differ from our expectations,
estimates,
and projections and, consequently, you should not rely on these
forward-looking
statements as predictions of future events. Forward-looking
statements are not
historical in nature and can be identified by words such as
“anticipate,”
“estimate,” “will,” “should,” “expect,” “believe,” “intend,” “seek,” “plan” and
similar expressions or their negative forms, or by references
to strategy,
plans, or intentions. These forward-looking statements are
subject to risks and
uncertainties, including, among other things, those described
in our Annual
Report on Form 10-K for the year ended December 31, 2007 under
the caption “Risk
Factors.” Other risks, uncertainties, and factors that could cause actual
results to differ materially from those projected are described
below and may be
described from time to time in reports we file with the Securities
and Exchange
Commission, including reports on Forms 10-K, 10-Q, and 8-K.
We undertake no
obligation to update or revise any forward-looking statements,
whether as a
result of new information, future events, or otherwise.
Important
factors, among others, that may affect our actual results include:
changes in
interest rates; changes in prepayment rates; general economic
conditions,
particularly as they affect the price of earning assets and
the credit status of
borrowers; legislative and regulatory actions affecting the
mortgage industry;
the availability of high quality assets for purchase at attractive
prices;
declines in home prices; increases in mortgage payment delinquencies;
changes in
the level of liquidity in the capital markets which may adversely
affect our
ability to finance our real estate asset portfolio; changes
in liquidity in the
market for real estate securities, the re-pricing of credit
risk in the capital
markets, rating agency downgrades of securities and increases
in the supply of
real estate securities available for sale, each of which may
adversely affect
the values of securities we own; the extent of changes in the
values of
securities we own and the impact of adjustments reflecting
those changes on our
income statement and balance sheet, including our stockholders’ equity; our
ability to maintain the positive stockholders’ equity necessary to enable us to
pay the dividends required to maintain our status as a real
estate investment
trust for tax purposes; and other factors not presently identified.
This Redwood
Review may contain statistics and other data that in some cases
have been
obtained from or compiled from information made available by
servicers and other
third-party service providers.
2
THE REDWOOD REVIEW 2ND QUARTER 2008
|
|
 |
|
SHAREHOLDER
LETTER
|
Dear
Fellow
Shareholders:
Our
job as
management is to understand and address what is truly happening
in order to make
better decisions for Redwood shareholders. When communicating
with shareholders,
we do our best to pass on the unvarnished truth as we see
it. We don’t
sugar-coat and we don’t spin. We try not to err too far on the other side
either, which could cause unwarranted pessimism or despair.
Getting these
communications right is a tricky business, especially in
these times.
So
here is the
summary: In the short-term, we are suffering some credit
damage but overall we
are in good financial shape. Because of external events,
however, we are not
currently able to make much near-term progress towards
our long-term goals.
Nevertheless, as markets move into the correction phase
of the credit cycle, we
believe the longer-term prospects for Redwood have improved.
We are looking
forward to, over time, turning those improved prospects
into growth for the
company and improved levels of earnings and dividends for
shareholders.
Triage
and
emergency interventions continue for the economy and for
the real estate and
finance markets. We believe markets are still largely in
the denial stage,
although the first signs of capitulation are beginning
to appear. Unfortunately,
the housing market downturn has a long way to go before
it hits bottom. The
commercial real estate markets are far behind, but are
moving in the same
direction.
Redwood
is in the
business of pricing and taking credit risk. We expect to
take credit losses, and
we price in large losses when we make acquisitions. It
is important to note that
our business model limits our exposure to credit loss events
because our
exposure is capped at the amount we have invested in credit-enhancement
securities, which is usually a tiny fraction of the loan
amount. This differs
significantly from the degree of credit exposure to loans
that portfolio lenders
and insurance providers typically assume.
For
most of our
underperforming residential assets, we have written down
our remaining GAAP
exposure to a few cents on the dollar. There is not much
more to write off for
these assets. The bulk of our remaining assets should produce
reasonable
economic returns. Over 87% of the value of our residential
real estate assets is
in securities backed by loans that were originated before
or during 2004 or is
in securities that were acquired in 2008 or the fourth
quarter of 2007 at low
prices with extreme caution in mind. All of our commercial
real estate assets
are backed by loans originated in 2006 or earlier.
There
will again be
a healthy growing demand for credit enhancement of residential
jumbo and
commercial real estate loans. The banks, Fannie Mae, Freddie
Mac, and the
government are not able to provide all the capital required
to finance U.S.
residential and commercial real estate. There is a role
for the private sector,
and Redwood will continue to be a major player in that
sector.
Redwood
has the
freedom and capital to shape its own destiny. We have a
strong balance sheet,
ample liquidity, good cash flows, and virtually no exposure
to short-term debt
or to the liquidity issues that have plagued other market
participants. Redwood
is weathering this crisis and will continue to be a strong
player in the real
estate finance markets.
At
this challenging time, we particularly appreciate your
continued
support.
Sincerely,
 |
 |
|
George
E. Bull, III
|
Douglas
B. Hansen
|
|
Chairman
and CEO
|
President
|
THE
REDWOOD REVIEW 2ND QUARTER 2008 3
 |
|
|
QUARTERLY OVERVIEW
|
Second
Quarter 2008
During
the second
quarter, the challenges facing the mortgage industry grew
larger and more
complex. The same incendiaries — rising credit costs, falling home prices,
contracting credit availability, deteriorating balance
sheet strength, and
escalating rating agency downgrades — are still front and center. As a
consequence, fear and uncertainty continue to inhibit the
normal functioning of
the mortgage capital markets.
Capable
folks in
the public and private sectors are dedicated to developing
wide-ranging
solutions; unfortunately, there are no quick fixes. It
seems to us that
borrowers and financial institutions will endure significantly
more pain before
the storm passes.
Considering
market
headwinds, our accomplishments, and our disappointments,
we would categorize our
performance for the second quarter as “mixed”. On the one hand, we invested $152
million of our excess capital in what we believe are safe
and attractive assets,
we generated $52 million of cash flow in excess of our
operating and interest
costs, and we continued to expand our asset management
business. Furthermore, we
maintained our strong balance sheet. At June 30, 2008,
we had $148 million of
unrestricted cash, of which $132 million was capital in
excess of our operating
requirements. On the other hand, we are humbled by continued
increases in our
future loss assumptions for residential credit costs, particularly
for the 2006
and 2007 vintages. Additionally, we have materially reduced
our future cash flow
expectations from our Acacia equity investments due to
a barrage of rating
agency downgrades of Acacia assets in June and July of
2008 that were more
severe and more rapid than our expectations. During the
second quarter, the cash
flow we received from our Acacia equity investments was
$5 million, but we now
expect this cash flow to diminish rapidly over the next
few quarters. This topic
is discussed in more detail in the Investments in Acacia
module.
We
continue to
actively, yet patiently, pursue residential credit investments.
Credit
investment opportunities that we find attractive, however,
remain scarce. New
residential non-agency securitization activity is effectively
shut down, and
secondary trading of existing securities remains light.
Additionally, our
progress in completing other forms of credit risk transfers
with large financial
institutions has been impeded by the slow, deliberate pace
of their balance
sheet restructuring and capital reallocation process. As
a result, we only
invested $3 million in residential credit enhancement securities
(CES) during
the quarter.
Our
investing
activity at Redwood during the quarter was limited almost
entirely to
residential investment grade securities (IGS), securities
that provide a greater
certainty of the range of expected cash flows. We invested
$147 million in
residential IGS, $64 million of which was rated AAA and
AA and backed by prime
mortgage collateral and $62 million of which was AAA-rated
and backed by
non-prime mortgage collateral. We also acquired $21 million
of A and BBB-rated
securities backed by prime mortgage collateral from 2003
and 2004. The majority
(72%) of our acquisitions of IGS consisted of securities
backed by 2005 and
earlier mortgage collateral. The weighted average purchase
price for our
acquisitions was 75% of face value. The base case yields
range from 12% to 16%.
Although we can provide no assurance as to the future credit
performance of
these securities, we currently do not expect to incur any
material principal
credit losses on these newly acquired IGS. We acquired
these securities with
safety in mind. We take comfort in the fact that our recent
non-prime IGS
investments had on average over 30 points of credit enhancement.
This means for
example, that the underlying loan pools could withstand
a 50% default rate and a
40% loss severity and we would still have 10 points of
credit protection
remaining.
4
THE REDWOOD REVIEW 2ND QUARTER 2008
|
|
|
|
QUARTERLY
OVERVIEW
|
Second
Quarter 2008 (continued)
We
did not make any
new commercial or collateralized debt obligation (CDO)
investments at Redwood
during the quarter. We acquired $2 million of previously
issued Sequoia ABS.
The
Opportunity
Fund (the Fund) closed at the end of the first quarter
with $96 million of
commitments ($46 million from third-party investors and
$50 million from
Redwood). The offer and sale of interests in this private
fund were not
registered under the federal securities laws. The fund
was formed to capitalize
on dislocations in the non-prime residential mortgage-backed
securities (RMBS)
and CDO markets. As of June 30, 2008, the Fund had invested
$82 million, mainly
in seasoned residential non-prime IGS and CDOs. It is
managed by Redwood Asset
Management, one of our taxable subsidiaries. The expansion
of our asset
management business is an important part of our long-term
business strategy.
Rising
credit costs
remain our biggest challenge. We believe we established
adequate credit reserves
for GAAP purposes of $976 million, or $29.41 per share,
at the end of the
quarter. We are not, however, allowed to establish reserves
for tax purposes.
Our realized credit loss deductions for tax purposes
were $30 million in the
second quarter, up from $14 million in the prior quarter.
We expect credit
losses will increase in subsequent quarters, perhaps
not peaking until 2009 or
2010. A portion of these losses may be recoverable from
third parties and our
loss mitigation team is focused on recovering losses
where appropriate.
The
commercial real
estate market is facing economic headwinds with a slowing
economy, resulting in
rising vacancies across property types. In general, we
expect conditions to
worsen. We have not purchased and do not own commercial
assets that have
underlying loans originated in 2007 or 2008. So far,
our seasoned portfolio
continues to perform generally within our expectations.
We believe there will be
attractive opportunities to expand our commercial business
in the future.
Our
reported GAAP
loss for the second quarter of 2008 was $46 million (negative
$1.40 per share).
This loss includes $60 million (negative $1.84 per share)
of net negative market
valuation adjustments. Please note that we no longer
highlight core earnings as
recent accounting changes incorporating mark-to-market values have rendered
current results under that calculation that are not consistent
across asset
classes nor are comparable to prior core earnings results, and
thus core
earnings are no longer particularly useful in our view.
Estimated
taxable
earnings for this quarter were $4 million ($0.11 per
share). These taxable
earnings included $30 million (negative $0.92 per share)
of taxable income
deductions related to credit losses.
Our
economic, or
total rate of return, earnings during the second quarter
were a loss of $0.57
per share. This non-GAAP measure represents the change
in our economic book
value per share during the quarter after giving effect
to the payment of
dividends for the quarter. We caution that economic earnings
are heavily
influenced by short-term movements in market prices.
THE
REDWOOD REVIEW 2ND QUARTER 2008 5
|
|
|
|
QUARTERLY OVERVIEW
|
Second
Quarter 2008 (continued)
Our
GAAP book value
at June 30, 2008 was $17.00 per share. Our quarter-end
estimate of our economic
book value was $16.72 per share. Economic book
value is calculated using
bid-side or exit price marks. This value approximates
liquidation value and in
our opinion does not reflect the cost, or offered-side
values, we would have to
pay to replace our assets. Based on our estimate
of the future loss-adjusted
cash flows underlying our calculation of economic
book value at June 30, 2008,
the overall projected cash flow yield for our $624
million market value of
financial assets was 21% (including $147 million
of cash yielding 2%) and 26%
(excluding cash). The implied yield for our $81
million market value of
financial liabilities was 14%.
Details
and caveats
regarding the use and determination of these calculations,
and the
reconciliation of non-GAAP measures to GAAP, are
found later in this Review.
We
expect that GAAP
earnings will remain volatile. Early into the third
quarter, prices for many
real estate securities have continued to trend
down. It is still too early to
project whether this trend will continue throughout
the quarter. We will likely
continue to encounter mark-to-market (MTM) volatility
from our consolidation of
the Acacia entities due to the technical valuation
methodologies required under
FAS 159. In addition, we may recognize additional
GAAP impairment losses on
residential, commercial, and CDO securities held
at Redwood. Negative MTM
balance sheet write-downs that have not yet been
realized through the income
statement totaled $53 million at June 30, 2008.
During
the second
quarter, we raised $14 million through equity issuance
under our direct stock
purchase and dividend reinvestment plan. We ended
the second quarter with
reported capital of $714 million, including excess
capital of $132 million
available to make new investments. Our reported
capital base consists of $564
million of common equity and $150 million of subordinated
debt due in 2037. The
calculation of our excess capital is discussed
in the Capital and Liquidity
module that follows later in this Review.
Our
current capital
deployment plan is fluid and may include acquiring
or selling assets as well as
issuing or repurchasing equity shares. Our actions
will depend on:
| u |
The
level and
attractiveness of new investment opportunities;
|
| u |
Our
ability
to raise capital at a price that is accretive
to
earnings;
|
| u |
The
relative
attractiveness of investing in Redwood’s assets through the repurchase of
shares; and
|
| u |
The
amount of
cash we believe we should hold in reserve
to take advantage of potential
extraordinary investment opportunities
that may appear in the future.
|
As
these
considerations are in some respects competing,
and as market conditions remain
unclear and volatile, it is difficult to indicate
in advance what actions we
will likely take. We are keeping our options open.
We have not made any asset
acquisitions nor have we repurchased stock this
quarter through August 5, 2008.
You
can take
comfort in the fact that we are also shareholders
and we take capital decisions
personally. Suffice it to say, we will maintain
an appropriate amount of
liquidity, we will raise capital only if it is
accretive to earnings, and we are
prepared to buy back shares if we determine that
is our best investment
opportunity. To remind shareholders, from 1997
through 1999, we repurchased over
40% of the outstanding shares of Redwood.
6
THE REDWOOD REVIEW 2ND QUARTER 2008
|
|
|
|
QUARTERLY
OVERVIEW
|
Second
Quarter 2008 (continued)
We
expect that REIT
taxable income will continue to be pressured by
the realization of credit losses
through 2009 and into 2010. Actual REIT taxable
income will depend on the timing
of the credit losses and the level of taxable income
generated by our new and
existing investments. On a quarterly basis, we
expect taxable income generation
will be volatile.
As
a REIT, our
minimum dividend distribution requirements are
determined by our REIT taxable
income. Currently, our estimate is that the REIT
taxable income generated in
2008, together with the undistributed REIT taxable
income carried over from
2007, could fall somewhat short of full-year distributions
at our regular
dividend rate. We caution that the timing of credit
losses can be difficult to
project in the current environment and that our
estimates of taxable income
could change.
In
early August
2008, our Board of Directors reaffirmed its intention
to maintain the regular
quarterly dividend rate of $0.75 per share for
both the third and fourth
quarters of 2008. We do not expect to pay a special
dividend for 2008. Further,
we expect that the amount of undistributed taxable
income carried over into
2009, if any, will be minimal. The Board plans
to discuss dividend policy for
2009 at its regularly scheduled November board
meeting.
 |
 |
|
Martin
S. Hughes
|
Brett
D. Nicholas
|
|
Chief
Financial Officer
|
Chief
Investment Officer
|
|
Co-Chief
Operating Officer
|
Co-Chief
Operating Officer
|
THE
REDWOOD REVIEW 2ND QUARTER 2008 7
 |
|
|
FINANCIAL INSIGHTS
|
Components
of Book Value
| u |
The
following
supplemental non-GAAP balance sheet
presents our assets and liabilities
as
calculated under GAAP and as adjusted
to reflect our estimate of economic
value. We show our investments in the
Opportunity Fund and the Sequoia and
Acacia securitization entities in separate
line items, similar to the
equity method of accounting, reflecting
the reality that the underlying
assets and liabilities owned by these
entities are legally not ours. We
own only the securities or interests
that we have acquired or retained
from these entities.
|
| u |
This
table,
except for our estimates of economic
value, is derived from the
consolidating balance sheet presented
on page 10. Our estimate of economic
value of $16.72 is calculated using the
bid-side asset marks as required
to determine fair value under GAAP. This
method of calculating economic
value more closely relates to liquidation
value and does not represent the
higher amount we would have to pay at
the offered-side to replace our
existing assets.
|
|
Components
of Book Value
|
|||||||||||
|
June
30, 2008
|
|||||||||||
|
($
in millions, except per share data)
|
|||||||||||
|
As
Reported
|
|
Adj.
|
|
|
Management's
Estimate of Economic Value
|
||||||
|
Real
estate
securities at Redwood
|
|||||||||||
|
Residential
|
$
|
247
|
$
|
247
|
|||||||
|
Commercial
|
91
|
91
|
|||||||||
|
CDO
|
15
|
15
|
|||||||||
|
Total
real
estate securities at Redwood
|
353
|
353
|
|||||||||
|
Cash
and cash
equivalents
|
148
|
148
|
|||||||||
|
Investments
in
Opportunity Fund
|
47
|
47
|
|||||||||
|
Investments
in
Sequoia
|
140
|
(65)
|
|
(a)
|
75
|
||||||
|
Investments
in
Acacia
|
41
|
(22)
|
|
(b)
|
19
|
||||||
|
Other
assets/liabilities, net (d)
|
(15
|
)
|
|
(15
|
)
|
||||||
|
Long-term
debt
- Redwood
|
(150
|
)
|
78
|
(c)
|
(72
|
)
|
|||||
|
Stockholders'
equity
|
$
|
564
|
$
|
555
|
|||||||
|
Book
value per share
|
$
|
17.00
|
$
|
16.72
|
|||||||
| (a) |
Our
actual
Sequoia investments consist of CES,
IGS, and IOs acquired by Redwood from
the Sequoia entities. We calculated
the $75 million estimate of economic
value for these securities using the
same valuation process that we
followed to fair value all other real
estate securities. In contrast, the
$140 million of GAAP carrying value
of these investments represents the
difference between residential real
estate loans owned by the Sequoia
entities and the asset-backed securities
(ABS) issued by those entities to
third party investors. We account for
these loans and ABS issued at cost,
not at fair value.
|
| (b) |
Our
actual
Acacia investments consist of equity
interests, and to a lesser extent ABS
issued, that we acquired from the Acacia
entities. The $19 million
estimate of economic value of our investment
interests in the Acacia
entities represents the value of the
ABS acquired or retained using
bid-side marks from third parties,
plus the net present value of projected
cash flows from our Acacia management
fees discounted at 45%. We valued
our equity interests at the amount
of cash we received in July and expect
to receive in August and September
2008. We are not valuing any future
cash flows from equity distributions
beyond the third quarter. The
difference between the GAAP and economic
values is discussed in detail in
the Investments in Acacia section in
this Review.
|
| (c) |
We
issued
$150 million of 30-year long-term debt
at Redwood at an interest rate of
LIBOR plus 225 basis points. Under
GAAP, these notes are carried at cost.
Economic value is difficult to estimate
with precision as the market for
the notes is currently inactive. We
estimated the $72 million economic
value using the same valuation process
used to fair value our other
financial assets and liabilities. Estimated
economic value is $78 million
lower than our GAAP carrying value
because given the significant overall
contraction in credit availability
and re-pricing of credit risk, if we
had issued this long-term debt at Redwood
at June 30, 2008, investors
would have required a substantially
higher interest rate.
|
| (d) |
Other
assets/liabilities, net are comprised
of real estate loans of $4 million,
restricted cash of $2 million, $8 million
of deferred taxes, $5 million of
accrued interest, and other assets
of $11 million, less Redwood debt of
$9
million, accruals of $8 million, dividends
payable of $25 million, and
other liabilities of $3 million.
|
8
THE REDWOOD REVIEW 2ND QUARTER 2008
|
|
|
|
FINANCIAL
INSIGHTS
|
Components
of Book Value (continued)
| u |
The
following
table highlights the components of the overall change
in economic book
value per share that occurred during the quarter. It
is intended to
highlight the performance of our different investment
categories and show
other sources and uses of cash that impacted economic
value. Our
investment performance, expressed below as the change
in the economic
value of investments, gives effect to MTM adjustments,
new investments,
and principal and interest collected. As an example,
the $30 million
decline in economic value of our Acacia investments
from $49 million at
March 31, 2008 to $19 million at June 30, 2008, was
partially offset by
our receipt of $5 million in cash from our Acacia investments.
Therefore,
the net decrease in the economic value of our investments
in Acacia during
the quarter was $25 million ($0.75 per share).
|
| u |
The
changes
in the components of economic book value per
share is a non-GAAP measure.
Management’s estimate of economic value at March 31, 2008
is reconciled to
GAAP on Table 18 in the Financial Tables section.
Management’s estimate of
economic value at June 30, 2008 is reconciled
to GAAP on the previous
page.
|
|
Changes
in the Components of Economic Value Per Share
|
||||
|
Three
Months Ended June 30, 2008
|
||||
|
(in
$ per share)
|
||||
|
Management's
estimate of economic value at 3/31/08
|
$
|
18.04
|
||
|
Change
in
economic value of investments
|
||||
|
Real
estate
securities at Redwood
|
0.30
|
|||
|
Investments
in
Opportunity Fund
|
0.09
|
|||
|
Investments
in
Sequoia
|
-
|
|||
|
Investments
in
Acacia
|
(0.75
|
)
|
||
|
Total
change
in economic value of investments
|
(0.36
|
)
|
||
|
Operating
and
interest expenses
|
(0.36
|
)
|
||
|
Dividends
|
(0.75
|
)
|
||
|
Equity
issuance
|
0.15
|
|||
|
Total
changes to economic value
|
(1.32
|
)
|
||
|
Management's
estimate of economic value at 6/30/08
|
$
|
16.72
|
||
| u |
To
us, the
most important take-away from this presentation is
that our investments in
real estate securities held at Redwood and our investment
in the
Opportunity Fund showed a positive increase in economic
value despite the
extremely difficult market conditions, and that the
primary drag on our
overall investment performance during the second
quarter was our
investments in Acacia, which were significantly impacted
by rating agency
downgrades occurring late in the quarter at a rate
that exceeded our
expectations. Downgrades cut off cash flows to our
Acacia equity
interests. At June 30, 2008, our investments in Acacia
represent less than
4% of our invested capital.
|
THE
REDWOOD REVIEW 2ND QUARTER 2008 9
|
|
|
|
FINANCIAL INSIGHTS
|
Consolidating
Balance Sheet
| u |
GAAP
requires
us to consolidate all of the assets and liabilities
of the Sequoia and
Acacia securitization entities (which had a combined
$7.5 billion of
assets and $7.3 billion of liabilities at June 30,
2008) even though the
assets are owned by the securitization entities and
the liabilities are
obligations of the securitization entities payable
only from the cash
flows generated by the assets owned by the entities.
Additionally, we are
required to consolidate all of the assets and liabilities
of the
Opportunity Fund. Redwood owns the general partnership
interest in the
Opportunity Fund and just over half of the limited
partnership interests.
|
| u |
The
table
below shows the consolidating components of our consolidated
balance sheet
at June 30, 2008. The purpose of this presentation
is to show the effect
each of the components had on our consolidated shareholders’ equity at
June 30, 2008. The Opportunity Fund, Sequoia, and
Acacia components
represent investments and are not separate business
segments.
|
|
Consolidating
Balance Sheet
|
|||||||||||||||||||
|
June
30, 2008
|
|||||||||||||||||||
|
($
in millions)
|
|||||||||||||||||||
|
Redwood
|
|
Opportunity
Fund
|
|
Sequoia
|
|
Acacia
|
|
Intercompany
|
|
Redwood
Consolidated
|
|||||||||
|
Real
estate
loans
|
$
|
4
|
$
|
-
|
$
|
6,354
|
$
|
19
|
$
|
-
|
$
|
6,377
|
|||||||
|
Real
estate
securities
|
353
|
66
|
-
|
906
|
(84
|
)
|
1,241
|
||||||||||||
|
Other
investments
|
-
|
-
|
-
|
79
|
-
|
79
|
|||||||||||||
|
Cash
and cash
equivalents
|
148
|
-
|
-
|
-
|
-
|
148
|
|||||||||||||
|
Total
earning
assets
|
505
|
66
|
6,354
|
1,004
|
(84
|
)
|
7,845
|
||||||||||||
|
Investment
in
Opportunity Fund
|
47
|
-
|
-
|
-
|
(47
|
)
|
-
|
||||||||||||
|
Investment
in
Sequoia
|
140
|
-
|
-
|
-
|
(140
|
)
|
-
|
||||||||||||
|
Investment
in
Acacia
|
41
|
-
|
-
|
-
|
(41
|
)
|
-
|
||||||||||||
|
Other
assets
|
26
|
29
|
60
|
86
|
-
|
201
|
|||||||||||||
|
Total
assets
|
$
|
759
|
$
|
95
|
$
|
6,414
|
$
|
1,090
|
$
|
(312
|
)
|
$
|
8,046
|
||||||
|
Short-term
debt - Redwood
|
$
|
9
|
$
|
-
|
$
|
-
|
$
|
-
|
$
|
-
|
$
|
9
|
|||||||
|
Asset-backed
securities issued - Sequoia
|
-
|
-
|
6,259
|
-
|
(84
|
)
|
6,175
|
||||||||||||
|
Asset-backed
securities issued - Acacia
|
-
|
-
|
-
|
935
|
-
|
935
|
|||||||||||||
|
Other
liabilities
|
36
|
1
|
15
|
114
|
-
|
166
|
|||||||||||||
|
Long-term
debt
- Redwood
|
150
|
-
|
-
|
-
|
-
|
150
|
|||||||||||||
|
Total
Liabilities
|
195
|
1
|
6,274
|
1,049
|
(84
|
)
|
7,435
|
||||||||||||
|
Minority
Interest in Opportunity Fund
|
-
|
47
|
-
|
-
|
-
|
47
|
|||||||||||||
|
Total
Stockholders’ Equity
|
564
|
47
|
140
|
41
|
(228
|
)
|
564
|
||||||||||||
|
Total
liabilities and stockholders’ equity
|
$
|
759
|
$
|
95
|
$
|
6,414
|
$
|
1,090
|
$
|
(312
|
)
|
$
|
8,046
|
||||||
10
THE REDWOOD REVIEW 2ND QUARTER 2008
|
|
|
|
FINANCIAL
INSIGHTS
|
Real
Estate
Securities at Redwood
| u |
This
quarter
we reclassified our residential securities portfolio
into prime and
non-prime categories. The non-prime portfolio includes
securities backed
by alt-a and subprime loans and all option adjustable-rate
mortgages
(ARMs). As a result of establishing these new categories,
we reclassified
$4 million of option ARMs from prime to non-prime.
|
| u |
The
table
below provides a breakout of our real estate securities
portfolio by
residential, commercial, and CDO by vintage. The
residential and
commercial securities are further detailed by rating
in separate modules
later in this Review.
|
|
Real
Estate Securities at Redwood
|
|||||||||||||||||||
|
June
30, 2008
|
|||||||||||||||||||
|
($
in millions)
|
|||||||||||||||||||
|
<=
2004
|
2005
|
|
2006
|
|
2007
|
2008
|
|
Total
|
|||||||||||
|
Residential
|
|
||||||||||||||||||
|
Prime
|
|||||||||||||||||||
|
IGS
|
$
|
43
|
$
|
27
|
$
|
21
|
$
|
4
|
$
|
7
|
$
|
102
|
|||||||
|
CES
|
56
|
12
|
4
|
6
|
1
|
79
|
|||||||||||||
|
Non-prime
|
|||||||||||||||||||
|
IGS
|
-
|
29
|
13
|
16
|
-
|
58
|
|||||||||||||
|
CES
|
3
|
2
|
1
|
2
|
-
|
8
|
|||||||||||||
|
Total
Residential
|
102
|
70
|
39
|
28
|
8
|
247
|
|||||||||||||
|
Commercial
CES
|
15
|
18
|
45
|
13
|
-
|
91
|
|||||||||||||
|
CDO
IGS
|
8
|
6
|
-
|
1
|
-
|
15
|
|||||||||||||
|
Market
value
|
$
|
125
|
$
|
94
|
$
|
84
|
$
|
42
|
$
|
8
|
$
|
353
|
|||||||
| u |
Of
the total
$353 million of capital invested in real estate securities
at June 30,
2008, $211 million has been invested since the beginning
of the fourth
quarter of 2007.
|
| u |
Total
real
estate securities at Redwood increased during the
second quarter by 51% to
$353 million at June 30, 2008. The table below presents
our activity
during the second quarter.
|
|
Real
Estate Securities at Redwood
|
||||
|
Three
Months Ended June 30, 2008
|
||||
|
($
in millions)
|
||||
|
Market
value at March 31, 2008
|
$
|
234
|
||
|
Acquisitions
|
||||
|
Residential
IGS
|
||||
|
Prime
|
85
|
|||
|
Non-prime
|
62
|
|||
|
Total
Residential IGS
|
147
|
|||
|
Residential
Prime CES
|
3
|
|||
|
Principal
payments
|
(22
|
)
|
||
|
Discount
amortization
|
5
|
|||
|
Changes
in
fair value, net
|
(14
|
)
|
||
|
Market
value at June 30, 2008
|
$
|
353
|
||
THE
REDWOOD REVIEW 2ND QUARTER 2008 11
|
|
|
|
FINANCIAL INSIGHTS
|
Real
Estate
Securities at Redwood (continued)
| u |
During
the
second quarter, Redwood’s primary investment focus (exclusive of the
Opportunity Fund) was the acquisition of residential
IGS. With the
securitization market effectively shut down,
we invested a substantial
amount of our excess capital in seasoned securities
that are higher up in
the capital structure and where the range of
expected cash flows is more
certain. We acquired $147 million of IGS out
of total acquisitions of $152
million. We acquired $85 million of IGS securities
backed by prime
mortgage loans and $62 million backed by non-prime
mortgage loans. The
table below shows the detail by rating and vintage
for our prime and
non-prime residential IGS acquisitions during
the second quarter.
|
|
Residential
IGS Acquisitions
|
|||||||||||||||||||
|
at
Redwood by Type, Rating & Vintage
|
|||||||||||||||||||
|
Three
Months Ended June 30, 2008
|
|||||||||||||||||||
|
($
in millions)
|
|||||||||||||||||||
|
<=2004
|
|
2005
|
|
2006
|
|
2007
|
|
2008
|
|
Total
|
|||||||||
|
Prime
IGS
|
|||||||||||||||||||
|
AAA
|
$
|
-
|
$
|
4
|
$
|
14
|
$
|
-
|
$
|
-
|
$
|
18
|
|||||||
|
AA
|
19
|
22
|
-
|
5
|
-
|
46
|
|||||||||||||
|
A
|
15
|
-
|
-
|
-
|
-
|
15
|
|||||||||||||
|
BBB
|
6
|
-
|
-
|
-
|
-
|
6
|
|||||||||||||
|
Total
Prime
IGS
|
40
|
26
|
14
|
5
|
-
|
85
|
|||||||||||||
|
Non-prime
IGS
|
|||||||||||||||||||
|
AAA
|
-
|
34
|
14
|
14
|
-
|
62
|
|||||||||||||
|
Total
acquisitions
|
$
|
40
|
$
|
60
|
$
|
28
|
$
|
19
|
$
|
-
|
$
|
147
|
|||||||
| u |
Although
for
illustrative purposes we show the credit ratings
for our investments made
during the quarter, we emphasize that we do not
rely on credit ratings as
part of our investment decision process. Our
acquisition decisions are
based on the strength of the underlying collateral cash flows and the
level of subordination to protect against projected
credit losses. Of the
$62 million of non-prime acquisitions, $48 million
were backed by option
ARMs and $14 million were backed by subprime
loans. The option ARM IGS we
acquired have a weighted average credit support
of 29 points and were
acquired at 73% of face value. The subprime IGS
we acquired have a
weighted average credit support of 41 points
and were acquired at 83% of
face value.
|
| u |
The
percentage of IGS in our securities portfolio increased
to 50% at June 30,
2008 from 18% at the end of the first quarter.
|
12
THE REDWOOD REVIEW 2ND QUARTER 2008
|
|
|
|
FINANCIAL
INSIGHTS
|
Real
Estate
Securities at Redwood (continued)
| u |
For
GAAP
balance sheet purposes, we are required to
determine the carrying value of
our real estate securities using prices that
we can support as an “exit”
or bid-side price. Bid/offer spreads remain
wide for many of these
securities and, consequently, we reduced the
carrying value of our second
quarter acquisitions by $12 million below our
cost at June 30, 2008.
|
| u |
The
following
table presents the components of GAAP carrying
value (which equals fair
value determined in accordance with GAAP) for
residential and commercial
CES at Redwood. The carrying values as a percentage
of face value are all
equal to or less than 20%, with our non-prime
CES carried at 3% of face
value. In total, the carrying value of our
CES as a percentage of face
value is 15%.
|
|
Credit
Enhancement Securities at Redwood
|
||||||||||
|
June
30, 2008
|
||||||||||
|
($
in millions)
|
||||||||||
|
Residential
|
||||||||||
|
Prime
|
Non-Prime
|
|
Commercial
|
|||||||
|
Current
face
|
$
|
390
|
$
|
319
|
$
|
518
|
||||
|
Unamortized
discount, net
|
(49
|
)
|
(17
|
)
|
(33
|
)
|
||||
|
Discount
designated as credit reserve
|
(252
|
)
|
(297
|
)
|
(384
|
)
|
||||
|
Amortized
cost
|
89
|
5
|
101
|
|||||||
|
Unrealized
gains
|
9
|
4
|
3
|
|||||||
|
Unrealized
losses
|
(19
|
)
|
(1
|
)
|
(13
|
)
|
||||
|
Total
carrying value
|
$
|
79
|
$
|
8
|
$
|
91
|
||||
|
Carrying
value as a percentage of face
|
20
|
%
|
3
|
%
|
18
|
%
|
||||
| u |
We
acquire
CES at a significant discount to principal
value as credit losses could
reduce or eliminate the principal value of
these bonds. Our return on
these investments is based on how much principal
and interest we receive
and how quickly we receive it. Typically we
assume that most or all of the
principal will be written off due to credit
losses, so the timing of
credit losses is more of a factor than the
amount of credit losses when
looking at downside scenarios. In an ideal
environment, we would
experience fast prepayments and low credit
losses allowing us to recover a
substantial part of the discount as income.
Conversely, in the least
beneficial environment, we would experience
slow prepayments and high
credit losses.
|
| u |
We
provide
additional discussion and analysis regarding
the adequacy of our credit
reserves and the potential earnings upside
from an increase in prepayments
in the residential and commercial real estate
securities modules that
follow.
|
THE
REDWOOD REVIEW 2ND QUARTER 2008 13
| |
|
|
FINANCIAL INSIGHTS
|
Cash
Flow
| u |
As
a
supplement to our Consolidated Statement
of Cash Flows included in our
Quarterly Report on Form 10-Q, we have included
the table below that
summarizes the sources and uses of our cash
during the second quarter.
This table excludes the gross cash flows
generated by our Sequoia and
Acacia securitization entities and the Opportunity
Fund (cash flows that
are not available to Redwood), but does include
the cash flows paid to
Redwood as a result of our investments in
these entities.
|
| u |
In
the second
quarter, our investments generated cash from
principal and interest of $65
million, compared to $70 million in the first
quarter. We also received $1
million of asset management fees in the second
quarter. The net investment
cash flow, after deducting long and short-term
Redwood debt interest
expense of $2 million and cash operating
expenses of $12 million, was $52
million, compared to $54 million in the first
quarter.
|
|
Redwood
|
||||
|
Sources
and Uses of Cash
|
||||
|
Three
Months Ended June 30, 2008
|
||||
|
($
in millions)
|
||||
|
Sources:
|
||||
|
Cash
from
investments
|
$
|
65
|
||
|
Equity
raised
|
14
|
|||
|
Management
fees
|
1
|
|||
|
Short-term
borrowings
|
7
|
|||
|
Changes
in
working capital
|
5
|
|||
|
Total
Sources
|
92
|
|||
|
Uses:
|
||||
|
Acquisitions
|
(152
|
)
|
||
|
Additional
investment in Opportunity Fund
|
(10
|
)
|
||
|
Dividends
paid
|
(25
|
)
|
||
|
Operating
expenses paid
|
(12
|
)
|
||
|
Interest
expense
|
(2
|
)
|
||
|
Total
Uses
|
(201
|
)
|
||
|
Net
uses of cash
|
$
|
(109
|
)
|
|
|
Beginning
cash balance at 3/31/08
|
$
|
257
|
||
|
Ending
cash balance at 6/30/08
|
$
|
148
|
||
| u |
The
primary
reason for the decline in net investment
cash flow was lower interest
income resulting from slower prepayments
and the decline in short-term
interest rates during recent quarters,
which has lowered the coupon rates
we earn on adjustable-rate
assets.
|
14
THE REDWOOD REVIEW 2ND QUARTER 2008
|
|
|
|
FINANCIAL
INSIGHTS
|
Cash
Flow
(continued)
| u |
The
$65
million of cash flow from our investments
included $40 million of coupon
interest and $25 million of principal.
We caution readers that given the
nature of our investments (deep discount
credit-sensitive securities, IGS
at discounts, IOs, equity investments in
Acacia, and other types) it is
difficult to draw conclusions in any one
period about what portion of our
cash flow represents “income” and what is a “return of capital.” It is
only at the end of an asset’s life that we can accurately determine
what portion of the cumulative cash received
(whether principal or
interest) was truly income and what was
a return of capital.
|
| u |
The
following
table provides information regarding the
investment source and vintage of
our cash flow.
|
|
Cash
Flow by Vintage
|
|||||||||||||||||||
|
Three
Months Ended June 30, 2008
|
|||||||||||||||||||
|
($
in millions)
|
|||||||||||||||||||
|
<=2004
|
2005
|
|
2006
|
|
2007
|
|
2008
|
|
Total
|
||||||||||
|
Redwood
|
$
|
17
|
$
|
10
|
$
|
6
|
$
|
5
|
$
|
1
|
$
|
39
|
|||||||
|
Opportunity
Fund
|
1
|
1
|
-
|
-
|
-
|
2
|
|||||||||||||
|
Sequoia
|
14
|
1
|
-
|
4
|
-
|
19
|
|||||||||||||
|
Acacia
|
2
|
2
|
1
|
-
|
-
|
5
|
|||||||||||||
|
Total
|
$
|
34
|
$
|
14
|
$
|
7
|
$
|
9
|
$
|
1
|
$
|
65
|
|||||||
| u |
We
note that
credit losses on securities have no immediate
impact on our cash flow at
the time a loss is realized, although they
will result in a reduction in
the principal balance of the security.
Cash flow receipts will therefore
be reduced in future periods since interest
payments will be based on a
reduced principal balance. Also the upside
potential to recover the full
purchase discount from face value is reduced
by the amount of the loss.
|
| u |
We
caution
that the amount of cash flow from existing
investments could be volatile
from quarter to quarter depending on prepayment
patterns, changes in
interest rates, and the level of credit
losses. Overall, we expect cash
flow from existing investments to trend
lower over time. Future cash flows
could increase should our new investment
activity be successful.
|
THE
REDWOOD REVIEW 2ND QUARTER 2008 15
 |
|
|
GAAP INCOME
|
Summary
What
is
this?
GAAP
income is
income calculated under generally accepted accounting
principles in the United
States.
Quarterly
Update
| u |
The
table
below provides a summary of our GAAP (loss)
income for the second quarter
of 2008, the first quarter of 2008, and
the second quarter of 2007.
|
|
GAAP
Income
|
||||||||||
|
Three
Months Ended
|
||||||||||
|
($
in millions, except per share data)
|
||||||||||
|
6/30/08
|
3/31/08
|
|
6/30/07
|
|||||||
|
Interest
income
|
$
|
127
|
$
|
169
|
$
|
220
|
||||
|
Management
fees
|
1
|
2
|
1
|
|||||||
|
Interest
expense
|
(99
|
)
|
(130
|
)
|
(167
|
)
|
||||
|
Net
interest
income before market valuation adjustments
|
29
|
41
|
54
|
|||||||
|
Market
valuation adjustments, net
|
(60
|
)
|
(194
|
)
|
(29
|
)
|
||||
|
Net
interest
(loss) income
|
(31
|
)
|
(153
|
)
|
25
|
|||||
|
Operating
expenses
|
(15
|
)
|
(17
|
)
|
(13
|
)
|
||||
|
Realized
gains
(losses) on sales
|
3
|
-
|
1
|
|||||||
|
Realized
gains
on calls
|
-
|
-
|
1
|
|||||||
|
Minority
interest allocation
|
(2
|
)
|
-
|
-
|
||||||
|
Provision
for
income taxes
|
(1
|
)
|
(2
|
)
|
(3
|
)
|
||||
|
GAAP
(loss) income
|
$
|
(46
|
)
|
$
|
(172
|
)
|
$
|
11
|
||
|
GAAP
(loss) income per share
|
$
|
(1.40
|
)
|
$
|
(5.28
|
)
|
$
|
0.41
|
||
| u |
Our
reported
GAAP loss for the second quarter of 2008
was $46 million ($1.40 per share)
compared to a GAAP loss of $172 million
($5.28 per share) for the first
quarter of 2008. The improvement in the
second quarter was primarily a
result of substantially lower negative
market valuation adjustments (MVA).
|
| u |
Net
interest
income before MVA in the second quarter
totaled $29 million, a $12 million
decrease from the first quarter. More detailed
information on the
components of the changes in our net interest
income is found below.
|
| u |
MVA
in the
second quarter was a negative $60 million,
a significant difference from
negative MVA of $194 million in the first
quarter. MVA at Redwood totaled
$31 million, MVA at Acacia totaled $28
million, and MVA at Sequoia were $1
million. MVA are discussed in more detail
in the Mark-to-Market module
later in the Review.
|
| u |
Total
operating expenses decreased by $2 million
to $15 million from the prior
quarter, primarily due to lower variable
compensation accruals and a lower
headcount in the second quarter.
|
| u |
We
had
previously planned to distribute 90% of
our REIT taxable income for 2007
as dividends. As a result of the Board’s decision in August 2008 to
distribute the remaining 10% as a dividend
and to distribute 100% of our
2008 REIT taxable income as dividends,
rather than 90%, we expect to
record a $9 million reduction in our tax
provision during the third
quarter.
|
16
THE REDWOOD REVIEW 2ND QUARTER 2008
|
|
|
|
GAAP
INCOME
|
Quarterly
Update (continued)
| u |
The
following
tables detail the components of our
consolidated income statements for
the
second quarter and first quarters of
2008.
|
|
Consolidating
Income Statement
|
|||||||||||||||||||
|
Three
Months Ended June 30, 2008
|
|||||||||||||||||||
|
($
in millions)
|
|||||||||||||||||||
|
Redwood
|
Opportunity
Fund
|
Sequoia
|
Acacia
|
Intercompany
Adjustments
|
Redwood
Consolidated
|
||||||||||||||
|
Interest
income
|
$
|
20
|
$
|
1
|
$
|
72
|
$
|
40
|
$
|
(2
|
)
|
$
|
131
|
||||||
|
Net
discount
(premium) amortization
|
5
|
1
|
(10
|
)
|
-
|
-
|
(4
|
)
|
|||||||||||
|
Total
interest
income
|
25
|
2
|
62
|
40
|
(2
|
)
|
127
|
||||||||||||
|
Management
fees
|
1
|
-
|
-
|
-
|
-
|
1
|
|||||||||||||
|
Interest
expense
|
(2
|
)
|
-
|
(67
|
)
|
(32
|
)
|
2
|
(99
|
)
|
|||||||||
|
Net
interest
income (loss) before market valuation
adjustments
|
24
|
2
|
(5
|
)
|
8
|
-
|
29
|
||||||||||||
|
Market
valuation adjustments, net
|
(31
|
)
|
-
|
(1
|
)
|
(28
|
)
|
-
|
(60
|
)
|
|||||||||
|
Net
interest
(loss) income
|
(7
|
)
|
2
|
(6
|
)
|
(20
|
)
|
-
|
(31
|
)
|
|||||||||
|
Operating
expenses
|
(15
|
)
|
-
|
-
|
-
|
-
|
(15
|
)
|
|||||||||||
|
Realized
gains
on sales and calls, net
|
1
|
2
|
-
|
-
|
-
|
3
|
|||||||||||||
|
Income
from
Opportunity Fund
|
2
|
-
|
-
|
-
|
(2
|
)
|
-
|
||||||||||||
|
Loss
from
Sequoia
|
(6
|
)
|
-
|
-
|
-
|
6
|
-
|
||||||||||||
|
Loss
from
Acacia
|
(20
|
)
|
-
|
-
|
-
|
20
|
-
|
||||||||||||
|
Minority
interest allocation
|
-
|
(2
|
)
|
-
|
-
|
-
|
(2
|
)
|
|||||||||||
|
Provision
for
income taxes
|
(1
|
)
|
-
|
-
|
-
|
-
|
(1
|
)
|
|||||||||||
|
Net
(loss) income
|
$
|
(46
|
)
|
$
|
2
|
$
|
(6
|
)
|
$
|
(20
|
)
|
$
|
24
|
$
|
(46
|
)
|
|||
|
Consolidating
Income Statement
|
|||||||||||||||||||
|
Three
Months Ended March 31, 2008
|
|||||||||||||||||||
|
($
in millions)
|
|||||||||||||||||||
|
Redwood
|
Opportunity
Fund
|
Sequoia
|
Acacia
|
Intercompany
Adjustments
|
Redwood
Consolidated
|
||||||||||||||
|
Interest
income
|
$
|
23
|
$
|
1
|
$
|
94
|
$
|
48
|
$
|
(2
|
)
|
$
|
164
|
||||||
|
Net
discount
(premium) amortization
|
11
|
1
|
(7
|
)
|
-
|
-
|
5
|
||||||||||||
|
Total
interest
income
|
34
|
2
|
87
|
48
|
(2
|
)
|
169
|
||||||||||||
|
Management
fees
|
2
|
-
|
-
|
-
|
-
|
2
|
|||||||||||||
|
Interest
expense
|
(3
|
)
|
-
|
(83
|
)
|
(46
|
)
|
2
|
(130
|
)
|
|||||||||
|
Net
interest
income before market valuation adjustments
|
33
|
2
|
4
|
2
|
-
|
41
|
|||||||||||||
|
Market
valuation adjustments, net
|
(167
|
)
|
-
|
-
|
(27
|
)
|
-
|
(194
|
)
|
||||||||||
|
Net
interest
(loss) income
|
(134
|
)
|
2
|
4
|
(25
|
)
|
-
|
(153
|
)
|
||||||||||
|
Operating
expenses
|
(17
|
)
|
-
|
-
|
-
|
-
|
(17
|
)
|
|||||||||||
|
Income
from
Opportunity Fund
|
2
|
-
|
-
|
-
|
(2
|
)
|
-
|
||||||||||||
|
Income
from
Sequoia
|
4
|
-
|
-
|
-
|
(4
|
)
|
-
|
||||||||||||
|
Loss
from
Acacia
|
(25
|
)
|
-
|
-
|
-
|
25
|
-
|
||||||||||||
|
Provision
for
income taxes
|
(2
|
)
|
-
|
-
|
-
|
-
|
(2
|
)
|
|||||||||||
|
Net
(loss) income
|
$
|
(172
|
)
|
$
|
2
|
$
|
4
|
$
|
(25
|
)
|
$
|
19
|
$
|
(172
|
)
|
||||
THE
REDWOOD REVIEW 2ND QUARTER 2008 17
|
|
|
|
GAAP INCOME
|
Quarterly
Update (continued)
| u |
At
Redwood,
net interest income before MVA
declined by $9 million to $24 million
in
the second quarter from the prior
quarter. This decline was due to
higher
credit losses, slower prepayments,
and lower interest income as 69%
of our
investments are tied to short-term
interest rates. For securities
held at
Redwood, the second quarter annualized
interest income over our average
amortized cost was 25.99%.
|
| u |
At
Sequoia,
net interest income before MVA
declined by $9 million to negative
$5
million in the second quarter from
the prior quarter. Of this decline,
$2
million was due to higher credit
loss provisions, $4 million was
due to
lower interest rates, and $3 million
was due to higher loan premium
amortization which, for a portion
of our loans accelerates when short-term
LIBOR declines. Given the recent
relative stabilization in short
term
LIBOR, we expect loan premium amortization
to decline by approximately $3
million in the third quarter from
the second quarter level, although
actual prepayments may affect this
estimate.
|
For
the second
quarter, Sequoia loan premium amortization
and loan loss provisions totaled $20
million. These are non-cash charges. The cash
flows paid to Redwood from our
investments in Sequoia entities were $19 million
for the second quarter.
| u |
At
Acacia,
net interest income before MVA increased
by $6 million to $8 million in
the second quarter. This increase
was primarily due to interest rate
declines on Acacia liabilities, which
are all adjustable rate, versus less
significant interest rate declines
on assets, which are 42% adjustable
rate and 58% fixed rate. The decrease
in interest expense was largely
offset by market valuation adjustments
on Acacia ABS and hedging
derivatives, which are included in
MVA.
|
During
the second
quarter, Redwood received $5 million of cash
distributions from our Acacia
equity investments. We expect these distributions to diminish
rapidly over
the next few quarters. Earnings from Acacia
should also decline. Six of our
Acacia equity investments have stopped receiving
cash distributions due to
rating agency downgrades of securities held
by the Acacia entities. This has
materially affected the yield we expect to
earn on these investments in the
future.
18
THE REDWOOD REVIEW 2ND QUARTER 2008
|
|
 |
|
TAXABLE
INCOME
|
Summary
What
is
this?
Total
taxable
income is our pre-tax income as calculated
for tax purposes. Total taxable
income differs materially from GAAP income.
Table 3 in the Appendix reconciles
these two profitability measures.
REIT
taxable
income is the primary determinant of the
minimum amount of dividends we must
distribute in order to maintain our tax status
as a real estate investment trust
(REIT). REIT taxable income is pre-tax profit,
as calculated for tax purposes,
excluding taxable income earned at our non-REIT
taxable subsidiaries. Over time,
we must distribute at least 90% of our REIT
taxable income as
dividends.
For
our
quarterly taxable earnings estimates, we
project our taxable earnings for the
year based upon various assumptions of events
that will occur during the year.
However, some of the events that could have
significant impact on our taxable
earnings are difficult to project, including
the amount and timing of credit
losses, prepayments, and employee stock option
exercises. Thus, our quarterly
taxable earnings are likely to remain volatile.
Quarterly
Update
| u |
Total
taxable
income for the second quarter of
2008 was $4 million, or $0.11 per
share.
REIT taxable income was $4 million,
or $0.13 per share, in the second
quarter of 2008.
|
| u |
The
charts
below provide a summary of our total
taxable income per share and REIT
taxable income per share for each
for the nine most recently completed
fiscal quarters.
|
Total
Taxable Earnings per Share
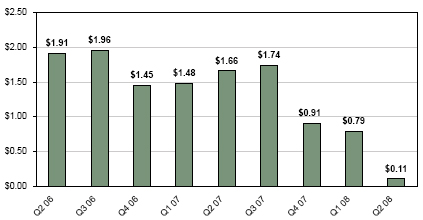
THE
REDWOOD REVIEW 2ND QUARTER 2008 19
|
|
|
|
TAXABLE INCOME
|
Quarterly
Update (continued)
REIT
Taxable
Earnings per Share
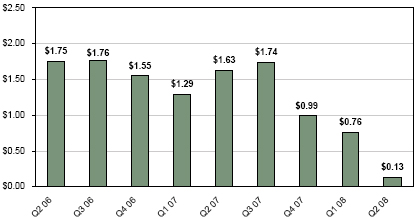
| u |
Our
total
taxable income decreased from
the prior quarter by $22 million.
Our second
quarter taxable earnings included
$30 million of deductions related
to
credit losses, an increase of
$16 million over the previous
quarter. In
addition, discount amortization
income for tax purposes decreased
by $5
million from the first quarter
to the second quarter primarily
as the
result of slower prepayment speeds.
We also generated $3 million
less in
taxable income from our investments
in Acacia entities.
|
| u |
Our
REIT
taxable income for the second
half of 2008 will depend on,
among other
things, our ability to deploy
our excess capital effectively,
prepayment
speeds (higher prepayments would
increase taxable income through
higher
discount amortization income)
and most importantly, on the
level of
realized credit losses. We expect
credit losses to continue to
increase in
the third and fourth quarters
of 2008 from the second quarter
level.
|
| u |
We
caution
that the realization of credit
losses can vary significantly
from quarter
to quarter, depending on a number
of variables (the level of loan
modifications, short-sales, and
the impact of new legislation)
that could
decelerate or accelerate the
timing of recognition of losses.
|
| u |
Our
taxable
income continues to be higher
than our GAAP income, as we are
not
permitted to establish credit
reserves for tax purposes and
we do not
generally recognize changes in
the market values of assets for
tax
purposes until the asset is sold.
As a result of these differences,
at
June 30, 2008, the tax basis
of our residential, commercial,
and CDO CES
at Redwood was $402 million higher
than our GAAP basis. Future credit
losses will have a more significant
impact on our taxable income
than on
our GAAP income. Over time, cumulative
GAAP and taxable income should
converge, suggesting that GAAP
income should increase or taxable
income
decrease over time relative to
the other.
|
| u |
The
tax basis
on Sequoia IOs we own is $45
million. Many of the underlying
pools of
loans have paid down or will
pay down within the next year
to levels where
they are callable. When these
are called, tax losses on these
IOs will be
incurred and our taxable income
and dividend distribution requirements
will decrease. The actual losses
will depend on the tax basis
at the time
of any calls, as the monthly
cash flows received on these
IOs in the
interim will reduce the cost
basis. During the second quarter,
the tax
basis in the IOs was reduced
by $10 million. At this time,
we do not
anticipate calling any Sequoia
deals in 2008.
|
20
THE REDWOOD REVIEW 2ND QUARTER 2008
|
|
 |
|
CAPITAL
& LIQUIDITY
|
Summary
What
is
this?
We
use capital
to fund our operations, invest in earning
assets that are primarily credit
sensitive and illiquid, fund working
capital, and meet lender capital
requirements with respect to collateralized
borrowings.
Through
our
internal risk-adjusted capital policy,
we allocate a prudent level of capital
for our earning assets to meet liquidity
needs that may arise. In most cases,
the amount of allocated capital is equal
to 100% of the fair value of the asset.
The amount of capital that exceeds our
risk-adjusted capital guideline, less
short-term debt, pending investment settlements,
operating expense allocations,
and other miscellaneous capital allocations,
is excess capital that can be
invested to support business growth.
Our
capital
base includes common equity plus $150
million of long-term debt at Redwood.
Declines
in the
fair value of assets do not have an effect
on excess capital, as asset value
declines equally reduce both available
capital and capital required for these
investments.
The
chart below
provides a summary of our aggregate capital
at work and excess capital for each
of the fiscal quarters noted.
Redwood
Reported Capital
($
in
billions)
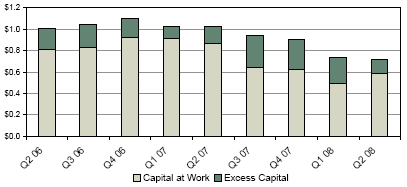
Quarterly
Update
| u |
Our
net
liquid assets at June 30, 2008
totaled $157 million and included
$148
million of unrestricted cash
and $18 million of AAA-rated
prime securities
at fair value, less $9 million
of Redwood debt.
|
| u |
At
June 30,
2008, our reported capital totaled
$714 million, compared to $735
million
March 31, 2008. Our reported
capital includes $564 million
of GAAP equity
and $150 million of 30-year long-term
debt at Redwood. The decline
in our
reported capital during the quarter
generally reflects the decrease
in the
estimated market value of our
assets.
|
THE
REDWOOD REVIEW 2ND QUARTER
2008 21
|
|
|
|
CAPITAL & LIQUIDITY
|
Quarterly
Update (continued)
| u |
Our
excess
capital position was $132
million at June 30, 2008,
a decrease from $247
million at March 31, 2008.
During the second quarter,
our sources of
capital were $52 million
from portfolio cash flows
and management fees in
excess of operating costs
and financing costs, $14
million raised from
stock issuances under our
direct stock purchase and
dividend reinvestment
plan, and $8 million from
net changes in working capital.
Our uses of
capital were $152 million
for new investments, $10
million for an
additional capital investment
in the Fund, and $25 million
for dividends.
|
| u |
The
high
level of excess capital and
liquidity that we have maintained
over the
past several quarters reflects
our intention to maintain
a strong balance
sheet during a time of market
distress. Over time, we expect
our excess
capital and liquidity to
decline as we fund new investments.
|
22
THE REDWOOD REVIEW 2ND QUARTER 2008
|
|
 |
|
DIVIDENDS
|
Summary
What
is
this?
As
a REIT, we
are required to distribute at least
90% of our REIT taxable income in the
form
of dividends to shareholders. The Board
of Directors can declare dividends
in
excess of this minimum requirement.
Our Board established a regular quarterly
dividend rate of $0.75 per share for
2008. We do not expect to pay a special
dividend in 2008.
Quarterly
Update
| u |
On
May 22,
2008, we declared a regular
dividend of $0.75 per share
for the second
quarter, which was paid on
July 21, 2008 to shareholders
of record on June
30, 2008.
|
Regular
Dividends per Share
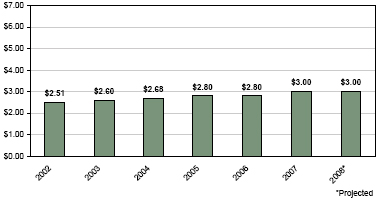
Special
Dividends per Share
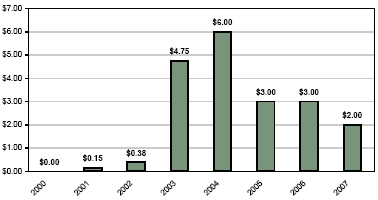
| u |
Our
REIT
taxable income for the second
quarter was $0.13 per share.
Our
undistributed REIT taxable
income (after giving effect
to the recent Board
of Directors’ action described below) was
$1.32 per share at June 30,
2008.
|
| u |
In
early
August, the Board of Directors
determined that Redwood would
distribute
100% of REIT taxable income
for 2007 and 2008 to shareholders.
Previously,
we had planned to distribute
90% and retain 10% for these
periods. As a
result, our GAAP provision
for taxes will be reduced
by $9 million in the
third quarter of 2008.
|
| u |
The
Board
recently affirmed its intention
to maintain the regular $0.75
per share
cash dividend for the third
and fourth quarters of 2008.
The Board will
review dividend policy for
2009 at its regularly scheduled
November board
meeting.
|
THE
REDWOOD REVIEW 2ND QUARTER
2008 23
 |
|
|
MARK-TO-MARKET ADJUSTMENTS
|
Market
Conditions
| u |
Pricing
for
residential and commercial
MBS and CDO securities
remained under pressure
during the second quarter,
although the rate of decline
was significantly
lower than the rate of
decline in the prior three
quarters. Prices
continued to trend lower
early into the third quarter.
|
| u |
The
capital
markets for non-agency
residential and commercial
mortgages remain
essentially closed. Residential
non-agency and commercial
securitizations
backed by newly originated
loans remain at the lowest
levels in many
years.
|
| u |
The
table
below illustrates the additional
interest rate spread that
investors have
required to compensate
for the perceived credit
risk of various types of
RMBS and commercial mortgage-backed
securities
(CMBS).
|
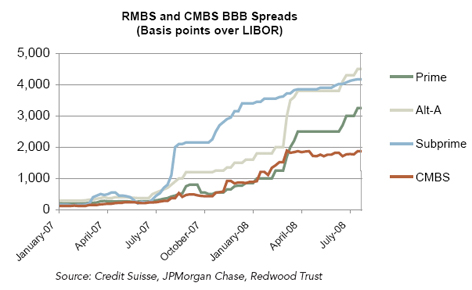
| u |
For
some
assets, declines in fair
values reflect the near
certainty of serious
credit losses being realized.
For others, significant
future losses may
not occur, but there is
a perceived increase in
the risk of loss,
resulting in a lower value.
Finally, many assets are
not at serious risk
of loss, but their declining
value largely reflects
a limited number of
observed sales in the market
as well as reduced buyer
liquidity and
increased buyer caution.
|
| u |
The
accounting rules regarding
MTM accounting are complex
and may not clearly
reflect the underlying
economics. This topic is
more fully discussed in
the Accounting Discussion
module in the Appendix.
|
| u |
Financial
Tables 17A, 17B, and 17C
in the back of this Review
detail the fair value
of residential, commercial,
and CDO securities at Redwood,
the Opportunity
Fund, and Acacia, respectively,
as a percentage of their
face value as of
June 30, 2008.
|
24
THE REDWOOD REVIEW 2ND QUARTER
2008
|
|
|
|
MARK-TO-MARKET
ADJUSTMENTS
|
Impact
on
Redwood
| u |
During
the
second quarter, the
net negative mark-to-market
(MTM) adjustments were
only $4 million for
securities held at
Redwood (exclusive
of securities at
or investments in the
Opportunity Fund, Sequoia,
and Acacia). This amount
is considerably lower
than the $146 million
in the first quarter.
The
reason for the decreased
rate of write-downs
is that many underperforming
securities, especially
residential CES, were
already written down
to cents
on the dollar during
prior quarters. For
instance, at March
31, 2008, our
residential prime CES
were valued at 14%
of face value and our
non-prime
CES were valued at
4% of face value.
|
| u |
The
tables
below detail the MTM
adjustments during
the second quarter
on securities
held at Redwood by
underlying collateral
type and by vintage.
|
|
Mark-To-Market
Adjustments
|
||||||||||||||||
|
on
Assets at Redwood
|
||||||||||||||||
|
Three
Months Ended June
30, 2008
|
||||||||||||||||
|
($
in millions)
|
||||||||||||||||
|
Loans
&
|
MTM
|
|||||||||||||||
|
IGS
|
CES
|
Derivatives
|
Total
|
Percent
(a)
|
||||||||||||
|
Residential
|
||||||||||||||||
|
Prime
|
$
|
(2
|
)
|
$
|
13
|
$
|
-
|
$
|
11
|
6
|
%
|
|||||
|
Non-prime
|
(7
|
)
|
(4
|
)
|
-
|
(11
|
)
|
(16
|
)%
|
|||||||
|
Total
Residential
|
(9
|
)
|
9
|
-
|
-
|
|||||||||||
|
Commercial
|
-
|
(6
|
)
|
-
|
(6
|
)
|
(7
|
)%
|
||||||||
|
Interest
rate
agreements & other derivatives
|
-
|
-
|
2
|
2
|
||||||||||||
|
Total
mark-to-market adjustments
|
$
|
(9
|
)
|
$
|
3
|
$
|
2
|
$
|
(4
|
)
|
||||||
|
By
Vintage &
Equity
|
||||||||||||||||||||||
|
<=
2004
|
2005
|
2006
|
|
2007
|
2008
|
Loans
& Derivatives
|
|
Total
|
||||||||||||||
|
Total
mark-to-market adjustments
|
$
|
14
|
$
|
(9
|
)
|
$
|
(7
|
)
|
$
|
(5
|
)
|
$
|
1
|
$
|
2
|
|
$
|
(4
|
)
|
|||
|
MTM
percent (a)
|
12
|
%
|
(9
|
)%
|
(8
|
)%
|
(12
|
)%
|
11
|
%
|
||||||||||||
|
(a)
This percentage represents
the MTMs taken as
a percentage of the
reported
fair values at the
beginning of the
period or purchase
price if acquired
during the period.
It is intended to
highlight the price
declines by
collateral type for
the three months
ended June 30, 2008.
These price
declines are specific
to our portfolio
and may not be indicative
of price
declines in the market
in
general.
|
||||||||||||||||||||||
| u |
During
the
second quarter of 2008,
the net market value
of the assets at Redwood
decreased by $4 million.
However, we recorded
a negative $31 million
market valuation adjustment
for accounting purposes.
This amount included
$29 million of impairments
on securities, most
of which had accumulated
through equity as unrealized
losses during prior
quarters. As a result,
we
had a positive net
change in our equity
of $27 million.
|
THE
REDWOOD REVIEW 2ND QUARTER
2008 25
|
|
|
|
MARK-TO-MARKET ADJUSTMENTS
|
Impact
on
Redwood (continued)
| u |
The
following
table shows the MTM
impact of the securities
at Redwood on our
balance
sheet and income
statement in the
second quarter.
|
|
Mark-to-Market
Adjustments on
Assets
|
||||
|
at
Redwood
|
||||
|
Balance
Sheet and Income
Statement Effects
|
||||
|
Three
Months Ended
June 30, 2008
|
||||
|
($
in millions)
|
||||
|
Balance
sheet
effect
|
||||
|
Net
change in
OCI
|
$
|
27
|
||
|
Income
statement effect
|
||||
|
Market
valuation adjustments
|
||||
|
Fair
value
assets
|
(2
|
)
|
||
|
Impairment
on
AFS securities
|
(29
|
)
|
||
|
Total
income
statement effect
|
(31
|
)
|
||
|
Total
mark-to-market
adjustments
|
$
|
(4
|
)
|
|
Impact
on
Assets and Liabilities held
by Acacia Entities
| u |
The
table
below shows detail
for the MTM adjustments
during the second
quarter for
the assets and liabilities
held by Acacia entities.
|
|
Mark-to-Market
Adjustments
|
||||
|
on
Acacia Assets
and Liabilities
|
||||
|
Three
Months Ended
June 30, 2008
|
||||
|
($
in millions)
|
||||
|
Assets
|
||||
|
Real
estate
securities and
loans
|
$
|
(61
|
)
|
|
|
Interest
rate
agreements and
other derivatives
|
29
|
|||
|
Liabilities
|
||||
|
ABS
issued
|
4
|
|||
|
Net
mark-to-market
adjustments
|
$
|
(28
|
)
|
|
| u |
During
the
second quarter, market
prices for the assets
owned by Acacia CDOs
and the
related debt declined
further due to continuing
credit deterioration,
rating agency downgrades,
and a market in which
there was light trading
volume.
|
| u |
The
entire
net negative $28
million of MTM adjustments
for Acacia was reflected
in
our income statement
as required by FAS
159.
|
| u |
As
a result
of the measurement
techniques required
by FAS 159, we expect
to continue
to encounter MTM
earnings volatility
as a result of the
consolidation of
Acacia entities.
We expect this volatility
to be significantly
less than
we encountered in
prior periods. This
complex topic is
more fully
discussed in the
Investments in Acacia
module later in this
Review.
|
26
THE REDWOOD REVIEW 2ND QUARTER
2008
|
|
|
|
MARK-TO-MARKET
ADJUSTMENTS
|
Mark-to-Market
Valuation Process
| u |
The
market
values we use for
our assets and
liabilities reflect
what we believe
we
would realize if
we chose to sell
our securities
or would have to
pay if
we chose to buy
back our liabilities
or asset-backed
securities (ABS)
issued liabilities.
Establishing market
values in thinly
traded or
essentially closed
markets is inherently
subjective and
is dependent upon
many market-based
inputs, including
observable trades,
information on
offered inventories,
bid lists, and
indications of
value obtained
from
dealers. Obtaining
fair values for
securities is especially
difficult for
illiquid securities
(such as ours),
and is made more
difficult when
there
is limited trading
visibility, as
has been the case
in recent months.
When
there are observable
sales, many of
them are from distressed
sellers and
tend to further
depress asset prices.
For these reasons,
we expect market
valuations to continue
to be highly volatile.
|
| u |
Fair
values
for our securities
and ABS issued
are dependent upon
a number of
market-based assumptions,
including future
interest rates,
prepayment
rates, discount
rates, credit loss
rates, and the
timing of credit
losses.
We use these assumptions
to generate cash
flow estimates
and internal
values for each
individual security.
|
| u |
We
request
indications of
value (marks) from
dealers on all
our assets and
liabilities every
quarter to assist
in the valuation
process. For June
30,
2008, we received
dealer marks on
81% of the assets
and 91% of our
liabilities on
our consolidated
balance sheet.
|
| u |
Our
valuation
process relied
on our internal
values to estimate
the fair values
of our
securities at June
30, 2008. In the
aggregate, our
internal valuations
of
the securities
on which we received
dealer marks were
17% lower than
the
aggregate dealer
marks at June 30,
2008. Our internal
valuations of our
ABS issued on which
we received dealer
marks were 1% lower
than the
aggregate dealer
marks at June 30,
2008.
|
| u |
One
of the
factors we consider
in our valuation
process is our
assessment of the
quality of the
dealer marks we
receive. Dealers
remain inundated
with
requests for quarter-end
marks, and there
continues to be
limited
observable trading
information for
them to rely upon.
Thus, their marks
were most likely
generated by their
own pricing models
for which they
did
not share their
inputs. We have
little insight
into their assumptions.
|
| u |
Furthermore,
the dealers continue
to heavily qualify
the information
they send to us.
The qualifications
include statements
to the effect that
the markets are
very volatile and
are characterized
by limited trading
volume and poor
price transparency.
An increasing number
of valuations are
model-based due
to a lack of observable
trades.
|
THE
REDWOOD REVIEW 2ND QUARTER
2008 27
 |
|
|
RESIDENTIAL REAL
ESTATE SECURITIES
|
Summary
What
is
this?
Redwood
invests
in securities that are backed
by pools of residential real
estate loans.
Historically, these securities
were primarily CES, but recent
acquisitions of
IGS have resulted in a larger
percentage of IGS to total
securities. Our
portfolio also includes other
real estate investments (OREI).
Most of our
investments in residential
real estate securities are
backed by prime
residential loans and some
are backed by alt-a or subprime
loans. The following
discussion refers only to
the residential securities
owned by Redwood, exclusive
of the securities owned by
Sequoia, Acacia, and the
Opportunity Fund or
Redwood’s investments in these entities.
Quarterly
Update
| u |
Our
residential securities
portfolio increased
by $130 million
(or 111%) to
$247 million
in the second
quarter. This
increase was
due to acquisitions
of $150 million,
which were partially
offset by principal
payments of $20
million.
|
| u |
As
previously
noted, our investments
this quarter
were focused
on IGS which
represented
$147 million
of our acquisitions
and we acquired
$3 million of
CES.
|
| u |
Industry-wide,
new securitizations
of non-agency
prime residential
loans totaled
only $1
billion in the
second quarter,
an 82% decline
from the first
quarter, and
a 98% decline
from the year-ago
period. The non-agency
prime
securitization
market for newly
originated loans
remains effectively
closed, largely
because investors
in AAA securities
are currently
requiring significantly
higher yield
premiums, thus
rendering new
securitization
activity uneconomic.
|
| u |
The
principal
value of credit
losses on prime
CES were $10
million during
the second
quarter, an increase
from $7 million
in the first
quarter. Principal
value
credit losses
on non-prime
CES were $57
million during
the second quarter,
an increase from
$24 million in
the first quarter.
These amounts
were
charged against
our GAAP credit
reserve.
|
| u |
For
tax
purposes, losses
on prime securities
were $5 million
($0.15 per share)
and
losses on non-prime
securities were
$25 million ($0.76
per share). These
deductions are
less than the
principal value
of credit losses
incurred on
the underlying
loans as we own
most of our credit
sensitive securities
at
a tax basis that
is substantially
less than par
value.
|
| u |
Industry-wide,
prepayment rates
on the residential
loans remain
low. For example,
the
annualized monthly
prepayment rate
for Fannie Mae’s $2.5 trillion
MBS was
14% in May. The
May annualized
prepayment rate
for jumbo fixed-rate
mortgages was
12%. For jumbo
ARMs, the rate
was higher at
20%, but ARM
prepayments have
been trending
down from 29%
in December 2007.
The decline
in prepayments
reflects tighter
underwriting
requirements,
the shutdown
of
the non-agency
securitization
market, and the
increase in mortgage
interest rates
during the year.
Mortgage interest
rates for 30-year
fixed-rate jumbo
mortgages have
increased by 76 basis points
to 7.47%
at July 31, 2008
from the beginning
of the year.
Over the same
time
period, interest
rates for 30-year
fixed-rate conforming
mortgages
increased by
47 basis points
to 6.26%.
|
28
THE REDWOOD REVIEW 2ND
QUARTER 2008
|
|
|
|
RESIDENTIAL
REAL ESTATE
SECURITIES
|
Quarterly
Update (continued)
| u |
Housing
market
conditions
remain
a significant
concern.
Home
prices,
as measured
by the
S&P Case-Shiller
Home
Price
Index
(composite-10),
were
down
17%
at the
end of
May from
a year
ago.
This
index
has declined
for 23
consecutive
months.
Foreclosure
filings
were
up 53%
in June
from
a year
ago,
according
to Realty
Trac,
marking
the 30th
consecutive
month
of
year-over-year
increases.
|
| u |
The
recent
housing
legislation
is too
new to
determine
the impact
it will
have
on us.
For example,
the temporary
increase
in the
Agency
conforming
loan
limits
to $729,750
through
the end
of the
year
has had
little
impact
to date.
Fannie
Mae had
completed
only
seven
jumbo
securitizations
totaling
$32
million
through
July
1, 2008.
The recent
Housing
and Economic
and
Recovery
Act of
2008
has provisions
that
could
be beneficial
to us
to the
extent
borrowers
are able
to remain
in their
homes
resulting
in fewer
foreclosures
and less
downward
pressure
on home
prices.
There
is a
provision
in the
Act related
to refinancing
mortgages
into
a new
FHA
program
involving
debt
forgiveness
that
can both
hurt
us by
potentially
accelerating
credit
losses
on our
CES,
and benefit
us at
the same
time
through
accelerated
prepayments
on our
IGS.
Predicting
the timing
and
magnitude
of the
impact
on individual
securities
is difficult
and we
will
be closely
monitoring
the impact
of the
legislation
on our
portfolio.
|
THE
REDWOOD REVIEW 2ND
QUARTER
2008 29
|
|
|
|
RESIDENTIAL
REAL ESTATE
SECURITIES
|
Prime
Securities Portfolio
What
is
this?
Prime
securities are mortgage-backed
securities backed
by high-credit quality
residential loans.
The borrowers typically
have high FICO credit
scores. The
loans have relatively
low loan-to-value
(LTV) ratios. The
following discussion
refers only to the
prime securities
at Redwood, exclusive
of any prime
securities owned
by Acacia, Redwood’s investments in
Sequoia, and securities
owned by the Opportunity
Fund.
Quarterly
Update
| u |
The
following
table presents
the activity
in our
prime securities
portfolio
during
the
second
quarter
of 2008.
The carrying
value as
of percentage
of face
value
for all
our securities
is detailed
on Table
17A in
the Financial
Tables
section.
|
|
Prime
Securities
at
Redwood
|
||||
|
Three
Months
Ended
June
30,
2008
|
||||
|
($
in
millions)
|
||||
|
Market
value
at
March
31,
2008
|
$
|
98
|
||
|
Acquisitions
|
88
|
|||
|
Transfers
to
/
from
other
portfolios
|
(4
|
)
|
||
|
Principal
payments
|
(15
|
)
|
||
|
Discount
amortization
|
6
|
|||
|
Changes
in
fair
value,
net
|
8
|
|||
|
Market
value
at
June
30,
2008
|
$
|
181
|
||
| u |
Total
interest
income
generated
by our
prime securities
was $15
million
in the
second
quarter.
The annualized
interest
income
over our
$233 million
average
amortized
cost was
26.61%.
|
30
THE REDWOOD REVIEW
2ND QUARTER 2008
|
|
|
|
RESIDENTIAL
REAL ESTATE
SECURITIES
|
Prime
Securities Portfolio
Quarterly
Update (continued)
| u |
The
table
below
presents
rating
and vintage
information
of the
prime
securities
in
our portfolio
at June
30, 2008.
|
|
Prime
Securities
at
Redwood
|
|||||||||||||||||||
|
By
Rating
and
Vintage
|
|||||||||||||||||||
|
June
30,
2008
|
|||||||||||||||||||
|
(by
market
value,
$ in
millions)
|
|||||||||||||||||||
|
<=2004
|
|
2005
|
|
2006
|
|
2007
|
|
2008
|
|
|
Total
|
||||||||
|
IGS
|
|||||||||||||||||||
|
AAA
|
$
|
1
|
$
|
4
|
$
|
13
|
$
|
-
|
$
|
-
|
$
|
18
|
|||||||
|
AA
|
19
|
21
|
-
|
4
|
4
|
48
|
|||||||||||||
|
A
|
13
|
-
|
8
|
-
|
2
|
23
|
|||||||||||||
|
BBB
|
10
|
2
|
-
|
-
|
1
|
13
|
|||||||||||||
|
Total
IGS
|
43
|
27
|
21
|
4
|
7
|
102
|
|||||||||||||
|
CES
|
|||||||||||||||||||
|
BB
|
16
|
8
|
2
|
3
|
1
|
30
|
|||||||||||||
|
B
|
17
|
1
|
1
|
2
|
-
|
21
|
|||||||||||||
|
NR
|
23
|
3
|
1
|
1
|
-
|
28
|
|||||||||||||
|
Total
CES
|
56
|
12
|
4
|
6
|
1
|
79
|
|||||||||||||
|
Market
value
|
$
|
99
|
$
|
39
|
$
|
25
|
$
|
10
|
$
|
8
|
$
|
181
|
|||||||
|
By
Loan
Type
and
Vintage
|
|||||||||||||||||||
|
<=2004
|
|
|
2005
|
|
|
2006
|
|
|
2007
|
|
2008
|
|
Total
|
||||||
|
ARM
|
$
|
5
|
$
|
-
|
$
|
-
|
$
|
-
|
$
|
-
|
$
|
5
|
|||||||
|
Fixed
|
21
|
-
|
9
|
8
|
3
|
41
|
|||||||||||||
|
Hybrid
|
73
|
39
|
16
|
2
|
5
|
135
|
|||||||||||||
|
Market
value
|
$
|
99
|
$
|
39
|
$
|
25
|
$
|
10
|
$
|
8
|
$
|
181
|
|||||||
| u |
Our
prime
CES
portfolio
is concentrated
in more
seasoned
assets
originated
in 2004
and
earlier
(71%
by current
market
value).
Although
delinquencies
are
currently
rising
across
all vintages,
these
seasoned
CES are
still
performing
within
our original
expectations
and are
carried
at 24%
of face
value
on our
balance
sheet.
|
| u |
For
2005
and
later
vintages
(29%
by current
market
value),
the performance
of our
prime
CES is
generally
worse
than
our original
expectations.
Credit
performance
for these
vintages
have
been
more
negatively
impacted
by declining
home
prices,
as many
borrowers
have
negative
equity
in their
houses.
These
securities
originated
in 2005
and later
represent
4% of
our capital.
Our
estimate
of market
value
is 9%
of principal
value.
|
THE
REDWOOD REVIEW
2ND QUARTER
2008 31
|
|
|
|
RESIDENTIAL
REAL
ESTATE
SECURITIES
|
Prime
Securities Portfolio
Quarterly
Update (continued)
| u |
The
chart
below
shows
the
level
of
serious
delinquencies
of
our
prime
CES
by
vintage
at
the
end
of
each
quarter
since
the
beginning
of
2006.
|
Prime
CES at
Redwood
Seriously
Delinquent Trends
by Vintage and
Quarter
(%
of
Current Balance)
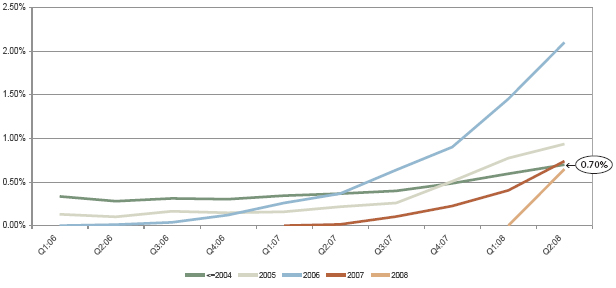
| u |
As
a result
of
the
increased
delinquencies
and
continued
weakening
of
the
housing
markets,
we
have
increased
our
levels
of
credit
reserves
on
recent
vintages.
As
seen
in
the
table
below,
our
investments
in
prime
CES
total
$79
million
at
June
30,
2008.
These
investments
have
a face
value
of
$390
million,
of
which
we
have
reserved
$252
million
($7.59
per
share).
Furthermore,
our
reserves
are
97%
of
face
value
for
all
non-rated,
first
loss
investments
originated
in
2005
and
later
periods.
The
amount
of
capital
we
currently
have
invested
in
securities
with
loans
originated
in
2005
or
later
totals
$23
million,
of
which
$5
million
is
currently
invested
in
first
loss
securities.
|
32
THE REDWOOD REVIEW
2ND QUARTER 2008
|
|
|
|
RESIDENTIAL
REAL
ESTATE
SECURITIES
|
Prime
Securities Portfolio
Quarterly
Update (continued)
|
Credit
Reserve
Analysis
-
Prime
CES
at
Redwood
|
||||||||||||||||||||||||||||||||||||||||
|
By
Rating
and
Vintage
|
||||||||||||||||||||||||||||||||||||||||
|
June
30,
2008
|
||||||||||||||||||||||||||||||||||||||||
|
($
in
millions)
|
||||||||||||||||||||||||||||||||||||||||
|
<=2004
|
2005
|
2006
|
2007
|
2008
|
Total
|
|||||||||||||||||||||||||||||||||||
|
Amount
|
%
of
loans
|
Amount
|
|
%
of
loans
|
Amount
|
%
of
loans
|
Amount
|
%
of
loans
|
Amount
|
%
of
loans
|
Amount
|
%
of
loans
|
||||||||||||||||||||||||||||
|
BB
|
||||||||||||||||||||||||||||||||||||||||
|
Face
|
$
|
43
|
0.45
|
%
|
$
|
29
|
0.34
|
%
|
$
|
6
|
0.08
|
%
|
$
|
16
|
0.31
|
%
|
$
|
6
|
0.48
|
%
|
$
|
100
|
0.31
|
%
|
||||||||||||||||
|
Unamortized
discount
|
(12
|
)
|
(13
|
)
|
(2
|
)
|
2
|
(2
|
)
|
(27
|
)
|
|||||||||||||||||||||||||||||
|
Discount
designated
as
credit
reserve
|
(7
|
)
|
0.08
|
%
|
(7
|
)
|
0.08
|
%
|
(2
|
)
|
0.03
|
%
|
(15
|
)
|
0.30
|
%
|
(2
|
)
|
0.18
|
%
|
(33
|
)
|
0.11
|
%
|
||||||||||||||||
|
Unrealized
gains
(losses)
|
|
(8
|
)
|
(1
|
)
|
-
|
-
|
(1
|
)
|
(10
|
)
|
|||||||||||||||||||||||||||||
|
Market
value
|
$
|
16
|
$
|
8
|
$
|
2
|
$
|
3
|
$
|
1
|
$
|
30
|
||||||||||||||||||||||||||||
|
Overall
credit
protection
to
BB
CES
|
0.69
|
%
|
0.45
|
%
|
1.03
|
%
|
0.40
|
%
|
0.65
|
%
|
0.66
|
%
|
||||||||||||||||||||||||||||
|
B
|
||||||||||||||||||||||||||||||||||||||||
|
Face
|
$
|
37
|
0.07
|
%
|
$
|
6
|
0.15
|
%
|
$
|
3
|
0.25
|
%
|
$
|
19
|
0.15
|
%
|
$
|
4
|
0.31
|
%
|
$
|
69
|
0.10
|
%
|
||||||||||||||||
|
Unamortized
discount
|
(7
|
)
|
-
|
-
|
1
|
-
|
(6
|
)
|
||||||||||||||||||||||||||||||||
|
Discount
designated
as
credit
reserve
|
(10
|
)
|
0.02
|
%
|
(5
|
)
|
0.12
|
%
|
(2
|
)
|
0.18
|
%
|
(18
|
)
|
0.14
|
%
|
(4
|
)
|
0.28
|
%
|
(39
|
)
|
0.05
|
%
|
||||||||||||||||
|
Unrealized
gains
(losses)
|
|
(3
|
)
|
-
|
-
|
-
|
-
|
(3
|
)
|
|||||||||||||||||||||||||||||||
|
Market
value
|
$
|
17
|
$
|
1
|
$
|
1
|
$
|
2
|
$
|
0
|
$
|
21
|
||||||||||||||||||||||||||||
|
Overall
credit
protection
to
B
CES
|
0.26
|
%
|
0.18
|
%
|
0.27
|
%
|
0.17
|
%
|
0.34
|
%
|
0.24
|
%
|
||||||||||||||||||||||||||||
|
Unrated
|
||||||||||||||||||||||||||||||||||||||||
|
Face
|
$
|
118
|
0.44
|
%
|
$
|
40
|
0.23
|
%
|
$
|
33
|
0.21
|
%
|
$
|
25
|
0.18
|
%
|
$
|
5
|
0.34
|
%
|
$
|
221
|
0.29
|
%
|
||||||||||||||||
|
Unamortized
discount
|
(19
|
)
|
1
|
1
|
1
|
-
|
(16
|
)
|
||||||||||||||||||||||||||||||||
|
Discount
designated
as
credit
reserve
|
(80
|
)
|
0.30
|
%
|
(38
|
)
|
0.21
|
%
|
(33
|
)
|
0.21
|
%
|
(25
|
)
|
0.22
|
%
|
(4
|
)
|
0.31
|
%
|
(180
|
)
|
0.24
|
%
|
||||||||||||||||
|
Unrealized
(losses)
gains
|
4
|
-
|
-
|
-
|
(1
|
) |
3
|
|||||||||||||||||||||||||||||||||
|
Market
value
|
$
|
23
|
$
|
3
|
$
|
1
|
$
|
1
|
$
|
0
|
$
|
28
|
||||||||||||||||||||||||||||
| u |
The
chart
on
the
prior
page
and
the
table
above
can
be
used
to
analyze
our
credit
reserves
relative
to
existing
credit
trends.
For
example,
the
chart
shows
that
serious
delinquencies
on
2004
and
prior
vintage
CES
are
currently
0.70%
of
collateral
loan
balances
at
June
30,
2008.
If
we
assume
a
default
rate
of
seriously
delinquent
loans
of
75%
and
a
loss
severity
of
40%,
total
expected
credit
losses
from
these
delinquencies
would
equal
0.21%
of
current
collateral
loan
balances.
Our
credit
reserves
on
2004
and
prior
vintage
unrated
CES
currently
total
0.30%
of
collateral
balances
(as
shown
in
the
table
above).
Under
this
scenario,
our
credit
reserves
could
absorb
the
losses
from
the
existing
seriously
delinquent
loans
at
June
30,
2008,
plus
another
0.09%
of
future
losses.
|
THE
REDWOOD REVIEW
2ND QUARTER
2008 33
|
|
|
|
RESIDENTIAL
REAL
ESTATE
SECURITIES
|
Prime
Securities
Portfolio
Quarterly
Update (continued)
| u |
The
following
chart
breaks
out
our
prime
portfolio
loan
types
by
weighted
average
interest
rate,
as
well
as
our
estimate
of
conforming
and
non-conforming
(i.e.,
jumbo)
balances
as
of
June
30,
2008.
This
chart
illustrates
how
our
portfolio
might
be
affected
by
refinancing
activity
from
a
reduction
in
interest
rates,
increases
in
GSE
conforming
loan
limits.
We
estimate
that
approximately
43%
of
the
principal
amount
of
the
jumbo
loans
in
our
portfolio
are
eligible
for
purchase
by
the
GSEs
based
only
on
the
temporary
GSE
conforming
loan
limit.
The
recently
enacted
housing
bill
changed
the
conforming
loan
limit
(effective
January
1,
2009)
to
$625,000,
and
we
estimate
that
approximately
36%
of
our
portfolio
will
be
eligible
for
purchase
by
the
GSEs
based
only
on
this
revised
GSE
conforming
loan
limit.
The
decision
by
these
borrowers
to
refinance
their
loans
will
largely
be
dependent
on
their
current
mortgage
rates
relative
to
current
rates
offered
by
the
GSEs,
the
values
of
their
homes,
the
GSE’s
underwriting
standards
and
origination
practices,
and
other
factors.
We
currently
do
not
expect
any
material
short-term
impact
on
our
existing
portfolio
from
the
new
GSE
confirming
loan
limit.
|
|
Prime
CES
at
Redwood
|
|||||||||||||||||||||||||||||||||||||
|
Composition
by
Product
Type,
Vintage,
and
Balance
|
|||||||||||||||||||||||||||||||||||||
|
June
30,
2008
(a)
|
|||||||||||||||||||||||||||||||||||||
|
<=
2004
|
2005
|
2006
|
2007
|
2008
|
Total
|
||||||||||||||||||||||||||||||||
|
Product
|
%
of
Balance
|
Wtd
Avg
Loan
Rate
|
%
of
Balance
|
Wtd
Avg
Loan
Rate
|
%
of
Balance
|
Wtd
Avg
Loan
Rate
|
%
of
Balance
|
Wtd
Avg
Loan
Rate
|
%
of
Balance
|
Wtd
Avg
Loan
Rate
|
%
of
Balance
|
Wtd
Avg
Loan
Rate
|
|||||||||||||||||||||||||
|
Hybrid
|
37%
|
4.80%
|
71%
|
5.47%
|
66%
|
6.11%
|
32%
|
6.36%
|
11%
|
6.35%
|
46%
|
5.25%
|
|||||||||||||||||||||||||
|
ARM(b)
|
|
2%
|
4.95%
|
<1%
|
5.06%
|
<1%
|
6.18%
|
<1%
|
6.41%
|
-
|
-
|
1%
|
5.00%
|
||||||||||||||||||||||||
|
Fixed
|
|
23%
|
5.66%
|
7%
|
6.03%
|
17%
|
6.38%
|
64%
|
6.45%
|
88%
|
6.54%
|
22%
|
5.88%
|
||||||||||||||||||||||||
|
Jumbo
|
|
62%
|
|
78%
|
|
83%
|
|
96%
|
|
99%
|
|
69%
|
|
||||||||||||||||||||||||
|
|
|
|
|
|
|
|
|
|
|
|
|
|
|
||||||||||||||||||||||||
|
Hybrid
|
|
14%
|
4.97%
|
20%
|
5.59%
|
16%
|
6.12%
|
<1%
|
6.35%
|
-
|
-
|
14%
|
5.26%
|
||||||||||||||||||||||||
|
ARM(b)
|
|
1%
|
5.40%
|
<1%
|
5.17%
|
-
|
-
|
<1%
|
6.40%
|
-
|
-
|
<1%
|
5.40%
|
||||||||||||||||||||||||
|
Fixed
|
|
23%
|
5.94%
|
2%
|
6.01%
|
<1%
|
6.49%
|
3%
|
6.58%
|
1%
|
6.38%
|
16%
|
5.95%
|
||||||||||||||||||||||||
|
Conforming
|
|
38%
|
|
22%
|
|
17%
|
|
4%
|
|
1%
|
|
31%
|
|
||||||||||||||||||||||||
(a)
The
product percentages
differ from
other tables
as the table
above represents
our
exposure on
a loan balance
basis and others
are on a market
value basis.
(b)
ARMs are
indexed to
one-or-six
month LIBOR
and have
a weighted
average margin
of
1.73%.
30-Year
Fixed Rates
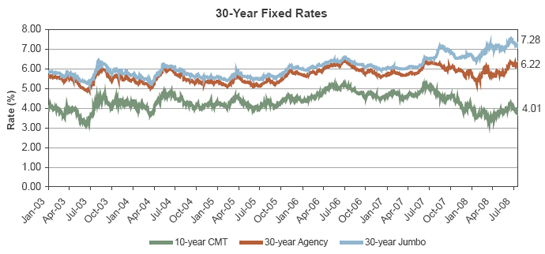
34
THE REDWOOD
REVIEW 2ND
QUARTER 2008
|
|
|
|
RESIDENTIAL
REAL
ESTATE
SECURITIES
|
Prime
Securities
Portfolio
Quarterly
Update
(continued)
5-Year
Jumbo
Hybrids
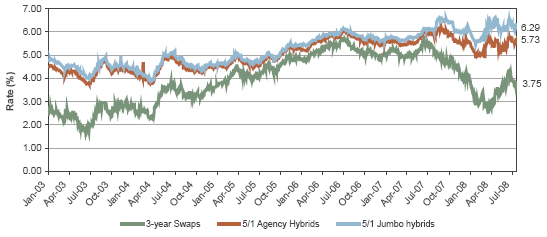
Source:
Bloomberg
& Bankrate.com
| u |
The
chart
below
shows
the
trends
in
our
residential
prime
CES
prepayment
speeds,
which
have
been
declining
for
our
adjustable-rate
mortgages
and
remain
at
low
speeds
for
our
fixed
and
hybrid
loans.
|
Residential
Prime CES
Prepayment
Speeds
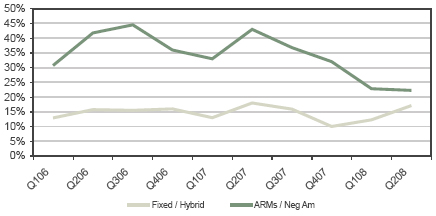
| u |
The
degree
of
refinancing
activity
is
important
to
consider,
since
our
credit
reserves
provide
protection
on
securities
that
we
have
purchased
at
a
substantial
discount
to
principal
face
value
amounts.
All
things
being
equal,
faster
prepayments
would
benefit
these
investments
by
accelerating
the
collection
of
principal
and
the
potential
recovery
of
credit
reserves.
|
THE
REDWOOD
REVIEW
2ND QUARTER
2008 35
|
|
|
|
RESIDENTIAL
REAL
ESTATE
SECURITIES
|
Prime
Securities
Portfolio
Quarterly
Update
(continued)
| u |
We
believe
the
loan
characteristics
of
our
prime
portfolio
set
forth
below
illustrate
the
high
quality
of
these
loans,
including
relatively
low
LTV
ratios
and
high
FICO
scores.
As
the
following
table
also
illustrates,
we
have
geographically
diverse
pools
of
prime
loans
that
are
generally
seasoned
over
three
years.
|
|
Residential
Prime
CES
at
Redwood
|
|||||
|
Underlying
Loan
Characteristics
|
|||||
|
June
30,
2008
|
|||||
|
|
|||||
|
Number
of
loans
|
262,263
|
Wtd
Avg
FICO
|
748
|
||
|
Total
loan
face
($
in
millions)
|
107,284
|
FICO:
621
-
660
|
4%
|
||
|
Average
loan
size
($
in
1000's)
|
$409
|
FICO:
661
-
700
|
14%
|
||
|
|
FICO:
701
-
740
|
26%
|
|||
|
Southern
CA
|
25%
|
|
FICO:
>
740
|
53%
|
|
|
Northern
CA
|
23%
|
Unknown
|
3%
|
||
|
Florida
|
5%
|
|
|
||
|
New
York
|
6%
|
Conforming
at
origination
%
|
25%
|
|
|
|
Georgia
|
2%
|
>
$1
MM
%
|
8%
|
|
|
|
New
Jersey
|
3%
|
|
|
||
|
Other
states
|
36%
|
2nd
home
%
|
6%
|
|
|
|
Investment
home
%
|
1%
|
|
|||
|
2008
origination
|
<1%
|
|
|
||
|
2007
origination
|
6%
|
Purchase
|
42%
|
|
|
|
2006
origination
|
11%
|
Cash
out
refi
|
21%
|
||
|
2005
origination
|
20%
|
Rate-term
refi
|
35%
|
||
|
2004
origination
and
earlier
|
63%
|
Other/unknown
|
2%
|
||
|
|
|||||
|
Full
doc
|
54%
|
||||
|
Wtd
Avg
Original
LTV
|
69
|
No
doc
|
7%
|
||
|
Original
LTV:
0
-
50
|
14%
|
Other
(limited,
etc)
|
37%
|
||
|
Original
LTV:
50
-
60
|
12%
|
Unknown
|
2%
|
||
|
Original
LTV:
60.
-
70
|
22%
|
|
|||
|
Original
LTV:
70
-
80
|
49%
|
2-4
family
|
1%
|
|
|
|
Original
LTV:
80
-
90
|
2%
|
Condo
|
11%
|
|
|
|
Original
LTV:
90
-
100
|
1%
|
Single
family
|
88%
|
||
36
THE REDWOOD
REVIEW
2ND QUARTER
2008
|
|
|
|
RESIDENTIAL
REAL
ESTATE
SECURITIES
|
Non-Prime
Securities
Portfolio
What
is
this?
Non-prime
securities
include
alt-a and
subprime
securities.
Beginning
this quarter,
our
non-prime
securities
also include
our option
ARM securities,
some of
which were
previously
included
in our
prime securities
portfolio.
The following
discussion
reflects
only the
non-prime
securities
at Redwood,
exclusive
of any
non-prime
securities
owned by
Acacia
or the
Opportunity
Fund.
Alt-a
securities
are residential
mortgage-backed
securities
backed
by loans
that
generally
have higher
credit-quality
characteristics
than subprime,
but lower
credit-quality
characteristics
than prime.
Subprime
securities
are residential
mortgage-backed
securities
backed
by lower-quality
loans.
Many subprime
borrowers
have impaired
credit
histories.
Quarterly
Update
| u |
The
following
table
presents
the
activity
in
our
non-prime
securities
portfolio
during
the
second
quarter
of
2008.
|
|
Non-Prime
Securities
at
Redwood
|
||||
|
Three
Months
Ended
June
30,
2008
|
||||
|
($
in
millions)
|
||||
|
Market
value
at
March
31,
2008
|
$
|
19
|
||
|
Acquisitions
|
62
|
|||
|
Transfers
to
/
from
other
portfolios
|
4
|
|||
|
Principal
payments
|
(5
|
)
|
||
|
Discount
amortization
|
1
|
|||
|
Changes
in
fair
value,
net
|
(15
|
)
|
||
|
Market
value
atJune
30,
2008
|
$
|
66
|
||
| u |
During
the
second
quarter,
we
acquired
$48
million
of
AAA-rated option
ARM
securities
at
a
weighted
average
price
of
73%
of
face
value,
and
$14
million
of
AAA-rated
subprime
securities
at
a
weighted
average
price
of
83%
of
face
value.
We
also
transferred
$4
million
of
securities
previously
classified
as
prime
option
ARM
to
the
non-prime
category.
We
did
not
acquire
any
non-prime
CES
in
the
second
quarter.
|
| u |
Total
interest
income
generated
by
our
non-prime
securities
was
$3
million
in
the
quarter,
an
annualized
yield
of
31.29%
based
on
our
average
amortized
cost
of
the
securities.
|
THE
REDWOOD
REVIEW
2ND
QUARTER
2008 37
|
|
|
|
RESIDENTIAL
REAL
ESTATE
SECURITIES
|
Non-Prime
Securities
Portfolio
Quarterly
Update
(continued)
| u |
The
table
below
presents
rating
and
vintage
information
of
the
non-prime
securities
in
our
portfolio
at
June
30,
2008.
|
|
Non-Prime
Securities
at
Redwood
|
|||||||||||||||||||
|
By
Rating
and
Vintage
|
|||||||||||||||||||
|
June
30,
2008
|
|||||||||||||||||||
|
(by
market
value,
$
in
millions)
|
|||||||||||||||||||
|
<=2004
|
|
2005
|
|
2006
|
|
2007
|
|
Total
|
|||||||||||
|
IGS
|
|||||||||||||||||||
|
AAA
|
$
|
-
|
$
|
29
|
$
|
13
|
$
|
15
|
$
|
57
|
|||||||||
|
BBB
|
-
|
-
|
-
|
1
|
1
|
||||||||||||||
|
Total
IGS
|
-
|
29
|
13
|
16
|
58
|
||||||||||||||
|
|
|||||||||||||||||||
|
CES
|
|
||||||||||||||||||
|
B
|
1
|
-
|
-
|
1
|
2
|
||||||||||||||
|
NR
|
2
|
2
|
1
|
1
|
6
|
||||||||||||||
|
Total
CES
|
3
|
2
|
1
|
2
|
8
|
||||||||||||||
|
Market
value
|
$
|
3
|
$
|
31
|
$
|
14
|
$
|
18
|
$
|
66
|
|||||||||
|
By
Loan
Type
and
Vintage
|
||||||||||||||||
|
Hybrid
|
$
|
1
|
$
|
-
|
$
|
-
|
$
|
16
|
$
|
17
|
||||||
|
Option
Arm
|
2
|
31
|
14
|
2
|
49
|
|||||||||||
|
Market
value
|
$
|
3
|
$
|
31
|
$
|
14
|
$
|
18
|
$
|
66
|
||||||
| u |
At
June
30,
2008,
88%
of
our
non-prime
portfolio
were
IGS,
which
had
an
average
of
32
points
of
credit
support
from
other
securities.
Less
than
$8
million,
or
1%
of
our
capital,
was
invested
in
non-prime
CES.
The
aggregate
fair
value
of
our
non-prime
securities
was
15%
of
principal
value.
|
| u |
Our
option
ARM
non-prime
securities
consist
of
$47
million
of
AAA-rated
IGS
and
$2
million
of
CES.
Our
hybrid
non-prime
securities
include
$9
million
of
IGS
and
$8
million
of
CES.
|
| u |
Seriously
delinquent
loans
underlying
our
non-prime
CES
were
13.29%
at
June
30,
2008.
Our
non-prime
CES
had
a
face
value
of
$319
million
and
credit
reserves
of
$297
million
($8.95
per
share)
at
June
30,
2008.
|
| u |
Our
designated
GAAP
credit
reserves
for
non-prime
CES
increased
by
$91
million
for
the
quarter
due
to
a
combination
of
the
transfer
of
our
option
ARMs
into
the
non-prime
portfolio
and
from
our
reassessment
of
credit
reserves
on
some
recent
vintage
alt-a
CES,
which
was
partially
offset
by
credit
losses.
|
38
THE
REDWOOD
REVIEW
2ND
QUARTER
2008
|
|
|
|
RESIDENTIAL
REAL
ESTATE
SECURITIES
|
Non-Prime
Securities
Portfolio
Quarterly
Update
(continued)
| u |
Prepayment
speeds
for
our
non-prime
securities
continued
to
decline.
|
Residential
Non-Prime
Option
ARM
CES
at
Redwood
Prepayment
Speeds
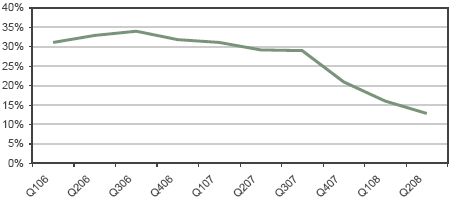
THE
REDWOOD
REVIEW
2ND
QUARTER
2008 39
 |
|
|
COMMERCIAL
REAL
ESTATE
SECURITIES
|
Commercial
Securities
Portfolio
What
is
this?
We
invest
in
securities
that
are
backed
by
pools
of
commercial
real
estate
loans.
The
following
discussion
refers
only
to
the
commercial
securities
owned
by
Redwood,
exclusive
of
any
commercial
securities
owned
by
Acacia.
Quarterly
Update
| u |
Our
commercial
securities
portfolio
declined
by
$9
million
to
$91
million
in
the
second
quarter
due
primarily
to
negative
market
value
changes.
We
have
not
purchased
any
commercial
securities
since
the
first
quarter
of
2007.
We
are
carefully
monitoring
developments
and
trends
in
commercial
real
estate
and
positioning
ourselves
to
expand
our
commercial
business
at
the
appropriate
time.
|
| u |
The
commercial
securitization
market
remained
largely
inactive
during
the
second
quarter,
reflecting
continuing
negative
investor
sentiment
over
deteriorating
fundamentals
in
the
commercial
real
estate
market.
Second
quarter
U.S.
commercial
mortgage-backed
securities
issuance
totaled
$6
billion,
down
92%
from
the
year-ago
period.
|
| u |
Financing
costs
for
property
acquisitions
remain
elevated
due
to
the
shut
down
of
the
commercial
mortgage
securitization
market
and
the
reduction
of
credit
available
from
the
commercial
banking
industry.
Tight
underwriting
standards
and
fewer
refinance
alternatives
will
likely
result
in
more
extensions
and
defaults
on
maturing
loans.
On
the
positive
side,
our
commercial
CES
is
primarily
backed
by
longer
term
fixed-rate
loans,
with
few
loans
scheduled
to
mature
in
the
near
term.
|
| u |
According
to
Fitch,
serious
delinquencies
(60+
days)
for
$566
billion
of
loans
backing
rated
CMBS
securitizations
in
the
U.S.
increased
to
0.41%
in
June
from
0.39%
in
May,
and
a
record
low
of
0.27%
in
January.
Although
total
market
delinquencies
are
increasing,
the
current
industry
rate
remains
well
below
the
historical
average
of
0.80%
according
to
Fitch.
We
expect
further
increases
in
delinquency
levels
throughout
the
year.
|
40
THE
REDWOOD
REVIEW
2ND
QUARTER
2008
|
|
|
|
COMMERCIAL
REAL
ESTATE
SECURITIES
|
Commercial
Securities
Portfolio
Quarterly
Update
(continued)
| u |
Our
commercial
securities
portfolio
consists
of
CES
investments
that
we
fund
with
equity.
The
types
of
loans
backing
these
securities
are
typically
fixed-rate
with
10-year
average
lives.
The
following
table
presents
our
commercial
securities
portfolio
by
credit
rating
and
vintage.
The
vintage
shown
is
the
year
the
securitization
was
completed
and
may
include
commercial
real
estate
loans
originated
in
an
earlier
year.
|
|
Commercial
Securities
at
Redwood
|
||||||||||||||||
|
By
Rating
and
Vintage
|
||||||||||||||||
|
June
30,
2008
|
||||||||||||||||
|
(by
market
value,
$
in
millions)
|
||||||||||||||||
|
<=
2004
|
|
2005
|
|
2006
|
|
2007
|
|
Total
|
||||||||
|
BB+
|
$
|
2
|
$
|
-
|
$
|
1
|
$
|
2
|
$
|
5
|
||||||
|
BB
|
2
|
-
|
2
|
-
|
4
|
|||||||||||
|
BB-
|
1
|
-
|
3
|
1
|
5
|
|||||||||||
|
B+
|
-
|
-
|
3
|
2
|
5
|
|||||||||||
|
B
|
-
|
-
|
1
|
1
|
2
|
|||||||||||
|
B-
|
-
|
-
|
3
|
2
|
5
|
|||||||||||
|
NR
|
10
|
18
|
32
|
5
|
65
|
|||||||||||
|
Market
value
|
$
|
15
|
$
|
18
|
$
|
45
|
$
|
13
|
$
|
91
|
||||||
| u |
Total
interest
income
generated
by
our
commercial
securities
was
$4
million
in
the
second
quarter,
which
resulted
in
an
annualized
yield
on
our
average
amortized
cost
of
15.63%.
|
| u |
The
overall
credit
performance
of
our
commercial
securities
portfolio
weakened
during
the
second
quarter.
Total
serious
delinquencies
(60
days+)
were
$390
million,
or
0.80%
of
the
$49
billion
of
commercial
loans
that
we
credit
enhance,
an
increase
from
0.42%
at
March
31,
2008.
Included
in
these
delinquencies
are
three
loans
totaling
$253
million
(or
0.56%) that
are
contained
within
securities
with
a
cumulative
market
value
of
$9
million.
|
| u |
Principal
credit
losses
on
our
commercial
CES
of
$6
million
during
the
quarter
were
charged
against
our
designated
credit
reserve.
For
tax
purposes,
realized
losses
on
commercial
securities
were
less
than
$1
million
in
the
second
quarter.
This
deduction
is
less
than
the
principal
value
of
credit
losses
incurred
on
the
underlying
loans,
as
we
own
our
commercial
CES
at
a
tax
basis
that
is
substantially
less
than
par
value.
|
| u |
When
assessing
commercial
credit
reserves,
it
is
important
to
consider
that
fixed
rate
commercial
loans
do
not
usually
prepay
like
residential
loans
due
to
various
early
refinancing
disincentives
for
borrowers.
These
loans
typically
perform
very
well
in
their
early
stages,
while
experiencing
a
greater
risk
of
default
near
maturity
when
borrowers
are
forced
to
obtain
new
financing.
Because
of
this
dynamic,
we
maintain
our
initial
credit
reserve
levels
on
commercial
CES
until
we
are
confident
that
late-term
defaults
are
highly
unlikely.
|
THE
REDWOOD
REVIEW
2ND
QUARTER
2008 41
|
|
|
|
COMMERCIAL
REAL
ESTATE
SECURITIES
|
Commercial
Securities
Portfolio
Quarterly
Update
(continued)
| u |
The
summary-level
information
below
presents
weighted-average
credit
reserve
balances
by
principal
value,
designated
by
loan
vintage
and
credit
rating.
Our
GAAP
credit
reserve
for
commercial
CES
was
$384
million
($11.57
per
share)
at
June
30,
2008.
|
|
Credit
Reserve
Analysis
-
Commercial
Portfolio
|
||||||||||||||||||||||||||||||||||
|
By
Rating
and
Vintage
|
||||||||||||||||||||||||||||||||||
|
June
30,
2008
|
||||||||||||||||||||||||||||||||||
|
($
in
millions)
|
||||||||||||||||||||||||||||||||||
|
<=2004
|
2005
|
2006
|
2007
|
Total
|
||||||||||||||||||||||||||||||
|
Amount
|
|
%
of
loans
|
Amount
|
%
of
loans
|
Amount
|
%
of
loans
|
Amount
|
%
of
loans
|
Amount
|
%
of
loans
|
||||||||||||||||||||||||
|
BB
|
||||||||||||||||||||||||||||||||||
|
Face
|
$
|
9
|
0.09
|
%
|
$
|
-
|
-
|
$
|
22
|
0.12
|
%
|
$
|
14
|
0.12
|
%
|
$
|
45
|
0.11
|
%
|
|||||||||||||||
|
Unamortized
discount
|
(1
|
)
|
-
|
(16
|
)
|
(11
|
)
|
(28
|
)
|
|||||||||||||||||||||||||
|
Discount
designated
as
credit
reserve
|
-
|
-
|
-
|
-
|
-
|
-
|
-
|
-
|
-
|
0.00
|
%
|
|||||||||||||||||||||||
|
Unrealized
gains
(losses)
|
|
(3
|
)
|
-
|
-
|
-
|
(3
|
)
|
||||||||||||||||||||||||||
|
Market
value
|
$
|
5
|
$
|
-
|
$
|
6
|
$
|
3
|
$
|
14
|
||||||||||||||||||||||||
|
Overall
credit
protection
to
BB
CES
|
3.38
|
%
|
-
|
2.09
|
%
|
1.88
|
%
|
2.33
|
%
|
|||||||||||||||||||||||||
|
|
||||||||||||||||||||||||||||||||||
|
B
|
||||||||||||||||||||||||||||||||||
|
Face
|
$
|
-
|
-
|
$
|
-
|
-
|
$
|
35
|
0.17
|
%
|
$
|
28
|
0.19
|
%
|
$
|
63
|
0.18
|
%
|
||||||||||||||||
|
Unamortized
discount
|
-
|
-
|
(27
|
)
|
(23
|
)
|
(50
|
)
|
||||||||||||||||||||||||||
|
Discount
designated
as
credit
reserve
|
-
|
-
|
-
|
-
|
(1)
|
0.00
|
%
|
-
|
0.00
|
%
|
(1)
|
0.00
|
%
|
|||||||||||||||||||||
|
Unrealized
gains
(losses)
|
|
-
|
-
|
-
|
-
|
-
|
||||||||||||||||||||||||||||
|
Market
value
|
$
|
-
|
$
|
-
|
$
|
7
|
$
|
5
|
$
|
12
|
||||||||||||||||||||||||
|
|
Overall
credit
protection
to
B
CES
|
-
|
-
|
1.45
|
%
|
1.28
|
%
|
1.38
|
%
|
|||||||||||||||||||||||||
|
|
||||||||||||||||||||||||||||||||||
|
Unrated
|
||||||||||||||||||||||||||||||||||
|
Face
|
$
|
43
|
0.58
|
%
|
$
|
124
|
0.61
|
%
|
$
|
204
|
1.08
|
%
|
$
|
39
|
0.90
|
%
|
$
|
410
|
0.81
|
%
|
||||||||||||||
|
Unamortized
discount
|
(1
|
)
|
9
|
32
|
5
|
45
|
||||||||||||||||||||||||||||
|
Discount
designated
as
credit
reserve
|
(32
|
)
|
0.44
|
%
|
(110
|
)
|
0.50
|
%
|
(203
|
)
|
1.08
|
%
|
(38
|
)
|
0.89
|
%
|
(383
|
)
|
0.76
|
%
|
||||||||||||||
|
Unrealized
(losses)
gains
|
-
|
(5
|
)
|
(1
|
)
|
(1
|
)
|
(7
|
)
|
|||||||||||||||||||||||||
|
Market
value
|
$
|
10
|
$
|
18
|
$
|
32
|
$
|
5
|
$
|
65
|
||||||||||||||||||||||||
| u |
From
the
lower
right-hand
side
of
the
table
above,
note
that
our
credit
reserves
of
$383
million
for
our
unrated
CES
were
94%
of
the
$410
million
face
value.
|
| u |
The
column
on
the
right
shows
the
market
values
for
our
BB,
B,
and
unrated
commercial
CES
at
June
30,
2008.
These
totaled
$91
million,
which
is
equal
to
18%
of
the
$518
million
face
value.
|
42
THE
REDWOOD
REVIEW
2ND
QUARTER
2008
|
|
 |
|
INVESTMENTS
IN
SEQUOIA
|
Summary
What
is
this?
Sequoia
entities are independent securitization entities that acquire residential
mortgage loans and create and issue ABS backed by these loans. Most
of the loans
that Sequoia entities acquire are prime-quality loans. Most of the
investment-grade rated ABS created by Sequoia are sold to third party
investors.
Redwood usually acquires most of the CES and occasionally acquires
the
interest-only securities (IOs). Acacia also acquires some CES, IOs,
and IGS
issued by Sequoia. Although Redwood’s investment in Sequoia entities is
relatively small and limited, the loans and ABS issued by Sequoia
are shown on
our consolidated financial statements. Redwood’s investments in these entities
do not appear on our balance sheet as an asset — rather it is reflected as the
difference between the consolidated assets of Sequoia and the consolidated
Sequoia ABS issued to third parties.
Redwood’s
credit risk is limited to its investment in the CES Redwood acquires
from the
Sequoia entities. Each Sequoia entity is independent from the others,
thus the
performance of any one Sequoia entity does not affect any other Sequoia
entity.
Over
the years,
Sequoia securitizations have created significant profits for Redwood.
These
profits have two underlying economic components: the profit or loss
created at
the time of securitization on those ABS sold to investors and the
returns earned
over time on the securities that we retained as investments. For
GAAP purposes,
both of these components are recognized over time through net interest
income.
For
the past
several years, approximately 97% of the ABS issued by Sequoia were
sold to third
parties, 2% were sold to Acacia, and 1% were sold to Redwood.
Quarterly
Update
| u |
Cash
generated by our investments in Sequoia during the second
quarter totaled
$19 million, compared to $23 million in the first quarter.
|
| u |
As
of June
30, 2008, we had 38 Sequoia transactions outstanding.
|
| u |
Due
to the
turbulence in the mortgage markets and concerns over credit
performance,
AAA buyers continue to require a much higher yield to compensate
for
actual or perceived risk. If we were to buy loans and securitize
them at
current AAA price levels, the transaction would result
in a significant
loss. Consequently, since July 2007, we have not acquired
loans and have
not completed new Sequoia securitizations. We continue
to believe the
prime non-agency securitization market will likely be one
of the first
structured markets to return; however, until housing prices
stabilize and
securitization economics improve, we do not anticipate
completing any new
Sequoia transactions.
|
| u |
The
GAAP
carrying value of Redwood’s investments in Sequoia was $140 million at
June 30, 2008. This is reflected on our balance sheet as
the difference
between residential loans of $6.4 billion and ABS issued
of $6.3 billion.
Both the loans and ABS issued are carried at their cost
basis.
|
| u |
Our
estimated
fair value of Sequoia securities that Redwood owns at June
30, 2008 was
$75 million. This consists of $56 million of IOs, $15 million
of CES, and
$4 million of IGS. We used the same valuation process to
value the Sequoia
securities as we did for third party securities (as described
on page 27).
Our IOs are all rated AAA, the IGS we own are mostly AA-rated,
and the CES
are rated BB, B, and unrated.
|
THE
REDWOOD REVIEW 2ND QUARTER
2008 43
|
|
|
|
INVESTMENTS IN SEQUOIA
|
Quarterly
Update (continued)
| u |
The
primary
difference between our GAAP carrying value and the
fair value of our
investments in Sequoia is that for several years the
loan premium
amortization expenses as calculated under GAAP have
not kept pace with
prepayments. For a portion of these loans, our GAAP
amortization method is
linked more closely to short-term interest rates. As
short-term interest
rates decline, which they did during the first quarter,
we expect premium
amortization for this portion of the loan portfolio
to increase. Loan
premium amortization expenses, a component of interest
income, was $10
million in the second quarter, up from $7 million in
the first quarter. We
ended the quarter with a $6.4 billion carrying value
of residential loans
and a principal loan balance of $6.3 billion for an
average basis of
100.55, net of credit reserves.
|
| u |
Seriously
delinquent loans increased from $84 million to $118
million in the second
quarter, an increase from 1.25% to 1.87% of current
balances and an
increase from 0.30% to 0.42% of original balance. Serious
delinquencies
increased across all vintages. Most of the loans (66%
of the Sequoia
loans) were originated in 2005 and earlier and many
of the loans in the
original pools have paid off. As a percent of the original
balances,
seriously delinquent loans are 0.42%, which compares
to a seriously
delinquent rate of 0.47% on the original balance of
loans we
credit-enhance through our prime CES portfolio. Nonetheless,
the recent
rise in delinquencies is concerning, especially for
loans originated in
2006 or later (34% of this portfolio).
|
Residential
Loans at Sequoia
Seriously
Delinquent Trends by Quarter
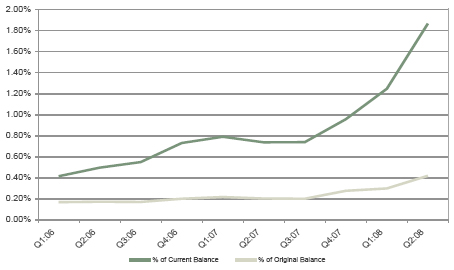
| u |
At
June 30,
2008, our loan loss reserve was $33 million, or 0.52%
of the current loan
balance, an increase of $8 million in the quarter.
Our credit provision
for loans was $10 million in the second quarter of
2008, compared to $8
million in the first quarter of 2008. The increase
in the credit provision
was attributable to higher delinquencies. We had net
charge-offs of $2
million in both the second and first quarters of 2008.
|
44
THE REDWOOD REVIEW 2ND QUARTER 2008
|
|
|
|
INVESTMENTS
IN SEQUOIA
|
Quarterly
Update (continued)
| u |
There
are
also $23 million of REO in the Sequoia entities and
these are reported at
their net realizable value.
|
| u |
As
a result
of rising delinquencies and concerns about future
performance, certain of
the ABS issued by Sequoia have been downgraded by
credit rating agencies.
Specifically, several of the ABS issued by Sequoia
entities were
downgraded. Redwood’s CES investment in these affected Sequoia entities
totals $7 million.
|
| u |
Unlike
our
investments in Acacia, our investments in Sequoia
are not subject to cash
flow disruptions due to rating downgrades. However,
many of our
investments represent the first, second, and third
loss securities and as
such will absorb the initial losses in these pools
of residential loans.
|
| u |
ARM
loans
held by Sequoia entities, representing 67% of the
aggregate loan
portfolio, are indexed to LIBOR. In the second quarter,
prepayment rates
on these loans declined to 22% constant prepayment
rate (CPR) from the
first quarter rate of 25% CPR.
|
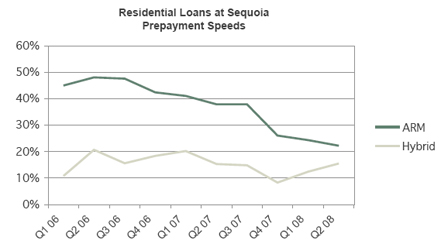
| u |
Nearly
all of
the hybrid loans held by Sequoia entities, representing
33% of the
aggregate loan portfolio, are still in their initial
fixed-rate period.
Prepayment rates on these loans increased slightly
to 15% CPR in the
second quarter from an average of 12% CPR in the
first quarter.
|
| u |
For
tax
accounting, the Sequoia securities we own are treated
like other
securities we purchase from third parties. As of
June 30, 2008, the tax
basis of our IOs was $45 million. In 2008, we expect
to recognize little
taxable income from our IOs. However, the basis in
these IOs will decline
over time as cash flows are received and the remainder
of the basis will
be expensed at the time the IOs are called.
|
| u |
We
hold call
option rights on all our Sequoia transactions. The
call option gives us
the right, but not the obligation, to retire the
ABS issued at par and
take possession of the underlying loans. Currently
we have 16 Sequoias
that are callable and one more that will likely become
callable by the end
of the year. Given the current mortgage and securitization
markets, we do
not anticipate calling any Sequoias in the near future,
and thus, there
will likely be little economic or accounting gains
or losses during this
period.
|
THE
REDWOOD REVIEW 2ND QUARTER
2008 45
|
|
|
|
INVESTMENTS IN SEQUOIA
|
| u |
The
following
table summarizes the characteristics of the loans
owned by the Sequoia
entities.
|
|
Residential
Loans at Sequoia*
|
|||||
|
Underlying
Loan Characteristics
|
|||||
|
June
30, 2008
|
|||||
|
Number
of loans
|
18,679
|
Wtd
Avg FICO
|
732
|
||
|
Total
loan face ($ in millions)
|
$6,318
|
FICO:
<= 620
|
1%
|
||
|
Average
loan size ($ in 1000's)
|
$338
|
FICO:
621 - 660
|
5%
|
||
|
FICO:
661 - 700
|
19%
|
||||
|
Southern
CA
|
15%
|
FICO:
701 - 740
|
27%
|
||
|
Northern
CA
|
11%
|
FICO:
> 741
|
48%
|
||
|
Florida
|
13%
|
|
|||
|
New
York
|
6%
|
Conforming
at origination %
|
33%
|
||
|
Georgia
|
4%
|
>
$1 MM %
|
15%
|
||
|
New
Jersey
|
4%
|
|
|||
|
Other
states
|
47%
|
2nd
home %
|
11%
|
||
|
Investment
home %
|
3%
|
||||
|
2007
origination
|
13%
|
|
|||
|
2006
origination
|
21%
|
Purchase
|
36%
|
||
|
2005
origination
|
5%
|
Cash
out refi
|
32%
|
||
|
2004
origination and earlier
|
61%
|
Rate-term
refi
|
30%
|
||
|
Other
|
2%
|
||||
|
Wtd
Avg Original LTV
|
69
|
|
|||
|
Original
LTV: 0 - 50
|
15%
|
Hybrid
|
33%
|
||
|
Original
LTV: 50 - 60
|
11%
|
Adjustable
|
67%
|
||
|
Original
LTV: 60. - 70
|
19%
|
|
|||
|
Original
LTV: 70 - 80
|
49%
|
Interest
only
|
95%
|
||
|
Original
LTV: 80 - 90
|
2%
|
Fully-amortizing
|
5%
|
||
|
Original
LTV: 90 - 100
|
4%
|
||||
| * |
Total
residential real estate loans at Sequoia excludes
REO, which is included
in our consolidated other assets at net realized
value and totaled $23
million at June
30,2008.
|
46
THE REDWOOD REVIEW 2ND QUARTER 2008
|
|
 |
|
INVESTMENTS
IN ACACIA
|
Summary
What
is
this?
Under
our
Acacia program, we re-securitize real estate securities
using bankruptcy remote
collateralized debt obligation (CDO) entities that sell
asset-backed securities
(ABS) to independent third-party investors. We typically
retain an equity
interest in the Acacia CDO entities and receive asset management
fees. We may
also retain some of the other securities created by the
Acacia entities. Our
asset management fees typically equal ten basis points
of the outstanding
principal balance of Acacia assets. These fees are paid
to us in a first or
senior priority from the cash flows of the Acacia assets.
Our equity interests
in the Acacia entities entitle us to receive the net cash
flows (i.e., the net
cash flows generated by the assets after deducting asset
management and other
fees and the money distributed to the ABS debt holders)
of those entities. Our
credit risk is limited to the amount we invested, while
the remainder of any
losses will be borne by the holders of the securities issued
by Acacia. Cash
distributions on our Acacia interests can be disrupted
based on rating agency
downgrades of the underlying collateral or due to deterioration
in collateral
performance. Our investment in each entity is separate
and independent, thus
diminished performance on one of our CDO equity interests
has no effect on our
other CDO equity interests.
Quarterly
Update
| u |
During
the
second quarter, we received cash distributions
from Acacia entities of $5
million, including $3 million from our equity
interests and $2 million
from our ABS investments. We also received $1
million of management fees.
|
| u |
We
did not
make any new equity investments or acquire any
Acacia ABS during the
second quarter of 2008.
|
Economic
Value of our Investments in Acacia Entities
| u |
We
cautioned
in the Redwood Review for the first quarter of
2008 that severe collateral
rating downgrades by Moody’s, S&P, and Fitch had placed considerable
negative pressure on the collateralization tests
for Acacia’s 9, 10, 11,
OA1, and 12. As a result of these downgrades,
we expected that the cash
flows on our equity investments in these CDO
entities would likely be
suspended in either the second quarter or shortly
thereafter. During the
second quarter, the cash flows for all of these
equity investments were
suspended.
|
| u |
In
the
Redwood Review for the first quarter of 2008,
we also indicated that we
expected to continue to receive cash flows from
our equity investments in
the remaining Acacia CDO entities (Acacia 5,
6, 7, 8 and CRE1) based on
our assessment of collateral performance and
the favorable ratio of rating
agencies actions (upgrades to downgrades) through
early May 2008. In June
and July, these five CDO entities received an
unexpected barrage of rating
agency collateral downgrades (91 downgrades).
These downgrades caused
considerable negative pressure on the collateral
tests for all these
Acacia entities. Due to the volatility surrounding
rating downgrades, we
are no longer comfortable projecting the likelihood
of or timing for
future cash distributions for our investments
in these Acacias. Although
we still expect to receive some cash flows on
some of our equity
investments, (we received $1 million in July
and we currently expect to
collect an additional $1 million during the reminder
of the third
quarter), we only include these anticipated third
quarter cash flows and
not any other future cash flows in our calculation
of economic value.
|
THE
REDWOOD REVIEW 2ND QUARTER
2008 47
|
|
|
|
INVESTMENTS IN ACACIA
|
Economic
Value of our
Investments in Acacia Entities (continued)
| u |
The
table
below shows the components of management’s estimate of economic value for
our investment in Acacia as of the end of the
second and first quarters.
|
|
Investment
in Acacia Entities
|
|||||||
|
Management's
Estimate of Economic Value
|
|||||||
|
($
in millions)
|
|||||||
|
6/30/2008
|
|
3/31/2008
|
|
||||
|
Management
fees
|
$
|
7
|
$
|
7
|
|||
|
ABS
retained or acquired
|
10
|
25
|
|||||
|
Preference
shares
|
2
|
17
|
|||||
|
Total
|
$
|
19
|
$
|
49
|
|||
| u |
Even
if
equity cash flows are shut off, we still collect
management fees, which
are senior in cash flow payment priority to
the AAA holders in each Acacia
securitization. Our estimate of the net present
value of these management
fees (discounted at 45%) was $7 million at
June 30, 2008.
|
| u |
At
June 30,
2008, we valued the Acacia ABS we previously
acquired or retained using
bid-side marks from third-parties. This process
valued these securities at
a price equal to 9% of face value, in the aggregate.
|
| u |
As
noted
earlier, the only value we have ascribed to
the preference shares is the
$2 million we expect to collect in the third
quarter.
|
| u |
As
a result
of the above adjustments, we reduced the economic
value of our investments
in Acacia to $19 million at June 30, 2008,
compared to $49 million at
March 31, 2008. At the end of the quarter,
investments in Acacia were 3%
of our capital.
|
48
THE REDWOOD REVIEW 2ND QUARTER 2008
|
|
|
|
INVESTMENTS
IN ACACIA
|
Cash
Activity
| u |
The
following
table highlights the cash activity for each
of the outstanding Acacia
entities.
|
|
Historical
Summary of Investment and Cash Activity
for Acacia
Entities
|
||||||||||||||||||||||||||||||||||
|
($
in millions)
|
||||||||||||||||||||||||||||||||||
|
Acacia
|
|
Acacia
|
|
Acacia
|
|
Acacia
|
|
Acacia
|
|
Acacia
|
|
Acacia
|
|
Acacia
|
|
Acacia
|
|
Acacia
|
|
Total
|
|
|||||||||||||
|
|
5
|
|
6
|
|
7
|
|
8
|
|
CRE1
|
|
9
|
|
10
|
|
11
|
|
OA1
|
|
12
|
|
Acacia
|
|
||||||||||||
|
Investment:
|
||||||||||||||||||||||||||||||||||
|
Investment
as of December 31, 2007
|
$
|
13
|
$
|
14
|
$
|
11
|
$
|
18
|
$
|
14
|
$
|
11
|
$
|
29
|
$
|
5
|
$
|
14
|
$
|
22
|
$
|
151
|
||||||||||||
|
Investment
3 months ended March 31, 2008
|
-
|
4
|
-
|
1
|
2
|
-
|
-
|
-
|
-
|
-
|
7
|
|||||||||||||||||||||||
|
Investment
3 months ended June 30, 2008
|
-
|
-
|
-
|
-
|
-
|
-
|
-
|
-
|
-
|
-
|
-
|
|||||||||||||||||||||||
|
Total
Investment
|
13
|
18
|
11
|
19
|
16
|
11
|
29
|
5
|
14
|
22
|
158
|
|||||||||||||||||||||||
|
Cash
Distributions Received:
|
||||||||||||||||||||||||||||||||||
|
2007
and prior
|
(7
|
)
|
(7
|
)
|
(3
|
)
|
(5
|
)
|
(2
|
)
|
(2
|
)
|
(3
|
)
|
(1
|
)
|
(2
|
)
|
(1
|
)
|
(33
|
)
|
||||||||||||
|
3
months ended March 31, 2008
|
(1
|
)
|
(1
|
)
|
(1
|
)
|
(1
|
)
|
(1
|
)
|
(1
|
)
|
(1
|
)
|
-
|
-
|
-
|
(7
|
)
|
|||||||||||||||
|
3
months ended June 30, 2008
|
(1
|
)
|
(1
|
)
|
(1
|
)
|
(1
|
)
|
(1
|
)
|
-
|
-
|
-
|
-
|
-
|
(5
|
)
|
|||||||||||||||||
|
Total
Cash Received (ex. mgmt fees)
|
(9
|
)
|
(9
|
)
|
(5
|
)
|
(7
|
)
|
(4
|
)
|
(3
|
)
|
(4
|
)
|
(1
|
)
|
(2
|
)
|
(1
|
)
|
(45
|
)
|
||||||||||||
|
Net
cash investment as of June 30, 2008
|
$
|
4
|
$
|
9
|
$
|
6
|
$
|
12
|
$
|
12
|
$
|
8
|
$
|
25
|
$
|
4
|
$
|
12
|
$
|
21
|
$
|
113
|
||||||||||||
Income
Statements
| u |
The
following
table shows the Acacia consolidated income
statements for second and first
quarters of 2008 and the second quarter of
2007.
|
|
Acacia
Consolidated Income Statement
|
||||||||||
|
Three
Months Ended
|
||||||||||
|
($
in millions)
|
||||||||||
|
6/30/2008
|
|
3/31/2008
|
|
6/30/2007
|
||||||
|
Interest
income (cash)
|
$
|
40
|
$
|
48
|
$
|
57
|
||||
|
Accretion
of discount
|
-
|
-
|
8
|
|||||||
|
Total
interest income
|
40
|
48
|
65
|
|||||||
|
Interest
expense
|
(32
|
)
|
(46
|
)
|
(52
|
)
|
||||
|
Net
interest income before MTM adjustments
|
8
|
2
|
13
|
|||||||
|
MTM
- securities and derivatives
|
(32
|
)
|
(837
|
)
|
(9
|
)
|
||||
|
MTM
- ABS issued
|
4
|
810
|
-
|
|||||||
|
Net
interest (loss) income
|
(20
|
)
|
(25
|
)
|
4
|
|||||
|
Realized
(losses) gains on sales and calls, net
|
-
|
-
|
(1
|
)
|
||||||
|
Net
(loss) income
|
$
|
(20
|
)
|
$
|
(25
|
)
|
$
|
3
|
||
| u |
As
noted
earlier, under FAS 159, there is no longer
an accretion of discount
included in interest income on Acacia assets.
In the second quarter of
2007, we recognized $8 million of discount
accretion in our interest
income. The amount of discount accretion
we would have recorded had we not
adopted FAS 159 is now reflected as a component
in the change in fair
value of the Acacia assets.
|
THE
REDWOOD REVIEW 2ND QUARTER
2008 49
|
|
|
|
INVESTMENTS IN ACACIA
|
Income
Statements
(continued)
| u |
At
Acacia,
net interest income before MVA increased
by $6 million to $8 million in
the second quarter. This increase was primarily
due to interest rate
declines on Acacia liabilities, which are
all adjustable rate, versus less
significant interest rate declines on assets,
which are 42% adjustable
rate and 58% fixed rate.
|
| u |
During
the
second quarter we received $5 million of
cash distributions from our
Acacia equity investments, but expect these
distributions to diminish
rapidly over the next few quarters. Earnings
from Acacia should also
decline.
|
| u |
All
changes
in the GAAP fair values of Acacia assets
and liabilities flow through the
income statement subsequent to our adoption
of FAS 159 on January 1, 2008.
As more fully discussed in the Accounting
Discussion in the Appendix, the
application of FAS 159 for Acacia assets
and liabilities may lead to
significant quarterly MTM earnings volatility.
In the second quarter, the
net change in the market value of the assets
and liabilities of Acacia was
a loss of $32 million.
|
Balance
Sheets
| u |
The
following
table shows the consolidated balance sheets
of the Acacia entities at June
30, 2008, March 31, 2008, and January 1,
2008 (upon the adoption of FAS
159).
|
|
Acacia
Consolidated Balance Sheet
|
||||||||||
|
($
in millions)
|
||||||||||
|
|
6/30/2008
|
|
3/31/2008
|
|
1/1/2008
|
|||||
|
Real
estate investments
|
||||||||||
|
Current
face
|
$
|
3,457
|
$
|
3,525
|
$
|
3,595
|
||||
|
Market
value discount
|
(2,532
|
)
|
(2,492
|
)
|
(1,713
|
)
|
||||
|
Other
investments
|
79
|
79
|
79
|
|||||||
|
Total
real estate and other investments
|
1,004
|
1,112
|
1,961
|
|||||||
|
Restricted
cash and other assets
|
86
|
157
|
130
|
|||||||
|
Total
assets
|
$
|
1,090
|
$
|
1,269
|
$
|
2,091
|
||||
|
ABS
issued and other liabilities
|
||||||||||
|
Current
face
|
$
|
3,231
|
$
|
3,340
|
$
|
3,404
|
||||
|
Market
value discount
|
(2,296
|
)
|
(2,294
|
)
|
(1,511
|
)
|
||||
|
Other
liabilities
|
114
|
155
|
114
|
|||||||
|
Total
Liabilities
|
1,049
|
1,201
|
2,007
|
|||||||
|
Total
investment
|
158
|
158
|
151
|
|||||||
|
Retained
earnings
|
(86
|
)
|
(58
|
)
|
(35
|
)
|
||||
|
Balance
sheet MTM adjustments
|
(31
|
)
|
(32
|
)
|
(32
|
)
|
||||
|
Total
Equity
|
41
|
68
|
84
|
|||||||
|
Total
liabilities and equity
|
$
|
1,090
|
$
|
1,269
|
$
|
2,091
|
||||
| u |
There
is a
continuing divergence between our estimate
of economic value and GAAP
carrying values even after the adoption
of FAS 159. Our reported GAAP
equity value for Acacia was $41 million
while our estimate of economic
value was $19 million. Over time, these
values will converge to zero.
|
50
THE REDWOOD REVIEW 2ND QUARTER 2008

 |
|
|
ACCOUNTING DISCUSSION
|
Accounting
Discussion
| u |
At
Redwood,
where we hold most of our securities
as available-for-sale for accounting
purposes, MTM changes that are other-than-temporary
flow through our
income statement while MTM changes
that are temporary are charged to
equity.
|
| u |
For
accounting purposes, we consolidate
the balance sheets and income
statements of the Acacia securitization
entities. On January 1, 2008, we
adopted a new accounting standard,
FAS 159, and elected to fair value
both
the assets and liabilities of the Acacia
entities. In accordance with FAS
159, we recorded a one-time, cumulative-effect
adjustment to our January
1, 2008 opening balance sheet that
decreased the carrying value of Acacia
liabilities by $1.5 billion and increased
equity. This new standard
significantly reduces the disparity
that existed between GAAP carrying
value and our previous estimates of
economic value.
|
| u |
For
Sequoia,
we are required to consolidate the
assets and liabilities, which we report
at amortized cost except
for
REO, which are reported at net realizable
value. In the second quarter we
had a negative $1 million MVA on Sequoia
REOs.
|
| u |
The
rules
regarding MTM accounting are complex
and may not be consistent across
portfolios or clearly reflect the underlying
economics. This accounting
discussion is intended to provide investors
with a better understanding of
the impact of MTM adjustments on our
reported results.
|
| u |
MTM
adjustments can result from changes
in fair values caused either by a
change in expected cash flows (i.e.
increased credit loss estimates reduce
expected cash flows), a change in market
discount rates (i.e. the market
requires a greater risk premium and/or
interest rates rise), or a
combination of both.
|
| u |
All
changes
in fair value for securities, derivatives,
or liabilities accounted for as
trading instruments or under the fair
value option of FAS 159 flow through
the income statement. These adjustments
can be either positive or negative
from period to period.
|
| u |
Our
CES and
most IGS held at Redwood and the real estate
securities held by
the Opportunity Fund are accounted
for as available-for-sale (AFS)
securities. We carry AFS securities
on our GAAP balance sheet at their
fair value. Positive changes in the
fair value of AFS securities from
period to period are always accounted
for as increases to stockholders’
equity and do not flow through our
income statement. Accounting for
negative changes in the fair value
of AFS securities from period to period
requires a three-step process involving
a combination of quantitative
andjudgmental evaluations. The ultimate
purpose of this process is to
determine whether negative MTM adjustments
represent
“other-than-temporary” (permanent) impairments, which flow
through our
GAAP income statement, or represent
“temporary” impairments, which are
recorded as a reduction of stockholders’ equity and do not flow through
our income statement.
|
52
THE REDWOOD REVIEW 2ND QUARTER 2008
|
|
|
|
ACCOUNTING
DISCUSSION
|
Accounting
Discussion
(continued)
| u |
The
diagram
below and the narrative discussion that
follows address the three-step
process for evaluating impairments on
AFS securities.
|
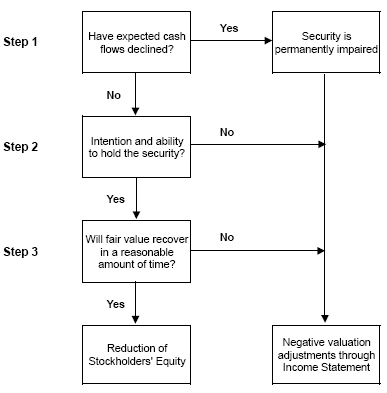
| u |
The
first
step is to determine whether there has
been an adverse change in the
underlying cash flows generated by the
security. A security is considered
permanently impaired even if the change
in projected cash flows is small
relative to the resulting MTM adjustment.
It is difficult to separate with
precision how much of the change in fair
value is driven by changes in
expected cash flows versus changes in
market discount rates, but during
periods of market illiquidity and uncertainty
(as we have encountered
since late 2007), the market discount
rate impact can be significant.
|
| u |
The
second
step is to determine whether we have
the ability and intention to hold the
security.
|
| u |
The
third
step requires us to evaluate whether
an impaired security will recover in
value within a reasonable period of time.
This step is very subjective,
particularly when there is turmoil and
uncertainty in the capital markets.
|
| u |
AFS
securities deemed permanently impaired
for accounting purposes cannot be
written back up through MTM adjustments
in our income statement. This does
not mean the underlying security could
not recover in value. If the value
of an impaired security does recover,
we would recognize this benefit
through higher interest yields over time.
Therefore, some of the
securities classified as permanently
impaired during recent quarters may
eventually prove to have significant
value to us.
|
THE
REDWOOD REVIEW 2ND QUARTER
2008 53
|
|
|
|
ACCOUNTING DISCUSSION
|
Accounting
Discussion
(continued)
| u |
The
consolidated Sequoia assets are accounted
for on our GAAP balance sheet as
held-for-investment and are carried
at their unpaid principal balances
adjusted for net amortized premiums
or discounts and net of any allowances
for credit losses. The consolidated
Sequoia liabilities are accounted for
at their unpaid principal balances
net of any amortized premiums or
discounts.
|
| u |
Prior
to
January 1, 2008, we accounted for
the consolidated securities held
at
Acacia entities (the assets) as AFS
and the consolidated ABS issued by
Acacia entities (the liabilities)
at cost. In our opinion, this difference
in accounting treatment led to a
significant discrepancy in the GAAP
carrying value for our investment
in Acacia entities and our estimate
of
economic value.
On
January 1,
2008, we adopted a new accounting
standard, FAS 159, and elected to
fair
value both the assets and liabilities
of the Acacia entities. In
accordance with FAS 159, we recorded
a one-time, cumulative-effect
adjustment to our January 1, 2008
opening balance sheet that decreased
the
carrying value of Acacia liabilities
by $1.5 billion and increased equity.
This new standard significantly reduces
the disparity that existed between
GAAP carrying value and our previous
estimates of economic
value.
|
| u |
Under
FAS
159, we are required to flow through
our quarterly income statement any
net change in the fair value of Acacia
assets and liabilities. As a result
of the measurement techniques required
by FAS 159, we still expect to
encounter some MTM earnings volatility
in the future as a result of the
consolidation of Acacia entities. During
the
second quarter of 2008, the fair value
of our assets and derivatives
declined by $32 million and the fair
value of our paired liabilities
declined by $4 million, for a net change
of a negative $28
million.
|
| u |
The
net GAAP
carrying value of our investments in
Acacia in our financial statements
is
derived by subtracting the fair value
of Acacia’s liabilities from the
fair value of Acacia’s assets. In theory, fair values of
Acacia’s assets
and liabilities should be reasonably
correlated as they are paired within
the same legal structure. ABS issued
by each Acacia entity will be repaid
directly and solely from the cash flows
generated by the assets owned by
that entity. However, at any given
moment, the capital markets may use
different discount rates and valuation
parameters for Acacia’s collateral
assets relative to its ABS issued.
On
June 30,
2008, the derived net GAAP carrying
value of our retained Acacia
investments was $41 million. This
valuation was greater than our $19
million estimate of the fair value
based on the value of the ABS acquired
or retained using bid-side marks
from third parties, plus the net
present
value of projected cash flows from
our Acacia management fees discounted
at 45% and the cash received in July
and we expect to receive in August
and September from equity interest
distributions. We did not ascribe
any
value to potential future distributions
from our equity interests, as more
fully discussed in the Investments
in Acacia
module.
|
54
THE REDWOOD REVIEW 2ND QUARTER 2008
|
|
 |
|
GLOSSARY
|
NOTE:
Not all
companies and analysts calculate non-GAAP
measures in the same fashion. As a
result, certain measures as calculated by
Redwood may not be comparable to
similarly titled measures reported by other
companies.
ACACIA
Acacia
is the brand
name for the collateralized debt obligation
(CDO) securitizations Redwood
sponsors. The underlying pool of assets for
these CDO securitizations generally
consists of IGS and, in some pools, some
below-investment-grade rated
securities. The securities are backed by
residential prime, alt-a, and subprime
real estate loans, and commercial real estate
loans. Acacia also owns related
assets such as CDO securities issued by other
real estate oriented CDOs,
corporate debt issued by equity REITs, commercial
real estate loans, and
synthetic assets derived from real estate
assets. Redwood typically acquires a
portion of the CDO credit-enhancement (or
“equity”) securities issued by Acacia;
these are the securities that are in the
first-loss (highest risk) position with
respect to absorbing any credit losses that
may occur within the assets owned by
the Acacia entities. Redwood may also retain
or acquire Acacia ABS issued.
Redwood also earns asset management fees
for ongoing management of the Acacia
entities.
ADJUSTABLE-RATE
MORTGAGES (ARMs)
Adjustable-rate
mortgages are loans that have coupons that
adjust at least once per year. We
make a distinction between ARMs (loans with
a rate adjustment at least annually)
and hybrids (loans that have a fixed-rate
period of two to ten years and then
become adjustable-rate).
ALT-A
SECURITIES
Alt-a
securities
are residential mortgage-backed securities
backed by loans that have higher
credit quality than subprime and lower credit
quality than prime. Alt-a
originally represented loans with alternative
documentation, but the definition
has shifted over time to include loans with
additional risk characteristics and
a higher percentage of investor loans. In
an alt-a loan, the borrower’s income
may not be verified, and in some cases, may
not be disclosed on the loan
application. Alt-a loans may also have expanded
criteria that allow for higher
debt-to-income ratios with higher accompanying
loan-to-value ratios than would
otherwise be permissible for prime loans.
ASSET-BACKED
SECURITIES (ABS)
ABS
are securities
backed by financial assets that generate
cash flows. Each ABS issued from a
securitization entity has a unique priority
with respect to receiving principal
and interest cash flows and absorbing any
credit losses from the assets owned by
the entity.
BOOK
VALUE
Book
value is the
value of our common equity. As measured for
GAAP, through December 31, 2007,
reported book value generally incorporated
mark-to-market adjustments for
securities and interest rate agreements,
but not for loans or liabilities.
Beginning January 1, 2008, book value as
measured for GAAP includes
mark-to-market adjustments on certain assets
and liabilities. We may also report
management’s estimate of economic value, which is management’s estimate of the
fair value of its investments net of liabilities.
COLLATERALIZED
DEBT OBLIGATION (CDO) SECURITIZATIONS
The
securitization
of a diverse pool of assets. See “Acacia.”
THE
REDWOOD REVIEW 2ND QUARTER
2008 55
|
|
|
|
GLOSSARY
|
CDO
EQUITY
SECURITIES
CDO
equity
securities (or CDO CES) are credit-enhancement
securities that bear the initial
credit losses of the assets owned by CDO
securitization entities.
COMMERCIAL
B-NOTE LOANS
Commercial
b-note
loans are structured loans that are subordinated
to the more senior portions of
loans secured by the same commercial real
estate property.
COMMERCIAL
MEZZANINE LOANS
Commercial
mezzanine loans are junior subordinated
loans that are not secured by a lien on
commercial real estate; rather, they are
secured by a pledge from an entity by
its equity interests in commercial real
estate.
COMMERCIAL
WHOLE LOANS
Commercial
whole
loans are unsecuritized first-lien loans
that are secured by commercial real
estate.
CONDUIT
A
conduit is an
entity that acquires closed loans from
originators, accumulates loans over a
period, and sells these loans, seeking
to generate a gain on sale. Sales are
usually made via securitization, but also
can be made through bulk whole loan
sales.
CORE
EARNINGS
Core
earnings is
not a measure of earnings in accordance
with GAAP. In calculating core earnings,
we attempt to strip some of the elements
out of GAAP income that we believe are
temporary, one-time, or non-economic
in nature, or that primarily relate to
the
past with little relevance to the future.
In calculating core earnings, we are
trying to show the trend of underlying
ongoing earnings. For example, we sell
assets from time to time as part of our
ongoing portfolio management activities.
These sales can produce material gains
and losses that can obscure the
underlying trend of our long-term portfolio
earnings. Thus, we exclude realized
gains and losses resulting from asset
sales and calls that are included in
GAAP
income. Similarly, we exclude gains from
calls of residential credit-enhancement
securities, as these are essentially
sales of assets. GAAP income also include
mark-to-market income and expenses for
some of our assets and interest rate
agreements. These are unrealized fair
value fluctuations, and we exclude them
from core earnings. Core earnings also
exclude other one-time expenses such
as
severance.
CORE
EQUITY
(CORE BOOK VALUE)
Core
equity is not
a measure calculated in accordance with
GAAP. GAAP equity includes
mark-to-market adjustments for some of
our assets and interest rate agreements
(“accumulated other comprehensive income”). Core equity excludes these
mark-to-market adjustments. Core equity
in some ways approximates what our
equity value would be if we used historical
amortized cost accounting
exclusively. A reconciliation of core equity
to GAAP equity appears in Table 2
of the Appendix.
CONSTANT
(OR CONDITIONAL) PREPAYMENT RATE (CPR)
Constant
(or
conditional) prepayment rate (CPR) is an
industry-standard measure of the speed
at which mortgage loans prepay. It approximates
the annual percentage rate at
which a pool of loans is paying down due
to principal prepayments.
CREDIT-ENHANCEMENT
SECURITIES (CES)
Credit-enhancement
securities (CES) absorb the initial credit
losses generated by a pool of
securitized assets. As a result, the more
senior securities issued from that
securitization are credit-enhanced because
they carry less credit risk. Our
definition of CES includes all the below
investment-grade rated bonds issued
from a securitization. These securities
are also referred to as subordinated
securities or B-pieces. For a typical securitization
of prime residential loans,
there are three CES: the first-loss, second-loss,
and third-loss bonds. The
first-loss security takes the initial risk
of credit loss. If credit losses
within the securitized asset pool exceed
the principal value of the first-loss
security, the second-loss security is at
risk. If cumulative losses exceed the
principal value of the first- and second-loss
securities, then the third-loss
security is at risk. Generally, for these
securitizations, the third-loss
security has a credit rating of BB, the
second-loss security has a credit rating
of B, and the first-loss security is unrated.
Other types of securitizations,
such as commercial, CDO, subprime residential,
and some alt-a residential
transactions, may be structured differently.
Nevertheless, the non-investment
grade rated securities issued from these
securitizations function as
credit-enhancement securities in these
transactions.
56
THE REDWOOD REVIEW 2ND QUARTER 2008
|
|
|
|
GLOSSARY
|
GAAP
Generally
Accepted
Accounting Principles in the United States.
GSEs
(GOVERNMENT-SPONSORED ENTERPRISES)
GSEs
are
government-sponsored enterprises, including
the Federal National Mortgage
Association (Fannie Mae) and the Federal
Home Loan and Mortgage Corporation
(Freddie Mac).
INTEREST-ONLY
SECURITIES (IOs)
Interest-only
securities (IOs) are specialized securities
created by securitization entities
where the projected cash flows generated
by the underlying assets exceed the
cash flows projected to be paid to the
ABS issued that have principal balances.
They receive interest payments calculated
by a formula wherein cash flows on IOs
vary as a function of interest payments
generated by the underlying assets
within a securitization or as a function
of the spread between the yield on the
loans owned by a securitization entity
and the cost of funds of the securities
issued by that entity. Typically, IOs
do not have a principal balance and they
will not receive principal payments.
Interest payments to IOs usually equal
an
interest rate formula multiplied by a
“notional” principal balance. The notional
principal balances for IOs are typically
reduced over time as the actual
principal balances of the underlying
pools of assets pay down, thus reducing
the
cash flows to the IOs over time. Cash
flows on IOs are typically reduced more
quickly if asset prepayments accelerate.
LEVERAGE
RATIOS
We
use
collateralized debt to finance the accumulation
of assets prior to sale to a
securitization entity and to finance
investments in high-quality loans and
IGS.
We currently have very low levels of
recourse debt. However, because of the
consolidation of independent securitization
entities, it appears on our GAAP
consolidated financial statements that
Redwood is highly leveraged, with total
consolidated liabilities significantly
greater than equity. The obligations
of
these securitization entities are not
obligations of Redwood. When determining
Redwood’s financial leverage, traditional leverage
ratios may be misleading in
some respects if consolidated ABS issued
from securitization entities are
included as part of Redwood’s obligations when calculating this or
similar
ratios.
LONG-TERM
DEBT AT REDWOOD
Long-term
debt at
Redwood is
debt that is an
obligation of Redwood that is not payable
within a year and includes
junior
subordinated notes and trust preferred
securities. We generally treat
long-term debt as part of our capital
base when it is not payable in the near
future. We may issue other forms of long-term
debt in the future.
MARK-TO-MARKET
ACCOUNTING
Mark-to-market
accounting uses estimated fair values
of assets, liabilities, and hedges. Many
of our assets are carried on our balance
sheet at their fair value rather than
historical amortized cost. Through December
31, 2007 changes in the fair value
of some of our assets and hedges are
reported through our income statement.
Beginning January 1, 2008 we began to
use mark-to-market accounting for income
statement purposes for a wider variety
of assets and liabilities. This will
likely make quarter-to-quarter GAAP income
trends more volatile. Taxable income
is generally not affected by market valuation
adjustments.
THE
REDWOOD REVIEW 2ND QUARTER
2008 57
|
|
|
|
GLOSSARY
|
NEGATIVE
AMORTIZATION ADJUSTABLE-RATE MORTGAGES
(NEG
AM
ARMs, OPTION ARMs, OR MTA ARMs)
Negative
amortization ARMs (neg am ARMs, option
ARMs, pay option ARMs, or monthly
treasury average (MTA) ARMs) are adjustable-rate
mortgages that allow the
borrower to choose between different
payment options. These options allow
the
borrower to make minimum payments,
or other payments that are less than
the
interest accrued on the mortgage during
that period. As a result of this
feature, the borrower’s loan balance may increase, causing
negative amortization
of the loan balance.
NET
INTEREST MARGIN SECURITIES (NIMs)
Net
interest margin
securities (NIMs) are securities backed
by cash flows that otherwise would
be
payable to the residual security. Through
a new securitization, cash flows are
diverted from the residual to pay the
NIM principal in addition to paying
a
coupon on the NIM, and thus, NIMs tend
to have short-averaged lives. Ratings
on
NIMs can range from AAA to single-B.
NON-PRIME
SECURITIES
Non-prime
securities are alt-a and subprime securities.
See definitions of alt-a and
subprime securities.
OPTION
ARMs
See
negative
amortization adjustable-rate mortgages.
OTHER
REAL
ESTATE INVESTMENTS
Other
real estate
investments (OREI) include IOs, NIMs,
and residuals. We have elected to classify
these investments as trading instruments
under GAAP. These assets are reported
at fair value with changes in fair
values recognized in our income statements.
PRIME
RESIDENTIAL REAL ESTATE LOANS
Prime
loans are
residential loans with high quality
credit characteristics, such as borrowers
with high FICO credit scores, lower
loan-to-value ratios, lower debt-to-income
ratios, greater levels of other assets,
and more documentation.
PRIME
SECURITIES
Prime
securities
are residential mortgage-backed securities
backed by high credit-quality loans,
generally with balances greater than
conforming loan limits. Prime securities
are typically backed by loans that
have relatively high weighted average
FICO
scores (700 or higher), low weighted
average LTVs (75% or less), limited
concentrations of investor properties,
and low percentages of loans with low
FICO or high LTV.
PROFITABILITY
RATIOS
Many
financial
institution analysts use asset-based
profitability ratios such as interest
rate
spread and interest rate margin when
analyzing financial institutions. These
are
asset-based measures. Because we consolidate
the assets and liabilities of
securitization entities for GAAP purposes,
our total GAAP assets and liabilities
may vary over time, and may not be
comparable in economic reality to assets
typically used in profitability calculations
for other financial institutions.
As a result, we believe equity-based
profitability ratios may be more
appropriate than asset-based measures
for analyzing Redwood’s operations. We
believe, for example, that net interest
income as a percentage of equity is
a
useful measure of profitability. For
operating expenses, we believe useful
measures are operating efficiency ratio
(operating expenses as a percentage
of
net interest income) and operating
expenses as a percentage of equity.
58
THE REDWOOD REVIEW 2ND QUARTER 2008
|
|
|
|
GLOSSARY
|
REAL
ESTATE
INVESTMENT TRUST (REIT)
A
REIT is an entity
that makes a tax election to be taxed
as a REIT, invests in real estate
assets,
and meets other REIT qualifications,
including the distribution as dividends
of
at least 90% of REIT taxable income.
A REIT’s profits are not taxed at the
corporate level to the extent that
these profits are distributed as
dividends to
stockholders, providing an operating
cost savings. On the other hand,
the
requirement to pay out as dividends
most of the REIT profits means it
can be
harder for a REIT to grow if using
only internally-generated funds (as
opposed
to issuing new stock).
REDWOOD
DEBT
Debt
that is an
obligation of Redwood. See Long-term
Debt at Redwood and Short-term
Debt at
Redwood.
REIT
RETAINED TAXABLE INCOME
REIT
retained
taxable income is not a measure calculated
in accordance with GAAP. REIT
retained taxable income is the taxable
income earned at the REIT after dividend
distributions to our shareholders,
less corporate income taxes paid
at the REIT
level. A reconciliation of REIT retained
taxable income to GAAP income appears
in Table 3 in the Appendix.
REIT
SUBSIDIARY
A
REIT subsidiary
is a subsidiary of a REIT that is
taxed as a REIT.
REIT
TAXABLE INCOME
REIT
taxable income
is not a measure calculated in accordance
with GAAP. REIT taxable income is
pre-tax income calculated for tax
purposes at Redwood including only
its REIT
subsidiaries (i.e., excluding its
taxable subsidiaries). REIT taxable
income is
an important measure as it is the
basis of our dividend distribution
requirements. We must distribute
at least 90% of REIT taxable income
as
dividends to shareholders over time.
As a REIT, we are not subject to
corporate
income taxes on the REIT taxable
income we distribute. We pay income
tax on the
REIT taxable income we retain (up
to 10% of total REIT taxable income).
A
reconciliation of REIT taxable income
to GAAP income appears in Table 3
in the
Appendix.
RESIDUALS
Residuals
are
first-loss securities that are not
rated by a rating agency. Residuals
are
called such because they get the
last (or residual) claim on the cash
flow from
a securitization after ABS debt interest
expense, losses, and servicing fees
have been deducted from the interest
paid by the underlying assets. The
value of
residual securities can vary greatly
and is highly dependent on prepayment
speeds. The value is also dependent
on the level and timing of credit
losses,
but often is not as sensitive to
losses as it is to prepayment speeds.
These
securities perform poorly when prepayments
are fast and losses are higher than
expected.
RETURN
ON
EQUITY (ROE) AND ADJUSTED RETURN
ON EQUITY
ROE
is the amount
of profit we generate each year per
dollar of equity capital and equals
GAAP
income divided by GAAP equity. Adjusted
ROE is GAAP income divided by core
equity. Core equity excludes balance
sheet mark-to-market adjustments.
Thus,
only those market value changes that
are included in our income statement
will
affect adjusted ROE. A reconciliation
of ROE to adjusted ROE appears in
Table 7
in the Appendix.
SEQUOIA
Sequoia
is the
brand name for securitizations of
residential real estate loans Redwood
sponsors.
THE
REDWOOD REVIEW 2ND QUARTER
2008 59
|
|
|
|
GLOSSARY
|
SHORT-TERM
DEBT AT REDWOOD
Short-term
debt at
Redwood is debt that is an obligation
of Redwood payable within a year. We
obtain this debt from a variety
of Wall Street firms, banks, and
other
institutions. As another form of short-term debt, we have issued
collateralized commercial paper
in the past and may issue other
forms
of short-tem debt in the future.
SUBPRIME
SECURITIES
Subprime
securities
are residential mortgage-backed
securities backed by loans to borrowers
who have
impaired credit histories, and
who appear to exhibit the ability
to repay the
current loan. Typically, these
borrowers have lower credit scores
and/or other
credit deficiencies that prevent
them from qualifying for prime
or alt-a
mortgages and may have experienced
credit problems in the past, such
as late
payments or bankruptcies. To compensate
for the greater risks and higher
costs
to service the loans, subprime
borrowers pay higher interest rates,
points, and
origination fees.
Typical
characteristics of subprime loan
pools include more than 60% of
loans with FICO
scores below 680, weighted average
LTVs over 85%, more than 70% of
loans with
LTVs over 75%, and loans with LTVs
over 80% with no mortgage insurance.
TAXABLE
SUBSIDIARY
A
taxable
subsidiary is a subsidiary of a
REIT that is not taxed as a REIT
and thus pays
taxes on its income. A taxable
subsidiary is not limited to investing
in real
estate and it can choose to retain
all of its after-tax profits.
TOTAL
RETAINED TAXABLE INCOME
Total
retained
taxable income is not a measure
calculated in accordance with GAAP.
Total
retained taxable income is the
taxable income earned at the REIT
after dividend
distributions to shareholders and
taxes. It also includes all of
the taxable
income earned at our taxable subsidiaries,
less corporate income taxes paid,
as
we generally retain the after-tax
income at the subsidiary level.
A
reconciliation of total retained
taxable income to GAAP income appears
in Table
3 in the Appendix.
TOTAL
TAXABLE INCOME
Total
taxable
income is not a measure calculated
in accordance with GAAP. Total
taxable income
is pre-tax income for Redwood and
all its subsidiaries as calculated
for tax
purposes. Taxable income calculations
differ significantly from GAAP
income
calculations. A reconciliation
of total taxable income to GAAP
income appears in
Table 3 in the Appendix.
60
THE REDWOOD REVIEW 2ND QUARTER
2008

|
|
Table
1: GAAP Earnings ($ in thousands, except per share
data)
|
62
|
|
Six
|
Six
|
|||||||||||||||||||||||||||||||||
|
2008
|
2008
|
2007
|
2007
|
2007
|
2007
|
2006
|
2006
|
2006
|
Months
|
Months
|
||||||||||||||||||||||||
|
Q2
|
Q1
|
Q4
|
Q3
|
Q2
|
Q1
|
Q4
|
Q3
|
Q2
|
2008
|
2007
|
||||||||||||||||||||||||
|
Interest
income
|
$140,445
|
$171,977
|
$193,728
|
$207,023
|
$208,708
|
$210,372
|
$213,504
|
$217,504
|
$214,544
|
$312,422
|
$419,080
|
|||||||||||||||||||||||
|
Net
securities discount amortization income
|
6,258
|
10,864
|
18,869
|
20,514
|
23,849
|
20,268
|
18,665
|
17,842
|
13,234
|
17,122
|
44,117
|
|||||||||||||||||||||||
|
Other
investment interest income
|
514
|
732
|
984
|
1,143
|
464
|
-
|
-
|
-
|
-
|
1,246
|
464
|
|||||||||||||||||||||||
|
Net
loan premium amortization expense
|
(10,215
|
)
|
(7,509
|
)
|
(6,656
|
)
|
(8,349
|
)
|
(10,863
|
)
|
(11,705
|
)
|
(13,272
|
)
|
(11,232
|
)
|
(12,046
|
)
|
(17,724
|
)
|
(22,568
|
)
|
||||||||||||
|
(Provision
for) reversal of credit reserve
|
(10,061
|
)
|
(8,058
|
)
|
(4,972
|
)
|
(1,507
|
)
|
(2,500
|
)
|
(3,829
|
)
|
(1,506
|
)
|
(465
|
)
|
2,506
|
(18,119
|
)
|
(6,329
|
)
|
|||||||||||||
|
Total
GAAP interest income
|
126,941
|
168,006
|
201,953
|
218,824
|
219,658
|
215,105
|
217,391
|
223,649
|
218,238
|
294,947
|
434,764
|
|||||||||||||||||||||||
|
Management
fee income
|
1,319
|
1,613
|
1,866
|
1,893
|
1,481
|
1,168
|
993
|
928
|
645
|
2,932
|
2,649
|
|||||||||||||||||||||||
|
Short-term
debt - Redwood
|
(68
|
)
|
(182
|
)
|
(377
|
)
|
(5,858
|
)
|
(22,700
|
)
|
(31,094
|
)
|
(16,520
|
)
|
(9,422
|
)
|
(1,822
|
)
|
(250
|
)
|
(53,794
|
)
|
||||||||||||
|
|
||||||||||||||||||||||||||||||||||
|
ABS
interest expense consolidated from trusts
|
(95,313
|
)
|
(125,042
|
)
|
(149,665
|
)
|
(157,554
|
)
|
(141,993
|
)
|
(132,561
|
)
|
(153,036
|
)
|
(166,105
|
)
|
(172,304
|
)
|
(220,355
|
)
|
(274,554
|
)
|
||||||||||||
|
ABS
issuance expense amortization
|
(1,921
|
)
|
(2,093
|
)
|
(4,644
|
)
|
(4,616
|
)
|
(5,681
|
)
|
(7,068
|
)
|
(7,897
|
)
|
(5,786
|
)
|
(6,079
|
)
|
(4,014
|
)
|
(12,749
|
)
|
||||||||||||
|
ABS
interest rate agreement income
|
(1,246
|
)
|
(1,245
|
)
|
1,265
|
1,959
|
3,358
|
1,646
|
2,497
|
3,317
|
3,678
|
(2,491
|
)
|
5,004
|
||||||||||||||||||||
|
ABS
issuance premium amortization income
|
1,955
|
2,183
|
1,930
|
2,096
|
2,294
|
1,869
|
1,529
|
2,395
|
2,363
|
4,138
|
4,163
|
|||||||||||||||||||||||
|
Total
consolidated ABS expense
|
(96,525
|
)
|
(126,197
|
)
|
(151,114
|
)
|
(158,115
|
)
|
(142,022
|
)
|
(136,114
|
)
|
(155,914
|
)
|
(165,251
|
)
|
(171,697
|
)
|
(222,722
|
)
|
(278,136
|
)
|
||||||||||||
|
Long-term
debt - Redwood
|
(2,233
|
)
|
(2,533
|
)
|
(3,055
|
)
|
(3,150
|
)
|
(2,516
|
)
|
(2,056
|
)
|
(423
|
)
|
-
|
-
|
(4,766
|
)
|
(4,572
|
)
|
||||||||||||||
|
GAAP
net interest income before market valuation adjustments
|
29,434
|
40,707
|
49,273
|
53,594
|
53,901
|
47,009
|
44,534
|
48,976
|
44,719
|
70,141
|
100,910
|
|||||||||||||||||||||||
|
Market
valuation adjustments, net
|
(60,619
|
)
|
(193,932
|
)
|
(1,118,989
|
)
|
(102,766
|
)
|
(29,430
|
)
|
(10,264
|
)
|
(1,404
|
)
|
(5,257
|
)
|
(2,995
|
)
|
(254,551
|
)
|
(39,694
|
)
|
||||||||||||
|
Net
interest (loss) income
|
(31,185
|
)
|
(153,225
|
)
|
(1,069,716
|
)
|
(49,172
|
)
|
24,471
|
36,745
|
43,130
|
43,719
|
41,724
|
($184,410
|
)
|
$61,216
|
||||||||||||||||||
|
Fixed
compensation expense
|
(4,648
|
)
|
(5,674
|
)
|
(4,316
|
)
|
(4,560
|
)
|
(4,286
|
)
|
(4,616
|
)
|
(3,688
|
)
|
(3,437
|
)
|
(3,310
|
)
|
(10,322
|
)
|
(8,902
|
)
|
||||||||||||
|
Variable
compensation expense
|
(330
|
)
|
(1,857
|
)
|
(434
|
)
|
1,096
|
(198
|
)
|
(2,251
|
)
|
(1,666
|
)
|
(2,630
|
)
|
(1,900
|
)
|
(2,187
|
)
|
(2,449
|
)
|
|||||||||||||
|
Equity
compensation expense
|
(3,502
|
)
|
(3,306
|
)
|
(2,767
|
)
|
(2,593
|
)
|
(3,540
|
)
|
(3,349
|
)
|
(3,233
|
)
|
(2,579
|
)
|
(2,991
|
)
|
(6,808
|
)
|
(6,889
|
)
|
||||||||||||
|
Severance
expense
|
-
|
-
|
(1,340
|
)
|
-
|
-
|
(2,380
|
)
|
-
|
-
|
-
|
-
|
(2,380
|
)
|
||||||||||||||||||||
|
Other
operating expense
|
(5,767
|
)
|
(5,502
|
)
|
(7,337
|
)
|
(5,455
|
)
|
(4,670
|
)
|
(4,479
|
)
|
(4,732
|
)
|
(4,425
|
)
|
(5,149
|
)
|
(11,269
|
)
|
(9,149
|
)
|
||||||||||||
|
Due
diligence expenses
|
(8
|
)
|
(10
|
)
|
(75
|
)
|
(220
|
)
|
(78
|
)
|
(707
|
)
|
(532
|
)
|
(384
|
)
|
(2,687
|
)
|
(18
|
)
|
(785
|
)
|
||||||||||||
|
Total
GAAP operating expenses
|
(14,255
|
)
|
(16,349
|
)
|
(16,269
|
)
|
(11,732
|
)
|
(12,772
|
)
|
(17,782
|
)
|
(13,851
|
)
|
(13,455
|
)
|
(16,037
|
)
|
(30,604
|
)
|
(30,554
|
)
|
||||||||||||
|
Realized
gains (losses) sales
|
2,909
|
(3
|
)
|
7,199
|
(1,460
|
)
|
1,428
|
303
|
5,308
|
4,968
|
8,241
|
2,906
|
1,731
|
|||||||||||||||||||||
|
Realized
(losses) gain on calls
|
(72
|
)
|
45
|
(126
|
)
|
3,284
|
1,310
|
843
|
1,511
|
722
|
747
|
(27
|
)
|
2,153
|
||||||||||||||||||||
|
Total
realized gains, net
|
2,837
|
42
|
7,073
|
1,824
|
2,738
|
1,146
|
6,819
|
5,690
|
8,988
|
2,879
|
3,884
|
|||||||||||||||||||||||
|
Minority
interest in Opportunity Fund
|
(2,369
|
)
|
(255
|
)
|
-
|
-
|
-
|
-
|
-
|
-
|
-
|
(2,624
|
)
|
-
|
||||||||||||||||||||
|
(Provision)
credit for income taxes
|
(937
|
)
|
(1,800
|
)
|
1,467
|
(1,837
|
)
|
(3,021
|
)
|
(1,800
|
)
|
(407
|
)
|
(3,538
|
)
|
(3,265
|
)
|
(2,737
|
)
|
(4,821
|
)
|
|||||||||||||
|
GAAP
net (loss) income
|
($45,909
|
)
|
($171,587
|
)
|
($1,077,445
|
)
|
($60,917
|
)
|
$11,416
|
$18,309
|
$35,691
|
$32,416
|
$31,410
|
($217,496
|
)
|
$29,725
|
||||||||||||||||||
|
Diluted
average shares
|
32,871
|
32,511
|
29,531
|
27,892
|
28,165
|
27,684
|
27,122
|
26,625
|
26,109
|
32,691
|
27,918
|
|||||||||||||||||||||||
|
GAAP
net (loss) income per share
|
($1.40
|
)
|
($5.28
|
)
|
($36.49
|
)
|
($2.18
|
)
|
$0.41
|
$0.66
|
$1.32
|
$1.22
|
$1.20
|
$
(6.65
|
)
|
$1.06
|
||||||||||||||||||
|
THE
REDWOOD
REVIEW
2ND
QUARTER
2008
|
Table
1: GAAP
Earnings
|
|