
 |
 |
|
TABLE
OF CONTENTS
|
|
Introduction
|
2
|
|||
|
Shareholder
Letter
|
3
|
|||
|
Quarterly
Overview
|
4
|
|||
|
Financial
Insights
|
8
|
|||
|
-
Components
of Book Value
|
8
|
|||
|
-
Consolidating Balance Sheet
|
10
|
|||
|
-
Real Estate
Securities at Redwood
|
11
|
|||
|
-
Cash
Flow
|
13
|
|||
|
GAAP
Income
|
16
|
|||
|
Taxable
Income
|
19
|
|||
|
Dividends
|
21
|
|||
|
Capital
&
Liquidity
|
22
|
|||
|
Mark-to-Market
Adjustments
|
24
|
|||
|
Residential
Real Estate Securities
|
29
|
|||
|
Commercial
Real Estate Securities
|
40
|
|||
|
Investments
in Sequoia
|
43
|
|||
|
Investments
in Acacia
|
47
|
|||
|
Appendix
|
||||
|
Accounting
Discussion
|
50
|
|||
|
Glossary
|
53
|
|||
|
Financial
Tables
|
60
|
|||
THE
REDWOOD REVIEW 3RD QUARTER 2008 1
|
|
|
|
INTRODUCTION
|
Note
to Readers:
We
file annual
reports (on Form 10-K) and quarterly reports (on Form 10-Q)
with the Securities
and Exchange Commission. These filings and our earnings press
releases provide
information about our financial results in accordance with
generally accepted
accounting principles (GAAP). We urge you to review these documents,
which are
available through our web site, www.redwoodtrust.com.
This
document,
called the Redwood Review, provides supplemental information
about Redwood
through a discussion of many GAAP as well as non-GAAP metrics,
such as taxable
income and economic book value. We believe that these figures
provide additional
insight into Redwood’s business and future prospects. In each case in which we
discuss a non-GAAP metric, you will find an explanation of
how it has been
calculated and why we think the figure is important, and a
reconciliation
between the GAAP and non-GAAP figures. We hope you find the
Redwood Review to be
helpful to your understanding of our business.
The
form and
content of the Redwood Review will likely continue to change
over time. We
welcome your input and suggestions.
|
Selected
Financial Highlights
|
||||||||||||
|
Quarter:Year
|
GAAP
Income per Share
|
Total
Taxable Income per Share
|
Annualized
Return on Equity
|
GAAP
Book Value per Share
|
Core
Book Value per Share
|
Total
Dividends per Share
|
||||||
|
Q306
|
$1.22
|
$1.96
|
14%
|
$40.02
|
$36.38
|
$0.70
|
||||||
|
Q406
|
$1.32
|
$1.45
|
15%
|
$37.51
|
$34.02
|
$3.70
|
||||||
|
Q107
|
$0.66
|
$1.48
|
8%
|
$34.06
|
$34.29
|
$0.75
|
||||||
|
Q207
|
$0.41
|
$1.66
|
5%
|
$31.50
|
$34.40
|
$0.75
|
||||||
|
Q307
|
($2.18)
|
$1.74
|
(26%)
|
$5.32
|
$31.58
|
$0.75
|
||||||
|
Q407*
|
($36.49)
|
$0.92
|
(610%)
|
$23.18
|
$26.24
|
$2.75
|
||||||
|
Q108
|
($5.28)
|
$0.79
|
(83%)
|
$17.89
|
$20.74
|
$0.75
|
||||||
|
Q208
|
($1.40)
|
$0.11
|
(28%)
|
$17.00
|
$19.05
|
$0.75
|
||||||
|
Q308
|
($3.34)
|
$0.07
|
(80%)
|
$12.40
|
$14.92
|
$0.75
|
||||||
|
*
The book values per share are after giving retroactive
effect to the
adoption of FAS 159 on January 1, 2008.
Without
giving retroactive effect to FAS 159, the GAAP
book value per share and
core book value per share were a negative $22.18
and a negative $4.46,
respectively.
|
||||||||||||
CAUTIONARY
STATEMENT: This Redwood Review contains forward-looking statements
within the
meaning of the safe harbor provisions of the Private Securities
Litigation
Reform Act of 1995. Forward-looking statements involve numerous
risks and
uncertainties. Our actual results may differ from our expectations,
estimates,
and projections and, consequently, you should not rely on
these forward-looking
statements as predictions of future events. Forward-looking
statements are not
historical in nature and can be identified by words such
as “anticipate,”
“estimate,” “will,” “should,” “expect,” “believe,” “intend,” “seek,” “plan” and
similar expressions or their negative forms, or by references
to strategy,
plans, or intentions. These forward-looking statements are
subject to risks and
uncertainties, including, among other things, those described
in our Annual
Report on Form 10-K for the year ended December 31, 2007
and in our Quarterly
Report on Form 10-Q for the quarter ended September 30, 2008
under the caption
“Risk Factors.” Other risks, uncertainties, and factors that could cause
actual
results to differ materially from those projected are described
below and may be
described from time to time in reports we file with the Securities
and Exchange
Commission, including reports on Forms 10-K, 10-Q, and 8-K.
We undertake no
obligation to update or revise forward-looking statements,
whether as a result
of new information, future events, or otherwise.
Important
factors, among others, that may affect our actual results include:
changes in
interest rates; changes in prepayment rates; general economic
conditions,
particularly as they affect the price of earning assets and
the credit status of
borrowers; legislative and regulatory actions affecting the
mortgage industry;
the availability of high quality assets for purchase at attractive
prices;
declines in home prices; increases in mortgage payment delinquencies;
changes in
the level of liquidity in the capital markets which may adversely
affect our
ability to finance our real estate asset portfolio; changes
in liquidity in the
market for real estate securities, the re-pricing of credit
risk in the capital
markets, rating agency downgrades of securities, and increases
in the supply of
real estate securities available for sale, each of which may
adversely affect
the values of securities we own; the extent of changes in the
values of
securities we own and the impact of adjustments reflecting
those changes on our
income statement and balance sheet, including our stockholders’ equity; our
ability to maintain the positive stockholders’ equity necessary to enable us to
pay the dividends required to maintain our status as a real
estate investment
trust for tax purposes; and other factors not presently identified.
This Redwood
Review may contain statistics and other data that in some cases
have been
obtained from or compiled from information made available by
servicers and other
third-party service providers.
2
THE REDWOOD REVIEW 3RD QUARTER 2008
|
|
 |
|
SHAREHOLDER
LETTER
|
Dear
Fellow Shareholders:
We
have been
cautioning about more shoes to drop throughout the credit
crisis, yet the events
of the last month and a half have been far more dramatic
than even we had
anticipated. The speed and breadth of the worldwide financial
carnage has been
startling. We now live in a time of extreme market volatility
which makes it
difficult for most investors to keep their wits about them.
So
how is Redwood
faring? All in all, we are okay. The structure of our balance
sheet has kept us
out of harm’s way and during the third quarter our investments generated
cash
flow of $46 million in excess of our operating and interest
costs. We ended the
quarter with $177 million of unrestricted cash and $7 million
of short-term
debt. We have kept our powder dry for the past four months,
as we were uncertain
of the financial impacts resulting from governmental intervention
into the
mortgage markets. Further, our team has benefited from watching
and studying the
crisis from safe ground, leaving us clear-headed, energized,
and ready to tackle
the challenges that lie ahead.
Nevertheless,
our
business remains challenging as we continue to see an overall
deterioration in
credit performance. Delinquencies are trending upwards in
a manner somewhat
worse than our base case expectations. Furthermore, we remain
concerned about
economic fallout and the compounding effects on an already
distressed housing
market. We are disappointed by the continued precipitous
decline in the market
values of mortgage loans and related securities (on average
almost 30% during
the latest quarter) that has pressured book value.
Enough
focus on
gloom and doom — let’s turn to the other side of the crisis. President John F.
Kennedy said, “The Chinese use two brush strokes to write the word ‘crisis.’ One
brush stroke stands for danger; the other for opportunity.
In a crisis, be aware
of the danger — but recognize the opportunity.” We have been playing defensively
since late 2005; it is now time for Redwood to fully take
advantage of the
opportunities that are in front of us. The residential mortgage
playbook has
been thrown out and a new one needs to be written. We intend
to be an integral
part of the mortgage solutions of the future by working with
the major financial
institutions and the government agencies. We have the team,
the track record,
the systems, the relationships, and the capital.
Still,
with all the
uncertainty surrounding the resurgence of the residential
mortgage markets, it
is important to the long term success of Redwood to grow
our other businesses.
We are pleased with the early success of our asset management
business, which
offers Redwood the potential to expand our revenue stream,
and provides an
alternative means of raising investment capital.
You
can trust that as we move forward we will keep a wary eye
on credit as the
recessionary period plays out. On one final note, we are
significant
shareholders and we share your frustration and disappointment
with our current
stock price, which has not been immune from the widespread
declines in the stock
market. We are comforted by the belief that there are many
opportunities in the
future to build shareholder value and we are focused and
motivated to do so. We
thank you for your continued support.
 |
 |
|
George
E.
Bull, III
|
Douglas
B.
Hansen
|
|
Chairman
and CEO
|
President
|
THE
REDWOOD REVIEW 3RD QUARTER
2008 3
 |
|
|
QUARTERLY OVERVIEW
|
Third
Quarter 2008
For
the past month
and a half, we have all witnessed a regrettable chapter
in American financial
history. You have already been bombarded by the media with
all the “Who’s” — who
got saved, who didn’t, and, of course, who’s to blame. And all the “Why’s” — why
did it happen, why is it so unbelievably bad, and why nothing
seems to work.
We
are not going to
add to the abundance of opinions on these topics. Instead,
we are going to focus
below on the “What’s”— what have we been doing, what happened to our
investments, what does it mean for our business model,
and what are our plans.
The narrative below is aimed at answering all these inter-related
questions.
From
an investment
standpoint we didn’t buy assets at Redwood from June 19, 2008 to October 22,
2008. We held back on investing in residential mortgage
securities in order to
analyze and quantify the financial impact of the new systematic
FHA and FDIC
loan modification programs and the recently enacted Troubled
Asset Relief Plan
(TARP). We were also reluctant to invest as the global
financial crisis
escalated and outcomes were not measurable.
To
focus on one key
area, the government loan modification programs are intended
to help troubled
borrowers and stem the decline in home values. Based on
our initial analysis, we
believe the methodology used in these programs may negatively
impact the return
to some investors in mortgage securities.
At
this time, it’s
too early to say which of the various loan modification
programs will take hold.
Based on our initial assessment, we believe that the most
significant financial
impact from these programs will be borne by investors in
lower-rated non-prime
securities. We believe the impact of these programs on
our existing residential
real estate portfolio will not be significant. The carrying
value of our
investment in subprime and alt-a securities rated below
AAA was $6 million at
the end of the third quarter. We are also now modeling
and pricing for the
likely impact of these loan modification programs on the
securities that we are
targeting for possible investment in the near term.
Our
observations
concerning the negative financial impact of the government’s loan modifications
on investors’ returns are not an attempt to criticize or obstruct government
policy. We are only trying to impartially and accurately
measure the impact of
these programs on our assets and investment opportunities.
Time is of the
essence for many delinquent borrowers and we recognize
that innovative
solutions, such as systematic loan modification programs,
may be necessary.
Furthermore, we strongly support policies that stem the
decline in home values
and help troubled borrowers. We would welcome the opportunity
to work alongside
policy makers to assist in the development of policies
that would benefit
borrowers and investors alike.
It
is not clear how
TARP will evolve or how it might affect liquidity in the
mortgage markets. We
considered and ultimately decided not to pursue an opportunity
to become an
asset manager under TARP. We concluded that our role as
an asset manager for
TARP would not be in the overall best interest of our shareholders,
as it could
create a conflict of interest that would prevent us from
directly investing in
potentially extraordinary investment opportunities in our
upcoming quarters.
4
THE REDWOOD REVIEW 3RD QUARTER 2008
|
|
|
|
QUARTERLY
OVERVIEW
|
Third
Quarter 2008 (continued)
The graph
shown below illustrates
the psychological phases an investor goes through during
the creation and the
unraveling of bubbles — a process we are all currently experiencing. These
psychological phases motivate an investor’s decision to buy, hold, or sell.
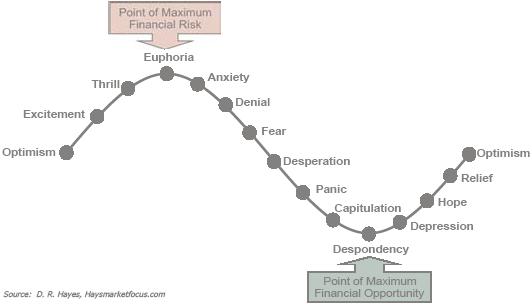
These
psychological phases interconnect with technical factors
such as market
liquidity, margin calls, leverage ratios, and rating
agency downgrades. In the
final stages of a market correction, the combination
of psychological and
technical factors can have a snowball effect leading
to a rapid and steep
decline in prices. While we are neither traders nor in
the business of picking
market bottoms, we believe the crescendo of events over
the past two months has
pushed or forced investors in residential loans and securities
to a point near
the capitulation point in the graph above.
After
almost a year of historically low activity, secondary
market trading for
residential mortgage assets is beginning to pick up.
Furthermore, we expect
that, in the upcoming months, hedge fund redemptions,
forced margin calls, and
planned asset liquidations from troubled or seized financial
institutions will
further contribute to the supply of residential mortgage
assets. While these
sales may further pressure prices, they may also offer
extraordinary investment
opportunities. We invested $7 million in residential
securities from October 23,
2008 through November 3, 2008. The size of future opportunities
will likely be
greater than our excess capital. Consequently, in order
to seize on these
opportunities, we may decide to raise non-dilutive capital
as more fully
outlined below.
While
the opportunities to invest in senior cash-flow residential
mortgages are
increasing, there are very few opportunities in CES,
or subordinate investments.
There is tremendous value for these assets at the bid-side
of the market, but
there are no willing sellers at these prices. We continue
to work with holders
of jumbo mortgages on innovative risk transfers; however,
given recent market
events, government actions, and rapid changes in the
banking industry, activity
is on hold. We will continue to pursue CES investments,
but also believe at this
time there are better risk-adjusted returns available
in senior cash-flows,
given deteriorating housing fundamentals and economic
uncertainty. We believe in
the long run there will be a need for private capital
to hold risk on non-agency
mortgages. This will be accomplished through securitization
or through other
derivative means. Without new private capital, the non-agency
mortgage market
will have to shrink or banks will take a more prominent
role then historically
has been the case.
THE
REDWOOD REVIEW 3RD QUARTER
2008 5
|
|
|
|
QUARTERLY OVERVIEW
|
Third
Quarter 2008 (continued)
We
are pleased that the Redwood Opportunity Fund
(the Fund) became fully invested
during the third quarter through the acquisition
of an additional $14 million of
assets at distressed prices. The Fund is a private
fund that seeks to take
advantage of investment opportunities in this
current distressed market. The
Fund is comprised of capital from both Redwood
and third-party investors. We
believe that private funds like the Fund provide
us with the ability to raise
capital in a non-dilutive manner for our shareholders
and utilize our existing
investment resources to generate incremental
revenues. Indeed, one of our
important initiatives for 2009 will be building
brand recognition for Redwood
Asset Management as one of the outstanding investment
franchises in real estate
related assets. The offer and sale of interests
in the Fund were privately
placed and not registered under federal securities
laws.
During
the third quarter, we did not acquire commercial
real estate assets. We remain
cautious in our near term outlook for commercial
real estate fundamentals.
Commercial credit availability is now scarce,
as the shutdown of the commercial
securitization markets eliminated a crucial financing
option for commercial
borrowers. Additionally, the economic headwinds
facing commercial property
owners and their tenants are becoming more severe.
While observable credit
deterioration to date remains relatively moderate,
we expect commercial
delinquencies and credit losses to rise as the
full effects of the recession are
felt. Even though prices for commercial securities
have been in a steep decline,
we believe that it is still too early in the
cycle to make significant new
commercial investments. We continue to prepare
for when the time is right, as
our commercial business remains an important
part of Redwood’s growth plans for
the future.
In
the third quarter, our GAAP book value declined
by $152 million, or $4.60 per
share, to $12.40 per share. Our estimated economic
book value declined by $117
million, or $3.54 per share, to $13.18 per share.
These declines were largely
due to mark-to-market securities write-downs
that were driven by the continuing
and unprecedented lack of liquidity in the marketplace.
Credit deterioration
continues to persist in most parts of our portfolio
at rates consistent with
recent quarters. We believe the steep rate of
market price declines in the third
quarter is exaggerated relative to the change
and trend of the fundamentals
underlying these securities.
Economic
value is calculated using bid-side or exit price
marks. This value is our best
approximation of liquidation value and in our
opinion does not reflect the cost,
or offered-side values, we would have to pay
to replace our assets. Based on our
estimate of the future loss-adjusted cash flows
underlying our calculation of
economic book value at September 30, 2008, the
overall cash flow yield for our
$509 million market value of financial assets
was 14% (including $177 million of
cash yielding 1%) and 30% (excluding cash). The
implied yield for our $71
million of market value of financial liabilities
was 17%. Details and caveats
regarding the use and determination of these
calculations, and reconciliations
of non-GAAP measures to GAAP, are found later
in this Review.
6
THE REDWOOD REVIEW 3RD QUARTER 2008
|
|
|
|
QUARTERLY
OVERVIEW
|
Third
Quarter 2008 (continued)
During
August, we invested $6 million to repurchase 341,656
shares of our common stock
at an average purchase price of $18.05 per share.
We believe these repurchases
represented an attractive long-term investment.
It is important to note that
applicable securities laws require that we limit
share repurchases to certain
window periods that generally close near the end
of the second month of the
quarter. Our recent repurchase window closed at
the end of August 2008.
Overall,
our capital deployment plan remains fluid and may
include acquiring or selling
assets, repurchasing our common shares, or raising
capital through an investment
fund or sale of preferred stock, or through other
instruments and structures
that are not dilutive to common shareholders. Unless
events or circumstances
change in an unforeseen way, we do not intend to
issue common stock at the
current share price level. As these considerations
are in some respects
competing, and as market conditions remain volatile,
it is difficult to
anticipate the actions we will take. Our actions
will depend upon:
| ► |
The
level and
attractiveness of new investment
opportunities;
|
| ► |
Our
ability
to raise non-dilutive capital at a price
that is accretive to
earnings;
|
| ► |
The
relative
attractiveness of investing in Redwood’s assets by repurchasing shares;
and,
|
| ► |
The
amount of
cash we believe we should hold in reserve
for the future.
|
As
a REIT, our
minimum dividend requirement is tied to our taxable
income. We now project that
our REIT taxable income in 2008, together with
the undistributed REIT taxable
income carried over from 2007, will fall somewhat
short of our full-year
distributions at our regular dividend rate of a
$0.75 per share per quarter. In
August of 2008, our Board of Directors reaffirmed
its intention to pay the
regular fourth quarter dividend. We will not pay
a special dividend in 2008. We
expect that taxable income will continue to be
pressured by the realization of
credit losses in 2009 and it is highly probable
that taxable income for 2009
will be negative. The Board plans to review and
consider our dividend policy for
2009 at our regularly scheduled meeting in early
November.
 |
 |
|
Martin
S.
Hughes
|
Brett
D.
Nicholas
|
|
Chief
Financial Officer
|
Chief
Investment Officer
|
|
Co-Chief
Operating Officer
|
Co-Chief
Operating Officer
|
THE
REDWOOD REVIEW 3RD QUARTER
2008 7
 |
|
|
FINANCIAL INSIGHTS
|
Components
of Book Value
| ► |
The
following
supplemental non-GAAP balance sheet
presents our assets and liabilities
as
calculated under GAAP and as adjusted
to reflect our estimate of economic
value. We show our investments in
the Opportunity Fund (the Fund) and
the
Sequoia and Acacia securitization
entities in separate line items,
similar
to the equity method of accounting,
reflecting the reality that the
underlying assets and liabilities
owned by these entities are legally
not
ours. We own only the securities
or interests that we have acquired
from
these entities.
|
| ► |
This
table,
except for our estimates of economic
value, is derived from the
consolidating balance sheet presented
on page 10. Our estimate of economic
value of $13.18 per share is calculated
using the bid-side asset marks as
required to determine fair value under
GAAP. This method of calculating
economic value more closely relates
to liquidation value and does not
represent the higher amount we would
have to pay at the offered-side to
replace our existing assets.
|
|
Components
of Book Value
|
|||||||||
|
September
30, 2008
|
|||||||||
|
($
in millions, except per share data)
|
|||||||||
|
As
Reported
|
Adj.
|
Management's
Estimate of Economic Value
|
|||||||
|
Real
estate securities at Redwood
|
|||||||||
|
Residential
|
$
|
160
|
$
|
160
|
|||||
|
Commercial
|
64
|
64
|
|||||||
|
CDO
|
4
|
4
|
|||||||
|
Total
real estate securities at Redwood
|
228
|
228
|
|||||||
|
Cash
and cash equivalents
|
177
|
|
|
177
|
|||||
|
Investments
in the Fund
|
35
|
35
|
|||||||
|
Investments
in Sequoia
|
111
|
(55)
|
(a)
|
56
|
|||||
|
Investments
in Acacia
|
19
|
(6)
|
(b)
|
13
|
|||||
|
Other
assets/liabilities, net (d)
|
(8)
|
|
(8)
|
||||||
|
Long-term
debt - Redwood
|
(150)
|
87
|
(c)
|
(63)
|
|||||
|
Stockholders'
equity
|
$
|
412
|
$
|
438
|
|||||
|
Book
value per share
|
$
|
12.40
|
$
|
13.18
|
|||||
|
(a)
|
Our
actual Sequoia investments consist
of credit enhancement securities
(CES),
investment grade securities (IGS),
and interest-only securities (IOs)
acquired by Redwood from the Sequoia
entities. We calculated the $56
million estimate of economic value
for these securities using the same
valuation process that we followed
to fair value our other real estate
securities. In contrast, the $111
million of GAAP carrying value of
these
investments represents the difference
between residential real estate
loans owned by the Sequoia entities
and the asset-backed securities (ABS)
issued by these entities to third-party
investors. We account for these
loans and ABS issued at cost, not
at fair value.
|
| (b) |
Our
Acacia investments consist of ABS issued
that we acquired from Acacia
entities and equity interests. The
$13 million estimate of economic value
of our investment interests in the
Acacia entities represents the value
of
the ABS acquired or retained using
bid-side marks from third parties,
plus
the net present value of projected
cash flows from our Acacia management
fees discounted at 45%. We valued our
equity interests at the amount of
cash we received in October and expect
to receive in November 2008. We are
not valuing future cash flows from
equity distributions beyond the fourth
quarter. The difference between the
GAAP and economic values is discussed
in the Investments in Acacia section
in this
Review.
|
| (c) |
We
issued
$150 million of 30-year long-term debt
at Redwood at an interest rate of
LIBOR plus 225 basis points. Under
GAAP, these notes are carried at cost.
Economic value is difficult to estimate
with precision as the market for
the notes is currently inactive. We
estimated the $63 million economic
value using the same valuation process
used to fair value our other
financial assets and liabilities. Estimated
economic value is $87 million
lower than our GAAP carrying value
because given the significant overall
contraction in credit availability
and re-pricing of credit risk, if we
had issued this long-term debt at Redwood
at September 30, 2008, investors
would have required a substantially
higher interest
rate.
|
| (d) |
Other
assets/liabilities, net are comprised
of real estate loans of $3 million,
$8 million of deferred taxes, $4 million
of accrued interest, and other
assets of $13 million, less Redwood
debt of $7 million, accruals of $2
million, dividends payable of $25 million,
and other liabilities of $2
million.
|
8
THE REDWOOD REVIEW 3RD QUARTER 2008
|
|
|
|
FINANCIAL
INSIGHTS
|
Components of Book Value (continued)
| ► |
The
following table highlights the components of the overall
change in
economic book value per share that occurred during
the quarter. It is
intended to highlight the performance of our different
investment
categories and show other sources and uses of cash
that impacted economic
value. Our investment performance, expressed below
as the change in the
economic value of investments, gives effect to mark-to-market
(MTM)
adjustments, new investments, and principal and interest
collected. As
previously discussed, the decreases in market values
were material this
quarter and overwhelmed the cash receipts for the quarter.
As a result,
all our investments had net negative economic performance
this quarter.
|
| ► |
As
an
example, the $19 million decline in economic value
of our Sequoia
investments from $75 million at June 30, 2008 to $56
million at September
30, 2008 was partially offset by our receipt of $13
million in cash from
our Sequoia investments. Therefore, the net economic
performance of our
investments in Sequoia during the quarter was negative
$6 million ($0.18
per share).
|
|
Changes
in the Components of Economic Value Per Share
|
|||||
|
Three
Months Ended September 30, 2008
|
|||||
|
(in
$ per share)
|
|||||
|
Management's
estimate of economic value at 6/30/08
|
$
|
16.72
|
|||
|
Change
in economic value of investments
|
|||||
|
Real
estate securities at Redwood
|
(2.44)
|
||||
|
Investments
in the Fund
|
(0.15)
|
||||
|
Investments
in Sequoia
|
(0.18)
|
||||
|
Investments
in Acacia
|
(0.03)
|
||||
|
Total
change in economic value of investments
|
(2.80)
|
||||
|
Operating
expenses and working capital
|
(0.36)
|
||||
|
Interest
expense and long-term debt valuation
|
0.30
|
||||
|
Dividends
|
(0.75)
|
||||
|
Equity
issuance, net
|
0.07
|
||||
|
Total
changes to economic value
|
(3.54)
|
||||
|
Management's
estimate of economic value at 9/30/08
|
$
|
13.18
|
|||
| ► |
The
changes
in the components of economic book value per share
are a non-GAAP measure.
Management’s estimate of economic value at June 30, 2008 is reconciled
to
GAAP book value on Table 17 in the Financial Tables
section. Management’s
estimate of economic value at September 30, 2008 is
reconciled to GAAP on
the previous page.
|
THE
REDWOOD REVIEW 3RD QUARTER
2008 9
|
|
|
|
FINANCIAL INSIGHTS
|
Consolidating
Balance Sheet
| ► |
GAAP
requires
us to consolidate all of the assets and liabilities
of the Sequoia and
Acacia securitization entities (which had a combined
$7.0 billion of
assets and $6.8 billion of liabilities at September
30, 2008) even though
the assets are owned by the securitization entities
and the liabilities
are obligations of the securitization entities
payable only from the cash
flows generated by the assets owned by the entities.
Additionally, we are
required to consolidate all of the assets and liabilities
of the Fund.
Redwood owns the general partnership interest in
the Fund and just over
half of the limited partnership
interests.
|
| ► |
The
table
below shows the consolidating components of our
consolidated balance sheet
at September 30, 2008. The purpose of this presentation
is to show the
effect each of the components had on our consolidated
shareholders’ equity
at September 30, 2008. The Fund, Sequoia, and Acacia
components represent
investments and are not separate business segments.
|
|
Consolidating
Balance
Sheet
|
|||||||||||||||||||
|
September
30,
2008
|
|||||||||||||||||||
|
($
in
millions)
|
|||||||||||||||||||
|
Redwood
|
The
Fund
|
Sequoia
|
Acacia
|
Intercompany
|
Redwood
Consolidated
|
||||||||||||||
|
Real
estate loans
|
$
|
3
|
$
|
-
|
$
|
6,084
|
$
|
14
|
$
|
-
|
$
|
6,101
|
|||||||
|
Real
estate securities
|
228
|
67
|
-
|
649
|
(82
|
)
|
862
|
||||||||||||
|
Other
investments
|
-
|
-
|
-
|
79
|
-
|
79
|
|||||||||||||
|
Cash
and cash equivalents
|
177
|
-
|
-
|
-
|
-
|
177
|
|||||||||||||
|
Total
earning assets
|
408
|
67
|
6,084
|
742
|
(82
|
)
|
7,219
|
||||||||||||
|
Investment
in the Fund
|
35
|
-
|
-
|
-
|
(35
|
)
|
-
|
||||||||||||
|
Investment
in Sequoia
|
111
|
-
|
-
|
-
|
(111
|
)
|
-
|
||||||||||||
|
Investment
in Acacia
|
19
|
-
|
-
|
-
|
(19
|
)
|
-
|
||||||||||||
|
Other
assets
|
25
|
6
|
53
|
71
|
-
|
155
|
|||||||||||||
|
Total
assets
|
$
|
598
|
$
|
73
|
$
|
6,137
|
$
|
813
|
$
|
(247
|
)
|
$
|
7,374
|
||||||
|
Short-term
debt - Redwood
|
$
|
7
|
$
|
-
|
$
|
-
|
$
|
-
|
$
|
-
|
$
|
7
|
|||||||
|
Other
liabilities
|
29
|
3
|
14
|
121
|
-
|
167
|
|||||||||||||
|
Asset-backed
securities issued - Sequoia
|
-
|
-
|
6,012
|
-
|
(82
|
)
|
5,930
|
||||||||||||
|
Asset-backed
securities issued - Acacia
|
-
|
-
|
-
|
673
|
-
|
673
|
|||||||||||||
|
Long-term
debt - Redwood
|
150
|
-
|
-
|
-
|
-
|
150
|
|||||||||||||
|
Total
liabilities
|
186
|
3
|
6,026
|
794
|
(82
|
)
|
6,927
|
||||||||||||
|
Minority
interest
|
-
|
35
|
-
|
-
|
-
|
35
|
|||||||||||||
|
Total
stockholders’ equity
|
412
|
35
|
111
|
19
|
(165
|
)
|
412
|
||||||||||||
|
Total
liabilities and stockholders’ equity
|
$
|
598
|
$
|
73
|
$
|
6,137
|
$
|
813
|
$
|
(247
|
)
|
$
|
7,374
|
||||||
10
THE REDWOOD REVIEW 3RD QUARTER 2008
|
|
|
|
FINANCIAL
INSIGHTS
|
Real
Estate Securities at Redwood
| ► |
The
table
below provides a breakout of our real estate
securities portfolio by
residential, commercial, and CDO by vintage.
The residential and
commercial securities are further detailed by
rating in separate modules
later in this Review.
|
|
Real
Estate Securities at Redwood
|
|||||||||||||||||||
|
September
30, 2008
|
|||||||||||||||||||
|
($
in millions)
|
|||||||||||||||||||
|
<=
2004
|
|
2005
|
2006
|
|
2007
|
2008
|
Total
|
||||||||||||
|
Residential
|
|||||||||||||||||||
|
Prime
|
|||||||||||||||||||
|
IGS
|
$
|
29
|
$
|
18
|
$
|
13
|
$
|
3
|
$
|
3
|
$
|
66
|
|||||||
|
CES
|
32
|
4
|
2
|
3
|
-
|
41
|
|||||||||||||
|
Non-prime
|
|||||||||||||||||||
|
IGS
|
-
|
24
|
10
|
13
|
-
|
47
|
|||||||||||||
|
CES
|
1
|
1
|
-
|
4
|
-
|
6
|
|||||||||||||
|
Total
Residential
|
62
|
47
|
25
|
23
|
3
|
160
|
|||||||||||||
|
Commercial
CES
|
13
|
14
|
27
|
10
|
-
|
64
|
|||||||||||||
|
CDO
IGS
|
-
|
4
|
-
|
-
|
-
|
4
|
|||||||||||||
|
Market
value
|
$
|
75
|
$
|
65
|
$
|
52
|
$
|
33
|
$
|
3
|
$
|
228
|
|||||||
| ► |
Total
real
estate securities at Redwood decreased during
the third quarter by 35% to
$228 million at September 30, 2008. The table
below presents our activity
during the third quarter.
|
|
Real
Estate Securities at Redwood
|
||||
|
Three
Months Ended September 30, 2008
|
||||
|
($
in millions)
|
||||
|
Market
value at June 30, 2008
|
$
|
353
|
||
|
Acquisitions
|
-
|
|||
|
Sales
|
(8
|
)
|
||
|
Principal
payments
|
(17
|
)
|
||
|
Discount
amortization
|
5
|
|||
|
Changes
in market value, net
|
(105
|
)
|
||
|
Market
value at September 30, 2008
|
$
|
228
|
||
THE
REDWOOD
REVIEW 3RD QUARTER
2008 11
|
|
|
|
FINANCIAL INSIGHTS
|
Real
Estate Securities at Redwood (continued)
| ► |
During
the third quarter, we did not purchase securities.
We held back investing
in residential mortgage securities at Redwood
in order to analyze and
quantify the financial impact of the new systematic
FHA and FDIC loan
modification programs and the recently enacted
Troubled Asset Relief Plan
(TARP). We were also reluctant to invest as
the global financial crisis
escalated and security prices fell precipitously.
|
| ► |
Prices
weakened in the quarter due to the well publicized
and nearly
unprecedented distress in the global financial
markets. As a result, we
reduced the fair value of our securities by
$107 million, or 32%. For GAAP
balance sheet purposes, we are required to
determine the carrying value of
our real estate securities using prices that
we can support as an “exit”
or bid-side price. Although the Financial Accounting
Standards Board
issued clarifying guidance on marking assets
to fair value, it did not
change the accounting requirements and we continue
to value our securities
at the prices at which we believe we could
sell them in the current
illiquid market. Bid/offer spreads remain very
wide for all of these
securities.
|
| ► |
Investment
grade securities (IGS) in our securities portfolio
continue to represent
about half (51%) of the portfolio, which is
unchanged since June. We
emphasize that we do not rely on credit ratings
as part of our investment
decision process. Our acquisition decisions
are based on the strength of
the underlying collateral cash flows and the
level of subordination to
protect against projected credit losses.
|
| ► |
The
following
table presents the components of GAAP carrying
value (which equals fair
value determined in accordance with GAAP) for
residential and commercial
credit enhancement securities (CES) at Redwood.
In total, the weighted
average carrying value of our CES as a percentage
of face value declined
to 9% at September 30, 2008 from 15% at June
30,
2008.
|
|
Credit
Enhancement Securities at Redwood
|
||||||||||
|
September
30, 2008
|
||||||||||
|
($
in millions)
|
||||||||||
|
Residential
|
||||||||||
|
Prime
|
Non-Prime
|
|
Commercial
|
|||||||
|
Current
face
|
$
|
361
|
$
|
295
|
$
|
515
|
||||
|
Unamortized
premium (discount), net
|
(29
|
)
|
(43
|
)
|
24
|
|||||
|
Discount
designated as credit reserve
|
(287
|
)
|
(248
|
)
|
(471
|
)
|
||||
|
Amortized
cost
|
45
|
4
|
68
|
|||||||
|
Unrealized
gains
|
3
|
2
|
2
|
|||||||
|
Unrealized
losses
|
(7
|
)
|
-
|
(6
|
)
|
|||||
|
Market
value
|
$
|
41
|
$
|
6
|
$
|
64
|
||||
|
Market
value as a percentage of face
|
11
|
%
|
2
|
%
|
12
|
%
|
||||
12
THE REDWOOD REVIEW 3RD QUARTER 2008
|
|
|
|
FINANCIAL
INSIGHTS
|
Real
Estate Securities at Redwood (continued)
| ► |
We
acquire CES at a significant discount to
principal value as credit losses
could reduce or eliminate the principal value
of these bonds. Our return
on these investments is based on how much
principal and interest we
receive and how quickly we receive it. Typically
we assume that most or
all of the principal will be written off
due to credit losses, so the
timing of credit losses is more of a factor
than the amount of credit
losses when looking at downside scenarios.
In an ideal environment, we
would experience fast prepayments and low
credit losses allowing us to
recover a substantial part of the discount
as income. Conversely, in the
least beneficial environment, we would experience
slow prepayments and
high credit losses.
|
| ► |
We
provide
additional discussion and analysis regarding
the adequacy of our credit
reserves and the potential earnings upside
from an increase in prepayments
in the residential and commercial real estate
securities modules that
follow.
|
Cash
Flow
| ► |
As
a
supplement to our Consolidated Statement
of Cash Flows included in our
Quarterly Report on Form 10-Q, we have included
the table below that
summarizes the sources and uses of our cash
during the third quarter. This
table excludes the gross cash flows generated
by our Sequoia and Acacia
securitization entities and the Fund (cash
flows that are not available to
Redwood), but does include the cash flows
paid to Redwood as a result of
our investments in these entities.
|
| ► |
In
the third
quarter, our investments generated cash from
principal and interest of $60
million, compared to $65 million in the second
quarter. We also received
$2 million of asset management fees in the
third quarter. The net
investment cash flow, after deducting long
and short-term Redwood debt
interest expense of $2 million and cash operating
expenses of $14 million,
was $46 million, compared to $52 million
in the second quarter.
|
|
Redwood
|
||||
|
Sources
and Uses of Cash
|
||||
|
Three
Months Ended September 30, 2008
|
||||
|
($
in millions)
|
||||
|
Sources:
|
||||
|
Cash
from investments
|
$
|
60
|
||
|
Proceeds
from asset sales
|
8
|
|||
|
Equity
raised
|
8
|
|||
|
Asset
management fees
|
2
|
|||
|
Total
Sources
|
78
|
|||
|
Uses:
|
||||
|
Stock
buyback
|
(6
|
)
|
||
|
Reductions
in short term borrowings
|
(2
|
)
|
||
|
Dividends
paid
|
(25
|
)
|
||
|
Operating
expenses paid
|
(14
|
)
|
||
|
Interest
expense on Redwood debt
|
(2
|
)
|
||
|
Total
Uses
|
(49
|
)
|
||
|
Net
sources of cash
|
$
|
29
|
||
|
Beginning
cash balance at 6/30/08
|
$
|
148
|
||
|
Ending
cash balance at 9/30/08
|
$
|
177
|
||
THE
REDWOOD REVIEW 3RD QUARTER 2008
13
| |
|
|
FINANCIAL INSIGHTS
|
Cash
Flow
(continued)
| ► |
The
primary reason for the decline in net investment
cash flow was lower
interest income resulting from credit losses
in prior periods (which
reduce coupon income in future periods),
higher cash balances, and slower
prepayments (which reduce principal received).
|
| ► |
The
$60
million of cash flow from our investments
included $36 million of coupon
interest and $24 million of principal. We
caution readers that given the
nature of our investments (deep discount
credit-sensitive securities, IGS
at discounts, IOs, equity investments in
Acacia, and other types) it is
difficult to draw conclusions in any one
period about what portion of our
cash flow represents “income” and what is a “return of capital.” It is
only at the end of an asset’s life that we can accurately determine what
portion of the cumulative cash received (whether
principal or interest)
was truly income and what was a return of
capital.
|
| ► |
The
following
table provides information regarding the
investment source and vintage of
our cash flow. As shown, most of our cash
flows are generated by assets
from earlier vintages, which we believe provides
a level of comfort about
the ongoing generation of our cash as these
assets generally continue to
perform within our expectations.
|
|
Cash
Flow by Vintage
|
|||||||||||||||||||
|
Three
Months Ended September 30, 2008
|
|||||||||||||||||||
|
($
in millions)
|
|||||||||||||||||||
|
<=2004
|
2005
|
2006
|
|
2007
|
2008
|
Total
|
|||||||||||||
|
Redwood
|
$
|
16
|
$
|
7
|
$
|
6
|
$
|
5
|
$
|
1
|
$
|
35
|
|||||||
|
The
Fund
|
5
|
2
|
-
|
-
|
-
|
7
|
|||||||||||||
|
Sequoia
|
10
|
-
|
-
|
3
|
-
|
13
|
|||||||||||||
|
Acacia
|
3
|
2
|
-
|
-
|
-
|
5
|
|||||||||||||
|
Total
|
$
|
34
|
$
|
11
|
$
|
6
|
$
|
8
|
$
|
1
|
$
|
60
|
|||||||
| ► |
We
repurchased 341,656 shares at a total cost
of $6 million during
August.
|
| ► |
Through
our
dividend stock purchase plan, we raised $8
million in July. In August, we
suspended the optional cash purchase feature
of this plan due to the
decline in our share price and the adequacy
of our
liquidity.
|
| ► |
We
generated
$8 million from the sale of three CDO securities.
|
| ► |
We
note that
credit losses on securities have little or
no immediate impact on our cash
flow at the time losses are realized, although
they result in a reduction
in the principal balances. Cash flow receipts
will therefore be reduced in
future periods since interest payments will
be based on reduced principal
balances. Also, losses reduce the upside
potential to recover the full
purchase discounts from face value.
|
14
THE REDWOOD REVIEW 3RD QUARTER 2008
|
|
|
|
FINANCIAL
INSIGHTS
|
Cash
Flow
(continued)
|
►
|
We
caution that the amount of cash flow from
existing investments could be
volatile from quarter to quarter depending
on prepayment patterns, changes
in interest rates, and the level of credit
losses. Overall, we expect cash
flow from existing investments to trend
lower over time. Future increases
in cash flow will be generated by successfully
reinvesting our capital.
|
| ► |
In
the fourth
quarter, we expect that cash flow from
our investments will decrease
significantly (by about one-third) due
to slower prepayments. An
acceleration of prepayments from the current
low levels would increase our
cash flow.
|
| ► |
The
third
quarter spike in LIBOR will also contribute
to the expected decrease in
cash flow in the fourth quarter, by reducing
the amount of spread income
earned on our Sequoia IOs as the interest
rates on the liabilities
generally reset faster than on the assets. As LIBOR stabilizes (or
decreases), we expect that a portion of
the IO cash flows will be
recovered in 2009 as the loans reset or
“catch-up” to the higher level of
LIBOR.
|
| ► |
The
third
quarter included several one-time events
that resulted in $5 million of
non-recurring cash flows from Acacia and
the Fund.
|
| ► |
At
this time,
we believe our quarterly cash flows in
2009 will be similar to the
expected cash flows in the fourth quarter
of 2008. We caution that these
are projections and the actual results
may vary and will depend upon our
level of investment activity, the amount
and timing of credit losses, the
amount and timing or prepayments, and the
nature and impact of legislative
and regulatory actions, among other factors.
|
THE
REDWOOD REVIEW 3RD QUARTER 2008
15
 |
|
|
GAAP INCOME
|
Summary
What
is this?
GAAP
income is income calculated under generally accepted
accounting principles in
the United States.
Quarterly
Update
| ► |
The
table below provides a summary of our
GAAP (loss) income for the third
quarter of 2008, the second quarter of
2008, and the third quarter of
2007.
|
|
GAAP
(Loss) Income
|
||||||||||
|
Three
Months Ended
|
||||||||||
|
($
in millions, except per share data)
|
||||||||||
|
9/30/08
|
6/30/08
|
9/30/07
|
||||||||
|
Interest
income
|
$
|
131
|
$
|
137
|
$
|
220
|
||||
|
Management
fees
|
1
|
1
|
2
|
|||||||
|
Interest
expense
|
(93
|
)
|
(99
|
)
|
(167
|
)
|
||||
|
Net
interest income
|
39
|
39
|
55
|
|||||||
|
|
||||||||||
|
Provision
for loan losses
|
(18
|
)
|
(10
|
)
|
(2
|
)
|
||||
|
Market
valuation adjustments, net
|
(127
|
)
|
(60
|
)
|
(102
|
)
|
||||
|
Net
interest income (loss) after provision
and market valuation
adjustments
|
(106
|
)
|
(31
|
)
|
(49
|
)
|
||||
|
|
||||||||||
|
Operating
expenses
|
(17
|
)
|
(15
|
)
|
(12
|
)
|
||||
|
Realized
gains (losses) on sales
|
-
|
3
|
(1
|
)
|
||||||
|
Realized
gains on calls
|
-
|
-
|
3
|
|||||||
|
Minority
interest allocation
|
2
|
(2
|
)
|
-
|
||||||
|
Credit
(provision) for income taxes
|
10
|
(1
|
)
|
(2
|
)
|
|||||
|
GAAP
(loss) income
|
$
|
(111
|
)
|
$
|
(46
|
)
|
$
|
(61
|
)
|
|
|
GAAP
(loss) income per share
|
$
|
(3.34
|
)
|
$
|
(1.40
|
)
|
$
|
($2.18
|
)
|
|
| ► |
Our
reported GAAP loss for the third quarter
of 2008 was $111 million ($3.34
per share) compared to a GAAP loss of
$46 million ($1.40 per share) for
the second quarter of 2008. The loss
increased in the third quarter due to
higher negative market valuation adjustments
(MVA) and provisions for loan
losses.
|
| ► |
Net
interest income before provision for
loan losses and MVA in the third
quarter totaled $39 million, unchanged
from the second quarter. More
detailed information on the components
of the changes in our net interest
income is found below.
|
| ► |
MVA
in the third quarter was negative $127
million, a significant increase
from negative MVA of $60 million in the
second quarter. MVA at Redwood
totaled $88 million, MVA at Sequoia totaled
negative $2 million, MVA at
Acacia were negative $29 million, and
MVA at the Fund were negative $8
million. MVA are discussed in the Mark-to-Market
module later in this
Review.
|
| ► |
Provision
for loan losses increased by $8 million
to $18 million due to increased
delinquencies and continued credit deterioration
on residential loans at
Sequoia. More information on the provision
for loan losses is provided
below.
|
16
THE REDWOOD REVIEW 3RD QUARTER 2008
|
|
|
|
GAAP
INCOME
|
Quarterly
Update (continued)
| ► |
Total
operating expenses increased by $2
million to $17 million in the third
quarter of 2008 as compared to the
second quarter of 2008 due to legal
and
consulting expenses. These expenses
were incurred primarily in connection
with the expansion of our asset management
business, our preparation for
the possible registration of our asset
management subsidiary as an
investment adviser with the Securities
and Exchange Commission, and our
continuing analysis of potential claims
against third parties arising out
of the origination of mortgage loans
underlying securities we own. We are
not currently involved in any litigation.
|
| ► |
We
recorded a $10 million credit for income
taxes in the third quarter as a
result our Board of Directors’ decision in August to distribute the
remaining 10% of our 2007 REIT taxable
income and 100% of our 2008 REIT
taxable income as dividends. Our prior
practice had been to distribute 90%
of our REIT taxable income which resulted
in a tax liability on the
remaining 10% of REIT taxable earnings.
|
| ► |
The
following tables detail the components
of our consolidated income
statements for the third and second
quarters of
2008.
|
|
Consolidating
Income Statement
|
|||||||||||||||||||
|
Three
Months Ended September 30, 2008
|
|||||||||||||||||||
|
($
in millions)
|
|||||||||||||||||||
|
Redwood
|
The
Fund
|
Sequoia
|
Acacia
|
Intercompany
Adjustments
|
Redwood
Consolidated
|
||||||||||||||
|
Interest
income
|
$
|
17
|
$
|
2
|
$
|
71
|
$
|
37
|
$
|
(1
|
)
|
$
|
126
|
||||||
|
Net
discount
(premium) amortization
|
6
|
2
|
(3
|
)
|
-
|
-
|
5
|
||||||||||||
|
Total
interest
income
|
23
|
4
|
68
|
37
|
(1
|
)
|
131
|
||||||||||||
|
Management
fees
|
1
|
-
|
-
|
-
|
-
|
1
|
|||||||||||||
|
Interest
expense
|
(2
|
)
|
-
|
(63
|
)
|
(29
|
)
|
1
|
(93
|
)
|
|||||||||
|
Net
interest
income
|
22
|
4
|
5
|
8
|
-
|
39
|
|||||||||||||
|
|
-
|
||||||||||||||||||
|
Provision
for
loan losses
|
-
|
-
|
(18
|
)
|
-
|
-
|
(18
|
)
|
|||||||||||
|
Market
valuation adjustments, net
|
(88
|
)
|
(8
|
)
|
(2
|
)
|
(29
|
)
|
-
|
(127
|
)
|
||||||||
|
Net
interest
income (loss) after provision and market
valuation
adjustments
|
(66
|
)
|
(4
|
)
|
(15
|
)
|
(21
|
)
|
-
|
(106
|
)
|
||||||||
|
Operating
expenses
|
(17
|
)
|
-
|
-
|
-
|
-
|
(17
|
)
|
|||||||||||
|
Realized
gains
on sales and calls, net
|
-
|
-
|
-
|
-
|
-
|
-
|
|||||||||||||
|
Loss
from the
Fund
|
(2
|
)
|
-
|
-
|
-
|
2
|
-
|
||||||||||||
|
Loss
from
Sequoia
|
(15
|
)
|
-
|
-
|
-
|
15
|
-
|
||||||||||||
|
Loss
from
Acacia
|
(21
|
)
|
-
|
-
|
-
|
21
|
-
|
||||||||||||
|
Minority
interest allocation
|
-
|
2
|
-
|
-
|
-
|
2
|
|||||||||||||
|
Credit
(provision) for income taxes
|
10
|
-
|
-
|
-
|
-
|
10
|
|||||||||||||
|
Net
(loss) income
|
$
|
(111
|
)
|
$
|
(2
|
)
|
$
|
(15
|
)
|
$
|
(21
|
)
|
$
|
38
|
$
|
(111
|
)
|
||
|
Consolidating
Income Statement
|
|||||||||||||||||||
|
Three
Months Ended June 30, 2008
|
|||||||||||||||||||
|
($
in millions)
|
|||||||||||||||||||
|
Redwood
|
The
Fund
|
Sequoia
|
Acacia
|
Intercompany
Adjustments
|
Redwood
Consolidated
|
||||||||||||||
|
Interest
income
|
$
|
20
|
$
|
1
|
$
|
82
|
$
|
40
|
$
|
(2
|
)
|
$
|
141
|
||||||
|
Net
discount
(premium) amortization
|
5
|
1
|
(10
|
)
|
-
|
-
|
(4
|
)
|
|||||||||||
|
Total
interest
income
|
25
|
2
|
72
|
40
|
(2
|
)
|
137
|
||||||||||||
|
Management
fees
|
1
|
-
|
-
|
-
|
-
|
1
|
|||||||||||||
|
Interest
expense
|
(2
|
)
|
-
|
(67
|
)
|
(32
|
)
|
2
|
(99
|
)
|
|||||||||
|
Net
interest
income
|
24
|
2
|
5
|
8
|
-
|
39
|
|||||||||||||
|
|
-
|
||||||||||||||||||
|
Provision
for
loan losses
|
-
|
-
|
(10
|
)
|
-
|
-
|
(10
|
)
|
|||||||||||
|
Market
valuation adjustments, net
|
(31
|
)
|
-
|
(1
|
)
|
(28
|
)
|
-
|
(60
|
)
|
|||||||||
|
Net
interest
income (loss) after provision and
market valuation
adjustments
|
(7
|
)
|
2
|
(6
|
)
|
(20
|
)
|
-
|
(31
|
)
|
|||||||||
|
|
-
|
||||||||||||||||||
|
Operating
expenses
|
(15
|
)
|
-
|
-
|
-
|
-
|
(15
|
)
|
|||||||||||
|
Realized
gains
on sales and calls, net
|
1
|
2
|
-
|
-
|
-
|
3
|
|||||||||||||
|
Income
from
the Fund
|
2
|
-
|
-
|
-
|
(2
|
)
|
-
|
||||||||||||
|
Loss
from
Sequoia
|
(6
|
)
|
-
|
-
|
-
|
6
|
-
|
||||||||||||
|
Loss
from
Acacia
|
(20
|
)
|
-
|
-
|
-
|
20
|
-
|
||||||||||||
|
Minority
interest allocation
|
-
|
(2
|
)
|
-
|
-
|
-
|
(2
|
)
|
|||||||||||
|
Credit
(provision) for income taxes
|
(1
|
)
|
-
|
-
|
-
|
-
|
(1
|
)
|
|||||||||||
|
Net
(loss) income
|
$
|
(46
|
)
|
$
|
2
|
$
|
(6
|
)
|
$
|
(20
|
)
|
$
|
24
|
$
|
(46
|
)
|
|||
THE
REDWOOD REVIEW 3RD QUARTER 2008
17
|
|
|
|
GAAP INCOME
|
Quarterly
Update (continued)
| ► |
At
Redwood, net interest income declined
by $2 million to $22 million in
the
third quarter from the prior quarter.
This decline was due to higher
credit losses in this period and
prior quarters (which reduced the
face
value of our bonds and the resulting
interest income), slower prepayments
(which reduced the rate at which
we accrete discount into income),
and
lower coupon rates as approximately
70% of our investments are tied
to
short-term interest rates. Negative
MVA on our securities increased
by $57
million to $88 million as many
of the continued declines in market
values
on our securities resulted in other-than-temporary
impairments.
|
| ► |
At
Sequoia, net interest income was
unchanged from the second quarter
at $5
million. A decline in loan premium
expense was offset by an increase
in
provisions for loan losses. Negative
MVA was $2 million, reflecting
valuation adjustments related to
other real estate owned, which
are
reported at the lower of cost or
market. The cash flows paid to
Redwood
from our investments in Sequoia
entities were $13 million in the
third
quarter.
|
| ► |
At
Acacia, net interest income was
$8 million in the third quarter,
similar
to the prior quarter. The value
of Acacia assets decreased more
than the
decrease in value of the Acacia
liabilities during the third quarter
resulting in a MVA of negative
$29 million.
|
|
During
the third quarter, Redwood received
$1 million in management fees and
$5
million of cash distributions from
Acacia entities (which included
$3
million from outstanding entities, and a one-time payment
of $2
million from an entity that had
been called in the fourth quarter
of
2006.) We continue to expect cash
flows from Acacia to diminish because
seven of our ten Acacia equity
investments have stopped receiving
cash
distributions due to rating agency
downgrades of securities held by
those
entities.
|
18
THE REDWOOD REVIEW 3RD QUARTER 2008
|
|
 |
|
TAXABLE
INCOME
|
Summary
What
is this?
Total
taxable income is our pre-tax income as calculated
for tax purposes. Total
taxable income differs materially from GAAP
income. Table 3 in the Appendix
reconciles these two profitability measures.
REIT
taxable income is the primary determinant
of the minimum amount of dividends we
must distribute in order to maintain our
tax status as a real estate investment
trust (REIT). REIT taxable income is pre-tax
profit, as calculated for tax
purposes, excluding taxable income earned
at our non-REIT taxable subsidiaries.
Over time, we must distribute at least 90%
of our REIT taxable income as
dividends.
For
our quarterly taxable earnings estimates,
we project our taxable earnings for
the year based upon various assumptions of
events that will occur during the
year. However, some of the events that could
have significant impact on our
taxable earnings are difficult to project,
including the amount and timing of
credit losses, prepayments, and employee
stock option exercises. Thus, our
quarterly taxable earnings are likely to
remain volatile.
Quarterly
Update
| ► |
Total
taxable income for the third quarter
of 2008 was $2 million, or $0.07
per
share. The majority of the income
this quarter was generated at the
REIT.
|
| ► |
The
charts below provide a summary
of our total taxable income per
share and
REIT taxable income per share for
each for the nine most recently
completed fiscal quarters.
|
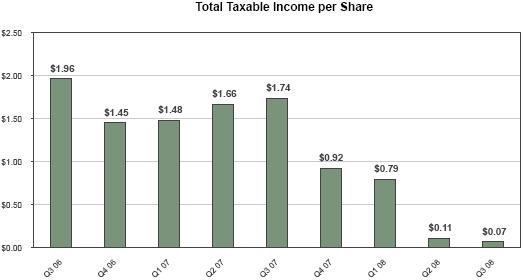
THE
REDWOOD REVIEW 3RD QUARTER 2008
19
|
|
|
|
TAXABLE INCOME
|
Quarterly
Update (continued)
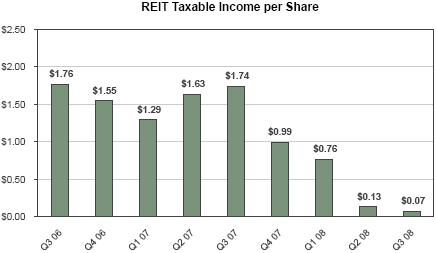
| ► |
Our
undistributed REIT taxable
income was $0.63 per share
at September 30,
2008.
|
| ► |
Total
REIT taxable income for the
third quarter decreased from
the prior quarter
by $2 million primarily due
to an increase in credit losses.
Our third
quarter taxable earnings included
$33 million of deductions related
to
credit losses, an increase
of $3 million over the previous
quarter.
|
| ► |
We
caution that the realization
of credit losses can vary significantly
from
quarter to quarter, depending
on a number of variables (the
level of loan
modifications, short-sales,
and the impact of new legislation)
that could
decelerate or accelerate the
timing of recognition of losses.
For example,
federal and state regulatory
actions are giving delinquent
borrowers
additional time to resolve
their mortgage delinquency
issues. However, we
expect credit losses to continue
to increase from the third
to the fourth
quarter of 2008.
|
| ► |
Our
taxable income continues to
be higher than our GAAP income,
as we are not
permitted to establish credit
reserves for tax purposes and
we do not
generally recognize changes
in the market values of assets
for tax
purposes until the asset is
sold. As a result of these
differences, at
September 30, 2008, the tax
basis of our residential, commercial,
and CDO
CES at Redwood was $472 million
higher than our GAAP basis.
As a result,
future credit losses will have
a more significant impact on
our taxable
income than on our GAAP income.
Over time, cumulative GAAP
and taxable
income should converge; and
given our projected losses,
we expect taxable
income to decrease relative
to GAAP income for the next
several quarters.
|
| ► |
The
tax basis on Sequoia IOs we
own is $41 million. Many of
the underlying
pools of loans have paid down
or will pay down within the
next year to
levels where they are callable.
When these are called, tax
losses on these
IOs are incurred and our taxable
income and dividend distribution
requirements decrease. We do
not anticipate calling any
Sequoia deals in
the foreseeable future.
|
20
THE REDWOOD REVIEW 3RD QUARTER 2008
|
|
 |
|
DIVIDENDS
|
Summary
What
is this?
As
a REIT, we are required to distribute
at least 90% of our REIT taxable income
in
the form of dividends to shareholders.
The Board of Directors can declare
dividends in excess of this minimum
requirement. Our Board established
a regular
quarterly dividend rate of $0.75 per
share for 2008.
|
The
charts below show our historical
regular and special dividends
per share
that were paid to shareholders
for the indicated periods
and our projected
regular dividend for 2008.
|
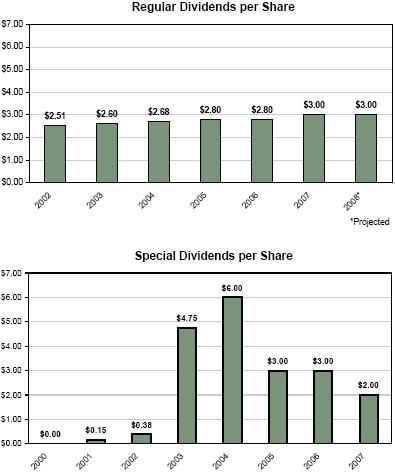
Quarterly
Update
| ► |
On
August 21, 2008, we declared
a regular dividend of $0.75
per share for the
third quarter, which was
paid on October 21, 2008
to shareholders of
record on September 30, 2008.
|
| ► |
Our
undistributed REIT taxable
income was $0.63 per share
at September 30,
2008.
|
| ► |
The
Board of Directors has affirmed
its intention to maintain
the regular
$0.75 per share cash dividend
for the fourth quarter of
2008.
|
| ► |
It
is likely that a portion
of the 2008 dividends paid
to shareholders will
be accounted for as a return
of capital.
|
| ► |
The
Board of Directors will review
dividend policy for 2009
at its regularly
scheduled November meeting.
|
| ► |
We
will not pay a special dividend
in
2008.
|
THE
REDWOOD REVIEW 3RD QUARTER
2008 21
 |
|
|
CAPITAL & LIQUIDITY
|
Summary
What
is this?
We
use capital to fund our operations,
invest in earning assets that are primarily
credit sensitive and illiquid, fund
working capital, and meet lender capital
requirements with respect to collateralized
borrowings.
Through
our internal risk-adjusted capital
policy, we allocate a prudent level
of
capital for our earning assets to meet
liquidity needs that may arise. In
most
cases, the amount of allocated capital
is equal to 100% of the fair value
of the
asset. The amount of capital that exceeds
our risk-adjusted capital guideline,
less short-term debt, pending investment
settlements, operating expense
allocations, and other miscellaneous
capital allocations, is excess capital
that
can be invested to support business
growth.
Our
capital base includes common equity
plus $150 million of long-term debt
at
Redwood, which is due in 2037.
Declines
in the fair value of assets do not
have an effect on excess capital, as
asset
value declines equally reduce both
available capital and capital required
for
these investments.
The
chart below provides a summary of our
aggregate capital at work and excess
capital at the end of each of the quarters
noted.
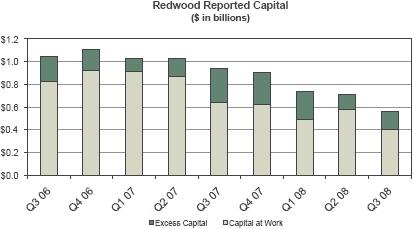
Quarterly
Update
| ► |
Our
net liquid assets at September
30, 2008, totaled $183 million
and included
$177 million of unrestricted
cash and $13 million of AAA-rated
prime
securities at fair value,
less $7 million of short-term
Redwood
debt.
|
| ► |
At
September 30, 2008, our reported
capital totaled $562 million,
compared to
$714 million at June 30,
2008. Our reported capital
includes $412 million
of GAAP equity and $150 million
of long-term debt at Redwood.
The decline
in our reported capital during
the quarter generally reflects
the decrease
in the estimated market value
of our assets.
|
22
THE REDWOOD REVIEW 3RD QUARTER 2008
|
|
|
|
CAPITAL
& LIQUIDITY
|
Quarterly
Update (continued)
| ► |
Our
excess capital position
was $163 million at September
30, 2008, an
increase from $132 million
at June 30, 2008. During
the third quarter, our
sources of capital were
$46 million from portfolio
cash flows and
management fees in excess
of operating costs and
financing costs, $8
million raised from stock
issuances under our direct
stock purchase and
dividend reinvestment
plan, and $8 million
from asset sales. Our
uses of
capital were $6 million
for share buybacks, and
$25 million for dividends.
|
| ► |
We
believe
the residential investment
outlook has recently
improved. Secondary
trading activity has
picked up and the amount
of securities available
for
purchase at attractive
prices has been increasing.
Trading activity could
increase further as the
financial services industry
continues to
deleverage. In mid-October,
we selectively resumed
our investment
activity, but the potential
opportunities may far
exceed our excess
capital. As a result,
we may explore raising
non-dilutive capital
to
enable Redwood to take
advantage of future investment
opportunities.
|
THE
REDWOOD REVIEW 3RD QUARTER
2008 23
 |
|
|
MARK-TO-MARKET ADJUSTMENTS
|
Market
Conditions
| ► |
Pricing
for residential mortgage-backed
securities (RMBS) and
commercial mortgage-backed securities
(CMBS) and CDO securities
came under renewed
pressure during the
third quarter due to
the high level
of distress in the
global credit markets,
driving down the value
of our
assets.
|
| ► |
There
was limited liquidity
in the market for non-agency
residential and
commercial mortgages.
In general, only seriously
distressed sellers
sold
assets.
|
| ► |
Since
the end of the third
quarter, market activity
has increased as securities
prices have continued
to drift lower.
|
| ► |
Industry-wide,
new residential non-agency
securitizations totaled
only $2 billion in
the
third quarter, down
from $25 billion in
the second quarter
and $124
billion in the third
quarter of 2007. There
were no commercial
securitizations in
the third quarter,
and the year-to-date
issuance of $12
billion is down 94%
from the same period
a year ago.
|
| ► |
The
table below illustrates
the additional spread
that investors have
required
to compensate for
the perceived credit
risk of various types
of RMBS and
CMBS.
|
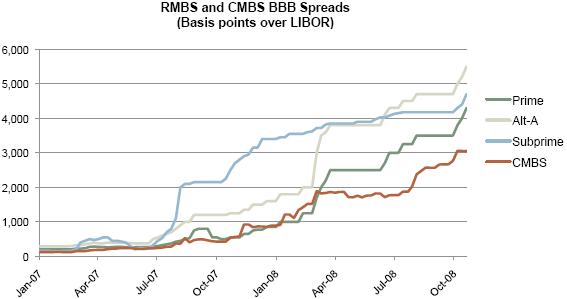
| ► |
For
some assets, declines
in fair values reflect
the near certainty
of serious
credit losses being
realized. For others,
significant future
losses may
not occur, but there
is a perceived increase
in the risk of loss,
resulting in a lower
value. Finally, many
assets are not at serious
risk
of loss, but their
declining value largely
reflects a limited
number of
observed sales in the
market as well as reduced
liquidity and increased
buyer caution.
|
| ► |
The
accounting rules regarding
MTM accounting are
complex and may not
clearly
reflect the underlying
economics. This topic
is more fully discussed
in
the Accounting Discussion
module in the Appendix.
|
| ► |
Financial
Table 16 in the back
of this Review details
the fair value of the
residential, commercial,
and CDO securities
at Redwood as a percentage
of
their face value as
of September 30, 2008.
|
24
THE REDWOOD REVIEW 3RD QUARTER
2008
|
|
|
|
MARK-TO-MARKET
ADJUSTMENTS
|
Total
Mark-to-Market Adjustments
| u |
Consolidated
MTM adjustments
were a negative
$127 million in
the third quarter.
As
discussed below,
negative MTM adjustments
at Redwood totaled
$88 million,
negative MTM adjustments
at the Fund were
$8 million, negative
MTM
adjustments at
Sequoia were $2
million, and negative
MTM adjustments
at
Acacia were $29
million.
|
Impact
on Redwood
| ► |
During
the third quarter,
total negative MTM
adjustments were
$107 million for
securities held at
Redwood (exclusive
of securities at
or investments in
the Fund, Sequoia,
and Acacia). We estimate
that approximately
two-thirds
of the decline in
market value was
caused by a lack
of liquidity in the
market and one-third
was caused by a combination
of slowing prepayments
and deteriorating
credit expectations.
|
| ► |
The
tables below detail
the MTM adjustments
during the third
quarter on
securities held at
Redwood by underlying
collateral type and
by vintage.
|
|
Mark-to-Market
Adjustments
|
||||||||||||||||
|
on
Assets at Redwood
|
||||||||||||||||
|
Three
Months Ended September
30, 2008
|
||||||||||||||||
|
($
in millions)
|
||||||||||||||||
|
Loans
&
|
MTM
|
|||||||||||||||
|
IGS
|
CES
|
Derivatives
|
Total
|
Percent
(a)
|
||||||||||||
|
Residential
|
||||||||||||||||
|
Prime
|
$
|
(34
|
)
|
$
|
(35
|
)
|
$
|
-
|
$
|
(69
|
)
|
(39
|
)%
|
|||
|
Non-prime
|
(8
|
)
|
(2
|
)
|
-
|
(10
|
)
|
(17
|
)%
|
|||||||
|
Total
Residential
|
(42
|
)
|
(37
|
)
|
-
|
(79
|
)
|
|||||||||
|
Commercial
|
-
|
(25
|
)
|
-
|
(25
|
)
|
(28
|
)%
|
||||||||
|
CDO
|
(3
|
)
|
1
|
-
|
(2
|
)
|
(40
|
)%
|
||||||||
|
Interest
rate
agreements & other derivatives
|
-
|
-
|
(1
|
)
|
(1
|
)
|
||||||||||
|
Total
mark-to-market
adjustments
|
$
|
(45
|
)
|
$
|
(61
|
)
|
$
|
(1
|
)
|
$
|
(107
|
)
|
||||
|
By
Vintage & Equity
|
||||||||||||||||||||||
|
<=
2004
|
|
2005
|
|
2006
|
|
2007
|
2008
|
Loans
& Derivatives
|
Total
|
|||||||||||||
|
Total
mark-to-market
adjustments
|
$
|
(39
|
)
|
$
|
(27
|
)
|
$
|
(28
|
)
|
$
|
(7
|
)
|
$
|
(5
|
)
|
$
|
(1
|
)
|
$
|
(107
|
)
|
|
|
MTM
percent (a)
|
(34
|
)%
|
(29
|
)%
|
(35
|
)%
|
(17
|
)%
|
(57
|
)%
|
||||||||||||
| (a) |
This
percentage represents
the MTMs taken
as a percentage
of the reported
fair
values at the
beginning of
the period or
purchase price
if acquired during
the period. It
is intended to
highlight the
price declines
by collateral
type for the
three months
ended September
30, 2008. These
price declines
are specific
to our portfolio
and may not be
indicative of
price declines
in the market
in
general.
|
| ► |
During
the third quarter
of 2008, $88 million
of the total MTM
adjustments were
reported on Redwood’s income statement
and $19 million were
charged
directly to equity.
Of the amount reported
on the income statement,
$85
million represented
assets accounted
for at other-than-temporary
impairments on available-for-sale
securities and $3
million represented
fair value adjustments.
|
THE
REDWOOD REVIEW 3RD QUARTER
2008 25
|
|
|
|
MARK-TO-MARKET ADJUSTMENTS
|
Impact
on Redwood (continued)
| ► |
The
table below shows
the impact of MTM
adjustments of the
securities at
Redwood on our balance
sheet and income
statement in the
third quarter.
|
|
Mark-to-Market
Adjustments on
Assets
|
||||
|
at
Redwood
|
||||
|
Balance
Sheet and Income
Statement Effects
|
||||
|
Three
Months Ended September
30, 2008
|
||||
|
($
in millions)
|
||||
|
Balance
sheet effect
|
||||
|
Net
change in equity
account
|
$
|
(19
|
)
|
|
|
Income
statement effect
|
||||
|
Market
valuation adjustments
|
||||
|
Fair
value assets
|
(3
|
)
|
||
|
Impairment
on AFS securities
|
(85
|
)
|
||
|
Total
income statement
effect
|
(88
|
)
|
||
|
Total
mark-to-market
adjustments
|
$
|
(107
|
)
|
|
Impact
on Assets at the Fund
| ► |
During
the third quarter,
total mark-to-market
adjustments at the
Fund totaled
$10 million, of which
$8 million were deemed
other-than-temporary
impairments. There
were no impairments
on securities owned
by the Fund in
prior quarters. All
of the securities
owned by the Fund
were classified as
available-for-sale.
|
Impact
on Assets and Liabilities at
Sequoia
| ► |
During
the third quarter,
MVA totaled $2 million
stemming from a decrease
in the
fair value of real
estate owned. Both
the loans and ABS
issued at Sequoia
are carried at their
amortized cost basis.
|
26
THE REDWOOD REVIEW 3RD QUARTER
2008
|
|
|
|
MARK-TO-MARKET
ADJUSTMENTS
|
Impact
on Assets and Liabilities held
by Acacia Entities
| ► |
The
table below shows
detail for the
MTM adjustments
during the third
quarter
for the assets
and liabilities
held by Acacia
entities.
|
|
Mark-to-Market
Adjustments
|
||||
|
on
Acacia Assets
and Liabilities
|
||||
|
Three
Months Ended
September 30,
2008
|
||||
|
($
in millions)
|
||||
|
Assets
|
||||
|
Real
estate securities
and loans
|
$
|
(225
|
)
|
|
|
Interest
rate agreements
and other derivatives
|
(11
|
)
|
||
|
Liabilities
|
||||
|
ABS
issued
|
207
|
|||
|
Net
mark-to-market
adjustments
|
$
|
(29
|
)
|
|
| ► |
During
the third quarter,
market prices for
the assets owned
by the Acacia
entities and the
related debt declined
further due to
continuing credit
deterioration,
rating agency downgrades,
and a market in
which there was
light trading volume.
|
| ► |
The
entire net negative
$29 million of
MTM adjustments
for Acacia was
reflected in our
income statement
as required by
FAS 159.
|
| ► |
As
a result of the
measurement techniques
required by FAS
157, we may
continue to encounter
MTM earnings volatility
due to the consolidation
of
Acacia entities,
although we also
expect this volatility
to be less than
we encountered
in prior periods.
This complex topic
is discussed in
the
Investments in
Acacia module later
in this
Review.
|
THE
REDWOOD REVIEW 3RD QUARTER
2008 27
|
|
|
|
MARK-TO-MARKET
ADJUSTMENTS
|
Mark-to-Market
Valuation Process
| ► |
The
market values
we use for
our assets
and liabilities
reflect the
price we
believe we
believe we
would realize
if we chose
to sell our
securities
or
would have
to pay if we
chose to buy
back our liabilities
or asset-backed
securities
(ABS) issued
liabilities.
This is the
required accounting
standard even
if we have
no intention
to sell assets.
Establishing
market
values in thinly
traded or essentially
closed markets
is inherently
subjective
and is dependent
upon many market-based
inputs, including
observable
trades, information
on offered
inventories,
bid lists,
and
indications
of value obtained
from dealers.
Obtaining fair
values for
securities
is especially
difficult for
illiquid securities
(such as the
securities
we own), and
is made more
difficult when
there is limited
trading visibility,
as has been
the case in
recent months.
When there
have
been observable
sales, many
of them are
by distressed
sellers and
tend to
further depress
asset prices.
For these reasons,
we expect market
valuations
to continue
to be highly
volatile.
|
| ► |
Although
the Financial
Accounting
Standards Board
issued clarifying
guidance
recently on
marking assets
to fair value,
it did not
change the
accounting
requirements
nor did it
affect our
valuation process.
We continue
to value
our securities
at prices where
we believe
we can sell
them in the
current
illiquid market.
|
| ► |
Fair
values for
our securities
and ABS issued
are dependent
upon a number
of
market-based
assumptions,
including future
interest rates,
prepayment
rates, discount
rates, credit
loss rates,
and the timing
of credit losses.
We use these
assumptions
to generate
cash flow estimates
and internal
values for
each individual
security.
|
| ► |
Our
valuation process
continues to
rely primarily
on our internal
assumptions
to estimate
the fair values
of our securities
at September
30, 2008. We
do, however,
request indications
of value (marks)
from dealers
on all of
our assets
and liabilities
every quarter
to assist in
the valuation
process.
|
| ► |
For
September 30,
2008, we received
dealer marks
on 75% of the
assets and
88%
of our liabilities
on our consolidated
balance sheet.
One major dealer
that we have
used in prior
periods provided
no marks this
quarter. In
the
aggregate,
our internal
valuations
of the securities
on which we
received
dealer marks
were 20% lower
than the aggregate
dealer marks
at September
30, 2008. Our
internal valuations
of our ABS
issued on which
we received
dealer marks
were within
1% of the aggregate
dealer marks
at September
30,
2008.
|
| ► |
One
of the factors
we consider
in our valuation
process is
our assessment
of
the quality
of the dealer
marks we receive.
Dealers remain
inundated with
requests for
quarter-end
marks, and
there continues
to be limited
observable
trading information
for them to
rely upon.
Thus, their
marks
are most likely
generated by
their own pricing
models for
which they
do
not share their
inputs. Thus
we have little
insight into
their modeling
assumptions.
|
| ► |
Furthermore,
the dealers
continue to
heavily qualify
the information
they send to
us.
The qualifications
include statements
to the effect
that the markets
are
very volatile
and are characterized
by limited
trading volume
and poor
price transparency.
|
28
THE REDWOOD REVIEW 3RD
QUARTER 2008
|
|
 |
|
RESIDENTIAL
REAL ESTATE
SECURITIES
|
Summary
What
is this?
Redwood
invests in securities
that are backed by
pools of residential
real estate loans.
Historically, these
securities were primarily
CES, but recent acquisitions
of
IGS have resulted in
a larger percentage
of IGS to total securities.
Most of our
investments in residential
real estate securities
are backed by prime
residential loans and
some are backed by
alt-a or subprime loans.
The following
discussion refers only
to the residential
securities owned by
Redwood, exclusive
of the securities owned
by Sequoia, Acacia,
and the Fund, and exclusive
of
Redwood’s investments in these
entities.
Quarterly
Update
| ► |
Our
residential
securities
portfolio
decreased
by $87 million
(or 35%)
to $160
million in
the third
quarter.
We did not
acquire securities
during the
quarter.
MVA totaled
a negative
$79 million,
principal
payments
were $17
million,
and we recognized
$9 million
in discount
accretion.
|
| ► |
Industry-wide,
securitization
of non-agency
prime residential
loans was
virtually
shut
down in the
third quarter
at only $0.3
billion compared
to $1 billion
in
the second
quarter and
$40 billion
in the third
quarter one
year ago.
The
non-agency
prime securitization
market for
newly originated
loans remains
effectively
closed, largely
because AAA
investors
are demanding
yields
that render
new securitization
activity
uneconomic.
|
| ► |
Housing
market conditions
remain a
significant
concern.
Home prices,
as measured
by the S&P/Case-Shiller
Home Price
Index (composite-20),
were down
16.6% at
the end of
August from
a year ago,
and 20.3%
from the
peak in
July 2006.
This index
has declined
for 25 consecutive
months. Foreclosure
filings were
up 71% in
the third
quarter from
the third
quarter of
2007,
according
to Realty
Trac.
|
| ► |
The
principal
value of
credit losses
on our prime
CES was $24
million during
the third
quarter,
an increase
from $18
million in
the second
quarter and
$7 million
in the first
quarter.
The principal
value of
credit losses
on
our non-prime
CES was $57
million during
the third
quarter,
an increase
from $49
million in
the second
quarter and
$24 million
in the first
quarter.
These amounts
were charged
against our
GAAP credit
reserve,
which
totaled $556
million ($16.74
per share)
for residential
CES at September
30, 2008.
|
| ► |
For
tax purposes,
losses on
our prime
securities
were $12
million ($0.36
per
share) and
losses on
our non-prime
securities
were $20
million ($0.59
per
share). These
deductions
are less
than the
principal
value of
credit
losses incurred
on the underlying
loans as
we own most
of our credit
sensitive
securities
at a tax
basis that
is substantially
less than
par
value.
|
| ► |
Prepayment
rates slowed
on residential
loans because
of tighter
underwriting
standards,
higher down
payment requirements,
the continuing
decline in
housing prices,
the shutdown
of the non-agency
securitization
market, and
the increase
in mortgage
interest
rates over
the past
quarter.
Notably,
non-agency
prepayment
rates slowed
more than
agency prepayment
rates as
there was
little incentive
for borrowers
to
refinance.
|
| ► |
A
moderate
increase
in prepayment
speeds from
the very
low current
speeds
could result
in a disproportionately
higher increase
in the yield
on, and
market values
of, our securities.
|
THE
REDWOOD REVIEW 3RD
QUARTER
2008 29
|
|
|
|
RESIDENTIAL
REAL ESTATE
SECURITIES
|
Prime
Securities Portfolio
What
is this?
Prime
securities are mortgage-backed
securities backed
by high-credit quality
residential loans.
The borrowers typically
have high FICO credit
scores. The
loans have relatively
low loan-to-value
(LTV) ratios. The
following discussion
refers only to the
prime securities
at Redwood, exclusive
of prime securities
owned by Acacia,
Redwood’s investments in
Sequoia, and securities
owned by the
Fund.
Quarterly
Update
| ► |
The
following
table presents
the activity
in our
prime securities
portfolio
during
the third
quarter
of 2008.
The carrying
value as
a percentage
of
face value
for all
our securities
is detailed
on Table
16 in the
Financial
Tables
section.
|
|
|
|
|||
|
|
|
|||
|
Prime
Securities
at Redwood
|
||||
|
Three
Months
Ended
September
30, 2008
|
||||
|
($
in millions)
|
||||
|
|
|
|||
|
Market
value
at June
30, 2008
|
$
|
181
|
||
|
|
|
|||
|
Acquisitions
|
-
|
|||
|
Sales
|
-
|
|||
|
Principal
payments
|
(11
|
)
|
||
|
Discount
amortization
|
5
|
|||
|
Changes
in
market
value,
net
|
(68
|
)
|
||
|
|
|
|||
|
Market
value
at September
30, 2008
|
$
|
107
|
||
| ► |
Total
interest
income
generated
by our
prime securities
was $12
million
in the
third quarter.
The annualized
interest
income
over our
$175 million
average
amortized
cost was
27%.
|
30
THE REDWOOD REVIEW
3RD QUARTER 2008
|
|
|
|
RESIDENTIAL
REAL ESTATE
SECURITIES
|
Prime
Securities Portfolio
Quarterly
Update (continued)
|
►
|
The
table below
presents
rating
and vintage
information
of the
prime
securities
in our
portfolio
at September
30, 2008.
The vintage
shown is
the year
the securitization
was completed
and may
include
residential
real
estate
loans originated
in an earlier
year.
|
|
Prime
Securities
at Redwood
|
|||||||||||||||||||
|
By
Rating
and Vintage
|
|||||||||||||||||||
|
September
30, 2008
|
|||||||||||||||||||
|
(by
market
value,
$ in
millions)
|
|||||||||||||||||||
|
<=2004
|
|
2005
|
|
2006
|
|
2007
|
|
2008
|
|
Total
|
|||||||||
|
IGS
|
|||||||||||||||||||
|
AAA
|
$
|
1
|
$
|
3
|
$
|
10
|
$
|
-
|
$
|
-
|
$
|
14
|
|||||||
|
AA
|
14
|
14
|
-
|
3
|
2
|
33
|
|||||||||||||
|
A
|
8
|
-
|
3
|
-
|
1
|
12
|
|||||||||||||
|
BBB
|
6
|
1
|
-
|
-
|
-
|
7
|
|||||||||||||
|
Total
IGS
|
29
|
18
|
13
|
3
|
3
|
66
|
|||||||||||||
|
CES
|
|||||||||||||||||||
|
BB
|
8
|
3
|
-
|
1
|
-
|
12
|
|||||||||||||
|
B
|
11
|
-
|
1
|
1
|
-
|
13
|
|||||||||||||
|
NR
|
13
|
1
|
1
|
1
|
-
|
16
|
|||||||||||||
|
Total
CES
|
32
|
4
|
2
|
3
|
-
|
41
|
|||||||||||||
|
Market
value
|
$
|
61
|
$
|
22
|
$
|
15
|
$
|
6
|
$
|
3
|
$
|
107
|
|||||||
|
By
Loan
Type
and Vintage
|
|||||||||||||||||||
|
<=2004
|
2005
|
2006
|
2007
|
2008
|
Total
|
||||||||||||||
|
ARM
|
$
|
3
|
$
|
-
|
$
|
-
|
$
|
-
|
$
|
-
|
$
|
3
|
|||||||
|
Fixed
|
13
|
-
|
2
|
5
|
2
|
22
|
|||||||||||||
|
Hybrid
|
45
|
22
|
13
|
1
|
1
|
82
|
|||||||||||||
|
Market
value
|
$
|
61
|
$
|
22
|
$
|
15
|
$
|
6
|
$
|
3
|
$
|
107
|
|||||||
| ► |
IGS
represent
62% of
our prime
securities
portfolio.
As noted
earlier,
we do
not rely
on credit
ratings
as part
of our
investment
decision
process.
Our
acquisition
decisions
are based
on the
strength
of the
underlying
collateral
cash flows
and the
level of
subordination
to protect
against
projected
credit
losses.
|
| ► |
Our
prime CES
portfolio
is concentrated
in more
seasoned
assets
originated
in
2004 and
earlier
(78% by
current
market
value).
Although
delinquencies
are
currently
rising
across
all vintages,
these seasoned
CES are
still
performing
within
our original
expectations
and are
carried
at 18%
of face
value on
our balance
sheet.
|
| ► |
For
our prime
CES of
2005 and
later vintages
(22% by
current
market
value),
the performance
is generally
worse than
our original
expectations.
Credit
performance
for these
vintages
has been
more negatively
impacted
by
declining
home prices,
as many
borrowers
now have
negative
equity
in their
houses.
Our estimate
of market
value is
5% of principal
value for
these
securities
and it
represents
2% of our
capital.
|
THE
REDWOOD REVIEW
3RD QUARTER
2008 31
|
|
|
|
RESIDENTIAL
REAL
ESTATE
SECURITIES
|
Prime
Securities Portfolio
Quarterly
Update (continued)
|
►
|
The
chart
below
shows
the level
of serious
delinquencies
of our
prime
CES by
vintage
at the
end of
each
quarter
since
the beginning
of
2006.
|
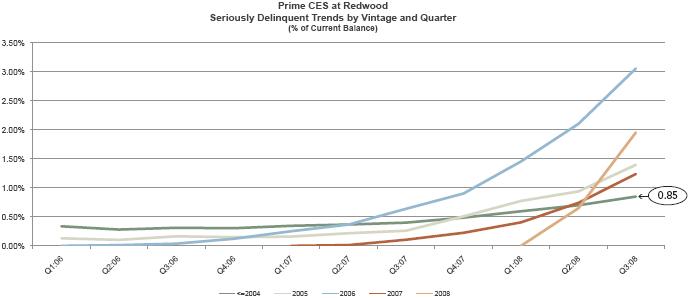
| ► |
The
chart
above
shows
that
delinquencies
for
the
2008
vintage
securities
are
rising
rapidly.
The
market
value
of
our
investment
in
the
2008
vintage
was
$3
million
at
September
30,
2008.
|
32
THE REDWOOD REVIEW
3RD QUARTER 2008
|
|
|
|
RESIDENTIAL
REAL
ESTATE
SECURITIES
|
Prime
Securities Portfolio
Quarterly
Update (continued)
|
►
|
As
a
result
of
the
increased
delinquencies
and
continued
weakening
of
the
housing
markets,
we
have
increased
our
level
of
credit
reserves.
As
seen
in
the
table
below,
our
investments
in
prime
CES
totaled
$41
million
at
September
30,
2008.
These
investments
have
a
face
value
of
$361
million,
of
which
we
have
reserved
$287
million
($8.63
per
share).
We
have
now
reserved
98%
of
face
value
for
all
non-rated,
first-loss
investments
of
2005
and
later
vintages.
The
market
value
of
our
investments
in
CES
of
2005
or
later
vintages
totaled
$9
million,
of
which
$3
million
is
invested
in
first-loss
securities.
|
|
Credit
Reserve
Analysis
-
Prime
CES
at
Redwood
|
|||||||||||||||||||||||||||||||||||||
|
By
Rating
and
Vintage
|
|||||||||||||||||||||||||||||||||||||
|
September
30,
2008
|
|||||||||||||||||||||||||||||||||||||
|
($
in
millions)
|
|||||||||||||||||||||||||||||||||||||
|
<=2004
|
2005 | 2006 | 2007 | 2008 | Total | ||||||||||||||||||||||||||||||||
|
Amount
|
%
of
loans
|
|
Amount
|
%
of
loans
|
Amount
|
|
%
of
loans
|
Amount
|
|
%
of
loans
|
Amount
|
|
%
of
loans
|
|
Amount
|
%
of
loans
|
|||||||||||||||||||||
|
BB
|
|||||||||||||||||||||||||||||||||||||
|
Face
|
$
|
37
|
0.47
|
%
|
$
|
28
|
0.35
|
%
|
$
|
-
|
$
|
6
|
0.37
|
%
|
$
|
6
|
0.50
|
%
|
$
|
77
|
0.41
|
%
|
|||||||||||||||
|
Unamortized
discount
|
(16
|
)
|
(3
|
)
|
-
|
-
|
-
|
.
|
(19
|
)
|
|||||||||||||||||||||||||||
|
Discount
designated
as
credit
reserve
|
(11
|
)
|
0.13
|
%
|
(22
|
)
|
0.27
|
%
|
-
|
(5
|
)
|
0.35
|
%
|
(6
|
)
|
0.50
|
%
|
(44
|
)
|
0.24
|
%
|
||||||||||||||||
|
Unrealized
gains
(losses)
|
(2
|
)
|
-
|
-
|
-
|
-
|
(2
|
)
|
|||||||||||||||||||||||||||||
|
Market
value
|
$
|
8
|
$
|
3
|
$
|
-
|
$
|
1
|
$
|
-
|
$
|
12
|
|||||||||||||||||||||||||
|
Overall
credit
protection
to
BB
CES
|
0.69
|
%
|
0.45
|
%
|
0.47
|
%
|
0.69
|
%
|
0.57
|
%
|
|||||||||||||||||||||||||||
|
B
|
|||||||||||||||||||||||||||||||||||||
|
Face
|
$
|
35
|
0.08
|
%
|
$
|
6
|
0.17
|
%
|
$
|
5
|
0.07
|
%
|
$
|
9
|
0.21
|
%
|
$
|
4
|
0.33
|
%
|
$
|
59
|
0.09
|
%
|
|||||||||||||
|
Unamortized
discount
|
(2
|
)
|
-
|
1
|
1
|
-
|
-
|
||||||||||||||||||||||||||||||
|
Discount
designated
as
credit
reserve
|
(19
|
)
|
0.04
|
%
|
(6
|
)
|
0.17
|
%
|
(5
|
)
|
0.07
|
%
|
(9
|
)
|
0.21
|
%
|
(4
|
)
|
0.33
|
%
|
(43
|
)
|
0.07
|
%
|
|||||||||||||
|
Unrealized
gains
(losses)
|
(3
|
)
|
-
|
-
|
-
|
-
|
(3
|
)
|
|||||||||||||||||||||||||||||
|
Market
value
|
$
|
11
|
$
|
-
|
$
|
1
|
$
|
1
|
$
|
-
|
$
|
13
|
|||||||||||||||||||||||||
|
Overall
credit
protection
to
B
CES
|
0.28
|
%
|
0.22
|
%
|
1.07
|
%
|
0.21
|
%
|
0.36
|
%
|
0.37
|
%
|
|||||||||||||||||||||||||
|
Unrated
|
|||||||||||||||||||||||||||||||||||||
|
Face
|
$
|
112
|
0.42
|
%
|
$
|
37
|
0.21
|
%
|
$
|
28
|
0.17
|
%
|
$
|
43
|
0.17
|
%
|
$
|
5
|
0.36
|
%
|
$
|
225
|
0.26
|
%
|
|||||||||||||
|
Unamortized
discount
|
(11
|
)
|
-
|
-
|
1
|
-
|
(10
|
)
|
|||||||||||||||||||||||||||||
|
Discount
designated
as
credit
reserve
|
(89
|
)
|
0.33
|
%
|
(36
|
)
|
0.19
|
%
|
(27
|
)
|
0.15
|
%
|
(43
|
)
|
0.17
|
%
|
(5
|
)
|
0.36
|
%
|
(200
|
)
|
0.23
|
%
|
|||||||||||||
|
Unrealized
(losses)
gains
|
1
|
-
|
-
|
-
|
-
|
1
|
|||||||||||||||||||||||||||||||
|
Market
value
|
$
|
13
|
$
|
1
|
$
|
1
|
$
|
1
|
$
|
-
|
$
|
16
|
|||||||||||||||||||||||||
| ► |
The
chart
on
the
prior
page
and
the
table
above
can
be
used
to
analyze
our
credit
reserves
relative
to
existing
credit
trends.
For
example,
the
chart
shows
that
serious
delinquencies
on
2004
and
prior
vintage
CES
are
currently
0.85%
of
collateral
loan
balances
at
September
30,
2008.
If
we
assume
a default
rate
of
seriously
delinquent
loans
of
75%
and
a loss
severity
of
40%,
total
expected
credit
losses
from
these
delinquencies
would
equal
0.26%
of
current
collateral
loan
balances.
Our
credit
reserves
on
2004
and
prior
vintage
unrated
CES
currently
total
0.33%
of
collateral
balances
(as
shown
in
the
table
above).
Under
this
scenario,
our
credit
reserves
on
our
unrated
CES
could
absorb
the
losses
from
the
existing
seriously
delinquent
loans
at
September
30,
2008,
plus
another
0.07%
of
future
losses.
|
| ► |
Note
that
regardless
of
how
high
delinquencies
rise,
once
losses
in
a pool
of
mortgages
exceed
our
investment
in
that
pool,
we
cannot
suffer
additional
losses
as
the
most
we
have
to
lose
is
capped
at
our
investment
in
the
securities
in
that
pool.
|
| ► |
Up
to
the
point
of
a credit
loss,
and
the
subsequent
reduction
of
principal
on
the
security,
we
will
continue
to
receive
interest
from
these
investments.
For
this
reason,
the
timing
of
credit
losses,
not
the
magnitude,
will
have
a greater
effect
on
future
cash
flows.
|
THE
REDWOOD REVIEW
3RD QUARTER
2008 33
|
|
|
|
RESIDENTIAL
REAL
ESTATE
SECURITIES
|
Prime
Securities
Portfolio
Quarterly
Update
(continued)
| ► |
The
following
chart
breaks
out
our
prime
portfolio
loan
types
by
weighted
average
interest
rate,
as
well
as
our
estimate
of
conforming
and
non-conforming
(i.e.,
jumbo)
balances
as
of
September
30,
2008.
This
chart
illustrates
how
our
portfolio
might
be
affected
by
refinancing
activity
from
a
reduction
in
interest
rates
and
increases
in
GSE
conforming
loan
limits.
The
housing
bill
that
was
signed
into
law
in
July
2008
changed
the
conforming
loan
limit
(effective
January
1,
2009)
to
$625,000,
and
we
estimate
that
approximately
68%
of
our
portfolio
is
or
will
be
eligible
for
purchase
by
the
GSEs
based
only
on
this
revised
GSE
conforming
loan
limit.
|
|
Prime
CES
at
Redwood
|
|||||||||||||||||||||||||||||||||||||
|
Composition
by
Product
Type,
Vintage,
and
Balance
|
|||||||||||||||||||||||||||||||||||||
|
September
30,
2008
(a)
|
|||||||||||||||||||||||||||||||||||||
|
<=
2004
|
2005
|
2006
|
2007
|
2008
|
Total
|
||||||||||||||||||||||||||||||||
|
Product
|
%
of
Balance
|
|
Wtd
Avg
Loan
Rate
|
|
%
of
Balance
|
Wtd
Avg
Loan
Rate
|
|
%
of
Balance
|
Wtd
Avg
Loan
Rate
|
%
of
Balance
|
Wtd
Avg
Loan
Rate
|
|
%
of
Balance
|
|
Wtd
Avg
Loan
Rate
|
%
of
Balance
|
Wtd
Avg
Loan
Rate
|
||||||||||||||||||||
|
Hybrid
|
36
|
%
|
4.83
|
%
|
71
|
%
|
5.47
|
%
|
65
|
%
|
6.09
|
%
|
31
|
%
|
6.36
|
%
|
11
|
%
|
6.35
|
%
|
46
|
%
|
5.26
|
%
|
|||||||||||||
|
ARM(b)
|
2
|
%
|
4.37
|
%
|
<1
|
%
|
4.61
|
%
|
<1
|
%
|
6.18
|
%
|
<1
|
%
|
6.41
|
%
|
-
|
-
|
1
|
%
|
4.43
|
%
|
|||||||||||||||
|
Fixed
|
24
|
%
|
5.66
|
%
|
7
|
%
|
6.03
|
%
|
18
|
%
|
6.37
|
%
|
64
|
%
|
6.45
|
%
|
88
|
%
|
6.55
|
%
|
23
|
%
|
5.88
|
%
|
|||||||||||||
|
Jumbo
|
62
|
%
|
78
|
%
|
83
|
%
|
96
|
%
|
99
|
%
|
70
|
%
|
|||||||||||||||||||||||||
|
Hybrid
|
14
|
%
|
4.99
|
%
|
20
|
%
|
5.58
|
%
|
16
|
%
|
6.13
|
%
|
<1
|
%
|
6.35
|
%
|
-
|
-
|
14
|
%
|
5.28
|
%
|
|||||||||||||||
|
ARM(b)
|
2
|
%
|
4.69
|
%
|
<1
|
%
|
4.66
|
%
|
-
|
-
|
<1
|
%
|
6.40
|
%
|
-
|
-
|
1
|
%
|
4.70
|
%
|
|||||||||||||||||
|
Fixed
|
22
|
%
|
5.97
|
%
|
2
|
%
|
6.00
|
%
|
1
|
%
|
6.49
|
%
|
3
|
%
|
6.57
|
%
|
1
|
%
|
6.37
|
%
|
15
|
%
|
5.98
|
%
|
|||||||||||||
|
Conforming
|
38
|
%
|
22
|
%
|
17
|
%
|
4
|
%
|
1
|
%
|
30
|
%
|
|||||||||||||||||||||||||
|
(a)
The
product
percentages
differ
from
other
tables
as
the
table
above
represents
our
exposure
on
a
loan
balance
basis
and
others
are
on
a
market
value
basis.
|
||||||||||||||||||
|
(b)
ARMs
are
indexed
to
one-or-six
month
LIBOR
and
have
a
weighted
average
margin
of
1.72%.
|
| ► |
A
significant
factor
in
the
rate
of
prepayments
is
the
level
of
mortgage
rates.
Historically,
jumbo
fixed-rate
mortgages
have
been
priced
to
a spread
of
roughly
1.25%
above
the
10-year
Treasury
note
yield.
While
the
10-year
note
yield
has
hovered
near
4.00%
for
the
past
year,
current
jumbo
fixed-rate
mortgages
are
close
to
8.00%,
implying
a spread
over
the
10-year
note
well
above
the
recent
norm
(as
seen
in
the
chart
below).
Should
jumbo
fixed-rate
mortgage
spreads
fall
back
to
historical
levels,
many
borrowers
will
have
an
incentive
to
refinance
and
prepayments
rate
could
increase
substantially
from
the
current
low
levels.
|
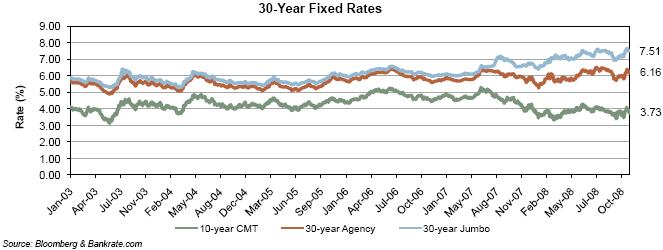
34
THE REDWOOD
REVIEW 3RD
QUARTER 2008
|
|
|
|
RESIDENTIAL
REAL
ESTATE
SECURITIES
|
Prime
Securities
Portfolio
Quarterly
Update
(continued)
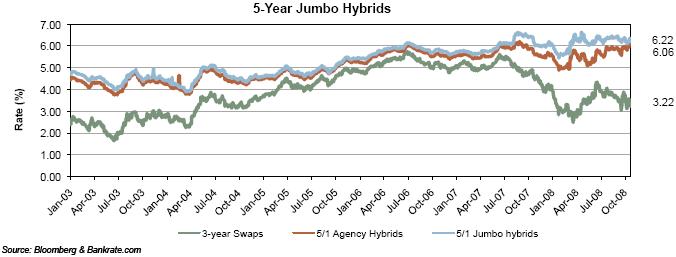
| ► |
The
chart
below
shows
the
trends
in
our
residential
prime
CES
prepayment
speeds,
which
have
been
declining
for
our
adjustable-rate
mortgages
and
remain
at
low
speeds
for
our
fixed
and
hybrid
loans.
|
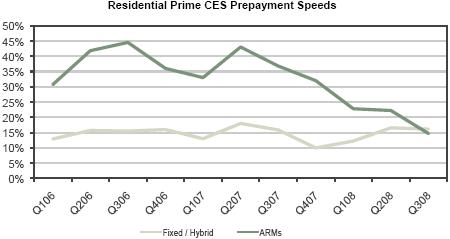
| ► |
The
degree
of
refinancing
activity
is
important
to
consider,
since
our
credit
reserves
provide
protection
on
securities
that
we
have
purchased
at
a
substantial
discount
to
principal
face
value
amounts.
All
things
being
equal,
faster
prepayments
would
benefit
these
investments
by
accelerating
the
collection
of
principal
and
the
potential
recovery
of
credit
reserves.
|
| ► |
CES
backed
by
2004
and
prior
originations
are
especially
sensitive
to
the
rate
of
prepayments
as
many
of
the
securities
are
close
to
or
are
already
receiving
principal
payments.
An
uptick
in
prepayments
could
have
a
significant
beneficial
effect
on
cash
flows
and
valuations.
|
THE
REDWOOD
REVIEW
3RD QUARTER
2008 35
|
|
|
|
RESIDENTIAL
REAL
ESTATE
SECURITIES
|
Prime
Securities
Portfolio
Quarterly
Update
(continued)
| ► |
We
believe
the
loan
characteristics
of
our
prime
portfolio
set
forth
below
illustrate
the
high
quality
of
these
loans,
including
relatively
low
LTV
ratios
and
high
FICO
scores.
As
the
following
table
also
illustrates,
we
have
geographically
diverse
pools
of
prime
loans
that
are
generally
seasoned
over
three
years.
|
|
Residential
Prime
CES
at
Redwood
|
|||||
|
Underlying
Loan
Characteristics
|
|||||
|
September
30,
2008
|
|||||
|
Number
of
loans
|
247,449
|
Wtd
Avg
FICO
|
748
|
||
|
Total
loan
face
($
in
millions)
|
$101,075
|
FICO:
<620
|
1%
|
|
|
|
Average
loan
size
($
in
1000's)
|
$408
|
FICO:
621
-
660
|
4%
|
||
|
FICO:
661
-
700
|
14%
|
||||
|
Southern
CA
|
25%
|
FICO:
701
-
740
|
26%
|
||
|
Northern
CA
|
23%
|
|
FICO:
>
740
|
53%
|
|
|
Florida
|
5%
|
Unknown
|
2%
|
||
|
New
York
|
6%
|
||||
|
Georgia
|
2%
|
Conforming
at
origination
%
|
24%
|
||
|
New
Jersey
|
3%
|
>
$1
MM
%
|
8%
|
||
|
Other
states
|
36%
|
||||
|
|
2nd
home
%
|
6%
|
|||
|
2008
origination
|
<1%
|
|
Investment
home
%
|
1%
|
|
|
2007
origination
|
6%
|
|
|||
|
2006
origination
|
11%
|
Purchase
|
43%
|
||
|
2005
origination
|
21%
|
Cash
out
refi
|
21%
|
||
|
2004
origination
and
earlier
|
62%
|
Rate-term
refi
|
36%
|
||
|
Full
doc
|
53%
|
||||
|
Wtd
Avg
Original
LTV
|
69%
|
No
doc
|
7%
|
||
|
Original
LTV:
0
-
50
|
14%
|
Other
(limited,
etc)
|
37%
|
||
|
Original
LTV:
50
-
60
|
12%
|
Unknown
|
3%
|
||
|
Original
LTV:
60.
-
70
|
22%
|
|
|||
|
Original
LTV:
70
-
80
|
49%
|
2-4
family
|
1%
|
|
|
|
Original
LTV:
80
-
90
|
2%
|
Condo
|
11%
|
|
|
|
Original
LTV:
90
-
100
|
1%
|
Single
family
|
88%
|
||
36
THE REDWOOD
REVIEW
3RD QUARTER
2008
|
|
|
|
RESIDENTIAL
REAL
ESTATE
SECURITIES
|
Non-Prime
Securities
Portfolio
What
is
this?
Non-prime
securities
include
option-ARM,
alt-a,
and
subprime
securities.
The
following
discussion
reflects
only
the
non-prime
securities
at
Redwood,
exclusive
of
non-prime
securities
owned
by
Acacia
or
the
Fund.
Alt-a
securities
are
residential
mortgage-backed
securities
backed
by
loans
that
generally
have
higher
credit-quality
characteristics
than
subprime,
but
lower
credit-quality
characteristics
than
prime.
Subprime
securities
are
residential
mortgage-backed
securities
backed
by
lower-quality
loans.
Many
subprime
borrowers
have
impaired
credit
histories.
Option-ARM
securities
are
residential
mortgage-backed
securities
backed
by
loans
that
allow
borrowers
to
make
payments
that
are
less
than
the
monthly
accrued
interest
on
the
mortgages.
Quarterly
Update
| ► |
The
following
table
presents
the
activity
in
our
non-prime
securities
portfolio
during
the
third
quarter
of
2008.
|
|
Non-Prime
Securities
at
Redwood
|
||||
|
Three
Months
Ended
September
30,
2008
|
||||
|
($
in
millions)
|
||||
|
Market
value
at
June
30,
2008
|
$
|
66
|
||
|
Acquisitions
|
-
|
|||
|
Sales
|
-
|
|||
|
Principal
payments
|
(6
|
)
|
||
|
Discount
amortization
|
4
|
|||
|
Changes
in
market
value,
net
|
(11
|
)
|
||
|
Market
value
at
September
30,
2008
|
$
|
53
|
||
| ► |
Total
interest
income
generated
by
our
non-prime
securities
was
$7
million
in
the
quarter,
an
annualized
yield
of
43%
on
our
average
amortized
cost
of
these
securities
of
$68
million.
|
THE
REDWOOD
REVIEW
3RD
QUARTER
2008 37
|
|
|
|
RESIDENTIAL
REAL
ESTATE
SECURITIES
|
Non-Prime
Securities
Portfolio
Quarterly
Update
(continued)
| ► |
The
table
below
presents
rating
and
vintage
information
of
the
non-prime
securities
in
our
portfolio
at
September
30,
2008.
The
vintage
shown
is
the
year
the
securitization
was
completed
and
may
include
real
estate
loans
originated
in
an
earlier
year.
|
|
Non-Prime
Securities
at
Redwood
|
||||||||||||||||
|
By
Rating
and
Vintage
|
||||||||||||||||
|
September
30,
2008
|
||||||||||||||||
|
(by
market
value,
$
in
millions)
|
||||||||||||||||
|
<=2004
|
2005
|
|
2006
|
|
2007
|
|
Total
|
|||||||||
|
IGS
|
||||||||||||||||
|
AAA
|
$
|
-
|
$
|
24
|
$
|
10
|
$
|
13
|
$
|
47
|
||||||
|
Total
IGS
|
-
|
24
|
10
|
13
|
47
|
|||||||||||
|
CES
|
||||||||||||||||
|
B
|
-
|
-
|
-
|
2
|
2
|
|||||||||||
|
NR
|
1
|
1
|
-
|
2
|
4
|
|||||||||||
|
Total
CES
|
1
|
1
|
-
|
4
|
6
|
|||||||||||
|
Market
value
|
$
|
1
|
$
|
25
|
$
|
10
|
$
|
17
|
$
|
53
|
||||||
|
By
Loan
Type
and
Vintage
|
||||||||||||||||
|
<=2004
|
|
2005
|
|
2006
|
|
2007
|
|
Total
|
||||||||
|
Hybrid
|
$
|
-
|
$
|
-
|
$
|
1
|
$
|
15
|
$
|
16
|
||||||
|
Option
Arm
|
1
|
25
|
9
|
2
|
37
|
|||||||||||
|
Market
value
|
$
|
1
|
$
|
25
|
$
|
10
|
$
|
17
|
$
|
53
|
||||||
| ► |
At
September
30,
2008,
89%
of
our
non-prime
portfolio
was
IGS,
which
had
an
average
of
32
percentage
points
of
credit
support
from
lower-rated
subordinate
securities.
|
| ► |
$6
million,
or
1%
of
our
capital,
was
invested
in
non-prime
CES
at
September
30,
2008.
The
aggregate
fair
value
of
our
non-prime
securities
was
14%
of
principal
value.
|
| ► |
Our
option
ARM
non-prime
securities
consist
of
$33
million
of
AAA-rated
IGS
and
$4
million
of
CES.
Our
hybrid
non-prime
securities
include
$14
million
of
IGS
and
$2
million
of
CES.
|
38
THE
REDWOOD
REVIEW
3RD
QUARTER
2008
|
|
|
|
RESIDENTIAL
REAL
ESTATE
SECURITIES
|
Non-Prime
Securities
Portfolio
Quarterly
Update
(continued)
|
►
|
Our
non-prime
CES
portfolio
was
nearly
fully
reserved
for
credit
losses,
with
an
aggregate
face
value
of
$261
million
and
credit
reserves
of
$248
million
($7.46
per
share)
at
September
30,
2008.
|
| ► |
Seriously
delinquent
loans
underlying
our
non-prime
CES
were
15%
at
September
30,
2008.
|
| ► |
Prepayment
speeds
on
non-prime
CES
have
continued
to
slow
as
refinancing
options
for
these
borrowers
are
generally
diminishing,
as
illustrated
in
the
chart
below.
|
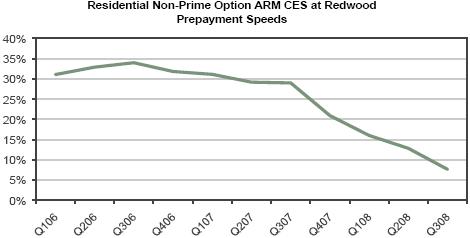
THE
REDWOOD
REVIEW
3RD
QUARTER
2008 39
 |
|
|
COMMERCIAL
REAL
ESTATE
SECURITIES
|
Commercial
Securities
Portfolio
What
is
this?
We
invest
in
securities
that
are
backed
by
pools
of
commercial
real
estate
loans.
The
following
discussion
refers
only
to
the
commercial
securities
owned
by
Redwood,
exclusive
of
commercial
securities
owned
by
Acacia.
Quarterly
Update
| ► |
Conditions
in
the
commercial
mortgage
market
deteriorated
during
the
quarter
due
to
the
upheaval
in
both
the
credit
and
equity
markets.
Trading
activity
was
limited,
reflecting
the
market
turmoil
and
the
continuing
negative
investor
sentiment
over
deteriorating
fundamentals
in
the
commercial
real
estate
market.
Spreads
widened
throughout
the
quarter
with
AAAs
increasing
by
about
165
basis
points
to
350
and
BBBs
increasing
about
900
basis
points
to
nearly
2,400
at
the
end
of
the
third
quarter
according
to
data
published
by
Commercial
Mortgage
Alert;
spreads
continued
to
widen
materially
following
the
end
of
the
quarter.
U.S.
commercial
mortgage-backed
securities
issuance
remains
weak,
with
no
issuance
in
the
third
quarter
and
nine
month
volume
($12
billion)
down
94%
from
the
year-ago
period.
|
| ► |
Financing
costs
for
property
acquisitions
remain
elevated
due
to
the
shutdown
of
the
commercial
mortgage
securitization
market
and
the
reduction
of
credit
available
from
the
commercial
banking
industry.
Tight
underwriting
standards
and
few
refinance
alternatives
will
likely
result
in
more
extensions
and
defaults
on
maturing
loans.
On
the
positive
side,
our
commercial
CES
is
primarily
backed
by
longer
term
fixed-rate
loans,
with
few
loans
scheduled
to
mature
in
the
near
term.
|
| ► |
According
to
monthly
data
compiled
by
Citigroup,
commercial
mortgage
delinquencies
have
increased
by
approximately
13
basis
points
since
the
beginning
of
the
year
to
0.52%
as
of
September
2008.
As
the
economy
slows
and
financing
becomes
increasingly
scarce
delinquency
rates
are
expected
to
increase.
|
| ► |
Our
commercial
securities
portfolio
declined
by
$27
million
to
$64
million
in
the
third
quarter
due
to
significantly
wider
spreads
for
CMBS.
|
| ► |
We
have
not
purchased
commercial
securities
since
the
first
quarter
of
2007.
We
continue
to
monitor
developments
and
trends
in
commercial
real
estate
and
positioning
ourselves
to
expand
our
commercial
business
at
the
appropriate
time.
|
40
THE
REDWOOD
REVIEW
3RD
QUARTER
2008
|
|
|
|
COMMERCIAL
REAL
ESTATE
SECURITIES
|
Commercial
Securities
Portfolio
Quarterly
Update
(continued)
|
►
|
Our
commercial
securities
portfolio
consists
of
CES
investments
that
we
fund
with
equity.
The
types
of
loans
backing
these
securities
are
typically
fixed-rate
with
10-year
average
lives.
The
following
table
presents
our
commercial
securities
portfolio
by
credit
rating
and
vintage.
The
vintage
shown
is
the
year
the
securitization
was
completed
and
may
include
commercial
real
estate
loans
originated
in
an
earlier
year.
|
|
|
||||||||||||||||
|
Commercial
Securities
at
Redwood
|
||||||||||||||||
|
By
Rating
and
Vintage
|
||||||||||||||||
|
September
30,
2008
|
||||||||||||||||
|
(by
market
value,
$
in
millions)
|
||||||||||||||||
|
|
|
|
|
|
|
|||||||||||
|
|
<=
2004
|
|
2005
|
2006
|
2007
|
|
Total
|
|||||||||
|
BB
or
B
|
4
|
-
|
5
|
6
|
15
|
|||||||||||
|
NR
|
9
|
14
|
22
|
4
|
49
|
|||||||||||
|
Market
value
|
$
|
13
|
$
|
14
|
$
|
27
|
$
|
10
|
$
|
64
|
||||||
| ► |
Total
interest
income
generated
by
our
commercial
securities
was
$3
million
in
the
third
quarter,
which
resulted
in
an
annualized
yield
on
our
average
amortized
cost
of
13%.
|
| ► |
The
overall
credit
performance
of
our
commercial
securities
portfolio
weakened
during
the
third
quarter.
Total
serious
delinquencies
(60
days+)
were
$473
million,
or
0.96%
of
the
$49
billion
of
commercial
loans
that
we
credit
enhance,
an
increase
from
0.80%
at
June
30,
2008.
Included
in
these
delinquencies
are
three
loans
totaling
$241million
(or
0.49%)
that
are
contained
within
securities
we
own
with
a
cumulative
market
value
of
$0.8
million.
|
| ► |
Principal
credit
losses
on
our
commercial
CES
of
$3
million
during
the
quarter
were
charged
against
our
designated
credit
reserve.
For
tax
purposes,
realized
losses
on
commercial
securities
were
less
than
$0.3
million
in
the
third
quarter.
This
deduction
is
less
than
the
principal
value
of
credit
losses
incurred
on
the
underlying
loans,
as
we
own
our
commercial
CES
at
a
tax
basis
that
is
substantially
less
than
par
value.
|
| ► |
Our
GAAP
credit
reserve
for
commercial
CES
was
$471
million
($14.16
per
share)
at
September
30,
2008.
|
| ► |
When
assessing
commercial
credit
reserves,
it
is
important
to
consider
that
commercial
loans
do
not
usually
prepay
like
residential
loans
due
to
various
early
refinancing
disincentives
for
borrowers.
These
loans
typically
perform
very
well
in
their
early
stages,
while
experiencing
a
greater
risk
of
default
near
maturity
when
borrowers
must
obtain
new
financing.
Because
of
this
dynamic,
we
are
nearly
fully
reserved
for
losses
on
our
non-rated
pieces
and
most
of
our
B-rated
securities.
We
expect
our
commercial
CES
to
absorb
losses;
the
key
determent
of
the
impact
on
returns
will
be
when
the
losses
will
occur.
|
THE
REDWOOD
REVIEW
3RD
QUARTER
2008 41
|
|
|
|
COMMERCIAL
REAL
ESTATE
SECURITIES
|
Commercial
Securities
Portfolio
Quarterly
Update
(continued)
|
►
|
The
summary-level
information
below
presents
weighted-average
credit
reserve
balances
by
principal
value,
designated
by
loan
vintage
and
credit
rating.
|
|
|
|||||||||||||||||||||||||||||||
|
Credit
Reserve
Analysis
-
Commercial
Portfolio
|
|||||||||||||||||||||||||||||||
|
By
Rating
and
Vintage
|
|||||||||||||||||||||||||||||||
|
September
30,
2008
|
|||||||||||||||||||||||||||||||
|
($
in
millions)
|
|||||||||||||||||||||||||||||||
|
<=2004
|
|
2005
|
2006
|
2007
|
|
Total
|
|||||||||||||||||||||||||
|
Amount
|
%
of
loans
|
|
Amount
|
|
%
of
loans
|
Amount
|
|
%
of
loans
|
Amount
|
|
%
of
loans
|
Amount
|
%
of
loans
|
||||||||||||||||||
|
BB
|
|||||||||||||||||||||||||||||||
|
Face
|
$
|
9
|
0.09
|
%
|
$
|
-
|
$
|
3
|
0.08
|
%
|
$
|
14
|
0.10
|
%
|
$
|
26
|
0.10
|
%
|
|||||||||||||
|
Unamortized
discount
|
(5
|
)
|
-
|
(1
|
)
|
(9
|
)
|
(15
|
)
|
||||||||||||||||||||||
|
Discount
designated
as
credit
reserve
|
-
|
-
|
(1
|
)
|
0.04
|
%
|
(2
|
)
|
0.01
|
%
|
(3
|
)
|
0.01
|
%
|
|||||||||||||||||
|
Unrealized
gains
(losses)
|
-
|
-
|
-
|
(1
|
)
|
(1
|
)
|
||||||||||||||||||||||||
|
Market
value
|
$
|
4
|
$
|
-
|
$
|
1
|
$
|
2
|
$
|
7
|
|||||||||||||||||||||
|
Overall
credit
protection
to
BB
CES
|
3.40
|
%
|
2.26
|
%
|
1.94
|
%
|
2.49
|
%
|
|||||||||||||||||||||||
|
B
|
|||||||||||||||||||||||||||||||
|
Face
|
$
|
-
|
$
|
-
|
$
|
23
|
0.11
|
%
|
$
|
27
|
0.19
|
%
|
$
|
50
|
0.14
|
%
|
|||||||||||||||
|
Unamortized
discount
|
-
|
-
|
4
|
(5
|
)
|
(1
|
)
|
||||||||||||||||||||||||
|
Discount
designated
as
credit
reserve
|
-
|
-
|
(23
|
)
|
0.11
|
%
|
(18
|
)
|
0.12
|
%
|
(41
|
)
|
0.11
|
%
|
|||||||||||||||||
|
Unrealized
gains
(losses)
|
-
|
-
|
-
|
-
|
-
|
||||||||||||||||||||||||||
|
Market
value
|
$
|
-
|
$
|
-
|
$
|
4
|
$
|
4
|
$
|
8
|
|||||||||||||||||||||
|
Overall
credit
protection
to
B
CES
|
-
|
-
|
1.89
|
%
|
1.22
|
%
|
1.62
|
%
|
|||||||||||||||||||||||
|
Unrated
|
|||||||||||||||||||||||||||||||
|
Face
|
$
|
41
|
0.58
|
%
|
$
|
124
|
0.61
|
%
|
$
|
235
|
0.70
|
%
|
$
|
39
|
0.86
|
%
|
$
|
439
|
0.67
|
%
|
|||||||||||
|
Unamortized
discount
|
(2
|
)
|
15
|
23
|
4
|
40
|
|||||||||||||||||||||||||
|
Discount
designated
as
credit
reserve
|
(32
|
)
|
0.44
|
%
|
(121
|
)
|
0.50
|
%
|
(235
|
)
|
0.70
|
%
|
(39
|
)
|
0.86
|
%
|
(427
|
)
|
0.65
|
%
|
|||||||||||
|
Unrealized
(losses)
gains
|
2
|
(4
|
)
|
(1
|
)
|
-
|
(3
|
)
|
|||||||||||||||||||||||
|
Market
value
|
$
|
9
|
$
|
14
|
$
|
22
|
$
|
4
|
$
|
49
|
|||||||||||||||||||||
| ► |
The
market
values
for
our
BB,
B,
and
unrated
commercial
CES
at
September
30,
2008
totaled
$64
million,
which
is
equal
to
12%
of
the
$515
million
face
value.
|
42
THE
REDWOOD
REVIEW
3RD
QUARTER
2008
|
|
 |
|
INVESTMENTS
IN
SEQUOIA
|
Summary
What
is this?
Sequoia
entities are independent securitization entities that acquire residential
mortgage loans and create and issue ABS backed by these loans.
Most of the loans
that Sequoia entities acquire are prime-quality loans. Most of
the
investment-grade rated ABS created by Sequoia are sold to third
party investors.
Redwood usually acquires most of the CES and occasionally acquires
interest-only
securities (IOs) and IGS. Acacia also acquires some CES, IOs, and
IGS issued by
Sequoia. Although Redwood’s investment in Sequoia entities is relatively small
and limited, the loans and ABS issued by Sequoia are shown on our
consolidated
financial statements. Redwood’s investments in these entities do not appear on
our balance sheet as an asset - rather they are reflected as the
difference between the consolidated assets of Sequoia and the consolidated
Sequoia ABS issued to third parties.
Redwood’s
credit risk is limited to its investment in the IGS and CES Redwood
acquires
from the Sequoia entities. Each Sequoia entity is independent from
the others,
thus the performance of any one Sequoia entity does not affect
any other Sequoia
entity.
Over
the years, Sequoia securitizations have created significant profits
for Redwood.
These profits have two underlying economic components: the profit
or loss
created at the time of securitization on those ABS sold to investors
and the
returns earned over time on the securities that we acquired as
investments. For
GAAP purposes, both of these components are recognized over time
through net
interest income.
For
the past several years, approximately 97% of the ABS issued by
the Sequoia
entities were sold to third parties, 2% were sold to Acacia and
1% were sold to
Redwood.
Quarterly
Update
| ► |
Cash
generated by our investments in Sequoia during the third
quarter totaled
$13 million, compared to $19 million in the second quarter.
In the fourth
quarter, we expect to receive about one-third the amount
of cash that we
received in the third quarter as the increase in LIBOR
will adversely
affect cash flows to the IOs we own from these securitizations.
Due to
timing differences between coupon resets on the loans
held by the Sequoia
entities and the ABS issued held by the Sequoia entities,
a portion of the
IO cash flows will be recovered in future periods as
the loans reset or
“catch-up” to the higher level of
LIBOR.
|
| ► |
Due
to the turbulence in the mortgage markets, including
declining home prices
and concerns over credit performance, AAA buyers continue
to require a
much higher yield to compensate for actual and perceived
risk.
Consequently, since July 2007, we have not acquired loans
and have not
completed new Sequoia securitizations. We continue to
believe the prime
non-agency securitization market will be one of the first
structured
markets to return; however, we do not anticipate completing
any new
Sequoia transactions until housing prices stabilize and
securitization
economics improve.
|
| ► |
The
GAAP carrying value of Redwood’s investments in Sequoia was $111 million
at September 30, 2008. This is reflected on our balance
sheet as the
difference between residential loans of $6.1 billion
and ABS issued of
$6.0 billion. Both the loans and ABS issued are carried
at their amortized
cost basis.
|
THE
REDWOOD REVIEW 3RD QUARTER
2008 43
|
|
|
|
INVESTMENTS IN SEQUOIA
|
Quarterly
Update (continued)
| ► |
Our
estimated fair value of Sequoia securities that Redwood
owns at September
30, 2008, was $56 million. This consists of $44 million
of IOs, $9 million
of CES, and $3 million of IGS. We used the same valuation
process to value
the Sequoia securities as we did for third-party
securities (as described
on page 27). Most of our IOs are rated AAA, the IGS
we own are mostly
AA-rated, and the CES are rated BB, B, and
unrated.
|
| ► |
The
primary difference between our GAAP carrying value
and the fair value of
our investments in Sequoia is that for several years
the loan premium
amortization expenses as calculated under GAAP have
not kept pace with
prepayments. For a portion of these loans, our GAAP
amortization method is
linked more closely to short-term interest rates.
As short-term interest
rates increase, which they did during the third quarter,
we expect premium
amortization for this portion of the loan portfolio
to decrease. Loan
premium amortization expenses, a component of interest
income, was $3
million in the third quarter, down from $10 million
in the second quarter.
We ended the quarter with a net premium of $65 million
on a $6.1 billion
principal loan balance for an average basis of
101.07.
|
| ► |
Seriously
delinquent loans increased from $118 million to $143
million in the third
quarter, an increase from 1.87% to 2.36% of current
balances. Serious
delinquencies increased across all vintages. Most
of the loans (65% of the
Sequoia loans) were originated in 2005 and earlier
and many of the loans
in the original pools have been paid in full. As
a percent of the original
balances, seriously delinquent loans are 0.51% at
September 30, 2008, as
compared to 0.42% at June 30, 2008. Nonetheless,
the recent rise in
delinquencies is concerning, especially for loans
originated in 2006 or
later (35% of our residential
loans).
|
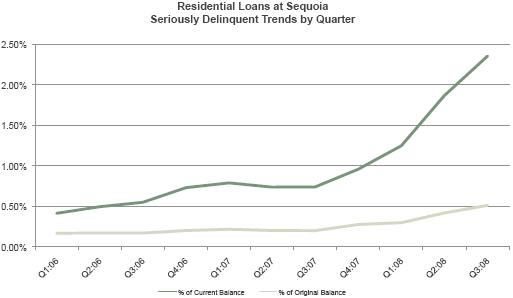
44
THE REDWOOD REVIEW 3RD QUARTER 2008
|
|
|
|
INVESTMENTS
IN SEQUOIA
|
Quarterly
Update (continued)
| ► |
At
September 30, 2008, our loan loss reserve was $47
million, or 0.77% of the
current loan balance, an increase of $14 million
in the quarter. Our
credit provision for loans was $18 million in the
third quarter, compared
to $10 million in the second quarter. The increase
in credit provision was
attributable to higher delinquencies. We had net
charge-offs of $4 million
in the third quarter compared to $2 million in
both the second and first
quarters of 2008.
|
| ► |
Loans
from the 2006 and 2007 vintages are performing
worse than our
expectations. In several of these loan pools we
have negative equity as
our loan loss reserve is larger than our investment.
These losses, when
they occur, will eliminate our investment and parts
of the ABS issued. For
GAAP purposes, we take the loan loss provision
expense today and will take
a gain when the ABS issued absorb the
losses.
|
| ► |
Unlike
our investments in Acacia, our investments in Sequoia are not subject to
cash flow disruptions due to ratings downgrades.
However, many of our
investments represent the first, second, and third
loss securities and as
such will absorb the initial losses in these pools
of residential
loans.
|
| ► |
The
table below shows the declining prepayment speeds
for the residential
loans at Sequoia.
|
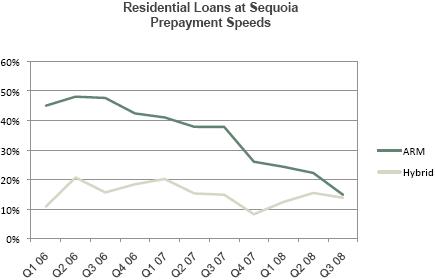
| ► |
Nearly
all of the hybrid loans held by Sequoia entities,
representing 34% of the
aggregate loan portfolio, are still in their initial
fixed-rate period.
Prepayment rates on these loans decreased slightly
to 14% CPR in the third
quarter from an average of 15% CPR in the second
quarter.
|
THE
REDWOOD REVIEW 3RD QUARTER
2008 45
|
|
|
|
INVESTMENTS IN SEQUOIA
|
Quarterly
Update (continued)
| ► |
ARM
loans held by Sequoia entities, representing
67% of the aggregate loan
portfolio, are indexed to LIBOR. In the third
quarter, prepayment rates on
these loans declined to 15% constant prepayment
rate (CPR) from the second
quarter rate of 22% CPR.
|
| ► |
As
of September 30, 2008, the tax basis of our
IOs was $41 million.
Consistent with tax accounting principles,
cash flows received will be
used primarily to reduce our basis. As a result,
we expect to recognize
little taxable income from these IOs until
2009.
|
| ► |
We
hold call option rights on all our Sequoia
transactions. The call option
gives us the right, but not the obligation,
to retire the ABS issued at
par and take possession of the underlying loans.
Currently, we have 16
Sequoias that are callable and one more that
will likely become callable
by the end of the year. Given the current mortgage
and securitization
markets, we do not anticipate calling any Sequoias
in the foreseeable
future.
|
| ► |
The
following table summarizes the characteristics
of the loans owned by the
Sequoia entities.
|
|
Residential
Loans at Sequoia*
|
|||||
|
Underlying
Loan Characteristics
|
|||||
|
September
30, 2008
|
|||||
|
Number
of loans
|
18,019
|
Wtd
Avg FICO
|
732
|
||
|
Total
loan face ($ in millions)
|
$6,067
|
FICO:
<= 620
|
2%
|
||
|
Average
loan size ($ in 1000's)
|
$337
|
FICO:
621 - 660
|
4%
|
||
|
FICO:
661 - 700
|
19%
|
||||
|
Southern
CA
|
15%
|
FICO:
701 - 740
|
26%
|
||
|
Northern
CA
|
11%
|
FICO:
> 741
|
49%
|
||
|
Florida
|
13%
|
|
|||
|
New
York
|
6%
|
Conforming
at origination %
|
34%
|
||
|
Georgia
|
4%
|
>
$1 MM %
|
15%
|
||
|
New
Jersey
|
4%
|
|
|||
|
Other
states
|
47%
|
2nd
home %
|
11%
|
||
|
Investment
home %
|
3%
|
||||
|
2007
origination
|
13%
|
|
|||
|
2006
origination
|
21%
|
Purchase
|
36%
|
||
|
2005
origination
|
5%
|
Cash
out refi
|
32%
|
||
|
2004
origination and earlier
|
61%
|
Rate-term
refi
|
30%
|
||
|
Other
|
2%
|
||||
|
Wtd
Avg Original LTV
|
69%
|
|
|||
|
Original
LTV: 0 - 50
|
15%
|
Hybrid
|
33%
|
||
|
Original
LTV: 50 - 60
|
11%
|
Adjustable
|
67%
|
||
|
Original
LTV: 60. - 70
|
19%
|
|
|||
|
Original
LTV: 70 - 80
|
49%
|
Interest
only
|
95%
|
||
|
Original
LTV: 80 - 90
|
2%
|
Fully-amortizing
|
5%
|
||
|
Original
LTV: 90 - 100
|
4%
|
||||
|
*
Total residential real estate loans at Sequoia
excludes REO, which is
included in our consolidated
other assets at lower of cost or fair value
and totaled $21 million at
September 30,2008.
|
|||||
46
THE REDWOOD REVIEW 3RD QUARTER 2008
|
|
 |
|
INVESTMENTS
IN ACACIA
|
Summary
What
is this?
Under
our Acacia program, we re-securitize real estate securities
using bankruptcy
remote collateralized debt obligation (CDO) entities
that sell asset-backed
securities (ABS) to independent third-party investors.
We typically acquire an
equity interest in the Acacia CDO entities and receive
asset management fees. We
may also acquire other securities created by the Acacia
entities. Our asset
management fees typically equal 10 basis points of
the outstanding principal
balance of Acacia assets. These fees are paid to us
in a first or senior
priority from the cash flows of the Acacia assets.
Our equity interests in the
Acacia entities entitle us to receive the net cash
flows (i.e., the net cash
flows generated by the assets after deducting asset
management and other fees
and the money distributed to the ABS debt holders)
of those entities. Our credit
risk is limited to the amount we invested, while the
remainder of any losses
will be borne by the holders of the securities issued
by Acacia. Cash
distributions on our Acacia interests can be disrupted
based on rating agency
downgrades of the underlying collateral or due to deterioration
in collateral
performance. Our investment in each entity is separate
and independent, thus
diminished performance on one of our CDO equity interests
has no effect on our
other CDO equity interests.
Quarterly
Update
| ► |
The
consolidated Acacia net loss was $21 million
in the third quarter of 2008,
compared to a net loss of $20 million in
the second quarter as negative
MVA of $29 million in the third quarter was
similar to the level
recognized in the second quarter. Net interest
income of $8 million in the
third quarter remained unchanged from the
second quarter. Earnings from
Acacia should decline in future periods.
|
| ► |
During
the third quarter, we received cash distributions
from Acacia entities of
$6 million, including $4 million from our
equity interests and $1 million
from our ABS investments. These distributions
included $2 million from our
equity investments that is nonrecurring,
and was a result of resolving a
claim with the trustee from the call of Acacia
3. We also received $1
million of management fees.
|
| ► |
Our
reported GAAP equity value for Acacia was
$19 million while our estimate
of economic value is $13 million. Over time,
these values will converge to
zero.
|
Economic
Value of our Investments in Acacia Entities
| ► |
We
cautioned in prior Redwood Reviews that severe
collateral rating
downgrades by Moody’s, S&P, and Fitch had placed considerable negative
pressure on the collateralization tests for
all of the Acacia entities. As
a result of these downgrades, the cash flows
on our equity investments in
Acacia 7, 8, 9, 10, 11, OA1, and 12 have
been shut off.
|
THE
REDWOOD REVIEW 3RD QUARTER
2008 47
|
|
|
|
INVESTMENTS IN ACACIA
|
Economic
Value of our Investments in Acacia Entities
(continued)
| ► |
We
are still receiving cash distributions from
our equity investments in
Acacia 5, 6, and CRE1. Due to the volatility
surrounding rating
downgrades, we are no longer comfortable projecting
the likelihood of
future cash distributions for our investments
in these Acacia entities. We
only included the $0.4 million received in
October and the $0.8 million we
expect to receive in November in our calculation
of economic value.
|
| ► |
The
table below shows the components of management’s estimate of economic
value for our investment in the Acacia
entities as of the end of the third
and second quarters.
|
|
Investment
in Acacia Entities
|
|||||||
|
Management's
Estimate of Economic Value
|
|||||||
|
($
in millions)
|
|||||||
|
9/30/2008
|
6/30/2008
|
||||||
|
Management
fees
|
$
|
5
|
$
|
7
|
|||
|
ABS
acquired
|
7
|
10
|
|||||
|
Preference
shares
|
1
|
2
|
|||||
|
Total
|
$
|
13
|
$
|
19
|
|||
| ► |
Even
if equity cash flows are shut off, we still
collect management fees, which
are senior in cash flow payment priority
to the AAA holders in each Acacia
securitization. Our estimate of the net
present value of these management
fees (discounted at 45%) was $5 million
at September 30, 2008.
|
| ► |
At
September 30, 2008, we valued the Acacia
ABS we previously acquired at a
price equal to 7% of face value using bid-side
marks from third parties.
|
| ► |
Our
investment in Acacia represents 2% of our
capital.
|
48
THE REDWOOD REVIEW 3RD QUARTER 2008

 |
|
|
ACCOUNTING DISCUSSION
|
Accounting
Discussion
| ► |
At
Redwood, where we hold most of our
securities as AFS for accounting
purposes, other-than-temporary MTM
changes flow through our income
statement while MTM changes that are
temporary are charged to equity.
|
| ► |
For
accounting purposes, we consolidate
the balance sheets and income
statements of the Acacia securitization
entities. On January 1, 2008, we
adopted a new accounting standard,
FAS 159, and elected to fair value
both
the assets and liabilities of the
Acacia entities. In accordance with
FAS
159, we recorded a one-time, cumulative-effect
adjustment to our January
1, 2008 opening balance sheet that
decreased the carrying value of Acacia
liabilities by $1.5 billion and increased
equity. This new standard
significantly reduces the disparity
that existed between GAAP carrying
value and our previous estimates
of economic value.
|
| ► |
For
the Sequoia entities, we are required
to consolidate the assets and
liabilities, which we report at amortized
cost, except for REO, which are
reported at the lower of cost or
fair
value.
|
| ► |
The
rules regarding MTM accounting are
complex and may not be consistent
across portfolios or clearly reflect
the underlying economics. This
accounting discussion is intended
to provide investors with a better
understanding of the impact of MTM
adjustments on our reported results.
|
| ► |
MTM
adjustments can result from changes
in fair values caused either by a
change in expected cash flows (i.e.
increased credit loss estimates reduce
expected cash flows), a change in
market discount rates (i.e. the market
requires a greater risk premium and/or
interest rates rise), or a
combination of both.
|
| ► |
All
changes in fair value for securities,
derivatives, or liabilities
accounted for as trading instruments
or under the fair value option of
FAS
159 flow through the income statement.
These adjustments can have a
positive or negative impact on income
in any period.
|
| ► |
Our
CES and most IGS held at Redwood
and the real estate securities held
by
the Fund are accounted for as AFS
securities. We carry AFS securities
on
our GAAP balance sheet at their fair
value. Positive changes in the fair
value of AFS securities from period
to period are always accounted for
as
increases to stockholders’ equity and do not flow through our
income
statement. Accounting for negative
changes in the fair value of AFS
securities from period to period
requires a three-step process involving
a
combination of quantitative and judgmental
evaluations. The ultimate
purpose of this process is to determine
whether negative MTM adjustments
represent “other-than-temporary” (permanent) impairments, which flow
through our GAAP income statement,
or represent “temporary” impairments,
which are recorded as a reduction
of stockholders’ equity and do not flow
through our income statement.
|
50
THE REDWOOD REVIEW 3RD QUARTER 2008
|
|
|
|
ACCOUNTING
DISCUSSION
|
Accounting
Discussion (continued)
| ► |
The
diagram below and the narrative discussion
that follows address the
three-step process for evaluating
impairments on AFS
securities.
|
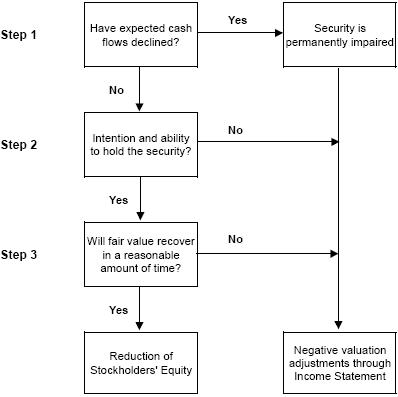
| ► |
The
first step is to determine whether
there has been an adverse change
in the
underlying cash flows generated by
the security. A security is considered
permanently impaired even if the
change in projected cash flows is
small
relative to the resulting MTM adjustment.
It is difficult to separate with
precision how much of the change
in fair value is driven by changes
in
expected cash flows versus changes
in market discount rates, but during
periods of market illiquidity and
uncertainty (as we have encountered
since mid-2007), the market discount
rate impact can be significant.
|
| ► |
The
second step is to determine whether
we have the ability and intention
to
hold the security.
|
| ► |
The
third step requires us to evaluate
whether an impaired security will
recover in value within a reasonable
period of time. This step is very
subjective, particularly when there
is turmoil and uncertainty in the
capital markets.
|
| ► |
AFS
securities deemed permanently impaired
for accounting purposes cannot be
written back up through MTM adjustments
in our income statement. This does
not mean the underlying security
could not recover in value. If the
value
of an impaired security does recover,
we would recognize this benefit
through higher interest yields over
time. Therefore, some of the
securities classified as permanently
impaired during recent quarters may
eventually prove to have significant
value to
us.
|
THE
REDWOOD REVIEW 3RD QUARTER
2008 51
|
|
|
|
ACCOUNTING DISCUSSION
|
Accounting
Discussion (continued)
| ► |
The
consolidated Sequoia assets are accounted
for on our GAAP balance sheet as
held-for-investment and are carried
at their unpaid principal balances
adjusted for net amortized premiums
or discounts and net of allowances
for
credit losses. The consolidated Sequoia
liabilities are accounted for at
their unpaid principal balances net
of any amortized premiums or
discounts.
|
| ► |
Prior
to January 1, 2008, we accounted
for the consolidated securities
held at
Acacia entities (the assets) as
AFS and the consolidated ABS issued
by
Acacia entities (the liabilities)
at cost. In our opinion, this difference
in accounting treatment led to
a significant discrepancy in the
GAAP
carrying value for our investment
in Acacia entities and our estimate
of
economic value.
|
| ► |
On
January 1, 2008, we adopted a new
accounting standard, FAS 159, and
elected to fair value both the
assets and liabilities of the Acacia
entities. In accordance with FAS
159, we recorded a one-time,
cumulative-effect adjustment to
our January 1, 2008 opening balance
sheet
that decreased the carrying value
of Acacia liabilities by $1.5 billion
and increased equity. This new
standard significantly reduces
the
disparity that existed between
GAAP carrying value and our previous
estimates of economic value.
|
| ► |
Under
FAS 159, we are required to flow
through our quarterly income statement
any net change in the fair value
of Acacia assets and liabilities.
As a
result of the measurement techniques
required by FAS 159, we still expect
to encounter some MTM earnings
volatility in the future as a result
of the
consolidation of Acacia entities.
During the third quarter of 2008,
the
fair value of Acacia’s assets and derivatives declined
by $236 million and
the fair value of Acacia’s paired liabilities declined by
$207 million,
for a net change of a negative
$29 million.
|
| ► |
The
net GAAP carrying value of our
investments in Acacia in our financial
statements is derived by subtracting
the fair value of Acacia’s
liabilities from the fair value
of Acacia’s assets. In theory, fair values
of Acacia’s assets and liabilities should
be reasonably correlated as they
are paired within the same legal
structure. ABS issued by each Acacia
entity will be repaid directly
and solely from the cash flows
generated by
the assets owned by that entity.
However, at any given moment, the
capital
markets may use different discount
rates and valuation parameters
for
Acacia’s collateral assets relative to
its ABS issued.
|
| ► |
On
September 30, 2008, the derived
net GAAP carrying value of our
retained
Acacia investments was $19 million.
This valuation was greater than
our
$13 million estimate of the fair
value based on the value of the
ABS
acquired using bid-side marks,
plus the net present value of projected
cash flows from our Acacia management
fees discounted at 45%, and the
cash
received in October and we expect
to receive in November from equity
interests.
|
52
THE REDWOOD REVIEW 3RD QUARTER 2008
|
|
 |
|
GLOSSARY
|
NOTE:
Not all companies and analysts calculate
non-GAAP measures in the same fashion.
As a result, certain measures as calculated
by Redwood may not be comparable to
similarly titled measures reported by other
companies.
ACACIA
Acacia
is the brand name for the collateralized
debt obligation (CDO) securitizations
Redwood sponsors. The underlying pool of
assets for these CDO securitizations
generally consists of IGS and, in some
pools, some CES. The securities are
backed by residential prime, alt-a, and
subprime real estate loans, and
commercial real estate loans. Acacia also
owns related assets such as CDO
securities issued by other real estate
oriented CDOs, corporate debt issued by
equity REITs, commercial real estate loans,
and synthetic assets derived from
real estate assets. Redwood typically acquires
a portion of the CDO
credit-enhancement (or “equity”) securities issued by Acacia; these are
the
securities that are in the first-loss (highest
risk) position with respect to
absorbing any credit losses that may occur
within the assets owned by the Acacia
entities. Redwood may also retain or acquire
Acacia ABS issued. Redwood also
earns asset management fees for ongoing
management of the Acacia
entities.
ADJUSTABLE-RATE
MORTGAGES (ARMs)
Adjustable-rate
mortgages are loans that have coupons that
adjust at least once per year. We
make a distinction between ARMs (loans
with a rate adjustment at least annually)
and hybrids (loans that have a fixed-rate
period of two-to-ten years and then
become adjustable-rate).
ALT-A
SECURITIES
Alt-a
securities are residential mortgage-backed
securities backed by loans that have
higher credit quality than subprime and
lower credit quality than prime. Alt-a
originally represented loans with alternative
documentation, but the definition
has shifted over time to include loans
with additional risk characteristics and
a higher percentage of investor loans.
In an alt-a loan, the borrower’s income
may not be verified, and in some cases,
may not be disclosed on the loan
application. Alt-a loans may also have
expanded criteria that allow for higher
debt-to-income ratios with higher accompanying
loan-to-value ratios than would
otherwise be permissible for prime loans.
AMORTIZED
COST
Amortized
cost is the initial acquisition cost of
an AFS security, minus principal
repayments or principal reductions through
credit losses, plus or minus premium
or discount amortization. At the point
in time an AFS security is deemed
other-than-temporarily impaired, the amortized
cost is adjusted (by changing the
amount of unamortized premium or discount)
to equal to the fair value of the
security.
ASSET-BACKED
SECURITIES (ABS)
Asset-backed
securities (ABS) are securities backed
by financial assets that generate cash
flows. Each ABS issued from a securitization
entity has a unique priority with
respect to receiving principal and interest
cash flows and absorbing any credit
losses from the assets owned by the entity.
THE
REDWOOD REVIEW 3RD QUARTER
2008 53
|
|
|
|
GLOSSARY
|
BOOK
VALUE
Book
value is the value of our common equity.
As measured for GAAP, through December
31, 2007, reported book value generally
incorporated mark-to-market adjustments
for securities and interest rate agreements,
but not for loans or liabilities.
Beginning January 1, 2008, book value as
measured for GAAP includes
mark-to-market adjustments on certain assets
and liabilities. We may also report
management’s estimate of economic value, which is
management’s estimate of the
fair value of its investments net of liabilities.
COLLATERALIZED
DEBT OBLIGATION (CDO) SECURITIZATIONS
The
securitization of a diverse pool of assets.
See “Acacia.”
CDO
EQUITY SECURITIES
CDO
equity securities (or CDO CES) are credit-enhancement
securities that bear the
initial credit losses of the assets owned
by CDO securitization entities.
COMMERCIAL
WHOLE LOANS
Commercial
whole loans are unsecuritized first-lien
loans that are secured by commercial
real estate.
CONDUIT
A
conduit is an entity that acquires closed
loans from originators, accumulates
loans over a period, and sells these loans,
seeking to generate a gain on sale.
Sales are usually made via securitization,
but also can be made through bulk
whole loan sales.
CORE
EQUITY (CORE BOOK VALUE)
Core
equity is not a measure calculated in accordance
with GAAP. GAAP equity includes
unrealized mark-to-market adjustments for
some of our assets and interest rate
agreements (“accumulated other comprehensive income”). Core equity excludes
these mark-to-market adjustments. Core
equity in some ways approximates what our
equity value would be if we used historical
amortized cost accounting
exclusively. A reconciliation of core equity
to GAAP equity appears in Table 2
of the Appendix.
CONSTANT
(OR CONDITIONAL) PREPAYMENT RATE (CPR)
Constant
(or conditional) prepayment rate (CPR)
is an industry-standard measure of the
speed at which mortgage loans prepay. It
approximates the annual percentage rate
at which a pool of loans is paying down
due to principal
prepayments.
CREDIT-ENHANCEMENT
SECURITIES (CES)
Credit-enhancement
securities (CES) absorb the initial credit
losses generated by a pool of
securitized assets. As a result, the more
senior securities issued from that
securitization are credit-enhanced because
they carry less credit risk. Our
definition of CES includes all the below
investment-grade rated bonds issued
from a securitization. These securities
are also referred to as subordinated
securities or B-pieces. For a typical securitization
of prime residential loans,
there are three CES: the first-loss, second-loss,
and third-loss bonds. The
first-loss security takes the initial risk
of credit loss. If credit losses
within the securitized asset pool exceed
the principal value of the first-loss
security, the second-loss security is at
risk. If cumulative losses exceed the
principal value of the first- and second-loss
securities, then the third-loss
security is at risk. Generally, for these
securitizations, the third-loss
security has a credit rating of BB, the
second-loss security has a credit rating
of B, and the first-loss security is unrated.
Other types of securitizations,
such as commercial, CDO, subprime residential,
and some alt-a residential
transactions, may be structured differently.
Nevertheless, the non-investment
grade rated securities issued from these
securitizations function as
credit-enhancement securities in these
transactions.
54
THE REDWOOD REVIEW 3RD QUARTER 2008
|
|
|
|
GLOSSARY
|
GAAP
Generally
Accepted Accounting Principles in the
United States.
GSEs
(GOVERNMENT-SPONSORED ENTERPRISES)
Government-sponsored
enterprises (GSEs), include the Federal
National Mortgage Association (Fannie
Mae) and the Federal Home Loan and Mortgage
Corporation (Freddie Mac).
INTEREST-ONLY
SECURITIES (IOs)
Interest-only
securities (IOs) are specialized securities
created by securitization entities
where the projected cash flows generated
by the underlying assets exceed the
cash flows projected to be paid to the
ABS issued that have principal balances.
They receive interest payments calculated
by a formula wherein cash flows on IOs
vary as a function of interest payments
generated by the underlying assets
within a securitization or as a function
of the spread between the yield on the
loans owned by a securitization entity
and the cost of funds of the securities
issued by that entity. Typically, IOs
do not have a principal balance and they
will not receive principal payments.
Interest payments to IOs usually equal
an
interest rate formula multiplied by a
“notional” principal balance. The notional
principal balances for IOs are typically
reduced over time as the actual
principal balances of the underlying
pools of assets pay down, thus reducing
the
cash flows to the IOs over time. Cash
flows on IOs are typically reduced more
quickly when asset prepayments accelerate.
INVESTMENT
GRADE SECURITIES (IGS)
Investment
grade securities (IGS) are securities
that are rated AAA, AA, A, or BBB.
LEVERAGE
RATIOS
We
use collateralized debt to finance the
accumulation of assets prior to sale
to a
securitization entity and to finance
investments in high-quality loans and
IGS.
We currently have very low levels of
short-term recourse debt. However, because
of the consolidation of independent securitization
entities, it appears on our
GAAP consolidated financial statements
that Redwood is highly leveraged, with
total consolidated liabilities significantly
greater than equity. The
obligations of these securitization entities
are not obligations of Redwood.
When determining Redwood’s financial leverage, traditional leverage
ratios may
be misleading in some respects if consolidated
ABS issued from securitization
entities are included as part of Redwood’s obligations when calculating this or
similar ratios.
LONG-TERM
DEBT AT REDWOOD
Long-term
debt at Redwood is debt that is an obligation
of Redwood that is not payable
within a year and includes junior subordinated
notes and trust preferred
securities. We generally treat long-term
debt as part of our capital base when
it is not payable in the near future.
We may issue other forms of long-term
debt
in the future.
MARK-TO-MARKET
ACCOUNTING
Mark-to-market
accounting uses estimated fair values
of assets, liabilities, and hedges. Many
of our assets are carried on our balance
sheet at their fair value rather than
historical amortized cost. Through December
31, 2007 changes in the fair value
of some of our assets and hedges are
reported through our income statement.
Beginning January 1, 2008 we began to
use mark-to-market accounting for income
statement purposes for a wider variety
of assets and liabilities. This likely
makes quarter-to-quarter GAAP income
trends more volatile. Taxable income
is
generally not affected by market valuation
adjustments.
THE
REDWOOD REVIEW 3RD QUARTER
2008 55
|
|
|
|
GLOSSARY
|
MARKET
VALUE ADJUSTMENTS (MVA)
Market
value adjustments (MVA) are those changes
in market values reported through our
GAAP income statement. They reflect
all changes in market values on assets
and
liabilities accounted for at fair value
and impairments on securities accounted
for as AFS.
NEGATIVE
AMORTIZATION ADJUSTABLE-RATE MORTGAGES
(NEG
AM ARMs, OPTION ARMs, OR MTA ARMs)
Negative
amortization ARMs (neg am ARMs, option
ARMs, pay option ARMs, or monthly
treasury average (MTA) ARMs) are adjustable-rate
mortgages that allow the
borrower to choose between different
payment options. These options allow
the
borrower to make minimum payments,
or other payments that are less than
the
interest accrued on the mortgage during
that period. As a result of this
feature, the borrower’s loan balance may increase, causing
negative amortization
of the loan balance.
NON-PRIME
SECURITIES
Non-prime
securities are alt-a and subprime securities.
See definitions of alt-a and
subprime securities.
OPTION
ARMs
See
negative amortization adjustable-rate
mortgages.
PRIME
RESIDENTIAL REAL ESTATE LOANS
Prime
loans are residential loans with high
quality credit characteristics, such
as
borrowers with high FICO credit scores,
lower loan-to-value ratios, lower
debt-to-income ratios, greater levels
of other assets, and more
documentation.
PRIME
SECURITIES
Prime
securities are residential mortgage-backed
securities backed by high
credit-quality loans, generally with
balances greater than conforming loan
limits. Prime securities are typically
backed by loans that have relatively
high
weighted average FICO scores (700 or
higher), low weighted average LTVs
(75% or
less), limited concentrations of investor
properties, and low percentages of
loans with low FICO or high LTV.
PROFITABILITY
RATIOS
Many
financial institution analysts use
asset-based profitability ratios such
as
interest rate spread and interest rate margin when analyzing
financial
institutions. These are asset-based
measures. Because we consolidate the
assets
and liabilities of securitization entities
for GAAP purposes, our total GAAP
assets and liabilities may vary over
time, and may not be comparable in
economic
reality to assets typically used in
profitability calculations for other
financial institutions. As a result,
we believe equity-based profitability
ratios may be more appropriate than
asset-based measures for analyzing
Redwood’s
operations. We believe, for example,
that net interest income as a percentage
of
equity is a useful measure of profitability.
For operating expenses, we believe
useful measures are operating efficiency
ratio (operating expenses as a
percentage of net interest income)
and operating expenses as a percentage
of
equity.
56
THE REDWOOD REVIEW 3RD QUARTER 2008
|
|
|
|
GLOSSARY
|
REAL
ESTATE INVESTMENT TRUST (REIT)
A
real estate investment trust (REIT)
is an entity that makes a tax election
to be
taxed as a REIT, invests in real
estate assets, and meets other REIT
qualifications, including the distribution
as dividends of at least 90% of REIT
taxable income. A REIT’s profits are not taxed at the corporate
level to the
extent that these profits are distributed
as dividends to stockholders,
providing an operating cost savings.
On the other hand, the requirement
to pay
out as dividends most of the REIT
profits means it can be harder for
a REIT to
grow if using only internally-generated
funds (as opposed to issuing new
stock).
REAL
ESTATE OWNED (REO)
Real
estate owned (REO) refers to real
property owned by the lender that
has been
acquired through foreclosure.
REDWOOD
DEBT
Redwood
debt is an obligation of Redwood.
See Long-term debt at Redwood and
Short-term
debt at Redwood.
REIT
RETAINED TAXABLE INCOME
REIT
retained taxable income is not a
measure calculated in accordance
with GAAP.
REIT retained taxable income is the
taxable income earned at the REIT
after
dividend distributions to our shareholders,
less corporate income taxes paid
at
the REIT level. A reconciliation
of REIT retained taxable income to
GAAP income
appears in Table 3 in the Appendix.
REIT
SUBSIDIARY
A
REIT subsidiary is a subsidiary of
a REIT that is taxed as a REIT.
REIT
TAXABLE INCOME
REIT
taxable income is not a measure calculated
in accordance with GAAP. REIT taxable
income is pre-tax income calculated
for tax purposes at Redwood including
only
its REIT subsidiaries (i.e., excluding
its taxable subsidiaries). REIT taxable
income is an important measure as
it is the basis of our dividend distribution
requirements. We must distribute
at least 90% of REIT taxable income
as
dividends to shareholders over time.
As a REIT, we are not subject to
corporate
income taxes on the REIT taxable
income we distribute. We pay income
tax on the
REIT taxable income we retain (up
to 10% of total REIT taxable income).
A
reconciliation of REIT taxable income
to GAAP income appears in Table 3
in the
Appendix.
RETURN
ON EQUITY (ROE) AND ADJUSTED RETURN
ON EQUITY
ROE
is the amount of profit we generate
each year per dollar of equity capital
and
equals GAAP income divided by GAAP
equity. Adjusted ROE is GAAP income
divided
by core equity. Core equity excludes
balance sheet mark-to-market adjustments.
Thus, only those market value changes
that are included in our income statement
will affect adjusted ROE.
SEQUOIA
Sequoia
is the brand name for securitizations
of residential real estate loans
Redwood
sponsors.
SHORT-TERM
DEBT AT REDWOOD
Short-term
debt at Redwood is debt that is an
obligation of Redwood and payable
within a
year. We obtain this debt from a
variety of Wall Street firms, banks,
and other
institutions. As another form of
short-term debt, we have issued collateralized
commercial paper in the past and
may issue other forms of short-term
debt in the
future.
THE
REDWOOD REVIEW 3RD QUARTER
2008 57
|
|
|
|
GLOSSARY
|
SUBPRIME
SECURITIES
Subprime
securities are residential mortgage-backed
securities backed by loans to
borrowers who typically have lower
credit scores and/or other credit
deficiencies that prevent them
from qualifying for prime or alt-a
mortgages and
may have experienced credit problems
in the past, such as late payments
or
bankruptcies. To compensate for
the greater risks and higher costs
to service
the loans, subprime borrowers pay
higher interest rates, points,
and origination
fees.
Typical
characteristics of subprime loan
pools include more than 60% of
loans with FICO
scores below 680, weighted average
LTVs over 85%, more than 70% of
loans with
LTVs over 75%, and loans with LTVs
over 80% with no mortgage
insurance.
TAXABLE
SUBSIDIARY
A
taxable subsidiary is a subsidiary
of a REIT that is not taxed as
a REIT and
thus pays taxes on its income.
A taxable subsidiary is not limited
to investing
in real estate and it can choose
to retain all of its after-tax
profits.
TOTAL
RETAINED TAXABLE INCOME
Total
retained taxable income is not
a measure calculated in accordance
with GAAP.
Total retained taxable income is
the taxable income earned at the
REIT after
dividend distributions to shareholders
and taxes. It also includes all
of the
taxable income earned at our taxable
subsidiaries, less corporate income
taxes
paid, as we generally retain the
after-tax income at our taxable
subsidiaries. A
reconciliation of total retained
taxable income to GAAP income appears
in Table
3 in the Appendix.
TOTAL
TAXABLE INCOME
Total
taxable income is not a measure
calculated in accordance with GAAP.
Total
taxable income is pre-tax income
for Redwood and all its subsidiaries
as
calculated for tax purposes. Taxable
income calculations differ significantly
from GAAP income calculations.
A reconciliation of total taxable
income to GAAP
income appears in Table 3 in the
Appendix.
58
THE REDWOOD REVIEW 3RD QUARTER
2008

|
|
Table
1: GAAP Earnings ($ in thousands, except per share
data)
|
60
|
|
Nine
|
Nine
|
|||||||||||||||||||||||||||||||||
|
2008
|
2008
|
2008
|
2007
|
2007
|
2007
|
2007
|
2006
|
2006
|
Months
|
Months
|
||||||||||||||||||||||||
|
Q3
|
Q2
|
Q1
|
Q4
|
Q3
|
Q2
|
Q1
|
Q4
|
Q3
|
2008
|
2007
|
||||||||||||||||||||||||
|
Interest
income
|
$
|
126,227
|
$
|
140,445
|
$
|
171,977
|
$
|
193,728
|
$
|
207,023
|
$
|
208,708
|
$
|
210,372
|
$
|
213,504
|
$
|
217,504
|
$
|
438,649
|
$
|
626,103
|
||||||||||||
|
Net
securities
discount amortization income
|
7,850
|
6,258
|
10,864
|
18,869
|
20,514
|
23,849
|
20,268
|
18,665
|
17,842
|
24,972
|
64,631
|
|||||||||||||||||||||||
|
Other
investment interest income
|
487
|
514
|
732
|
984
|
1,143
|
464
|
-
|
-
|
-
|
1,733
|
1,607
|
|||||||||||||||||||||||
|
Net
loan
premium amortization expense
|
(3,372
|
)
|
(10,215
|
)
|
(7,509
|
)
|
(6,656
|
)
|
(8,349
|
)
|
(10,863
|
)
|
(11,705
|
)
|
(13,272
|
)
|
(11,232
|
)
|
(21,096
|
)
|
(30,917
|
)
|
||||||||||||
|
Total
GAAP
interest income
|
131,192
|
137,002
|
176,064
|
206,925
|
220,331
|
222,158
|
218,935
|
218,897
|
224,114
|
444,258
|
661,424
|
|||||||||||||||||||||||
|
Management
fee
income
|
1,307
|
1,319
|
1,613
|
1,866
|
1,893
|
1,481
|
1,168
|
993
|
928
|
4,239
|
4,542
|
|||||||||||||||||||||||
|
Interest
on
short-term debt - Redwood
|
(65
|
)
|
(68
|
)
|
(182
|
)
|
(377
|
)
|
(5,858
|
)
|
(22,700
|
)
|
(31,094
|
)
|
(16,520
|
)
|
(9,422
|
)
|
(315
|
)
|
(59,652
|
)
|
||||||||||||
|
ABS
interest
expense consolidated from trusts
|
(89,205
|
)
|
(95,313
|
)
|
(125,042
|
)
|
(149,665
|
)
|
(157,554
|
)
|
(141,993
|
)
|
(132,561
|
)
|
(153,036
|
)
|
(166,105
|
)
|
(309,560
|
)
|
(432,108
|
)
|
||||||||||||
|
ABS
issuance
expense amortization
|
(930
|
)
|
(1,921
|
)
|
(2,093
|
)
|
(4,644
|
)
|
(4,616
|
)
|
(5,681
|
)
|
(7,068
|
)
|
(7,897
|
)
|
(5,786
|
)
|
(4,944
|
)
|
(17,365
|
)
|
||||||||||||
|
ABS
interest
rate agreement (expense) income
|
(1,259
|
)
|
(1,246
|
)
|
(1,245
|
)
|
1,265
|
1,959
|
3,358
|
1,646
|
2,497
|
3,317
|
(3,750
|
)
|
6,963
|
|||||||||||||||||||
|
ABS
issuance
premium amortization income
|
557
|
1,955
|
2,183
|
1,930
|
2,096
|
2,294
|
1,869
|
1,529
|
2,395
|
4,695
|
6,259
|
|||||||||||||||||||||||
|
Total
consolidated ABS expense
|
(90,837
|
)
|
(96,525
|
)
|
(126,197
|
)
|
(151,114
|
)
|
(158,115
|
)
|
(142,022
|
)
|
(136,114
|
)
|
(156,907
|
)
|
(166,179
|
)
|
(313,559
|
)
|
(436,251
|
)
|
||||||||||||
|
Interest
expense on long-term debt - Redwood
|
(2,164
|
)
|
(2,233
|
)
|
(2,533
|
)
|
(3,055
|
)
|
(3,150
|
)
|
(2,516
|
)
|
(2,056
|
)
|
(423
|
)
|
-
|
(6,930
|
)
|
(7,722
|
)
|
|||||||||||||
|
Net
interest
income
|
39,433
|
39,495
|
48,765
|
54,245
|
55,101
|
56,401
|
50,840
|
46,040
|
49,441
|
127,693
|
162,342
|
|||||||||||||||||||||||
|
Provision
for
credit reserve
|
(18,333
|
)
|
(10,061
|
)
|
(8,058
|
)
|
(4,972
|
)
|
(1,507
|
)
|
(2,500
|
)
|
(3,829
|
)
|
(1,506
|
)
|
(465
|
)
|
(36,452
|
)
|
(7,836
|
)
|
||||||||||||
|
Market
valuation adjustments, net
|
(127,157
|
)
|
(60,619
|
)
|
(193,932
|
)
|
(1,118,989
|
)
|
(102,766
|
)
|
(29,430
|
)
|
(10,264
|
)
|
(1,404
|
)
|
(5,257
|
)
|
(381,708
|
)
|
(142,460
|
)
|
||||||||||||
|
Net
interest (loss) income after provision and market valuation
adjustments
|
(106,057
|
)
|
(31,185
|
)
|
(153,225
|
)
|
(1,069,716
|
)
|
(49,172
|
)
|
24,471
|
36,747
|
43,130
|
43,719
|
(290,467
|
)
|
|
12,046
|
||||||||||||||||
|
Fixed
compensation expense
|
(4,331
|
)
|
(4,648
|
)
|
(5,674
|
)
|
(4,316
|
)
|
(4,560
|
)
|
(4,286
|
)
|
(4,616
|
)
|
(3,688
|
)
|
(3,437
|
)
|
(14,653
|
)
|
(13,462
|
)
|
||||||||||||
|
Variable
compensation expense
|
(616
|
)
|
(330
|
)
|
(1,857
|
)
|
(434
|
)
|
1,096
|
(198
|
)
|
(2,251
|
)
|
(1,666
|
)
|
(2,630
|
)
|
(2,803
|
)
|
(1,353
|
)
|
|||||||||||||
|
Equity
compensation expense
|
(3,080
|
)
|
(3,502
|
)
|
(3,306
|
)
|
(2,767
|
)
|
(2,593
|
)
|
(3,540
|
)
|
(3,349
|
)
|
(3,233
|
)
|
(2,579
|
)
|
(9,888
|
)
|
(9,482
|
)
|
||||||||||||
|
Severance
expense
|
-
|
-
|
-
|
(1,340
|
)
|
-
|
-
|
(2,380
|
)
|
-
|
-
|
-
|
(2,380
|
)
|
||||||||||||||||||||
|
Other
operating expense
|
(9,191
|
)
|
(5,767
|
)
|
(5,502
|
)
|
(7,337
|
)
|
(5,455
|
)
|
(4,670
|
)
|
(4,479
|
)
|
(4,732
|
)
|
(4,425
|
)
|
(20,460
|
)
|
(14,604
|
)
|
||||||||||||
|
Due
diligence
expenses
|
(29
|
)
|
(8
|
)
|
(10
|
)
|
(75
|
)
|
(220
|
)
|
(78
|
)
|
(707
|
)
|
(532
|
)
|
(384
|
)
|
(47
|
)
|
(1,005
|
)
|
||||||||||||
|
Total
GAAP
operating expenses
|
(17,247
|
)
|
(14,255
|
)
|
(16,349
|
)
|
(16,269
|
)
|
(11,732
|
)
|
(12,772
|
)
|
(17,782
|
)
|
(13,851
|
)
|
(13,455
|
)
|
(47,851
|
)
|
(42,286
|
)
|
||||||||||||
|
Realized
(losses) gains on sales
|
(15
|
)
|
2,909
|
(3
|
)
|
7,199
|
(1,460
|
)
|
1,428
|
303
|
5,308
|
4,968
|
2,891
|
271
|
||||||||||||||||||||
|
Realized
(losses) gains on calls
|
(39
|
)
|
(72
|
)
|
45
|
(126
|
)
|
3,284
|
1,310
|
843
|
1,511
|
722
|
(66
|
)
|
5,437
|
|||||||||||||||||||
|
Total
realized
gains, net
|
(54
|
)
|
2,837
|
42
|
7,073
|
1,824
|
2,738
|
1,146
|
6,819
|
5,690
|
2,825
|
5,708
|
||||||||||||||||||||||
|
Minority
interest allocation
|
2,194
|
(2,369
|
)
|
(255
|
)
|
-
|
-
|
-
|
-
|
-
|
-
|
(430
|
)
|
-
|
||||||||||||||||||||
|
Credit
(provision) for income taxes
|
9,860
|
(937
|
)
|
(1,800
|
)
|
1,467
|
(1,837
|
)
|
(3,021
|
)
|
(1,801
|
)
|
(407
|
)
|
(3,538
|
)
|
7,123
|
(6,659
|
)
|
|||||||||||||||
|
GAAP
net (loss) income
|
($111,304
|
)
|
($45,909
|
)
|
($171,587
|
)
|
($1,077,445
|
)
|
($60,917
|
)
|
$
|
11,416
|
$
|
18,310
|
$
|
35,691
|
$
|
32,416
|
($328,800
|
)
|
($31,191
|
)
|
||||||||||||
|
Diluted
average shares
|
33,334
|
32,871
|
32,511
|
29,531
|
27,892
|
28,165
|
27,684
|
27,122
|
26,625
|
32,907
|
27,388
|
|||||||||||||||||||||||
|
GAAP
net (loss) income per share
|
($3.34
|
)
|
($1.40
|
)
|
($5.28
|
)
|
($36.49
|
)
|
($2.18
|
)
|
$
|
0.41
|
$
|
0.66
|
$
|
1.32
|
$
|
1.22
|
($9.99
|
)
|
($1.14
|
)
|
||||||||||||
|
THE
REDWOOD
REVIEW
3RD
QUARTER
2008
|
Table
1: GAAP
Earnings
|
|