
 |
|
|
|
|
TABLE OF
CONTENTS
|
|
Introduction
|
3
|
|
Shareholder
Letter
|
4
|
|
Quarterly
Overview
|
6
|
|
Financial
Insights
|
10
|
|
GAAP
Income
|
23
|
|
Taxable
Income
|
26
|
|
Dividends
|
28
|
|
Capital
and Liquidity
|
29
|
|
Mark-to-Market
Adjustments
|
30
|
|
Residential
Real Estate Securities
|
35
|
|
Commercial
Real Estate Securities
|
42
|
|
Investments
in Sequoia
|
44
|
|
Investments
in Acacia
|
47
|
|
Appendix
|
|
|
Accounting
Discussion
|
50
|
|
Glossary
|
52
|
|
Financial
Tables
|
61
|
|
THE REDWOOD
REVIEW 4TH QUARTER 2008
|
1
|
|
|
|
|
|
CAUTIONARY
STATEMENT
|
Cautionary
Statement
This Redwood Review
contains forward-looking statements within the meaning of the safe harbor
provisions of the Private Securities Litigation Reform Act of 1995.
Forward-looking statements involve numerous risks and uncertainties. Our actual
results may differ from our expectations, estimates, and projections and,
consequently, you should not rely on these forward-looking statements as
predictions of future events. Forward-looking statements are not historical in
nature and can be identified by words such as "anticipate," "estimate," "will,"
"should," "expect," "believe," "intend," "seek," "plan" and similar expressions
or their negative forms, or by references to strategy, plans, or intentions.
These forward-looking statements are subject to risks and uncertainties,
including, among other things, those described in our Annual Report on Form 10-K
for the year ended December 31, 2008 under the caption "Risk Factors." Other
risks, uncertainties, and factors that could cause actual results to differ
materially from those projected are described below and may be described from
time to time in reports we file with the Securities and Exchange Commission,
including reports on Forms 10-K, 10-Q, and 8-K. We undertake no obligation to
update or revise forward-looking statements, whether as a result of new
information, future events, or otherwise.
Statements
regarding the following subjects, among others, are forward-looking by their
nature: (i) the ability of our current and future investments to generate
attractive future cash flows and returns with a comfortable margin of safety,
(ii) our ability to prosper in the current environment and build our business in
the future, (iii) our belief that our common stock offering in January 2009, and
the investment of the proceeds thereof, will be accretive to our future
financial results and significantly extend the duration of our investment cash
flows, (iv) our estimate of how long it will take to invest the proceeds of
common stock offering in January 2009, (v) our expectation that we will generate
over $100 million in positive cash flow from existing investments after
operating and interest expenses in 2009, (vi) our expectations regarding future
declines in home values, (vii) our credit loss expectations for investment grade
securities and the sensitivity of investment grade securities to credit risk,
(viii) our Board of Directors’ intention to pay a regular quarterly dividend of
$0.25 per share in 2009 and our expectation that such dividends will constitute
a return of capital, and (ix) our belief that government initiatives could
result in an increase in mortgage prepayment rates.
Important factors,
among others, that may affect our actual results include: changes in interest
rates; changes in mortgage prepayment rates; the timing of credit losses within
our portfolio; our exposure to adjustable-rate and negative amortization
mortgage loans; the state of the credit markets and other general economic
conditions, particularly as they affect the price of earning assets and the
credit status of borrowers; the concentration of the credit risks we are exposed
to; the ability of counterparties to satisfy their obligations to us;
legislative and regulatory actions affecting the mortgage industry or our
business; the availability of high quality assets for purchase at attractive
prices; declines in home prices and commercial real estate prices; increases in
mortgage payment delinquencies; changes in the level of liquidity in the capital
markets which may adversely affect our ability to finance our real estate asset
portfolio; changes in liquidity in the market for real estate securities, the
re-pricing of credit risk in the capital markets, inaccurate ratings of
securities by rating agencies, rating agency downgrades of securities, and
increases in the supply of real estate securities available-for-sale, each of
which may adversely affect the values of securities we own; the extent of
changes in the values of securities we own and the impact of adjustments
reflecting those changes on our income statement and balance sheet, including
our stockholders’ equity; our ability to maintain the positive stockholders’
equity necessary to enable us to pay the dividends required to maintain our
status as a real estate investment trust (REIT) for tax purposes; our ability to
generate the amount of cash flow we expect from our investment portfolio;
changes in our investment, financing, and hedging strategies and the new risks
that those changes may expose us to; changes in the competitive landscape within
our industry, including changes that may affect our ability to retain or attract
personnel; our failure to manage various operational risks associated with our
business; our failure to maintain appropriate internal controls over financial
reporting; our failure to properly administer and manage our securitization
entities; risks we may be exposed to if we expand our business activities, such
as risks relating to significantly increasing our direct holdings of loans;
limitations imposed on our business due to our REIT status and our status as
exempt from registration under the Investment Company Act of 1940; our ability
to successfully deploy the proceeds from our recent common equity offering and
raise additional capital to fund our investing activity; and other factors not
presently identified. This Redwood Review may contain statistics and other data
that in some cases have been obtained from or compiled from information made
available by servicers and other third-party service
providers.
|
2
|
THE REDWOOD
REVIEW 4TH QUARTER 2008
|
|
|
|
|
|
|
|
INTRODUCTION
|
Note
to Readers:
We file annual
reports (on Form 10-K) and quarterly reports (on Form 10-Q) with the Securities
and Exchange Commission. These filings and our earnings press releases provide
information about our financial results in accordance with generally accepted
accounting principles (GAAP). We urge you to review these documents, which are
available through our web site, www.redwoodtrust.com.
This document,
called the Redwood Review, provides supplemental information about Redwood
through a discussion of many GAAP as well as non-GAAP metrics, such as taxable
income and economic book value. We believe that these figures provide additional
insight into Redwood’s business and future prospects. In each case in which we
discuss a non-GAAP metrics, you will find an explanation of how it has been
calculated, why we think the figure is important, and a reconciliation between
the GAAP and non-GAAP figures. We hope you find the Redwood Review to be helpful
to your understanding of our business.
We
thank you for your input and suggestions, which have resulted in our changing
the form and content of the Redwood Review over time. We welcome your continued
interest and comments.
|
Selected
Financial Highlights
|
||||||
|
Quarter:Year
|
GAAP
Income
per
Share
|
Taxable
Income
per
Share
|
Annualized
Return
on
Equity
|
GAAP
Book
Value
per
Share
|
Economic
Book
Value
per
Share**
|
Total
Dividends
per
Share
|
|
Q406
|
$1.32
|
$1.45
|
15%
|
$37.51
|
$31.42
|
$3.70
|
|
Q107
|
$0.66
|
$1.48
|
8%
|
$34.06
|
$32.22
|
$0.75
|
|
Q207
|
$0.41
|
$1.66
|
5%
|
$31.50
|
$33.11
|
$0.75
|
|
Q307
|
($2.18)
|
$1.74
|
(26%)
|
$5.32
|
$27.55
|
$0.75
|
|
Q407*
|
($36.49)
|
$0.92
|
(610%)
|
$23.18
|
$22.29
|
$2.75
|
|
Q108
|
($5.28)
|
$0.79
|
(83%)
|
$17.89
|
$18.04
|
$0.75
|
|
Q208
|
($1.40)
|
$0.11
|
(28%)
|
$17.00
|
$16.72
|
$0.75
|
|
Q308
|
($3.34)
|
$0.07
|
(80%)
|
$12.40
|
$13.18
|
$0.75
|
|
Q408
|
($3.46)
|
$0.25
|
(103%)
|
$9.02
|
$11.10
|
$0.75
|
|
*
|
The GAAP book
value per share is after giving retroactive effect to the adoption of FAS
159 on January 1, 2008. Without giving retroactive effect to FAS 159, the
GAAP book value per share was negative $22.18.
|
|
**
|
Economic book
value per share is calculated using bid-side marks for our financial
assets and offer-side marks for our financial liabilities and we believe
it more accurately reflects liquidation value than does GAAP book value
per share. Economic book value is reconciled to GAAP book value
in Table 6 of the Financial Tables.
|
|
THE REDWOOD
REVIEW 4TH QUARTER 2008
|
3
|
|
|
|
|
|
SHAREHOLDER
LETTER
|
Dear
Fellow Shareholders:
We all know by now
that we are in the midst of a multifaceted downturn that is the worst since the
Great Depression. But as someone who has been in the business world for many
years and seen many cycles, I can assure you that this dreadful period will pass
and that the economy, housing, and the financial system will right themselves —
setting the stage, yet again, for a new cycle of growth to begin.
Before looking to
the future, I want to take a moment to review 2008. While we were not surprised
by the downturn, we underestimated the extraordinary level and complexity of the
financial risks that market participants had taken, the extreme level of
leverage employed, and the degree to which the fates of most financial
institutions and markets were intertwined. With the clarity of hindsight, we
were too early with some of the investments we made in the first half of 2008,
although we believe these investments will ultimately yield acceptable
returns.
On the positive
side, we financed our 2008 investments with permanent capital, which allows us
to hold these securities to maturity without the risk of margin calls or forced
redemptions. In addition, starting in mid-June we ceased all investing activity,
so that we could assess the impact of the unprecedented developments occurring
in the financial markets and the implications of government intervention in the
mortgage market. We resumed acquiring assets late in the fourth quarter, after
we got our arms around the potential investment risks and rewards.
Looking ahead to
2009 and 2010, no matter how I adjust the prism, it’s not a pretty picture on so
many levels. If there were an easy fix for this situation, the smart,
hard-working, and experienced people addressing these problems would already
have found it. In the absence of a silver bullet, we expect governments and the
private sector to continue probing for solutions that enable homeowners and the
markets to stabilize. Complicating the problem is the extreme level of anger
from all quarters (in some cases, justifiably so) at banks, regulators, Wall
Street, and Washington, among others. We are not yet at the point at which
emotions can subside and people can resume working with and trusting each other
again. We believe it is simply going to take time, and that eventually, market
forces will take hold and provide the needed stability for the economy to
recover.
Of course, of
particular interest to Redwood is the health of the housing sector. It is
clearly in Redwood’s interest for home values to stabilize as soon as possible.
Unfortunately, despite all the good intentions of government programs, we
believe that home values will continue to fall for some time, until housing
inventories decline and values come back in line with income and rental
fundamentals. The rapid increase in home values between January 2000 and
December 2006 — a period during which home prices doubled — was driven not by
fundamentals but by excessive leverage and creative "affordability" mortgage
products that stretched the purchasing power of borrowers. Home ownership rates,
which had averaged 65% in the 20 years prior to 2000, rose to 69% between 2004
and 2006. We believe we are now in the midst of a painful retrenchment period
during which home values and home ownership rates will decline until they are in
line with historical norms. Realistically, this is likely to take
years.
|
4
|
THE REDWOOD
REVIEW 4TH QUARTER 2008
|
|
|
|
|
|
|
|
SHAREHOLDER
LETTER
|
We continue to
offer support for government programs designed to alleviate the housing and
credit crisis, but we believe that as a nation, we must determine what long-term
role the government should play in the mortgage market. We are of the opinion
that governmental entities can not do it all, and that private sector financing
will be essential to getting the mortgage markets back on track. We will
continue to support the creative exploration of securitization solutions and we
look forward to resuming our role of facilitating credit risk transfers. In the
meantime, we will continue to invest carefully and patiently in assets that we
believe will generate attractive returns with comfortable margins of
safety.
Redwood has a
strong balance sheet, solid operations, and management depth, which we believe
will enable us to prosper in the current environment and continue to build our
franchise in the months and years ahead. We appreciate the support you have
shown us throughout a very challenging year in 2008, and more recently during
our capital raise. Rest assured that we remain focused on building shareholder
value as we navigate through what is likely to be a challenging
2009.

George E. Bull,
III
Chairman and
CEO
|
THE REDWOOD
REVIEW 4TH QUARTER 2008
|
5
|
|
|
|
|
|
QUARTERLY
OVERVIEW
|
Fourth
Quarter 2008
In the spirit of
keeping our commentary as topical as possible, we are changing the focal point
of this letter to a Q&A discussion that recaps the most frequent questions
investors asked during our recent common stock offering road show. Our usual
summary of quarterly results seems out-of-date, as we released fourth quarter
financial information a month-and-a-half ago in connection with our common stock
offering. Rest assured that all of the numbers and usual commentary regarding
the fourth quarter are addressed in detail in the relevant modules later in this
Review.
Before we turn to
the Q&A, let’s start with a quick recap of the current market conditions.
Unfortunately, for many companies and homeowners, the real-life horror story
continues. The credit markets remain under intense pressure as housing and
economic activity continue to deteriorate, available credit and liquidity
continue to contract, and the rating agencies busily issue a barrage of
downgrades. In response, prices for residential and commercial real estate loans
and securities saw a steep decline during the fourth quarter. So far in 2009,
asset prices seem to be holding relatively steady from year-end levels. We would
caution that this price stability may be temporary, especially as we expect
significant additional downgrades of AAA residential and commercial
mortgage-backed securities.
Various arms of the
federal government have issued an alphabet soup of programs, legislation, and
stimulus packages, all aimed at stemming the decline in home values, slowing the
rate of foreclosures, and getting the economy and banking system back on track.
Overall, these and other initiatives should be positive for Redwood. We support
government policy aimed at helping homeowners, and actions that improve
conditions in the housing market will directly benefit Redwood if they lead to
lower losses and higher prepayments. We believe, however, that there is unlikely
to be a near-term recovery in housing or the economy.
In spite of the
gloomy outlook, and after spending four months watching and analyzing from the
sidelines, we have been active investors in residential mortgage-backed
securities (RMBS) since the latter part of the fourth quarter. We will go into
more detail on the prospective returns from these investments later in the
Review, but we believe we can now make attractive long-term residential
mortgage-related investments with a comfortable margin of safety. We invested
$50 million in the fourth quarter of 2008 and $98 million in the first quarter
through February 24, 2009. The vast majority of these investments were in senior
residential mortgage securities backed by prime or near-prime
loans.
It was clear from
our market analysis that the size of the investment opportunity was
substantially larger than the excess capital we had on hand to invest. After
much research and analysis, we concluded that raising common stock equity (at
the right price) would be accretive to earnings after the proceeds were deployed
into new investments and, therefore would be in the best interest of the company
and shareholders. When we commenced the offering road show in mid-January, we
were immediately tested by strong stock market headwinds. Nevertheless, thanks
to the support of existing shareholders and some new large institutional
investors we were successful in raising $283 million of new equity capital for
Redwood.
During the road
show, we met with over 100 institutional investors who asked many thoughtful,
hard-hitting questions. The majority of these questions touched on the purpose
of the offering, the investment opportunities we see, the impact of government
initiatives, and the sensitivity of our balance sheet and cash flows to further
credit deterioration. Below are the most frequent questions and our
answers.
|
6
|
THE REDWOOD
REVIEW 4TH QUARTER 2008
|
|
|
|
|
|
|
|
QUARTERLY
OVERVIEW
|
Fourth
Quarter 2008 (continued)
The
Offering
Q: Did Redwood need to raise
additional capital?
A: No, we did not need to
raise capital. This was an offensive capital raise. At December 31, 2008, we had
$126 million of unrestricted cash and no short-term debt. We also expect to
generate over $100 million in positive cash flow from our existing investments
after operating and interest expenses in 2009.
Q: Will the offering be
accretive?
A: One of the core values
that we remain deeply committed to (and which was articulated at Redwood’s
inception in 1994) is this: We ask for new capital from our shareholders only
when we believe we have investment opportunities in our business that should
lead us to higher levels of earnings and dividends per share. We believe this
offering will be accretive since we will be able to leverage our existing
overhead to invest the additional capital without adding personnel, systems, or
space. Furthermore, Redwood will benefit as the planned investments will
significantly extend the duration of our investment cash flows.
Q: Why common
equity?
A: We reviewed several
alternative forms of capital and structures that did not involve common equity.
The net result of this review was that these alternative forms of capital were
either prohibitively expensive, or would give rise to REIT or Investment Company
Act issues, or just added too much complexity to the story. In the end, we
decided that common equity was the best alternative for Redwood and its
shareholders. Common equity was simple, transparent, and appealing to the
broadest range of potential investors.
The
Investment Opportunity
Q: Why now? Many other smart
investors have lost a fortune calling a bottom to this down cycle.
A: We are not in the business
of calling market tops or bottoms, but we do have a view on when it is a better
time to invest and when it is a better time to sell. We are now active
buyers.
We have based our
analysis on our expectation that more bad things will happen in housing. In our
base case, we expect, on average, another 18% decline in nationwide home values
and as much as a 35% further decline in some major markets. We make our
investment decisions based on a range of outcomes. In this market, our target
investment has attractive mid- to high-teen returns in an unlevered base case,
well-protected stress case returns, and exceptional upside returns if we benefit
from faster prepayments or lower than expected credit losses.
As we intend to
fund these investments with permanent capital, we can sustain any future price
volatility without the risk of margin calls or equity redemptions. Furthermore,
if market discount rates go higher and asset prices go lower, it does not change
our long-term investment returns. So if we are a little early or a little late,
it’s okay. We are still acquiring assets that we believe will generate
attractive long-term cash flows.
|
THE REDWOOD
REVIEW 4TH QUARTER 2008
|
7
|
|
|
|
|
|
QUARTERLY
OVERVIEW
|
Fourth Quarter 2008
(continued)
Q: How will you invest the
proceeds?
A: Our primary focus will be
on assets similar to our recent purchases — senior cash flows from prime and
near-prime residential mortgage securities. To a lesser degree, we may
selectively purchase very credit-sensitive securities with a shorter duration,
but with the expectation of high projected rates of return. We have no current
plans to purchase commercial mortgage-backed securities, although we constantly
monitor the commercial market and the steps the government is taking in this
area. Additionally, we may use a portion of the proceeds to co-invest with third
party investors in investment funds which we may sponsor and
manage.
Q: What separates you from
your competitors?
A: To make successful
investment decisions, you need both the right people and the right tools. Over
the past 14 years, we have built a team comprised of seasoned mortgage and
capital markets professionals. These include former loan servicers, originators,
underwriters, as well as bond research analysts, structuring experts, and senior
managers with extensive Wall Street investment backgrounds. They
provide invaluable experience and street-level insights into our investment
assumptions and decisions. But that’s not enough. To properly evaluate the
projected cash flow from a residential mortgage-backed security (RMBS), you need
to have an opinion on each of the thousands of underlying loans. The market
often only gives us an hour to bid on a security. Traditional underwriting
methods and analytical tools are too slow to react. That is why our propriety
analytical tools are so crucial — they allow us to leverage our extensive
mortgage knowledge to make quick, well-informed decisions in the limited time
available without sacrificing detailed loan level analysis.
Q: How long will it take to
invest the proceeds?
A: We intend to invest the
proceeds in a focused and patient manner. We conservatively estimate it will
take about six months to invest the proceeds from the offering, but we caution
that the time period is difficult to project. For example, we invested $50
million in the fourth quarter, but $33 million was invested within a short
period in mid-December. In contrast, from mid-June through late October 2008, we
were on the sidelines. The opportunities to invest the proceeds can change
rapidly depending upon a number of factors including changes in the economy, the
state of the banking industry, and changes in government regulation and policy.
We consistently bid on considerably more securities than we
purchase.
Balance
Sheet and Cash Flows
Q: Can you discuss the credit
sensitivity of your balance sheet? What are your cash flow expectations for your
existing investment portfolio?
A: These are critical
questions that require reference to data and tables. Please see the Real Estate
Securities at Redwood section (pages 14-17) and the Cash Flow section (pages
20-22) in the Financial Insights section of this Redwood Review for an analysis
that addresses these questions.
|
8
|
THE REDWOOD
REVIEW 4TH QUARTER 2008
|
|
|
|
|
|
|
|
QUARTERLY
OVERVIEW
|
Fourth Quarter 2008
(continued)
Governmental
Actions
Q: Please provide the
Company’s thoughts on loan modifications and the impact on Redwood’s returns.
A: As the government becomes
further enmeshed in the banking system, and as support builds for a bankruptcy
law cramdown amendment that will enable bankruptcy courts to modify mortgage
loan terms, we believe the industry will continue to see mounting pressure (and
incentives) to accept loan modifications (or be forced to accept them through a
cramdown in bankruptcy).
At Redwood, we
believe that loan modifications will have a relatively small financial impact on
our existing portfolio. We expect that the biggest impact of modifications will
be on lower-rated non-prime securities. Our capital investment in these types of
securities is minimal ($0.24 per share at December 31, 2008). For new
investments, our analysis takes into account the likely negative impact to
investors of projected loan modifications.
Q: How would the proposal to
allow for bankruptcy cramdowns affect Redwood?
A: We don’t think cramdowns
will have a major impact on Redwood. Like modifications, we believe cramdowns
will have more of an impact on non-prime securities, where we have an
increasingly smaller exposure. We note that for December 2008 only 0.22% of
prime borrowers were in bankruptcy proceedings compared to 2.65% for subprime
borrowers, according to data from LoanPerformance.
The proposed
cramdown amendment may result in additional downgrades of AAA securities and
additional forced selling by investors whose capital allocation is
ratings-sensitive. This would present attractive investment opportunities for
Redwood.
We
are delighted that we completed the capital raise during difficult market
conditions. We are pleased by the support our equity offering received from
several new and existing shareholders. Now comes the crucial job of successfully
deploying the capital. We intend to invest patiently and wisely, and we fully
appreciate the trust and confidence you have shown us. Thank you for your
continuing support.
 |
 |
|
Martin S.
Hughes
President,
Chief Financial Officer,
and
Co-Chief Operating Officer
|
Brett D.
Nicholas
Chief
Investment Officer and
Co-Chief
Operating Officer
|
|
THE REDWOOD
REVIEW 4TH QUARTER 2008
|
9
|
|
|
|
|
|
FINANCIAL
INSIGHTS
|
Book
Value
Summary
|
u
|
The following
supplemental non-GAAP balance sheet presents our assets and liabilities as
calculated under GAAP and adjusted to reflect our estimate of economic
value. We show our investments in the Redwood Opportunity Fund, L.P. (the
Fund) and the Sequoia and Acacia securitization entities in separate line
items, similar to the equity method of accounting, reflecting the reality
that the underlying assets and liabilities owned by these entities are
legally not ours. We own only the securities or interests that we have
acquired from these entities.
|
|
u
|
This table,
except for our estimates of economic value, is derived from the
consolidating balance sheet presented on page 19. Our estimate of economic
value of $11.10 per share is calculated using bid-side asset marks, as
required to determine fair value under GAAP. This method of calculating
economic value more closely represents liquidation value and does not
represent the higher amount we would have to pay at the offered-side to
replace our existing assets.
|
|
Components
of Book Value
|
|||||||||
|
December
31, 2008
|
|||||||||
|
($
in millions, except per share data)
|
|||||||||
|
As
Reported
|
Adj.
|
Management's
Estimate of Economic Value
|
|||||||
|
Cash and cash
equivalents
|
$
|
126
|
|
$
|
|
$
|
126
|
||
|
Real estate
securities at Redwood
|
|||||||||
|
Residential
|
145
|
145
|
|||||||
|
Commercial
|
42
|
42
|
|||||||
|
CDO
|
4
|
4
|
|||||||
|
Total real
estate securities at Redwood
|
191
|
191
|
|||||||
|
Investments in
the Fund
|
28
|
28
|
|||||||
|
Investments in
Sequoia
|
97
|
(32)
|
(a)
|
65
|
|||||
|
Investments in
Acacia
|
16
|
(7)
|
(b)
|
9
|
|||||
|
Total
securities and investments
|
$
|
332
|
$
|
293
|
|||||
|
Long-term
debt
|
(150)
|
108
|
(c)
|
(42)
|
|||||
|
Other
assets/liabilities, net (d)
|
(6)
|
(6)
|
|||||||
|
Stockholders'
equity
|
$
|
302
|
$
|
371
|
|||||
|
Book
value per share
|
$
|
9.02
|
$
|
11.10
|
|||||
(a)
Our Sequoia investments consist of credit enhancement securities, investment
grade securities, and interest-only securities issued by Sequoia entities. We
calculated the $65 million estimate of economic value for these securities using
the same valuation process that we followed to fair value our other real estate
securities. In contrast, the $97 million of GAAP carrying value of these
investments represents the difference between residential real estate loans
owned by the Sequoia entities and the asset-backed securities (ABS) issued by
these entities to third-party investors. Under GAAP, we account for these loans
and ABS issued at cost, not at fair value.
(b)
Our Acacia investments consist of ABS and equity interests issued by Acacia
entities; we also have management agreements with each entity. The $9 million
estimate of economic value of our investments in Acacia entities represents the
fair value of the ABS acquired plus the net present value of projected cash
flows from our Acacia management fees discounted at 45%. We valued our equity
interests at zero. In contrast, the $16 million GAAP value of these investments
represents the difference between securities owned by the Acacia entities and
the ABS issued by these entities to third-party investors. Under GAAP we account
for these securities and ABS issued at fair value.
(c)
We have issued $150 million of 30-year long-term debt at an interest rate of
LIBOR plus 225 basis points. Under GAAP, this debt is carried at cost. Economic
value is difficult to estimate with precision as the market for this debt is
currently inactive. We estimated the $42 million economic value using the same
valuation process used to fair value our other financial assets and liabilities.
Estimated economic value is $108 million lower than our GAAP carrying value
because given the significant overall contraction in credit availability and
re-pricing of credit risk, we believe that if we had issued this long-term debt
at December 31, 2008, investors would have required a substantially higher
interest rate.
(d)
Other assets/liabilities, net are comprised of real estate loans of $3 million,
$4 million of deferred taxes, $6 million of accrued interest receivable, and
other assets of $27 million, less dividends payable of $25 million and accrued
interest and other liabilities of $21 million.
|
10
|
THE REDWOOD
REVIEW 4TH QUARTER 2008
|
|
|
|
|
|
|
|
FINANCIAL
INSIGHTS
|
Book Value
(continued)
Summary (continued)
|
u
|
In the fourth
quarter, our GAAP book value declined by $110 million, or $3.38 per share,
to $9.02 per share. Our estimated economic book value declined by $67
million, or $2.08 per share, to $11.10 per share. These declines were
largely due to mark-to-market write-downs that were driven by the
continuing and unprecedented lack of liquidity in the marketplace. Credit
deterioration continues to persist in most parts of our portfolio at rates
consistent with the expectations we established in prior quarters. We
believe the steep rate of market price declines in the fourth quarter was
exaggerated relative to the change in, and trend of, the fundamentals
underlying these securities.
|
|
u
|
Based on our
estimate of the future loss-adjusted cash flows underlying our calculation
of economic book value at December 31, 2008, the overall cash flow yield
for our $419 million economic value of financial assets was 21% (including
$126 million of cash yielding less than 1%) and 36% (excluding cash). The
implied yield for our $42 million of market value of financial liabilities
was 18%. Details and caveats regarding the use and determination of these
calculations and reconciliations of non-GAAP measures to GAAP are found
later in this Review.
|
|
u
|
The following
table highlights the components of the change in economic book value per
share that occurred during the fourth quarter. This table highlights the
performance of our different investment categories and shows other sources
and uses of cash that impacted economic value. Our investment performance,
expressed below as the change in the non-GAAP economic value of
investments, gives effect to mark-to-market adjustments, new investments,
and principal and interest
collected.
|
|
Changes
in the Components of Economic Value Per Share
|
|||||
|
Three
Months Ended December 31, 2008
|
|||||
|
(in
$ per share)
|
|||||
|
Management's
estimate of economic value at 9/30/08
|
$
|
13.18
|
|||
|
Change in
economic value of securities and investments
|
|||||
|
Real estate
securities at Redwood
|
(1.73)
|
||||
|
Investments in
the Fund
|
(0.12)
|
||||
|
Investments in
Sequoia
|
0.21
|
||||
|
Investments in
Acacia
|
(0.09)
|
||||
|
Total change
in economic value of securities and investments
|
(1.73)
|
||||
|
Operating
expenses and working capital
|
(0.51)
|
||||
|
Interest
expense and change in long-term debt valuation
|
0.98
|
||||
|
Equity
issuance, net
|
(0.07)
|
||||
|
Changes in
economic value before dividends
|
(1.33)
|
||||
|
Dividends
|
(0.75)
|
||||
|
Total
changes to economic value
|
(2.08)
|
||||
|
Management's
estimate of economic value at 12/31/08
|
$
|
11.10
|
|||
|
THE REDWOOD
REVIEW 4TH QUARTER 2008
|
11
|
|
|
|
|
|
FINANCIAL
INSIGHTS
|
Book Value
(continued)
Summary (continued)
|
u
|
The following
table shows the components of management’s estimate of economic book value
at December 31, 2008 on a pro forma basis after giving retroactive effect
to the receipt of $283 million of net proceeds from our public offering of
common stock in January 2009.
|
|
Pro
forma Components of Economic Value
|
||||||||||||||
|
reflecting the January 2009 equity offering (a)
|
||||||||||||||
|
($
in millions, except per share data)
|
||||||||||||||
|
December
31, 2008
|
Pro
forma
|
|||||||||||||
|
Management's
Estimate
of
Economic
Value
|
Per
Share
|
Management's
Estimate
of
Economic
Value
|
Per
Share
|
|||||||||||
|
Cash and cash
equivalents
|
$
|
126
|
$
|
3.76
|
$
|
409
|
$
|
6.81
|
||||||
|
Total
securities and investments
|
293
|
8.77
|
293
|
4.88
|
||||||||||
|
Long-term
debt
|
(42)
|
(1.25)
|
(42)
|
(0.70)
|
||||||||||
|
Other
assets/liabilities, net
|
(6)
|
(0.18)
|
(6)
|
(0.10)
|
||||||||||
|
Stockholders'
equity
|
$
|
371
|
$
|
11.10
|
$
|
654
|
$
|
10.89
|
||||||
|
(a)
Reflects net proceeds of $283 million and issuance of 26,450,000 shares
from the common stock
offering.
|
|
u
|
The shares of
common stock issued in the January 2009 public offering were priced at
$11.25 per share and, after underwriting fees and other offering expenses
of $0.53 per share, the net proceeds to Redwood were $10.72 per share.
This is the reason pro forma economic book value declined from $11.10 per
share pre-offering to $10.89 per share
post-offering.
|
|
u
|
At year-end,
our cash was $3.76 per share and management’s non-GAAP estimate of the
economic value of our securities and investments was $8.77 per share.
After giving retroactive effect to the offering, on a pro forma basis, our
cash was $6.81 per share and management’s non-GAAP estimate of the
economic value of our securities and investments was $4.88 per share. This
table highlights that our cash position, after the offering, accounts for
a significant amount of value per share and, as a result, our future
returns will depend upon our investment
success.
|
|
12
|
THE REDWOOD
REVIEW 4TH QUARTER 2008
|
|
|
|
|
|
|
|
FINANCIAL
INSIGHTS
|
Book Value (continued)
Quarterly
Activity
|
u
|
The total
fair value of securities at Redwood (which is the same as GAAP carrying
value) decreased during the fourth quarter by $37 million to $191 million.
The table below presents the changes in fair value for our real estate
securities portfolio during the fourth
quarter.
|
|
Real
Estate Securities at Redwood
|
|||
|
Three
Months Ended December 31, 2008
|
|||
|
($
in millions)
|
|||
|
Fair
value at September 30, 2008
|
$
|
228
|
|
|
Acquisitions
|
50
|
||
|
Sales
|
(1)
|
||
|
Principal
payments
|
(10)
|
||
|
Discount
amortization
|
(2)
|
||
|
Mark-to-market
adjustments, net
|
(74)
|
||
|
Fair
value at December 31, 2008
|
$
|
191
|
|
|
u
|
In the fourth
quarter we invested $46 million in AAA RMBS at a weighted average price of
64% of face value and with average credit support of 12 percentage points.
In addition, we invested $4 million in residential CES at a weighted
average price of 2% of face value. We have continued to acquire assets in
the first quarter of 2009 and through February 24, 2009, we invested $98
million in IGS at a weighted average price of 63% of face value and with
average credit support of 11 percentage points. The vast majority of these
IGS are in senior cash flow securities backed by prime or near-prime
loans.
|
Impact
of Potential Credit Ratings Downgrades
|
u
|
Our
investment decisions are based on our projection of the underlying
collateral cash flows and the level of subordination protecting against
future credit losses. We do not rely on credit ratings as part of our
investment decision process. We emphasize this point because in the near
future we expect significant downgrades by rating agencies of prime and
non-prime AAA RMBS issued from 2005 through 2008. The overall credit
performance of loans underlying these vintages is significantly worse than
the rating agencies’ original expectations. In many cases, we expect
securities currently rated AAA to be downgraded below investment grade,
and in some cases downgraded to
CCC.
|
|
u
|
Additionally,
the proposed bankruptcy cramdown legislation, if enacted, could result in
additional downgrades of prime and Alt-A RMBS, as technical loss sharing
arrangements in many of these securitization structures require that the
AAA securities share in a portion of the credit losses resulting from
bankruptcies.
|
|
u
|
So what does
this all mean for Redwood? Although there could be downward pressure on
prices for our existing portfolio, there may also be buying opportunities
as many current AAA investors could be pressured to sell. Some AAA
investors are rating-sensitive (meaning they can only own securities that
are rated AAA) and others, such as banks, would face significantly higher
capital requirements to hold lower-rated
securities.
|
|
u
|
It also means
that next quarter we are going to re-think how we present our information
on our securities. We are considering presenting our residential
securities by their senior and subordinate cash flow designations instead
of IGS and CES (as presented in the table on the next page).
Unfortunately, communicating the Redwood story just never seems to get any
easier. Nevertheless, we remain committed to transparency and will adapt
our presentations to keep up with the changing
times.
|
|
THE REDWOOD
REVIEW 4TH QUARTER 2008
|
13
|
|
|
|
|
|
FINANCIAL
INSIGHTS
|
Book Value
(continued)
Components
Cash
and Cash Equivalents
|
u
|
At December
31, 2008, we had $126 million in cash and cash equivalents, or $3.76 per
share. Adjusted for the $283 million net proceeds from our January 2009
public offering of common stock, we had, on a pro forma basis, $409
million in cash and cash equivalents, or $6.81 per share. All of our cash
is currently invested in U.S. Treasury Bills or bank deposits insured by
the Federal Deposit Insurance
Corporation.
|
Real
Estate Securities at Redwood
|
u
|
The following
table provides a breakout of our real estate securities portfolio by
residential, commercial, and CDO, and by vintage at December 31,
2008.
|
|
Real
Estate Securities at Redwood
|
|||||||||||||||||||||
|
December
31, 2008
|
|||||||||||||||||||||
|
($
in millions)
|
|||||||||||||||||||||
|
%
of Total
|
|||||||||||||||||||||
|
<=2004
|
2005
|
2006-2008
|
Total
|
Securities
|
|||||||||||||||||
|
Residential
|
|||||||||||||||||||||
|
IGS
|
|||||||||||||||||||||
|
Prime
|
$
|
16 |
$
|
41 |
$
|
16 |
$
|
73 | 38 | % | |||||||||||
|
Non-prime
|
- | 25 | 17 | 42 | 22 | % | |||||||||||||||
|
Total
IGS
|
$
|
16 |
$
|
66 |
$
|
33 |
$
|
115 | 60 | % | |||||||||||
|
CES
|
|||||||||||||||||||||
|
Prime
|
$
|
18 |
$
|
2 |
$
|
2 |
$
|
22 | 12 | % | |||||||||||
|
Non-prime
|
1 | 1 | 6 | 8 | 4 | % | |||||||||||||||
|
Total
CES
|
$
|
19 |
$
|
3 |
$
|
8 |
$
|
30 | 16 | % | |||||||||||
|
Total
Residential
|
$
|
35 |
$
|
69 |
$
|
41 |
$
|
145 | 76 | % | |||||||||||
|
Commercial
CES
|
$
|
10 |
$
|
9 |
$
|
23 |
$
|
42 | 22 | % | |||||||||||
|
CDO
|
$
|
- |
$
|
4 |
$
|
- |
$
|
4 | 2 | % | |||||||||||
|
Total
|
$
|
45 |
$
|
82 |
$
|
64 |
$
|
191 | 100 | % | |||||||||||
|
14
|
THE REDWOOD
REVIEW 4TH QUARTER 2008
|
|
|
|
|
|
|
|
FINANCIAL
INSIGHTS
|
Book Value
(continued)
Components
(continued)
Real Estate Securities at
Redwood (continued)
Residential
IGS
|
u
|
Our
investment strategy has shifted over the past year towards acquiring
residential prime and near-prime senior cash flows with a comfortable
margin of safety to protect against escalating credit losses. As a result,
the fair value of our residential IGS at December 31, 2008 was $115
million, representing 60% of our total securities portfolio at December
31, 2008, up from 51% at the end of the third quarter and 11% at the end
of last year.
|
|
u
|
Due to the
unprecedented dislocations in the credit markets, we are currently able to
buy IGS at significant discounts to principal value. Our returns on these
IGS investments will be based on how much principal and interest we
ultimately receive and how quickly we receive it. As these investments
primarily represent senior cash flows, we do not expect a high level of
losses. Our IGS returns are generally more sensitive to changes in
prepayment rates than they are to credit
risk.
|
|
u
|
The following
table presents the components of fair value (which equals GAAP carrying
value determined in accordance with GAAP) for residential prime and
non-prime IGS at Redwood at December 31,
2008.
|
|
Residential
Investment Grade Securities at Redwood
|
||||||
|
December
31, 2008
|
||||||
|
($
in millions)
|
||||||
|
Prime
|
Non-Prime
|
Total
|
||||
|
Current
face
|
$
|
195
|
$
|
104
|
$
|
299
|
|
Unamortized
premium (discount), net
|
(100)
|
(44)
|
(144)
|
|||
|
Discount
designated as credit reserve
|
(24)
|
(7)
|
(31)
|
|||
|
Amortized
cost
|
71
|
53
|
124
|
|||
|
Unrealized
gains
|
3
|
1
|
4
|
|||
|
Unrealized
losses
|
(1)
|
(12)
|
(13)
|
|||
|
Fair
value
|
$
|
73
|
$
|
42
|
$
|
115
|
|
Fair
value as a percentage of face
|
37%
|
40%
|
38%
|
|||
|
u
|
The $115
million fair value of our IGS represents 38% of face value at December 31,
2008. The IGS credit reserve of $31 million represents 10% of face value,
while the IGS unamortized discount (the face amount we expect to recoup
over time) of $144 million represents 48% of face
value.
|
|
u
|
The lifetime
prepayment assumptions used to value our IGS range from 8 to 15 CPR for
securities backed by prime loans and from 2 to 10 CPR securities backed by
non-prime loans. While these rates are representative of current
prepayment speeds for non-agency securities, we note that they are
extremely low relative to historical prepayment
rates.
|
|
u
|
As has been
well publicized, many borrowers are currently having difficulty
refinancing due to high non-agency mortgage rates, insufficient home
equity, and stringent underwriting. A pick-up in refinance activity either
from lower non-agency mortgage rates or from the government’s initiatives
to stimulate refinancing would likely benefit our IGS
returns.
|
|
THE REDWOOD
REVIEW 4TH QUARTER 2008
|
15
|
|
|
|
|
|
FINANCIAL
INSIGHTS
|
Book Value
(continued)
Components
(continued)
Real Estate Securities at
Redwood (continued)
Residential
CES
|
u
|
The fair
value of our residential CES portfolio was $30 million, representing 16%
of our total securities portfolio at December 31, 2008, down from 42% a
year ago. This decline resulted from a reduction in market values due to
negative mark-to-market adjustments and from our decision to re-direct our
investment focus to senior cash flows (i.e.,
IGS).
|
|
u
|
We acquire
CES at a significant discount to principal value, as credit losses could
reduce or eliminate the principal value of these bonds. In an ideal
environment, we would experience fast prepayments and low credit losses,
allowing us to recover a substantial part of the discount as income.
Conversely, the least beneficial environment is the environment we are
currently experiencing, with slow prepayments and high credit
losses.
|
|
u
|
The table
below presents the components of fair value (which equals GAAP carrying
value) of residential CES at Redwood at December 31,
2008.
|
|
Residential
Credit Enhancement Securities at Redwood
|
||||||||
|
December
31, 2008
|
||||||||
|
($
in millions)
|
||||||||
|
Vintage
|
||||||||
|
<=2004
|
>=2005
|
Total
|
||||||
|
Current
face
|
$
|
208
|
$
|
593
|
$
|
801
|
||
|
Unamortized
premium (discount), net
|
(35)
|
(33)
|
(68)
|
|||||
|
Discount
designated as credit reserve
|
(151)
|
(549)
|
(700)
|
|||||
|
Amortized
cost
|
22
|
11
|
33
|
|||||
|
Unrealized
gains
|
1
|
3
|
4
|
|||||
|
Unrealized
losses
|
(5)
|
(2)
|
(7)
|
|||||
|
Fair
value
|
$
|
18
|
$
|
12
|
$
|
30
|
||
|
Fair
value as a percentage of face
|
9%
|
2%
|
4%
|
|||||
|
u
|
We believe it
is best to analyze and discuss our CES investments by vintage — 2004 and
prior and 2005 to 2008 — as the potential return profiles differ
significantly.
|
|
u
|
The fair
value of our CES from 2004 and prior vintages totals $18 million,
representing 9% of face value. From a credit standpoint, these vintages
are generally performing in line with or better than our initial
expectations. We believe there is still potential earnings upside from
these investments if actual credit losses are below our credit reserves of
$151 million. These investments would also benefit from an increase in
refinance activity.
|
|
u
|
The fair
value of our CES from 2005 to 2008 vintages totals $12 million,
representing 2% of face value. Based on the poor credit trends underlying
these vintages, we expect future credit losses to eliminate nearly all of
the principal or face amount of these securities. Therefore, the fair
value ascribed to these securities primarily represents the present value
of future interest we expect to collect before actual credit losses are
realized. Even if prepayments increase, it will be too late to benefit
these CES to any material extent. We do not expect any upside from these
investments.
|
|
16
|
THE REDWOOD
REVIEW 4TH QUARTER 2008
|
|
|
|
|
|
|
|
FINANCIAL
INSIGHTS
|
Book Value
(continued)
Components
(continued)
Real Estate Securities at
Redwood (continued)
Commercial
CES
|
u
|
Our
commercial CES represents 22% of our securities portfolio, down from 41% a
year ago. We have not purchased commercial securities since the first
quarter of 2007 and we remain on the sidelines. Due to the continuing
deterioration in the fundamentals (increasing vacancies, falling rents,
and difficulty in refinancing) in an increasingly weakening economy, we
wrote down our commercial CES to $42 million, or 8% of face value in the
fourth quarter.
|
|
u
|
The table
below presents the components of fair values (which equals GAAP carrying
values) of commercial CES at Redwood at December 31,
2008.
|
|
Commercial
Credit Enhancement Securities at Redwood
|
||||||||||||
|
December
31, 2008
|
||||||||||||
|
($
in millions)
|
||||||||||||
|
Vintage
|
||||||||||||
|
<=2004
|
2005
|
2006
|
2007
|
Total
|
||||||||
|
Current
face
|
$
|
48
|
$
|
124
|
$
|
261
|
$
|
81
|
$
|
514
|
||
|
Unamortized
premium (discount), net
|
(6)
|
12
|
23
|
7
|
36
|
|||||||
|
Discount
designated as credit reserve
|
(34)
|
(123)
|
(260)
|
(81)
|
(498)
|
|||||||
|
Amortized
cost
|
8
|
13
|
24
|
7
|
52
|
|||||||
|
Unrealized
gains
|
2
|
-
|
-
|
-
|
2
|
|||||||
|
Unrealized
losses
|
-
|
(4)
|
(7)
|
(1)
|
(12)
|
|||||||
|
Fair
value
|
$
|
10
|
$
|
9
|
$
|
17
|
$
|
6
|
$
|
42
|
||
|
Fair
value as a percentage of face
|
21%
|
7%
|
7%
|
7%
|
8%
|
|||||||
|
u
|
Our $498
million commercial CES credit reserve reflects our belief that we will not
receive much principal from these investments. Since commercial CES do not
prepay like residential securities, our returns will be based on our
receiving interest on the outstanding face value until the anticipated
losses occur.
|
|
THE REDWOOD
REVIEW 4TH QUARTER 2008
|
17
|
|
|
|
|
|
FINANCIAL
INSIGHTS
|
Book Value
(continued)
Components
(continued)
Investments
in the Fund
|
u
|
The fair
value (which equals GAAP carrying value) of our investments in the Fund
was $28 million at December 31, 2008. This investment represents a 52%
interest in the Fund, which closed in March 2008 and is fully invested,
primarily in non-prime RMBS. The Fund is managed by a subsidiary of
Redwood.
|
Investments
in Sequoia
|
u
|
At December
31, 2008, the fair value of our investments in Sequoia was $65 million and
the GAAP carrying value was $97 million. These investments consist
primarily of interest-only securities (IOs) and to a lesser extent IGS and
CES. Our returns on these IOs are most sensitive to prepayments and faster
prepayments would negatively impact returns. Material changes in interest
rates also have a short-term impact on cash flows
generated.
|
Investments
in Acacia
|
u
|
At December
31, 2008, the fair value of our investments in Acacia was $9 million and
the GAAP carrying value was $16 million. These investments represent
equity interests and ABS issued from our Acacia CDO securitization
entities and the management fees we receive from those entities. Due to
various provisions in each CDO securitization, our equity interests are
generally cut off from cash flows and we only expect limited returns on
the ABS issued we own. We value the management fees at $5 million, which
equals our projected management fees discounted at a 45%
rate.
|
Short-term
Debt
|
u
|
We had no
short-term debt at December 31, 2008. We believe that it is currently
prudent to fund our investments with permanent capital (equity and
long-term debt) that is not subject to margin calls and financial
covenants.
|
Long-term
Debt
|
u
|
In 2006 and
2007, we issued $150 million of 30-year long-term debt at Redwood (due in
2037) at an interest rate of LIBOR plus 2.25%. Under GAAP, this debt is
carried at cost. At December 31, 2008, we estimated a $63 million fair
value for this liability using the same valuation process used to fair
value our other financial assets and liabilities. Estimated economic value
is lower than our GAAP carrying value because we believe that investors
would have required an 18% yield on this debt (currently equal to LIBOR +
16.75%) had we issued it at December 31, 2008, and the low LIBOR rates
have decreased anticipated interest
payments.
|
|
18
|
THE REDWOOD
REVIEW 4TH QUARTER 2008
|
|
|
|
|
|
|
|
FINANCIAL
INSIGHTS
|
Book Value (continued)
Consolidating
Balance Sheet
|
u
|
GAAP requires
us to consolidate all of the assets and liabilities of the Sequoia and
Acacia securitization entities (which had a combined $5.2 billion of
assets and $5.1 billion of liabilities at December 31, 2008), even though
the assets are owned by securitization entities and the liabilities are
obligations of these securitization entities payable only from the cash
flows generated by the assets owned by these entities. Additionally, we
are required to consolidate all of the assets and liabilities of the Fund,
even though Redwood owns only the general partnership interest in the Fund
and just over half of the limited partnership
interests.
|
|
u
|
The table
below shows the consolidating components of our consolidated balance sheet
at December 31, 2008. The purpose of this presentation is to show the
effect each of the components had on our consolidated shareholders’ equity
at December 31, 2008. The Fund, Sequoia, and Acacia components represent
investments and are not separate business
segments.
|
|
Consolidating
Balance Sheet
|
|||||||||||||||||||
|
December
31, 2008
|
|||||||||||||||||||
|
($
in millions)
|
|||||||||||||||||||
|
Redwood
|
The
Fund
|
|
Sequoia
|
|
Acacia
|
Intercompany
|
Redwood
Consolidated
|
||||||||||||
|
Real estate
loans
|
$
|
3
|
$
|
-
|
$
|
4,644
|
$
|
12
|
$
|
-
|
$
|
4,659
|
|||||||
|
Real estate
securities
|
191
|
48
|
-
|
408
|
(74)
|
573
|
|||||||||||||
|
Investments in
the Fund
|
28
|
-
|
-
|
-
|
(28)
|
-
|
|||||||||||||
|
Investments in
Sequoia
|
97
|
-
|
-
|
-
|
(97)
|
-
|
|||||||||||||
|
Investments in
Acacia
|
16
|
-
|
-
|
-
|
(16)
|
-
|
|||||||||||||
|
Other
investments
|
-
|
-
|
-
|
78
|
-
|
78
|
|||||||||||||
|
Cash and cash
equivalents
|
126
|
-
|
-
|
-
|
-
|
126
|
|||||||||||||
|
Total earning
assets
|
461
|
48
|
4,644
|
498
|
(215)
|
5,436
|
|||||||||||||
|
Other
assets
|
37
|
5
|
44
|
60
|
-
|
146
|
|||||||||||||
|
Total
assets
|
$
|
498
|
$
|
53
|
$
|
4,688
|
$
|
558
|
$
|
(215)
|
$
|
5,582
|
|||||||
|
Short-term
debt
|
$
|
-
|
$
|
-
|
$
|
-
|
$
|
-
|
$
|
-
|
$
|
-
|
|||||||
|
Other
liabilities
|
46
|
2
|
9
|
195
|
-
|
252
|
|||||||||||||
|
Asset-backed
securities issued - Sequoia
|
-
|
-
|
4,582
|
-
|
(74)
|
4,508
|
|||||||||||||
|
Asset-backed
securities issued - Acacia
|
-
|
-
|
-
|
347
|
-
|
347
|
|||||||||||||
|
Long-term
debt
|
150
|
-
|
-
|
-
|
-
|
150
|
|||||||||||||
|
Total
liabilities
|
196
|
2
|
4,591
|
542
|
(74)
|
5,257
|
|||||||||||||
|
Minority
interest
|
-
|
23
|
-
|
-
|
-
|
23
|
|||||||||||||
|
Total
stockholders’ equity
|
302
|
28
|
97
|
16
|
(141)
|
302
|
|||||||||||||
|
Total
liabilities and stockholders’ equity
|
$
|
498
|
$
|
53
|
$
|
4,688
|
$
|
558
|
$
|
(215)
|
$
|
5,582
|
|||||||
|
THE REDWOOD
REVIEW 4TH QUARTER 2008
|
19
|
|
|
|
|
|
FINANCIAL
INSIGHTS
|
Cash
Flow
|
u
|
As a
supplement to the Consolidated Statement of Cash Flows included in our
Annual Report on Form 10-K, we have included the table below, which
summarizes the sources and uses of our cash during the fourth quarter in a
manner consistent with the way management analyzes them. This table
excludes the gross cash flows generated by our Sequoia and Acacia
securitization entities and the Fund (cash flows that are not available to
Redwood), but does include the cash flows distributed to Redwood as a
result of our investments in these
entities.
|
|
u
|
As shown in
the table below, fourth quarter business cash flow totaled $27 million,
down $19 million from the third quarter. The majority of the decline
resulted from a $20 reduction in cash flow received from our investments,
which was consistent with our warning in the third quarter
Review. Other factors included a $1 million reduction in asset
management fees and a $2 million reduction in cash operating
expenses.
|
|
Redwood
|
|||
|
Sources
and Uses of Cash
|
|||
|
Three
Months Ended December 31, 2008
|
|||
|
($
in millions)
|
|||
|
Beginning
cash balance at 9/30/08
|
$
|
177
|
|
|
Business Cash
Flows:
|
|||
|
Cash flow from
investments
|
$
|
40
|
|
|
Asset
management fees
|
1
|
||
|
Operating
expenses
|
(12)
|
||
|
Interest
expense on debt
|
(2)
|
||
|
Total business
cash flows
|
27
|
||
|
Other Sources
and Uses:
|
|||
|
Proceeds from
asset sales
|
1
|
||
|
Proceeds from
equity issuance
|
2
|
||
|
Changes in
working capital
|
2
|
||
|
Acquistions
|
(50)
|
||
|
Dividends
|
(26)
|
||
|
Repayment of
debt
|
(7)
|
||
|
Net other
uses
|
(78)
|
||
|
Net
uses of cash
|
$
|
(51)
|
|
|
Ending
cash balance at 12/31/08
|
$
|
126
|
|
|
u
|
The beginning
cash balance at September 30, 2008 and the ending cash balance at December
31, 2008 presented in the table above are GAAP amounts. The presentation
of our sources and uses of cash in the table is derived from our GAAP
Consolidated Statement of Cash Flows for the fourth quarter of 2008 by
aggregating and netting all items within our GAAP Consolidated Statement
of Cash Flows in order to present our sources and uses of cash in a manner
consistent with the way management analyzes
them.
|
|
20
|
THE REDWOOD
REVIEW 4TH QUARTER 2008
|
|
|
|
|
|
|
|
FINANCIAL
INSIGHTS
|
Cash Flow
(continued)
|
u
|
Our cash flow
from investments in the fourth quarter declined from the prior quarter due
for three reasons; slower prepayments (reducing principal paid on our
securities), lower interest rates (reducing the interest paid on our
securities and investments in Sequoia), and the lack of one-time events
(which had increased our third quarter cash flows from our investments in
the Fund and in Acacia). The table below presents the changes in cash
flows from the third to the fourth quarter from our securities and
investments.
|
|
Redwood
|
|||||||||
|
Cash
Flow From Investments
|
|||||||||
|
($
in millions)
|
|||||||||
|
Three
Months Ended
|
|||||||||
|
9/30/08
|
12/31/08
|
Change
|
|||||||
|
Securities at
Redwood
|
|||||||||
|
Residential
principal
|
$
|
17
|
$
|
10
|
$
|
(7)
|
|||
|
Residential
interest
|
13
|
11
|
(2)
|
||||||
|
Commercial and
CDO interest
|
5
|
5
|
-
|
||||||
|
Total
Securities at Redwood
|
35
|
26
|
(9)
|
||||||
|
Investments in
Sequoia
|
13
|
9
|
(4)
|
||||||
|
Investments in
Acacia
|
5
|
2
|
(3)
|
||||||
|
Investments in
the Fund
|
7
|
3
|
(4)
|
||||||
|
Total
Cash Flow from Securities and Investments
|
$
|
60
|
$
|
40
|
$
|
(20)
|
|||
|
u
|
The $40
million of cash flow from our investments included $27 million of coupon
interest and $13 million of principal. We caution readers that given the
nature of our investments (deep discount credit-sensitive securities, IGS
at discounts, IOs, equity investments in Acacia, and other types) it is
difficult to draw conclusions in any one period about what portion of our
cash flow represents "income" and what is a "return of capital." It is
only at the end of an asset’s life that we can accurately determine what
portion of the cumulative cash received (whether principal or interest)
was truly income and what was a return of
capital.
|
|
THE REDWOOD
REVIEW 4TH QUARTER 2008
|
21
|
|
|
|
|
|
FINANCIAL
INSIGHTS
|
Cash Flow
(continued)
|
u
|
The following
table provides information regarding the investment source and vintage of
cash flows from our investments. As shown, most of our cash flows are
generated by assets from earlier vintages, which we believe provides a
level of comfort about our ongoing ability to generate cash, as these
assets generally continue to perform within our
expectations.
|
|
Cash
Flow from Investments by Vintage
|
|||||||||||||
|
Three
Months Ended December 31, 2008
|
|||||||||||||
|
($
in millions)
|
|||||||||||||
|
|
|||||||||||||
|
<=2004
|
2005
|
2006
|
2007
|
2008
|
Total
|
||||||||
|
Redwood
|
$
|
11
|
$
|
6
|
$
|
5
|
$
|
4
|
$
|
-
|
$
|
26
|
|
|
The
Fund
|
2
|
1
|
-
|
-
|
-
|
3
|
|||||||
|
Sequoia
|
6
|
-
|
-
|
3
|
-
|
9
|
|||||||
|
Acacia
|
2
|
-
|
-
|
-
|
-
|
2
|
|||||||
|
Total
|
$
|
21
|
$
|
7
|
$
|
5
|
$
|
7
|
$
|
-
|
$
|
40
|
|
|
u
|
At this time,
we believe our 2009 quarterly cash flows from our existing investments
(excluding the small amount of interest we receive on our cash) at
December 31, 2008 will be similar to the cash flows in the fourth quarter
of 2008. That is, we currently expect our net investment cash flow, after
operating and interest expenses, to exceed $100 million for 2009. We
caution that the projection of cash flows from existing investments at
December 31, 2008 is subject to risks and the actual cash flows may vary
and will depend upon, among other things, the amount and timing of credit
losses, the amount and timing of prepayments, and the nature and impact of
legislative and regulatory actions.
|
|
u
|
Cash flow
will be reduced in future periods as a consequence of credit losses, since
interest payments will be based on reduced principal balances. Credit
losses reduce our potential to recover the full face
value.
|
|
u
|
Future
increases in cash flow could be generated by successfully reinvesting the
cash flow from our existing investments, from investing our $126 million
of cash at December 31, 2008, and from investing the $283 million in
proceeds from our January 2009 common stock
offering.
|
|
22
|
THE REDWOOD
REVIEW 4TH QUARTER 2008
|
|
|
|
|
|
|
|
GAAP INCOME
|
Summary
What
is this?
GAAP
income is income calculated under generally accepted accounting principles in
the United
States.
Quarterly
Update
|
u
|
Our reported
consolidated GAAP loss for the fourth quarter of 2008 was $116 million
($3.46 per share) compared to a loss of $111 million ($3.34 per share) for
the third quarter of 2008. Negative market valuation adjustments (MVA)
recognized through our income statement continue to be the driving factor
in our results.
|
|
u
|
The table
below provides a summary of our GAAP loss for the fourth and third
quarters of 2008.
|
|
GAAP
(Loss) Income
|
|||||
|
($
in millions, except per share data)
|
|||||
|
Three
Months Ended
|
|||||
|
12/31/08
|
9/30/08
|
||||
|
Interest
income
|
$
|
123
|
$
|
131
|
|
|
Management
fees
|
1
|
1
|
|||
|
Interest
expense
|
(100)
|
(93)
|
|||
|
Net interest
income
|
24
|
39
|
|||
|
Provision for
loan losses
|
(19)
|
(18)
|
|||
|
Market
valuation adjustments, net
|
(111)
|
(127)
|
|||
|
Net interest
income (loss) after provision and market valuation
adjustments
|
(106)
|
(106)
|
|||
|
Operating
expenses
|
(14)
|
(17)
|
|||
|
Realized gains
on sales
|
6
|
-
|
|||
|
Realized gains
on calls
|
-
|
-
|
|||
|
Minority
interest allocation
|
2
|
2
|
|||
|
Benefit from
(provision for) income taxes
|
(4)
|
10
|
|||
|
GAAP
(loss) income
|
$
|
(116)
|
$
|
(111)
|
|
|
GAAP
(loss) income per share
|
$
|
(3.46)
|
$
|
(3.34)
|
|
|
THE REDWOOD
REVIEW 4TH QUARTER 2008
|
23
|
|
|
|
|
|
GAAP INCOME
|
Quarterly
Update (continued)
|
u
|
The table
below shows the consolidating components of our consolidated income
statements for the fourth and third quarters of 2008. The purpose of this
presentation is to show the effect each of the components had on our
consolidated income statements for these periods. The Fund, Sequoia, and
Acacia components represent investments and are not separate business
segments.
|
|
Consolidating
Income Statement
|
|||||||||||||||||||
|
Three
Months Ended December 31, 2008
|
|||||||||||||||||||
|
($
in millions)
|
|||||||||||||||||||
|
Redwood
|
The
Fund
|
Sequoia
|
Acacia
|
Intercompany
Adjustments
|
Redwood
Consolidated
|
||||||||||||||
|
Interest
income
|
$
|
18
|
$
|
2
|
$
|
71
|
$
|
36
|
$
|
(1)
|
$
|
126
|
|||||||
|
Net discount
(premium) amortization
|
(3)
|
1
|
(1)
|
-
|
-
|
(3)
|
|||||||||||||
|
Total interest
income
|
15
|
3
|
70
|
36
|
(1)
|
123
|
|||||||||||||
|
Management
fees
|
1
|
-
|
-
|
-
|
-
|
1
|
|||||||||||||
|
Interest
expense
|
(2)
|
-
|
(64)
|
(35)
|
1
|
(100)
|
|||||||||||||
|
Net interest
income
|
14
|
3
|
6
|
1
|
-
|
24
|
|||||||||||||
|
Provision for
loan losses
|
-
|
-
|
(19)
|
-
|
-
|
(19)
|
|||||||||||||
|
Market
valuation adjustments, net
|
(103)
|
(7)
|
(3)
|
(4)
|
6
|
(111)
|
|||||||||||||
|
Net interest
income (loss) after provision and market valuation
adjustments
|
(89)
|
(4)
|
(16)
|
(3)
|
6
|
(106)
|
|||||||||||||
|
Operating
expenses
|
(13)
|
(1)
|
-
|
-
|
-
|
(14)
|
|||||||||||||
|
Realized gains
on sales and calls, net
|
-
|
-
|
12
|
-
|
(6)
|
6
|
|||||||||||||
|
Loss from the
Fund, Sequoia, and Acacia
|
(10)
|
-
|
-
|
-
|
10
|
-
|
|||||||||||||
|
Minority
interest allocation
|
-
|
2
|
-
|
-
|
-
|
2
|
|||||||||||||
|
Benefit from
(provision for) income taxes
|
(4)
|
-
|
-
|
-
|
-
|
(4)
|
|||||||||||||
|
Net
(loss) income
|
$
|
(116)
|
$
|
(3)
|
$
|
(4)
|
$
|
(3)
|
$
|
10
|
$
|
(116)
|
|||||||
|
Consolidating
Income Statement
|
|||||||||||||||||||
|
Three
Months Ended September 30, 2008
|
|||||||||||||||||||
|
($
in millions)
|
|||||||||||||||||||
|
Redwood
|
The
Fund
|
Sequoia
|
Acacia
|
Intercompany
Adjustments
|
Redwood
Consolidated
|
||||||||||||||
|
Interest
income
|
$
|
17
|
$
|
2
|
$
|
71
|
$
|
37
|
$
|
(1)
|
$
|
126
|
|||||||
|
Net discount
(premium) amortization
|
6
|
2
|
(3)
|
-
|
-
|
5
|
|||||||||||||
|
Total interest
income
|
23
|
4
|
68
|
37
|
(1)
|
131
|
|||||||||||||
|
Management
fees
|
1
|
-
|
-
|
-
|
-
|
1
|
|||||||||||||
|
Interest
expense
|
(2)
|
-
|
(63)
|
(29)
|
1
|
(93)
|
|||||||||||||
|
Net interest
income
|
22
|
4
|
5
|
8
|
-
|
39
|
|||||||||||||
|
-
|
|||||||||||||||||||
|
Provision for
loan losses
|
-
|
-
|
(18)
|
-
|
-
|
(18)
|
|||||||||||||
|
Market
valuation adjustments, net
|
(88)
|
(8)
|
(2)
|
(29)
|
-
|
(127)
|
|||||||||||||
|
Net interest
income (loss) after provision and market valuation
adjustments
|
(66)
|
(4)
|
(15)
|
(21)
|
-
|
(106)
|
|||||||||||||
|
Operating
expenses
|
(17)
|
-
|
-
|
-
|
-
|
(17)
|
|||||||||||||
|
Realized gains
on sales and calls, net
|
-
|
-
|
-
|
-
|
-
|
-
|
|||||||||||||
|
Loss from the
Fund, Sequoia, and Acacia
|
(38)
|
-
|
-
|
-
|
38
|
-
|
|||||||||||||
|
Minority
interest allocation
|
-
|
2
|
-
|
-
|
-
|
2
|
|||||||||||||
|
Benefit from
(provision for) income taxes
|
10
|
-
|
-
|
-
|
-
|
10
|
|||||||||||||
|
Net
(loss) income
|
$
|
(111)
|
$
|
(2)
|
$
|
(15)
|
$
|
(21)
|
$
|
38
|
$
|
(111)
|
|||||||
|
24
|
THE REDWOOD
REVIEW 4TH QUARTER 2008
|
|
|
|
|
|
|
|
GAAP INCOME
|
Quarterly
Update (continued)
|
u
|
At Redwood,
net interest income declined from the prior quarter by $8 million to $14
million in the fourth quarter. This decline was due to the reduction in
face value on our securities due to credit losses in this and prior
quarters, slower prepayments (which reduced the rate at which we accrete
discount into income), and lower coupon rates as a result of lower
short-term interest rates (approximately 70% of our investments are
variable-rate investments). Negative MVA on our securities increased by
$15 million to $103 million as many of the continued declines in market
values on our securities resulted in other-than-temporary impairments this
quarter.
|
|
u
|
Total
operating expenses at Redwood decreased by $4 million to $13 million in
the fourth quarter of 2008. As discussed in the third quarter Review,
prior period expenses included non-recurring legal and consulting
costs.
|
|
u
|
In the fourth
quarter, we recorded a $4 million provision for income taxes relating to
timing differences between GAAP and taxable income recognition. As noted
in the third quarter Review, the decision of our board of directors to
distribute 100% of our 2007 and 2008 REIT taxable income resulted in a $10
million credit for income taxes in that
quarter.
|
|
u
|
For reasons
noted below, the losses from our investments in the Fund, Sequoia, and
Acacia were $10 million in the fourth quarter, as compared to a loss of
$38 million from these investments in the third quarter. As a result of
all the following factors, Redwood’s loss in the fourth quarter of $116
million was similar to the loss of $111 million in the prior
quarter.
|
|
u
|
The Fund
generated $3 million of net interest income, a slight decrease from the
prior quarter. Negative MVA on the securities in the Fund totaled $7
million in the fourth quarter, a slight improvement from the prior
quarter. After minority interests, the net loss from our investments in
the Fund was $3 million in the fourth quarter, which was similar to the
net loss of $2 million in the third
quarter.
|
|
u
|
At Sequoia,
net interest income after loan loss provision and MVA in the fourth
quarter was negative $16 million, similar to the third quarter result of
negative $15 million. The sale of our interests in certain Sequoia
entities resulted in a $12 million gain at Sequoia this quarter (as
discussed further in the Investment in Sequoia section of this Review). As
a result, our loss from our investments in Sequoia of $4 million was lower
than the $15 million loss in the third
quarter.
|
|
u
|
At Acacia,
net interest income declined as expected to $1 million in the fourth
quarter as distributions on our equity investments were terminated due to
rating agency downgrades of securities held by the Acacia entities. The
negative MVA of $4 million in the fourth quarter was significantly less
than in the prior quarter. As a result, our loss of $3 million on our
investment in Acacia In the fourth quarter was down than the $21 million
loss in the third quarter.
|
|
THE REDWOOD
REVIEW 4TH QUARTER 2008
|
25
|
|
|
|
|
|
TAXABLE
INCOME
|
Summary
What
is this?
Taxable
income is our pre-tax income as calculated for tax purposes. Taxable income
differs materially from GAAP income. Table 3 in the Appendix reconciles these
two earnings measures.
REIT
taxable income is the primary determinant of the minimum amount of dividends we
must distribute in order to maintain our tax status as a REIT. REIT taxable
income is pre-tax profit, as calculated for tax purposes, excluding taxable
income earned at our taxable subsidiaries. Over time, we must distribute at
least 90% of our REIT taxable income as dividends.
For
our quarterly taxable earnings estimates, we project our taxable earnings for
the year based upon various assumptions of events that will occur during the
year. However, some of the events that could have significant impact on our
taxable earnings are difficult to project, including the amount and timing of
credit losses, prepayments, and employee stock option exercises. Thus, our
quarterly taxable earnings are likely to remain volatile.
Quarterly
Update
|
u
|
The charts
below provide a summary of our taxable income per share and REIT taxable
income per share of each for the nine most recently completed fiscal
quarters.
|
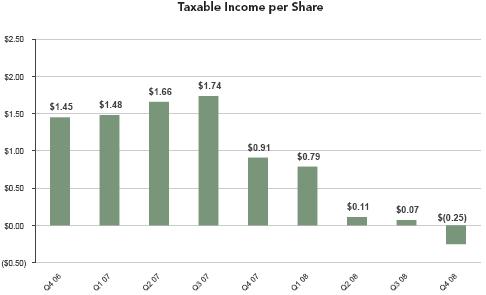
|
26
|
THE REDWOOD
REVIEW 4TH QUARTER 2008
|
|
|
|
|
|
|
|
GAAP INCOME
|
Quarterly
Update (continued)
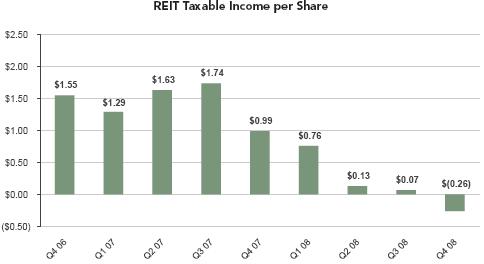
|
u
|
Our fourth
quarter taxable earnings included $40 million of deductions related to
credit losses, an increase of $7 million over the previous
quarter.
|
|
u
|
We caution
that the realization of credit losses can vary significantly from quarter
to quarter, depending on a number of variables (e.g., the level of loan
modifications, short sales, and the impact of new legislation) that could
decelerate or accelerate the timing of recognition of losses. For example,
federal and state regulatory actions are giving delinquent borrowers
additional time to resolve mortgage delinquency issues. Nevertheless, we
expect credit losses to continue to increase in
2009.
|
|
u
|
We are not
permitted to establish credit reserves for tax purposes and we do not
generally recognize changes in the market values of assets for tax
purposes until the asset is sold. As a result, at December 31, 2008, the
tax basis of our residential, commercial, and CDO CES at Redwood
(excluding investments in Sequoia and Acacia) was $479 million higher than
our GAAP basis. As a result, future credit losses will have a more
significant impact on our taxable income than on our GAAP income. Over
time, cumulative GAAP and taxable income will converge. Given our
projected losses, we expect taxable income to be less than GAAP income for
the next few quarters (although negative MVA could decrease reported GAAP
income significantly).
|
|
THE REDWOOD
REVIEW 4TH QUARTER 2008
|
27
|
|
|
|
|
|
DIVIDENDS
|
Summary
What
is this?
As
a REIT, we are required to distribute at least 90% of our REIT taxable income in
the form of dividends to shareholders. Our board of directors can declare
dividends in excess of this minimum requirement.
The
chart below shows the regular and special dividends per share paid to
shareholders for the indicated periods and our projected regular dividend for
2009.
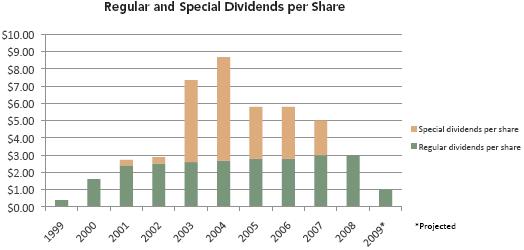
Quarterly
Update
|
u
|
On November
10, 2008, our board of directors declared a regular dividend of $0.75 per
share for the fourth quarter, which was paid on January 21, 2009 to
shareholders of record on December 31,
2008.
|
|
u
|
We paid $3.00
per share in regular dividends in 2008 and have announced that these
dividends consisted of $2.75 per share of ordinary income and $0.25 per
share of return of capital.
|
|
u
|
On November
10, 2008, our board of directors announced its intention to pay a regular
dividend of $0.25 per share per quarter in
2009.
|
|
u
|
There was no
undistributed REIT taxable income at December 31,
2008.
|
|
u
|
We expect a
tax loss at the REIT level for 2009 due to the expected realization of
credit losses. We currently expect that Redwood’s 2009 regular dividend
will constitute a return of capital and, as such, will not be taxable to
shareholders.
|
|
u
|
We currently
believe it is unlikely that we will pay a special dividend in
2009.
|
|
28
|
THE REDWOOD
REVIEW 4TH QUARTER 2008
|
|
|
|
|
|
|
|
CAPITAL &
LIQUIDITY
|
Summary
What
is this?
We
use capital to fund our operations, invest in earning assets that are generally
illiquid, fund working capital, and meet lender capital requirements with
respect to collateralized borrowings, if any.
Through
our internal risk-adjusted capital policy, we allocate a prudent level of
capital for our earning assets to meet liquidity needs that may arise. In most
cases, the amount of allocated capital is equal to 100% of the fair value of the
asset. The amount of capital that exceeds our risk-adjusted capital guideline,
less short-term debt, pending investment settlements, operating expense
allocations, and other miscellaneous capital allocations, is excess capital that
can be invested to support business growth.
Our
capital base includes common equity plus $150 million of long-term debt at
Redwood, which is due in 2037.
Declines
in the fair value of assets do not have an effect on excess capital, as asset
value declines equally reduce both available capital and capital required for
these investments.
Quarterly
Update
|
u
|
At December
31, 2008, our unrestricted cash totaled $126
million.
|
|
u
|
At December
31, 2008, our reported capital totaled $452 million, compared to $562
million at September 30, 2008. The decline in our reported capital during
the quarter generally reflects the decrease in the market value of our
assets.
|
|
u
|
Our excess
capital position was $121 million at December 31, 2008, a decrease from
$163 million at September 30, 2008. During the fourth quarter, our sources
of capital were $27 million from portfolio cash flows and management fees
in excess of operating costs and financing costs. Other sources of capital
included $1 million from asset sales, $2 million from the sale of shares
pursuant to our dividend reinvestment plan, and $4 million of net changes
in operating capital (per our internal risk-adjusted guidelines). Uses of
capital included the payment of $26 million in dividends and the funding
of $50 million of asset
acquisitions.
|
|
u
|
In January
2009, we raised $283 million, net of offering expenses, from a public
offering of common stock.
|
|
THE REDWOOD
REVIEW 4TH QUARTER 2008
|
29
|
|
|
|
|
|
MARK-TO-MARKET
ADJUSTMENTS
|
Market
Conditions
|
u
|
No sector of
the non-agency RMBS or CMBS market was spared from pricing pressure during
the fourth quarter of 2008. In particular, the AAA space saw relentless
declines in market value. We believe multiple factors drove the market
lower, including the following:
|
|
-
|
Hedge funds,
facing redemptions, were persistent and relatively price insensitive
sellers.
|
|
-
|
Mutual funds
were also persistent sellers in the face of
redemptions.
|
|
-
|
Global
investment banks were again under earnings and liquidity
pressure.
|
|
-
|
Traditional
high yield corporate investors, who had moved capital into the RMBS space,
moved back to high-yield corporate bonds as yields in that sector reached
historical levels.
|
|
-
|
Increased
uncertainty about how loan modifications and bankruptcy cramdowns will
affect mortgage-backed securities.
|
|
-
|
The slowing
pace of existing home sales and the continued declines in housing
prices.
|
|
-
|
A limited
amount of new capital available at year
end.
|
|
u
|
No
residential prime non-agency mortgage securitizations were completed in
the fourth quarter, and less than $7 billion were issued in 2008, down
from $180 billion issued in 2007, and $281 billion issued in the peak year
of 2005. No commercial mortgage securitizations were completed in the
second half of 2008, and only $12 billion were issued for the full year,
which was a significant reduction from the $230 billion issued in
2007.
|
|
u
|
The chart
below illustrates the substantial decline in prices throughout 2008 that
investors demanded to compensate for the perceived risk of various types
of AAA RMBS and CMBS over the past two
years.
|
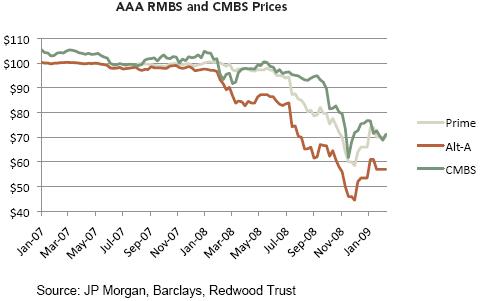
|
u
|
Note that AAA
RMBS and CMBS prices dropped dramatically in the fourth quarter (after the
Treasury Department announced it would not use TARP funds to acquire
non-agency mortgage securities). In early 2009, prices have partially
recovered from their lows.
|
|
30
|
THE REDWOOD
REVIEW 4TH QUARTER 2008
|
|
|
|
|
|
|
|
MARK-TO-MARKET
ADJUSTMENTS
|
Market
Conditions (continued)
|
u
|
For some
assets, declines in fair values reflect the near certainty of serious
credit losses being realized. For others, significant future losses may
not occur, but there is a perceived increase in the risk of loss,
resulting in a lower value. Finally, many assets are not at serious risk
of loss, but their declining value largely reflects a limited number of
observed sales in the market as well as reduced liquidity and increased
buyer caution.
|
|
u
|
The
accounting rules regarding mark-to-market (MTM) accounting are complex and
may not clearly reflect the underlying economics. This topic is more fully
discussed in the Accounting Discussion module in the
Appendix.
|
|
u
|
Financial
Table 16 in the back of this Review details the fair value of the
residential, commercial, and CDO securities at Redwood as a percentage of
their face value as of December 31,
2008.
|
Total
Mark-to-Market Adjustments
|
u
|
The table
below shows the consolidating impact of MTM adjustments against loans and
securities on our balance sheet and income statement in the fourth
quarter.
|
|
Mark-to-Market
Adjustments on Assets and Liabilities
|
|||||||||||
|
Consolidated
Balance Sheet and Income Statement Effects
|
|||||||||||
|
Three
Months Ended December 31, 2008
|
|||||||||||
|
($
in millions)
|
|||||||||||
|
The
|
|||||||||||
|
Redwood
|
Fund
|
Sequoia
|
Acacia (a)
|
Total
|
|||||||
|
Balance sheet
effect
|
|||||||||||
|
Net change in
equity account
|
$
|
26
|
$
|
(2)
|
$
|
-
|
$
|
-
|
$
|
24
|
|
|
Income
statement effect
|
|||||||||||
|
Market
valuation adjustments
|
|||||||||||
|
Fair value
assets and liabilities
|
(4)
|
-
|
(3)
|
2
|
(5)
|
||||||
|
Impairment on
AFS securities
|
(99)
|
(7)
|
-
|
-
|
(106)
|
||||||
|
Total income
statement effect
|
(103)
|
(7)
|
(3)
|
2
|
(111)
|
||||||
|
Total
mark-to-market adjustments
|
$
|
(77)
|
$
|
(9)
|
$
|
(3)
|
$
|
2
|
$
|
(87)
|
|
|
(a) Changes in
fair value assets at Acacia does not include $6.5 million of intercompany
market valuation adjustments related to the derecognition of certain
Sequoia ABS issued assets at Acacia entities during the fourth quarter of
2008. These ABS issued were previously eliminated upon
consolidation
|
|
THE REDWOOD
REVIEW 4TH QUARTER 2008
|
31
|
|
|
|
|
|
MARK-TO-MARKET
ADJUSTMENTS
|
Total
Mark-to-Market Adjustments (continued)
|
u
|
During the
quarter, net MTM adjustments on securities held at Redwood were negative
$77 million and were primarily related to higher discount rates required
by market participants and declining prepayment speeds, with credit
deterioration contributing to a minimal
extent.
|
|
u
|
The tables
below detail the negative $77 million of MTM adjustments during the fourth
quarter on securities held at Redwood by underlying collateral type and by
vintage.
|
|
Mark-to-Market
Adjustments
|
|||||||||||
|
on
Assets at Redwood
|
|||||||||||
|
Three
Months Ended December 31, 2008
|
|||||||||||
|
($
in millions)
|
|||||||||||
|
Loans
&
|
MTM
|
||||||||||
|
IGS
|
CES
|
Derivatives
|
Total
|
Percentage
(a)
|
|||||||
|
Residential
|
|||||||||||
|
Prime
|
$
|
(26)
|
$
|
(18)
|
$
|
-
|
$
|
(44)
|
(31)
|
%
|
|
|
Non-prime
|
(14)
|
(1)
|
-
|
(15)
|
(21)
|
%
|
|||||
|
Total
Residential
|
(40)
|
(19)
|
-
|
(59)
|
|||||||
|
Commercial
|
-
|
(15)
|
-
|
(15)
|
(24)
|
%
|
|||||
|
CDO
|
-
|
-
|
-
|
-
|
-
|
||||||
|
Interest rate
agreements & other derivatives
|
-
|
-
|
(3)
|
(3)
|
|||||||
|
Total
mark-to-market adjustments
|
$
|
(40)
|
$
|
(34)
|
$
|
(3)
|
$
|
(77)
|
|||
|
By
Vintage
|
|||||||||||||||||||||
| <= 2004 | 2005 | 2006 | 2007 | 2008 | Loans & Derivatives | Total | |||||||||||||||
|
Total
mark-to-market adjustments
|
$
|
(30)
|
$
|
(19)
|
$
|
(15)
|
$
|
(8)
|
$
|
(2)
|
$
|
(3)
|
$
|
(77)
|
|||||||
|
MTM
percentage (a)
|
(36)
|
%
|
(18)
|
%
|
(28)
|
%
|
(19)
|
%
|
(64)
|
%
|
|||||||||||
|
(a)
|
This
percentage represents the MTM adjustments taken as a percentage of the
reported fair values at the beginning of the period or purchase price if
acquired during the period. It isintended
to highlight the price declines by collateral type for the three months
ended December 31, 2008. These price declines are specific to our
portfolio and may not be indicative
of price declines in the market in
general.
|
|
32
|
THE REDWOOD
REVIEW 4TH QUARTER 2008
|
|
|
|
|
|
|
|
MARK-TO-MARKET
ADJUSTMENTS
|
Impact
on Assets at the Fund
|
u
|
During the
fourth quarter, total MTM adjustments at the Fund were a negative $9
million, all of which were deemed other-than-temporary impairments. All of
the securities owned by the Fund are classified as
available-for-sale.
|
Impact
on Assets and Liabilities at Sequoia
|
u
|
Loans and ABS
issued at Sequoia are carried at their amortized cost basis. Real estate
owned is reported at lower of cost or market. During the fourth quarter,
MTM adjustments totaled a negative $3 million resulting from a decrease in
the fair value of real estate
owned.
|
Impact
on Assets and Liabilities at Acacia
|
u
|
During the
fourth quarter, MTM adjustments were negative $4 million resulting from
decreases in the fair value of real estate securities, loans, derivatives,
and related ABS issued, as presented in the table
below.
|
|
Mark-to-Market
Adjustments
|
|||
|
on
Acacia Assets and Liabilities
|
|||
|
Three
Months Ended December 31, 2008
|
|||
|
($
in millions)
|
|||
|
Assets
|
|||
|
Real
estate securities and loans
|
$
|
(216)
|
|
|
Interest
rate agreements and other derivatives
|
(74)
|
||
|
Liabilities
|
|||
|
ABS
issued
|
286
|
||
|
Net
mark-to-market adjustments
|
$
|
(4)
|
|
|
THE REDWOOD
REVIEW 4TH QUARTER 2008
|
33
|
|
|
|
|
|
MARK-TO-MARKET
ADJUSTMENTS
|
Mark-to-Market
Valuation Process
|
u
|
The market
values we use for our assets and liabilities reflect the price we believe
we would realize if we chose to sell our securities or would have to pay
if we chose to buy back our liabilities or ABS issued. This is the
required accounting standard even if we have no intention to sell
assets.
|
|
u
|
Establishing
market values in thinly traded or essentially closed markets is inherently
subjective and is dependent upon many market-based inputs, including
observable trades, information on offered inventories, bid lists, and
indications of value obtained from dealers. Obtaining market values for
securities is especially difficult for illiquid securities (such as the
securities we own), and is made more difficult when there is limited
trading visibility. Although trading volume improved in the fourth quarter
from depressed levels over the prior three quarters, we expect market
valuations to remain volatile.
|
|
u
|
Late last
year, the Financial Accounting Standards Board issued clarifying guidance
on marking assets to fair value, although it did not change the accounting
requirements nor did it affect our valuation process. We continue to value
our securities at prices where we believe we can sell them in the current
illiquid market.
|
|
u
|
Market values
for our securities and ABS issued are dependent upon a number of
market-based assumptions, including future interest rates, prepayment
rates, discount rates, credit loss rates, and the timing of credit losses.
We use these assumptions to generate internal estimates of fair value for
each individual security.
|
|
u
|
Although we
rely on our internal calculations to compute the fair value of securities
we own, we also request and consider indications of value (marks) from
third-party dealers to assist us in our valuation process. For December
31, 2008, we received dealer marks on 67% of our assets and 94% of our
liabilities on our consolidated balance sheet. In the aggregate, our
internal valuations of the securities on which we received dealer marks
were 1% lower than the aggregate dealer marks at December 31, 2008. Our
internal valuations of our ABS issued on which we received dealer marks
were 12% higher than the aggregate dealer marks at December 31,
2008.
|
|
u
|
In assessing
the third-party dealer marks that we receive, it appears that some
measures have been taken to enhance the quality of these marks, as they
more closely approximated our internal fair value estimates in the fourth
quarter of 2008 than in recent prior quarters. However, there were fewer
third party generated data points available to us at December 31, 2008,
than in prior quarters, in part because some dealers no longer exist and
others have ceased providing client valuation
services.
|
|
34
|
THE REDWOOD
REVIEW 4TH QUARTER 2008
|
|
|
|
|
|
|
|
RESIDENTIAL REAL ESTATE
SECURITIES
|
Summary
What
is this?
Redwood
invests in securities that are backed by pools of residential real estate loans.
Historically, these securities were primarily CES, but recent acquisitions of
IGS have resulted in a larger percentage of IGS to total securities. Most of our
investments in residential real estate securities are backed by prime
residential loans and some are backed by Alt-A, Option ARM, and subprime loans.
The following discussion refers only to the residential securities owned by
Redwood, exclusive of the securities owned by Sequoia, Acacia, and the Fund, and
exclusive of Redwood’s investments in these entities.
Quarterly
Update
|
u
|
In the fourth
quarter, we invested primarily in AAA, or senior cash flow, securities. We
invested $46 million in AAA securities at a weighted average price of 64%
of the face value and with an average credit support of 12 percentage
points, and $4 million of CES, or subordinate cash flow securities, that
we acquired at 2% of face value. More details about our securities follow
in the prime IGS, non-prime IGS, and CES
sections.
|
|
u
|
Prices for
non-agency mortgage securities declined roughly 20% during the fourth
quarter. The drop was driven by a combination of forced selling by certain
investors facing liquidity pressures, uncertainty about government
intervention and loan modifications, and the potential for bankruptcy
cramdowns.
|
|
u
|
Mortgage
delinquencies continue to increase and ultimately will result in higher
future losses. It is important to note Redwood’s losses are capped at its
investment in any specific security, regardless of how much higher
delinquencies and losses increase. This is significantly different from a
portfolio lender or a guarantor that owns or guarantees the entire loan
(or portfolio of loans) where the higher the amount of delinquencies and
losses, the more loss exposure the lender or guarantor
has.
|
|
u
|
We expect the
rating agencies to downgrade a significant number of prime and Alt-A
mortgage securities from AAA to below investment grade ratings in the near
term. Approximately $1.5 trillion of prime and Alt-A AAA securities were
issued between 2005 and 2008. Given our current estimates of cumulative
losses for loans from these vintages, we believe most of these securities
will be downgraded.
|
|
u
|
The pending
bankruptcy reform legislation, if signed into law, will also result in AAA
downgrades as many of the bond structures require losses from bankruptcies
to be shared by all of the tranches in a mortgage security, and do not
allocate these losses only to the most subordinate
tranche.
|
|
u
|
Prepayment
rates in the fourth quarter were near historic lows (around 10%) for both
non-agency prime and agency securities. However, government programs such
as the recently announced Homeowner Affordability and Stability Plan are
designed to spur refinancing activity. The government is highly motivated
to increase prepayment activity and we may see an increase in prepayments
in the near future.
|
|
u
|
The Homeowner
Affordability and Stability Plan is primarily focused on reducing
foreclosures through loan modifications, and increasing refinancing
opportunities for Agency borrowers. Although details will not
be released until March 4, 2009, the Plan appears to formalize several
existing loan modification plans. The refinance aspect of the plan allows
existing mortgagors with loan to value ratios up to 105%, and who have
loans that are either owned or guaranteed by the Agencies, to refinance.
Existing non-Agency borrowers who have conforming loan balances (up to
$729,750 in high cost areas) could benefit under the plan by refinancing
into an Agency loan subject to satisfying the underwriting
requirements.
|
|
THE REDWOOD
REVIEW 4TH QUARTER 2008
|
35
|
|
|
|
|
|
RESIDENTIAL REAL ESTATE
SECURITIES
|
Prime
IGS Portfolio
What
is this?
Prime
IGS are mortgage-backed securities backed by high quality residential loans. The
borrowers typically have high FICO credit scores. The loans have relatively low
loan-to-value (LTV) ratios. Information on our prime IGS and underlying loan
characteristics are set forth in Tables 9, 10, 12, and 16 in the Financial
Tables in this Review.
Quarterly
Update
|
u
|
Total
interest income generated by our prime IGS was $3 million in the fourth
quarter, which produced an annualized yield of 15% on our amortized cost
of these securities.
|
|
u
|
During the
fourth quarter, we acquired $36 million of non-agency prime mortgage
securities. This included $30 million of 2005 AAA mortgage securities at a
weighted average price of 65% of face value and average credit support of
8 percentage points, and $6 million of 2007 AAA mortgage securities at a
weighted average price of 60% of face value and average credit support of
6 percentage points.
|
|
u
|
The increased
level of delinquencies and losses, and the insufficient amount of credit
support to cover the losses, means that today’s AAA, or senior cash flow,
securities could experience principal losses in the future. Therefore,
investing in these securities has become much more credit intensive,
requiring significant mortgage credit and structured finance
expertise.
|
|
36
|
THE REDWOOD
REVIEW 4TH QUARTER 2008
|
|
|
|
|
|
|
|
RESIDENTIAL REAL ESTATE
SECURITIES
|
Prime
IGS Portfolio (continued)
Quarterly
Update (continued)
|
u
|
The following
table presents information on our prime IGS at Redwood at December 31,
2008.
|
|
Credit
Reserve Analysis - Prime IGS at Redwood
|
|||||||||||||||||||||||||||||||
|
By
Rating and Vintage
|
|||||||||||||||||||||||||||||||
|
December
31, 2008
|
|||||||||||||||||||||||||||||||
|
($
in millions)
|
|||||||||||||||||||||||||||||||
|
<=2004
|
2005
|
2006
|
2007
|
2008
|
Total
|
||||||||||||||||||||||||||
| Amount |
%
of loans
|
Amount |
%
of loans
|
Amount |
%
of loans
|
Amount |
%
of loans
|
Amount |
%
of loans
|
Amount |
%
of loans
|
||||||||||||||||||||
|
AAA
|
|||||||||||||||||||||||||||||||
|
Face
|
$
|
-
|
$
|
51
|
$
|
16
|
$
|
10
|
$
|
-
|
$
|
77
|
|||||||||||||||||||
|
Unamortized
discount
|
-
|
(19)
|
(9)
|
(4)
|
-
|
(32)
|
|||||||||||||||||||||||||
|
Discount
designated as credit reserve
|
-
|
-
|
-
|
-
|
-
|
-
|
|||||||||||||||||||||||||
|
Unrealized
gains (losses)
|
-
|
2
|
-
|
-
|
-
|
2
|
|||||||||||||||||||||||||
|
Fair
value
|
$
|
-
|
$
|
34
|
$
|
7
|
$
|
6
|
$
|
-
|
$
|
47
|
|||||||||||||||||||
|
Credit
protection to AAA
|
n/a
|
7.57%
|
3.33%
|
8.43%
|
n/a
|
7.11%
|
|||||||||||||||||||||||||
|
Serious
delinquencies
|
n/a
|
2.27%
|
0.92%
|
0.10%
|
n/a
|
1.74%
|
|||||||||||||||||||||||||
|
AA
|
|||||||||||||||||||||||||||||||
|
Face
|
$
|
23
|
$
|
30
|
$
|
-
|
$
|
-
|
$
|
6
|
$
|
59
|
|||||||||||||||||||
|
Unamortized
discount
|
(15)
|
(23)
|
-
|
-
|
(4)
|
(42)
|
|||||||||||||||||||||||||
|
Discount
designated as credit reserve
|
-
|
-
|
-
|
-
|
(1)
|
(1)
|
|||||||||||||||||||||||||
|
Unrealized
gains (losses)
|
-
|
-
|
-
|
-
|
-
|
-
|
|||||||||||||||||||||||||
|
Fair
value
|
$
|
8
|
$
|
7
|
$
|
-
|
$
|
-
|
$
|
1
|
$
|
16
|
|||||||||||||||||||
|
Credit
protection to AA
|
3.44%
|
3.86%
|
n/a
|
n/a
|
2.66%
|
3.61%
|
|||||||||||||||||||||||||
|
Serious
delinquencies
|
1.47%
|
1.45%
|
n/a
|
n/a
|
0.85%
|
1.39%
|
|||||||||||||||||||||||||
|
A
|
|||||||||||||||||||||||||||||||
|
Face
|
$
|
23
|
$
|
-
|
$
|
1
|
$
|
-
|
$
|
3
|
$
|
27
|
|||||||||||||||||||
|
Unamortized
discount
|
(15)
|
-
|
|
-
|
-
|
(1)
|
(16)
|
||||||||||||||||||||||||
|
Discount
designated as credit reserve
|
(3)
|
-
|
(1)
|
-
|
(2)
|
(6)
|
|||||||||||||||||||||||||
|
Unrealized
(losses) gains
|
-
|
-
|
|
-
|
-
|
-
|
|
-
|
-
|
||||||||||||||||||||||
|
Fair
value
|
$
|
5
|
$
|
-
|
$
|
-
|
$
|
-
|
$
|
-
|
$
|
5
|
|||||||||||||||||||
|
Credit
protection to A
|
1.99%
|
n/a
|
n/a
|
n/a
|
1.76%
|
1.78%
|
|||||||||||||||||||||||||
|
Serious
delinquencies
|
1.97%
|
n/a
|
n/a
|
n/a
|
0.85%
|
1.61%
|
|||||||||||||||||||||||||
|
BBB
|
|||||||||||||||||||||||||||||||
|
Face
|
$
|
16
|
$
|
6
|
$
|
-
|
$
|
6
|
$
|
4
|
$
|
32
|
|||||||||||||||||||
|
Unamortized
discount
|
(6)
|
-
|
-
|
(4)
|
-
|
(10)
|
|||||||||||||||||||||||||
|
Discount
designated as credit reserve
|
(7)
|
(6)
|
-
|
-
|
(4)
|
(17)
|
|||||||||||||||||||||||||
|
Unrealized
gains (losses)
|
-
|
-
|
-
|
-
|
-
|
-
|
|||||||||||||||||||||||||
|
Fair
value
|
$
|
3
|
$
|
-
|
$
|
-
|
$
|
2
|
$
|
-
|
$
|
5
|
|||||||||||||||||||
|
Credit
protection to BBB
|
1.26%
|
0.99%
|
n/a
|
3.74%
|
1.23%
|
2.24%
|
|||||||||||||||||||||||||
|
Serious
delinquencies
|
1.21%
|
1.96%
|
n/a
|
1.38%
|
3.52%
|
1.68%
|
|||||||||||||||||||||||||
|
Total
fair value
|
$
|
16
|
$
|
41
|
$
|
7
|
$
|
8
|
$
|
1
|
$
|
73
|
|||||||||||||||||||
|
u
|
As seen in
the table above, most of our IGS are from 2005 and prior vintages and
rated AAA or AA. Note that most of these higher-rated securities are
senior cash flows (although this information is not shown in this
table).
|
|
u
|
Comparing the
level of credit support available to seriously delinquent loans provides a
measure of the low level of credit sensitivity that exists within our
prime IGS portfolio. For example, the AAA securities have over 7
percentage points of credit support while serious delinquencies are below
2%. In addition, the discount at which these securities are held provides
additional credit protection.
|
|
u
|
The credit
support presented in the table above represents the level of protection to
the associated position. As the amount of this credit support diminishes,
the likelihood of our securities absorbing losses increases. When we
anticipate that credit losses will exceed the credit support and be
absorbed by our securities, we designate a portion of the discount as a
credit reserve.
|
|
u
|
For our AAA
securities, we currently do not anticipate that losses will exceed the
level of credit support that exists and thus have no designated credit
reserve for these securities. We have established credit reserves for
prime IGS other than AAA
securities.
|
|
THE REDWOOD
REVIEW 4TH QUARTER 2008
|
37
|
|
|
|
|
|
RESIDENTIAL REAL ESTATE
SECURITIES
|
Prime
IGS Portfolio (continued)
Quarterly
Update (continued)
|
u
|
The
unamortized purchase discount on prime IGS was $100 million, or 51% of
face value. This discount will be amortized into interest income over the
expected lives of the securities.
|
|
u
|
A significant
factor in the rate of prepayments is the level of mortgage interest rates.
The following table illustrates our analysis of the percent of our prime
portfolio that is considered jumbo and the percent considered conforming
balance, broken out by loan type and vintage, as well as the weighted
average interest rates for the respective
buckets.
|
|
Prime
Securities at Redwood
|
||||||||||||||||||
|
Composition
by Product Type, Vintage, and Balance
|
||||||||||||||||||
|
December 31, 2008 (a)
(c)
|
||||||||||||||||||
|
<=
2004
|
2005
|
2006
|
2007
|
2008
|
Total
|
|||||||||||||
|
Product
|
% of
Balance
|
Wtd
Avg
Loan
Rate
|
% of
Balance
|
Wtd
Avg
Loan
Rate
|
% of
Balance
|
Wtd
Avg
Loan
Rate
|
% of
Balance
|
Wtd
Avg
Loan
Rate
|
% of
Balance
|
Wtd
Avg
Loan
Rate
|
% of
Balance
|
Wtd
Avg
Loan
Rate
|
||||||
|
Hybrid/ARM (b)
|
22%
|
4.85%
|
41%
|
5.46%
|
34%
|
6.00%
|
13%
|
6.35%
|
7%
|
6.13%
|
26%
|
5.28%
|
||||||
|
Fixed
|
10%
|
5.69%
|
4%
|
6.03%
|
11%
|
6.29%
|
46%
|
6.41%
|
71%
|
6.57%
|
12%
|
6.02%
|
||||||
|
Jumbo
|
32%
|
45%
|
44%
|
59%
|
78%
|
38%
|
||||||||||||
|
Hybrid/ARM (b)
|
33%
|
4.93%
|
49%
|
5.54%
|
42%
|
6.04%
|
8%
|
6.36%
|
2%
|
6.37%
|
35%
|
5.29%
|
||||||
|
Fixed
|
35%
|
5.85%
|
6%
|
6.02%
|
14%
|
6.25%
|
33%
|
6.40%
|
20%
|
6.48%
|
27%
|
5.94%
|
||||||
|
Conforming (d)
|
68%
|
55%
|
56%
|
41%
|
22%
|
62%
|
||||||||||||
|
Totals
|
100%
|
100%
|
100%
|
100%
|
100%
|
100%
|
||||||||||||
|
(a) The
product percentages differ from other tables as this shows our exposure on
a loan balance basis whereas other tables show our exposure on a market
value basis.
|
|
(b) ARMs
represent approximately 1% of our portfolio.
|
|
(c) Only the
loan groups providing direct cash-flows to our securities are
included. Loans backing the subordinate bonds within the same
structure as our IGS investments are not included unless we also hold such
a subordinate bond in our portfolio.
|
|
(d) Consistent
with the American Recovery and Reinvestment Act (ARRA) definition released
in late February 2009.
|
|
u
|
We estimate
that 38% of our prime portfolio is jumbo, or non-conforming
balance.
|
|
u
|
Given the
current level of non-conforming mortgage rates (close to 7%), tighter
underwriting standards, and the equity required to refinance, we do not
expect prepayments for our jumbo loans to increase in the near
future.
|
|
u
|
Historically,
jumbo fixed-rate mortgages have been priced to a spread of roughly 1.25%
above the 10-year Treasury note yield. Although the 10-year Treasury yield
has declined since mid-November to about 3% in mid-February, current jumbo
30-year fixed-rate mortgage spreads remain high by historical standards,
resulting in jumbo mortgage rates close to
7%.
|
|
u
|
We estimate
that approximately 62% of the loans backing our prime IGS portfolio have
loan balances that conform to the new Agency conforming limit of up to
$729,750 in high cost areas.
|
|
u
|
For those
borrowers that qualify under GSE underwriting requirements, we expect
prepayment speeds to increase in the near future. Due to the delays
associated with closing and reporting refinances, we will have more
clarity regarding the magnitude of the change in prepayment speeds as
future remittance reports are received in March or
April.
|
|
u
|
Prepayment
speeds on our IGS portfolio dropped from 13 CPR in the third quarter to 10
CPR in the fourth quarter. Our base scenario for evaluating current and
potential investments assumes no more than a 10 CPR. An increase in future
prepayment speeds, resulting from government programs or other market
factors, would increase our returns since the $100 million purchase
discount associated with this portfolio would be amortized into income at
a faster rate, and a portion of the credit reserves could be
recovered.
|
|
38
|
THE REDWOOD
REVIEW 4TH QUARTER 2008
|
|
|
|
|
|
|
|
RESIDENTIAL REAL ESTATE
SECURITIES
|
Non-Prime
Securities Portfolio
What
is this?
Non-prime
IGS include, Alt-A, option ARM, and subprime securities.
Alt-A
securities are residential mortgage-backed securities backed by loans that
generally have higher credit-quality characteristics than subprime, but lower
credit-quality characteristics than prime.
Option
ARM securities are residential mortgage-backed securities backed by loans that
allow borrowers to make payments that are less than the monthly accrued interest
on the mortgages.
Subprime
securities are residential mortgage-backed securities backed by lower-quality
loans. Many subprime borrowers have impaired credit histories.
Quarterly
Update
|
u
|
Total
interest income generated by our non-prime IGS was $1 million in the
fourth quarter, which produced an annualized yield of 10% on our amortized
cost.
|
|
u
|
During the
fourth quarter, we acquired $10 million of 2005 Alt-A securities at an
average price of 63% of face value and with average credit support of 26
percentage points.
|
|
u
|
The following
table presents information on our non-prime IGS at Redwood at December 31,
2008.
|
|
Credit
Reserve Analysis - Non-Prime IGS at
Redwood
|
||||||||||||||
|
By
Rating and Vintage
|
||||||||||||||
|
December
31, 2008
|
||||||||||||||
|
($
in millions)
|
||||||||||||||
|
2005
|
2006
|
2007
|
Total
|
|||||||||||
|
Amount
|
%
of loans
|
Amount
|
%
of loans
|
Amount
|
%
of loans
|
Amount
|
%
of loans
|
|||||||
|
AAA
|
||||||||||||||
|
Face
|
$
|
58
|
$
|
17
|
$
|
-
|
$
|
75
|
||||||
|
Unamortized
discount
|
(27)
|
(11)
|
-
|
(38)
|
||||||||||
|
Discount
designated as credit reserve
|
-
|
-
|
-
|
-
|
||||||||||
|
Unrealized
gains (losses)
|
(7)
|
-
|
-
|
(7)
|
||||||||||
|
Fair
value
|
$
|
24
|
$
|
6
|
$
|
-
|
$
|
30
|
||||||
|
Credit
protection to AAA
|
34.37%
|
37.28%
|
n/a
|
34.84%
|
||||||||||
|
Serious
delinquencies
|
11.68%
|
14.11%
|
n/a
|
11.96%
|
||||||||||
|
AA
|
||||||||||||||
|
Face
|
$
|
2
|
$
|
-
|
$
|
-
|
$
|
2
|
||||||
|
Unamortized
discount
|
(1)
|
-
|
-
|
(1)
|
||||||||||
|
Discount
designated as credit reserve
|
-
|
-
|
-
|
-
|
||||||||||
|
Unrealized
gains (losses)
|
-
|
-
|
-
|
-
|
||||||||||
|
Fair
value
|
$
|
1
|
$
|
-
|
$
|
-
|
$
|
1
|
||||||
|
Credit
protection to AA
|
18.08%
|
n/a
|
n/a
|
18.08%
|
||||||||||
|
Serious
delinquencies
|
7.96%
|
n/a
|
n/a
|
7.96%
|
||||||||||
|
BBB
|
||||||||||||||
|
Face
|
$
|
-
|
$
|
-
|
$
|
25
|
$
|
25
|
||||||
|
Unamortized
discount
|
-
|
-
|
-
|
(2)
|
(2)
|
|||||||||
|
Discount
designated as credit reserve
|
-
|
-
|
(7)
|
(7)
|
||||||||||
|
Unrealized
(losses) gains
|
-
|
-
|
-
|
(5)
|
(5)
|
|||||||||
|
Fair
value
|
$
|
-
|
$
|
-
|
$
|
11
|
$
|
11
|
||||||
|
Credit
protection to BBB
|
n/a
|
n/a
|
24.98%
|
24.98%
|
||||||||||
|
Serious
delinquencies
|
n/a
|
n/a
|
27.04%
|
27.04%
|
||||||||||
|
Total
fair value
|
$
|
25
|
$
|
6
|
$
|
11
|
$
|
42
|
||||||
|
THE REDWOOD
REVIEW 4TH QUARTER 2008
|
39
|
|
|
|
|
|
RESIDENTIAL REAL ESTATE
SECURITIES
|
Non-Prime
Securities Portfolio (continued)
Quarterly
Update (continued)
|
u
|
Not
surprisingly, serious delinquencies in our non-prime IGS portfolio are
significantly higher than in our prime IGS portfolio. However, the levels
of credit support and structural protection are also significantly higher
and, as a result, our non-prime IGS portfolio can withstand higher levels
of credit losses.
|
|
u
|
For example,
a non-prime super senior AAA security we recently purchased has 17
percentage points of credit support. This security can withstand default
rates as high as 75% of the underlying loans, with loss severities up to
50%, and still generate low double-digit returns for
Redwood.
|
|
u
|
The fair
value of our non-prime IGS portfolio is $42 million, or 41% of face value.
In addition to the credit support and designated credit reserves, we
effectively have additional cushion through this discount to face value
before the value of our investments would not be returned to
us.
|
|
u
|
The
unamortized purchase discount totaled $41 million, or 40% of face value.
This discount will be amortized into interest income over the lives of the
securities.
|
|
u
|
The fourth
quarter prepayment speed for our non-prime IGS was 6 CPR, down from 10 CPR
in the third quarter as non-prime borrowers continued to have fewer
refinancing options. We do not purchase or value non-prime IGS with fast
prepayment assumptions.
|
|
40
|
THE REDWOOD
REVIEW 4TH QUARTER 2008
|
|
|
|
|
|
|
|
RESIDENTIAL REAL ESTATE
SECURITIES
|
Credit-Enhancement
Securities Portfolio
What
is this?
CES
includes securities backed by prime and non-prime loans. The following
discussion reflects only the CES at Redwood, exclusive of CES owned by Acacia or
the Fund.
Quarterly
Update
|
u
|
Total
interest income generated by our CES was $11 million in the fourth
quarter, which produced an annualized yield of 93% on our amortized
cost.
|
|
u
|
In the fourth
quarter, we acquired $4 million of CES at a weighted average purchase
price of 2% of the face value.
|
|
u
|
The table
below presents information on our CES portfolio at Redwood at December 31,
2008.
|
|
Residential
Credit Enhancement Securities at
Redwood
|
||||||||
|
December
31, 2008
|
||||||||
|
($
in millions)
|
||||||||
|
Vintage
|
||||||||
|
<=2004
|
>=2005
|
Total
|
||||||
|
Current
face
|
$
|
208
|
$
|
593
|
$
|
801
|
||
|
Unamortized
premium (discount), net
|
(35)
|
(33)
|
(68)
|
|||||
|
Discount
designated as credit reserve
|
(151)
|
(549)
|
(700)
|
|||||
|
Amortized
cost
|
22
|
11
|
33
|
|||||
|
Unrealized
gains
|
1
|
3
|
4
|
|||||
|
Unrealized
losses
|
(5)
|
(2)
|
(7)
|
|||||
|
Fair
value
|
$
|
18
|
$
|
12
|
$
|
30
|
||
|
Fair
value as a percentage of face
|
9%
|
2%
|
4%
|
|||||
|
u
|
We break out
our CES portfolio into 2004 and earlier and 2005 and later categories. The
fair value of the 2004 and earlier vintages is $18 million and is reported
on our balance sheet at 9% of face value. From a credit standpoint, these
securities continue to perform within our general expectations, and we
believe there is upside potential (through recovery of a portion of the
discount designated as credit reserve) to some of these seasoned
securities that have low delinquencies and
losses.
|
|
u
|
The fair
value of our 2005 and later securities is $12 million and is reported on
our balance sheet at 2% of face value, and is performing worse than our
original expectations. We expect to write these off in the near term as
losses are incurred. Until then, they will continue to generate interest
payments.
|
|
u
|
Credit losses
on our CES were $102 million in the fourth quarter, an increase from $81
million in the third quarter. For tax purposes, losses on our CES were $39
million ($1.17 per share). The loss for tax purposes is less than the
principal value of credit losses incurred on the underlying loans as we
own most of our credit sensitive securities at a tax basis that is
substantially less than par value.
|
|
u
|
Our credit
reserves of $700 million for our CES portfolio represent 87% of the
aggregate face value of $801 million at December 31, 2008. Our credit
reserves increased by a net $152 million due primarily to the acquisition
of approximately $244 million in face value of CES for which we
established reserves of an equal amount, less credit losses in the fourth
quarter. Credit expectations for our existing portfolio did not materially
change during the fourth quarter.
|
|
THE REDWOOD
REVIEW 4TH QUARTER 2008
|
41
|
|
|
|
|
|
COMMERCIAL REAL ESTATE
SECURITIES
|
Commercial
Securities Portfolio
What
is this?
We
invest in securities that are backed by pools of commercial real estate loans.
The following discussion refers only to the commercial securities owned by
Redwood, exclusive of commercial securities owned by Acacia.
Market
Conditions
|
u
|
We believe
difficult times lay ahead for the commercial real estate sector.
Escalating economic woes are causing downward pressure on property-level
cash flows and valuations and, as a result, delinquency rates are expected
to increase at an accelerated pace in 2009. Furthermore, tight
underwriting standards at lowered leverage ratios will result in more
extensions and defaults on maturing loans, exacerbating the
problem.
|
|
u
|
Prompted by
the expectation of higher levels of delinquency, and a possible decline in
property values of 30% or more from their peak, Moody’s recently
re-assessed their CMBS rating model for 2006 and 2007 vintages, resulting
in several downgrades for classes up to and including the junior AAA
tranche. We expect the trend of downgrades to
continue.
|
|
u
|
According to
data from Barclays Capital, prices on senior AAA CMBS declined from 86% of
face value at September 30, 2008 to 62% of face value as of February 12,
2009. Prices for these securities hit a low of 50% of face value in
November 2008.
|
|
u
|
Our
commercial CES generated $5 million of positive cash flow during the
fourth quarter. As we anticipated at acquisition, portfolio cash flow will
decrease over time as our bond principal erodes due to credit losses,
leaving less principal outstanding to generate interest. The timing of
these credit losses will therefore be the key determinant of our future
returns. Structural considerations specific to CMBS, such as bond interest
shortfalls due to property appraisal reductions, will also impact the
timing of interest cash flows and affect our returns. (An appraisal
reduction is a mechanism that prevents the bond servicer from
over-advancing interest on seriously delinquent loans with high potential
loss severities).
|
|
u
|
Our
commercial securities portfolio consists of CES investments that we fund
with equity. The $49 billion of loans backing these securities are
predominantly fixed-rate, 10-year loans. The loans are diverse in size,
property type, and geographic location. Only 4% of these loans mature in
2009.
|
|
u
|
The fair
value of our commercial CES decreased to $42 million in the fourth quarter
from $64 million in the third quarter due to negative MTM adjustments.
These MTM adjustments resulted from significant price declines on CMBS
during the quarter. The fair value of our commercial CES was equal to 8%
of their $514 million face value at December 31, 2008. This fair value
reflects the fact that we do not expect a return of principal on the
majority of our commercial
investments.
|
|
42
|
THE REDWOOD
REVIEW 4TH QUARTER 2008
|
|
|
|
|
|
|
|
COMMERCIAL REAL ESTATE
SECURITIES
|
Commercial
Securities Portfolio (continued)
Quarterly
Update
|
u
|
The following
table presents our commercial securities portfolio by credit rating and
vintage and shows our cost as percentage of face
value.
|
|
Credit
Reserve Analysis - Commercial Portfolio
|
|||||||||||||||||
|
By
Rating and Vintage
|
|||||||||||||||||
|
December
31, 2008
|
|||||||||||||||||
|
($
in millions)
|
|||||||||||||||||
|
<=2004
|
2005
|
2006
|
2007
|
Total
|
|||||||||||||
|
Amount
|
%
of loans
|
Amount
|
%
of loans
|
Amount
|
%
of loans
|
Amount
|
%
of loans
|
Amount
|
%
of loans
|
||||||||
|
BB
|
|||||||||||||||||
|
Face
|
$
|
8
|
0.10%
|
$
|
-
|
-
|
$
|
3
|
0.08%
|
$
|
12
|
0.18%
|
$
|
23
|
0.12%
|
||
|
Unamortized
discount
|
(4)
|
-
|
-
|
1
|
(3)
|
||||||||||||
|
Discount
designated as credit reserve
|
(3)
|
0.04%
|
-
|
-
|
(2)
|
0.04%
|
(12)
|
0.18%
|
(17)
|
0.09%
|
|||||||
|
Unrealized
gains (losses)
|
-
|
-
|
-
|
-
|
-
|
||||||||||||
|
Fair
value
|
$
|
1
|
$
|
-
|
$
|
1
|
$
|
1
|
$
|
3
|
|||||||
|
Overall
credit protection to BB CES
|
3.61%
|
2.26%
|
2.13%
|
2.84%
|
|||||||||||||
|
B
|
|||||||||||||||||
|
Face
|
$
|
-
|
$
|
-
|
$
|
23
|
0.11%
|
$
|
16
|
0.11%
|
$
|
39
|
0.11%
|
||||
|
Unamortized
discount
|
-
|
-
|
4
|
2
|
6
|
||||||||||||
|
Discount
designated as credit reserve
|
-
|
-
|
(23)
|
0.11%
|
(16)
|
0.11%
|
(39)
|
0.11%
|
|||||||||
|
Unrealized
gains (losses)
|
-
|
-
|
(1)
|
-
|
(1)
|
||||||||||||
|
Fair
value
|
$
|
-
|
$
|
-
|
$
|
3
|
$
|
2
|
$
|
5
|
|||||||
|
Overall
credit protection to B CES
|
-
|
-
|
1.89%
|
1.60%
|
1.77%
|
||||||||||||
|
Unrated
|
|||||||||||||||||
|
Face
|
$
|
40
|
0.58%
|
$
|
125
|
0.61%
|
$
|
235
|
0.70%
|
$
|
53
|
0.45%
|
$
|
452
|
0.62%
|
||
|
Unamortized
discount
|
(2)
|
11
|
20
|
3
|
32
|
||||||||||||
|
Discount
designated as credit reserve
|
(31)
|
0.44%
|
(123)
|
0.50%
|
(235)
|
0.70%
|
(53)
|
0.45%
|
(442)
|
0.61%
|
|||||||
|
Unrealized
(losses) gains
|
2
|
(4)
|
(7)
|
-
|
(9)
|
||||||||||||
|
Fair
value
|
9
|
9
|
13
|
3
|
34
|
||||||||||||
|
Total
fair value
|
$
|
10
|
$
|
9
|
$
|
17
|
$
|
6
|
$
|
42
|
|||||||
|
u
|
In line with
the broader CMBS market, credit performance of our commercial portfolio
continued to weaken during the fourth quarter. At December 31, 2008,
serious delinquencies (60+ days) were $562 million, or 1.15% of the $49
billion of collateral loans, an increase from 0.96% at September 30, 2008.
As delinquencies rise, monthly cash flow will become less
predictable.
|
|
u
|
Realized
credit losses on our commercial CES of $0.7 million were charged against
our designated credit reserve during the fourth quarter. For tax purposes,
our deduction for these realized losses was $0.2 million. This deduction
is less than the principal value of credit losses incurred on the
underlying loans, as we own our commercial CES at a tax basis that is
substantially less than par value.
|
|
u
|
Our GAAP
credit reserve for commercial CES was $498 million, or $14.88 per share,
at December 31, 2008. We are not allowed to establish reserves for tax
purposes.
|
|
THE REDWOOD
REVIEW 4TH QUARTER 2008
|
43
|
|
|
|
|
|
INVESTMENTS IN
SEQUOIA
|
Summary
What
is this?
Sequoia
entities are independent securitization entities that acquire residential
mortgage loans and create and issue ABS backed by these loans. The vast majority
of the loans that Sequoia entities acquire are prime-quality loans. Most of the
investment-grade rated ABS created by Sequoia were sold to third-party
investors. Redwood acquired most of the CES and acquired most of the IOs for
securitizations issued before 2006. Although Redwood’s investment in Sequoia
entities is relatively small and limited, the loans and ABS issued by Sequoia
are shown on our consolidated financial statements. Redwood’s investments in
these entities do not appear on our balance sheet as an asset; rather, they are
reflected as the difference between the consolidated assets of Sequoia and the
consolidated Sequoia ABS issued to third parties.
Redwood’s
credit risk is generally limited to its investment in the CES Redwood acquires
from the Sequoia entities. Each Sequoia entity is independent from the others,
thus the performance of any one Sequoia entity does not affect any other Sequoia
entity.
Quarterly
Update
|
u
|
Cash
generated by our investments in Sequoia during the fourth quarter totaled
$9 million, compared to $13 million in the third quarter. The increase in
LIBOR late in the third quarter adversely affected cash flows distributed
to the IOs in the fourth quarter due to timing differences between coupon
resets on the loans held by the Sequoia entities and the ABS issued by the
Sequoia entities. We expect IO cash flows over the next few quarters to
increase because LIBOR fell dramatically during the fourth quarter and
cash flows will benefit from the reset timing differences between the
loans and ABS issued.
|
|
u
|
As discussed
in prior Reviews, loans underlying the Sequoia securitizations from 2006
and 2007 are performing worse than our expectations. For some of these
securitizations, we have negative GAAP equity as our loan loss reserves
exceed our investments. Economically, our losses cannot exceed our
investment. For GAAP purposes, we will recoup this negative equity upon a
deconsolidation event including the sale of our interests or the legal
extinguishment of our interests as credit losses are passed through by
trustees.
|
|
u
|
In the fourth
quarter, we sold our interests in the 2007 vintages of hybrid loans. For
GAAP, we deconsolidated the loans and associated ABS issued from these
securitization entities. This resulted in a positive $12 million
adjustment to our income. This positive adjustment is the primary reason
that the Sequoia net loss was $4 million in the fourth quarter of 2008,
compared to a net loss of $15 million in the third
quarter.
|
|
44
|
THE REDWOOD
REVIEW 4TH QUARTER 2008
|
|
|
|
|
|
|
|
INVESTMENTS IN
SEQUOIA
|
Quarterly
Update (continued)
|
u
|
After the
above sale, we still had $14 million of negative GAAP equity from other
interests in securitizations from 2007 and 2006. We would likely take
corresponding gains in the future if and when deconsolidation events
occur.
|
|
u
|
At December
31, 2008, our loan loss reserve was $36 million, or 0.77% of the current
loan balance, a decrease of $11 million during the quarter. Our credit
provision for loans was $18 million in both the fourth and third quarters.
We had net charge-offs of $7 million in the fourth quarter, compared to $4
million in the third quarter, and reversed $22 million of the reserve as a
result of the deconsolidation noted
above.
|
|
u
|
Seriously
delinquent loans decreased from $143 million to $120 million in the fourth
quarter, primarily as a result of the deconsolidation of the 2007 hybrid
loans. As a percent of current balances, seriously delinquent loans
increased from 2.36% to 2.61% as serious delinquencies increased across
all vintages.
|
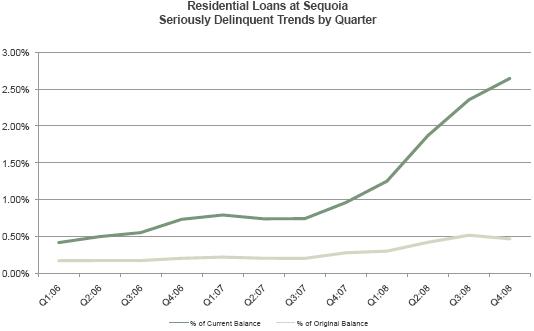
Economic
Value of our Investments in Sequoia
|
u
|
The GAAP fair
value of Redwood’s investments in Sequoia was $97 million at December 31,
2008. This is reflected on our balance sheet as the difference between
residential loans of $4.7 billion and ABS issued of $4.6 billion. Both the
loans and ABS issued are carried on our consolidated balance sheet at
their amortized cost basis.
|
|
u
|
Our estimated
economic value of Sequoia securities that Redwood owned at December 31,
2008, was $65 million, consisting of $59 million of IOs, $5 million of
CES, and $1 million of IGS. We used the same valuation process to value
these Sequoia securities as we did for third-party securities (as
described on page 34).
|
|
THE REDWOOD
REVIEW 4TH QUARTER 2008
|
45
|
|
|
|
|
|
INVESTMENTS IN
SEQUOIA
|
Economic
Value of our Investments in Sequoia (continued)
|
u
|
The primary
difference between our GAAP fair value and the economic value of our
investments in Sequoia is that for several years the loan premium
amortization expenses as calculated under GAAP have not kept pace with
prepayments. For a portion of these loans, our GAAP amortization method is
linked more closely to short-term interest rates. As short-term interest
rates increase, which they did during the third quarter, we expect premium
amortization for this portion of the loan portfolio to decrease. Loan
premium amortization expenses, a component of interest income, was $1
million in the fourth quarter, down from $3 million in the third quarter.
We ended the quarter with a net premium of $68 million on a $4.6 billion
principal loan balance for an average basis of 101.48. In the first half
of 2009, we expect our premium amortization expense to increase
substantially as a result of the decline in LIBOR rates during the fourth
quarter of 2008.
|
|
u
|
Our most
significant investments in Sequoia are IOs, which have no credit risk and
significant prepayment risk. These IOs earn the "spread" between the
coupon rate on $2.3 billion notional amount of underlying adjustable rate
mortgage loans (indexed to one- and six-month LIBOR) and the cost of funds
(indexed to one-month LIBOR) on the ABS issued within each respective
securitization entity. Returns on these investments increase when
prepayments slow and decrease when prepayments speed up. The table below
shows the declining prepayment speeds for the residential loans at Sequoia
over the past several quarters. Our tax basis in these IOs is $39
million.
|
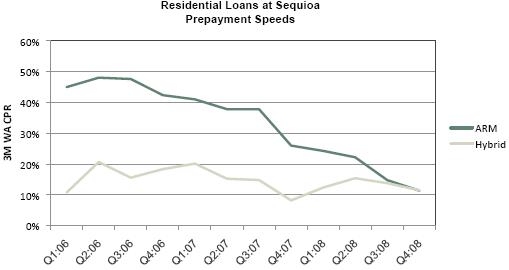
|
46
|
THE REDWOOD
REVIEW 4TH QUARTER 2008
|
|
|
|
|
|
|
|
INVESTMENTS IN
ACACIA
|
Summary
What
is this?
Our
investments in Acacia include equity interests and other securities in the
Acacia CDO entities we sponsor. We also receive asset management fees that are
paid to us as first or senior priority from the cash flows of the Acacia
assets.
Quarterly
Update
|
u
|
During the
fourth quarter, we received cash distributions of $1 million from our
equity interests and $1 million from our ABS investments. We also received
$1 million of management fees.
|
|
u
|
The
consolidated Acacia net loss was $3 million in the fourth quarter of 2008,
compared to a net loss of $21 million in the third quarter, primarily due
to lower MTM adjustments in the fourth quarter. Earnings from Acacia will
continue to decline in future periods and MTM adjustments may continue to
be volatile.
|
|
u
|
Our reported
GAAP equity value for Acacia was $16 million while our estimate of
economic value is $9 million.
|
Economic
Value of our Investments in Acacia
|
u
|
Our
investment in Acacia represent less than 4% of our capital at December 31,
2008.
|
|
u
|
The table
below shows the components of management’s estimate of economic value for
our investment in Acacia as of the end of the fourth quarters.
Management’s estimate of economic value is reconciled to GAAP fair value
on Table 6 of the Financial Tables.
|
|
Investment
in Acacia
|
|||
|
Management's
Estimate of
|
|||
|
Economic
Value
|
|||
|
($
in millions)
|
|||
|
December 31,
|
|||
|
2008
|
|||
|
Management
fees
|
$
|
5
|
|
|
ABS
|
4
|
||
|
Preference
shares
|
-
|
||
|
Total
|
$
|
9
|
|
|
u
|
Our economic
value includes the net present value of anticipated management fees
(discounted at 45%) of $5 million.
|
|
u
|
We valued our
Acacia ABS investments at 4% of face value, which is our estimate of
bid-side value.
|
|
u
|
As noted in
prior Reviews, collateral rating downgrades by credit rating agencies have
now shut off the cash flows on all but one equity investment in Acacia.
Due to the volatility surrounding rating downgrades, we are projecting no
future cash distributions on any of our equity investments in Acacia
entities and we valued our equity investments at
zero.
|
|
THE REDWOOD
REVIEW 4TH QUARTER 2008
|
47
|
This Page Intentionally
Left Blank
|
48
|
|

|
|
|
|
|
ACCOUNTING
DISCUSSION
|
Accounting
Discussion
|
u
|
The rules
regarding MTM accounting are complex and may not be consistent across
portfolios or clearly reflect the underlying economics. This accounting
discussion is intended to provide investors with a better understanding of
the impact of MTM adjustments on our reported
results.
|
|
u
|
MTM
adjustments can result from changes in fair values caused either by a
change in expected cash flows (i.e., increased credit loss estimates that
reduce expected cash flows), a change in market discount rates (i.e., the
market requires a greater risk premium and/or interest rates rise), or a
combination of both.
|
|
u
|
At Redwood,
where we hold most of our securities as available-for-sale (AFS) for
accounting purposes, other-than-temporary MTM changes flow through our
income statement while MTM changes that are temporary are charged to
equity.
|
|
u
|
All changes
in fair value for securities, derivatives, or liabilities accounted for as
trading instruments or under the fair value option of FAS 159 flow through
the income statement. These adjustments can have a positive or negative
impact on income in any period.
|
|
u
|
CES and most
IGS held at Redwood and the real estate securities held by the Fund are
accounted for as AFS securities. We carry AFS securities on our GAAP
balance sheet at their fair value. Positive changes in the fair value of
AFS securities from period to period are always accounted for as increases
to stockholders’ equity and do not flow through our income statement.
Accounting for negative changes in the fair value of AFS securities from
period to period requires a three-step process involving a combination of
quantitative and judgmental evaluations. The ultimate purpose of this
process is to determine whether negative MTM adjustments represent
"other-than-temporary" (permanent) impairments, which flow through our
GAAP income statement, or represent "temporary" impairments, which are
recorded as a reduction of stockholders’ equity and do not flow through
our income statement.
|
|
u
|
For the
Sequoia entities, we generally consolidate the assets and liabilities,
which we report at amortized cost, except for REO, which are reported at
the lower of cost or fair value.
|
|
u
|
For
accounting purposes, we consolidate the balance sheets and income
statements of the Acacia securitization entities. On January 1, 2008, we
adopted a new accounting standard, FAS 159, and elected to fair value both
the assets and liabilities of the Acacia entities. In accordance with FAS
159, we recorded a one-time, cumulative-effect adjustment to our January
1, 2008 opening balance sheet that decreased the carrying value of Acacia
liabilities by $1.5 billion and increased equity. This new standard
significantly reduces the disparity that existed between GAAP carrying
value and our previous estimates of economic
value.
|
|
50
|
THE REDWOOD
REVIEW 4TH QUARTER 2008
|
|
|
|
|
|
|
|
ACCOUNTING
DISCUSSION
|
Accounting
Discussion (continued)
|
u
|
The diagram
below and the narrative discussion that follows address the three-step
process for evaluating impairments on AFS
securities.
|
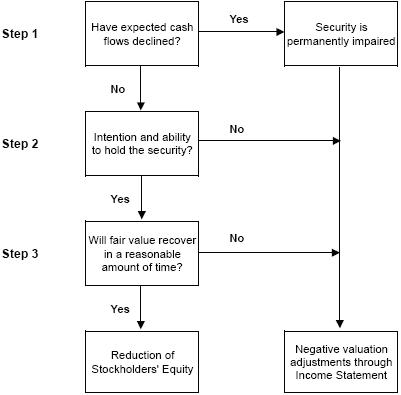
|
u
|
The first
step is to determine whether there has been an adverse change in the
underlying cash flows generated by the security. A security is considered
permanently impaired even if the change in projected cash flows is small
relative to the resulting MTM adjustment. It is difficult to separate with
precision how much of the change in fair value is driven by changes in
expected cash flows versus changes in market discount rates, but during
periods of market illiquidity and uncertainty (as we have encountered
since mid-2007), the market discount rate impact can be
significant.
|
|
u
|
The second
step is to determine whether we have the ability and intention to hold the
security.
|
|
u
|
The third
step requires us to evaluate whether an impaired security will recover in
value within a reasonable period of time. This step is very subjective,
particularly when there is turmoil and uncertainty in the capital
markets.
|
|
u
|
AFS
securities deemed permanently impaired for accounting purposes cannot be
written back up through MTM adjustments in our income statement. This does
not mean the underlying security could not recover in value. If the value
of an impaired security does recover, we would recognize this benefit
through higher interest yields over time. Therefore, some of the
securities classified as permanently impaired during recent quarters may
eventually prove to have significant value to
us.
|
|
THE REDWOOD
REVIEW 4TH QUARTER 2008
|
51
|
|
|
|
|
|
GLOSSARY
|
ACACIA
Acacia is the brand
name for the collateralized debt obligation (CDO) securitizations Redwood
sponsors (that is, a re-securitization of real estate and other securities). The
underlying securities are generally backed by residential prime, Alt-A, and
subprime real estate loans, and commercial real estate loans. Acacia also owns
related assets such as CDO securities issued by other real estate oriented CDOs,
corporate debt issued by equity REITs, commercial real estate loans, and
synthetic assets derived from real estate assets. Redwood typically acquires a
portion of the CDO credit-enhancement (or "equity") securities issued by Acacia;
these are the securities that are in the first-loss (highest risk) position with
respect to absorbing any credit losses that may occur within the assets owned by
the Acacia entities. Redwood may also retain or acquire Acacia ABS issued.
Redwood’s credit risk is limited to its investments in Acacia and each Acacia
entity is independent of the others. Redwood also earns asset management fees
for ongoing management of the Acacia entities. For GAAP accounting purposes, we
consolidate the assets and liabilities of the Acacia entities and their
associated income and expense on Redwood’s consolidating balance sheet and
income statements.
ADJUSTABLE-RATE
MORTGAGES (ARMs)
Adjustable-rate
mortgages are loans that have coupons that adjust at least once per year. We
make a distinction between ARMs (loans with a rate adjustment at least annually)
and hybrids (loans that have a fixed-rate period of two-to-10 years and then
become adjustable-rate).
AGENCY
Agency refers to
government-sponsored enterprises (GSEs), include the Federal National Mortgage
Association (Fannie Mae) and the Federal Home Loan and Mortgage Corporation
(Freddie Mac).
ALT-A
SECURITIES
Alt-A securities
are residential mortgage-backed securities backed by loans that have higher
credit quality than subprime and lower credit quality than prime. Alt-A
originally represented loans with alternative documentation, but the definition
has shifted over time to include loans with additional risk characteristics and
a higher percentage of investor loans. In an Alt-A loan, the borrower’s income
may not be verified, and in some cases, may not be disclosed on the loan
application. Alt-A loans may also have expanded criteria that allow for higher
debt-to-income ratios with higher accompanying loan-to-value ratios than would
otherwise be permissible for prime loans.
AMORTIZED
COST
Amortized cost is
the initial acquisition cost of an AFS security, minus principal repayments or
principal reductions through credit losses, plus or minus premium or discount
amortization. At the point in time an AFS security is deemed
other-than-temporarily impaired, the amortized cost is adjusted (by changing the
amount of unamortized premium or discount) to equal to the fair value of the
security, and this adjustment is recognized as a loss through our income
statement.
|
52
|
THE REDWOOD
REVIEW 4TH QUARTER 2008
|
|
|
|
|
|
|
|
GLOSSARY
|
ASSET-BACKED
SECURITIES (ABS)
Asset-backed
securities (ABS) are securities backed by financial assets that generate cash
flows. Each ABS issued from a securitization entity has a unique priority with
respect to receiving principal and interest cash flows and absorbing any credit
losses from the assets owned by the entity.
BOOK
VALUE (GAAP)
Book value is the
value of our common equity. As measured for GAAP, through December 31, 2007,
reported book value generally incorporated mark-to-market adjustments for
securities and interest rate agreements, but not for loans or liabilities.
Beginning January 1, 2008, book value as measured for GAAP includes
mark-to-market adjustments on certain assets and liabilities.
CDO
EQUITY SECURITIES
CDO equity
securities (CDO CES) are credit-enhancement securities that bear the initial
credit losses of the assets owned by CDO securitization entities. See
"Credit-Enhancement Securities."
COLLATERALIZED
DEBT OBLIGATION (CDO) SECURITIZATIONS
The securitization
of a diverse pool of assets.
COMMERCIAL
MORTGAGE-BACKED SECURITIES (CMBS)
A type of
mortgage-backed security that is secured by one or more loans on a commercial
property.
CONSTANT
(OR CONDITIONAL) PREPAYMENT RATE (CPR)
Constant (or
conditional) prepayment rate (CPR) is an industry-standard measure of the speed
at which mortgage loans prepay. It approximates the annual percentage rate at
which a pool of loans is paying down due to principal prepayments.
CREDIT-ENHANCEMENT
SECURITIES (CES)
Credit-enhancement
securities (CES) absorb the initial credit losses generated by a pool of
securitized assets. As a result, the more senior securities issued from that
securitization are credit-enhanced because they carry less credit risk. Our
definition of CES includes all the below investment-grade rated bonds issued
from a securitization. These securities are also referred to as subordinated
securities or B-pieces. For a typical securitization of prime residential loans,
there are three CES: the first-loss, second-loss, and third-loss bonds. The
first-loss security takes the initial risk of credit loss. If credit losses
within the securitized asset pool exceed the principal value of the first-loss
security, the second-loss security is at risk. If cumulative losses exceed the
principal value of the first- and second-loss securities, then the third-loss
security is at risk. Generally, for these securitizations, the third-loss
security has a credit rating of BB, the second-loss security has a credit rating
of B, and the first-loss security is unrated. Other types of securitizations,
such as commercial, CDO, subprime residential, and some Alt-A residential
transactions, may be structured differently. Nevertheless, the non-investment
grade rated securities issued from these securitizations function as
credit-enhancement securities in these transactions.
|
THE REDWOOD
REVIEW 4TH QUARTER 2008
|
53
|
|
|
|
|
|
GLOSSARY
|
CREDIT
SUPPORT
The face amount of
securities subordinate (or junior) to the applicable security, that protects the
security from credit losses, expressed as a percentage of the pool
balance.
DEBT
Debt is an
obligation of Redwood. See Long-term debt and Short-term debt.
ECONOMIC
VALUE (MANAGEMENT’S ESTIMATE OF ECONOMIC VALUE)
Economic value
closely relates to liquidation value and is calculated using the bid-side marks
for all of our financial assets, and offered-side marks for all of our financial
liabilities. We calculate management’s estimate of economic value per share as a
supplemental measure to book value per share calculated under GAAP. Our economic
value estimates are reconciled to GAAP book values in Table 6 of the Financial
Tables.
THE
FUND
The Fund refers to
the Redwood Opportunity Fund, L.P., which is managed by Redwood Asset
Management, and invested in sub-prime and CDO mortgage securities.
GAAP
Generally Accepted
Accounting Principles in the United States.
INTEREST-ONLY
SECURITIES (IOs)
Interest-only
securities (IOs) are specialized securities created by securitization entities
where the projected cash flows generated by the underlying assets exceed the
cash flows projected to be paid to the ABS issued that have principal balances.
They receive interest payments calculated by a formula wherein cash flows on IOs
vary as a function of interest payments generated by the underlying assets
within a securitization or as a function of the spread between the yield on the
loans owned by a securitization entity and the cost of funds of the securities
issued by that entity. Typically, IOs do not have a principal balance and they
will not receive principal payments. Interest payments to IOs usually equal an
interest rate formula multiplied by a "notional" principal balance. The notional
principal balances for IOs are typically reduced over time as the actual
principal balances of the underlying pools of assets pay down, thus reducing the
cash flows to the IOs over time. Cash flows on IOs are typically reduced more
quickly when asset prepayments accelerate.
INVESTMENT
GRADE SECURITIES (IGS)
Investment grade
securities (IGS) are securities that are rated AAA, AA, A, or BBB.
|
54
|
THE REDWOOD
REVIEW 4TH QUARTER 2008
|
|
|
|
|
|
|
|
GLOSSARY
|
LEVERAGE
RATIOS
When determining
Redwood’s financial leverage, traditional leverage ratios may be misleading in
some respects if consolidated ABS issued from securitization entities are
included as part of Redwood’s obligations when calculating this or similar
ratios. Because of the requirement to consolidate the independent securitization
entities for GAAP accounting purposes, it appears that Redwood is highly
leveraged, with total consolidated liabilities significantly greater than
equity. The obligations of these securitization entities are not obligations of
Redwood. We may use collateralized debt to finance the accumulation of assets
prior to sale to a securitization entity and to finance investments in
high-quality loans and IGS.
LONG-TERM
DEBT
Long-term debt is
debt that is an obligation of Redwood that is not payable within a year and
includes junior subordinated notes and trust preferred securities. We generally
treat long-term debt as part of our capital base when it is not payable in the
near future. We may issue other forms of long-term debt in the
future.
MARK-TO-MARKET
ACCOUNTING
Mark-to-market
accounting uses estimated fair values of assets, liabilities, and hedges. Many
of our assets are carried on our balance sheet at their fair value rather than
historical amortized cost. Through December 31, 2007 changes in the fair value
of some of our assets and hedges were reported through our income statement.
Beginning January 1, 2008 we began to use mark-to-market accounting for income
statement purposes for a wider variety of assets and liabilities. This likely
makes quarter-to-quarter GAAP income trends more volatile. Taxable income is
generally not affected by market valuation adjustments.
MARKET
VALUE ADJUSTMENTS (MVA)
Market value
adjustments (MVA) are those changes in market values reported through our GAAP
income statement. They reflect all changes in market values on assets and
liabilities accounted for at fair value and impairments on securities accounted
for as AFS.
NEGATIVE
AMORTIZATION ADJUSTABLE-RATE MORTGAGES (NEG AM ARMs, OPTION
ARMs, OR MTA ARMs)
Negative
amortization ARMs (neg am ARMs, option ARMs, pay option ARMs, or monthly
treasury average (MTA) ARMs) are adjustable-rate mortgages that allow the
borrower to choose between different payment options. These options allow the
borrower to make minimum payments, or other payments that are less than the
interest accrued on the mortgage during that period. As a result of this
feature, the borrower’s loan balance may increase, causing negative amortization
of the loan balance.
NON-GAAP
MEASURES
Not all companies
and analysts calculate non-GAAP measures in the same fashion. As a result,
certain measures as calculated by Redwood may not be comparable to similarly
titled measures reported by other companies. Redwood uses non-GAAP measures such
as management’s estimate of economic value to provide greater transparency for
investors. Our non-GAAP measures are reconciled to GAAP in the Financial Tables
in the Review.
|
THE REDWOOD
REVIEW 4TH QUARTER 2008
|
55
|
|
|
|
|
|
GLOSSARY
|
NON-PRIME
SECURITIES
Non-prime
securities are Alt-A, option ARM, and subprime securities. See definitions
of Alt-A, option ARM, and subprime securities.
PRIME
RESIDENTIAL REAL ESTATE LOANS
Prime loans are
residential loans with high quality credit characteristics, such as borrowers
with high FICO credit scores, lower loan-to-value ratios, lower debt-to-income
ratios, greater levels of other assets, and more documentation.
PRIME
SECURITIES
Prime securities
are residential mortgage-backed securities backed by high credit-quality loans,
generally with balances greater than conforming loan limits. Prime securities
are typically backed by loans that have relatively high weighted average FICO
scores (700 or higher), low weighted average LTVs (75% or less), limited
concentrations of investor properties, and a low percentages of loans with low
FICO scores or high loan-to-value ratios.
PROFITABILITY
RATIOS
Many financial
institution analysts use asset-based profitability ratios such as interest rate
spread and interest rate margin when analyzing financial institutions. These are
asset-based measures. Because we consolidate the assets and liabilities of
securitization entities for GAAP purposes, our total GAAP assets and liabilities
may vary over time, and may not be comparable in economic reality to assets
typically used in profitability calculations for other financial institutions.
As a result, we believe equity-based profitability ratios may be more
appropriate than asset-based measures for analyzing Redwood’s operations. We
believe, for example, that net interest income as a percentage of equity is a
useful measure of profitability. For operating expenses, we believe useful
measures are operating efficiency ratio (operating expenses as a percentage of
net interest income) and operating expenses as a percentage of
equity.
REAL
ESTATE INVESTMENT TRUST (REIT)
A real estate
investment trust (REIT) is an entity that makes a tax election to be taxed as a
REIT, invests in real estate assets, and meets other REIT qualifications,
including the distribution as dividends of at least 90% of REIT taxable income.
A REIT’s profits are not taxed at the corporate level to the extent that these
profits are distributed as dividends to stockholders, providing an operating
cost savings. On the other hand, the requirement to pay out as dividends most of
the REIT profits means it can be harder for a REIT to grow using only
internally-generated funds (as opposed to issuing new stock).
REAL
ESTATE OWNED (REO)
Real estate owned
(REO) refers to real property owned by the lender or loan owner that has been
acquired through foreclosure.
|
56
|
THE REDWOOD
REVIEW 4TH QUARTER 2008
|
|
|
|
|
|
|
|
GLOSSARY
|
REIT
RETAINED TAXABLE INCOME
REIT retained
taxable income is not a measure calculated in accordance with GAAP. REIT
retained taxable income is the taxable income earned at the REIT after dividend
distributions to our shareholders, less corporate income taxes paid at the REIT
level. A reconciliation of REIT retained taxable income to GAAP income appears
in Table 3 in the Financial Tables.
REIT
SUBSIDIARY
A REIT subsidiary
is a subsidiary of a REIT that is taxed as a REIT.
REIT
TAXABLE INCOME
REIT taxable income
is not a measure calculated in accordance with GAAP. REIT taxable income is
pre-tax income calculated for tax purposes at Redwood including only its REIT
subsidiaries (i.e., excluding its taxable subsidiaries). REIT taxable income is
an important measure as it is the basis of our dividend distribution
requirements. We must distribute at least 90% of REIT taxable income as
dividends to shareholders over time. As a REIT, we are not subject to corporate
income taxes on the REIT taxable income we distribute. We pay income tax on the
REIT taxable income we retain (up to 10% of total REIT taxable income). A
reconciliation of REIT taxable income to GAAP income appears in Table 3 in the
Financial Tables.
RESIDENTIAL
MORTGAGE-BACKED SECURITIES (RMBS)
A type of
mortgage-backed security that is secured by a pool of residential
properties.
RETAINED
TAXABLE INCOME
Retained taxable
income is not a measure calculated in accordance with GAAP. Retained taxable
income is the taxable income earned at the REIT after dividend distributions to
shareholders and taxes. It also includes all of the taxable income earned at our
taxable subsidiaries, less corporate income taxes paid, as we generally retain
the after-tax income at our taxable subsidiaries. A reconciliation
of retained taxable income to GAAP income appears in Table 3 in the
Financial Tables.
RETURN
ON EQUITY (ROE) AND ADJUSTED RETURN ON EQUITY
ROE is the amount
of profit we generate each year per dollar of equity capital and equals GAAP
income divided by GAAP equity. Adjusted ROE is GAAP income divided by core
equity. Core equity excludes balance sheet mark-to-market adjustments. Thus,
only those market value changes that are included in our income statement will
affect adjusted ROE.
|
THE REDWOOD
REVIEW 4TH QUARTER 2008
|
57
|
|
|
|
|
|
GLOSSARY
|
SEQUOIA
Sequoia is the
brand name for securitizations of residential real estate loans Redwood
sponsors. Most of the loans the Sequoia entities acquire are prime-quality
loans. Most of the investment grade ABS issued by Sequoia are sold to
third-party investors. Redwood usually acquires most of the CES and IOs issued
by these securitization entities. Acacia has also acquired some CES, IOs, and
IGS from Sequoia. Redwood’s credit risk is limited to its investments in Sequoia
and each Sequoia entity is independent of the others. For GAAP accounting
purposes, we generally consolidate the assets and liabilities of the Sequoia
entities and their associated income and expense on Redwood’s consolidating
balance sheet and income statements.
SENIOR
SECURITIES
Senior securities
have the least credit risk in a securitization transaction because they are the
last securities to absorb credit losses. In addition, the senior securities have
the highest claim on the principal and interest payments (after the fees to
servicers and trustees are paid.) To further reduce credit risk, most
if not all principal collected from the underlying asset pool is used to paydown
the senior securities until certain performance tests are satisfied. After
certain performance tests are satisfied, principal payments are shared between
the senior securities and the subordinated securities, generally on a pro rata
basis. At issuance, senior securities are generally AAA-rated.
SHORT-TERM
DEBT
Short-term debt is
debt that is an obligation of Redwood and payable within a year. We obtain this
debt from a variety of Wall Street firms, banks, and other institutions. As
another form of short-term debt, we have issued collateralized commercial paper
in the past and may issue other forms of short-term debt in the
future.
SUBPRIME
SECURITIES
Subprime securities
are residential mortgage-backed securities backed by loans to borrowers who
typically have lower credit scores and/or other credit deficiencies that prevent
them from qualifying for prime or Alt-A mortgages and may have experienced
credit problems in the past, such as late payments or bankruptcies. To
compensate for the greater risks and higher costs to service the loans, subprime
borrowers pay higher interest rates, points, and origination fees.
Typical
characteristics of subprime loan pools include more than 60% of loans with FICO
scores below 680, weighted average LTVs over 85%, more than 70% of loans with
LTVs over 75%, and loans with LTVs over 80% with no mortgage
insurance.
|
58
|
THE REDWOOD
REVIEW 4TH QUARTER 2008
|
|
|
|
|
|
|
|
GLOSSARY
|
SUBORDINATE
SECURITIES (JUNIOR SECURITIES)
Subordinate
securities absorb the initial credit losses from a securitization structure,
thus protecting the senior securities. Subordinate securities have a lower
priority to receive principal and interest payments than the senior securities.
Subordinate securities receive little, if any, principal payments until certain
performance tests are satisfied. After certain performance tests are satisfied,
principal payments are shared between the senior securities and the subordinated
securities, generally on a pro rata basis. Subordinate securities generally
receive interest payments even if they do not receive principal payments. At
issuance, subordinate securities are generally rated AA or below.
TAXABLE
INCOME
Taxable income is
not a measure calculated in accordance with GAAP. Taxable income is pre-tax
income for Redwood and all its subsidiaries as calculated for tax purposes.
Taxable income calculations differ significantly from GAAP income calculations.
A reconciliation of taxable income to GAAP income appears in Table 3 in the
Financial Tables.
TAXABLE
SUBSIDIARY
A taxable
subsidiary is a subsidiary of a REIT that is not taxed as a REIT and thus pays
taxes on its income. A taxable subsidiary is not limited to investing in real
estate and it can choose to retain all of its after-tax
profits.
|
THE REDWOOD
REVIEW 4TH QUARTER 2008
|
59
|
This
Page Intentionally Left Blank
|
60
|
|
|
|
Table 1: GAAP Earnings ($ in
thousands, except per share data)
|
62
|
|
Full
|
Full
|
||||||||||
|
2008
|
2008
|
2008
|
2008
|
2007
|
2007
|
2007
|
2007
|
2006
|
Year
|
Year
|
|
|
Q4
|
Q3
|
Q2
|
Q1
|
Q4
|
Q3
|
Q2
|
Q1
|
Q4
|
2008
|
2007
|
|
|
Interest
income
|
$124,452
|
$126,227
|
$140,445
|
$171,976
|
$193,728
|
$207,023
|
$208,708
|
$210,372
|
$213,504
|
$563,101
|
$819,831
|
|
(Premium) discount amortization on
securities, net
|
(1,189)
|
7,850
|
6,258
|
10,864
|
18,869
|
20,514
|
23,849
|
20,268
|
18,665
|
23,783
|
83,500
|
|
Other investment interest
income
|
572
|
487
|
514
|
732
|
984
|
1,143
|
464
|
-
|
-
|
2,305
|
2,591
|
|
Premium amortization expense on
loans
|
(547)
|
(3,372)
|
(10,215)
|
(7,509)
|
(6,656)
|
(8,349)
|
(10,863)
|
(11,705)
|
(13,272)
|
(21,643)
|
(37,573)
|
|
Total interest
income
|
123,288
|
131,192
|
137,002
|
176,063
|
206,925
|
220,331
|
222,158
|
218,935
|
218,897
|
567,545
|
868,349
|
|
Management fee
income
|
1,152
|
1,307
|
1,319
|
1,612
|
1,866
|
1,893
|
1,481
|
1,168
|
993
|
5,390
|
6,408
|
|
Interest on short-term
debt
|
(3)
|
(65)
|
(68)
|
(182)
|
(377)
|
(5,858)
|
(22,700)
|
(31,094)
|
(16,520)
|
(318)
|
(60,029)
|
|
ABS interest
expense
|
(95,212)
|
(89,205)
|
(95,046)
|
(124,888)
|
(149,665)
|
(157,554)
|
(141,993)
|
(132,561)
|
(153,036)
|
(404,351)
|
(581,773)
|
|
ABS issuance expense
amortization
|
(1,470)
|
(930)
|
(1,921)
|
(2,093)
|
(4,644)
|
(4,616)
|
(5,681)
|
(7,068)
|
(7,897)
|
(6,414)
|
(22,009)
|
|
ABS interest rate agreement
(expense) income
|
(1,934)
|
(1,259)
|
(1,246)
|
(1,245)
|
1,265
|
1,959
|
3,358
|
1,646
|
2,497
|
(5,684)
|
8,228
|
|
ABS issuance premium amortization
income
|
476
|
557
|
1,955
|
2,183
|
1,930
|
2,096
|
2,294
|
1,869
|
1,529
|
5,171
|
8,189
|
|
Total ABS expense consolidated
from trusts
|
(98,140)
|
(90,837)
|
(96,258)
|
(126,043)
|
(151,114)
|
(158,115)
|
(142,022)
|
(136,114)
|
(156,907)
|
(411,278)
|
(587,365)
|
|
Interest expense on long-term
debt
|
(2,344)
|
(2,164)
|
(2,233)
|
(2,534)
|
(3,055)
|
(3,150)
|
(2,516)
|
(2,056)
|
(423)
|
(9,275)
|
(10,777)
|
|
Net interest
income
|
23,952
|
39,433
|
39,762
|
48,916
|
54,245
|
55,101
|
56,401
|
50,840
|
46,040
|
152,064
|
216,587
|
|
Provision for credit
reserve
|
(18,659)
|
(18,333)
|
(10,061)
|
(8,058)
|
(4,972)
|
(1,507)
|
(2,500)
|
(3,829)
|
(1,506)
|
(55,111)
|
(12,808)
|
|
Market valuation adjustments,
net
|
(111,331)
|
(127,157)
|
(60,619)
|
(193,780)
|
(1,118,989)
|
(102,766)
|
(29,430)
|
(10,264)
|
(1,404)
|
(492,887)
|
(1,261,449)
|
|
Net interest (loss) income after
provision and market valuation adjustments
|
(106,038)
|
(106,057)
|
(30,918)
|
(152,922)
|
(1,069,716)
|
(49,172)
|
24,471
|
36,747
|
43,130
|
(395,935)
|
(1,057,670)
|
|
Fixed compensation
expense
|
(3,575)
|
(4,331)
|
(4,648)
|
(5,674)
|
(4,316)
|
(4,560)
|
(4,286)
|
(4,616)
|
(3,688)
|
(18,228)
|
(17,778)
|
|
Variable compensation
expense
|
418
|
(616)
|
(330)
|
(1,857)
|
(434)
|
1,096
|
(198)
|
(2,251)
|
(1,666)
|
(2,385)
|
(1,787)
|
|
Equity compensation
expense
|
(2,377)
|
(3,080)
|
(3,502)
|
(3,306)
|
(2,767)
|
(2,593)
|
(3,540)
|
(3,349)
|
(3,233)
|
(12,265)
|
(12,249)
|
|
Severance
expense
|
(1,814)
|
-
|
-
|
-
|
(1,340)
|
-
|
-
|
(2,380)
|
-
|
(1,814)
|
(3,720)
|
|
Other operating
expense
|
(6,311)
|
(9,191)
|
(6,034)
|
(5,806)
|
(7,337)
|
(5,455)
|
(4,670)
|
(4,479)
|
(4,732)
|
(27,342)
|
(21,941)
|
|
Due diligence
expenses
|
(13)
|
(29)
|
(8)
|
(10)
|
(75)
|
(220)
|
(78)
|
(707)
|
(532)
|
(60)
|
(1,080)
|
|
Total operating
expenses
|
(13,672)
|
(17,247)
|
(14,522)
|
(16,653)
|
(16,269)
|
(11,732)
|
(12,772)
|
(17,782)
|
(13,851)
|
(62,094)
|
(58,555)
|
|
Realized gains (losses) on sales,
net
|
5,671
|
(15)
|
2,909
|
(3)
|
7,199
|
(1,460)
|
1,428
|
303
|
5,308
|
8,562
|
7,470
|
|
Realized (losses) gains on calls,
net
|
-
|
(39)
|
(72)
|
45
|
(126)
|
3,284
|
1,310
|
843
|
1,511
|
(66)
|
5,311
|
|
Realized gains (losses),
net
|
5,671
|
(54)
|
2,837
|
42
|
7,073
|
1,824
|
2,738
|
1,146
|
6,819
|
8,496
|
12,781
|
|
Minority interest
allocation
|
2,366
|
2,194
|
(2,369)
|
(254)
|
-
|
-
|
-
|
-
|
-
|
1,937
|
-
|
|
(Provision) credit for
income taxes
|
(3,914)
|
9,860
|
(937)
|
(1,800)
|
1,467
|
(1,837)
|
(3,021)
|
(1,801)
|
(407)
|
3,209
|
(5,192)
|
|
Net (loss)
income
|
($115,586)
|
($111,304)
|
($45,909)
|
($171,587)
|
($1,077,445)
|
($60,917)
|
$11,416
|
$18,310
|
$35,691
|
($444,386)
|
($1,108,636)
|
|
Diluted average
shares
|
33,366
|
33,334
|
32,871
|
32,511
|
29,531
|
27,892
|
28,165
|
27,684
|
27,122
|
33,023
|
27,928
|
|
Net (loss) income per
share
|
($3.46)
|
($3.34)
|
($1.40)
|
($5.28)
|
($36.49)
|
($2.18)
|
$0.41
|
$0.66
|
$1.32
|
($13.46)
|
($39.70)
|
|
THE REDWOOD
REVIEW
4TH QUARTER
2008
|
Table 1: GAAP
Earnings
|
|
|
|
Table 2: Taxable Income
and GAAP (Loss) Income Differences
($ in thousands, except per
share data)
|
|
|
Estimated
|
Actual
|
Actual
|
Estimated
|
Actual
|
|||||||
|
Full
|
Full
|
||||||||||
|
2008
|
2008
|
2008
|
2008
|
2007
|
2007
|
2007
|
2007
|
2006
|
Year
|
Year
|
|
|
Q4
|
Q3
|
Q2
|
Q1
|
Q4
|
Q3
|
Q2
|
Q1
|
Q4
|
2008
|
2007
|
|
|
GAAP net (loss)
income
|
$(115,586)
|
$(111,304)
|
$(45,909)
|
$(171,587)
|
$(1,077,445)
|
$(60,917)
|
$11,416
|
$18,309
|
$35,691
|
$(444,386)
|
$(1,108,637)
|
|
Difference in taxable income
calculations
|
|||||||||||
|
Amortization and credit
losses
|
6,877
|
4,313
|
(7,377)
|
6,094
|
(15,080)
|
10,426
|
10,298
|
10,417
|
13,740
|
9,907
|
16,061
|
|
Operating
expenses
|
(1,274)
|
2,713
|
706
|
1,491
|
10,048
|
(2,080)
|
(2,921)
|
(1,713)
|
(12,079)
|
3,636
|
3,334
|
|
Gross realized (gains) losses, net
on calls and sales
|
(13,571)
|
(10,755)
|
(5,834)
|
(5,266)
|
(4,819)
|
(3,073)
|
(3,589)
|
954
|
(5,499)
|
(35,426)
|
(10,527)
|
|
Market valuation adjustments,
net
|
111,179
|
127,157
|
60,619
|
193,932
|
1,118,989
|
102,766
|
29,430
|
10,264
|
6,571
|
492,887
|
1,261,449
|
|
Provision (benefit) for income
taxes
|
3,897
|
(9,825)
|
1,447
|
1,158
|
(2,214)
|
1,523
|
1,662
|
1,800
|
405
|
(3,323)
|
2,771
|
|
Total differences in GAAP and
taxable income
|
107,108
|
113,603
|
49,561
|
197,409
|
1,106,924
|
109,562
|
34,880
|
21,722
|
3,138
|
467,681
|
1,273,088
|
|
Taxable (loss)
income
|
$(8,478)
|
$2,299
|
$3,652
|
$25,822
|
$29,479
|
$48,645
|
$46,296
|
$40,031
|
$38,829
|
$23,295
|
$164,451
|
|
REIT taxable (loss)
income
|
$(8,793)
|
$2,400
|
$4,414
|
$24,734
|
$32,125
|
$48,591
|
$45,233
|
$35,112
|
$41,555
|
$22,755
|
$161,061
|
|
Taxable income
(loss) in taxable subsidiaries
|
315
|
(101)
|
(762)
|
1,088
|
(2,646)
|
54
|
1,063
|
4,919
|
(2,727)
|
540
|
3,390
|
|
Taxable (loss)
income
|
$(8,478)
|
$2,299
|
$3,652
|
$25,822
|
$29,479
|
$48,645
|
$46,296
|
$40,031
|
$38,828
|
$23,295
|
$164,451
|
|
After-tax
|
|||||||||||
|
Retained REIT taxable
income
|
$-
|
$ -
|
$-
|
$-
|
$-
|
$-
|
$-
|
$-
|
$2,010
|
$-
|
$-
|
|
Retained taxable income (loss) in
taxable subsidiaries
|
210
|
(43)
|
(444)
|
633
|
(1,325)
|
34
|
663
|
3,068
|
(1,175)
|
356
|
2,440
|
|
Retained taxable income
(loss)
|
$210
|
$(43)
|
$(444)
|
$633
|
$(1,325)
|
$34
|
$663
|
$3,068
|
$835
|
$356
|
$2,440
|
|
Shares used for taxable EPS
calculation
|
33,471
|
33,238
|
33,184
|
32,710
|
32,385
|
27,986
|
27,816
|
27,129
|
26,733
|
32,577
|
28,354
|
|
REIT taxable (loss) income per
share (1)
|
$(0.26)
|
$0.07
|
$0.13
|
$0.76
|
$0.99
|
$1.74
|
$1.63
|
$1.29
|
$1.55
|
$0.70
|
$5.65
|
|
Taxable income (loss)
in taxable subsidiaries per share
|
$0.01
|
$(0.00)
|
$(0.02)
|
$0.03
|
$(0.08)
|
$0.00
|
$0.03
|
$0.19
|
$(0.10)
|
$0.02
|
$0.14
|
|
Taxable (loss) income per share
(1)
|
$(0.25)
|
$0.07
|
$0.11
|
$0.79
|
$0.91
|
$1.74
|
$1.66
|
$1.48
|
$1.45
|
$0.72
|
$5.79
|
|
$-
|
$-
|
||||||||||
|
Retained taxable income (loss)
(after-tax)
|
$0.01
|
$(0.01)
|
$(0.01)
|
$0.02
|
$(0.04)
|
$0.00
|
$0.02
|
$0.11
|
$0.03
|
$0.01
|
$0.10
|
|
(1) REIT
taxable (loss) income per share and taxable (loss) income per share per
quarter are based on the number of shares outstanding at the end of each
quarter. REIT taxable (loss) income and taxable (loss) income per
share for the year are the sum of the four corresponding quarterly per
share amounts.
|
|||||||||||
|
THE REDWOOD
REVIEW
4TH QUARTER
2008
|
Table 2: Taxable
Income and GAAP (Loss) Income Differences
|
63
|
|
|
Table 3: Retention and
Distribution of Taxable Income
($ in thousands, except per
share data)
|
64
|
|
Estimated
|
Actual
|
Actual
|
Estimated
|
Actual
|
|||||||
|
Full
|
Full
|
||||||||||
|
2008
|
2008
|
2008
|
2008
|
2007
|
2007
|
2007
|
2007
|
2006
|
Year
|
Year
|
|
|
Q4
|
Q3
|
Q2
|
Q1
|
Q4
|
Q3
|
Q2
|
Q1
|
Q4
|
2008
|
2007
|
|
|
Dividends
declared
|
$25,103
|
$24,928
|
$24,887
|
$24,532
|
$80,496
|
$20,989
|
$20,862
|
$20,347
|
$97,665
|
$99,450
|
$142,694
|
|
Dividend deductions on stock
issued through DSPP
|
45
|
165
|
288
|
192
|
2,605
|
81
|
933
|
660
|
812
|
690
|
4,279
|
|
Total dividend deductions
(1)
|
$25,148
|
$25,093
|
$25,175
|
$24,724
|
$83,101
|
$21,070
|
$21,795
|
$21,007
|
$98,477
|
$100,140
|
$146,973
|
|
Regular dividend per
share
|
$0.75
|
$0.75
|
$0.75
|
$0.75
|
$0.75
|
$0.75
|
$0.75
|
$0.75
|
$0.70
|
$3.00
|
$3.00
|
|
Special dividend per
share
|
-
|
-
|
-
|
-
|
2.00
|
-
|
-
|
-
|
3.00
|
-
|
2.00
|
|
Total dividends per share
(2)
|
$0.75
|
$0.75
|
$0.75
|
$0.75
|
$2.75
|
$0.75
|
$0.75
|
$0.75
|
$3.70
|
$3.00
|
$5.00
|
|
Undistributed REIT taxable income
at beginning of period (pre-tax):
|
$21,128
|
$43,821
|
$64,582
|
$64,572
|
$115,548
|
$88,027
|
$64,589
|
$50,484
|
$111,411
|
$64,572
|
$50,484
|
|
REIT taxable income (loss)
(pre-tax)
|
(8,793)
|
2,400
|
4,414
|
24,734
|
32,125
|
48,591
|
45,233
|
35,112
|
41,555
|
22,755
|
161,061
|
|
Retained
(pre-tax)
|
-
|
-
|
-
|
-
|
-
|
-
|
-
|
-
|
(4,005)
|
-
|
-
|
|
Dividend of 2006
income
|
-
|
-
|
-
|
-
|
-
|
(7,682)
|
(21,795)
|
(21,007)
|
(98,477)
|
-
|
(50,484)
|
|
Dividend of 2007
income
|
(14,673)
|
(25,175)
|
(24,724)
|
(83,101)
|
(13,388)
|
-
|
-
|
-
|
(64,572)
|
(96,489)
|
|
|
Dividend of 2008
income
|
(12,335)
|
(10,420)
|
-
|
-
|
-
|
-
|
-
|
-
|
-
|
(22,755)
|
-
|
|
Undistributed REIT taxable income
at period end (pre-tax):
|
$-
|
$21,128
|
$43,821
|
$64,582
|
$64,572
|
$115,548
|
$88,027
|
$64,589
|
$50,484
|
$-
|
$64,572
|
|
Undistributed REIT taxable income
(pre-tax) at period end
|
|||||||||||
|
From 2006
|
$-
|
$-
|
$-
|
$-
|
$-
|
$-
|
$7,682
|
$29,477
|
$50,484
|
$-
|
$-
|
|
From 2007
|
-
|
-
|
14,673
|
39,848
|
64,572
|
115,548
|
80,345
|
35,112
|
-
|
-
|
64,572
|
|
From 2008
|
-
|
20,872
|
29,148
|
24,734
|
-
|
-
|
-
|
-
|
-
|
-
|
-
|
|
Total
|
$-
|
$20,872
|
$43,821
|
$64,582
|
$64,572
|
$115,548
|
$88,027
|
$64,589
|
$ 50,484
|
$-
|
$64,572
|
|
Shares outstanding at period
end
|
33,471
|
33,238
|
33,184
|
32,710
|
32,385
|
27,986
|
27,816
|
27,129
|
26,733
|
33,471
|
32,385
|
|
Undistributed REIT taxable income
(pre-tax)
|
|||||||||||
|
per share
outstanding at period end
|
$-
|
$0.63
|
$1.32
|
$1.97
|
$1.99
|
$4.13
|
$3.16
|
$2.38
|
$1.89
|
$-
|
$1.99
|
|
(1) Dividends
in 2008 exceeded the year's taxable income plus undistributed income
carried over from prior years. Thus, the 2008 dividends
included $8.4 million return of capital.
|
|||||||||||
|
(2) Total
dividends in 2008 were $3.00 per share, of which $2.75 per share was
characterized as ordinary income and $0.25 per share was characterized as
a return of capital. The portion of Redwood's dividends
characterized as a return of capital is not taxable and reduces a
shareholder's basis for shares held at each quarterly distribution
date. Total dividends in 2007 were $5.00 per share, which were
characterized entirely as ordinary
income.
|
|||||||||||
|
THE REDWOOD
REVIEW
4TH QUARTER
2008
|
Table 3:
Retention and
Distribution of Taxable Income
|
|
|
|
Table 4: Components of
Book Value ($ in millions, except per
share data)
|
|
|
2008
|
2008
|
2008
|
2008
|
January 1,
|
2007
|
2007
|
2007
|
2007
|
||
|
Q4
|
Q3
|
Q2
|
Q1
|
2008
|
Q4
|
Q3
|
Q2
|
Q1
|
||
|
Assets at
Redwood
|
||||||||||
|
Residential
CES
|
||||||||||
|
Prime
|
$22
|
$41
|
$79
|
$78
|
$128
|
$128
|
$132
|
$189
|
$181
|
|
|
Non-prime
|
8
|
6
|
9
|
10
|
23
|
23
|
45
|
70
|
75
|
|
|
Total Residential CES at
Redwood
|
30
|
47
|
88
|
88
|
151
|
151
|
177
|
259
|
256
|
|
|
Residential
IGS
|
||||||||||
|
Prime
|
73
|
66
|
102
|
20
|
1
|
1
|
2
|
119
|
39
|
|
|
Non-prime
|
42
|
47
|
58
|
6
|
11
|
11
|
59
|
85
|
67
|
|
|
Total Residential IGS at
Redwood
|
115
|
113
|
160
|
26
|
12
|
12
|
61
|
204
|
106
|
|
|
Commercial
CES
|
42
|
64
|
91
|
100
|
148
|
148
|
159
|
186
|
198
|
|
|
Real estate
loans
|
3
|
3
|
4
|
5
|
4
|
4
|
6
|
878
|
1,256
|
|
|
CDO
|
4
|
4
|
14
|
15
|
21
|
21
|
9
|
24
|
24
|
|
|
Other real estate
investments
|
-
|
-
|
-
|
3
|
12
|
12
|
24
|
32
|
47
|
|
|
Total securities and loans at
Redwood
|
194
|
231
|
357
|
237
|
348
|
348
|
436
|
1,583
|
1,887
|
|
|
Cash and cash
equivalents
|
126
|
177
|
148
|
257
|
290
|
290
|
310
|
83
|
92
|
|
|
Other assets
(1)
|
37
|
25
|
27
|
35
|
67
|
67
|
118
|
109
|
120
|
|
|
Other liabilities
(2)
|
(46)
|
(29)
|
(37)
|
(34)
|
(41)
|
(41)
|
(89)
|
(88)
|
(65)
|
|
|
Short-term
debt
|
-
|
(7)
|
(9)
|
(2)
|
(8)
|
(8)
|
(39)
|
(849)
|
(1,880)
|
|
|
Commercial
paper
|
-
|
-
|
-
|
-
|
-
|
-
|
(5)
|
(5)
|
(5)
|
|
|
Total short-term
debt
|
-
|
(7)
|
(9)
|
(2)
|
(8)
|
(8)
|
(44)
|
(854)
|
(1,885)
|
|
|
Investments in
Sequoia
|
||||||||||
|
Total
assets
|
4,688
|
6,137
|
6,414
|
6,800
|
7,205
|
7,205
|
7,624
|
7,473
|
7,424
|
|
|
Total
liabilities
|
(4,591)
|
(6,026)
|
(6,274)
|
(6,654)
|
(7,059)
|
(7,059)
|
(7,376)
|
(7,238)
|
(7,203)
|
|
|
Net investments in
Sequoia
|
97
|
111
|
140
|
146
|
146
|
146
|
248
|
235
|
221
|
|
|
Investments in
Acacia
|
||||||||||
|
Total
assets
|
558
|
813
|
1,091
|
1,269
|
2,107
|
2,107
|
2,795
|
3,433
|
3,424
|
|
|
Total
liabilities
|
(542)
|
(794)
|
(1,050)
|
(1,201)
|
(2,023)
|
(3,492)
|
(3,475)
|
(3,475)
|
(2,770)
|
|
|
Net investments in
Acacia
|
16
|
19
|
41
|
68
|
84
|
(1,385)
|
(680)
|
(42)
|
654
|
|
|
Investments in the
Fund
|
||||||||||
|
Total
assets
|
53
|
73
|
94
|
36
|
15
|
15
|
-
|
-
|
-
|
|
|
Total liabilities and minority
interest
|
(25)
|
(38)
|
(47)
|
(8)
|
-
|
-
|
-
|
-
|
-
|
|
|
Net investments in the
Fund
|
28
|
35
|
47
|
28
|
15
|
15
|
-
|
-
|
-
|
|
|
Long-term
debt
|
(150)
|
(150)
|
(150)
|
(150)
|
(150)
|
(150)
|
(150)
|
(150)
|
(100)
|
|
|
Total GAAP
equity
|
$302
|
$412
|
$564
|
$585
|
$751
|
$(718)
|
$149
|
$876
|
$924
|
|
|
GAAP Book value per
share
|
$9.02
|
$12.40
|
$17.00
|
$17.89
|
$23.18
|
$(22.18)
|
$5.32
|
$31.50
|
$34.06
|
|
(1)
Other assets includes deferred ABS issuance costs, derivative assets,
accrued interest recievable, deferred tax assets, restricted cash, and
other assets.
|
||||||||||
|
(2)
Other liabilities include derivative liabilities, accrued interest
payable, dividends payable, accrued expenses, and other
liabilities.
|
||||||||||
|
THE REDWOOD
REVIEW
4TH QUARTER
2008
|
Table 4: Components
of Book Value
|
65
|
|
|
Table 5: Investment
Activity in Sequoia, Acacia and the Fund ($ in
millions)
|
66
|
|
2008
|
2008
|
2008
|
2008
|
|
|
Q4
|
Q3
|
Q2
|
Q1
|
|
|
Investments in
Sequoia
|
||||
|
Beginning asset
balance
|
$6,136
|
$6,414
|
$6,800
|
$7,205
|
|
Beginning liability
balance
|
(6,025)
|
(6,274)
|
(6,654)
|
$(7,059)
|
|
Beginning book
value
|
$111
|
$140
|
$146
|
$146
|
|
Principal payments on
assets
|
$(153)
|
$(243)
|
$(365)
|
$(400)
|
|
Asset transfers to
REO
|
(12)
|
(6)
|
(13)
|
(7)
|
|
Loan premium
amortization
|
(2)
|
(3)
|
(10)
|
(8)
|
|
Provision for credit
losses
|
(19)
|
(18)
|
(10)
|
(8)
|
|
Sale of interests and resulting
deconsolidation
|
(1,253)
|
-
|
-
|
-
|
|
Change in other
assets
|
(9)
|
(8)
|
12
|
18
|
|
Net change in Sequoia
assets
|
$(1,448)
|
$(278)
|
$(386)
|
$(405)
|
|
Principal payments on
liabilities
|
$155
|
$243
|
$364
|
$394
|
|
Discount
amortization
|
2
|
2
|
6
|
8
|
|
Sale of interests and resulting
deconsolidation
|
1,264
|
-
|
-
|
-
|
|
Change in other
liabilities
|
13
|
4
|
10
|
3
|
|
Net change in Sequoia
liabilities
|
$1,434
|
$249
|
$380
|
$405
|
|
Ending asset
balance
|
4,688
|
6,136
|
6,414
|
6,800
|
|
Ending liability
balance
|
(4,591)
|
(6,025)
|
(6,274)
|
(6,654)
|
|
Ending book
value
|
$97
|
$111
|
$140
|
$146
|
|
Investments in
Acacia
|
||||
|
Beginning asset
balance
|
$813
|
$1,091
|
$1,269
|
$2,107
|
|
Beginning liability
balance
|
(794)
|
(1,050)
|
(1,201)
|
(3,492)
|
|
Beginning book
value
|
$19
|
$41
|
$68
|
$(1,385)
|
|
Principal payments on
assets
|
$(29)
|
$(35)
|
$(40)
|
$(55)
|
|
Market valuation
changes
|
(207)
|
(221)
|
(67)
|
(782)
|
|
Change in other
assets
|
(19)
|
(22)
|
(71)
|
(1)
|
|
Net change in Acacia
assets
|
$(255)
|
$(278)
|
$(178)
|
$(838)
|
|
Principal payments on
liabilities
|
44
|
58
|
110
|
37
|
|
Market valuation
changes
|
282
|
204
|
1
|
810
|
|
FAS 159
adjustments
|
-
|
-
|
-
|
1,490
|
|
Change in other
liabilities
|
(74)
|
(6)
|
40
|
(46)
|
|
Net change in Acacia
liabilities
|
$252
|
$256
|
$151
|
$2,291
|
|
Ending asset
balance
|
$558
|
$813
|
$1,091
|
$1,269
|
|
Ending liability
balance
|
(542)
|
(794)
|
(1,050)
|
(1,201)
|
|
Ending book
value
|
$16
|
$19
|
$41
|
$68
|
|
Investments in the
Fund
|
||||
|
Beginning asset
balance
|
$73
|
$94
|
$36
|
$15
|
|
Beginning liability
balance
|
(38)
|
(47)
|
(8)
|
$-
|
|
Beginning book
value
|
$35
|
$47
|
$28
|
$15
|
|
Principal payments on
assets
|
$(4)
|
$(4)
|
$(6)
|
$(1)
|
|
Acquisitions
|
-
|
13
|
40
|
20
|
|
Discount
amortization
|
1
|
2
|
1
|
1
|
|
Sales
|
-
|
-
|
(5)
|
-
|
|
Market valuation
changes
|
(17)
|
(10)
|
-
|
1
|
|
Change in other
assets
|
-
|
(22)
|
28
|
-
|
|
Net change in the Fund
assets
|
$(20)
|
$(21)
|
$58
|
$21
|
|
Change in other liabilities and
minority interest
|
13
|
9
|
(39)
|
(8)
|
|
Ending asset
balance
|
$53
|
$73
|
$94
|
$36
|
|
Ending liability and minority
interest balance
|
(25)
|
(38)
|
(47)
|
(8)
|
|
Ending book
value
|
$28
|
$35
|
$47
|
$28
|
|
THE REDWOOD
REVIEW
4TH QUARTER
2008
|
Table 5:
Investment
Activity in Sequoia, Acacia and the Fund
|
|