
 |
|
|
|
|
TABLE OF
CONTENTS
|
|
Introduction
|
3
|
|
Shareholder
Letter
|
4
|
|
Quarterly
Overview
|
6
|
|
Financial
Insights
|
11
|
|
GAAP Income
|
24
|
|
Taxable
Income
|
28
|
|
Dividends
|
31
|
|
Capital and
Liquidity
|
32
|
|
Mark-to-Market
Adjustments
|
33
|
|
Residential Real Estate
Securities
|
36
|
|
Commercial Real Estate
Securities
|
41
|
|
Investments in
Sequoia
|
43
|
|
Investments in
Acacia
|
45
|
|
Appendix
|
|
|
Accounting
Discussion
|
47
|
|
Glossary
|
52
|
|
Financial
Tables
|
59
|
|
|
THE REDWOOD
REVIEW 1ST QUARTER 2009
|
1
|
|
|
|
|
|
CAUTIONARY
STATEMENT
|
|
2
|
THE REDWOOD
REVIEW 1ST QUARTER 2009
|
|
|
|
|
|
|
|
INTRODUCTION
|
|
Selected
Financial Highlights
|
||||||
|
Quarter:Year
|
GAAP
Income (Loss) per Share
|
Taxable
Income (Loss) per Share
|
Annualized
Return on Equity
|
GAAP
Book Value per Share
|
Economic Book Value per Share
(2)
|
Total
Dividends per Share
|
|
Q107
|
$0.66
|
$1.48
|
8%
|
$34.06
|
$32.22
|
$0.75
|
|
Q207
|
$0.41
|
$1.66
|
5%
|
$31.50
|
$33.11
|
$0.75
|
|
Q307
|
($2.18)
|
$1.74
|
(26%)
|
$5.32
|
$27.55
|
$0.75
|
|
Q407(1)
|
($36.49)
|
$0.92
|
(610%)
|
$23.18
|
$22.29
|
$2.75
|
|
Q108
|
($5.28)
|
$0.79
|
(83%)
|
$17.89
|
$18.04
|
$0.75
|
|
Q208
|
($1.40)
|
$0.11
|
(28%)
|
$17.00
|
$16.72
|
$0.75
|
|
Q308
|
($3.34)
|
$0.07
|
(80%)
|
$12.40
|
$13.18
|
$0.75
|
|
Q408
|
($3.46)
|
($0.25)
|
(103%)
|
$9.02
|
$11.10
|
$0.75
|
|
Q109
|
($0.65)
|
($0.22)
|
(31%)
|
$8.40
|
$10.01
|
$0.25
|
|
(1) The GAAP
book value per share is after giving retroactive effect on December 31,
2007 to the adoption of FAS 159 on January 1, 2008. Without
giving retroactive effect to FAS 159, the GAAP book value per share was
negative $22.18.
|
||||||
|
(2) Economic
book value per share is calculated using bid-side marks for our financial
assets and offer-side marks for our financial liabilities and we believe
it more accurately reflects liquidation value than does GAAP book value
per share. Economic book value is reconciled to GAAP book value
in Table 6 in the Appendix of this
Review.
|
|
|
THE REDWOOD
REVIEW 1ST QUARTER 2009
|
3
|
|
|
|
|
|
SHAREHOLDER
LETTER
|
|
4
|
THE REDWOOD
REVIEW 1ST QUARTER 2009
|
|
|
|
|
|
|
|
SHAREHOLDER
LETTER
|

|
|
THE REDWOOD
REVIEW 1ST QUARTER 2009
|
5
|
|
|
|
|
|
QUARTERLY
OVERVIEW
|
|
6
|
THE REDWOOD
REVIEW 1ST QUARTER 2009
|
|
|
|
|
|
|
|
QUARTERLY
OVERVIEW
|
|
|
THE REDWOOD
REVIEW 1ST QUARTER 2009
|
7
|
|
|
|
|
|
QUARTERLY
OVERVIEW
|
|
8
|
THE REDWOOD
REVIEW 1ST QUARTER 2009
|
|
|
|
|
|
|
|
QUARTERLY
OVERVIEW
|
|
|
THE REDWOOD
REVIEW 1ST QUARTER 2009
|
9
|
|
|
|
|
|
QUARTERLY
OVERVIEW
|
 |
 |
|
Martin S.
Hughes
President,
Co-Chief Operating Officer
and
Chief Financial Officer
|
Brett D.
Nicholas
Chief
Investment Officer and
Co-Chief
Operating Officer
|
|
10
|
THE REDWOOD
REVIEW 1ST QUARTER 2009
|
|
|
|
|
|
|
|
FINANCIAL
INSIGHTS
|
|
u
|
The following supplemental
non-GAAP balance sheet presents our assets and liabilities as calculated
under GAAP and adjusted to reflect our estimate of economic value. We show
our investments in the Redwood Opportunity Fund, L.P. (the Fund) and the
Sequoia and Acacia
securitization entities in separate line items, similar to the equity
method of accounting, reflecting the reality that the underlying assets
and liabilities owned by these entities are legally not ours. We own only
the securities or interests that we have acquired from these
entities.
|
|
u
|
This table, except for our
estimates of economic value, is derived from the consolidating balance
sheet presented on page 20. Our estimate of economic value of $10.01 per
share is calculated using bid-side asset marks, and offer-side marks for
our financial
liabilities, as required to determine fair value under GAAP. This method
of calculating economic value more closely represents liquidation value
and does not represent the higher amount we would have to pay at the
offered-side to replace our existing assets.
|
|
Components
of Book Value
|
||||||||
|
March
31, 2009
|
||||||||
|
($
in millions, except per share data)
|
||||||||
|
As
Reported
|
Adj.
|
Management's
Estimate of
Economic Value |
||||||
|
Cash and cash
equivalents
|
$
|
333
|
|
$
|
$
|
333
|
||
|
Real estate
securities at Redwood
|
||||||||
|
Residential
|
195
|
195
|
||||||
|
Commercial
|
23
|
23
|
||||||
|
CDO
|
3
|
3
|
||||||
|
Total real
estate securities at Redwood
|
221
|
221
|
||||||
|
Investments
in the Fund
|
22
|
22
|
||||||
|
Investments
in Sequoia
|
70
|
(9)
|
61
|
|||||
|
Investments
in Acacia
|
7
|
(2)
|
5
|
|||||
|
Total
securities and investments
|
$
|
320
|
$
|
309
|
||||
|
Long-term
debt
|
(150)
|
108
|
(42)
|
|||||
|
Other
assets/liabilities, net (d)
|
3
|
3
|
||||||
|
Stockholders'
equity
|
$
|
506
|
$
|
603
|
||||
|
Book
value per share
|
$
|
8.40
|
$
|
10.01
|
||||
|
|
THE REDWOOD
REVIEW 1ST QUARTER 2009
|
11
|
|
|
|
|
|
FINANCIAL
INSIGHTS
|
|
u
|
During the first quarter, our GAAP
book value declined by $0.62 per share to $8.40, primarily due to negative
market value adjustments of $1.25 per share (of which $0.80 was reflected
as a charge on our income statement and $0.45 as reduced shareholders’ equity on
our balance sheet), and the declaration of a first quarter dividend of
$0.25 per share. These items were partially offset by $0.15 per share of
positive earnings before market valuation adjustments and $0.73 of
accretion resulting from the equity offering we
completed in January.
|
|
u
|
During the first quarter, our
economic book value declined by $1.09 per share to $10.01, also primarily
due to negative market value adjustments of $1.36 per share (including
those on our Sequoia and Acacia investments). Our dividend of $0.25 per
share and cash
operating and interest expenses of $0.21 per share also contributed to the
decline in economic book value. The net proceeds of our equity offering
were below our economic value and had a negative $0.21 per share impact.
These factors were partially offset by the positive impact of
$0.94 per share of cash flow generated by our investments during this
period.
|
|
u
|
Despite a rally in March, security
prices were lower at the end of the first quarter than at the end of last
year. This resulted in total mark-to-market adjustments during this period
of negative $75 million. As discussed further in the Mark-to-Market
Adjustments module in
this Review, the securities at Redwood recorded a negative adjustment of
$54 million, of which $25 million was on senior securities, $13 million on
subordinate securities, and $16 million on commercial and CDO securities.
Mark-to-market adjustments on securities at the Fund were negative
$8 million. Loans owned by Sequoia had mark-to-market adjustments of
negative $1 million. The net adjustments on the assets and liabilities at
Acacia were negative $12 million.
|
|
u
|
Based on our estimate of the
future loss-adjusted cash flows underlying our calculation of economic
book value at March 31, 2009, the overall cash flow yield for our $309
million in economic value of securities and investments is 38%. We had
$333 million of cash
yielding less than 1%. The implied yield for our $42 million of market
value of financial liabilities was 19%.
|
|
u
|
At March 31, 2009, our cash
position of $333 million represented $5.53 of economic book value per
share and the value of total securities and investments of $309
million represented $5.13 of economic book value per share. This
relationship highlights the fact that our future earnings and cash flows
will be significantly impacted by future
investments.
|
|
12
|
THE REDWOOD
REVIEW 1ST QUARTER 2009
|
|
|
|
|
|
|
|
FINANCIAL
INSIGHTS
|
|
u
|
As presented in the table below, the fair
value of securities at Redwood (which is the same as GAAP carrying value)
increased during the first quarter by $30 million to $221 million.
|
|
Real
Estate Securities at Redwood
|
|||
|
Three
Months Ended March 31, 2009
|
|||
|
($
in millions)
|
|||
|
Fair
value at December 31, 2008
|
$
|
191
|
|
|
Acquisitions
|
98
|
||
|
Sales
|
(1)
|
||
|
Principal
payments
|
(15)
|
||
|
Discount
amortization
|
2
|
||
|
Mark-to-market
adjustments, net
|
(54)
|
||
|
Fair
value at March 31, 2009
|
$
|
221
|
|
|
u
|
In the first quarter, we invested
$98 million in senior residential mortgage-backed securities (RMBS) at a
weighted average price of 63% of face value and with average credit
support of 11 percentage points. Thus far in the second quarter of 2009,
through April 30, 2009, we have invested $141 million in senior securities
at a weighted average price of 61% of face
value and with average credit support of 11 percentage points, and $1
million in subordinate securities at a weighted average price of 15% of
face value.
|
|
u
|
Principal payments received from
securities at Redwood totaled $15 million, an increase of $5 million from
the fourth quarter, reflecting an uptick of prepayment activity for
mortgage loans in the first
quarter.
|
|
|
THE REDWOOD
REVIEW 1ST QUARTER 2009
|
13
|
|
|
|
|
|
FINANCIAL
INSIGHTS
|
|
u
|
At March 31, 2009, we had $333
million in cash and cash equivalents. All of our cash is currently
invested in U.S. Treasury Bills or bank deposits insured by the Federal
Deposit Insurance
Corporation.
|
|
u
|
As we
forewarned last quarter,
the rating agencies issued a substantial number of downgrades during the
first quarter and we expect more to come. Most of the downgrades targeted
prime and non-prime AAA RMBS from 2005 through 2008. The overall credit
performance of loans underlying these
vintages has been significantly worse than the rating agency’s original
expectations. Downgrades may provide future investment opportunities for
us if credit sensitive investors are pressured to
sell.
|
|
u
|
Our investment decisions are based
on our projection of the underlying collateral cash flows, the level of
subordination protecting against future losses, and the priority of cash
flow received by the security. We do not rely on credit ratings as part
of our investment
decision process. If, for example, a security currently rated AAA is
downgraded to below investment grade, it is still in the most senior
position with respect to cash flows. We care more about where this
security sits with regard to seniority of the cash flows than to any
credit rating.
|
|
u
|
As we mentioned in last
quarter’s Review, we believe that
presenting our holdings, based on subjective ratings (i.e., investment
grade securities (IGS) and credit-enhancement securities (CES)), is less
meaningful than the seniority of cash flows. Thus, we now categorize our securities
by their senior or subordinate cash flows priority.
|
|
14
|
THE REDWOOD
REVIEW 1ST QUARTER 2009
|
|
|
|
|
|
|
|
FINANCIAL
INSIGHTS
|
|
u
|
For comparability purposes, we
present data on our securities using the new senior and subordinate cash
flow categories as well as the credit rating categories we
have used in the
past. The first table reflects our prior presentation categories of IGS
and CES and the second table reflects our new presentation using senior
and subordinate securities categories. The differences are not that
dramatic this quarter, but could be significant in future
quarters depending on the volume of future
downgrades.
|
|
Real
Estate Securities at Redwood
|
||||||||||||||||||||
|
March
31, 2009
|
||||||||||||||||||||
|
($
in millions)
|
||||||||||||||||||||
|
%
of Total
|
||||||||||||||||||||
|
<=2004
|
2005
|
2006-2008
|
Total
|
Securities
|
||||||||||||||||
|
Residential
|
||||||||||||||||||||
|
IGS
|
||||||||||||||||||||
|
Prime
|
$ | 13 | $ | 67 | $ | 17 | $ | 97 | 44% | |||||||||||
|
Non-prime
|
26 | 20 | 11 | 57 | 26% | |||||||||||||||
|
Total
IGS
|
$ | 39 | $ | 87 | $ | 28 | $ | 154 | 70% | |||||||||||
|
CES
|
||||||||||||||||||||
|
Prime
|
$ | 13 | $ | 5 | $ | 1 | $ | 19 | 9% | |||||||||||
|
Non-prime
|
1 | 18 | 3 | 22 | 10% | |||||||||||||||
|
Total
CES
|
$ | 14 | $ | 23 | $ | 4 | $ | 41 | 19% | |||||||||||
|
Total
Residential
|
$ | 53 | $ | 110 | $ | 32 | $ | 195 | 89% | |||||||||||
|
Commercial
CES
|
$ | 9 | $ | 4 | $ | 10 | $ | 23 | 10% | |||||||||||
|
CDO
|
$ | - | $ | 3 | $ | - | $ | 3 | 1% | |||||||||||
|
Total
|
$ | 62 | $ | 117 | $ | 42 | $ | 221 | 100% | |||||||||||
|
Real
Estate Securities at Redwood
|
||||||||||||||||||||
|
March
31, 2009
|
||||||||||||||||||||
|
($
in millions)
|
||||||||||||||||||||
|
%
of Total
|
||||||||||||||||||||
|
<=2004
|
2005
|
2006-2008
|
Total
|
Securities
|
||||||||||||||||
|
Residential
|
||||||||||||||||||||
|
Seniors
|
||||||||||||||||||||
|
Prime
|
$ | 5 | $ | 67 | $ | 16 | $ | 88 | 40% | |||||||||||
|
Non-prime
|
26 | 37 | 11 | 74 | 34% | |||||||||||||||
|
Total
Seniors
|
$ | 31 | $ | 104 | $ | 27 | $ | 162 | 74% | |||||||||||
|
Subordinates
|
||||||||||||||||||||
|
Prime
|
$ | 21 | $ | 5 | $ | 3 | $ | 29 | 13% | |||||||||||
|
Non-prime
|
1 | 1 | 2 | 4 | 2% | |||||||||||||||
|
Total
Subordinates
|
$ | 22 | $ | 6 | $ | 5 | $ | 33 | 15% | |||||||||||
|
Total
Residential
|
$ | 53 | $ | 110 | $ | 32 | $ | 195 | 89% | |||||||||||
|
Commercial
Subordinates
|
$ | 9 | $ | 4 | $ | 10 | $ | 23 | 10% | |||||||||||
|
CDO
Subordinates
|
$ | - | $ | 3 | $ | - | $ | 3 | 1% | |||||||||||
|
Total
|
$ | 62 | $ | 117 | $ | 42 | $ | 221 | 100% | |||||||||||
|
u
|
All subsequent tables with
securities-related information reflect the senior and subordinate
categories rather than the credit rating
categories.
|
|
|
THE REDWOOD
REVIEW 1ST QUARTER 2009
|
15
|
|
|
|
|
|
FINANCIAL
INSIGHTS
|
|
u
|
Our investment strategy has
shifted over the past year towards acquiring residential senior securities with
a comfortable margin of safety to protect against escalating credit
losses. As a result, the fair value of our residential senior securities
at March 31, 2009 was $162 million, representing 74% of our total
securities portfolio, up from 49% at the end of
the fourth quarter and 2% at the end of the first quarter of 2008.
|
|
u
|
The following table presents the
components of fair value (which equals GAAP carrying value) for
residential prime and non-prime senior securities at Redwood at March 31,
2009.
|
|
Residential
Senior Securities at Redwood
|
||||||||||||
|
March
31, 2009
|
||||||||||||
|
($
in millions)
|
||||||||||||
|
Available
for sale (AFS)
|
Prime
|
Non-Prime
|
Total
|
|||||||||
|
Current
face
|
$ | 160 | $ | 174 | $ | 334 | ||||||
|
Credit
reserve
|
(1 | ) | (4 | ) | (5 | ) | ||||||
|
Net
unamortized discount
|
(64 | ) | (69 | ) | (132 | ) | ||||||
|
Amortized
cost
|
95 | 101 | 197 | |||||||||
|
Unrealized
gains
|
- | - | - | |||||||||
|
Unrealized
losses
|
(7 | ) | (28 | ) | (35 | ) | ||||||
|
Fair
value of AFS securities
|
$ | 88 | $ | 73 | $ | 161 | ||||||
|
Fair
value of trading senior securities
|
- | 1 | 1 | |||||||||
|
Total
senior securities fair value
|
$ | 88 | 74 | 162 | ||||||||
|
u
|
Due to the dislocations in the
credit markets, we are able to buy senior securities at significant
discounts to principal value. Our returns on these investments will be
based on how much principal and interest we ultimately receive and how
quickly we receive it. As these investments primarily represent senior
cash flows, we generally expect few credit losses.
Over time, our credit expectations may change. If they do, we will
designate the appropriate amount of our discount as credit
reserve.
|
|
u
|
The returns on our senior
securities are generally more sensitive to changes in prepayment rates
than they are to credit risk. An increase in refinance activity
either from lower non-agency mortgage rates or from the
government’s initiatives to
stimulate refinancing
would benefit the returns on our senior securities as we would recognize
the discount more quickly.
|
|
16
|
THE REDWOOD
REVIEW 1ST QUARTER 2009
|
|
|
|
|
|
|
|
FINANCIAL
INSIGHTS
|
|
u
|
The $33 million fair value of our
residential subordinate securities represented 4% of face value at
March 31, 2009. As a
percentage of the total securities portfolio, subordinate securities
represented 15% of the portfolio at March 31, 2009, down from 49% a year
ago. This decline resulted from a combination of credit losses, a
reduction in market values due to negative mark-to-market
adjustments, and our decision to redirect our investment focus to senior
securities.
|
|
u
|
The table below presents the
components of fair value (which equals GAAP carrying value) of residential
subordinate securities at Redwood at March 31,
2009.
|
|
Residential
Subordinate Securities at Redwood
|
||||||||||||
|
March
31, 2009
|
||||||||||||
|
($
in millions)
|
||||||||||||
|
Vintage
|
||||||||||||
|
Available
for sale (AFS)
|
<=2004
|
>=2005
|
Total
|
|||||||||
|
Current
face
|
$ | 253 | $ | 473 | $ | 726 | ||||||
|
Credit
reserve
|
(157 | ) | (440 | ) | (597 | ) | ||||||
|
Net
unamortized discount
|
(65 | ) | (22 | ) | (87 | ) | ||||||
|
Amortized
cost
|
31 | 11 | 42 | |||||||||
|
Unrealized
gains
|
1 | 2 | 3 | |||||||||
|
Unrealized
losses
|
(11 | ) | (2 | ) | (13 | ) | ||||||
|
Fair
value of AFS securities
|
$ | 21 | $ | 11 | $ | 32 | ||||||
|
Fair
value of trading senior securities
|
1 | - | 1 | |||||||||
|
Total
subordinate securities fair value
|
$ | 22 | $ | 11 | $ | 33 | ||||||
|
u
|
The fair value of our subordinate
securities from 2004 and prior vintages totals $22 million, representing 9% of the $255
million of face value ($253 million on AFS securities and $2 million in
trading securities). From a credit standpoint, these vintages are
generally performing in line with or better than our initial expectations.
We believe there is still potential earnings
upside from these investments if actual credit losses are below our credit
reserves of $157 million. These investments would also benefit from an
increase in refinance
activity.
|
|
u
|
The fair value of our subordinate
securities from 2005 to 2008 vintages totals $11 million, representing 2%
of face value. Based on the poor credit trends underlying these vintages,
we expect future credit losses to eliminate nearly all the face amount
of these securities.
Therefore, the fair value ascribed to these securities primarily
represents the present value of future interest we expect to collect
before actual credit losses are realized. Even if prepayments increase, it
will be too late to benefit these securities to any material
extent.
|
|
|
THE REDWOOD
REVIEW 1ST QUARTER 2009
|
17
|
|
|
|
|
|
FINANCIAL
INSIGHTS
|
|
u
|
Due to a continuing deterioration
in fundamentals (increasing vacancies, falling rents, and difficulty in
refinancing) and an increasingly weakening economy, the value of our
commercial securities, all of which are subordinate securities, declined
by $19 million to $23
million, and were reported at 4% of face value at the end of the first
quarter.
|
|
u
|
Our commercial subordinate
securities represent 10% of our securities portfolio, down from 22% in the
prior period, and 43% a year
ago.
|
|
u
|
We have not purchased commercial securities since
the second quarter of 2007. However, given existing prices and the
resulting risk/return profile, we may acquire commercial assets in the
future.
|
|
|
u
|
The table below presents the
components of fair value (which equals GAAP carrying value) of commercial
securities at Redwood at March 31, 2009. Based on the quarterly cash flow
run rate of $5 million per quarter, the value of our commercial securities
is effectively equal to five quarters of cash flow.
|
|
Commercial
Subordinate Securities at Redwood
|
||||||||||||||||
|
March
31, 2009
|
||||||||||||||||
|
($
in millions)
|
||||||||||||||||
|
Vintage
|
||||||||||||||||
|
<=2004
|
2005
|
>=2006
|
Total
|
|||||||||||||
|
Current
face
|
$ | 48 | $ | 123 | $ | 341 | $ | 512 | ||||||||
|
Credit
reserve
|
(34 | ) | (123 | ) | (341 | ) | (498 | ) | ||||||||
|
Net
unamortized (discount) premium
|
(6 | ) | 5 | 15 | 14 | |||||||||||
|
Amortized
cost
|
8 | 5 | 15 | 28 | ||||||||||||
|
Unrealized
gains
|
2 | - | - | 2 | ||||||||||||
|
Unrealized
losses
|
(1 | ) | (1 | ) | (5 | ) | (7 | ) | ||||||||
|
Fair
value
|
$ | 9 | $ | 4 | $ | 10 | $ | 23 | ||||||||
|
Fair
value as a percentage of face
|
19% | 3% | 3% | 4% | ||||||||||||
|
u
|
Our $498 million of credit reserve on commercial
securities reflects our belief that we will not receive much principal
from these investments. Since commercial securities do not prepay like
residential securities, our returns will be based on our receiving
interest on the outstanding face value until the
anticipated credit losses occur.
|
|
18
|
THE REDWOOD
REVIEW 1ST QUARTER 2009
|
|
|
|
|
|
|
|
FINANCIAL
INSIGHTS
|
|
u
|
The fair value (which equals GAAP
carrying value) of our investments in the Fund was $22 million at March
31, 2009. This investment represents a 52% interest in the Fund, which
closed in March 2008 and is fully invested, primarily in non-prime RMBS.
The Fund is managed
by a subsidiary of Redwood.
|
|
u
|
At March 31, 2009, the fair value
of our investments in Sequoia was $61 million and the GAAP carrying value
was $70 million. These investments consist primarily of interest-only
securities (IOs) and
to a lesser extent senior and subordinate securities. Our returns on these
IOs are most sensitive to prepayments and faster prepayments would
negatively impact returns. Material changes in interest rates also have a
short-term impact on cash flows received from these
assets.
|
|
u
|
At March 31, 2009, the fair value
of our investments in Acacia was $5 million and the GAAP carrying value
was $7 million. These investments represent equity interests and ABS
issued from our Acacia CDO securitization entities and the management fees
we receive from those
entities. Due to various provisions in each CDO securitization, all but
one of our equity interests are cut off from cash flows and we only expect
limited returns on the ABS issued we own. We value the management fees at
$4 million, which equals our projected management
fees discounted at a 45%
rate.
|
|
u
|
We had no short-term debt at March
31, 2009. We believe that it is currently prudent to fund our investments
with permanent capital (equity and long-term debt) that is not subject to
margin calls and financial
covenants.
|
|
u
|
In 2006 and 2007, we issued $150 million of
30-year long-term debt at Redwood (due in 2037) at an interest rate of
LIBOR plus 2.25%. Under GAAP, this debt is carried at cost. At March 31,
2009, we estimated a $42 million fair value for this liability using the
same valuation process used to fair value
our other financial assets and liabilities. Estimated economic value is
lower than our GAAP carrying value because we believe that investors would
have required a 19% yield on this debt (currently equal to LIBOR +
16.80%) had we issued it at March 31,
2009.
|
|
|
THE REDWOOD
REVIEW 1ST QUARTER 2009
|
19
|
|
|
|
|
|
FINANCIAL
INSIGHTS
|
|
u
|
GAAP requires us to consolidate
all of the assets and liabilities of the Sequoia and Acacia securitization
entities (which had a combined $5.0 billion of assets and $4.9 billion of
liabilities at March
31, 2009), even though the assets are owned by securitization entities and
the liabilities are obligations of these securitization entities payable
only from the cash flows generated by the assets owned by these entities.
Additionally, we are required to consolidate all of
the assets and liabilities of the Fund since Redwood owns the general
partnership interest in the Fund and just over half of the limited
partnership interests.
|
|
u
|
The table below shows the
consolidating components of our consolidated balance sheet at March 31,
2009. The purpose of this presentation is to show the effect each of the
components had on our consolidated shareholders’ equity. The Fund, Sequoia, and
Acacia components
represent investments and are not separate business
segments.
|
|
Consolidating
Balance Sheet
|
||||||||||||||||||||||||
|
March
31, 2009
|
||||||||||||||||||||||||
|
($
in millions)
|
||||||||||||||||||||||||
|
Redwood
|
The
Fund
|
Sequoia
|
Acacia
|
Intercompany
|
Redwood
Consolidated
|
|||||||||||||||||||
|
Real estate
loans
|
$ | 3 | $ | - | $ | 4,528 | $ | 10 | $ | - | $ | 4,541 | ||||||||||||
|
Real estate
securities
|
221 | 38 | - | 332 | (72 | ) | 519 | |||||||||||||||||
|
Investments in
the Fund
|
22 | - | - | - | (22 | ) | - | |||||||||||||||||
|
Investments in
Sequoia
|
70 | - | - | - | (70 | ) | - | |||||||||||||||||
|
Investments in
Acacia
|
7 | - | - | - | (7 | ) | - | |||||||||||||||||
|
Other
investments
|
- | - | - | 62 | - | 62 | ||||||||||||||||||
|
Cash and cash
equivalents
|
333 | - | - | - | - | 333 | ||||||||||||||||||
|
Total earning
assets
|
656 | 38 | 4,528 | 404 | (171 | ) | 5,455 | |||||||||||||||||
|
Other
assets
|
25 | 4 | 38 | 59 | - | 126 | ||||||||||||||||||
|
Total
assets
|
$ | 681 | $ | 42 | $ | 4,566 | $ | 463 | $ | (171 | ) | $ | 5,581 | |||||||||||
|
Short-term
debt
|
$ | - | $ | - | $ | - | $ | - | $ | - | $ | - | ||||||||||||
|
Other
liabilities
|
25 | 2 | 6 | 165 | - | 198 | ||||||||||||||||||
|
Asset-backed
securities issued - Sequoia
|
- | - | 4,490 | - | (72 | ) | 4,418 | |||||||||||||||||
|
Asset-backed
securities issued - Acacia
|
- | - | - | 291 | - | 291 | ||||||||||||||||||
|
Long-term
debt
|
150 | - | - | - | - | 150 | ||||||||||||||||||
|
Total
liabilities
|
175 | 2 | 4,496 | 456 | (72 | ) | 5,057 | |||||||||||||||||
|
Stockholders’
equity
|
506 | 22 | 70 | 7 | (99 | ) | 506 | |||||||||||||||||
|
Noncontrolling
interest
|
- | 18 | - | - | - | 18 | ||||||||||||||||||
|
Total equity
|
506 | 40 | 70 | 7 | (99 | ) | 524 | |||||||||||||||||
|
Total
liabilities and stockholders’ equity
|
$ | 681 | $ | 42 | $ | 4,566 | $ | 463 | $ | (171 | ) | $ | 5,581 | |||||||||||
|
20
|
THE REDWOOD
REVIEW 1ST QUARTER 2009
|
|
|
|
|
|
|
|
FINANCIAL
INSIGHTS
|
|
u
|
Our sources and uses of cash in
the table below is derived from our GAAP Consolidated Statement of Cash
Flows for the first quarter of 2009 by aggregating and netting all
items in a manner
consistent with the way management analyzes them. This table excludes the
gross cash flows generated by our Sequoia and Acacia securitization
entities and the Fund (cash flows that are not available to Redwood), but
does include the cash flows distributed to Redwood as a
result of our investments in these entities. The beginning and ending cash
balances presented in the table below are GAAP
amounts.
|
|
Redwood
|
||||||||
|
Sources
and Uses of Cash
|
||||||||
|
($
in millions)
|
||||||||
|
Three
Months Ended
|
||||||||
|
3/31/2009
|
12/31/2008
|
|||||||
|
Beginning
cash balance
|
$ | 126 | $ | 177 | ||||
|
Business Cash
Flows:
|
||||||||
|
Cash flow
from investments
|
$ | 57 | $ | 40 | ||||
|
Asset
management fees
|
1 | 1 | ||||||
|
Operating
expenses
|
(11 | ) | (12 | ) | ||||
|
Interest
expense on debt
|
(2 | ) | (2 | ) | ||||
|
Total
business cash flows
|
45 | 27 | ||||||
|
Other Sources
and Uses:
|
||||||||
|
Proceeds from
asset sales
|
1 | 1 | ||||||
|
Proceeds from
equity issuance
|
285 | 2 | ||||||
|
Changes in
working capital
|
1 | 2 | ||||||
|
Acquistions
|
(98 | ) | (50 | ) | ||||
|
Dividends
|
(27 | ) | (26 | ) | ||||
|
Repayment of
debt
|
- | (7 | ) | |||||
|
Net other
sources (uses)
|
162 | (78 | ) | |||||
|
Net
sources (uses) of cash
|
$ | 207 | $ | (51 | ) | |||
|
Ending
cash balance
|
$ | 333 | $ | 126 | ||||
|
u
|
First quarter business cash flow
totaled $45 million, up $18 million from the fourth quarter as cash flow
from our investment portfolio increased by $17 million and cash operating
expenses declined by $1
million.
|
|
|
THE REDWOOD
REVIEW 1ST QUARTER 2009
|
21
|
|
|
|
|
|
FINANCIAL
INSIGHTS
|
|
u
|
The table below
presents the components of our
investment cash flow for the fourth quarter of 2008 and the first quarter
of 2009.
|
|
Redwood
|
||||||||
|
Cash
Flow From Investments
|
||||||||
|
($
in millions)
|
||||||||
|
Three
Months Ended
|
||||||||
|
3/31/2009
|
12/31/2008
|
|||||||
|
Securities at
Redwood
|
||||||||
|
Residential
principal
|
$ | 15 | $ | 10 | ||||
|
Residential
interest
|
15 | 11 | ||||||
|
Commercial
and CDO interest
|
5 | 5 | ||||||
|
Total
Securities at Redwood
|
35 | 26 | ||||||
|
Investments
in Sequoia
|
18 | 9 | ||||||
|
Investments
in Acacia
|
1 | 2 | ||||||
|
Investments
in the Fund
|
3 | 3 | ||||||
|
Total
Cash Flow from Securities and Investments
|
$ | 57 | $ | 40 | ||||
|
u
|
Our cash flow from investments
increased by $17 million in the first quarter from the prior quarter due
to:
|
|
•
|
$9 million increase in cash flow
from our investments
in Sequoia, as our IO securities benefited from the reset timing
differences between the loans and ABS issued (as previously described in
our fourth quarter Review). Our IO securities generated $16 million of the
$18 million in Sequoia cash flow in the first
quarter.
|
|
•
|
$5 million increase in principal
payments received from our investment securities as prepayment speeds
increased during the period, including $3 million of principal from new
investments.
|
|
•
|
$4 million increase in interest
received from our
investment securities, due in part to earning a full quarter from our
fourth quarter acquisitions, as well as $1 million from first quarter
investments.
|
|
u
|
Our cash flow from investments
included $39 million of coupon interest and $18 million of
principal. We caution
readers that given the nature of our investments (deep discount
subordinated securities, senior securities at discounts, IOs, equity
investments in Acacia, and other types) it is difficult to draw
conclusions in any one period about what portion of our cash flow represents
“income” and what is a “return of capital.” It is only at the end of an
asset’s life that we can accurately
determine what portion of the cumulative cash received (whether principal
or interest) was truly income and what was a return of
capital.
|
|
22
|
THE REDWOOD
REVIEW 1ST QUARTER 2009
|
|
|
|
|
|
|
|
FINANCIAL
INSIGHTS
|
|
u
|
The following table provides
information regarding the source and vintage of cash flows from our
investments. As shown, most of our cash flows are generated by assets from
earlier vintages, which we believe provides a level of comfort about our ongoing ability
to generate cash, as these assets generally continue to perform within our
expectations.
|
|
Cash
Flow from Investments by Vintage
|
||||||||||||||||||||||||
|
Three
Months Ended March 31, 2009
|
||||||||||||||||||||||||
|
($
in millions)
|
||||||||||||||||||||||||
|
|
||||||||||||||||||||||||
|
<=2004
|
2005
|
2006
|
2007
|
2008
|
Total
|
|||||||||||||||||||
|
Redwood
|
$ | 13 | $ | 8 | $ | 5 | $ | 9 | $ | - | $ | 35 | ||||||||||||
|
The
Fund
|
2 | 1 | - | - | - | 3 | ||||||||||||||||||
|
Sequoia
|
12 | - | - | 6 | - | 18 | ||||||||||||||||||
|
Acacia
|
1 | - | - | - | - | 1 | ||||||||||||||||||
|
Total
|
$ | 28 | $ | 9 | $ | 5 | $ | 15 | $ | - | $ | 57 | ||||||||||||
|
u
|
A majority of the cash flow
generated from our investments at Redwood ($25 million of the $35 million
in the first quarter) was from our subordinated securities.
Thus, even though our subordinate securities represent a small percentage
of the market value of our portfolio, they are still contributing strong
cash flows.
|
|
|
THE REDWOOD
REVIEW 1ST QUARTER 2009
|
23
|
|
|
|
|
|
GAAP INCOME
|
|
u
|
Our reported GAAP loss was $35
million ($0.65 per share) for the first quarter of 2009, as compared to a
loss of $116 million ($3.46 per share) for the fourth quarter of 2008.
Negative market valuation adjustments (MVA) recognized through our income
statement continue to
be the primary driver of our results.
|
|
u
|
The following table provides a
summary of our GAAP loss for the first quarter of 2009 and the fourth
quarter of 2008.
|
|
GAAP
(Loss) Income
|
||||||||
|
($
in millions, except per share data)
|
||||||||
|
Three
Months Ended
|
||||||||
|
3/31/2009
|
12/31/2008
|
|||||||
|
Interest
income
|
$ | 82 | $ | 123 | ||||
|
Interest
expense
|
(48 | ) | (99 | ) | ||||
|
Net interest
income
|
34 | 24 | ||||||
|
Provision for
loan losses
|
(16 | ) | (19 | ) | ||||
|
Market
valuation adjustments, net
|
(43 | ) | (111 | ) | ||||
|
Net interest
income (loss) after provision and market valuation
adjustments
|
(25 | ) | (106 | ) | ||||
|
Operating
expenses
|
(11 | ) | (14 | ) | ||||
|
Realized
gains on sales
|
- | 6 | ||||||
|
Realized
gains on calls
|
- | - | ||||||
|
Noncontrolling
interest
|
1 | 2 | ||||||
|
Benefit from
(provision for) income taxes
|
- | (4 | ) | |||||
|
GAAP
(loss) income
|
$ | (35 | ) | $ | (116 | ) | ||
|
GAAP
(loss) income per share
|
$ | (0.65 | ) | $ | (3.46 | ) | ||
|
24
|
THE REDWOOD
REVIEW 1ST QUARTER 2009
|
|
|
|
|
|
|
|
GAAP INCOME
|
|
u
|
The table below shows the
consolidating components of our consolidated income statements for the first
quarter of 2009 and the fourth quarter of 2008. The purpose of this
presentation is to show the effect each of the components had on our
reported loss for these periods. The Fund, Sequoia, and Acacia components
represent investments and are not separate
business segments.
|
|
Consolidating
Income Statement
|
||||||||||||||||||||||||
|
Three
Months Ended March 31, 2009
|
||||||||||||||||||||||||
|
($
in millions)
|
||||||||||||||||||||||||
|
Redwood
|
The
Fund
|
Sequoia
|
Acacia
|
Intercompany
Adjustments
|
Redwood
Consolidated
|
|||||||||||||||||||
|
Interest
income
|
$ | 19 | $ | 1 | $ | 41 | $ | 22 | $ | 1 | $ | 84 | ||||||||||||
|
Net discount
(premium) amortization
|
3 | 2 | (7 | ) | - | - | (2 | ) | ||||||||||||||||
|
Total interest
income
|
22 | 3 | 34 | 22 | 1 | 82 | ||||||||||||||||||
|
Management
fees
|
1 | - | - | - | (1 | ) | - | |||||||||||||||||
|
Interest
expense
|
(2 | ) | - | (25 | ) | (21 | ) | - | (48 | ) | ||||||||||||||
|
Net interest
income
|
21 | 3 | 9 | 1 | - | 34 | ||||||||||||||||||
|
Provision for
loan losses
|
- | - | (16 | ) | - | - | (16 | ) | ||||||||||||||||
|
Market
valuation adjustments, net
|
(26 | ) | (4 | ) | (1 | ) | (12 | ) | - | (43 | ) | |||||||||||||
|
Net interest
income (loss) after provision and market valuation
adjustments
|
(5 | ) | (1 | ) | (8 | ) | (11 | ) | - | (25 | ) | |||||||||||||
|
Operating
expenses
|
(11 | ) | - | - | - | - | (11 | ) | ||||||||||||||||
|
Realized gains
on sales and calls, net
|
- | - | - | - | - | - | ||||||||||||||||||
|
Loss from the
Fund, Sequoia, and Acacia
|
(19 | ) | - | - | - | 19 | - | |||||||||||||||||
|
Noncontrolling
interest
|
- | 1 | - | - | - | 1 | ||||||||||||||||||
|
Benefit from
(provision for) income taxes
|
- | - | - | - | - | - | ||||||||||||||||||
|
Net
(loss) income
|
$ | (35 | ) | $ | - | $ | (8 | ) | $ | (11 | ) | $ | 19 | $ | (35 | ) | ||||||||
|
Consolidating
Income Statement
|
||||||||||||||||||||||||
|
Three
Months Ended December 31, 2008
|
||||||||||||||||||||||||
|
($
in millions)
|
||||||||||||||||||||||||
|
Redwood
|
The
Fund
|
Sequoia
|
Acacia
|
Intercompany
Adjustments
|
Redwood
Consolidated
|
|||||||||||||||||||
|
Interest
income
|
$ | 18 | $ | 2 | $ | 71 | $ | 36 | $ | (1 | ) | $ | 126 | |||||||||||
|
Net discount
(premium) amortization
|
(3 | ) | 1 | (1 | ) | - | - | (3 | ) | |||||||||||||||
|
Total interest
income
|
15 | 3 | 70 | 36 | (1 | ) | 123 | |||||||||||||||||
|
Management
fees
|
1 | - | - | - | - | 1 | ||||||||||||||||||
|
Interest
expense
|
(2 | ) | - | (64 | ) | (35 | ) | 1 | (100 | ) | ||||||||||||||
|
Net interest
income
|
14 | 3 | 6 | 1 | - | 24 | ||||||||||||||||||
|
Provision for
loan losses
|
- | - | (19 | ) | - | - | (19 | ) | ||||||||||||||||
|
Market
valuation adjustments, net
|
(103 | ) | (7 | ) | (3 | ) | (4 | ) | 6 | (111 | ) | |||||||||||||
|
Net interest
income (loss) after provision and market valuation
adjustments
|
(89 | ) | (4 | ) | (16 | ) | (3 | ) | 6 | (106 | ) | |||||||||||||
|
Operating
expenses
|
(13 | ) | (1 | ) | - | - | - | (14 | ) | |||||||||||||||
|
Realized gains
on sales and calls, net
|
- | - | 12 | - | (6 | ) | 6 | |||||||||||||||||
|
Loss from the
Fund, Sequoia, and Acacia
|
(10 | ) | - | - | - | 10 | - | |||||||||||||||||
|
Noncontrolling
interest
|
- | 2 | - | - | - | 2 | ||||||||||||||||||
|
Benefit from
(provision for) income taxes
|
(4 | ) | - | - | - | - | (4 | ) | ||||||||||||||||
|
Net
(loss) income
|
$ | (116 | ) | $ | (3 | ) | $ | (4 | ) | $ | (3 | ) | $ | 10 | $ | (116 | ) | |||||||
|
|
THE REDWOOD
REVIEW 1ST QUARTER 2009
|
25
|
|
|
|
|
|
GAAP INCOME
|
|
u
|
At Redwood, net interest income
before provision and market valuation adjustments was $21 million for the
first quarter of 2009, as compared to $14 million for the fourth quarter
of 2008. The increase was primarily due to faster prepayments, which
resulted in greater
discount amortization during the first quarter. Negative market valuation
adjustments at Redwood were $26 million for the first quarter as compared
to $103 million for the fourth quarter, reflecting fewer impairments of
securities. A detailed analysis of market valuation
adjustments is included in the Mark-to-Market Adjustments module of this
Review.
|
|
u
|
Operating expenses were $11
million for the first quarter of 2009, as compared to $13 million for the
fourth quarter, a decrease of $2 million. The decrease was due to lower
compensation expense as a result of a reduction in the number of employees
and lower consulting
and legal expenses.
|
|
u
|
We recognized a $1 million loss
this quarter, down from a $3 million loss in the prior quarter as there
were fewer impairments on securities owned by the
Fund.
|
|
u
|
We recorded an $8 million
first quarter loss
related to the Sequoia entities as compared to a $4 million loss in the
prior quarter. The primary reason for the difference was that there were
no gains arising from deconsolidation events in the first quarter whereas
Sequoia recognized a net $12 million deconsolidation
gain in the fourth quarter. Deconsolidation gains and related accounting
principles are discussed in detail in the Investments in Sequoia module
later in the Review.
|
|
u
|
Net interest income was slightly
higher in the first quarter as a result of falling short-term interest
rates, and our credit provision was slightly lower in part due to the
deconsolidation event in the fourth quarter (i.e., we have fewer loans on
which to establish a
credit reserve). We are required for financial reporting purposes to consolidate the loans
owned by Sequoia and establish credit reserves for anticipated credit
losses. At March 31, 2009 we have an aggregate $48 million Sequoia loan
loss reserve. Reserves are established
for each specific pool of loans and in one case the reserve exceeds our
investment in a Sequoia entity by $15 million. In a future period (maybe
as soon as the second quarter), we may be able to reverse this reserve as
we deconsolidate our investment in this
Sequoia entity.
|
|
u
|
A $11 million loss was recorded at
Acacia, which was greater than the $3 million loss recorded in the prior
quarter primarily because net market value adjustments (MVA) was negative
$12 million this
quarter as compared to a negative $4 million in the fourth quarter. All
the assets and liabilities of Acacia are reported at fair value with
changes in value reported through the income statement. As previously
discussed, the fair values of the securities owned by Acacia may not
necessarily move in tandem with the fair values of the Acacia ABS issued.
The reported equity in Acacia is currently $7 million and we expect the
market value adjustments to have a smaller impact in future periods.
|
|
26
|
THE REDWOOD
REVIEW 1ST QUARTER 2009
|
|
|
|
|
|
|
|
GAAP INCOME
|
|
u
|
On April 9, 2009, the Financial
Accounting Standards Board issued two new financial statement positions
(FSPs) addressing the determination of fair values in an inactive market
and the assessment of other-than-temporary impairment. We will apply these new FSPs beginning
in the second quarter of 2009. These FSPs will have no effect on our cash
flows, book value, or economic returns. The fair value FSP will have
little impact on us and the impairment FSP will impact our future
earnings, as summarized below and further
discussed in the Accounting Discussion module later in this Review.
|
|
u
|
As a result of the impairment FSP,
only that portion of an other-than-temporary impairment that is based on
adverse cash flow changes and not the portion reflecting changes in market
discount rates will be recognized through our income statement. This
could lead to fewer
impairment charges being recognized in the future. For example, if the
fair value of an asset decreased by $10 and the reason for this decrease
was due to a $1 adverse change in future cash flows (e.g., an increase in
credit loss forecast), we would deem this asset to be
other-than-temporarily impaired and historically, recognize the entire $10
decrease in market value through our income statement. Under the new FSP,
beginning in the second quarter, only the $1 decrease attributed to
the change in cash flow would be
recognized through the income statement with the remaining $9 decrease in
market value recorded through the balance
sheet.
|
|
u
|
There is also provision in the
impairment FSP that will have a negative impact on our future
earnings. The new FSP
requires a reclassification of prior impairments, as a result of which we
will not be allowed to recognize in future earnings the impairment charges
we have taken in the past that related to changes in market discount
rates. Referring back to the example in the previous
paragraph, assume we had impaired this asset in the first quarter of 2009
(or any time prior to this quarter). Our historical income would include a
$10 loss due to the impairment of this asset. Upon adoption of this FSP
next quarter, we would reclassify $9
(the amount not due to credit) into other comprehensive income from
retained earnings and increase the cost basis in this asset by the same
$9. As a result, our earnings in future periods will not include $9 of
income as this asset recovers in value and pays
down. Instead, we will recognize the benefit through positive equity
adjustments, which will be reflected in book value. The amount of the
reclassification of prior impairments on our securities will be determined
and reported upon adoption of this FSP in
the second quarter of 2009.
|
|
|
THE REDWOOD
REVIEW 1ST QUARTER 2009
|
27
|
|
|
|
|
|
TAXABLE
INCOME
|
|
|
Taxable income is our pre-tax
income as calculated for tax purposes. Taxable income differs materially
from GAAP income. Table 3 in the Appendix reconciles these two earnings
measures.
|
|
|
REIT taxable income is pre-tax
profit, as calculated for tax purposes, excluding taxable income earned at
our taxable subsidiaries. REIT taxable income is the primary determinant
of the minimum amount of dividends we must distribute in order to maintain our
tax status as a REIT and we must distribute at least 90% of our REIT
taxable income as dividends.
|
|
|
For our quarterly taxable earnings
estimates, we project our taxable earnings for the year based upon various
assumptions of events
that will occur during the year. However, some of the events that could
have significant impact on our taxable earnings are difficult to project,
including the amount and timing of credit losses, prepayments, and
employee stock option exercises. Thus, our quarterly taxable earnings
are likely to remain
volatile.
|
|
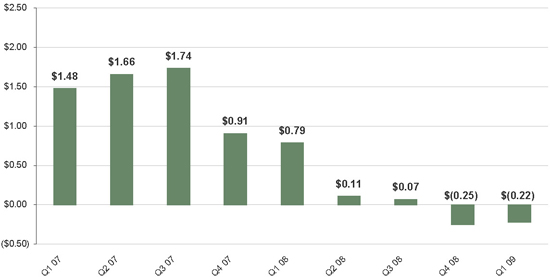
u
|
Our first quarter estimated
taxable earnings were negative $14 million ($0.22 per share) and included
$53 million in credit losses. This compares to estimated taxable
earnings in the
fourth quarter of negative $8 million ($0.25 per share), which included
$40 million of credit losses. We continue to expect that credit losses
will be the primary factor in generating a taxable loss in
2009.
|
|
u
|
The charts below provide a
summary of our
taxable income per share and REIT taxable income per share for each of the
last nine quarters.
|
|
28
|
THE REDWOOD
REVIEW 1ST QUARTER 2009
|
|
|
|
|
|
|
|
TAXABLE INCOME
|
|
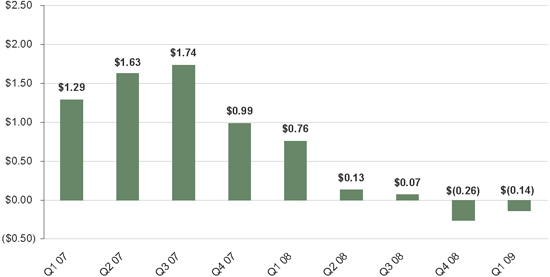
u
|
Our first quarter estimated REIT
taxable earnings were negative $9 million ($0.14 per share) and included
$48 million in credit losses. This compares to estimated REIT taxable
earnings in the prior quarter of negative $9 million ($0.26 per share),
which included $39 million of credit losses. The higher credit losses in
the first quarter were offset by higher net interest income from recent
acquisitions and lower operating expenses.
The reduction in the per share loss relates to the increase in the number
of shares outstanding resulting from the equity offering in the first
quarter.
|
|
u
|
We incurred $5 million of credit
losses on securities owned at our taxable subsidiaries which accounted for
the additional negative taxable
earnings.
|
|
u
|
Since, for tax purposes, we are
neither permitted to establish credit reserves nor recognize
market valuation
adjustments, the tax basis of our residential, commercial, and CDO
subordinate securities at Redwood (excluding investments in Sequoia and
Acacia) was $501 million higher than our GAAP basis. As a result, future
credit losses will have a more significant impact on our taxable
income than on our GAAP income. Over time, cumulative GAAP and taxable
income will converge. Given our projected losses, we expect 2009 taxable
income to be less than GAAP income before market valuation adjustments.
|
|
u
|
The tax basis on Sequoia IOs we
own is $33 million. Many of the underlying pools of loans have paid down
or will pay down within the next year to levels where they are callable.
When these are called, tax losses on these IOs are incurred and our
taxable income and
dividend distribution requirements decrease. We do not anticipate calling
any Sequoia deals in the foreseeable future.
|
|
|
THE REDWOOD
REVIEW 1ST QUARTER 2009
|
29
|
|
|
|
|
|
TAXABLE
INCOME
|
|
u
|
The table below reconciles our
GAAP and estimated taxable income for the first quarter of
2009.
|
|
GAAP
and Taxable Income (Loss)
|
||||||||||||
|
Three
Months Ended March 31, 2009
|
||||||||||||
|
GAAP
|
Tax
|
Differences
|
||||||||||
|
Net interest
income
|
$ | 34 | $ | 49 | $ | 15 | ||||||
|
GAAP
provision for loan losses
|
(16 | ) | - | 16 | ||||||||
|
Realized
credit losses
|
- | (53 | ) | (53 | ) | |||||||
|
Market
valuation adjustments, net
|
(43 | ) | - | 43 | ||||||||
|
Operating
expenses
|
(11 | ) | (10 | ) | 1 | |||||||
|
Realized
gains on sales and calls, net
|
- | - | - | |||||||||
|
Provision for
income taxes
|
- | - | - | |||||||||
|
Less: Net
loss attributable to noncontrolling interest
|
1 | - | 1 | |||||||||
|
Net
loss
|
$ | (35 | ) | $ | (14 | ) | $ | 21 | ||||
|
Estimated
taxable earnings per share
|
$ | (0.65 | ) | $ | (0.22 | ) | $ | 0.43 | ||||
|
u
|
There are significant differences between GAAP and
tax accounting, as illustrated in the table above, including:
|
|
•
|
Net interest income for tax is
higher due to the fact we cannot anticipate future credit losses in
determining the current period yield for an asset. Thus, we generally amortize more of an
asset’s purchase discount into income
for tax than for GAAP prior to anticipated credit losses
occurring.
|
|
•
|
For GAAP, we take credit
provisions for loan losses while for tax we cannot establish loan loss
reserves for future anticipated
events.
|
|
•
|
Realized credit losses are
expensed when incurred for tax. For GAAP, these losses are anticipated
through lower yields on assets or through the loan loss
provisions.
|
|
•
|
The timing, and for some expenses,
the amount, of some of our compensation expenses are different
under GAAP accounting than for tax accounting. In this quarter, these
differences were not significant, but could be in future
periods.
|
|
•
|
For tax purposes, we do not
consolidate noncontrolling interests as we do under GAAP.
|
|
30
|
THE REDWOOD
REVIEW 1ST QUARTER 2009
|
|
|
|
|
|
|
|
DIVIDENDS
|
|
|
As a REIT, we are required to
distribute at least 90% of our REIT taxable income in the form of
dividends to shareholders. Our board of directors can declare dividends in
excess of this minimum
requirement.
|
|
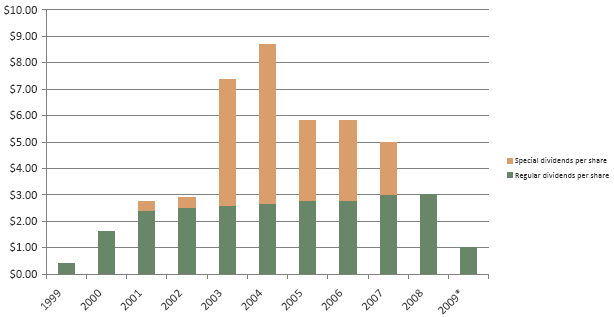
|
The
chart below shows
the regular and special dividends per share paid to shareholders for the
indicated periods and our projected regular dividend for 2009.
|
|
u
|
On November 10, 2008, our board of
directors announced its intention to pay a regular dividend of $0.25 per
share per quarter in 2009.
|
|
u
|
On March 18, 2009, our board of
directors declared a regular dividend of $0.25 per share for the first
quarter, which was
paid on April 21, 2009 to shareholders of record on March 31,
2009.
|
|
u
|
We expect to report a taxable loss
at the REIT level for 2009 due to the expected realization of credit
losses. We currently expect that Redwood’s 2009 regular dividend will
constitute a return
of capital and, as such, will not be taxable to
shareholders.
|
|
u
|
There was no undistributed REIT
taxable income at March 31,
2009.
|
|
u
|
We do not expect to pay a special
dividend in 2009.
|
|
|
THE REDWOOD
REVIEW 1ST QUARTER 2009
|
31
|
|
|
|
|
|
CAPITAL AND
LIQUIDTY
|
|
|
We use capital to fund our operations,
invest in earning assets that are generally illiquid, fund working
capital, and meet lender capital requirements with respect to
collateralized borrowings, if
any.
|
|
|
Through our internal risk-adjusted
capital policy, we allocate a prudent level of capital for
our earning assets to meet liquidity needs that may arise. In most cases,
the amount of allocated capital is equal to 100% of the fair value of the
asset. The amount of capital that exceeds our risk-adjusted capital
guideline, less short-term debt,
pending investment settlements, operating expense allocations, and other
miscellaneous capital allocations, is excess capital that can be invested
to support business growth.
|
|
|
Our capital base includes common
equity plus $150 million of long-term debt at Redwood,
which is due in 2037.
|
|
|
Declines in the fair value of
assets generally do not have an effect on excess capital, as asset value
declines usually reduce both available capital and capital required for
these investments by an equal
amount.
|
|
u
|
In January 2009, we completed a
public offering of common stock to raise capital for investment and
growth, and issued 26.45 million shares for net proceeds of $283
million.
|
|
u
|
Our reported capital totaled $656
million at March 31,
2009, compared to $452 million at December 31,
2008.
|
|
u
|
At March 31, 2009, our
unrestricted cash totaled $333
million.
|
|
u
|
Our excess capital position was
$328 million at March 31, 2009, an increase of $207 million from $121
million at December
31, 2008. During the first quarter, our sources of capital were: $45
million from portfolio cash flows and management fees in excess of
operating costs and financing costs; $283 million from the public offering
of common stock; $2 million from the sale of shares pursuant to our dividend
reinvestment plan; $1 million from asset sales; and $1 million of net
changes in operating capital (in accordance with our internal
risk-adjusted guidelines). Uses of capital included the payment of $27
million in dividends and $98 million for asset
acquisitions.
|
|
32
|
THE REDWOOD
REVIEW 1ST QUARTER 2009
|
|
|
|
|
|
|
|
MARK-TO-MARKET
ADJUSTMENTS
|
|
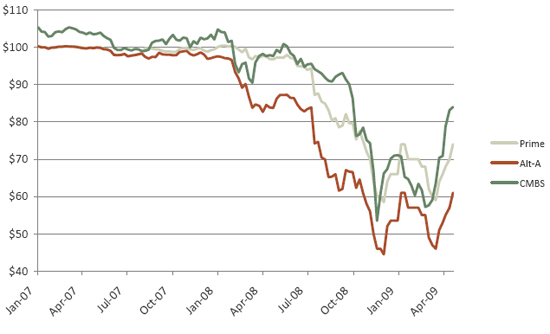
u
|
As previously discussed and as
illustrated in the chart below, prices in 2009 for senior securities have
been volatile. Thus far in the second quarter, there has been a partial recovery of prices
on senior securities backed by residential and commercial mortgages
following a large price decline in 2008.
|
|
u
|
Unlike prices for senior
securities, prices for subordinate securities have declined year to date
through April 2009.
|
|
|
THE REDWOOD
REVIEW 1ST QUARTER 2009
|
33
|
|
|
|
|
|
MARK-TO-MARKET
ADJUSTMENTS
|
|
u
|
The table below shows the
consolidating impact of mark-to-market (MTM) adjustments against
loans and securities
on our balance sheet and income statement in the first quarter.
|
|
Mark-to-Market
Adjustments on Assets and Liabilities
|
||||||||||||||||||||
|
Consolidated
Balance Sheet and Income Statement Effects
|
||||||||||||||||||||
|
Three
Months Ended March 31, 2009
|
||||||||||||||||||||
|
($
in millions)
|
||||||||||||||||||||
|
The
|
||||||||||||||||||||
|
Redwood
|
Fund
|
Sequoia
|
Acacia
|
Total
|
||||||||||||||||
|
Balance sheet
effect
|
||||||||||||||||||||
|
Net
change in equity account
|
$ | (28 | ) | $ | (4 | ) | $ | - | $ | - | $ | (32 | ) | |||||||
|
Income
statement effect
|
||||||||||||||||||||
|
Market
valuation adjustments
|
||||||||||||||||||||
|
Fair
value assets and liabilities
|
(1 | ) | - | (1 | ) | (12 | ) | (14 | ) | |||||||||||
|
Impairment
on AFS securities
|
(25 | ) | (4 | ) | - | - | (29 | ) | ||||||||||||
|
Total income
statement effect
|
(26 | ) | (4 | ) | (1 | ) | (12 | ) | (43 | ) | ||||||||||
|
Total
mark-to-market adjustments
|
$ | (54 | ) | $ | (8 | ) | $ | (1 | ) | $ | (12 | ) | $ | (75 | ) | |||||
|
u
|
As noted previously, market prices
for securities declined in the first quarter. Despite improving liquidity,
forced liquidations and other distressed sales continue to account for a significant portion of
overall market activity.
|
|
u
|
The table below details the
negative $54 million of MTM adjustments during the first quarter on
securities held at Redwood by underlying collateral type and by vintage.
|
|
Mark-to-Market
Adjustments
|
||||||||||||||||||||
|
on
Assets at Redwood
|
||||||||||||||||||||
|
Three
Months Ended March 31, 2009
|
||||||||||||||||||||
|
($
in millions)
|
||||||||||||||||||||
|
Loans
&
|
MTM
|
|||||||||||||||||||
|
Seniors
|
Subordinates
|
Derivatives
|
Total
|
Percentage (a)
|
||||||||||||||||
|
Residential
|
||||||||||||||||||||
|
Prime
|
$ | (9 | ) | $ | (11 | ) | $ | - | $ | (20 | ) | (14 | ) % | |||||||
|
Non-prime
|
(16 | ) | (2 | ) | - | (18 | ) | (18 | ) % | |||||||||||
|
Total
Residential
|
(25 | ) | (13 | ) | - | (38 | ) | |||||||||||||
|
Commercial
|
- | (15 | ) | - | (15 | ) | (37 | ) % | ||||||||||||
|
CDO
|
- | (1 | ) | - | (1 | ) | (21 | ) % | ||||||||||||
|
Interest rate
agreements & other derivatives
|
- | - | - | - | ||||||||||||||||
|
Total
mark-to-market adjustments
|
$ | (25 | ) | $ | (29 | ) | $ | - | $ | (54 | ) | |||||||||
|
34
|
THE REDWOOD
REVIEW 1ST QUARTER 2009
|
|
|
|
|
|
|
|
MARK-TO-MARKET
ADJUSTMENTS
|
|
u
|
Total MTM adjustments at the Fund,
Sequoia, and Acacia were negative $21 million. During the first quarter,
net MTM adjustments for securities at the Fund were negative $8
million. Net MTM
adjustments for real estate owned (REO) at Sequoia were negative $1
million, reflecting market value declines for REO properties below their
cost basis. Net MTM adjustments at Acacia were negative $12 million, which
reflected market value declines on assets (loans and
securities) offset by declines on liabilities (derivatives and ABS
issued). These declines were due to a combination of the factors
previously discussed.
|
|
u
|
Market values reported for our
assets and liabilities (except for those held at historical cost) reflect
an “exit
price,” or the amount
we believe we would realize if we sold an asset or would pay if we
repurchased a liability in an orderly transaction. This is the required accounting
standard even if we have no intention to sell assets or repurchase
liabilities.
|
|
u
|
Establishing market values is
inherently subjective given the volatile and illiquid markets for our real
estate assets and liabilities and requires us to make a number of
market-based assumptions, including the future of interest rates,
prepayment rates, discount rates, credit loss rates, and the timing of
credit losses. The market assumptions we apply are specific to each asset
or liability.
|
|
u
|
Although we rely on our internal
calculations to compute the fair value of the securities we own, we
request and consider indications of value (marks) from third-party dealers
to assist us in our valuation process. The availability of third-party
marks continues to
decline, in part because some dealers no longer exist and others have
ceased providing client valuation services. For March 31, 2009, we
received dealer marks on 76% of our securities and 95% of our ABS issued.
In the aggregate, our internal valuations of the securities on
which we received dealer marks were 8% lower than the aggregate dealer
marks. Our internal valuations of our ABS issued on which we received
dealer marks were 6% higher than the aggregate dealer marks.
|
|
|
THE REDWOOD
REVIEW 1ST QUARTER 2009
|
35
|
|
|
|
|
|
RESIDENTIAL REAL ESTATE
SECURITIES
|
|
|
Redwood invests in securities that
are backed by pools of residential real estate loans. Most of our
investments in residential real estate securities are backed by prime
residential loans and
some are backed by Alt-A, Option ARM, and subprime loans. Our primary
focus when investing in residential real estate securities is to
understand the credit risk. Thus, historically, we primarily acquired
subordinated securities. More recently, our credit risk analysis has
been appropriate in understanding the range of risks and returns
applicable to senior securities and our acquisitions have been heavily
weighted in this type of security. The following discussion refers only to
the residential securities owned by Redwood,
exclusive of the securities owned by Sequoia, Acacia, and the Fund, and
exclusive of Redwood’s investments in these entities.
|
|
u
|
During the first quarter, we
invested $98 million in senior securities at a weighted average price of
63% of the face value and with average credit support of 11 percentage
points. More details about our securities are provided in the sections
that follow. We did
not acquire any subordinate securities in the first quarter. In the second
quarter through April 30, 2009, we invested $141 million in senior
securities at a weighted average price of 61% of the face value and with
an average credit support of 11 percentage points. We also invested $1
million in subordinate securities at a weighted average price of 15% of
face value.
|
|
u
|
Mortgage delinquencies continued
to rise and show no signs of improving. We still do not see any
improvement in underlying housing fundamentals. Based on a broad number of
parameters, credit deterioration was apparent across the board as an
increased number of
borrowers went delinquent.
|
|
u
|
Credit losses continue, although
the imposed moratorium on foreclosures delayed some of the anticipated
losses until later this
year.
|
|
u
|
Prepayment rates in the first
quarter were mixed with noticeable differences depending upon the credit worthiness
of the borrower. Prepayments on prime loans increased throughout the
quarter and ended the period at between 15-20% CPR — faster than the previous
quarter’s CPR of 10%. Higher quality Alt-a
loans also saw an uptick in prepayment rates throughout the
quarter, while lower quality Alt-a loans continued to prepay at more
recent slower levels. Option ARM and subprime borrowers continued to have
difficulties attempting to refinance their existing mortgages resulting in
slower prepayment rates during the quarter
to about 3% CPR.
|
|
u
|
At March 31, 2009, the unamortized
discount on our residential securities was $221 million, comprised of $152
million on prime securities and $69 million on non-prime
securities. This discount will be amortized into interest income
over the expected lives of the securities. The faster we are able to
recognize this discount, the higher the yield is on our investments. The
rate at which we recognize this discount as income is dependent on how
fast the underlying loans prepay — the faster the prepayments, the
higher the yield.
|
|
u
|
We expect that government stimulus
and intervention will have the effect of increasing prepayment rates
through lower mortgage rates and by making loans easier to obtain for many
borrowers, especially for prime loans. We do not anticipate any
material increase in
the prepayment speeds for non-prime loans. Refinancing activity
will be dependent on mortgage rates and numerous other factors including
the borrower’s credit worthiness, employment
status, equity in the property, and other debt obligations. It is difficult to accurately
project the extent of this impact and we continue to look at a range of
potential outcomes when making investment decisions.
|
|
36
|
THE REDWOOD
REVIEW 1ST QUARTER 2009
|
|
|
|
|
|
|
|
RESIDENTIAL REAL ESTATE
SECURITIES
|
|
u
|
The following table breaks out the
underlying loans of our prime residential securities by size, loan type,
and vintage.
|
|
Prime
Securities at Redwood
|
||||||||||||||||||||||||||||||||||||||||||||||||
|
Composition
by Product Type, Vintage, and Balance
|
||||||||||||||||||||||||||||||||||||||||||||||||
|
March
31, 2009
|
||||||||||||||||||||||||||||||||||||||||||||||||
|
<=
2004
|
2005
|
2006
|
2007
|
2008
|
Total
|
|||||||||||||||||||||||||||||||||||||||||||
|
Product
|
% of
Balance
|
Wtd
Avg Loan Rate
|
% of
Balance
|
Wtd
Avg Loan Rate
|
% of
Balance
|
Wtd
Avg Loan Rate
|
% of
Balance
|
Wtd
Avg Loan Rate
|
% of
Balance
|
Wtd
Avg Loan Rate
|
% of
Balance
|
Wtd
Avg Loan Rate
|
||||||||||||||||||||||||||||||||||||
|
Hybrid/ARM (a)
|
24 | % | 4.69 | % | 41 | % | 5.40 | % | 33 | % | 6.00 | % | 12 | % | 6.39 | % | 7 | % | 6.13 | % | 27 | % | 5.16 | % | ||||||||||||||||||||||||
|
Fixed
|
11 | % | 5.68 | % | 5 | % | 6.03 | % | 12 | % | 6.29 | % | 48 | % | 6.41 | % | 71 | % | 6.55 | % | 14 | % | 6.02 | % | ||||||||||||||||||||||||
|
Jumbo
|
35 | % | 46 | % | 45 | % | 60 | % | 78 | % | 41 | % | ||||||||||||||||||||||||||||||||||||
|
Hybrid/ARM (a)
|
36 | % | 4.82 | % | 47 | % | 5.48 | % | 41 | % | 6.03 | % | 7 | % | 6.40 | % | 2 | % | 6.37 | % | 35 | % | 5.19 | % | ||||||||||||||||||||||||
|
Fixed
|
29 | % | 5.66 | % | 7 | % | 6.02 | % | 14 | % | 6.25 | % | 33 | % | 6.40 | % | 20 | % | 6.50 | % | 24 | % | 5.82 | % | ||||||||||||||||||||||||
|
Conforming
|
65 | % | 54 | % | 55 | % | 40 | % | 22 | % | 59 | % | ||||||||||||||||||||||||||||||||||||
|
Totals
|
100 | % | 100 | % | 100 | % | 100 | % | 100 | % | 100 | % | ||||||||||||||||||||||||||||||||||||
|
(a)
|
ARMs represent
approximately 2% of our
portfolio.
|
|
u
|
The majority of the loans (59%)
underlying our securities are within the conforming size
limit. These loans that have a current balance below the existing Agency
size limits. These limits vary by county and are as high as $729,750.
|
|
u
|
The table above also provides the
weighted average coupon rates for the respective buckets. The
current fixed mortgage rate for a conforming Agency loan is 4.78%. As mortgage
rates decline, the attractiveness and ability of borrowers to refinance
increases.
|
|
u
|
Historically, jumbo fixed-rate
mortgages have been priced to a spread of roughly 0.25% above the Fannie
Mae and Freddie Mac conforming rate. Although the conforming rates
have declined to historical lows, current jumbo 30-year fixed-rate
mortgage spreads are over 1.25% resulting in unattractive jumbo mortgage
rates (see chart below).
|
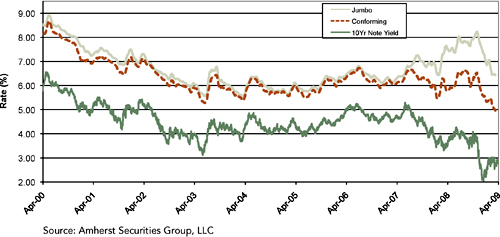
|
|
THE REDWOOD
REVIEW 1ST QUARTER 2009
|
37
|
|
|
|
|
|
RESIDENTIAL REAL ESTATE
SECURITIES
|
|
|
Residential prime securities are
mortgage-backed securities backed by prime residential mortgage loans.
Senior securities are those interests in a securitization that have the
first right to cash flows and are last in line to absorb losses.
Information on our
prime senior securities and underlying loan characteristics are set forth
in Tables 9, 10, 12, and 16 in the Financial Tables in this Review.
|
|
u
|
Total interest income generated by
our prime senior securities was $3 million in the first quarter, which produced an
annualized yield of 15% on our amortized cost of these securities.
|
|
u
|
During the first quarter, we
invested $50 million in prime senior securities. These securities were
purchased at a weighted average price of 67% of face value and average credit support
of 6 percentage points.
|
|
u
|
The following table presents
information on our residential prime senior securities at Redwood at March
31, 2009. Most of our senior securities are from 2005 and prior
vintages.
|
|
Credit
Support Analysis - Prime Senior Securities at Redwood
|
||||||||||||||||||||||||||||||||||||||||
|
By
Vintage
|
||||||||||||||||||||||||||||||||||||||||
|
March
31, 2009
|
||||||||||||||||||||||||||||||||||||||||
|
($
in millions)
|
||||||||||||||||||||||||||||||||||||||||
|
<=2004
|
2007
|
2006
|
2007
|
Total
|
||||||||||||||||||||||||||||||||||||
|
Amount
|
%
of loans
|
Amount
|
%
of loans
|
Amount
|
%
of loans
|
Amount
|
%
of loans
|
Amount
|
%
of loans
|
|||||||||||||||||||||||||||||||
|
Current
face
|
$ | 7 | $ | 116 | $ | 15 | $ | 22 | $ | 160 | ||||||||||||||||||||||||||||||
|
Net
unamortized discount
|
(2 | ) | (44 | ) | (9 | ) | (10 | ) | (65 | ) | ||||||||||||||||||||||||||||||
|
Credit
reserve
|
- | 0.00 | % | (1 | ) | 0.02 | % | - | 0.00 | % | - | 0.00 | % | (1 | ) | 0.01 | % | |||||||||||||||||||||||
|
Unrealized
gains (losses)
|
- | (4 | ) | (1 | ) | (1 | ) | (6 | ) | |||||||||||||||||||||||||||||||
|
Fair
value
|
$ | 5 | $ | 67 | $ | 5 | $ | 11 | $ | 88 | ||||||||||||||||||||||||||||||
|
Overall credit
protection to Prime Seniors
|
7.54 | % | 6.72 | % | 3.42 | % | 4.28 | % | 5.39 | % | ||||||||||||||||||||||||||||||
|
Serious delinq
as a % of collateral balance
|
11.43 | % | 3.79% | % | 1.23% | % | 2.68% | % | 3.20 | % | ||||||||||||||||||||||||||||||
|
Total
Prime Senior Securities
|
$ | 5 | $ | 67 | $ | 5 | $ | 11 | $ | 88 | ||||||||||||||||||||||||||||||
|
u
|
The overall credit protection data presented
in the table above represent the level of protection for the position
owned by Redwood. The credit reserve shows we currently expect minimal
losses on these securities. Over time, the performance of these securities
may require us to reassess the amount of
credit reserves we designate. We acquire securities assuming a range of
outcomes and believe our returns can still be attractive even if losses
increase above our current
estimates.
|
|
u
|
Comparing the level of credit
protection available to seriously delinquent loans provides a measure of
the low level of credit sensitivity that exists within our senior
securities portfolio. For example, a senior security may have 8 percentage
points of credit
protection while serious delinquencies are 6%. Assuming a historically
high 50% loss severity on these delinquencies would produce losses of 3%,
leaving enough credit support for an additional 5% of losses before the
senior security would absorb credit
losses.
|
|
38
|
THE REDWOOD
REVIEW 1ST QUARTER 2009
|
|
|
|
|
|
|
|
RESIDENTIAL REAL ESTATE
SECURITIES
|
|
|
Residential non-prime securities
are mortgage-backed securities backed by non-prime residential mortgage
loans. Non-prime residential loans include Alt-a, Option ARM, and
subprime mortgage
loans. Senior securities are those interests in a securitization that have
the first right to cash flows and are last in line to absorb losses.
Information on our non-prime senior securities and underlying loan
characteristics are set forth in Tables 9, 10, 12, and 16 in the
Financial Tables in this Review.
|
|
u
|
Total interest income generated by
our non-prime senior securities was $3 million in the first quarter, which
produced an annualized yield of 16% on our average amortized cost of these
securities.
|
|
u
|
During the first quarter, we
invested $48 million in non-prime senior securities. These Alt-a
securities were purchased at a weighted average price of 59% of face value
and average credit support of 15 percentage points.
|
|
u
|
The following table presents
information on our residential non-prime senior securities at Redwood at March 31, 2009. Most of
our non-prime senior securities are from 2005 and prior
vintages.
|
|
Credit
Support Analysis - Non-prime Senior Securities at Redwood
|
||||||||||||||||||||||||||||||||||||||||
|
By
Vintage
|
||||||||||||||||||||||||||||||||||||||||
|
March
31, 2009
|
||||||||||||||||||||||||||||||||||||||||
|
($
in millions)
|
||||||||||||||||||||||||||||||||||||||||
|
<=2004
|
2005
|
2006
|
2007
|
Total
|
||||||||||||||||||||||||||||||||||||
|
Amount
|
%
of loans
|
Amount
|
%
of loans
|
Amount
|
%
of loans
|
Amount
|
%
of loans
|
Amount
|
%
of loans
|
|||||||||||||||||||||||||||||||
|
Current
face
|
$ | 43 | $ | 98 | $ | 16 | $ | 17 | $ | 174 | ||||||||||||||||||||||||||||||
|
Net
unamortized discount
|
(15 | ) | (42 | ) | (11 | ) | (2 | ) | (70 | ) | ||||||||||||||||||||||||||||||
|
Credit
reserve
|
- | 0.00 | % | (4 | ) | 0.05 | % | - | 0.00 | % | - | 0.00 | % | (4 | ) | 0.04 | % | |||||||||||||||||||||||
|
Unrealized gains (losses)
|
(2 | ) | (15 | ) | (1 | ) | (9 | ) | (27 | ) | ||||||||||||||||||||||||||||||
|
Fair value
|
$ | 26 | $ | 37 | $ | 4 | $ | 6 | $ | 73 | ||||||||||||||||||||||||||||||
|
Overall
credit protection to Non-Prime Seniors
|
21.52 | % | 32.75 | % | 36.88 | % | 43.50 | % | 33.64 | % | ||||||||||||||||||||||||||||||
|
Serious
delinq as a % of collateral balance
|
14.92 | % | 15.89 | % | 18.13 | % | 44.16 | % | 19.31 | % | ||||||||||||||||||||||||||||||
|
Fair Value of Prime trading Senior Securities
|
$ | - | $ | - | $ | - | $ | 1 | $ | 1 | ||||||||||||||||||||||||||||||
|
Total Prime Senior Securities
|
$ | 26 | $ | 37 | $ | 4 | $ | 7 | $ | 74 | ||||||||||||||||||||||||||||||
|
u
|
At March 31, 2009, the fair value
of our senior non-prime securities backed by Alt-a loans is $51 million,
by Option ARMs is $17 million, and by subprime loans is $6 million.
|
|
u
|
Serious delinquencies in our
non-prime senior portfolio are significantly higher than in our prime
senior portfolio. However, the levels of credit and structural protection
are also significantly higher and, as a result, our non-prime senior portfolio can
withstand higher levels of credit losses. [Please see the discussion on
page 38 on comparing the level of credit support to serious
delinquencies.]
|
|
|
THE REDWOOD
REVIEW 1ST QUARTER 2009
|
39
|
|
|
|
|
|
RESIDENTIAL REAL ESTATE
SECURITIES
|
|
|
Subordinate securities are the interests in a
securitization that are not senior interests. Residential subordinate
securities owned at Redwood are backed by prime and non-prime residential
loans. Non-prime residential loans include Option ARM, and subprime
mortgage loans. Information on our subordinate
securities and underlying loan characteristics are set forth in Tables 9,
10, 12, and 16 in the Financial Tables in this Review. The following
discussion reflects only the subordinate securities at Redwood, exclusive
of subordinate securities owned by Acacia
or the Fund.
|
|
u
|
Total interest income generated by
our subordinate securities was $15 million in the first quarter, which
produced an annualized yield of 117% on our amortized
cost.
|
|
u
|
Total cash generated from our
subordinated securities was $28 million in the first quarter.
|
|
u
|
We did not acquire any subordinate
securities in the first
quarter.
|
|
u
|
The following table presents
information on our residential subordinate securities at Redwood at March
31, 2009, by their priority to absorb losses with their respective
securitization.
|
|
Residential
Subordinate Securities at Redwood
|
||||||||||||||||||||||||||||||||||||
|
By
Loss Ranking and Vintage
|
||||||||||||||||||||||||||||||||||||
|
March
31, 2009
|
||||||||||||||||||||||||||||||||||||
|
($
in millions)
|
||||||||||||||||||||||||||||||||||||
|
<2004
|
2005-2008
|
Total
|
||||||||||||||||||||||||||||||||||
|
Face
|
Credit
Reserve
|
Market
Value
|
Face
|
Credit
Reserve
|
Market
Value
|
Face
|
Credit
Reserve
|
Market
Value
|
||||||||||||||||||||||||||||
|
Loss
rank
|
||||||||||||||||||||||||||||||||||||
|
6th
|
$ | 22 | $ | 0 | $ | 5 | $ | 73 | $ | 46 | $ | 5 | $ | 95 | $ | 46 | $ | 10 | ||||||||||||||||||
|
5th
|
23 | 3 | 2 | 63 | 48 | 1 | 86 | 51 | 3 | |||||||||||||||||||||||||||
|
4th
|
16 | 7 | 2 | 36 | 31 | 1 | 52 | 38 | 3 | |||||||||||||||||||||||||||
|
3rd
|
44 | 27 | 4 | 113 | 109 | 1 | 157 | 136 | 5 | |||||||||||||||||||||||||||
|
2nd
|
39 | 27 | 3 | 97 | 97 | 1 | 136 | 124 | 4 | |||||||||||||||||||||||||||
|
1st
|
111 | 93 | 6 | 110 | 109 | 2 | 221 | 202 | 8 | |||||||||||||||||||||||||||
|
Total
|
$ | 255 | $ | 157 | $ | 22 | $ | 492 | $ | 440 | $ | 11 | $ | 747 | $ | 597 | $ | 33 | ||||||||||||||||||
|
u
|
Our subordinate securities
portfolio consists of 30% of securities in the sixth loss position
(comparable to an originally rated AA security), 45% of securities in the
fifth through second loss positions, and 25% in the first loss
positions.
|
|
u
|
For our securities in a sixth loss
position, the average credit enhancement supporting those securities is
4%.
|
|
u
|
Credit losses on our subordinate
securities were $137 million in the first quarter, an increase from $102
million in the fourth quarter. For tax purposes, losses on
our subordinate securities were $53 million ($0.87 per share). The loss
for tax purposes is less than the principal value of credit losses
incurred on the underlying loans as we own most of our credit sensitive
securities at a tax basis that is substantially
less than par value. Credit expectations for our portfolio of subordinate
securities did not materially change during the first
quarter.
|
|
40
|
THE REDWOOD
REVIEW 1ST QUARTER 2009
|
|
|
|
|
|
|
COMMERCIAL REAL ESTATE
SECURITIES
|
|
|
We invest in securities that are
backed by pools of commercial real estate loans. All of our existing
commercial investments are subordinated securities. Information on our
commercial securities and underlying loan characteristics can be
found in Tables 14 and 15. The following discussion
refers only to the commercial securities owned by Redwood, exclusive of
commercial securities owned by Acacia.
|
|
u
|
While generally lagging the recent
decline in the economy, deterioration in commercial real estate loans is
now readily apparent, evidenced by rapid growth in delinquency rates.
Industry-wide, CMBS delinquency (30+ days) was 1.80% at the end of the
first quarter,
representing a 67 basis point increase from December 31, 2008, and a 133
basis point increase from March 31,
2008.
|
|
u
|
With the securitization market
closed, and lending from banks and insurers significantly curtailed, the
amount of commercial real estate loans that borrowers are
seeking to refinance vastly outstrips the lending ability or inclination
of lenders. Due to the expected declines in property cash flow and
property value and the expected reversion of lenders to more conservative
loan underwriting standards, it remains
unclear how many loans will find new financing, even in a healthy
financing environment.
|
|
u
|
Prices on senior securities were
volatile during the first quarter of 2009. The combination of a steady
stream of negative commercial real estate headlines and the emergence of
new government programs specifically addressing the secondary CMBS market
served to add to the
uncertainty and price volatility. Prices on senior securities declined for
most of the quarter, bottoming in early March at 20% to 25% below year-end
levels. In response to the announcement of government initiatives
including TALF and PPIP late in the first quarter
prices for senior securities began to
rise.
|
|
u
|
In contrast to recent price
increases in senior commercial securities, prices on subordinate or credit
sensitive bonds dropped persistently over the course of the quarter due to
credit concerns, ratings downgrades, and ineligibility for leverage
provided by
government programs.
|
|
|
THE REDWOOD
REVIEW 1ST QUARTER 2009
|
41
|
|
|
|
|
|
COMMERCIAL REAL ESTATE
SECURITIES
|
|
u
|
Our commercial securities
generated $5 million of cash flow during the first
quarter.
|
|
u
|
The timing of anticipated credit
losses are the key determinant of our future returns. Structural
considerations specific to CMBS, such as bond interest
shortfalls due to property appraisal reductions, will also impact the
timing of interest cash flows and affect our returns. (An appraisal
reduction is a mechanism that prevents the bond servicer from
over-advancing interest on seriously delinquent loans
with high potential loss severities). Due to existing and anticipated
appraisal reductions on delinquent loans and other factors, we expect the
cash flow generated from our bonds to be less stable in the future.
|
|
u
|
The fair value of our commercial
securities decreased to $23 million in the first quarter from $42 million
in the fourth quarter. The fair value of our commercial subordinated
securities was equal to 4% of the $512 million face value at March 31,
2009 and was valued
assuming the receipt only of several quarters’ interest cash
flows.
|
|
u
|
The following table presents our
commercial securities portfolio by
vintage.
|
|
Credit
Support Analysis - Commercial Portfolio
|
||||||||||||||||||||||||||||||||||||||||
|
By
Vintage
|
||||||||||||||||||||||||||||||||||||||||
|
March
31, 2009
|
||||||||||||||||||||||||||||||||||||||||
|
($
in millions)
|
||||||||||||||||||||||||||||||||||||||||
|
<=2004
|
2005
|
2006
|
2007
|
Total
|
||||||||||||||||||||||||||||||||||||
|
Amount
|
%
of loans
|
Amount
|
%
of loans
|
Amount
|
%
of loans
|
Amount
|
%
of loans
|
Amount
|
%
of loans
|
|||||||||||||||||||||||||||||||
|
Face
|
$ | 48 | $ | 123 | $ | 261 | $ | 80 | $ | 512 | ||||||||||||||||||||||||||||||
|
Unamortized discount
|
(6 | ) | 5 | 10 | 5 | 14 | ||||||||||||||||||||||||||||||||||
|
Discount designated as credit reserve
|
(34 | ) | 0.21 | % | (123 | ) | 0.60 | % | (261 | ) | 0.44 | % | (80 | ) | 0.23 | % | (498 | ) | 0.38 | % | ||||||||||||||||||||
|
Unrealized gains (losses)
|
1 | (1 | ) | (3 | ) | (2 | ) | (5 | ) | |||||||||||||||||||||||||||||||
|
Fair value
|
$ | 9 | $ | 4 | $ | 7 | $ | 3 | $ | 23 | ||||||||||||||||||||||||||||||
|
Overall
credit protection to subordinate CMBS
|
2.31 | % | 0.00 | % | 1.27 | % | 1.44 | % | 1.24 | % | ||||||||||||||||||||||||||||||
|
Serious
delinq as a % of collateral balance
|
0.52 | % | 1.13 | % | 1.39 | % | 2.97 | % | 1.66 | % | ||||||||||||||||||||||||||||||
|
u
|
The $48 billion of loans backing
our
commercial securities
are fixed-rate, and typically have 5- to 10-year terms. The loans
are diverse in size, property type, and geographic location. Only 4% of
these loans mature in 2009.
|
|
u
|
In line with the broader CMBS
market, credit performance of our commercial portfolio continued to weaken
during the first
quarter. At March 31, 2009, serious delinquencies (60+ days) were $684
million, or 1.41% of the $48 billion of collateral loans, an increase from
1.15% at December 31, 2008.
|
|
u
|
Realized credit losses on our
commercial securities of $2 million were charged against our designated
credit reserve during the first quarter. For tax purposes, our deduction
for these realized losses was $1 million. This deduction is less than the
principal value of credit losses incurred on the underlying loans, as we
own our commercial securities at a tax
basis that is substantially less than par
value.
|
|
42
|
THE REDWOOD
REVIEW 1ST QUARTER 2009
|
|
|
|
|
|
|
INVESTMENTS IN
SEQUOIA
|
|
|
Sequoia entities are independent
securitization entities that acquire residential mortgage loans and create
and issue ABS backed
by these loans. The vast majority of the loans that Sequoia entities
acquire are prime-quality loans. Most of the senior securities created by
Sequoia were sold to third-party investors. Redwood acquired most of the
subordinated securities and acquired most of the IOs for securitizations
issued before 2006. Although Redwood’s investment in Sequoia entities
is relatively small and limited, the loans and ABS issued by Sequoia are
shown on our consolidated financial statements. Redwood’s investments in these entities do not appear on our
balance sheet as an asset; rather, they are reflected as the difference
between the consolidated assets of Sequoia and the consolidated Sequoia
ABS issued to third parties.
|
|
|
Redwood’s credit risk is generally limited
to its investment in
the subordinated securities Redwood acquired from the Sequoia entities.
Each Sequoia entity is independent from the others, thus the performance
of any one Sequoia entity does not affect any other Sequoia
entity.
|
|
|
Information on underlying loan
characteristics in
the Sequoia securitization entities can be found in Tables 11 and
13.
|
|
u
|
Cash generated by our investments
in Sequoia increased in the first quarter to $18 million, compared to $9
million in the fourth quarter of 2008. As expected, with LIBOR declining
rapidly in the fourth quarter, the funding costs for the Sequoia ABS
issued declined faster than the yields on the loans, which increased the
cash distributed to our IO securities. As loan coupons continue to reset
at lower LIBOR rates, we expect IO cash
flows will trend lower in the following quarters.
|
|
u
|
As discussed in prior Reviews,
loans underlying the Sequoia securitizations from 2006 and 2007 are
performing worse than our expectations. At March 31, 2009, our loan loss
reserve was $48 million, or 1.06% of the current loan balance, an increase
of $12 million during
the quarter. For one of these securitizations, our loan loss reserve
exceeds our investment in the entity (by $15 million at March 31, 2009).
Upon the occurrence of certain events (including the sale or legal
extinguishment of our interests in the Sequoia entity) which may
occur in the second quarter, we will be permitted to deconsolidate that
entity and, upon deconsolidation, would record a gain to the extent of the
excess loan loss reserve.
|
|
u
|
No Sequoia deconsolidation event
occurred in the first quarter. In the fourth quarter, we sold our
interests three Sequoia securitization entities and recognized a fourth
quarter deconsolidation gain of $12
million.
|
|
u
|
Serious delinquencies, which
include loans
delinquent for more than 90 days and in foreclosure, were $157 million and
$120 million as of March 31, 2009 and December 31, 2008, respectively. As
a percent of current balances, serious delinquencies totaled 3.50% and
2.61% at March 31, 2009, and December 31, 2008,
respectively, as serious delinquencies increased across all vintages.
|
|
|
THE REDWOOD
REVIEW 1ST QUARTER 2009
|
43
|
|
|
|
|
|
INVESTMENTS IN
SEQUOIA
|
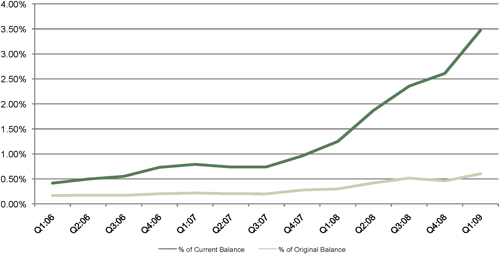
|
u
|
The GAAP book value of
Redwood’s investments in Sequoia was $70
million at March 31, 2009. This is reflected on our balance sheet as the
difference between residential loans of $4.6 billion and ABS issued of
$4.5 billion. Both the loans and ABS issued are carried on our consolidated
balance sheet at their amortized cost basis. We ended the quarter with a
net premium of $60 million on a $4.5 billion principal loan balance, for
an average basis of 101.47. With LIBOR relatively stable in the first
quarter, we expect our premium amortization
expense in the second quarter to trend down from $8 million in
the first quarter.
|
|
u
|
The estimated economic value of
Sequoia securities that Redwood owned at March 31, 2009, was $61 million,
consisting of $57 million of IOs, $3 million of subordinated securities,
and $1 million of senior securities. We used the same valuation process
to value these
Sequoia securities as we did for third-party securities. Our tax basis in
these IOs is $33 million.
|
|
u
|
Our IOs have no credit risk and
significant prepayment risk. These IOs earn the “spread” between the coupon rate on the
$2.7 billion notional
amount of underlying adjustable rate mortgage loans (indexed to one- and
six-month LIBOR) and the cost of funds (indexed to one-month LIBOR) on the
ABS issued within each respective securitization entity. Returns on these
investments increase when prepayments slow and decrease when
prepayments speed up. The accompanying table shows the declining
prepayment speeds for the residential loans at Sequoia over the past
several quarters.
|
Residential Loans at
Sequoia
Prepayment
Speeds
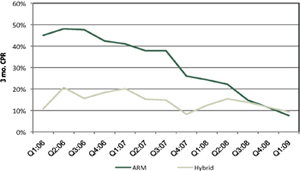 |
|
u
|
The low prepayment rates on ARMs
at Sequoia reflect that they are largely indexed to LIBOR. At March 31,
2009, these loans had a weighted average coupon of
3.62%.
|
|
44
|
THE REDWOOD
REVIEW 1ST QUARTER 2009
|
|
|
|
|
|
|
INVESTMENTS IN
ACACIA
|
|
|
Our investments in Acacia include
equity interests and
other securities in the Acacia CDO entities we sponsor. We also receive
asset management fees that are paid to us as first or senior priority from
the cash flows of the Acacia
assets.
|
|
u
|
During the first quarter, we
received cash
distributions of $1 million from our equity interests and ABS investments
in Acacia. We also received $1 million of management
fees.
|
|
u
|
Our reported GAAP value for our
investments in Acacia was $7 million while our estimate of the economic
value of those
investments was $5 million, down from $9 million in the prior quarter.
|
|
u
|
We valued our Acacia ABS
investments at 1% of face value, which is our estimate of bid-side value.
Our investment in
Acacia represents 1%
of our capital at March 31,
2009.
|
|
u
|
The table below shows the
components of management’s estimate of economic value for
our investment in Acacia as of the end of the first quarter of
2009.
|
|
Investment
in Acacia
|
||||||||
|
Management's
Estimate of
|
||||||||
|
Economic
Value
|
||||||||
|
($
in millions)
|
||||||||
|
March
31,
|
December
31,
|
|||||||
|
2009
|
2008
|
|||||||
|
Management
fees
|
$ | 4 | $ | 5 | ||||
|
ABS
|
1 | 4 | ||||||
|
Preference
shares
|
- | - | ||||||
|
Total
|
$ | 5 | $ | 9 | ||||
|
u
|
Our economic value includes the
net present value of anticipated management fees (discounted at 45%) of $4
million.
|
|
u
|
As noted in prior Reviews,
collateral rating downgrades by credit rating agencies have now shut off the cash flows on
all but one equity investment in Acacia, which we expect will be shut off
over the next few months. We project no future cash distributions on any
of our equity investments in Acacia and we valued these investments at
zero.
|
|
|
THE REDWOOD
REVIEW 1ST QUARTER 2009
|
45
|
|
46
|
THE REDWOOD
REVIEW 1ST QUARTER 2009
|

|
|
|
|
|
ACCOUNTING
DISCUSSION
|
|
u
|
The rules regarding MTM accounting
are complex, may not be consistent across portfolios or clearly reflect
the underlying economics, and continue to change. This accounting
discussion is intended to provide investors with a better understanding of
the impact of MTM
adjustments on our reported results.
|
|
u
|
MTM adjustments can result from
changes in fair values caused either by a change in expected cash flows
(i.e., increased credit loss estimates that reduce expected cash flows), a
change in market discount rates (i.e., the market
requires a greater risk premium and/or interest rates rise), or a
combination of both. MTM adjustments may be recognized through the income
statement or through the balance
sheet.
|
|
u
|
At Redwood, where we hold most of
our securities as
available-for-sale (AFS) for accounting purposes, other-than-temporary MTM
changes flow through our income statement while MTM changes that are
temporary are charged to equity.
|
|
u
|
Subordinate and most senior
securities held at Redwood and the real estate securities held by the Fund
are accounted for as AFS securities. We carry AFS securities on our
balance sheet at their fair value. Positive changes in the fair value of
AFS securities from period to period are always accounted for as increases
to stockholders’ equity and do not flow through
our income statement. Accounting for negative changes in the fair value of
AFS securities from period to period requires a three-step process
involving a combination of quantitative and judgmental evaluations.
The ultimate purpose of this process
is to determine whether and how much of the negative MTM adjustments
represent “other-than-temporary” (permanent) impairments, which
flow through our income statement, or whether or how much of the negative
MTM adjustments represent “temporary” impairments, which are recorded
as a reduction of stockholders’ equity and do not flow through
our income statement. New accounting guidelines that we will adopt in the
second quarter of 2009 change this three-step process, as
further described
below.
|
|
u
|
For the Sequoia entities, we
generally consolidate the loans and liabilities, which are reported at
amortized cost, except for REO, which are reported at the lower of cost or
fair value.
|
|
u
|
For accounting purposes, we
consolidate the balance sheets and income
statements of the Acacia securitization entities. On January 1, 2008, we
adopted a new accounting standard, FAS 159, and elected to fair value both
the assets and liabilities of the Acacia entities. All changes in fair
value for securities, derivatives, or
liabilities accounted for as trading instruments or under the fair value
option of FAS 159 flow through the income statement. These adjustments can
have a positive or negative impact on income in any period.
|
|
48
|
THE REDWOOD
REVIEW 1ST QUARTER 2009
|
|
|
||
|
|
ACCOUNTING
DISCUSSION
|
|
u
|
The diagram below and the
narrative discussion that follows address the current three-step process
for evaluating impairments on AFS
securities.
|
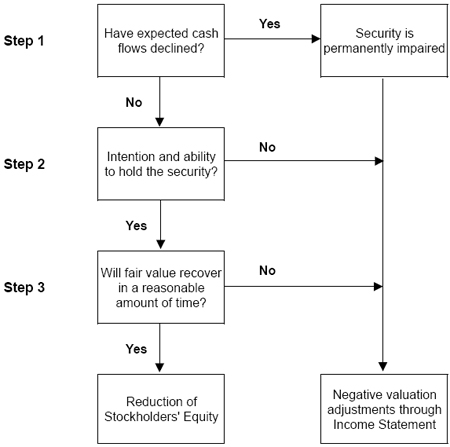
|
u
|
The first step is to determine
whether there has been an adverse change in the underlying cash flows
generated by the
security. A security is considered permanently impaired even if the change
in projected cash flows is small relative to the resulting MTM
adjustment.
|
|
u
|
The second step is to determine
whether we have the ability and intention to hold the security.
|
|
u
|
The third step requires us to
evaluate whether an impaired security will recover in value within a
reasonable period of time. This step is very subjective, particularly when
there is turmoil and uncertainty in the capital
markets.
|
|
u
|
AFS securities deemed permanently impaired
for accounting purposes may recover in value in future periods. If the
value of an impaired security does recover we cannot include positive MTM
adjustments in our income statement. Instead, we would recognize this
benefit through higher interest yields
over time. However, the new accounting standards limit the amount we will
be able to recognize on any security that has been impaired to date, as
further discussed below.
|
|
THE REDWOOD
REVIEW 1ST QUARTER 2009
|
49
|
|
|
||
|
ACCOUNTING
DISCUSSION
|
|
u
|
On April 9, 2009, the FASB issued
two new financial statement positions (FSPs) that address the
determination of fair values and assessments of other-than-temporary
impairments. We will apply these new FSPs beginning in the second quarter
of 2009.
|
|
u
|
FSP FAS 157-4 clarifies the process
for establishing market values when there has been a significant decrease
in market activity for an asset or liability and quoted prices are from
associated transactions that are not orderly. This statement does not
change the “exit price” objective of fair value
measurement, but does provide additional guidance on how to determine if a
market is inactive and whether an alternative valuation approach is
appropriate. Based upon the criteria set forth in FSP FAS 157-4, we
do not believe that our valuation
process will change significantly as our current process for assessing
market inputs appropriately considers the criteria set forth by the new
FSP for determining when a market is inactive, such as high volatility,
wide bid/ask spreads, lack of observable
trades, and other factors.
|
|
u
|
FSP FAS 115-2 changes the
three-step process for evaluating impairments on securities we own. The
following diagram outlines the new process we will follow beginning in the
second quarter of 2009.
|
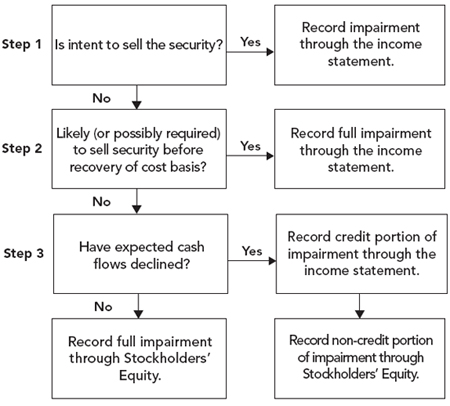
|
u
|
The first step is to determine
whether we have the intention to sell the security. If
so, we record the entire difference between fair value and our cost basis
through our income
statement.
|
|
u
|
The second step is to ascertain
whether we would be required to sell the security before it recovers in
value. If we would be
required to sell, then the entire MTM adjustment is taken through the
income statement. It should be noted that since we generally own our
securities with equity (including long-term debt), we would not expect to
be required to sell our securities.
|
|
50
|
THE REDWOOD
REVIEW 1ST QUARTER 2009
|
|
|
||
|
|
ACCOUNTING
DISCUSSION
|
|
u
|
The third step is to compare the
present value of expected future cash flows from the security to its
amortized cost. The discount rate used in this analysis is equal to the
previous yield expected to be earned on the
asset.
|
|
•
|
If the present value
is greater than
amortized cost, there is no other-than-temporary impairment and MTM
adjustments are recorded through the balance
sheet.
|
|
•
|
If the present value is less than
the amortized cost, there is other-than-temporary impairment. The amount
of the impairment is
then separated into:
|
|
-
|
the amount relating to credit loss
and this is recognized through MVA in the income statement,
and
|
|
-
|
the amount relating to all other
factors and this is recognized in other comprehensive income in the
balance sheet.
|
|
u
|
We expect this portion of this
impairment FSP to have a positive impact on our future reported earnings
as it is likely that the amount of impairment charges we recognize through
the income statement will be less in future periods than it would have
been prior to this
new accounting guideline since, a portion of the decline in fair values
relates to non-credit
issues.
|
|
u
|
However, there is a portion of
this impairment FSP that will have a negative impact on our future
reported income. Upon adoption of FSP FAS 115-2, a cumulative effect
transition adjustment is required to reclassify the non-credit portion of
any other-than-temporary impairments previously recorded through earnings
to accumulated other comprehensive income (OCI) for investments held as
of the beginning of the period of
adoption. The cumulative effect adjustment is determined based on the
difference between the present value of the cash flows expected to be
collected and the amortized cost basis of the debt security as of the
beginning of the period of adoption.
|
|
u
|
The reclassification of the
non-credit portion previous impairments recorded through our income
statement to OCI will have an adverse effect on Redwood’s future reported earnings as we
will no longer benefit from any recovery in our securities related to market
liquidity (i.e., discount rates), through our income statement. Unlike
banks and other regulated financial institutions that will receive
regulatory capital relief as a result of reclassifying impairments and
increasing retained earnings (i.e., “Tier 1 Capital”), Redwood is not regulated and
will not benefit from this
reclassification.
|
|
THE REDWOOD
REVIEW 1ST QUARTER 2009
|
51
|
|
|
|
|
|
GLOSSARY
|
|
52
|
THE REDWOOD
REVIEW 1ST QUARTER 2009
|
|
|
|
|
|
|
ACCOUNTING
DISCUSSION
|
|
THE REDWOOD
REVIEW 1ST QUARTER 2009
|
53
|
|
|
|
|
|
GLOSSARY
|
|
54
|
THE REDWOOD
REVIEW 1ST QUARTER 2009
|
|
|
|
|
|
|
ACCOUNTING
DISCUSSION
|
|
THE REDWOOD
REVIEW 1ST QUARTER 2009
|
55
|
|
|
|
|
|
GLOSSARY
|
|
56
|
THE REDWOOD
REVIEW 1ST QUARTER 2009
|
|
|
|
|
|
|
ACCOUNTING
DISCUSSION
|
|
THE REDWOOD
REVIEW 1ST QUARTER 2009
|
57
|
|
|
|
|
|
GLOSSARY
|
|
58
|
THE REDWOOD
REVIEW 1ST QUARTER 2009
|

|
|
Table 1: GAAP Earnings ($ in
thousands, except per share data)
|
60
|
|
Full
|
Full
|
|||||||||||||||||||||||||||||||||||||||||||
|
2009
|
2008
|
2008
|
2008
|
2008
|
2007
|
2007
|
2007
|
2007
|
Year
|
Year
|
||||||||||||||||||||||||||||||||||
|
Q1
|
Q4
|
Q3
|
Q2
|
Q1
|
Q4
|
Q3
|
Q2
|
Q1
|
2008
|
2007
|
||||||||||||||||||||||||||||||||||
|
Interest
income
|
$ | 83,903 | $ | 124,452 | $ | 126,227 | $ | 140,445 | $ | 171,976 | $ | 193,728 | $ | 207,023 | $ | 208,708 | $ | 210,372 | $ | 563,101 | $ | 819,831 | ||||||||||||||||||||||
|
(Premium)
discount amortization on securities, net
|
4,918 | (1,189 | ) | 7,850 | 6,258 | 10,864 | 18,869 | 20,514 | 23,849 | 20,268 | 23,783 | 83,500 | ||||||||||||||||||||||||||||||||
|
Other
investment interest income
|
76 | 572 | 487 | 514 | 732 | 984 | 1,143 | 464 | - | 2,305 | 2,591 | |||||||||||||||||||||||||||||||||
|
Premium
amortization expense on loans
|
(7,459 | ) | (547 | ) | (3,372 | ) | (10,215 | ) | (7,509 | ) | (6,656 | ) | (8,349 | ) | (10,863 | ) | (11,705 | ) | (21,643 | ) | (37,573 | ) | ||||||||||||||||||||||
|
Total
interest income
|
81,438 | 123,288 | 131,192 | 137,002 | 176,063 | 206,925 | 220,331 | 222,158 | 218,935 | 567,545 | 868,349 | |||||||||||||||||||||||||||||||||
|
Interest
on short-term debt
|
- | (3 | ) | (65 | ) | (68 | ) | (182 | ) | (377 | ) | (5,858 | ) | (22,700 | ) | (31,094 | ) | (318 | ) | (60,029 | ) | |||||||||||||||||||||||
|
ABS
interest expense
|
(44,518 | ) | (94,430 | ) | (88,294 | ) | (93,994 | ) | (123,586 | ) | (147,799 | ) | (155,661 | ) | (140,512 | ) | (131,393 | ) | (400,304 | ) | (575,365 | ) | ||||||||||||||||||||||
|
ABS
issuance expense amortization
|
(553 | ) | (1,470 | ) | (930 | ) | (1,921 | ) | (2,093 | ) | (4,644 | ) | (4,616 | ) | (5,681 | ) | (7,068 | ) | (6,414 | ) | (22,009 | ) | ||||||||||||||||||||||
|
ABS
interest rate agreement (expense) income
|
(1,098 | ) | (1,934 | ) | (1,259 | ) | (1,246 | ) | (1,245 | ) | 1,265 | 1,959 | 3,358 | 1,646 | (5,684 | ) | 8,228 | |||||||||||||||||||||||||||
|
ABS
issuance premium amortization income
|
335 | 476 | 557 | 1,955 | 2,183 | 1,930 | 2,096 | 2,294 | 1,869 | 5,171 | 8,189 | |||||||||||||||||||||||||||||||||
|
Total
ABS expense consolidated from trusts
|
(45,834 | ) | (97,358 | ) | (89,926 | ) | (95,206 | ) | (124,741 | ) | (149,248 | ) | (156,222 | ) | (140,541 | ) | (134,946 | ) | (407,231 | ) | (580,957 | ) | ||||||||||||||||||||||
|
Interest
expense on long-term debt
|
(1,808 | ) | (2,344 | ) | (2,164 | ) | (2,233 | ) | (2,534 | ) | (3,055 | ) | (3,150 | ) | (2,516 | ) | (2,056 | ) | (9,275 | ) | (10,777 | ) | ||||||||||||||||||||||
|
Net
interest income
|
33,796 | 23,583 | 39,037 | 39,495 | 48,606 | 54,245 | 55,101 | 56,401 | 50,839 | 150,721 | 216,586 | |||||||||||||||||||||||||||||||||
|
Provision
for credit reserve
|
(16,032 | ) | (18,659 | ) | (18,333 | ) | (10,061 | ) | (8,058 | ) | (4,972 | ) | (1,507 | ) | (2,500 | ) | (3,829 | ) | (55,111 | ) | (12,808 | ) | ||||||||||||||||||||||
|
Market
valuation adjustments, net
|
(43,242 | ) | (111,331 | ) | (127,157 | ) | (60,619 | ) | (193,780 | ) | (1,118,989 | ) | (102,766 | ) | (29,430 | ) | (10,264 | ) | (492,887 | ) | (1,261,449 | ) | ||||||||||||||||||||||
|
Net
interest (loss) income after provision
and
market
valuation adjustments
|
(25,478 | ) | (106,407 | ) | (106,453 | ) | (31,185 | ) | (153,232 | ) | (1,069,716 | ) | (49,172 | ) | 24,471 | 36,746 | (397,277 | ) | (1,057,671 | ) | ||||||||||||||||||||||||
|
Fixed
compensation expense
|
(4,028 | ) | (3,575 | ) | (4,331 | ) | (4,648 | ) | (5,674 | ) | (4,316 | ) | (4,560 | ) | (4,286 | ) | (4,616 | ) | (18,228 | ) | (17,778 | ) | ||||||||||||||||||||||
|
Variable
compensation expense
|
(556 | ) | 418 | (616 | ) | (330 | ) | (1,857 | ) | (434 | ) | 1,096 | (198 | ) | (2,251 | ) | (2,385 | ) | (1,787 | ) | ||||||||||||||||||||||||
|
Equity
compensation expense
|
(1,795 | ) | (2,377 | ) | (3,080 | ) | (3,502 | ) | (3,306 | ) | (2,767 | ) | (2,593 | ) | (3,540 | ) | (3,349 | ) | (12,265 | ) | (12,249 | ) | ||||||||||||||||||||||
|
Severance
expense
|
(28 | ) | (1,814 | ) | - | - | - | (1,340 | ) | - | - | (2,380 | ) | (1,814 | ) | (3,720 | ) | |||||||||||||||||||||||||||
|
Other
operating expense
|
(4,125 | ) | (5,941 | ) | (8,795 | ) | (5,767 | ) | (5,496 | ) | (7,337 | ) | (5,455 | ) | (4,670 | ) | (4,479 | ) | (25,999 | ) | (21,941 | ) | ||||||||||||||||||||||
|
Due
diligence expenses
|
(7 | ) | (13 | ) | (29 | ) | (8 | ) | (10 | ) | (75 | ) | (220 | ) | (78 | ) | (707 | ) | (60 | ) | (1,080 | ) | ||||||||||||||||||||||
|
Total
operating expenses
|
(10,539 | ) | (13,302 | ) | (16,851 | ) | (14,255 | ) | (16,343 | ) | (16,269 | ) | (11,732 | ) | (12,772 | ) | (17,782 | ) | (60,751 | ) | (58,555 | ) | ||||||||||||||||||||||
|
Realized
gains (losses) on sales, net
|
462 | 5,671 | (15 | ) | 2,909 | (3 | ) | 7,199 | (1,460 | ) | 1,428 | 303 | 8,562 | 7,470 | ||||||||||||||||||||||||||||||
|
Realized
(losses) gains on calls, net
|
- | - | (39 | ) | (72 | ) | 45 | (126 | ) | 3,284 | 1,310 | 843 | (66 | ) | 5,311 | |||||||||||||||||||||||||||||
|
Realized
gains (losses), net
|
462 | 5,671 | (54 | ) | 2,837 | 42 | 7,073 | 1,824 | 2,738 | 1,146 | 8,496 | 12,781 | ||||||||||||||||||||||||||||||||
|
Noncontrolling
interest
|
716 | 2,366 | 2,194 | (2,369 | ) | (254 | ) | - | - | - | - | 1,937 | - | |||||||||||||||||||||||||||||||
|
(Provision)
credit for income taxes
|
(105 | ) | (3,914 | ) | 9,860 | (937 | ) | (1,800 | ) | 1,467 | (1,837 | ) | (3,021 | ) | (1,801 | ) | 3,209 | (5,192 | ) | |||||||||||||||||||||||||
|
Net
(loss) income
|
$ | (34,944 | ) | $ | (115,586 | ) | $ | (111,304 | ) | $ | (45,909 | ) | $ | (171,587 | ) | $ | (1,077,445 | ) | $ | (60,917 | ) | $ | 11,416 | $ | 18,309 | $ | (444,386 | ) | $ | (1,108,637 | ) | |||||||||||||
|
Diluted
average shares
|
53,632 | 33,366 | 33,334 | 32,871 | 32,511 | 29,531 | 27,892 | 28,165 | 27,684 | 33,023 | 27,928 | |||||||||||||||||||||||||||||||||
|
Net
(loss) income per share
|
$ | (0.65 | ) | $ | (3.46 | ) | $ | (3.34 | ) | $ | (1.40 | ) | $ | (5.28 | ) | $ | (36.49 | ) | $ | (2.18 | ) | $ | 0.41 | $ | 0.66 | $ | (13.46 | ) | $ | (39.70 | ) | |||||||||||||
|
THE REDWOOD
REVIEW
1ST QUARTER
2009
|
Table 1: GAAP
Earnings
|
|
|
|
Table 2: Taxable Income
and GAAP (Loss) Income Differences ($ in thousands, except per share
data)
|
|
|
Estimated
|
Estimated
|
Actual
|
Estimated
|
Actual
|
||||||||||||||||||||||||||||||||||||||||
|
Full
|
Full
|
|||||||||||||||||||||||||||||||||||||||||||
|
2009
|
2008
|
2008
|
2008
|
2008
|
2007
|
2007
|
2007
|
2007
|
Year
|
Year
|
||||||||||||||||||||||||||||||||||
|
Q1
|
Q4
|
Q3
|
Q2
|
|
Q1
|
Q4
|
Q3
|
Q2
|
Q1
|
2008
|
2007
|
|||||||||||||||||||||||||||||||||
|
GAAP
net (loss) income
|
$ | (34,944 | ) | $ | (115,586 | ) | $ | (111,304 | ) | $ | (45,909 | ) | $ | (171,587 | ) | $ | (1,077,445 | ) | $ | (60,917 | ) | $ | 11,416 | $ | 18,309 | $ | (444,386 | ) | $ | (1,108,637 | ) | |||||||||||||
|
Difference
in taxable income calculations
|
||||||||||||||||||||||||||||||||||||||||||||
|
Amortization
and credit losses
|
(21,939 | ) | (1,023 | ) | (6,496 | ) | (10,374 | ) | 1,007 | (15,080 | ) | 10,426 | 10,298 | 10,417 | (16,886 | ) | 16,061 | |||||||||||||||||||||||||||
|
Operating
expenses
|
451 | (1,274 | ) | 2,713 | 706 | 1,353 | 10,048 | (2,080 | ) | (2,921 | ) | (1,713 | ) | 3,498 | 3,334 | |||||||||||||||||||||||||||||
|
Gross
realized (gains) losses, net on calls and
sales
|
(462 | ) | (5,671 | ) | 54 | (2,837 | ) | (42 | ) | (4,819 | ) | (3,073 | ) | (3,589 | ) | 954 | (8,496 | ) | (10,527 | ) | ||||||||||||||||||||||||
|
Market
valuation adjustments, net
|
43,242 | 111,179 | 127,157 | 60,619 | 193,932 | 1,118,989 | 102,766 | 29,430 | 10,264 | 492,887 | 1,261,449 | |||||||||||||||||||||||||||||||||
|
Provision
(benefit) for income taxes
|
105 | 3,897 | (9,825 | ) | 1,447 | 1,159 | (2,214 | ) | 1,523 | 1,662 | 1,800 | (3,322 | ) | 2,771 | ||||||||||||||||||||||||||||||
|
Total
differences in GAAP and taxable income
|
21,397 | 107,108 | 113,603 | 49,561 | 197,409 | 1,106,924 | 109,562 | 34,880 | 21,722 | 467,681 | 1,273,088 | |||||||||||||||||||||||||||||||||
|
Taxable
(loss) income
|
$ | (13,547 | ) | $ | (8,478 | ) | $ | 2,299 | $ | 3,652 | $ | 25,822 | $ | 29,479 | $ | 48,645 | $ | 46,296 | $ | 40,031 | $ | 23,295 | $ | 164,451 | ||||||||||||||||||||
|
REIT
taxable (loss) income
|
$ | (8,701 | ) | $ | (8,793 | ) | $ | 2,400 | $ | 4,414 | $ | 24,734 | $ | 32,125 | $ | 48,591 | $ | 45,233 | $ | 35,112 | $ | 22,755 | $ | 161,061 | ||||||||||||||||||||
|
Taxable
(loss) income in taxable subsidiaries
|
(4,846 | ) | 315 | (101 | ) | (762 | ) | 1,088 | (2,646 | ) | 54 | 1,063 | 4,919 | 540 | 3,390 | |||||||||||||||||||||||||||||
|
Taxable
(loss) income
|
$ | (13,547 | ) | $ | (8,478 | ) | $ | 2,299 | $ | 3,652 | $ | 25,822 | $ | 29,479 | $ | 48,645 | $ | 46,296 | $ | 40,031 | $ | 23,295 | $ | 164,451 | ||||||||||||||||||||
|
After-tax
|
||||||||||||||||||||||||||||||||||||||||||||
|
Retained
REIT taxable income (loss)
|
$ | - | $ | - | $ | - | $ | - | $ | - | $ | - | $ | - | $ | - | $ | - | $ | - | $ | - | ||||||||||||||||||||||
|
Retained
taxable (loss) income in taxable
subsidiaries
|
(3,198 | ) | 210 | (43 | ) | (444 | ) | 633 | (1,325 | ) | 34 | 663 | 3,068 | 356 | 2,440 | |||||||||||||||||||||||||||||
|
Retained
taxable (loss) income
|
$ | - | $ | 210 | $ | (43 | ) | $ | (444 | ) | $ | 633 | $ | (1,325 | ) | $ | 34 | $ | 663 | $ | 3,068 | $ | 356 | $ | 2,440 | |||||||||||||||||||
|
Shares
used for taxable EPS calculation
|
60,228 | 33,471 | 33,238 | 33,184 | 32,710 | 32,385 | 27,986 | 27,816 | 27,129 | 32,577 | 28,354 | |||||||||||||||||||||||||||||||||
|
REIT
taxable (loss) income per share (1)
|
$ | (0.14 | ) | $ | (0.26 | ) | $ | 0.07 | $ | 0.13 | $ | 0.76 | $ | 0.99 | $ | 1.74 | $ | 1.63 | $ | 1.29 | $ | 0.70 | $ | 5.65 | ||||||||||||||||||||
|
Taxable
(loss) income in taxable subsidiaries per
share
|
$ | (0.08 | ) | $ | 0.01 | $ | (0.00 | ) | $ | (0.02 | ) | $ | 0.03 | $ | (0.08 | ) | $ | 0.00 | $ | 0.03 | $ | 0.19 | $ | 0.02 | $ | 0.14 | ||||||||||||||||||
|
Taxable
(loss) income per share (1)
|
$ | (0.22 | ) | $ | (0.25 | ) | $ | 0.07 | $ | 0.11 | $ | 0.79 | $ | 0.91 | $ | 1.74 | $ | 1.66 | $ | 1.48 | $ | 0.72 | $ | 5.79 | ||||||||||||||||||||
| $ | - | $ | - | |||||||||||||||||||||||||||||||||||||||||
|
Retained
taxable (loss) income (after-tax)
|
$ | (0.05 | ) | $ | 0.01 | $ | (0.01 | ) | $ | (0.01 | ) | $ | 0.02 | $ | (0.04 | ) | $ | 0.00 | $ | 0.02 | $ | 0.11 | $ | 0.01 | $ | 0.10 | ||||||||||||||||||
|
(1) REIT
taxable (loss) income per share and taxable (loss) income per share per
quarter are based on the number of shares outstanding at the end of each
quarter. REIT taxable (loss) income and taxable (loss) income per share
for the year are the sum of the four corresponding quarterly per share
amounts.
|
|
THE REDWOOD
REVIEW
1ST QUARTER
2009
|
Table 2: Taxable
Income and GAAP (Loss) Income Differences
|
61
|
|
|
Table 3: Retention and
Distribution of Taxable Income
($ in thousands, except per
share data)
|
62
|
|
Estimated
|
Estimated
|
Actual
|
Estimated
|
Actual
|
||||||||||||||||||||||||||||||||||||||||
|
Full
|
Full
|
|||||||||||||||||||||||||||||||||||||||||||
|
2009
|
2008
|
2008
|
2008
|
2008
|
2007
|
2007
|
2007
|
2007
|
Year
|
Year
|
||||||||||||||||||||||||||||||||||
|
Q1
|
Q4
|
Q3
|
Q2
|
Q1
|
Q4
|
Q3
|
Q2
|
Q1
|
2008
|
2007
|
||||||||||||||||||||||||||||||||||
|
Dividends
declared
|
$ | 15,057 | $ | 25,103 | $ | 24,928 | $ | 24,887 | $ | 24,532 | $ | 80,496 | $ | 20,989 | $ | 20,862 | $ | 20,347 | $ | 99,450 | $ | 142,694 | ||||||||||||||||||||||
|
Dividend deductions on stock
issued through DSPP
|
30 | 45 | 165 | 288 | 192 | 2,605 | 81 | 933 | 660 | 690 | 4,279 | |||||||||||||||||||||||||||||||||
|
Total dividend deductions
(1)
|
$ | 15,087 | $ | 25,148 | $ | 25,093 | $ | 25,175 | $ | 24,724 | $ | 83,101 | $ | 21,070 | $ | 21,795 | $ | 21,007 | $ | 100,140 | $ | 146,973 | ||||||||||||||||||||||
|
Regular dividend per
share
|
$ | 0.25 | $ | 0.75 | $ | 0.75 | $ | 0.75 | $ | 0.75 | $ | 0.75 | $ | 0.75 | $ | 0.75 | $ | 0.75 | $ | 3.00 | $ | 3.00 | ||||||||||||||||||||||
|
Special dividend per
share
|
- | - | - | - | - | 2.00 | - | - | - | - | 2.00 | |||||||||||||||||||||||||||||||||
|
Total dividends per share
(2)
|
$ | 0.25 | $ | 0.75 | $ | 0.75 | $ | 0.75 | $ | 0.75 | $ | 2.75 | $ | 0.75 | $ | 0.75 | $ | 0.75 | $ | 3.00 | $ | 5.00 | ||||||||||||||||||||||
|
Undistributed REIT taxable income
at beginning of period (pre-tax):
|
$ | - | $ | 21,128 | $ | 43,821 | $ | 64,582 | $ | 64,572 | $ | 115,548 | $ | 88,027 | $ | 64,589 | $ | 50,484 | $ | 64,572 | $ | 50,484 | ||||||||||||||||||||||
|
REIT taxable income (loss)
(pre-tax)
|
(8,701 | ) | (8,793 | ) | 2,400 | 4,414 | 24,734 | 32,125 | 48,591 | 45,233 | 35,112 | 22,755 | 161,061 | |||||||||||||||||||||||||||||||
|
Retained
(pre-tax)
|
- | - | - | - | - | - | - | - | - | - | - | |||||||||||||||||||||||||||||||||
|
Dividend of 2006
income
|
- | - | - | - | - | - | (7,682 | ) | (21,795 | ) | (21,007 | ) | - | (50,484 | ) | |||||||||||||||||||||||||||||
|
Dividend of 2007
income
|
- | (14,673 | ) | (25,175 | ) | (24,724 | ) | (83,101 | ) | (13,388 | ) | - | - | (64,572 | ) | (96,489 | ) | |||||||||||||||||||||||||||
|
Dividend of 2008
income
|
- | (12,335 | ) | (10,420 | ) | - | - | - | - | - | - | (22,755 | ) | - | ||||||||||||||||||||||||||||||
|
Dividend of 2009
income
|
- | - | - | - | - | - | - | - | - | - | - | |||||||||||||||||||||||||||||||||
|
Undistributed REIT taxable income
at period end (pre-tax):
|
$ | - | $ | - | $ | 21,128 | $ | 43,821 | $ | 64,582 | $ | 64,572 | $ | 115,548 | $ | 88,027 | $ | 64,589 | $ | - | $ | 64,572 | ||||||||||||||||||||||
|
Undistributed REIT taxable income
(pre-tax) at period end
|
||||||||||||||||||||||||||||||||||||||||||||
|
From 2006
|
$ | - | $ | - | $ | - | $ | - | $ | - | $ | - | $ | - | $ | 7,682 | $ | 29,477 | $ | - | $ | - | ||||||||||||||||||||||
|
From 2007
|
- | - | - | 14,673 | 39,848 | 64,572 | 115,548 | 80,345 | 35,112 | - | 64,572 | |||||||||||||||||||||||||||||||||
|
From 2008
|
- | - | 20,872 | 29,148 | 24,734 | - | - | - | - | - | - | |||||||||||||||||||||||||||||||||
|
From 2009
|
- | - | - | - | - | - | - | - | - | - | - | |||||||||||||||||||||||||||||||||
|
Total
|
$ | - | $ | - | $ | 20,872 | $ | 43,821 | $ | 64,582 | $ | 64,572 | $ | 115,548 | $ | 88,027 | $ | 64,589 | $ | - | $ | 64,572 | ||||||||||||||||||||||
|
Shares outstanding at period
end
|
60,228 | 33,471 | 33,238 | 33,184 | 32,710 | 32,385 | 27,986 | 27,816 | 27,129 | 33,471 | 32,385 | |||||||||||||||||||||||||||||||||
|
Undistributed REIT taxable income
(pre-tax)
|
||||||||||||||||||||||||||||||||||||||||||||
|
per share outstanding at period
end
|
$ | - | $ | - | $ | 0.63 | $ | 1.32 | $ | 1.97 | $ | 1.99 | $ | 4.13 | $ | 3.16 | $ | 2.38 | $ | - | $ | 1.99 | ||||||||||||||||||||||
|
(1) Dividends in 2008
exceeded the year's taxable income plus undistributed income carried over
from prior years. Thus, the 2008 dividends included $8.4
million return of capital.
|
|||||||||||
|
(2) Total dividends for
the first quarter of 2009 were $0.25, which were characterized entirely as
a return of capital. The portion of Redwood's dividends
characterized as a return of capital is not taxable, and reduces a
shareholder's basis for shares held at each quarterly distribution
date. Total dividends in 2008 were $3.00 per share, of which
$2.75 per share was characterized as ordinary income and $0.25 per share
was characterized as a return of capital. Total dividends in
2007 were $5.00 per share, which were characterized entirely as ordinary
income.
|
|
THE REDWOOD
REVIEW
1ST QUARTER
2009
|
Table 3:
Retention and
Distribution of Taxable Income
|
|
|
|
Table 4: Components of
Book Value
($ in millions, except per
share data)
|
|
|
2009
|
2008
|
2008
|
2008
|
2008
|
||||||||||||||||
|
Q1
|
Q4
|
Q3
|
Q2
|
Q1
|
||||||||||||||||
|
Assets
at Redwood
|
||||||||||||||||||||
|
Residential
Seniors
|
||||||||||||||||||||
|
Prime
|
$ | 88 | $ | 51 | $ | 21 | $ | 27 | $ | 1 | ||||||||||
|
Non-prime
|
74 | 43 | 48 | 57 | 3 | |||||||||||||||
|
Total
Residential Seniors
|
162 | 94 | 69 | 84 | 4 | |||||||||||||||
|
Residential
Subordinates
|
||||||||||||||||||||
|
Prime
|
29 | 44 | 86 | 154 | 90 | |||||||||||||||
|
Non-prime
|
4 | 7 | 5 | 9 | 23 | |||||||||||||||
|
Total
Residential Subordinates
|
33 | 51 | 91 | 163 | 113 | |||||||||||||||
|
CDO
|
3 | 4 | 4 | 15 | 16 | |||||||||||||||
|
Commercial
Subordinates
|
23 | 42 | 64 | 91 | 99 | |||||||||||||||
|
Real
estate loans
|
3 | 3 | 3 | 4 | 5 | |||||||||||||||
|
Total
securities and loans at Redwood
|
224 | 194 | 231 | 357 | 237 | |||||||||||||||
|
Cash
and cash equivalents
|
333 | 126 | 177 | 148 | 257 | |||||||||||||||
|
Other
assets (1)
|
25 | 37 | 25 | 27 | 35 | |||||||||||||||
|
Other
liabilities (2)
|
(25 | ) | (46 | ) | (29 | ) | (37 | ) | (34 | ) | ||||||||||
|
Short-term
debt
|
- | - | (7 | ) | (9 | ) | (2 | ) | ||||||||||||
|
Investments
in Sequoia
|
||||||||||||||||||||
|
Total
assets
|
4,566 | 4,688 | 6,137 | 6,414 | 6,800 | |||||||||||||||
|
Total
liabilities
|
(4,496 | ) | (4,591 | ) | (6,026 | ) | (6,274 | ) | (6,654 | ) | ||||||||||
|
Net
investments in Sequoia
|
70 | 97 | 111 | 140 | 146 | |||||||||||||||
|
Investments
in Acacia
|
||||||||||||||||||||
|
Total
assets
|
463 | 558 | 813 | 1,091 | 1,269 | |||||||||||||||
|
Total
liabilities
|
(456 | ) | (542 | ) | (794 | ) | (1,050 | ) | (1,201 | ) | ||||||||||
|
Net
investments in Acacia
|
7 | 16 | 19 | 41 | 68 | |||||||||||||||
|
Investments
in the Fund
|
||||||||||||||||||||
|
Total
assets
|
42 | 53 | 73 | 94 | 36 | |||||||||||||||
|
Total
liabilities and minority interest
|
(20 | ) | (25 | ) | (38 | ) | (47 | ) | (8 | ) | ||||||||||
|
Net
investments in the Fund
|
22 | 28 | 35 | 47 | 28 | |||||||||||||||
|
Long-term
debt
|
(150 | ) | (150 | ) | (150 | ) | (150 | ) | (150 | ) | ||||||||||
|
Total
GAAP stockholders' equity
|
$ | 506 | $ | 302 | $ | 412 | $ | 564 | $ | 585 | ||||||||||
|
GAAP
Book value per share
|
$ | 8.40 | $ | 9.02 | $ | 12.40 | $ | 17.00 | $ | 17.89 | ||||||||||
|
(1)
Other assets includes deferred ABS issuance costs, derivative assets,
accrued interest recievable, deferred tax assets, restricted cash, and
other assets.
|
|
(2)
Other liabilities include derivative liabilities, accrued interest
payable, dividends payable, accrued expenses, and other
liabilities.
|
|
THE REDWOOD
REVIEW
1ST QUARTER
2009
|
Table 4: Components of
Book Value
|
63
|
|
|
Table 5: Investment
Activity in Sequoia, Acacia and the Fund ($ in
millions)
|
64
|
|
2009
|
2008
|
2008
|
2008
|
2008
|
||||||||||||||||
|
Q1
|
Q4
|
Q3
|
Q2
|
Q1
|
||||||||||||||||
|
Investments
in Sequoia
|
||||||||||||||||||||
|
Beginning
asset balance
|
$ | 4,688 | $ | 6,136 | $ | 6,414 | $ | 6,800 | $ | 7,205 | ||||||||||
|
Beginning
liability balance
|
(4,591 | ) | (6,025 | ) | (6,274 | ) | (6,654 | ) | $ | (7,059 | ) | |||||||||
|
Beginning
book value in Sequoia
|
$ | 97 | $ | 111 | $ | 140 | $ | 146 | $ | 146 | ||||||||||
|
Principal
payments on assets
|
$ | (84 | ) | $ | (153 | ) | $ | (243 | ) | $ | (365 | ) | $ | (400 | ) | |||||
|
Asset
transfers to REO
|
(8 | ) | (12 | ) | (6 | ) | (13 | ) | (7 | ) | ||||||||||
|
Loan
premium amortization
|
(7 | ) | (2 | ) | (3 | ) | (10 | ) | (8 | ) | ||||||||||
|
Provision
for credit losses
|
(16 | ) | (19 | ) | (18 | ) | (10 | ) | (8 | ) | ||||||||||
|
Sale
of interests and resulting deconsolidation
|
- | (1,253 | ) | - | - | - | ||||||||||||||
|
Change
in other assets
|
(6 | ) | (9 | ) | (8 | ) | 12 | 18 | ||||||||||||
|
Net
change in Sequoia assets
|
$ | (121 | ) | $ | (1,448 | ) | $ | (278 | ) | $ | (386 | ) | $ | (405 | ) | |||||
|
Principal
payments on liabilities
|
$ | 88 | $ | 155 | $ | 243 | $ | 364 | $ | 394 | ||||||||||
|
Discount
amortization
|
1 | 2 | 2 | 6 | 8 | |||||||||||||||
|
Sale
of interests and resulting deconsolidation
|
- | 1,264 | - | - | - | |||||||||||||||
|
Change
in other liabilities
|
6 | 13 | 4 | 10 | 3 | |||||||||||||||
|
Net
change in Sequoia liabilities
|
$ | 95 | $ | 1,434 | $ | 249 | $ | 380 | $ | 405 | ||||||||||
|
Ending
asset balance
|
4,567 | 4,688 | 6,136 | 6,414 | 6,800 | |||||||||||||||
|
Ending
liability balance
|
(4,496 | ) | (4,591 | ) | (6,025 | ) | (6,274 | ) | (6,654 | ) | ||||||||||
|
Ending
book value in Sequoia
|
$ | 71 | $ | 97 | $ | 111 | $ | 140 | $ | 146 | ||||||||||
|
Investments
in Acacia
|
||||||||||||||||||||
|
Beginning
asset balance
|
$ | 558 | $ | 813 | $ | 1,091 | $ | 1,269 | $ | 2,107 | ||||||||||
|
Beginning
liability balance
|
(542 | ) | (794 | ) | (1,050 | ) | (1,201 | ) | (3,492 | ) | ||||||||||
|
Beginning
book value in Acacia
|
$ | 16 | $ | 19 | $ | 41 | $ | 68 | $ | (1,385 | ) | |||||||||
|
Principal
payments on assets
|
$ | (44 | ) | $ | (29 | ) | $ | (35 | ) | $ | (40 | ) | $ | (55 | ) | |||||
|
Market
valuation changes
|
(47 | ) | (207 | ) | (221 | ) | (67 | ) | (782 | ) | ||||||||||
|
Change
in other assets
|
(4 | ) | (19 | ) | (22 | ) | (71 | ) | (1 | ) | ||||||||||
|
Net
change in Acacia assets
|
$ | (95 | ) | $ | (255 | ) | $ | (278 | ) | $ | (178 | ) | $ | (838 | ) | |||||
|
Principal
payments on liabilities
|
29 | 44 | 58 | 110 | 37 | |||||||||||||||
|
Market
valuation changes
|
27 | 282 | 204 | 1 | 810 | |||||||||||||||
|
FAS
159 adjustments
|
- | - | - | - | 1,490 | |||||||||||||||
|
Change
in other liabilities
|
30 | (74 | ) | (6 | ) | 40 | (46 | ) | ||||||||||||
|
Net
change in Acacia liabilities
|
$ | 86 | $ | 252 | $ | 256 | $ | 151 | $ | 2,291 | ||||||||||
|
Ending
asset balance
|
$ | 463 | $ | 558 | $ | 813 | $ | 1,091 | $ | 1,269 | ||||||||||
|
Ending
liability balance
|
(456 | ) | (542 | ) | (794 | ) | (1,050 | ) | (1,201 | ) | ||||||||||
|
Ending
book value in Acacia
|
$ | 7 | $ | 16 | $ | 19 | $ | 41 | $ | 68 | ||||||||||
|
Investments
in the Fund
|
||||||||||||||||||||
|
Beginning
asset balance
|
$ | 53 | $ | 73 | $ | 94 | $ | 36 | $ | 15 | ||||||||||
|
Beginning
liability balance
|
(25 | ) | (38 | ) | (47 | ) | (8 | ) | $ | - | ||||||||||
|
Beginning
book value in the Fund
|
$ | 28 | $ | 35 | $ | 47 | $ | 28 | $ | 15 | ||||||||||
|
Principal
payments on assets
|
$ | (4 | ) | $ | (4 | ) | $ | (4 | ) | $ | (6 | ) | $ | (1 | ) | |||||
|
Acquisitions
|
- | - | 13 | 40 | 20 | |||||||||||||||
|
Discount
amortization
|
2 | 1 | 2 | 1 | 1 | |||||||||||||||
|
Sales
|
- | - | - | (5 | ) | - | ||||||||||||||
|
Market
valuation changes
|
(8 | ) | (17 | ) | (10 | ) | - | 1 | ||||||||||||
|
Change
in other assets
|
(1 | ) | - | (22 | ) | 28 | - | |||||||||||||
|
Net
change in the Fund assets
|
$ | (11 | ) | $ | (20 | ) | $ | (21 | ) | $ | 58 | $ | 21 | |||||||
|
Change
in other liabilities and noncontrolling
interest
|
5 | 13 | 9 | (39 | ) | (8 | ) | |||||||||||||
|
Ending
asset balance
|
$ | 42 | $ | 53 | $ | 73 | $ | 94 | $ | 36 | ||||||||||
|
Ending
liability and noncontrolling interest
balance
|
(20 | ) | (25 | ) | (38 | ) | (47 | ) | (8 | ) | ||||||||||
|
Ending
book value in the Fund
|
$ | 22 | $ | 28 | $ | 35 | $ | 47 | $ | 28 | ||||||||||
|
THE REDWOOD
REVIEW
1ST QUARTER
2009
|
Table 5:
Investment Activity in Sequoia, Acacia and the Fund
|
|
|
|
Table 6: Book Value and
Other Ratios ($ in millions, except per
share data)
|
|
|
2009
|
2008
|
2008
|
2008
|
2008
|
January 1,
|
2007
|
2007
|
2007
|
2007
|
|||||||||||||||||||||||||||||||
|
Q1
|
Q4
|
Q3
|
Q2
|
Q1
|
2008 (1)
|
Q4
|
Q3
|
Q2
|
Q1
|
|||||||||||||||||||||||||||||||
|
Short-term
debt
|
$ | - | $ | - | $ | 7 | $ | 9 | $ | 2 | $ | 8 | $ | 8 | $ | 39 | $ | 849 | $ | 1,880 | ||||||||||||||||||||
|
Long-term
debt
|
150 | 150 | 150 | 150 | 150 | 150 | 150 | 150 | 150 | 100 | ||||||||||||||||||||||||||||||
|
Redwood
debt
|
$ | 150 | $ | 150 | $ | 157 | $ | 159 | $ | 152 | $ | 158 | $ | 158 | $ | 189 | $ | 999 | $ | 1,980 | ||||||||||||||||||||
|
GAAP stockholders'
equity
|
$ | 506 | $ | 302 | $ | 412 | $ | 564 | $ | 585 | $ | 751 | $ | (718 | ) | $ | 149 | $ | 876 | $ | 924 | |||||||||||||||||||
|
Redwood debt to
equity
|
0.3 | x | 0.5 | x | 0.4 | x | 0.3 | x | 0.3 | x | 0.2 | x | (0.2 | )x | 1.3 | x | 1.1 | x | 2.1 | x | ||||||||||||||||||||
|
Redwood debt to (equity +
debt)
|
23 | % | 33 | % | 28 | % | 22 | % | 21 | % | 17 | % | -28 | % | 56 | % | 53 | % | 68 | % | ||||||||||||||||||||
|
Redwood
debt
|
$ | 150 | $ | 150 | $ | 157 | $ | 159 | $ | 152 | $ | 158 | $ | 158 | $ | 189 | $ | 999 | $ | 1,980 | ||||||||||||||||||||
|
ABS obligations of consolidated
entities
|
4,709 | 4,855 | 6,603 | 7,110 | 7,591 | 8,839 | 10,329 | 10,803 | 10,675 | 9,947 | ||||||||||||||||||||||||||||||
|
GAAP debt
|
$ | 4,859 | $ | 5,005 | $ | 6,760 | $ | 7,269 | $ | 7,743 | $ | 8,997 | $ | 10,487 | $ | 10,992 | $ | 11,674 | $ | 11,927 | ||||||||||||||||||||
|
GAAP debt to
equity
|
9.6 | x | 16.6 | x | 16.4 | x | 12.9 | x | 13.2 | x | 12.0 | x | (14.6 | )x | 73.8 | x | 13.3 | x | 12.9 | x | ||||||||||||||||||||
|
GAAP debt to (equity + GAAP
debt)
|
91 | % | 94 | % | 94 | % | 93 | % | 93 | % | 92 | % | 107 | % | 99 | % | 93 | % | 93 | % | ||||||||||||||||||||
|
GAAP stockholders'
equity
|
$ | 506 | $ | 302 | $ | 412 | $ | 564 | $ | 585 | $ | 751 | $ | (718 | ) | $ | 149 | $ | 876 | $ | 924 | |||||||||||||||||||
|
Balance sheet mark-to-market
adjustments
|
(85 | ) | (57 | ) | (84 | ) | (68 | ) | (93 | ) | (99 | ) | (574 | ) | (735 | ) | (81 | ) | (6 | ) | ||||||||||||||||||||
|
Core equity
|
$ | 591 | $ | 359 | $ | 496 | $ | 632 | $ | 678 | $ | 850 | $ | (145 | ) | $ | 884 | $ | 957 | $ | 930 | |||||||||||||||||||
|
Shares outstanding at period
end
|
60,228 | 33,471 | 33,238 | 33,184 | 32,710 | 32,385 | 32,385 | 27,986 | 27,816 | 27,129 | ||||||||||||||||||||||||||||||
|
GAAP equity per
share
|
$ | 8.40 | $ | 9.02 | $ | 12.40 | $ | 17.00 | $ | 17.89 | $ | 23.18 | $ | (22.18 | ) | $ | 5.32 | $ | 31.50 | $ | 34.06 | |||||||||||||||||||
|
Adjustments to GAAP equity to
economic value
|
||||||||||||||||||||||||||||||||||||||||
|
Investments in
Sequoia
|
$ | (0.15 | ) | $ | (0.95 | ) | $ | (1.65 | ) | $ | (1.96 | ) | $ | (1.65 | ) | $ | (1.45 | ) | $ | (1.45 | ) | $ | (5.50 | ) | $ | (4.10 | ) | $ | (4.79 | ) | ||||||||||
|
Investments in
Acacia
|
(0.03 | ) | (0.21 | ) | (0.18 | ) | (0.66 | ) | (0.58 | ) | (1.17 | ) | 44.19 | 26.26 | 5.71 | 2.95 | ||||||||||||||||||||||||
|
Long-term
debt
|
1.79 | 3.24 | 2.61 | 2.34 | 2.38 | 1.73 | 1.73 | 1.47 | - | - | ||||||||||||||||||||||||||||||
|
Economic value per
share
|
$ | 10.01 | $ | 11.10 | $ | 13.18 | $ | 16.72 | $ | 18.04 | $ | 22.29 | $ | 22.29 | $ | 27.55 | $ | 33.11 | $ | 32.22 | ||||||||||||||||||||
|
(1) On January 1, 2008 we elected
the fair value option for the assets and liabilities of Acacia and certain
other assets.
|
|
THE REDWOOD
REVIEW
1ST QUARTER
2009
|
Table 6:
Book Value
and Other Ratios
|
65
|
|
|
Table 7: Profitability
Ratios ($ in
thousands)
|
66
|
|
Full
|
Full
|
|||||||||||||||||||||||||||||||||||||||||||
|
2009
|
2008
|
2008
|
2008
|
2008
|
2007
|
2007
|
2007
|
2007
|
Year
|
Year
|
||||||||||||||||||||||||||||||||||
|
Q1
|
Q4
|
Q3
|
Q2
|
Q1
|
Q4
|
Q3
|
Q2
|
Q1
|
2008
|
2007
|
||||||||||||||||||||||||||||||||||
|
Interest
income
|
$ | 81,438 | $ | 123,288 | $ | 131,192 | $ | 137,002 | $ | 176,063 | $ | 206,925 | $ | 220,331 | $ | 222,158 | $ | 218,935 | $ | 567,545 | $ | 868,349 | ||||||||||||||||||||||
|
Average consolidated earning
assets
|
$ | 5,553,470 | $ | 7,006,592 | $ | 7,594,682 | $ | 8,137,261 | $ | 9,090,678 | $ | 11,521,330 | $ | 12,193,242 | $ | 12,301,562 | $ | 12,279,814 | $ | 8,036,707 | $ | 12,258,453 | ||||||||||||||||||||||
|
Asset yield
|
5.87 | % | 7.04 | % | 6.91 | % | 6.73 | % | 7.75 | % | 7.18 | % | 7.23 | % | 7.22 | % | 7.13 | % | 7.06 | % | 7.08 | % | ||||||||||||||||||||||
|
Interest
expense
|
$ | (47,642 | ) | $ | (99,705 | ) | $ | (92,155 | ) | $ | (97,507 | ) | $ | (127,457 | ) | $ | (152,680 | ) | $ | (165,230 | ) | $ | (165,757 | ) | $ | (168,096 | ) | $ | (416,824 | ) | $ | (651,763 | ) | |||||||||||
|
Average consolidated
interest-bearing liabilities
|
$ | 4,940,304 | $ | 6,613,677 | $ | 7,106,052 | $ | 7,499,474 | $ | 8,383,296 | $ | 10,716,433 | $ | 11,376,762 | $ | 11,580,196 | $ | 11,623,627 | $ | 7,660,908 | $ | 11,527,275 | ||||||||||||||||||||||
|
Cost of
funds
|
3.86 | % | 6.03 | % | 5.19 | % | 5.20 | % | 6.08 | % | 5.70 | % | 5.81 | % | 5.73 | % | 5.78 | % | 5.44 | % | 5.65 | % | ||||||||||||||||||||||
|
Asset yield
|
5.87 | % | 7.04 | % | 6.91 | % | 6.73 | % | 7.75 | % | 7.18 | % | 7.18 | % | 7.14 | % | 7.01 | % | 7.06 | % | 7.08 | % | ||||||||||||||||||||||
|
Cost of
funds
|
(3.86 | %) | (6.03 | %) | (5.19 | %) | (5.20 | %) | (6.08 | %) | (5.70 | %) | (5.81 | )% | (5.73 | )% | (5.78 | )% | (5.44 | %) | (5.65 | %) | ||||||||||||||||||||||
|
Interest rate
spread
|
2.01 | % | 1.01 | % | 1.72 | % | 1.53 | % | 1.67 | % | 1.49 | % | 1.37 | % | 1.41 | % | 1.22 | % | 1.62 | % | 1.43 | % | ||||||||||||||||||||||
|
Net interest
income
|
$ | 33,796 | $ | 23,583 | $ | 39,037 | $ | 39,495 | $ | 48,606 | $ | 54,245 | $ | 55,101 | $ | 56,401 | $ | 50,839 | $ | 150,721 | $ | 216,586 | ||||||||||||||||||||||
|
Average consolidated earning
assets
|
$ | 5,553,470 | $ | 7,006,592 | $ | 7,594,682 | $ | 8,137,261 | $ | 9,090,678 | $ | 11,521,330 | $ | 12,193,242 | $ | 12,301,562 | $ | 12,279,814 | $ | 8,036,707 | $ | 12,258,453 | ||||||||||||||||||||||
|
Net interest
margin
|
2.43 | % | 1.35 | % | 2.06 | % | 1.94 | % | 2.14 | % | 1.88 | % | 1.81 | % | 1.83 | % | 1.66 | % | 1.88 | % | 1.77 | % | ||||||||||||||||||||||
|
Net interest
income
|
$ | 33,796 | $ | 23,583 | $ | 39,037 | $ | 39,495 | $ | 48,606 | $ | 54,245 | $ | 55,101 | $ | 56,401 | $ | 50,839 | $ | 150,721 | $ | 216,586 | ||||||||||||||||||||||
|
Net interest income / average core
equity
|
(21.90 | %) | 21.03 | % | 27.93 | % | 24.45 | % | 23.60 | % | 30.73 | % | 23.11 | % | 23.71 | % | 21.98 | % | 22.35 | % | 22.96 | % | ||||||||||||||||||||||
|
Operating expenses (excluding
severance expense) (1)
|
$ | (10,511 | ) | $ | (11,488 | ) | $ | (16,851 | ) | $ | (14,255 | ) | $ | (16,343 | ) | $ | (14,929 | ) | $ | (11,732 | ) | $ | (12,772 | ) | $ | (15,402 | ) | $ | (58,937 | ) | $ | (54,835 | ) | |||||||||||
|
Average total
assets
|
$ | 5,575,619 | $ | 7,040,306 | $ | 7,648,102 | $ | 8,203,461 | $ | 9,223,464 | $ | 10,866,153 | $ | 12,232,304 | $ | 12,688,468 | $ | 12,865,979 | $ | 8,025,780 | $ | 12,594,827 | ||||||||||||||||||||||
|
Average total
equity
|
$ | 556,861 | $ | 371,503 | $ | 533,755 | $ | 602,402 | $ | 720,035 | $ | 97,534 | $ | 851,869 | $ | 946,454 | $ | 1,008,688 | $ | 556,354 | $ | 723,807 | ||||||||||||||||||||||
|
Operating expenses / net interest
income (2)
|
31.10 | % | 48.71 | % | 43.17 | % | 36.09 | % | 33.62 | % | 27.52 | % | 21.89 | % | 23.70 | % | 32.76 | % | 39.10 | % | 25.32 | % | ||||||||||||||||||||||
|
Operating expenses / average total
assets (2)
|
0.75 | % | 0.65 | % | 0.88 | % | 0.70 | % | 0.71 | % | 0.55 | % | 0.38 | % | 0.40 | % | 0.48 | % | 0.73 | % | 0.44 | % | ||||||||||||||||||||||
|
Operating expenses / average total
equity (2)
|
7.55 | % | 12.37 | % | 12.63 | % | 9.47 | % | 9.08 | % | 61.23 | % | 5.51 | % | 5.40 | % | 6.11 | % | 10.59 | % | 7.58 | % | ||||||||||||||||||||||
|
GAAP net (loss)
income
|
$ | (34,944 | ) | $ | (115,586 | ) | $ | (111,304 | ) | $ | (45,909 | ) | $ | (171,587 | ) | $ | (1,077,445 | ) | $ | (60,917 | ) | $ | 11,416 | $ | 18,310 | $ | (444,386 | ) | $ | (1,108,636 | ) | |||||||||||||
|
GAAP net (loss) income / average
total assets
|
(2.51 | %) | (6.57 | %) | (5.82 | %) | (2.24 | %) | (7.44 | %) | (39.66 | %) | (1.99 | )% | 0.36 | % | 0.57 | % | (5.54 | %) | (8.80 | %) | ||||||||||||||||||||||
|
GAAP net (loss) income / average
equity (GAAP ROE)
|
(25.10 | %) | (124.45 | %) | (83.41 | %) | (30.48 | %) | (95.32 | %) | (4418.75 | %) | (28.60 | )% | 4.82 | % | 7.26 | % | (79.87 | %) | (153.17 | %) | ||||||||||||||||||||||
|
GAAP net (loss) income / average
core equity (adjusted ROE)
|
(22.64 | %) | (103.09 | %) | (79.62 | %) | (28.42 | %) | (83.31 | %) | (610.31 | %) | (25.55 | )% | 4.80 | % | 7.92 | % | (65.89 | %) | (117.52 | %) | ||||||||||||||||||||||
|
THE REDWOOD
REVIEW
1ST QUARTER
2009
|
Table 7:
Profitability
Ratios
|
|
|
|
Table 8: Average Balance
Sheet ($ in
thousands)
|
|
|
Full
|
||||||||||||||||||||||||
|
2009
|
2008
|
2008
|
2008
|
2008
|
Year
|
|||||||||||||||||||
|
Q1
|
Q4
|
Q3
|
Q2
|
Q1
|
2008
|
|||||||||||||||||||
|
Real estate assets at
Redwood
|
||||||||||||||||||||||||
|
Senior Residential
Securities
|
||||||||||||||||||||||||
|
Prime
|
$ | 77,651 | $ | 37,746 | $ | 27,880 | $ | 15,040 | $ | 663 | $ | 20,332 | ||||||||||||
|
Non-prime
|
87,464 | 63,050 | 63,818 | 50,056 | 7,061 | 45,996 | ||||||||||||||||||
|
Total Senior Residential
Securities
|
165,114 | 100,796 | 91,698 | 65,096 | 7,724 | 66,329 | ||||||||||||||||||
|
Subordinate Residential
Securities
|
||||||||||||||||||||||||
|
Prime
|
47,070 | 88,943 | 147,513 | 177,996 | 145,756 | 140,052 | ||||||||||||||||||
|
Non-prime
|
3,450 | 4,105 | 4,450 | 17,184 | 54,464 | 20,051 | ||||||||||||||||||
|
Subordinate Residential
Securities
|
50,519 | 93,048 | 151,963 | 195,180 | 200,220 | 160,103 | ||||||||||||||||||
|
Commercial subordinate
securites
|
46,382 | 63,969 | 98,534 | 106,314 | 183,446 | 112,892 | ||||||||||||||||||
|
Commercial
loans
|
248 | 249 | 250 | 251 | 250 | 250 | ||||||||||||||||||
|
Residential
loans
|
2,600 | 2,960 | 3,671 | 3,759 | 4,507 | 3,722 | ||||||||||||||||||
|
CDO
|
3,429 | 3,856 | 8,628 | 15,492 | 21,297 | 12,468 | ||||||||||||||||||
|
Other real estate
investments
|
- | 50 | 75 | 2,328 | 5,836 | 2,061 | ||||||||||||||||||
|
Total Real estate assets at
Redwood
|
268,293 | 264,927 | 354,819 | 388,420 | 423,280 | 357,824 | ||||||||||||||||||
|
Earning assets at
Acacia
|
404,596 | 575,709 | 830,311 | 982,169 | 1,439,913 | 955,637 | ||||||||||||||||||
|
Earning assets at
Sequoia
|
4,568,212 | 5,966,898 | 6,170,944 | 6,483,475 | 6,895,529 | 6,377,515 | ||||||||||||||||||
|
Earning assets at the
Fund
|
62,319 | 71,792 | 75,321 | 56,183 | 33,180 | 59,198 | ||||||||||||||||||
|
Cash and cash
equivalents
|
310,514 | 204,246 | 229,778 | 311,052 | 402,584 | 286,533 | ||||||||||||||||||
|
Earning
assets
|
5,613,934 | 7,083,573 | 7,661,173 | 8,221,299 | 9,194,486 | 8,036,707 | ||||||||||||||||||
|
Balance sheet mark-to-market
adjustments
|
(60,464 | ) | (76,981 | ) | (66,491 | ) | (84,038 | ) | (103,808 | ) | (82,767 | ) | ||||||||||||
|
Earning assets - reported
value
|
5,553,470 | 7,006,592 | 7,594,682 | 8,137,261 | 9,090,678 | 7,953,940 | ||||||||||||||||||
|
Other
assets
|
22,148 | 33,714 | 53,420 | 66,200 | 132,786 | 71,840 | ||||||||||||||||||
|
Total
assets
|
$ | 5,575,619 | $ | 7,040,306 | $ | 7,648,102 | $ | 8,203,461 | $ | 9,223,464 | $ | 8,025,780 | ||||||||||||
|
Short-term
debt
|
$ | - | $ | 975 | $ | 7,825 | $ | 4,904 | $ | 21,477 | $ | 8,771 | ||||||||||||
|
Sequoia ABS
issued
|
4,460,951 | 5,804,702 | 6,040,634 | 6,349,661 | 6,745,556 | 6,233,434 | ||||||||||||||||||
|
Acacia ABS
issued
|
325,392 | 652,398 | 900,611 | 986,915 | 1,456,506 | 997,891 | ||||||||||||||||||
|
Other
liabilities
|
55,487 | 32,533 | (22,524 | ) | 72,870 | 126,790 | 52,843 | |||||||||||||||||
|
Long-term
debt
|
147,193 | 146,944 | 146,705 | 146,480 | 146,242 | 146,594 | ||||||||||||||||||
|
Total
liabilities
|
4,989,023 | 6,637,552 | 7,073,251 | 7,560,830 | 8,496,572 | 7,439,533 | ||||||||||||||||||
|
Noncontrolling
interest
|
29,735 | 31,251 | 41,096 | 40,229 | 6,858 | 29,893 | ||||||||||||||||||
|
Core equity
|
617,325 | 448,484 | 600,246 | 686,440 | 823,843 | 639,123 | ||||||||||||||||||
|
Balance sheet mark-to-market
adjustments
|
(60,464 | ) | (76,981 | ) | (66,491 | ) | (84,038 | ) | (103,808 | ) | (82,769 | ) | ||||||||||||
|
Total
equity
|
556,861 | 371,503 | 533,755 | 602,402 | 720,035 | 556,354 | ||||||||||||||||||
|
Total liabilities and
equity
|
$ | 5,575,619 | $ | 7,040,306 | $ | 7,648,102 | $ | 8,203,461 | $ | 9,223,464 | $ | 8,025,780 | ||||||||||||
|
THE REDWOOD
REVIEW
1ST QUARTER
2009
|
Table 8:
Average
Balance Sheet
|
67
|
|
|
Table 9: Balances & Yields
by Securities Portfolio at Redwood
($ in
thousands)
|
68
|