 |
|
|
|
|
TABLE OF
CONTENTS
|
|
Introduction
|
3
|
|
Shareholder
Letter
|
4
|
|
Quarterly
Overview
|
6
|
|
Financial
Insights
|
10
|
|
Government
Initiatives
|
19
|
|
GAAP
Income
|
22
|
|
Taxable
Income
|
26
|
|
Dividends
|
28
|
|
Capital and
Liquidity
|
29
|
|
Mark-to-Market
Adjustments
|
30
|
|
Residential
Real Estate Securities
|
33
|
|
Commercial
Real Estate Securities
|
40
|
|
Investments
in Sequoia
|
42
|
|
Investments
in Acacia
|
44
|
|
Appendix
|
|
|
Accounting
Discussion
|
46
|
|
Glossary
|
49
|
|
Financial
Tables
|
57
|
|
|
THE REDWOOD
REVIEW 2ND QUARTER 2009
|
1
|
|
|
|
|
|
CAUTIONARY
STATEMENT
|
Cautionary
Statement
This Redwood Review
contains forward-looking statements within the meaning of the safe harbor
provisions of the Private Securities Litigation Reform Act of 1995.
Forward-looking statements involve numerous risks and uncertainties. Our actual
results may differ from our expectations, estimates, and projections and,
consequently, you should not rely on these forward-looking statements as
predictions of future events. Forward-looking statements are not historical in
nature and can be identified by words such as “anticipate,” “estimate,” “will,”
“should,” “expect,” “believe,” “intend,” “seek,” “plan,” and similar expressions
or their negative forms, or by references to strategy, plans, or intentions.
These forward-looking statements are subject to risks and uncertainties,
including, among other things, those described in our Annual Report on Form 10-K
for the year ended December 31, 2008 and in our Quarterly Report on Form 10-Q
for the three months ended June 30, 2009, in each case under the caption “Risk
Factors.” Other risks, uncertainties, and factors that could cause actual
results to differ materially from those projected are described below and may be
described from time to time in reports we file with the Securities and Exchange
Commission, including reports on Forms 10-K, 10-Q, and 8-K. We undertake no
obligation to update or revise forward-looking statements, whether as a result
of new information, future events, or otherwise.
Statements
regarding the following subjects, among others, are forward-looking by their
nature: (i) our view of future trends in the economy, the financial markets, the
housing markets, interest rates, unemployment, the prices for mortgage-backed
securities, and the affect of technical and fundamental factors on them; (ii)
our beliefs about future trends in the fundamental factors underlying the
performance of residential and commercial mortgage assets, such as credit
losses, delinquencies, foreclosures, and prepayment rates, and our beliefs
regarding the effects of these fundamental factors on the performance of our
investments; (iii) the potential effect of future legislation and regulations
and other government initiatives and programs on our investments and our
business, including, without limitation, the future role of government sponsored
enterprises (such as Fannie Mae and Freddie Mac) in mortgage financing and any
short-term measures that are taken with respect to the operations of these and
other government sponsored enterprises or agencies; (iv) our future role in the
mortgage financing industry and credit risk transfer markets as well as the
future of securitization as a means of financing mortgage debt and our ability
in the future to deploy capital in sponsoring securitizations of mortgage debt
and executing structured transactions relating to the transfer of credit risk;
(v) the extent to which we believe that existing and future investments will be
affected by loan modification and refinancing programs sponsored by the
government; (vi) the sufficiency of credit protection for our existing and
future investments and the potential for existing and future investments to
perform in-line with, or to exceed, our performance expectations; (vii) our
ability to continue to acquire real estate-related investments at prices and
with credit support and other characteristics that we believe will yield
long-term attractive cash flows and returns and our intention to maintain the
commercial sector as an important strategic area of investment; (viii) whether
and under what circumstances we would sell assets, our ability to free up
capital internally to meet short-term capital needs, and our expectation that
operating expenses are likely to increase to some extent in future quarters;
(ix) our expectations regarding the future effect of mark-to-market adjustments,
the strength and variability of future cash flows from our investments, and
our belief that future GAAP earnings may be inconsistent but should be largely
driven by the results of our recent investments in senior residential
mortgage-backed securities and by other future investments; and (x) the
intention of our board of directors to pay a regular dividend of $0.25 per share
per quarter in 2009 and our expectations: that dividends paid in 2009 will
constitute a return of capital, that tax losses will continue to increase in the
second half of 2009, that we will report a taxable loss for 2009, and that we do
not expect to pay a special dividend in 2009.
Important factors, among others, that
may affect our actual results include: changes in interest rates; changes in
mortgage prepayment rates; the timing of credit losses within our
portfolio; our exposure to adjustable-rate and negative amortization mortgage
loans; the state of the credit markets and other general economic conditions,
particularly as they affect the price of earning assets and the credit status of borrowers; the
concentration of the credit risks we are exposed to; the ability of
counterparties to satisfy their obligations to us; legislative and regulatory
actions, including those affecting the mortgage industry or our business; the
availability of high-quality assets for
purchase at attractive prices; declines in home prices and commercial real
estate prices; increases in mortgage payment delinquencies; changes in the level
of liquidity in the capital markets which may adversely affect our ability to finance our real estate
asset portfolio; changes in liquidity in the market for real estate securities,
the re-pricing of credit risk in the capital markets, inaccurate ratings of
securities by rating agencies, rating agency downgrades of securities, and increases in the supply of
real estate securities available-for-sale, each of which may adversely affect
the values of securities we own; the extent of changes in the values of
securities we own and the impact of adjustments reflecting those changes on our income statement and
balance sheet, including our stockholders’ equity; our ability to maintain our
status as a real estate investment trust (REIT) for tax purposes; our ability to
generate the amount of cash flow we expect from our investment portfolio; changes in our investment,
financing, and hedging strategies and the new risks that those changes may
expose us to; changes in the competitive landscape within our industry,
including changes that may affect our ability to retain or attract
personnel; our failure to manage various
operational risks associated with our business; our failure to maintain
appropriate internal controls over financial reporting; our failure to properly administer
and manage our securitization entities; risks we may be exposed to if we expand our business
activities, such as risks relating to significantly increasing our direct
holdings of loans; limitations imposed on our business due to our REIT status
and our status as exempt from registration under the Investment Company Act of 1940; our ability to
successfully deploy the proceeds from our recent common equity offering and
raise additional capital to fund our investing activity; and other factors not
presently identified. This Redwood Review may contain statistics and other data that in some cases have
been obtained from or compiled from information made available by servicers and
other third-party service providers.
|
2
|
THE REDWOOD
REVIEW 2ND QUARTER 2009
|
|
|
|
|
|
|
|
INTRODUCTION
|
Note
to Readers:
We file annual
reports (on Form 10-K) and quarterly reports (on Form 10-Q) with the Securities
and Exchange Commission. These filings and our earnings press releases provide
information about Redwood and our financial results in accordance with generally
accepted accounting principles (GAAP). We urge you to review these documents,
which are available through our web site, www.redwoodtrust.com.
This document,
called the Redwood Review, is an additional format for providing information
about Redwood through a discussion of many GAAP as well as non-GAAP metrics,
such as taxable income and economic book value. Supplemental information is also
provided in the Financial Tables in this Review to facilitate more detailed
understanding and analysis of Redwood. When we use non-GAAP metrics it is
because we believe that these figures provide additional insight into Redwood’s
business. In each case in which we discuss a non-GAAP metric you will find an
explanation of how it has been calculated, why we think the figure is important,
and a reconciliation between the GAAP and non-GAAP figures.
We
hope you find the Redwood Review to be helpful to your understanding of our
business. We thank you for your input and suggestions, which have resulted in
our changing the form and content of the Redwood Review over time. We welcome
your continued interest and comments.
|
Selected
Financial Highlights
|
||||||||||||
|
Quarter:Year
|
GAAP
Income
(Loss)
per
Share
|
Taxable
Income
(Loss)
per Share
|
Annualized
Return
on Equity
|
GAAP
Book
Value
per Share
|
Economic
Book
Value
per
Share (2)
|
Total
Dividends
per Share
|
||||||
|
Q207
|
$0.41
|
$1.66
|
5%
|
$31.50
|
$33.11
|
$0.75
|
||||||
|
Q307
|
($2.18)
|
$1.74
|
(29%)
|
$5.32
|
$27.55
|
$0.75
|
||||||
|
Q407
|
($36.49)
|
$0.92
|
(4,419%)
|
23.18 (1)
|
$22.29
|
$2.75
|
||||||
|
Q108
|
($5.28)
|
$0.79
|
(95%)
|
$17.89
|
$18.04
|
$0.75
|
||||||
|
Q208
|
($1.40)
|
$0.11
|
(30%)
|
$17.00
|
$16.72
|
$0.75
|
||||||
|
Q308
|
($3.34)
|
$0.07
|
(83%)
|
$12.40
|
$13.18
|
$0.75
|
||||||
|
Q408
|
($3.46)
|
($0.25)
|
(124%)
|
$9.02
|
$11.10
|
$0.75
|
||||||
|
Q109
|
($0.65)
|
($0.22)
|
(25%)
|
$8.40
|
$10.01
|
$0.25
|
||||||
|
Q209
|
$0.10
|
($0.16)
|
5%
|
$10.35
|
$11.30
|
$0.25
|
||||||
|
(1) The GAAP book value per share
is after giving retroactive effect on December 31, 2007 to the adoption of
FAS 159 on January 1, 2008. Without giving retroactive effect
to FAS 159, the GAAP book value per share was negative
$22.18.
|
||||||||||||
|
(2) Economic book value per share
is calculated using bid-side marks for our financial assets and offer-side
marks for our financial liabilities and we believe it more accurately
reflects liquidation value than does GAAP book value per
share. Economic book value is reconciled to GAAP book value in
Table 6 in the Financial Tables in this
Review.
|
|
|
THE REDWOOD
REVIEW 2ND QUARTER 2009
|
3
|
|
|
|
|
|
SHAREHOLDER
LETTER
|
Dear
Fellow Shareholders:
Our second quarter
business activity and financial results were generally in line with our plans
and expectations. We recorded positive net income on a GAAP basis, generated
substantial cash flow, and made progress on several business initiatives,
including raising additional capital through a successful public equity
offering. We welcome those shareholders who are reading the Redwood Review for
the first time and look forward to your feedback about this publication, which
is a supplemental review of our business operations.
Turning to the
financial markets, there are several indicators that are showing signs of
improvement, including firming prices for senior mortgage securities. While we
are encouraged by this development, we would caution that there are still many
near-term obstacles that remain before housing and the economy can fully
stabilize and recover, including an oversupply of homes for sale and the high
cost of jumbo mortgage loans.
We commenced
operations in 1994 as a provider of credit support to the prime jumbo mortgage
market, and in that role assisted families in obtaining mortgage credit in high
cost areas of the country. We grew our market share to where we were providing
credit enhancement to more than $172 billion of prime mortgages before scaling
back in advance of the recent market disruptions. Our core competency in
analyzing residential credit continued to serve us well when we re-entered the
market in the fall of 2008 to acquire senior securities on the secondary market
at distressed prices. This same credit expertise, coupled with the capital and
operational infrastructure we have maintained throughout this disruption, will
be the foundation we once again rely on as we work to craft, and ultimately
participate in, the mortgage financing markets of the future.
Acquiring senior
securities at attractive prices has been our primary focus during this turbulent
time, but it will eventually run its course. In the long run, the focus of our
business continues to be Redwood’s role in facilitating mortgage financing and
credit risk transfers.
What will Redwood’s
role be in the future mortgage market? While we expect to remain a leading
participant in providing credit support, the final answer to that question will
be determined in large part by the role the government chooses to play once the
current economic crisis subsides. Given the $15 trillion size of the residential
and commercial mortgage markets, we believe that private capital will need to
play a significant role. The government sponsored enterprises (Fannie Mae,
Freddie Mac, and Ginnie Mae) along with the banks, which currently finance a
combined 80% of the market, do not have the capacity to finance the entire
market. We expect that entities such as Redwood, who finance the remaining 20%
of the market, will continue to have a critical role.
Redwood supports
government and trade group efforts to restart mortgage securitization. We have
suggested potential changes for the structure of securitizations and are working
diligently with our business partners on new securitization initiatives.
Securitization has proven to be a highly efficient mechanism for matching
investors with borrowers, and is still the largest source of capital for
residential mortgage credit, although to be sure, the mortgage origination,
securitization, and ratings process must be reformed.
|
4
|
THE REDWOOD
REVIEW 2ND QUARTER 2009
|
|
|
|
|
|
|
|
SHAREHOLDER
LETTER
|
One impediment to
restarting securitization is the continuing decline of housing prices. In
addition to steps it is already taking to ensure the flow of low cost conforming
mortgage credit, we urge the federal government to work toward stabilizing
prices by reducing the supply of homes for sale. We know that allowing too many
homes to sit vacant and untended is bad public policy and depresses home prices.
We support initiatives to convert vacant housing into rental housing until the
demand from qualified homebuyers matches the supply of homes for sale. We have
shared our thoughts and specific suggestions about how to stabilize prices and
reform the securitization process with members of Congress as well as many other
market participants.
Regardless of the
extent to which private sector participation in securitization ultimately
resumes, we are confident in our ability to serve our shareholders by continuing
to be a patient, long-term focused investor and a leading provider of credit
enhancement.
We once again
welcome the many new shareholders who have joined us this year, and we thank
every shareholder for their continued trust and support.

George E. Bull,
III
Chairman
and CEO
|
|
THE REDWOOD
REVIEW 2ND QUARTER 2009
|
5
|
|
|
|
|
|
QUARTERLY
OVERVIEW
|
Second
Quarter 2009
It appears that the
worst of the systemic financial crisis is behind us (knock on wood) and, as a
nation, we are moving into a phase of fully assessing the damage and defining
the new financial rules of the road. The various stakeholders — investors,
borrowers, financial intermediaries, and the government — need to work out how
to properly balance the roles of the public and private sectors. If the early
debates are any indication, it will be a lively, passionate, and lengthy
process.
To us, one of the
most crucial questions that has not been answered is what long-term role Fannie
Mae, Freddie Mac, and the Federal Housing Administration will play in
facilitating mortgage financing – and it may be some time before we get a
definitive answer. Ultimately, our business tactics may need to adjust to what
emerges from this process, but we are ready for the challenge and feel that our
progress so far in 2009 is a strong foundation from which to move forward.
For Redwood, the
second quarter is probably best described as one in which we began to realize
the benefits of our patience and discipline and of the strategies that we put in
place to adapt to new market realities. Our GAAP and economic book value were
up, as was our cash flow, and we reported a second quarter GAAP profit. Over the
course of the quarter we invested a significant portion of our capital in
residential senior mortgage securities that we believe will yield long-term
attractive cash flows and returns. In addition, we continued to take steps to
restart our core residential credit risk franchise. The specifics on the key
metrics by which we measure our performance are highlighted below (please see
the tables in this Review for reconciliations between GAAP and non-GAAP
metrics):
|
•
|
Investment
cash flow increased to $64 million, up from $57 million in the first
quarter of 2009, and our business cash flow after operating and interest
expenses increased to $55 million, compared to $45 million in the prior
quarter;
|
|
•
|
GAAP book
value per share at the end of the second quarter was $10.35 per share, an
increase of $1.95 or 23% from the end of the first quarter, and economic
book value per share increased to $11.30, up $1.29 or 13% from the end of
the prior quarter;
|
|
•
|
GAAP net
income was $7 million, or $0.10 per share, compared with a net loss of
$0.65 per share in the first quarter (see the GAAP Income module of this
Review for more detail); and
|
|
•
|
We invested
$341 million during the second quarter and an additional $158 million in
July, primarily in selected senior seasoned RMBS, bringing total capital
invested thus far in 2009 to $597
million.
|
As a backdrop to
the discussion that follows, let us start by giving you our thoughts on the
factors impacting the residential mortgage market.
From a fundamental
standpoint, the underpinnings of the residential mortgage markets continue to
deteriorate. Housing prices continue to decline, delinquencies are still rising,
and unemployment is still heading in the wrong direction. There is some good
news — the overall rate of housing price decline is slowing and select housing
markets are showing signs of bottoming. Prepayments ticked up in the second
quarter, but that was attributable to low mortgage rates early in the year and
prepayments are beginning to moderate as mortgage rates have recently climbed.
However, and most importantly, current levels and trends in credit losses,
housing prices, and prepayment speeds continue to remain in line with the
parameters we have been using for our recent investment decisions.
|
6
|
THE REDWOOD
REVIEW 2ND QUARTER 2009
|
|
|
|
|
|
|
|
QUARTERLY
OVERVIEW
|
Second
Quarter 2009 (continued)
In the second
quarter, prices for senior RMBS rose by approximately 10% to 15%. This trend
continued early into the third quarter, as prices have moved significantly and
steadily higher. So, what is behind the dramatic move in prices? In
our opinion, it is best explained by looking back to early March 2009 when
prices were at their nadir. At that time, buyers were scarce, extremely
cautious, and were looking for attractive yields on an unlevered basis.
A lot has changed
in five months.
Buyers are now more
plentiful − and include major banks, hedge funds, broker-dealers, and new REITs
(and there are others looking to raise capital to enter this market). The
negative investment psychology has turned positive and, in some cases, is
showing signs of animal spirits. Additionally, some buyers are now willing to
pay higher prices in anticipation of enhancing yields by employing leverage that
may be available under the government’s PPIP and TALF programs (more on those
programs in the new Government Initiatives module in this Review).
The upward movement
in prices for senior RMBS has “raised all boats” — in some cases deservedly
so, and in others not. We have stuck to our game plan of buying those seasoned
senior securities that we believe are well protected on the downside, have the
potential to pay off at par, and offer the best long-term cash flow value.
Guessing where
prices might go in a volatile market is a tricky business. No one knows for
sure, especially as the run up appears to have been largely driven by technical
market and psychological factors and not fundamentals. If we had to hazard a
guess, it seems to us that the forces driving up prices have a good head of
steam. So, unless there is a change in these factors — e.g., PPIP does not play
out the way the markets are expecting — we would anticipate prices could stay at
elevated levels for some time.
So if prices stay
elevated, what would this mean for Redwood? First, it would be good
news for the overall value of our existing
portfolio. Furthermore, it could mean we may, in certain cases, sell some
securities as part of our normal portfolio management process. In fact, during
the second quarter, we sold $50 million of securities for a gain of $7 million,
and during July we sold an additional $9 million of securities for a gain
of $3 million. As far as new investments are concerned, however, we
believe it would be increasingly difficult to find senior secondary RMBS that
both meet our investment criteria and exceed our investment hurdle rates of
returns.
At the end of July,
we had $182 million of uninvested cash. You may wonder, are we concerned about
how to put it to work in this new environment? In short, the answer
is no. You can also rest assured we have no intention of relaxing our investment
discipline. We believe our long term track record over the years speaks for
itself. We are internally managed and get paid on the investment performance we
achieve for our shareholders, unlike others in our industry. We believe we could
still find select attractive investments, even if prices for RMBS in general
remain high. In addition, there is no guarantee that prices will remain
elevated. If they fall, there may, once again, be attractive opportunities for
investment.
|
|
THE REDWOOD
REVIEW 2ND QUARTER 2009
|
7
|
|
|
|
|
|
QUARTERLY
OVERVIEW
|
Second
Quarter 2009 (continued)
We also expect that
in the near term our investment focus will move more toward structured
credit-risk transfer transactions. We believe customized long-term credit risk
transfers are well suited to Redwood’s credit and structuring expertise. These
are highly illiquid, long-term investments that are appropriate for an unlevered
financing structure — a good fit for Redwood’s permanent capital. We deployed
$56 million into these types of investments during the second quarter. (Please
see the re-REMIC section of the Residential Real Estate Securities module for
details.)
Customized credit
risk transfer transactions have some characteristics that are similar to the
jumbo prime mortgage securitizations we did in the past, and we believe we are
getting closer to the day when we will be able to re-enter that business. There
is still a lot more work to do before that market begins to function again, but
seeing credit risk spreads tighten as they have during this rally gives us hope
that one of the economic barriers to the return of a healthy securitization
market may be starting to fall. We also feel that the Obama Administration’s
Financial Reform Plan reflects the government’s commitment to rehabilitating,
rather than eliminating, this financing mechanism. We are participating in the
conversations about securitization that are occurring among regulators, members
of Congress, banks, rating agencies, and other market participants, but needless
to say, there are no easy answers or quick solutions.
On the commercial
side, real estate fundamentals are in rapid decline and we believe that things
will continue to get worse before they get better. Debt holders are experiencing
rapidly rising delinquency rates. Commercial real estate owners are struggling
with plummeting property values and negative trends in rental and occupancy
rates. There is also a lack of financing alternatives (in the face of large
and looming bullet maturities) that could be a further accelerant to the
downside. Suffice to say, until we get clarity on how these issues will sort
themselves out, we will remain on the sidelines. Going forward, however, we
would like to reiterate that the commercial mortgage market remains an important
strategic area of investment for us.
Now that we have
explained where we think things are going on the investment side of our
business, you may be asking yourself about our plans to raise additional capital
in the near term. Never say never, but it seems highly unlikely that we would
raise additional common equity in 2009. We believe the cash flow from our
existing investments, together with our ability to free up capital internally
(through asset sales or other means), is sufficient to meet our short-term
capital needs.
Before you dig in
to the rest of this Review, here are some of our forward-looking thoughts on
income (GAAP and tax) and cash flow to keep in mind.
While GAAP earnings
may be bumpy for a couple of quarters, as accounting effects from our legacy
portfolio work themselves through, our future GAAP earnings will be largely
driven by our recent investments in senior RMBS. Legacy assets, including our
investments in the Fund, Sequoia, and Acacia (which have been the principal
source of pressure on earnings over the past two years as a result of impairment
charges) now represent only 12% of our total cash and investments. We look
forward to communicating our future performance through GAAP results, as GAAP
and the economics of our business track more in-line. Having said that, we would
not be Redwood if there was not a decent chance that we will do complex
transactions that result in our GAAP financials and our underlying business
economics once again diverging.
|
8
|
THE REDWOOD
REVIEW 2ND QUARTER 2009
|
|
|
|
|
|
|
|
QUARTERLY
OVERVIEW
|
Second
Quarter 2009 (continued)
As we have
explained in prior Reviews, in contrast to GAAP accounting, we are not permitted
to establish credit reserves for tax purposes. Instead, since we can only
recognize credit losses as they occur, there is a timing difference that results
in significant differences between these two earnings metrics. We expect to
report a taxable loss in 2009. Even if GAAP income remains positive, it would be
difficult to predict with precision when taxable income would turn positive, as
it would depend on the timing and inter-relationship of taxable income
generated from new investments and the recognition of taxable losses as credit
losses are realized on our legacy portfolio.
During the second
quarter, cash flow from our residential senior securities exceeded cash flow
from our subordinate securities for the first time, reflecting what we have been
communicating about the changing composition of our investment portfolio. We
expect to continue to produce strong cash flows from our
existing investments, as well as from the uninvested cash we held at the
end of July and the reinvestment of future cash flows.
In closing, we want
to say how proud we are of the Redwood team and the way they have handled the
extraordinary circumstances of the past two years. There has been a lot of
carnage on Wall Street and at financial institutions around the world, and many
formerly solid institutions have proven unable to withstand the market forces
that have shaken the global economy. In contrast, Redwood has stood firm, going
about our business in a deliberate manner, while acting aggressively to
capitalize on market opportunities and build our franchise for the future.
As always, we
appreciate your continued support.
 |
 |
|
Martin S.
Hughes
President,
Chief Financial Officer,
and
Co-Chief Operating Officer
|
Brett D.
Nicholas
Chief
Investment Officer and
Co-Chief
Operating Officer
|
|
|
THE REDWOOD
REVIEW 2ND QUARTER 2009
|
9
|
|
|
|
|
|
FINANCIAL
INSIGHTS
|
Book
Value
Summary
|
u
|
The following
supplemental non-GAAP balance sheet presents our assets and liabilities as
calculated under GAAP and adjusted to reflect our estimate of economic
value. We show our investments in the Redwood Opportunity Fund, L.P. (the
Fund) and the Sequoia and Acacia securitization entities in separate line
items, similar to the equity method of accounting, reflecting the reality
that the underlying assets and liabilities owned by these entities are
legally not ours. We own only the securities and interests that we have
acquired from these entities.
|
|
u
|
This table,
except for our estimates of economic value and the related adjustments, is
derived from the consolidating balance sheet presented on page 15. Our
estimate of economic value of $11.30 per share is calculated using
bid-side asset marks and offer-side marks for our financial liabilities,
as required to determine fair value under GAAP. This method of calculating
economic value more closely represents liquidation value and does not
represent the higher amount we would have to pay at the offered-side to
replace our existing assets.
|
|
Components
of Book Value
|
|||||||||||||
|
June
30, 2009
|
|||||||||||||
|
($
in millions, except per share data)
|
|||||||||||||
|
As
Reported
|
Adj.
|
Management's
Estimate of Economic Value
|
|||||||||||
|
Cash and cash
equivalents
|
$ | 337 | $ | 337 | |||||||||
|
Real estate securities at
Redwood
|
|||||||||||||
|
Residential
|
499 | 499 | |||||||||||
|
Commercial
|
16 | 16 | |||||||||||
|
CDO
|
2 | 2 | |||||||||||
|
Total real estate securities at
Redwood
|
517 | 517 | |||||||||||
|
Investments in the
Fund
|
22 | 22 | |||||||||||
|
Investments in
Sequoia
|
82 | (26 | ) | (a) | 56 | ||||||||
|
Investments in
Acacia
|
4 | 1 | (b) | 5 | |||||||||
|
Total securities and
investments
|
$ | 625 | $ | 600 | |||||||||
|
Long-term
debt
|
(150 | ) | 99 | (c) | (51 | ) | |||||||
|
Other assets/liabilities, net
(d)
|
(10 | ) | (10 | ) | |||||||||
|
Stockholders'
equity
|
$ | 802 | $ | 876 | |||||||||
|
Book value per
share
|
$ | 10.35 | $ | 11.30 | |||||||||
(a)
Our Sequoia investments consist of senior and subordinate securities and
interest-only securities issued by Sequoia entities. We calculated the $56
million estimate of economic value for these securities using the same valuation
process that we followed to fair value our other real estate securities. In
contrast, the $82 million of GAAP carrying value of these investments represents
the difference between residential real estate loans owned by the Sequoia
entities and the asset-backed securities (ABS) issued by these entities to
third-party investors. Under GAAP, we account for these loans and ABS issued at
cost.
(b)
Our $5 million estimate of economic value represents the fair value of our
investment in ABS issued by Acacia using the same valuation process we followed
to value our other real estate securities, plus the net present value of
projected cash flows from our Acacia management fees. In contrast, the $4
million of GAAP carrying value of these investments represents the difference
between real estate securities owned by the Acacia entities and the ABS issued
by these entities to third-party investors. Under GAAP, we account for these
securities and ABS issued at fair value.
(c)
As of June 30, 2009, we had $150 million of 30-year long-term debt that matures
in 2037 at an interest rate of LIBOR plus 225 basis points. Under GAAP, this
debt is carried at cost. Economic value can be difficult to estimate due to a
generally inactive trading market for this debt. In July 2009, we repurchased
$10 million of this debt at a market price equal to 34% of face value and
utilized this price to calculate our $51 million estimate of economic value.
(d)
Other assets/liabilities, net are comprised of $3 million of real estate loans,
$2 million of deferred taxes, $7 million of accrued interest receivable, and $13
million of other assets, less dividends payable of $19 million and accrued
interest and other liabilities of $16 million.
|
10
|
THE REDWOOD
REVIEW 2ND QUARTER 2009
|
|
|
|
|
|
|
|
FINANCIAL
INSIGHTS
|
Book
Value (continued)
Summary
(continued)
|
u
|
During the
second quarter, our GAAP book value increased by $1.95 per share to
$10.35. The increase resulted from $1.22 per share of accretion from our
June equity offering, $0.52 per share from positive MVA, $0.46 per share
from positive earnings before MVA, less $0.25 per share of dividends.
|
|
u
|
During the
second quarter, our economic book value increased by $1.29 per share to
$11.30. The increase resulted from $0.86 per share of accretion from our
June equity offering, $0.82 per share from net cash flows and net positive
MVA on our investments, less $0.14 per share of cash operating and
interest expenses and $0.25 per share of dividends.
|
Quarterly
Activity
|
u
|
The table
below highlights the components that led to an increase in the fair value
of securities at Redwood (which is the same as GAAP carrying value) from
$191 million at December 31, 2008 to $517 million at June 30, 2009.
|
|
Real
Estate Securities at Redwood
|
||||||||
|
($ in
millions)
|
||||||||
|
Three
months ended,
|
||||||||
|
June
30,
2009
|
March
31, 2009
|
|||||||
|
Beginning fair
value
|
$ | 221 | $ | 191 | ||||
|
Acquisitions
|
341 | 98 | ||||||
|
Sales
|
(50 | ) | (1 | ) | ||||
|
Effect of principal
payments
|
(13 | ) | (5 | ) | ||||
|
Change in fair value,
net
|
18 | (62 | ) | |||||
|
Ending fair
value
|
$ | 517 | $ | 221 | ||||
|
u
|
During the
second quarter, we acquired $341 million in residential securities,
consisting of $283 million of prime and Alt-A senior securities, $56
million of prime re-REMIC securities, and $2 million of prime subordinate
securities. Further information on these acquisitions and an explanation
of re-REMIC securities can be found in the Residential Real Estate
Securities module later in this
Review.
|
|
u
|
In July 2009,
we acquired $158 million in residential senior securities.
|
|
u
|
We sold $50
million of securities in the second quarter and generated a gain of $7
million. The sales consisted of securities which had increased in market
value to a price we did not believe was justified by the underlying
fundamentals. In July, we sold $9 million of securities and generated a
gain of $3 million. We continually manage our portfolio and may sell
additional assets as conditions
merit.
|
|
|
THE REDWOOD
REVIEW 2ND QUARTER 2009
|
11
|
|
|
|
|
|
FINANCIAL
INSIGHTS
|
Book
Value (continued)
Cash,
Securities, and Investments
|
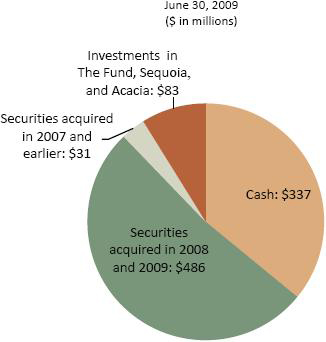
u
|
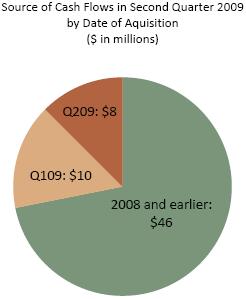
Our future
earnings are now largely dependent upon how well the senior securities we
have been purchasing perform and on the performance of future acquisitions
as we deploy our existing cash balance. This point is highlighted in the
chart below, which shows our cash, securities, and investments at June 30,
2009, with our securities segmented by acquisition dates.
|
Cash,
Securities, and Investments at Redwood
|
u
|
Securities
acquired in 2008 and 2009, which are predominately residential senior
securities, combined with cash, represent 88%, or $10.62 per share, of
total cash, securities, and investments at June 30,
2009.
|
|
u
|
Securities
acquired in 2007 and earlier, which are predominately subordinated
residential and commercial securities, and investments in the Fund,
Sequoia, and Acacia, represent 12%, or $1.47 per share, of total cash,
securities, and investments at June 30, 2009.
|
|
12
|
THE REDWOOD
REVIEW 2ND QUARTER 2009
|
|
|
|
|
|
|
|
FINANCIAL
INSIGHTS
|
Book
Value (continued)
Components
Cash
and Cash Equivalents
|
u
|
At June 30,
2009, we had $337 million in cash and cash equivalents. All of our cash is
currently invested in U.S. Treasury Bills or bank deposits insured by the
Federal Deposit Insurance
Corporation.
|
Real
Estate Securities at Redwood
|
u
|
As we
forewarned in prior quarters, the rating agencies have now issued a
substantial number of downgrades and the large majority of mortgage-backed
securities issued from 2005 through 2008 have now been downgraded. Many of
the downgrades have been severe (i.e., from AAA-rated to below investment
grade). These downgrades have provided investment opportunities for us as
investors who have ratings-based investment limitations or regulatory
risk-based capital requirements have, in some cases, been under pressure
to sell securities.
|
|
u
|
We do not
rely on credit ratings as part of our investment decision process. Our
investment decisions are based on our projection of the underlying
collateral cash flows, the level of subordination protecting against
projected future losses, and the priority of cash flow received by the
security. If, for example, a security originally rated AAA is downgraded
to below investment grade, it is still in the most senior position with
respect to cash flows.
|
|
u
|
The following
table presents the components of fair value (which equals GAAP carrying
value) for real estate securities at Redwood at June 30, 2009. Consistent
with our presentation last quarter, we now segment our securities
portfolio by senior and subordinate cash flow categories. We also break
out the re-REMIC securities we acquired in the second quarter.
|
|
Real
Estate Securities at Redwood
|
||||||||||||||||||||
|
June 30,
2009
|
||||||||||||||||||||
|
($ in
millions)
|
||||||||||||||||||||
|
%
of Total
|
||||||||||||||||||||
|
<=2004
|
2005
|
2006-2008
|
Total
|
Securities
|
||||||||||||||||
|
Residential
|
||||||||||||||||||||
|
Seniors
|
||||||||||||||||||||
|
Prime
|
$ | 11 | $ | 153 | $ | 19 | $ | 183 | 35 | % | ||||||||||
|
Non-prime
|
113 | 102 | 16 | 231 | 44 | % | ||||||||||||||
|
Total
Seniors
|
$ | 124 | $ | 255 | $ | 35 | $ | 414 | 79 | % | ||||||||||
|
Re-REMIC
|
||||||||||||||||||||
|
Prime
|
$ | - | $ | 2 | $ | 53 | $ | 55 | 11 | % | ||||||||||
|
Total
Re-REMIC
|
$ | - | $ | 2 | $ | 53 | $ | 55 | 11 | % | ||||||||||
|
Subordinates
|
||||||||||||||||||||
|
Prime
|
$ | 19 | $ | 4 | $ | 3 | $ | 26 | 5 | % | ||||||||||
|
Non-prime
|
1 | 1 | 2 | 4 | 1 | % | ||||||||||||||
|
Total
Subordinates
|
$ | 20 | $ | 5 | $ | 5 | $ | 30 | 6 | % | ||||||||||
|
Total
Residential
|
$ | 144 | $ | 262 | $ | 93 | $ | 499 | 96 | % | ||||||||||
|
Commercial
Subordinates
|
$ | 8 | $ | 2 | $ | 6 | $ | 16 | 3 | % | ||||||||||
|
CDO
Subordinates
|
$ | - | $ | 2 | $ | - | $ | 2 | 1 | % | ||||||||||
|
Total
|
$ | 152 | $ | 266 | $ | 99 | $ | 517 | 100 | % | ||||||||||
|
|
THE REDWOOD
REVIEW 2ND QUARTER 2009
|
13
|
|
|
|
|
|
FINANCIAL
INSIGHTS
|
Book
Value (continued)
Components
(continued)
Investments
in the Fund, Sequoia, and Acacia
|
u
|
Our
investments in the Fund, Sequoia, and Acacia totaled $108 million, or 14%
of our securities and investments at June 30,
2009.
|
|
•
|
The fair
value (which equals GAAP carrying value) of our investments in the Fund
was $22 million at June 30, 2009. This investment represents a 52%
interest in the Fund, which closed in March 2008 and is fully invested,
primarily in non-prime RMBS. The Fund is managed by a subsidiary of
Redwood.
|
|
•
|
At June 30,
2009, the fair value of our investments in Sequoia was $56 million and the
GAAP carrying value was $82 million. These investments consist primarily
of interest-only securities (IOs) and to a lesser extent senior and
subordinate securities. Our returns on these IOs are most sensitive to
prepayments and faster prepayments would negatively impact returns.
Material changes in interest rates also have a short-term impact on cash
flows received from these assets.
|
|
•
|
At June 30,
2009, the fair value of our investments in Acacia was $5 million and the
GAAP carrying value (which equals fair value) was $4 million. These
investments consist of equity interests and securities in the Acacia CDO
entities we sponsor. We value the management fees at $4 million, which
equals our projected management fees discounted at a 45%
rate.
|
Debt
|
u
|
We had no
short-term debt at June 30, 2009. We currently believe that it is prudent
to fund our investments with permanent capital (equity and long-term debt)
that is not subject to margin calls and financial
covenants.
|
|
u
|
As of June
30, 2009, we had $150 million of long-term debt at Redwood due in 2037.
Under GAAP, this debt is carried at cost. In July 2009, we repurchased $10
million of this debt at a market price equal to 34% of face value and
utilized this price to calculate our $51 million estimate of economic
value for these obligations.
|
|
14
|
THE REDWOOD
REVIEW 2ND QUARTER 2009
|
|
|
|
|
|
|
|
FINANCIAL
INSIGHTS
|
Book
Value (continued)
Consolidating
Balance Sheet
|
u
|
GAAP requires
us to consolidate all of the assets and liabilities of the Sequoia and
Acacia securitization entities (which had a combined $4.4 billion of
assets and $4.3 billion of liabilities at June 30, 2009), even though the
assets are owned by securitization entities and the liabilities are
obligations of these securitization entities payable only from the cash
flows generated by the assets owned by these entities. Additionally, we
are required to consolidate all of the assets and liabilities of the Fund,
since Redwood owns the general partnership interest in the Fund and just
over half of the limited partnership
interests.
|
|
u
|
The table
below shows the consolidating components of our consolidated balance sheet
at June 30, 2009. The purpose of this presentation is to show the effect
each of the components had on our consolidated shareholders’ equity. The
Fund, Sequoia, and Acacia components represent investments and are not
separate business segments.
|
|
Consolidating Balance
Sheet
|
||||||||||||||||||||||||
|
June
30, 2009
|
||||||||||||||||||||||||
|
($
in millions)
|
||||||||||||||||||||||||
|
Redwood
|
||||||||||||||||||||||||
|
Redwood
|
The
Fund
|
Sequoia
|
Acacia
|
Intercompany
|
Consolidated
|
|||||||||||||||||||
|
Real estate
loans
|
$ | 3 | $ | - | $ | 3,955 | $ | 8 | $ | - | $ | 3,966 | ||||||||||||
|
Real estate
securities
|
517 | 38 | - | 304 | (55 | ) | 804 | |||||||||||||||||
|
Investments in the
Fund
|
22 | - | - | - | (22 | ) | - | |||||||||||||||||
|
Investments in
Sequoia
|
82 | - | - | - | (82 | ) | - | |||||||||||||||||
|
Investments in
Acacia
|
4 | - | - | - | (4 | ) | - | |||||||||||||||||
|
Other
investments
|
- | - | - | 47 | - | 47 | ||||||||||||||||||
|
Cash and cash
equivalents
|
337 | - | - | - | - | 337 | ||||||||||||||||||
|
Total earning
assets
|
965 | 38 | 3,955 | 359 | (163 | ) | 5,154 | |||||||||||||||||
|
Other
assets
|
22 | 4 | 27 | 78 | - | 131 | ||||||||||||||||||
|
Total
assets
|
$ | 987 | $ | 42 | $ | 3,982 | $ | 437 | $ | (163 | ) | $ | 5,285 | |||||||||||
|
Short-term
debt
|
$ | - | $ | - | $ | - | $ | - | $ | - | $ | - | ||||||||||||
|
Other
liabilities
|
35 | 2 | 2 | 146 | - | 185 | ||||||||||||||||||
|
Asset-backed securities issued -
Sequoia
|
- | - | 3,898 | - | (55 | ) | 3,843 | |||||||||||||||||
|
Asset-backed securities issued -
Acacia
|
- | - | - | 287 | - | 287 | ||||||||||||||||||
|
Long-term
debt
|
150 | - | - | - | - | 150 | ||||||||||||||||||
|
Total
liabilities
|
185 | 2 | 3,900 | 433 | (55 | ) | 4,465 | |||||||||||||||||
|
Stockholders’
equity
|
802 | 22 | 82 | 4 | (108 | ) | 802 | |||||||||||||||||
|
Noncontrolling
interest
|
- | 18 | - | - | - | 18 | ||||||||||||||||||
|
Total equity
|
802 | 40 | 82 | 4 | (108 | ) | 820 | |||||||||||||||||
|
Total liabilities and
stockholders’ equity
|
$ | 987 | $ | 42 | $ | 3,982 | $ | 437 | $ | (163 | ) | $ | 5,285 | |||||||||||
|
|
THE REDWOOD
REVIEW 2ND QUARTER 2009
|
15
|
|
|
|
|
|
FINANCIAL
INSIGHTS
|
Cash
Flow
|
u
|
The sources
and uses of cash in the table below are derived from our GAAP Consolidated
Statement of Cash Flows for the second quarter of 2009 by aggregating and
netting all items in a manner consistent with the way management analyzes
them. This table excludes the gross cash flows generated by our Sequoia
and Acacia securitization entities and the Fund (cash flows that are not
available to Redwood), but does include the cash flows distributed to
Redwood as a result of our investments in these entities. The beginning
and ending cash balances presented in the table below are GAAP
amounts.
|
|
Redwood
|
||||||||
|
Sources
and Uses of Cash
|
||||||||
|
($
in millions)
|
||||||||
|
Three
Months Ended
|
||||||||
|
6/30/09
|
3/31/09
|
|||||||
|
Beginning cash
balance
|
$ | 333 | $ | 126 | ||||
|
Business Cash
Flows:
|
||||||||
|
Cash flow from securities and
investments
|
$ | 64 | $ | 57 | ||||
|
Asset management
fees
|
1 | 1 | ||||||
|
Operating
expenses
|
(8 | ) | (11 | ) | ||||
|
Interest expense on
long-term debt
|
(2 | ) | (2 | ) | ||||
|
Total business cash
flows
|
55 | 45 | ||||||
|
Other Sources and
Uses:
|
||||||||
|
Proceeds from asset
sales
|
57 | 1 | ||||||
|
Proceeds from equity
issuance
|
238 | 285 | ||||||
|
Changes in working
capital
|
4 | 1 | ||||||
|
Acquistions
|
(334 | ) | (98 | ) | ||||
|
Dividends
|
(16 | ) | (27 | ) | ||||
|
Net other (uses)
sources
|
(51 | ) | 162 | |||||
|
Net sources (uses) of
cash
|
$ | 4 | $ | 207 | ||||
|
Ending cash
balance
|
$ | 337 | $ | 333 | ||||
|
u
|
Second
quarter business cash flow totaled $55 million, up $10 million from the
first quarter, as cash flow from our investment portfolio increased by $7
million and cash operating expenses declined by $3 million. Our operating
expenses are likely to increase to some extent in future quarters as we
enhance our platform and focus on long-term business initiatives.
|
|
u
|
Second
quarter acquisitions were $341 million. The table above reflects
acquisitions of $334 million, as $7 million of these acquisitions were
executed in June, but settled in July.
|
|
u
|
Second
quarter cash flow from securities and investments of $64 million included
$31 million of coupon interest and $33 million of principal. We caution
readers that given the nature of our investments (deep discount
subordinated securities, senior securities acquired at discounts, IOs,
equity investments in Acacia, and other types) it is difficult to draw
conclusions in any one period about what portion of our cash flow
represents “income” and what is a “return of capital.” It is only at the
end of an asset’s life that we can accurately determine what portion of
the cumulative cash received (whether principal or interest) was truly
income and what was a return of
capital.
|
|
16
|
THE REDWOOD
REVIEW 2ND QUARTER 2009
|
|
|
|
|
|
|
|
FINANCIAL
INSIGHTS
|
Cash
Flow (continued)
|
u
|
The table
below presents the components of our cash flow from securities and
investments for the first and second quarters of
2009.
|
|
Redwood
|
||||||||
|
Cash
Flow From Securities and Investments
|
||||||||
|
($ in
millions)
|
||||||||
|
Three Months
Ended
|
||||||||
|
6/30/09
|
3/31/09
|
|||||||
|
Securities at
Redwood
|
||||||||
|
Residential
Senior
|
$ | 26 | $ | 10 | ||||
|
Residential
Subordinate
|
18 | 20 | ||||||
|
Commercial and
CDO
|
4 | 5 | ||||||
|
Total Cash Flow from Securities
at Redwood
|
48 | 35 | ||||||
|
Investments in the
Fund
|
2 | 3 | ||||||
|
Investments in
Sequoia
|
13 | 18 | ||||||
|
Investments in
Acacia
|
1 | 1 | ||||||
|
Total Cash Flow from Securities
and Investments
|
$ | 64 | $ | 57 | ||||
|
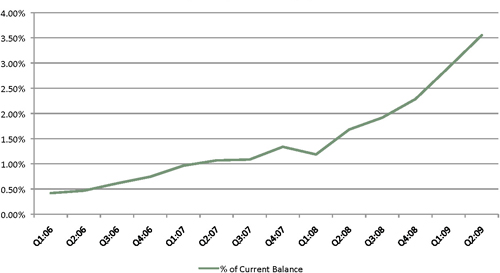
u
|
As expected,
with new acquisitions, primarily in senior securities, our quarterly cash
flow continued to increase. The chart below shows how much of our cash
flow in the second quarter was derived from the portfolio we owned at the
beginning of the year, how much was derived from first quarter
acquisitions, and how much was derived from second quarter
acquisitions.
|
Cash
Flow from Securities and Investments
|
|
THE REDWOOD
REVIEW 2ND QUARTER 2009
|
17
|
|
|
|
|
|
FINANCIAL
INSIGHTS
|
Cash
Flow (continued)
|
u
|
Depending on
the timing of acquisitions within a quarter and the cash remittance cycle
between trustees and investors, it could take one to two months before we
are generating cash flows from acquisitions. This is illustrated by our
second quarter acquisitions of $341 million that generated only $2 million
in cash interest in the quarter. (These second quarter acquisitions also
generated $6 million of principal payments.) We expect to receive closer
to $9 million in cash interest in the third quarter since the face value
of these acquisitions was $706 million and the average coupon was 5.17%.
In addition, we will be receiving principal as the underlying mortgages
prepay. As a result, our cash flows in future quarters from these second
quarter acquisitions should increase
substantially.
|
|
u
|
Since we are
acquiring more senior securities, the cash flows we receive every quarter
will be increasingly dependent on prepayment speeds, and since prepayments
will vary, there will be some volatility in the cash flows generated by
our senior portfolio.
|
|
u
|
Cash flow
generated from our residential subordinated securities totaled $18 million
in the second quarter, compared to $20 million in the first quarter. In
the second quarter, we received $10 million from principal payments and $8
million from interest. We earn cash interest payments on the face value
($622 million at June 30, 2009), which is reduced by principal paydowns
and credit losses. Credit losses can vary significantly from period to
period and totaled $127 million in the second quarter, compared to $137
million in the first quarter. We expect credit losses will remain at
elevated levels and thus, cash flows will trend down, and, if the expected
credit losses occur quickly, the decline in cash flows from
this portfolio could be
rapid.
|
|
u
|
The decrease
in cash flow from our investments in Sequoia resulted from lower spread
income from the IO securities we own. The spread narrowed as the loan
coupons reset down in the second quarter following the downward resets on
the related debt in the first quarter. Our IO securities generated $12
million of the $13 million in Sequoia cash flow in the second
quarter.
|
|
18
|
THE REDWOOD
REVIEW 2ND QUARTER 2009
|
|
|
|
|
|
|
|
GOVERNMENT
INITIATIVES
|
Summary
What
is this?
This
section provides a summary of the major government initiatives affecting our
business and industry and discusses how these initiatives may impact us. We have
added this section to this quarter’s Redwood Review in order to give you our
summary of, and analysis and observations about, these initiatives.
Public-Private
Investment Program (PPIP)
|
u
|
Description.
In March 2009, the FDIC, the Federal Reserve, and the Treasury Department
announced the PPIP, a program designed to facilitate the formation of
private investment funds to purchase so-called “toxic
assets”
from financial institutions. By providing equity capital to match
privately-raised capital, and with government provided leverage, PPIP was
designed to spur the purchase of up to $1 trillion of legacy real estate
assets (loans and securities), thereby freeing up bank balance sheets for
new lending. In July, the government announced the initial nine asset
managers it had selected for the program.
|
|
u
|
Observations
and Impact on Redwood. The program is currently expected to be $40
billion in size, which falls far short of the original goal. As a result,
the program appears able to address only a fraction of the approximately
$1.4 trillion of eligible outstanding RMBS. PPIP managers will be able to
use modest 2:1 leverage supplied by the government to buy RMBS, which we
believe has contributed to (but is not the sole cause of) the recent price
rally for senior RMBS. The program appears to be better suited for the
CMBS market, since PPIP investment funds can access TALF (see below) and
obtain 5:1 leverage for CMBS investments, and this has likely contributed
significantly to the stronger rally in prices for TALF-eligible CMBS.
Redwood decided not to participate as a PPIP manager in part because the
economics were not compelling, but more importantly, because there were
significant potential conflicts that could have put limitations on our
core business. In the future, PPIP investment funds may compete with us
when we are bidding on PPIP eligible assets. We may also sell assets to
these funds if we believe prices have outpaced the
fundamentals.
|
Term
Asset-Backed Securities Loan Facility (TALF)
|
u
|
Description.
In November 2008, the Federal Reserve announced the launch of this $200
billion non-recourse lending facility. TALF enables investors to borrow
from the Federal Reserve to finance the acquisition of eligible ABS.
Initially limited to ABS collateralized by new student loans, auto loans,
credit card loans, and Small Business Administration loans, TALF was
subsequently expanded to include legacy CMBS. There has been a high degree
of speculation that TALF will be expanded to include legacy RMBS, although
both legacy and newly issued RMBS currently remain ineligible.
|
|
|
THE REDWOOD
REVIEW 2ND QUARTER 2009
|
19
|
|
|
|
|
|
GOVERNMENT
INITIATIVES
|
Term
Asset-Backed Securities Loan Facility (TALF) (continued)
|
u
|
Observations
and Impact on Redwood. The leveraged financing available under TALF
appears attractive for eligible assets. Although certain seasoned CMBS are
eligible collateral, we believe the commercial real estate fundamentals
are in rapid decline and will get worse before they get better and have
decided not to participate at this time. We remain skeptical that seasoned
RMBS will become eligible collateral, but we support making newly
originated RMBS eligible for TALF because it would help banks (by freeing
up capital) and provide additional credit for borrowers, which together
would be beneficial for the economy. We would consider using TALF as a
source of leverage for RMBS if — and these are big ifs — we can get
comfortable with the resulting liquidity risk and any operating
restrictions that may be imposed by the government. For the time being, we
will continue to acquire assets without assuming we will be able to
utilize TALF (i.e., based upon unlevered return expectations).
|
|
|
So far,
TALF’s primary impact on Redwood has been that it has somewhat contributed
to the rally in senior RMBS in anticipation of being able to access TALF.
Several competitors have announced plans to raise capital and invest in
RMBS — again, in advance of RMBS actually being eligible for TALF.
|
Loan
Modification and Refinancing Programs
|
u
|
Description.
Various loan modification and refinancing programs have been implemented
by the Bush and Obama Administrations and Congress over the past year.
These programs provide incentives and safe harbor protections for
servicers to modify interest rates, capitalize arrearages, and postpone
scheduled repayments of principal. The government has also permitted
borrowers to refinance Fannie Mae or Freddie Mac loans with up to a 125%
loan-to-value ratio if one of those two entities already owns the risk
associated with the borrower’s mortgage.
|
|
u
|
Observations
and Impact on Redwood. Modifications have always been a part of
securitization structures, but they were subject to strict parameters to
protect investors. The current loan modification programs, when coupled
with the statutory safe harbor for servicers, may be detrimental to
restarting the securitization markets, as they potentially undermine
contract law. In anticipation of an increase in the number of loan
modifications, Redwood has been investing in RMBS backed by loans that we
believe are less likely to be impacted (such as prime and seasoned Alt-A
loans). Since the beginning of 2008, 10% (by dollar amount) of non-Agency
securitized loans have been modified, and the large majority of the
modifications have been to subprime (52%) and option ARM (35%) loans,
while Alt-A (11%) and prime (2%) loans have experienced fewer
modifications (according to data from JPMorgan).
|
Obama
Administration’s Financial Regulatory Reform Proposal
|
u
|
On June 17,
2009, the Obama Administration unveiled its proposed plan for Financial
Regulatory Reform. Many aspects of the reform plan would impact Redwood’s
business if they are enacted and implemented as proposed. Two of the most
relevant portions of the plan relate to reforming securitization and the
future roles of Fannie Mae and Freddie Mac. We would note that while this
plan outlines the Administration's direction of financial reform, we
believe there will likely be significant changes after all the debates are
settled and the details ironed-out.
|
|
20
|
THE REDWOOD
REVIEW 2ND QUARTER 2009
|
|
|
|
|
|
|
|
GOVERNMENT
INITIATIVES
|
Regulatory
Reform Plan – Securitization Reform
|
u
|
Description.
The reform plan is aimed at strengthening supervision and regulation of
securitization markets and proposes several initiatives, including:
requiring originators to retain a 5% economic interest in the securitized
credit exposure, aligning compensation with longer term performance,
increasing transparency, and reforming the credit rating
process.
|
|
u
|
Observation
and Impact on Redwood. Restarting the securitization market would
be positive for Redwood and we generally support this part of the plan and
take comfort that the Administration recognizes the need to reform and
restart securitization, which has proven to be a highly efficient
mechanism for financing residential mortgage credit. While Redwood’s
business model includes retaining an economic interest in securitizations,
we think the proposed 5% retention rule should vary depending on the risk
of the underlying assets (which could result in a higher or lower
percentage of risk retention) and we expect that industry feedback will
result in a more tailored risk retention rule.
|
Regulatory
Reform Plan – Future of Fannie Mae and Freddie Mac
|
u
|
Description.
Another portion of the reform plan is aimed at determining the future role
of Fannie Mae and Freddie Mac, the two largest participants in the
residential mortgage financing market, both of which are currently
operating under conservatorship. The reform plan suggests several options
for consideration, including: winding down their activities, breaking up
their businesses into smaller companies, or having them operate in a
public utility model.
|
|
u
|
Observation
and Impact on Redwood. It is difficult to speculate on exactly what
the outcome will be for Fannie Mae and Freddie Mac, as their fate will
likely depend to a large extent on the state of the housing and credit
markets, the economy, and the budget deficit when, and if, any proposal is
eventually brought before Congress. Given the enormous size ($11 trillion)
of the residential mortgage market, there may not be support for
continuing to concentrate substantial mortgage risk within the government
through these entities. In fact, under current law and regulation, both
entities are required to begin shrinking by 10% per year starting in 2010.
On the other hand, they have been one of the primary means through which
the federal government has implemented policies aimed at expanding, and
making affordable, home ownership — goals which continue to have broad
appeal, but which have not necessarily been successfully implemented in
the past to the detriment of the housing market.
|
|
|
Because of
their current size and role, any change in Fannie Mae’s and Freddie Mac’s
purpose and mandate, or any change in the manner in which they operate and
finance themselves, will likely have broad implications for participants
in the industry, including potentially positive or negative implications
for Redwood.
|
|
|
THE REDWOOD
REVIEW 2ND QUARTER 2009
|
21
|
|
|
|
|
|
GAAP INCOME
|
Summary
What
is this?
GAAP
income is income calculated under generally accepted accounting principles in
the United
States.
Quarterly
Update
|
u
|
Our reported
GAAP income was $7 million ($0.10 per share) for the second quarter of
2009, as compared to a loss of $35 million ($0.65 per share) for the first
quarter of 2009. Our second quarter earnings reflected $35 million of net
interest income before giving effect to a $15 million (or $0.23 per share)
loan loss provision at Sequoia and $29 million (or $0.44 per share) of
negative MVA. Our earnings benefited from a $19 million ($0.29 per share)
non-recurring gain related to the deconsolidation of a Sequoia
securitization trust as well as a $7 million ($0.11 per share) gain from
the sale of securities.
|
|
u
|
The following
table provides a summary of our GAAP income (loss) for the first and
second quarters of 2009.
|
|
GAAP
Income (Loss)
|
||||||||
|
($
in millions, except per share data)
|
||||||||
|
Three
Months Ended
|
||||||||
|
6/30/09
|
3/31/09
|
|||||||
|
Interest
income
|
$ | 74 | $ | 82 | ||||
|
Interest
expense
|
(39 | ) | (48 | ) | ||||
|
Net interest
income
|
35 | 34 | ||||||
|
Provision for loan
losses
|
(15 | ) | (16 | ) | ||||
|
Market valuation adjustments,
net
|
(29 | ) | (43 | ) | ||||
|
Net interest income (loss) after
provision and market valuation adjustments
|
(9 | ) | (25 | ) | ||||
|
Operating
expenses
|
(11 | ) | (11 | ) | ||||
|
Realized gains,
net
|
26 | - | ||||||
|
Noncontrolling
interest
|
- | 1 | ||||||
|
Benefit from (provision for)
income taxes
|
1 | - | ||||||
|
GAAP income
(loss)
|
$ | 7 | $ | (35 | ) | |||
|
GAAP income (loss) per
share
|
$ | 0.10 | $ | (0.65 | ) | |||
|
22
|
THE REDWOOD
REVIEW 2ND QUARTER 2009
|
|
|
|
|
|
|
|
GAAP INCOME
|
Quarterly
Update (continued)
|
u
|
The table
below shows the consolidating components of our income statements for the
second and first quarters of 2009. The purpose of this presentation is to
show the effect each of the components had on our reported income (loss)
for these periods. The Fund, Sequoia, and Acacia components represent
investments and are not separate business
segments.
|
|
Consolidating
Income Statement
|
||||||||||||||||||||||||
|
Three Months Ended June 30,
2009
|
||||||||||||||||||||||||
|
($ in
millions)
|
||||||||||||||||||||||||
|
Redwood
|
The
Fund
|
Sequoia
|
Acacia
|
Intercompany
Adjustments
|
Redwood
Consolidated
|
|||||||||||||||||||
|
Interest
income
|
$ | 18 | $ | 1 | $ | 34 | $ | 22 | $ | (1 | ) | $ | 74 | |||||||||||
|
Net discount (premium)
amortization
|
3 | 1 | (4 | ) | - | - | - | |||||||||||||||||
|
Total interest
income
|
21 | 2 | 30 | 22 | (1 | ) | 74 | |||||||||||||||||
| - | - | - | - | - | ||||||||||||||||||||
|
Management
fees
|
1 | - | - | - | (1 | ) | - | |||||||||||||||||
|
Interest
expense
|
(2 | ) | - | (23 | ) | (16 | ) | 2 | (39 | ) | ||||||||||||||
|
Net interest
income
|
20 | 2 | 7 | 6 | - | 35 | ||||||||||||||||||
| - | - | - | - | - | ||||||||||||||||||||
|
Provision for loan
losses
|
- | - | (15 | ) | - | - | (15 | ) | ||||||||||||||||
|
Market valuation adjustments,
net
|
(32 | ) | (1 | ) | (1 | ) | 5 | - | (29 | ) | ||||||||||||||
|
Net interest income (loss) after
provision and market valuation adjustments
|
(12 | ) | 1 | (9 | ) | 11 | - | (9 | ) | |||||||||||||||
| - | - | - | - | - | ||||||||||||||||||||
|
Operating
expenses
|
(11 | ) | - | - | - | - | (11 | ) | ||||||||||||||||
|
Realized gains,
net
|
7 | - | 19 | - | - | 26 | ||||||||||||||||||
|
Gain (loss) from the Fund,
Sequoia, and Acacia
|
22 | - | - | - | (22 | ) | - | |||||||||||||||||
|
Noncontrolling
interest
|
- | - | - | - | - | - | ||||||||||||||||||
|
Benefit from (provision for)
income taxes
|
1 | - | - | - | - | 1 | ||||||||||||||||||
|
Net income
(loss)
|
$ | 7 | $ | 1 | $ | 10 | $ | 11 | $ | (22 | ) | $ | 7 | |||||||||||
|
Consolidating
Income Statement
|
||||||||||||||||||||||||
|
Three Months Ended March 31,
2009
|
||||||||||||||||||||||||
|
($ in
millions)
|
||||||||||||||||||||||||
|
Redwood
|
The
Fund
|
Sequoia
|
Acacia
|
Intercompany
Adjustments
|
Redwood
Consolidated
|
|||||||||||||||||||
|
Interest
income
|
$ | 26 | $ | 3 | $ | 34 | $ | 22 | $ | 1 | $ | 86 | ||||||||||||
|
Net discount (premium)
amortization
|
(4 | ) | - | - | - | - | (4 | ) | ||||||||||||||||
|
Total interest
income
|
22 | 3 | 34 | 22 | 1 | 82 | ||||||||||||||||||
|
Management
fees
|
1 | - | - | - | (1 | ) | - | |||||||||||||||||
|
Interest
expense
|
(2 | ) | - | (25 | ) | (21 | ) | - | (48 | ) | ||||||||||||||
|
Net interest
income
|
21 | 3 | 9 | 1 | - | 34 | ||||||||||||||||||
|
Provision for loan
losses
|
- | - | (16 | ) | - | - | (16 | ) | ||||||||||||||||
|
Market valuation adjustments,
net
|
(26 | ) | (4 | ) | (1 | ) | (12 | ) | - | (43 | ) | |||||||||||||
|
Net interest income (loss) after
provision and market valuation adjustments
|
(5 | ) | (1 | ) | (8 | ) | (11 | ) | - | (25 | ) | |||||||||||||
|
Operating
expenses
|
(11 | ) | - | - | - | - | (11 | ) | ||||||||||||||||
|
Realized gains,
net
|
- | - | - | - | - | - | ||||||||||||||||||
|
Loss from the Fund, Sequoia, and
Acacia
|
(19 | ) | - | - | - | 19 | - | |||||||||||||||||
|
Noncontrolling
interest
|
- | 1 | - | - | - | 1 | ||||||||||||||||||
|
Benefit from (provision for)
income taxes
|
- | - | - | - | - | - | ||||||||||||||||||
|
Net (loss)
income
|
$ | (35 | ) | $ | - | $ | (8 | ) | $ | (11 | ) | $ | 19 | $ | (35 | ) | ||||||||
|
|
THE REDWOOD
REVIEW 2ND QUARTER 2009
|
23
|
|
|
|
|
|
GAAP INCOME
|
Quarterly
Update (continued)
Redwood
|
u
|
At Redwood,
net interest income was $20 million for the second quarter of 2009, as
compared to $21 million for the first quarter of 2009. Although interest
income on senior securities rose by $6 million due to acquisitions,
interest income on subordinate securities declined by $7 million primarily
due to our adoption of FSP 115-2. This new standard resulted in the
reclassification of $58 million of impairments on securities owned at
Redwood at the beginning of the quarter effectively reducing the
unamortized discount. See the Accounting Discussion module of this Review
for additional discussion on new accounting standards.
|
|
u
|
Negative MVA
at Redwood were $32 million for the second quarter as compared to $26
million for the first quarter. A detailed analysis of MVA is included in
the Mark-to-Market Adjustments module of this
Review.
|
|
u
|
We recorded
$7 million of gains from the sale of $50 million of securities in the
second quarter as market prices for these securities had risen much faster
than anticipated due to technical market forces.
|
|
u
|
Operating
expenses were $11 million for the second quarter of 2009, unchanged from
the first quarter. We note that our scalable internal management structure
enabled Redwood to raise $521 million of common equity in the first half
of 2009 and deploy $439 million of capital while reducing operating
expenses by $9 million as compared to the first half of 2008. Our
operating expenses are likely near their low point and are likely to move
somewhat higher in future quarters as we enhance our platform and focus on
long-term business initiatives.
|
The
Fund
|
u
|
We recognized
income of $0.2 million in the second quarter from the Fund, compared to a
$1 million loss in the prior quarter, as there were fewer impairment
charges on securities owned by the
Fund.
|
|
24
|
THE REDWOOD
REVIEW 2ND QUARTER 2009
|
|
|
|
|
|
|
|
GAAP INCOME
|
Quarterly
Update (continued)
Sequoia
|
u
|
We recorded
income of $10 million in the second quarter, compared to an $8 million
loss in the first quarter. The primary reason for the improvement was the
deconsolidation of one of the Sequoia securitization trusts, which
produced a gain of $19 million. As we noted last quarter, we had
previously expensed allowances for loan losses in excess of our investment
in this securitization trust, and we indicated that these excess
allowances would be recaptured upon deconsolidation.
|
|
u
|
Net interest
income totaled $7 million in the second quarter compared to $9 million in
the first quarter as the loan coupons reset lower in the second quarter,
following the lower resets of the associated liabilities in the first
quarter.
|
|
u
|
Our loan loss
provision for Sequoia remained elevated and totaled $15 million for the
second quarter as compared to $16 million for the first quarter,
reflecting continued credit deterioration and higher loss expectations.
The slight decrease in the amount relates to having fewer loans as a
result of the deconsolidation event discussed above.
|
Acacia
|
u
|
We recorded income of $11 million
from Acacia in the second quarter as compared to a loss of $11 million in
the first quarter. This increase primarily reflects positive MVA of $5
million recorded in the second quarter as compared to negative MVA of $12
million in the first
quarter, a $17 million change. MVA at Acacia reflects the net changes in
the values of assets and liabilities, and although the cash flows from the
assets are used to pay interest and pay down debt, the prices do not
necessarily move in tandem and the net changes can
be volatile. Net interest income totaled $6 million, up from $1 million in
the prior quarter, primarily due to lower funding costs (which are tied to
3-month LIBOR).
|
|
|
THE REDWOOD
REVIEW 2ND QUARTER 2009
|
25
|
|
|
|
|
|
TAXABLE
INCOME
|
Summary
What
is this?
|
|
Taxable
income is our pre-tax income as calculated for tax purposes. Taxable
income differs materially from GAAP income and these two earnings measures
are reconciled in Table 2 in the Financial Tables in this
Review.
|
|
|
REIT
taxable income is pre-tax profit, as calculated for tax purposes,
excluding taxable income earned at our taxable subsidiaries. We must
distribute at least 90% of our REIT taxable income as dividends in order
to maintain our tax status as a
REIT.
|
|
|
For
our quarterly taxable earnings estimates, we project our taxable earnings
for the year based upon various assumptions of events that may occur
during the year. However, some events that could have significant impact
on our taxable earnings are difficult to project, including the amount and
timing of credit losses, prepayments, and employee stock option exercises.
Thus, our quarterly taxable earnings are likely to remain
volatile.
|
Quarterly
Update
|
u
|
Second
quarter estimated taxable earnings were negative $12 million ($0.16 per
share) and included $50 million of credit losses. This compares to
estimated taxable earnings in the first quarter of negative $14 million
($0.22 per share), which included $53 million of credit losses. The
reduction in the loss per share was also attributable to the increase in
the number of shares outstanding following our June equity
offering.
|
|
u
|
Second
quarter estimated REIT taxable earnings were negative $10 million ($0.13
per share) and included $48 million in credit losses. This compares to
estimated REIT taxable earnings in the prior quarter of negative $9
million ($0.14 per share), which included $48 million of credit
losses.
|
|
u
|
For tax
purposes, we are not permitted to establish credit reserves as we are able
to do for GAAP. Thus, in the period credit losses do occur, there is
generally a limited, or no, effect on GAAP income, while a loss is
recognized for tax purposes.
|
|
u
|
As reflected
in our designated credit reserves, which total $1.2 billion at June 30,
2009, or $15.18 per share, there are significant credit losses we still
expect to recognize in the future. When these credit losses occur, the
actual loss recognized for tax purposes will be less than the full credit
reserve amount because the loss will be limited to our tax basis, which is
generally at a discount to the face value and the credit reserve is equal
to the projected face value of
losses.
|
|
u
|
The timing of
losses and which loans default will result in volatility in our tax
results. As an example, although housing prices continued to decline and
delinquencies continued to increase, our credit losses in the second
quarter were slightly lower than in the first quarter, and the mix of
defaulted loans and our basis in those loans varied. In the second
quarter, we had $136 million in face losses, which resulted in $50 million
in tax losses, while in the first quarter we had $143 million of face
losses, which resulted in $53 million of tax losses. Temporary foreclosure
moratoriums, which have since been lifted, may have contributed to this
decline in the second quarter. We anticipate that losses will continue and
likely increase in the second half of 2009, and thus we continue to expect
this year’s taxable income to be
negative.
|
|
u
|
There are
many differences in how we account for our assets and liabilities for GAAP
and tax purposes and these differences can sometimes lead to material
differences in our quarterly results. These differences also lead to
differences in the basis of our assets. At June 30, 2009, our tax basis
for securities at Redwood (excluding investments in the Fund, Sequoia, and
Acacia) was $442 million higher than our GAAP
basis.
|
|
26
|
THE REDWOOD
REVIEW 2ND QUARTER 2009
|
|
|
|
|
|
|
|
TAXABLE INCOME
|
Quarterly Update
(continued)
|
u
|
The tax basis
of the Sequoia IOs we own is $27 million. Many of the underlying pools of
loans have paid down or will pay down within the next year to levels where
they are callable. If and when these are called, any remaining tax basis
in the IO’s will be written off, creating a tax loss. We do not anticipate
calling any Sequoia deals in the foreseeable
future.
|
|
u
|
The table
below reconciles our GAAP and estimated taxable income for the second
quarter of 2009 followed by an explanation of the accounting treatments
leading to the differences.
|
|
GAAP
and Taxable Income (Loss)
|
||||||||||||
|
($ in millions, except per share
data)
|
||||||||||||
|
Three Months Ended June 30,
2009
|
||||||||||||
|
GAAP
|
Tax
|
Differences
|
||||||||||
|
Net interest
income
|
$ | 35 | $ | 48 | $ | 13 | ||||||
|
GAAP provision for loan
losses
|
(15 | ) | - | 15 | ||||||||
|
Realized tax credit
losses
|
- | (50 | ) | (50 | ) | |||||||
|
Market valuation adjustments,
net
|
(29 | ) | - | 29 | ||||||||
|
Operating
expenses
|
(11 | ) | (10 | ) | 1 | |||||||
|
Realized gains,
net
|
26 | - | (26 | ) | ||||||||
|
Benefit from (provision for)
income taxes
|
1 | - | (1 | ) | ||||||||
|
Less: Net income attributable to
noncontrolling interest
|
- | - | - | |||||||||
|
Net income
(loss)
|
$ | 7 | $ | (12 | ) | $ | (19 | ) | ||||
|
Estimated taxable earnings per
share
|
$ | 0.10 | $ | (0.16 | ) | $ | (0.26 | ) | ||||
|
•
|
Net interest
income for tax is higher because we cannot anticipate future credit losses
in determining the current period yield for an asset and thus we generally
amortize more of an asset’s purchase discount into income for tax than for
GAAP prior to anticipated credit losses
occurring.
|
|
•
|
For GAAP, we
take credit provisions for loan losses while for tax purposes we cannot
establish loan loss reserves for future anticipated
events.
|
|
•
|
Realized
credit losses are expensed when incurred for tax. For GAAP, these losses
are anticipated through lower yields on assets or through loan loss
provisions.
|
|
•
|
For GAAP, we
recognize certain MVA through the income statement. These are generally
not recognized for tax
purposes.
|
|
•
|
The timing,
and for some expenses, the amount, of some of our compensation expenses
are different under GAAP accounting than for tax accounting. In this
quarter, these differences were not significant, but they could be in
future periods.
|
|
•
|
Since
amortization and impairments on assets differ for GAAP and tax, the GAAP
and tax basis on sold assets may differ, resulting in differences in gains
on sale. In addition, for tax purposes, we are able to net capital losses
against gains. Thus, although we sold assets in the second quarter
and generated a GAAP gain of $7 million, for tax purposes these sales
generated gains of $6 million and were offset by capital losses from prior
years. As of June 30, 2009, we still had $17 million of capital losses at
the REIT available to offset future capital
gains.
|
|
•
|
For tax
purposes, we do not consolidate noncontrolling interests as we do under
GAAP. In the second quarter, as discussed earlier, the deconsolidation of
one of our Sequoia securitizations resulted in a GAAP gain of $19 million.
This was not a tax event and there was no recognition of any gain for tax
purposes.
|
|
|
THE REDWOOD
REVIEW 2ND QUARTER 2009
|
27
|
|
|
|
|
|
DIVIDENDS
|
Summary
What
is this?
|
|
As
a REIT, we are required to distribute at least 90% of our REIT taxable
income in the form of dividends to shareholders. Our board of directors
can declare dividends in excess of this minimum requirement.
|
|
|
The
chart below shows the regular and special dividends per share paid to
shareholders for the indicated periods and our projected regular dividend
for 2009.
|
Regular and Special
Dividends per Share
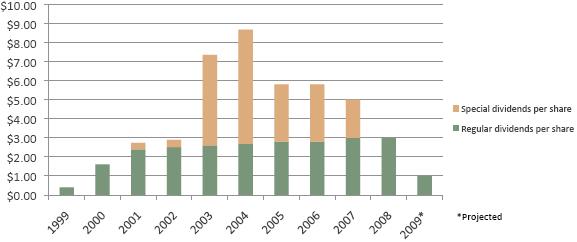
Quarterly
Update
|
u
|
On November
10, 2008, our board of directors announced its intention to pay a regular
dividend of $0.25 per share per quarter in
2009.
|
|
u
|
On May 19,
2009, our board of directors declared a regular dividend of $0.25 per
share for the second quarter, which was paid on July 21, 2009 to
shareholders of record on June 30,
2009.
|
|
u
|
We expect to
report a taxable loss at the REIT level for 2009 due to the expected
realization of credit losses. We currently expect that Redwood’s 2009
regular dividend will constitute a return of capital and, as such, will
not be taxable to shareholders.
|
|
u
|
There was no
undistributed REIT taxable income at June 30,
2009.
|
|
u
|
We do not
expect to pay a special dividend in
2009.
|
|
28
|
THE REDWOOD
REVIEW 2ND QUARTER 2009
|
|
|
|
|
|
|
|
CAPITAL AND
LIQUIDITY
|
Summary
What
is this?
|
|
We
use capital to fund our operations, invest in earning assets that are
generally illiquid, fund working capital, and meet lender capital
requirements with respect to collateralized borrowings, if
any.
|
|
|
Through
our internal risk-adjusted capital policy, we allocate a prudent level of
capital for our earning assets to meet liquidity needs that may arise. In
most cases, the amount of allocated capital is equal to 100% of the fair
value of the asset. The amount of capital that exceeds our risk-adjusted
capital guidelines, less short-term debt, pending investment settlements
and operating expenses, and other miscellaneous capital allocations, is
excess capital that can be invested to support business
growth.
|
|
|
At
June 30, 2009, our capital base included common equity plus $150 million
of long-term debt at Redwood, which is due in
2037.
|
|
|
Declines
in the fair value of assets generally do not have an effect on excess
capital, as asset value declines usually reduce both available capital and
capital required for these investments by an equal
amount.
|
Redwood Reported
Capital
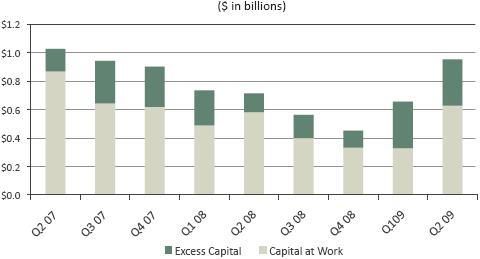
Quarterly
Update
|
u
|
In June 2009,
we completed our second public offering of common stock this year to raise
capital for investment and growth. We issued 17 million shares with net
proceeds from the offering of $238 million.
|
|
u
|
Capital
totaled $952 million at June 30, 2009, an increase of $296 million from
the $656 million of capital at March 31,
2009.
|
|
u
|
Our excess
capital position was $325 million at June 30, 2009, compared to $328
million at March 31, 2008. During the second quarter, our sources of
capital were: $55 million from portfolio cash flows and management fees in
excess of operating and interest expenses; $238 million from the public
offering; $57 million from asset sales; and $4 million of net changes
in operating capital (in accordance with our internal risk-adjusted
guidelines). Uses of capital included the payment of $16 million in
dividends and $341 million for asset
acquisitions.
|
|
|
THE REDWOOD
REVIEW 2ND QUARTER 2009
|
29
|
|
|
|
|
|
MARK-TO-MARKET
ADJUSTMENTS
|
Market
Conditions
|
u
|
The market
for senior residential and commercial securities significantly improved
during the second quarter as demand increased and prices rose. The
following chart illustrates generically the prices that investors were
willing to pay for senior RMBS and CMBS over the last one and a half
years.
|
Senior
RMBS and CMBS Prices
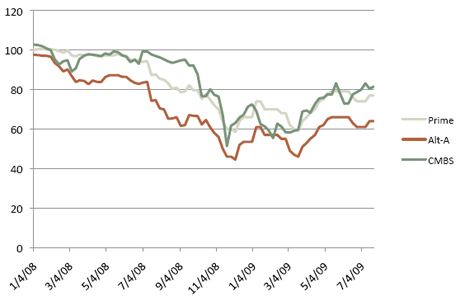
|
u
|
Prices for
senior residential securities steadily increased throughout the second
quarter, finishing up 10-20%. Strong demand for prime and Alt-A senior
securities contributed to the rise in prices, with new REITs and fund
investors entering the market in anticipation of government programs such
as TALF and PPIP. In the near term, we expect prices for senior securities
to continue to be driven by these technical forces, rather than
fundamentals.
|
|
u
|
Contributing
to the strong demand for residential senior securities was the creation
and sale of new residential re-REMIC securities in the second quarter. The
consummation of these re-REMIC transactions provided additional pricing
information to the market, which particularly benefited prime senior
securities, many of which can now be resecuritized and sold to a broader
range of investors.
|
|
u
|
As prices
rose during the quarter, a significant new supply of residential senior
securities came to market from foreign banks, with hedge funds, money
managers and commercial banks also contributing. Voluntary asset sales
were met with robust demand, resulting in significantly higher trading
volume than in recent quarters. Forced sales were much less prominent
during the second quarter, with the exception of the Thornburg Mortgage
portfolio liquidation in April.
|
|
u
|
Prices for
subordinate residential and commercial securities declined in the second
quarter as credit fundamentals worsened and trading activity remained
light. Subordinate securities continue to be priced by the market
according to near-term cash flow expectations, as many of these securities
will lose their outstanding principal to credit losses over the next few
years.
|
|
30
|
THE REDWOOD
REVIEW 2ND QUARTER 2009
|
|
|
|
|
|
|
|
MARK-TO-MARKET
ADJUSTMENTS
|
Total
Mark-to-Market Adjustments
|
u
|
We appreciate
that understanding mark-to-market (MTM) adjustments is not easy and this
quarter it is further complicated by the adoption of FSP 115-2. As a
result of the one-time adjustment required upon adoption of this new
accounting principal, our total MTM adjustments were negative. This
occurred even though, in aggregate, the market value of our portfolio of
assets and liabilities increased during the second quarter. The table
below shows the consolidating impact of mark-to-market (MTM) adjustments
on our balance sheet (positive $8 million) and income statement (negative
$29 million) in the second quarter of 2009. The balance sheet MTM
adjustments are broken out between changes in the equity account that
occurred during the quarter and the one-time FSP 115-2
reclassification.
|
|
Mark-to-Market
Adjustments on Assets and Liabilities
|
||||||||||||||||||||
|
Consolidating
Balance Sheet and Income Statement
Effects
|
||||||||||||||||||||
|
Three
Months Ended June 30, 2009
|
||||||||||||||||||||
|
($
in millions)
|
||||||||||||||||||||
|
The
|
||||||||||||||||||||
|
Redwood
|
Fund
|
Sequoia
|
Acacia
|
Total
|
||||||||||||||||
|
Balance sheet
effect
|
||||||||||||||||||||
|
FSP 115-2
adjustment
|
(58 | ) | (3 | ) | - | - | (61 | ) | ||||||||||||
|
Net change in equity
account
|
$ | 66 | $ | 3 | $ | - | $ | - | $ | 69 | ||||||||||
|
Total balance sheet
effect
|
8 | - | - | - | 8 | |||||||||||||||
|
Income statement
effect
|
||||||||||||||||||||
|
Market valuation
adjustments
|
||||||||||||||||||||
|
Fair value assets and
liabilities
|
- | - | (1 | ) | 5 | 4 | ||||||||||||||
|
Impairment on AFS
securities
|
(32 | ) | (1 | ) | - | - | (33 | ) | ||||||||||||
|
Total income statement
effect
|
(32 | ) | (1 | ) | (1 | ) | 5 | (29 | ) | |||||||||||
|
Total mark-to-market
adjustments
|
$ | (24 | ) | $ | (1 | ) | $ | (1 | ) | $ | 5 | $ | (21 | ) | ||||||
|
u
|
The table
below illustrates the percentage change in values during the second
quarter in our AFS securities at Redwood. In aggregate, the
value of our securities increased $18
million.
|
|
Pricing
Summary
|
||||||||||||||||||||||||
|
Securities at
Redwood
|
||||||||||||||||||||||||
|
June 30,
2009
|
||||||||||||||||||||||||
|
Q1 and Prior Acquistions (1)
|
Q2 Acquisitions (1)
|
|||||||||||||||||||||||
|
Fair Value as % of
Face at:
|
||||||||||||||||||||||||
|
Portfolio
|
6/30/09
|
3/31/09
|
Percentage Change in Price
(2)
|
Fair Value as % of Face at
06/30/09
|
Acquisition
Price
|
Percentage Change in Price
(2)
|
||||||||||||||||||
|
Residential
Senior
|
||||||||||||||||||||||||
|
Prime
|
64 | % | 53 | % | 21 | % | 69 | % | 66 | % | 5 | % | ||||||||||||
|
Non-prime
|
42 | % | 40 | % | 5 | % | 69 | % | 66 | % | 5 | % | ||||||||||||
|
Residential
Re-REMIC
|
- | - | - | 23 | % | 24 | % | (4 | %) | |||||||||||||||
|
Residential
Subordinate
|
||||||||||||||||||||||||
|
Prime
|
6 | % | 7 | % | (14 | %) | 5 | % | 6 | % | (17 | %) | ||||||||||||
|
Non-prime
|
1 | % | 1 | % | 0 | % | - | - | - | |||||||||||||||
|
CDO
|
10 | % | 11 | % | (9 | %) | - | - | - | |||||||||||||||
|
Commercial
Subordinate
|
3 | % | 5 | % | (40 | %) | - | - | - | |||||||||||||||
|
(1) Only includes securities still
held at June 30, 2009.
|
|
(2) This represents the percentage
changes in prices by security type for the three months ended June 30,
2009, or since acquisition. These price changes are specific to
our portfolio and may not be indicative of the price changes in the market
in
general.
|
|
|
THE REDWOOD
REVIEW 2ND QUARTER 2009
|
31
|
|
|
|
|
|
MARK-TO-MARKET
ADJUSTMENTS
|
Total
Mark-to-Market Adjustments (continued)
|
u
|
The senior
securities we held for the full quarter increased in value by $17 million
and the residential and commercial subordinate securities we owned for the
full quarter decreased in value by $11 million. In aggregate,
the fair value of this portfolio increased $6 million during the
quarter.
|
|
u
|
In the market
for securities, a spread exists between bid and ask prices and as a
result, the price we can immediately sell a security for is lower than the
price at which we purchased it. During the quarter, this bid-ask spread
narrowed for senior RMBS, and with prices increasing throughout the period
as a general matter, the bid price at the end of the quarter was higher
than our acquisition price. In aggregate, our second quarter acquisitions
increased in value by $12 million from purchase to the end of
June.
|
Mark-to-Market
Valuation Process
|
u
|
Market values
reported for our assets and liabilities (except for those held at
historical cost) reflect an “exit price,” or the amount we believe we
would realize if we sold an asset or would pay if we repurchased a
liability in an orderly transaction. This is the required accounting
standard even if we have no intention to sell assets or repurchase
liabilities.
|
|
u
|
Establishing
market values is inherently subjective given the volatile and illiquid
markets for our real estate assets and liabilities and requires us to make
a number of assumptions, including the future of interest rates,
prepayment rates, discount rates, credit loss rates, and the timing of
credit losses. The assumptions we apply are specific to each asset or
liability.
|
|
u
|
Although we
rely on our internal calculations to compute the fair value of the
securities we own, we request and consider indications of value (marks)
from third-party dealers to assist us in our valuation process. The
availability of third-party marks continues to decline, in part because
some dealers no longer exist and others have ceased providing client
valuation services. For June 30, 2009, we received dealer marks on 73% of
our securities and 95% of our ABS issued. In the aggregate, our internal
valuations of the securities on which we received dealer marks were 1%
lower than the aggregate dealer marks. Our internal valuations of our ABS
issued on which we received dealer marks were 14% higher than the
aggregate dealer marks.
|
|
32
|
THE REDWOOD
REVIEW 2ND QUARTER 2009
|
|
|
|
|
|
|
|
RESIDENTIAL REAL ESTATE
SECURITIES
|
Summary
What
is this?
|
|
Redwood
invests in securities that are backed by pools of residential real estate
loans. Most of our investments in residential real estate securities are
backed by prime residential loans and some are backed by non-prime loans
such as Alt-A loans. Historically, we used our credit risk analysis
capabilities to guide us in the acquisition of subordinated securities,
which carry concentrated credit risk. More recently, our credit risk
analysis has been appropriate in understanding the range of risks and
returns applicable to senior securities which carry less concentrated
credit risk, and our acquisitions have been heavily weighted to this type
of security. The following discussion refers only to the residential
securities owned by Redwood, exclusive of the securities owned by the
Fund, Sequoia, and Acacia, and exclusive of Redwood’s investments in these
entities.
|
Quarterly
Update
|
u
|
Nationally,
mortgage delinquencies rose throughout the quarter as housing fundamentals
continued to deteriorate. We are modeling that housing prices will decline
further and that delinquencies and foreclosures will continue to
increase.
|
|
u
|
Credit losses
remain elevated on a nationwide basis and vary significantly across
different credit sectors and vintages. Loss severities for prime mortgage
loans that defaulted in the second quarter averaged between 35-45%, while
loss severities for defaulted non-prime loans averaged
50-75%.
|
|
u
|
At June 30,
2009, the market value of our residential securities totaled $499 million,
consisting of $183 million in prime senior securities, $231 million in
non-prime senior securities, $55 million in re-REMIC securities, and $30
million in subordinated securities. Each of these is further discussed in
a separate module below.
|
|
u
|
During the
second quarter, we invested $341 million in securities. The table below
shows selected information on these acquisitions.
|
|
Acquisitions
|
||||||||||||
|
Three Months Ended June 30,
2009
|
||||||||||||
|
($ in
millions)
|
||||||||||||
|
Weighted
|
||||||||||||
|
Average
|
Credit
|
|||||||||||
|
Purchases
|
Price
%
|
Support
%
|
||||||||||
|
Prime
|
||||||||||||
|
Senior
|
$ | 121 | 64 | 7 | ||||||||
|
Re-REMIC
|
56 | 24 | 5 | |||||||||
|
Subordinate
|
2 | 6 | 2 | |||||||||
|
Total Prime
|
179 | |||||||||||
|
Alt-A
|
||||||||||||
|
Senior
|
162 | 65 | 14 | |||||||||
|
Total
Acquisitions
|
$ | 341 | ||||||||||
|
|
THE REDWOOD
REVIEW 2ND QUARTER 2009
|
33
|
|
|
|
|
|
RESIDENTIAL REAL ESTATE
SECURITIES
|
Quarterly
Update (continued)
|
u
|
Our
investment strategy has shifted since the beginning of 2008 toward
acquiring residential senior securities with, what we believe is, a
comfortable margin of safety to protect against escalating credit losses.
Due to the dislocations in the credit markets, we have been able to buy
senior securities at significant discounts to principal value. Our returns
on these investments will be based on how much principal and interest
we ultimately receive and how quickly we receive it.
|
|
u
|
Prepayment
rates in the second quarter were mixed, with noticeable differences
depending upon the credit worthiness of the borrower. Voluntary
prepayments on prime loans increased throughout the quarter and ended the
period at between 18-25% CPR — faster than the previous quarter’s CPR of
15-20%. Higher quality Alt-A loans also saw an uptick in prepayment rates
throughout the quarter, while lower quality Alt-A loans continued to
prepay at much slower levels.
|
|
u
|
At June 30,
2009, the net unamortized discount on our residential securities was $386
million, comprised of $91 million on prime senior securities, $134 million
on non-prime senior securities, $134 million on re-REMIC securities, and
$27 million on subordinated securities. The rate at which we recognize
this discount as income is dependent on how fast the underlying loans
prepay — the faster the prepayments, the higher the
yield.
|
|
u
|
The following
table breaks out the underlying loans of our prime residential securities
by size, loan type, and vintage.
|
|
Prime
Securities at Redwood
|
||||||||||||||||||||||||||||||||||||||||||||||||
|
Composition
by Product Type, Vintage, and
Balance
|
||||||||||||||||||||||||||||||||||||||||||||||||
|
June
30, 2009
|
||||||||||||||||||||||||||||||||||||||||||||||||
|
<=
2004
|
2005
|
2006
|
2007
|
2008
|
Total
|
|||||||||||||||||||||||||||||||||||||||||||
|
Product
|
% of
Balance
|
Wtd
Avg
Loan
Rate(1) |
% of
Balance
|
Wtd
Avg
Loan
Rate(1) |
% of
Balance
|
Wtd
Avg
Loan
Rate(1) |
% of
Balance
|
Wtd
Avg
Loan
Rate(1) |
% of
Balance
|
Wtd
Avg
Loan
Rate(1) |
% of
Balance
|
Wtd
Avg
Loan
Rate (1) |
||||||||||||||||||||||||||||||||||||
|
Hybrid/ARM (2)
|
24 | % | 4.55 | % | 40 | % | 5.40 | % | 32 | % | 5.97 | % | 11 | % | 6.40 | % | 8 | % | 6.13 | % | 27 | % | 5.07 | % | ||||||||||||||||||||||||
|
Fixed
|
11 | % | 5.68 | % | 5 | % | 6.00 | % | 13 | % | 6.29 | % | 49 | % | 6.41 | % | 76 | % | 6.56 | % | 14 | % | 6.02 | % | ||||||||||||||||||||||||
|
Jumbo
|
35 | % | 45 | % | 45 | % | 60 | % | 84 | % | 41 | % | ||||||||||||||||||||||||||||||||||||
|
Hybrid/ARM (2)
|
36 | % | 4.67 | % | 48 | % | 5.46 | % | 39 | % | 5.99 | % | 6 | % | 6.40 | % | 2 | % | 6.37 | % | 35 | % | 5.08 | % | ||||||||||||||||||||||||
|
Fixed
|
29 | % | 5.65 | % | 7 | % | 5.98 | % | 16 | % | 6.25 | % | 34 | % | 6.40 | % | 14 | % | 6.46 | % | 24 | % | 5.82 | % | ||||||||||||||||||||||||
|
Conforming
|
65 | % | 55 | % | 55 | % | 40 | % | 16 | % | 59 | % | ||||||||||||||||||||||||||||||||||||
|
Totals
|
100 | % | 100 | % | 100 | % | 100 | % | 100 | % | 100 | % | ||||||||||||||||||||||||||||||||||||
|
(1) Average rate is based on
underlying loan balances.
|
|
(2) ARMs represent approximately
2% of our portfolio.
|
|
u
|
The majority
(59%) of the loans underlying our securities are within the Agency
conforming loan limit. These limits vary by county and are as high as
$729,750 in high cost areas.
|
|
u
|
The table
above also provides the weighted average coupon rates for the respective
vintage buckets. As of the end of July 2009, the current fixed mortgage
rate for a conforming Agency loan was approximately 5.25%. As mortgage
rates decline, the ability of borrowers to refinance and the
attractiveness of financing increases, although mortgage rates are only
one of the factors affecting
refinancing.
|
|
34
|
THE REDWOOD
REVIEW 2ND QUARTER 2009
|
|
|
|
|
|
|
|
RESIDENTIAL REAL ESTATE
SECURITIES
|
Quarterly
Update (continued)
|
u
|
We expect
that government stimulus and intervention could have the effect of
increasing prepayment rates through lower mortgage rates for the most
credit-worthy borrowers, while having little impact on prepayment rates
for credit-impaired borrowers. Early in 2009, mortgage rates were
relatively low and this led to the increased prepayment speeds we have
experienced thus far this year. However, beginning in the second quarter,
mortgage rates started to increase (as illustrated in the chart below) and
we expect this to result in slower prepayments in the next few
quarters.
|
|
u
|
Historically, conforming loan rates
have generally been about 200 basis points over 10-year Treasury rates and
jumbo mortgage rates have been roughly 25 basis points over conforming
loan rates. As illustrated in the chart below, these long term
trends have not continued during the last two years, as mortgage rates
have not declined as much as Treasury rates and the difference between
conforming loan rates and jumbo loan rates has increased. The
chart also illustrates that mortgage rates have generally declined in the
early part of 2009, but have recently increased from historically low
levels.
|
Jumbo and
Conforming 30-Year Mortgage Rates
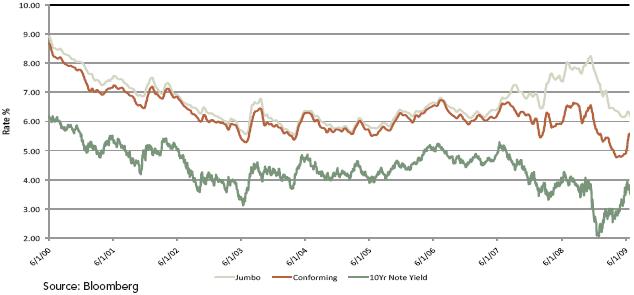
|
|
THE REDWOOD
REVIEW 2ND QUARTER 2009
|
35
|
|
|
|
|
|
RESIDENTIAL REAL ESTATE
SECURITIES
|
Residential
Prime Senior Securities Portfolio
What
is this?
|
|
Residential
prime securities are mortgage-backed securities backed by prime
residential mortgage loans. Senior securities are those interests in a
securitization that have the first right to cash flows and are last in
line to absorb losses. Information on our prime senior securities and
underlying loan characteristics are set forth in Tables 9, 10, 12, and 16
in the Financial Tables in this Review.
|
Quarterly
Update
|
u
|
Interest
income generated by our prime senior securities was $5 million in the
second quarter. Annualizing this level of income is not necessarily
reflective of our expected reported yields on this portfolio as there is
generally a lag of one to two months between when we acquire a security
and when we begin to receive interest payments and report the full
effective yield on that asset.
|
|
u
|
The following
table presents information on our residential prime senior securities at
Redwood at June 30, 2009. Most of our senior securities are from the 2005
vintage.
|
|
Credit
Support Analysis - Prime Senior Securities at
Redwood
|
||||||||||||||||||||
|
By
Vintage
|
||||||||||||||||||||
|
June 30,
2009
|
||||||||||||||||||||
|
($ in
millions)
|
||||||||||||||||||||
|
<=2004
|
2005
|
2006
|
2007
|
Total
|
||||||||||||||||
|
Current
face
|
$ | 15 | $ | 224 | $ | 16 | $ | 21 | $ | 276 | ||||||||||
|
Net unamortized
discount
|
(4 | ) | (76 | ) | (4 | ) | (7 | ) | (91 | ) | ||||||||||
|
Credit
reserve
|
- | (3 | ) | - | (1 | ) | (4 | ) | ||||||||||||
|
Unrealized gains
(losses)
|
- | 8 | (5 | ) | (1 | ) | 2 | |||||||||||||
|
Fair value of AFS Prime Senior
Securities
|
$ | 11 | $ | 153 | $ | 7 | $ | 12 | $ | 183 | ||||||||||
|
Overall credit
protection to Prime Senior Securities (1)
|
8.51 | % | 7.20 | % | 3.74 | % | 4.41 | % | 6.34 | % | ||||||||||
|
Serious
delinquencies as a % of collateral balance (1)
|
6.28 | % | 4.68 | % | 2.16 | % | 3.98 | % | 4.45 | % | ||||||||||
|
(1) Overall credit protection and
serious delinquency rates are weighted by securitization
balances. Credit protection and delinquencies may vary
significantly by
securtization.
|