
 |
|
|
|
|
TABLE OF
CONTENTS
|
|
Introduction
|
3
|
|
Shareholder
Letter
|
4
|
|
Quarterly
Overview
|
6
|
|
Financial
Insights
|
10
|
|
u
Book Value
|
10
|
|
u
Cash Flow
|
14
|
|
u
Balance Sheet
|
16
|
|
u
GAAP Income
|
17
|
|
u
Taxable Income
|
20
|
|
Dividends
|
21
|
|
Capital and
Liquidity
|
22
|
|
Residential
Real Estate Securities
|
23
|
|
Commercial
Real Estate Securities
|
33
|
|
Investments
in Securitization Entities
|
35
|
|
Appendix
|
|
|
Accounting
Discussion
|
38
|
|
Glossary
|
41
|
|
Financial
Tables
|
49
|
|
|
THE REDWOOD
REVIEW 3RD QUARTER 2009
|
1
|
|
|
|
|
|
CAUTIONARY
STATEMENT
|
|
2
|
THE REDWOOD
REVIEW 3RD QUARTER 2009
|
|
|
|
|
|
|
|
INTRODUCTION
|
|
Selected
Financial Highlights
|
||||||
|
Quarter:Year
|
GAAP
Income
(Loss)
per Share
|
Taxable
Income
(Loss)
per Share
|
Annualized
Return
on
Equity
|
GAAP
Book
Value
per
Share
(1)
|
Economic
Book
Value
per
Share
(2)
|
Total
Dividends
per
Share
|
|
Q307
|
($2.18)
|
$1.74
|
(29%)
|
$5.32
|
$27.55
|
$0.75
|
|
Q407
|
($36.49)
|
$0.92
|
(4419%)
|
$23.18
|
$22.29
|
$2.75
|
|
Q108
|
($5.28)
|
$0.79
|
(95%)
|
$17.89
|
$18.04
|
$0.75
|
|
Q208
|
($1.40)
|
$0.11
|
(30%)
|
$17.00
|
$16.72
|
$0.75
|
|
Q308
|
($3.34)
|
$0.07
|
(83%)
|
$12.40
|
$13.18
|
$0.75
|
|
Q408
|
($3.46)
|
($0.38)
|
(124%)
|
$9.02
|
$11.10
|
$0.75
|
|
Q109
|
($0.65)
|
($0.22)
|
(25%)
|
$8.40
|
$10.01
|
$0.25
|
|
Q209
|
$0.10
|
($0.16)
|
5%
|
$10.35
|
$11.30
|
$0.25
|
|
Q309
|
$0.35
|
($0.30)
|
13%
|
$11.68
|
$12.28
|
$0.25
|
|
(1)
The Q407 GAAP book value per share is after giving retroactive effect on
December 31, 2007 to the adoption of FAS 159 on January 1, 2008. Without
giving retroactive effect to FAS 159, the GAAP book value per share was
negative $22.18.
|
|
(2)
Economic book value per share is calculated using bid-side marks (or
estimated bid-side values) for our financial assets and offer-side marks
(or estimated offer-side values) for our financial liabilities and we
believe it more accurately reflects liquidation value than does GAAP book
value per share. Economic book value per share is reconciled to
GAAP book value per share in Table 4 in the Financial Tables in this
Review.
|
|
|
THE REDWOOD
REVIEW 3RD QUARTER 2009
|
3
|
|
|
|
|
|
SHAREHOLDER
LETTER
|
|
4
|
THE REDWOOD
REVIEW 3RD QUARTER 2009
|
|
|
|
|
|
|
|
SHAREHOLDER
LETTER
|

|
|
THE REDWOOD
REVIEW 3RD QUARTER 2009
|
5
|
|
|
|
|
|
QUARTERLY
OVERVIEW
|
 ” for a fast
recovery followed by a period of flat growth; a “W” for a double-dip
recession; and the dreaded bathtub “
” for a fast
recovery followed by a period of flat growth; a “W” for a double-dip
recession; and the dreaded bathtub “ ” for an extended
down cycle followed by eventual growth. The truth is that no one knows for sure
— even the experts have strong and disparate opinions on how and when this
enormous financial experiment of government intervention will end.
” for an extended
down cycle followed by eventual growth. The truth is that no one knows for sure
— even the experts have strong and disparate opinions on how and when this
enormous financial experiment of government intervention will end.|
u
|
GAAP earnings
were $27 million, or $0.35 per share in the third quarter, up from $7
million, or $0.10 per share in the second
quarter.
|
|
u
|
GAAP book
value was $11.68 per share at quarter-end, up $1.33 or 13% in the third
quarter over the prior quarter, while our non-GAAP estimate of economic
value was $12.28 per share at quarter-end, up $0.98 or 9% in the third
quarter over the prior quarter.
|
|
u
|
During the
third quarter, investment cash flow increased to $78 million, up $14
million from the second quarter, and business cash flow (after cash
operating expenses) increased to $68 million, up $13 million from the
second quarter.
|
|
u
|
We ended the
quarter with $217 million of cash.
|
|
6
|
THE REDWOOD
REVIEW 3RD QUARTER 2009
|
|
|
|
|
|
|
|
QUARTERLY
OVERVIEW
|
|
|
THE REDWOOD
REVIEW 3RD QUARTER 2009
|
7
|
|
|
|
|
|
QUARTERLY
OVERVIEW
|
|
8
|
THE REDWOOD
REVIEW 3RD QUARTER 2009
|
|
|
|
|
|
|
|
QUARTERLY
OVERVIEW
|
 |
 |
|
Martin S.
Hughes
President,
Chief Financial Officer,
and
Co-Chief Operating Officer
|
Brett D.
Nicholas
Chief
Investment Officer and
Co-Chief
Operating Officer
|
|
|
THE REDWOOD
REVIEW 3RD QUARTER 2009
|
9
|
|
|
|
|
|
FINANCIAL
INSIGHTS
|
|
u
|
The following
table shows the components of our GAAP Book Value and Management’s
Estimate of Economic Value at September 30,
2009.
|
|
Components
of Book Value
|
||||||||||||
|
September
30, 2009
|
||||||||||||
|
($
in millions, except per share data)
|
||||||||||||
|
GAAP
Book
Value
|
Adj.
|
Management's
Estimate of Economic Value*
|
||||||||||
|
Cash and cash
equivalents
|
$ | 217 | $ | 217 | ||||||||
|
Real estate securities at
Redwood
|
||||||||||||
|
Residential
|
732 | 732 | ||||||||||
|
Commercial
|
17 | 17 | ||||||||||
|
CDO
|
2 | 2 | ||||||||||
|
Total real estate securities at
Redwood
|
$ | 751 | $ | 751 | ||||||||
|
Investments in the
Fund
|
24 | 24 | ||||||||||
|
Investments in
Sequoia
|
76 | (29 | ) | 47 | ||||||||
|
Investments in
Acacia
|
2 | 2 | ||||||||||
|
Total cash, securities, and
investments
|
$ | 1,070 | $ | 1,041 | ||||||||
| - | ||||||||||||
|
Long-term
debt
|
(140 | ) | 76 | (64 | ) | |||||||
| - | ||||||||||||
|
Other assets/liabilities,
net
|
(23 | ) | (23 | ) | ||||||||
|
Stockholders'
equity
|
$ | 907 | $ | 954 | ||||||||
|
Book value per
share
|
$ | 11.68 | $ | 12.28 | ||||||||
|
u
|
During the
third quarter, our GAAP book value increased by $1.33 per share to $11.68.
The increase resulted from $1.09 per share of positive market valuation
adjustments and $0.49 per share from earnings before market valuation
adjustments, less $0.25 per share of dividends.
|
|
u
|
Our estimate
of economic value increased by $0.98 per share to $12.28. Economic value
is a non-GAAP measure determined by calculating the fair value of our
investments in consolidated entities directly as opposed to deriving their
reported GAAP values by netting their consolidated assets and liabilities.
We also value our long-term debt at its estimated fair value rather than
its amortized cost basis as reported for GAAP. See page 13 for a detailed
explanation of these adjustments.
|
|
10
|
THE REDWOOD
REVIEW 3RD QUARTER 2009
|
|
|
|
|
|
|
|
FINANCIAL
INSIGHTS
|
|
u
|
The following
chart summarizes the $1 billion economic value of our cash, securities,
and investments at September 30,
2009.
|
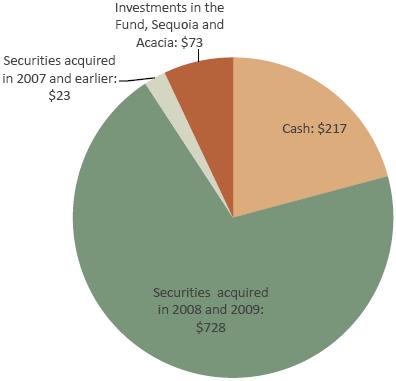
|
u
|
We have
segmented our securities portfolio by acquisition date in the above chart
to highlight that 91% of the economic value of the cash, securities and
investments are currently held in cash or in recently acquired securities.
Our future earnings will be driven primarily by the performance of these
recent investments along with how we deploy our existing cash and future
cash flows.
|
|
u
|
Our cash and
cash equivalents amounted to $217 million at September 30, 2009, and $240
million at the end of October. All of our cash is currently invested in
U.S. Treasury Bills or bank deposits insured by the Federal Deposit
Insurance Corporation.
|
|
u
|
Our primary
source of cash during the third quarter was $78 million from principal and
interest payments on our investments. Our primary use of cash was $246
million for acquisitions of residential securities. See the Cash Flow
section on pages 14 and 15 for detailed activity related to sources and
uses of cash.
|
|
|
THE REDWOOD
REVIEW 3RD QUARTER 2009
|
11
|
|
|
|
|
|
FINANCIAL
INSIGHTS
|
|
u
|
The following
table presents the fair value of real estate securities at Redwood at
September 30, 2009. We segment our securities portfolio by priority of
cash flows — senior, re-REMIC, and subordinate — and, for residential
securities, by quality of underlying loans — prime and non-prime.
|
|
Real
Estate Securities at Redwood
|
||||||||||||||||||||
|
September 30,
2009
|
||||||||||||||||||||
|
($ in
millions)
|
||||||||||||||||||||
|
%
of Total
|
||||||||||||||||||||
|
<=2004
|
2005
|
2006-2009
|
Total
|
Securities
|
||||||||||||||||
|
Residential
|
||||||||||||||||||||
|
Seniors
|
||||||||||||||||||||
|
Prime
|
$ | 15 | $ | 264 | $ | 58 | $ | 337 | 45 | % | ||||||||||
|
Non-prime
|
110 | 155 | 14 | 279 | 37 | % | ||||||||||||||
|
Total
Seniors
|
$ | 125 | $ | 419 | $ | 72 | $ | 616 | 82 | % | ||||||||||
|
Re-REMIC
|
||||||||||||||||||||
|
Prime
|
$ | 2 | $ | 9 | $ | 82 | $ | 93 | 12 | % | ||||||||||
|
Total
Re-REMIC
|
$ | 2 | $ | 9 | $ | 82 | $ | 93 | 12 | % | ||||||||||
|
Subordinates
|
||||||||||||||||||||
|
Prime
|
$ | 16 | $ | 3 | $ | 3 | $ | 22 | 3 | % | ||||||||||
|
Non-prime
|
- | 1 | - | 1 | 0 | % | ||||||||||||||
|
Total
Subordinates
|
$ | 16 | $ | 4 | $ | 3 | $ | 23 | 3 | % | ||||||||||
|
Total
Residential
|
$ | 143 | $ | 432 | $ | 157 | $ | 732 | 97 | % | ||||||||||
|
Commercial
Subordinates
|
$ | 7 | $ | 2 | $ | 8 | $ | 17 | 2 | % | ||||||||||
|
CDO
Subordinates
|
$ | - | $ | 2 | $ | - | $ | 2 | 1 | % | ||||||||||
|
Total
|
$ | 150 | $ | 436 | $ | 165 | $ | 751 | 100 | % | ||||||||||
|
u
|
The table
below details the net increase in the fair value of securities at Redwood
during the third and second quarters of
2009.
|
|
Real
Estate Securities at Redwood
|
||||||||
|
($ in
millions)
|
||||||||
|
Three
Months Ended
|
||||||||
|
9/30/2009
|
6/30/09
|
|||||||
|
Beginning fair
value
|
$ | 517 | $ | 221 | ||||
|
Acquisitions
|
246 | 341 | ||||||
|
Sales
|
(63 | ) | (50 | ) | ||||
|
Effect of principal
payments
|
(25 | ) | (13 | ) | ||||
|
Change in fair value,
net
|
76 | 18 | ||||||
|
Ending fair
value
|
$ | 751 | $ | 517 | ||||
|
12
|
THE REDWOOD
REVIEW 3RD QUARTER 2009
|
|
|
|
|
|
|
|
FINANCIAL
INSIGHTS
|
|
u
|
During the
third quarter, we acquired $246 million of residential securities,
consisting of $220 million of prime and non-prime senior securities, $25
million of prime re-REMIC securities, and $1 million of subordinate
securities. We also sold $74 million residential securities and realized
gains of $11 million. We continue to prudently manage our portfolio and
may sell additional assets as conditions
merit.
|
|
u
|
In October
2009, we acquired $6 million in prime residential senior securities, and
sold $34 million of prime residential senior securities and $8 million of
commercial subordinate securities.
|
|
u
|
Principal
payments reduced the fair value of our securities by $25 million during
the third quarter compared to $13 million in the second quarter. The
increase in principal payments primarily reflects the increase in size of
our portfolio. The rate of unscheduled prepayments on our securities was
generally unchanged from the prior
quarter.
|
|
u
|
Our
securities increased in value by $76 million during the third quarter.
This increase was primarily due to increased demand for residential senior
and re-REMIC securities.
|
|
u
|
Our
investments in the Fund, Sequoia, and Acacia totaled $102 million, or 12%
of our securities and investments at September 30,
2009.
|
|
u
|
The fair
value (which equals GAAP carrying value) of our investment in the Fund was
$24 million. The Fund is primarily invested in non-prime residential
securities and is managed by a subsidiary of Redwood. Our investment
represents a 52% interest in the
Fund.
|
|
u
|
Our Sequoia
investments consist predominately of AAA-rated interest-only securities
issued by Sequoia, and to a smaller extent, senior and subordinate
securities. We calculated the $47 million estimate of economic value for
these securities using the same valuation process that we follow to fair
value our other real estate securities. In contrast, the $76 million of
GAAP carrying value of these investments represents the difference between
the assets and liabilities owned by the Sequoia
entities.
|
|
u
|
The fair
value of our investments in Acacia was $2 million and the GAAP carrying
value was $2 million. These investments consist of equity interests and
securities in the Acacia CDO entities we sponsor, which have minimal
value, as well as management fees. We valued the management fees at $2
million, which equals our projected management fees discounted at a 45%
rate.
|
|
u
|
We had no
short-term debt at September 30, 2009. We currently fund our investments
with permanent capital (equity and long-term debt) that is not subject to
margin calls and financial
covenants.
|
|
u
|
At September
30, 2009, we had $140 million of long-term debt outstanding at an interest
rate of LIBOR plus 225 basis points due in 2037. We estimated the $64
million economic value of this debt using the same valuation process used
to fair value our other financial assets and liabilities. Economic value
is difficult to estimate with precision as the market for this debt is
largely inactive.
|
|
|
THE REDWOOD
REVIEW 3RD QUARTER 2009
|
13
|
|
|
|
|
|
FINANCIAL
INSIGHTS
|
|
u
|
The sources
and uses of cash in the table below are derived from our GAAP Consolidated
Statement of Cash Flows for the third and second quarters of 2009 by
aggregating and netting all items in a manner consistent with the way
management analyzes them. This table excludes the gross cash flows
generated by our Sequoia and Acacia securitization entities and the Fund
(cash flows that are not available to Redwood), but does include the cash
flows distributed to Redwood as a result of our investments in these
entities. The beginning and ending cash balances presented in the table
below are GAAP amounts.
|
|
Redwood
|
||||||||
|
Sources
and Uses of Cash
|
||||||||
|
($
in millions)
|
||||||||
|
Three
Months Ended
|
||||||||
|
9/30/2009
|
6/30/2009
|
|||||||
|
Beginning Cash
Balance
|
$ | 337 | $ | 333 | ||||
|
Business cash
flows:
|
||||||||
|
Cash flow from securities and
investments
|
$ | 78 | $ | 64 | ||||
|
Asset management
fees
|
1 | 1 | ||||||
|
Cash operating
expenses
|
(10 | ) | (8 | ) | ||||
|
Interest expense
on long-term debt
|
(1 | ) | (2 | ) | ||||
|
Total business cash
flows
|
68 | 55 | ||||||
| 0 | ||||||||
|
Other sources and
uses:
|
||||||||
|
Proceeds from asset
sales
|
74 | 57 | ||||||
|
Proceeds from equity
issuance
|
- | 238 | ||||||
|
Changes in working
capital
|
6 | 4 | ||||||
|
Acquistions
|
(246 | ) | (334 | ) | ||||
|
Repurchase of long-term
debt
|
(3 | ) | - | |||||
|
Dividends
|
(19 | ) | (16 | ) | ||||
|
Net other
uses
|
(188 | ) | (51 | ) | ||||
|
Net (uses) sources of
cash
|
$ | (120 | ) | $ | 4 | |||
|
Ending Cash
Balance
|
$ | 217 | $ | 337 | ||||
|
u
|
Third quarter
business cash flow totaled $68 million, an increase of $13 million from
the second quarter, primarily due to a $14 million increase in cash flow
from our securities and investments, reflecting the growth in the
securities portfolio from increased acquisitions in the second and third
quarters. In addition, we generated $74 million of cash flow from asset
sales.
|
|
u
|
Our primary
uses of cash in the third quarter were $246 million for acquisitions, $19
million for dividends, and $3 million for the repurchase of $10 million of
our long-term debt.
|
|
u
|
Third quarter
cash flow from securities and investments included $32 million of coupon
interest and $46 million of principal. Given the nature of our investments
(senior securities acquired at discounts, deep discount subordinate
securities, IOs, equity investments in Acacia, and other types) it is
difficult to draw conclusions in any one period about what portion of
our cash flow represents “income” and what represents a “return of
capital.” It is only at the end of an asset’s life that we can accurately
determine what portion of the cumulative cash received (whether principal
or interest) was income and what was a return of
capital.
|
|
14
|
THE REDWOOD
REVIEW 3RD QUARTER 2009
|
|
|
|
|
|
|
|
FINANCIAL
INSIGHTS
|
|
u
|
The table
below presents the components of our cash flow from securities and
investments for the third and second quarters of
2009.
|
|
Redwood
|
||||||||
|
Cash
Flow from Securities and Investments
|
||||||||
|
($ in
millions)
|
||||||||
|
Three Months
Ended
|
||||||||
|
9/30/2009
|
6/30/2009
|
|||||||
|
Securities at
Redwood
|
||||||||
|
Residential
Senior
|
$ | 45 | $ | 26 | ||||
|
Residential
Re-REMIC
|
3 | - | ||||||
|
Residential
Subordinate
|
14 | 18 | ||||||
|
Commercial and
CDO
|
3 | 4 | ||||||
|
Total Cash Flow from Securities
at Redwood
|
65 | 48 | ||||||
|
Investments in the
Fund
|
2 | 2 | ||||||
|
Investments in
Sequoia
|
11 | 13 | ||||||
|
Investments in
Acacia
|
- | 1 | ||||||
|
Total Cash Flow from Securities
and Investments
|
$ | 78 | $ | 64 | ||||
|
u
|
Since we are
acquiring more senior securities, the variability of the cash flows we
receive every quarter is primarily dependent on prepayment speeds, and
since prepayments will vary, there will be some volatility in the cash
flows generated by our senior securities
portfolio.
|
|
u
|
We generated
$3 million in cash (all interest) from our investments in re-REMICs in the
third quarter.
|
|
u
|
Cash flow
generated from our residential subordinate securities totaled $14 million
in the third quarter, compared to $18 million in the second quarter, and
totaled $52 million in the first nine months of 2009. In the third
quarter, we received $8 million from principal payments and $6 million
from interest. The cash flow we receive on subordinate securities is
heavily dependent upon the timing and amount of credit losses. See the
Residential Real Estate Securities module of this Review for a detailed
analysis of credit reserves on these
securities.
|
|
|
THE REDWOOD
REVIEW 3RD QUARTER 2009
|
15
|
|
|
|
|
|
FINANCIAL
INSIGHTS
|
|
u
|
The following
table shows the
components of our balance sheet at September 30,
2009.
|
|
Consolidating
Balance Sheet
|
||||||||||||||||||||
|
September
30, 2009
|
||||||||||||||||||||
|
($
in millions)
|
||||||||||||||||||||
|
Redwood
|
The
Fund
|
Securitization Entities
|
Intercompany
|
Redwood
Consolidated
|
||||||||||||||||
|
Real estate
loans
|
$ | 3 | $ | - | $ | 3,828 | $ | - | $ | 3,831 | ||||||||||
|
Real estate
securities
|
751 | 41 | 270 | - | 1,062 | |||||||||||||||
|
Investments in the
Fund
|
24 | - | - | (24 | ) | - | ||||||||||||||
|
Investment in Securitization
Entities
|
78 | - | - | (78 | ) | - | ||||||||||||||
|
Other
investments
|
- | - | 29 | - | 29 | |||||||||||||||
|
Cash and cash
equivalents
|
217 | - | - | - | 217 | |||||||||||||||
|
Total earning
assets
|
1,073 | 41 | 4,127 | (102 | ) | 5,139 | ||||||||||||||
|
Other
assets
|
24 | 4 | 118 | - | 146 | |||||||||||||||
|
Total
assets
|
$ | 1,097 | $ | 45 | $ | 4,245 | $ | (102 | ) | $ | 5,285 | |||||||||
|
Short-term
debt
|
$ | - | $ | - | $ | - | $ | - | $ | - | ||||||||||
|
Other
liabilities
|
50 | 2 | 151 | - | 203 | |||||||||||||||
|
Asset-backed securities
issued
|
- | - | 4,016 | - | 4,016 | |||||||||||||||
|
Long-term
debt
|
140 | - | - | - | 140 | |||||||||||||||
|
Total
liabilities
|
190 | 2 | 4,167 | - | 4,359 | |||||||||||||||
|
Stockholders’
equity
|
907 | 24 | 78 | (102 | ) | 907 | ||||||||||||||
|
Noncontrolling
interest
|
- | 19 | - | - | 19 | |||||||||||||||
|
Total equity
|
907 | 43 | 78 | (102 | ) | 926 | ||||||||||||||
|
Total liabilities and
stockholders’ equity
|
$ | 1,097 | $ | 45 | $ | 4,245 | $ | (102 | ) | $ | 5,285 | |||||||||
|
u
|
We are
required under GAAP to consolidate all of the assets, liabilities, and
noncontrolling interest of the Fund, due to our significant general and
limited partnership interests and ongoing asset management
responsibilities.
|
|
u
|
We are also
required to consolidate the assets and liabilities of Sequoia and Acacia
securitization entities that are considered to be secured borrowing
transactions under GAAP. However, the securitized assets of these entities
are not available to Redwood. Similarly, the liabilities of these entities
are obligations payable only from the cash flows generated by the
securitized assets and are not obligations of
Redwood.
|
|
u
|
We collapsed
the securitization entities (Sequoia and Acacia) in our third quarter
consolidating balance sheet to reflect our declining level of investment
in these entities, and our anticipation of consolidating additional
securitizations created by third parties as a result of potential
acquisitions due to the new accounting standards (FAS 166 and 167) that
are taking effect on January 1,
2010.
|
|
u
|
At Redwood,
the only debt with recourse is our $140 million of long-term debt, which
is due in 2037.
|
|
16
|
THE REDWOOD
REVIEW 3RD QUARTER 2009
|
|
|
|
|
|
|
|
FINANCIAL
INSIGHTS
|
|
u
|
The following
table provides a summary of our GAAP income for the third and second
quarters of 2009.
|
|
GAAP
Income (Loss)
|
||||||||
|
($
in millions, except per share data)
|
||||||||
|
Three
Months Ended
|
||||||||
|
9/30/2009
|
6/30/2009
|
|||||||
|
Interest
income
|
$ | 70 | $ | 74 | ||||
|
Interest
expense
|
(25 | ) | (39 | ) | ||||
|
Net interest
income
|
45 | 35 | ||||||
|
Provision for loan
losses
|
(10 | ) | (15 | ) | ||||
|
Market valuation adjustments,
net
|
(11 | ) | (29 | ) | ||||
|
Net interest income (loss) after
provision and market valuation adjustments
|
24 | (9 | ) | |||||
|
Operating
expenses
|
(15 | ) | (11 | ) | ||||
|
Realized gains,
net
|
18 | 26 | ||||||
|
Noncontrolling
interest
|
- | - | ||||||
|
Benefit from (provision for)
income taxes
|
- | 1 | ||||||
|
GAAP income
(loss)
|
$ | 27 | $ | 7 | ||||
|
GAAP income (loss) per
share
|
$ | 0.35 | $ | 0.10 | ||||
|
u
|
Our reported
GAAP income was $27 million ($0.35 per share) for the third quarter of
2009, as compared to $7 million ($0.10 per share) for the second quarter
of 2009. Our third quarter earnings benefited from an $10 million increase
in net interest income primarily due to interest earned on senior
securities acquired in 2009. Additionally, there were fewer impairment
charges on subordinate securities as prices have stabilized and less
credit provision expense on residential loans as loan balances have
declined. Credit trends on securities and loans have generally followed
our expectations.
|
|
u
|
Our earnings
for the third quarter of 2009 also reflect an $11 million ($0.14 per
share) gain from the sale of securities, and a $7 million
($0.09 per share) gain from the repurchase of $10 million principal amount
of our long term debt in July. In the second quarter, we realized a $7
million gain from the sale of securities and a gain of $19 million
resulting from the deconsolidation of a Sequoia securitization
trust.
|
|
u
|
Operating
expenses increased primarily as a result of higher variable compensation
accruals. We currently anticipate that operating expenses will be lower in
the fourth quarter than the third
quarter.
|
|
|
THE REDWOOD
REVIEW 3RD QUARTER 2009
|
17
|
|
|
|
|
|
FINANCIAL
INSIGHTS
|
|
u
|
The tables
below show the effect that Redwood, the Fund, and Securitization Entities
had on our reported income for the third and second quarters of 2009.
These components of our income statement represent investments and are not
separate business segments.
|
|
Consolidating
Income Statement
|
||||||||||||||||||||
|
Three Months Ended September 30,
2009
|
||||||||||||||||||||
|
($ in
millions)
|
||||||||||||||||||||
|
Redwood
|
The
Fund
|
Securitization
Entities
|
Intercompany
Adjustments
|
Redwood
Consolidated
|
||||||||||||||||
|
Interest
income
|
$ | 21 | $ | - | $ | 43 | $ | - | $ | 64 | ||||||||||
|
Net discount (premium)
amortization
|
8 | 2 | (4 | ) | - | 6 | ||||||||||||||
|
Total interest
income
|
29 | 2 | 39 | - | 70 | |||||||||||||||
|
Management
fees
|
1 | - | - | (1 | ) | - | ||||||||||||||
|
Interest
expense
|
(1 | ) | - | (24 | ) | - | (25 | ) | ||||||||||||
|
Net interest
income
|
29 | 2 | 15 | (1 | ) | 45 | ||||||||||||||
|
Provision for loan
losses
|
- | - | (10 | ) | - | (10 | ) | |||||||||||||
|
Market valuation adjustments,
net
|
(8 | ) | (1 | ) | (2 | ) | - | (11 | ) | |||||||||||
|
Net interest income (loss) after
provision and market valuation adjustments
|
21 | 1 | 3 | (1 | ) | 24 | ||||||||||||||
|
Operating
expenses
|
(15 | ) | (1 | ) | - | 1 | (15 | ) | ||||||||||||
|
Realized gains,
net
|
18 | - | - | - | 18 | |||||||||||||||
|
Gain from the
Fund
|
- | - | - | - | - | |||||||||||||||
|
Gain from Securitization
Entities
|
3 | - | - | (3 | ) | - | ||||||||||||||
|
Noncontrolling
interest
|
- | - | - | - | - | |||||||||||||||
|
Benefit from (provision for)
income taxes
|
- | - | - | - | - | |||||||||||||||
|
Net income
(loss)
|
$ | 27 | $ | - | $ | 3 | $ | (3 | ) | $ | 27 | |||||||||
|
Consolidating
Income Statement
|
||||||||||||||||||||
|
Three Months Ended June 30,
2009
|
||||||||||||||||||||
|
($ in
millions)
|
||||||||||||||||||||
|
Redwood
|
The
Fund
|
Securitization
Entities
|
Intercompany
Adjustments
|
Redwood
Consolidated
|
||||||||||||||||
|
Interest
income
|
$ | 18 | $ | 1 | $ | 56 | $ | (1 | ) | $ | 74 | |||||||||
|
Net discount (premium)
amortization
|
3 | 1 | (4 | ) | - | - | ||||||||||||||
|
Total interest
income
|
21 | 2 | 52 | (1 | ) | 74 | ||||||||||||||
|
Management
fees
|
1 | - | - | (1 | ) | - | ||||||||||||||
|
Interest
expense
|
(2 | ) | - | (39 | ) | 2 | (39 | ) | ||||||||||||
|
Net interest
income
|
20 | 2 | 13 | - | 35 | |||||||||||||||
|
Provision for loan
losses
|
- | - | (15 | ) | - | (15 | ) | |||||||||||||
|
Market valuation adjustments,
net
|
(31 | ) | (2 | ) | 4 | - | (29 | ) | ||||||||||||
|
Net interest income (loss) after
provision and market valuation adjustments
|
(11 | ) | - | 2 | - | (9 | ) | |||||||||||||
|
Operating
expenses
|
(11 | ) | - | - | - | (11 | ) | |||||||||||||
|
Realized gains,
net
|
7 | - | 19 | - | 26 | |||||||||||||||
|
Gain from the
Fund
|
- | - | - | - | - | |||||||||||||||
|
Gain from Securitization
Entities
|
21 | - | - | (21 | ) | - | ||||||||||||||
|
Noncontrolling
interest
|
- | - | - | - | - | |||||||||||||||
|
Benefit from (provision for)
income taxes
|
1 | - | - | - | 1 | |||||||||||||||
|
Net income
(loss)
|
$ | 7 | $ | - | $ | 21 | $ | (21 | ) | $ | 7 | |||||||||
|
18
|
THE REDWOOD
REVIEW 3RD QUARTER 2009
|
|
|
|
|
|
|
|
FINANCIAL
INSIGHTS
|
|
u
|
At Redwood,
net interest income was $29 million for the third quarter of 2009, as
compared to $20 million
for the second quarter of 2009. The acquisition of $685 million of
securities funded with equity over the first three quarters of 2009 has
driven the 45% increase in net interest
income.
|
|
u
|
Looking
forward, our net interest income will be driven by our recently acquired
residential senior and re-REMIC securities, which currently comprise 68%
of our total earning assets. During the third quarter, these securities
generated $22 million interest income, or a 14.5% effective annual yield
that was comprised of 8.5% cash coupon interest and 6.0% non-cash discount
amortization income. Future interest income will also be largely affected
by how we deploy our remaining cash balances (which currently comprise 20%
of our total earning assets) and future cash
flows.
|
|
u
|
Negative
market valuation adjustments were $8 million, a significant decrease from
the second quarter reflecting lower impairments as security prices have
climbed and credit deterioration has generally remained consistent with
our assumptions. Additionally, the predominance of senior cash flows in
our portfolio makes our future returns less sensitive to credit than in
the past. To the extent our loss expectations do not significantly change
and we continue to hold fewer subordinate securities, we expect
impairments to remain at or below current period
levels.
|
|
u
|
We recognized
income of $3 million in the third quarter from our investments in the
Fund, Sequoia, and Acacia.
|
|
u
|
Net interest
income was $17 million in the third quarter, as compared to $15 million in
the second quarter. The increase reflects a wider spread between fixed
rate assets and floating rate liabilities at Acacia. Net income or expense
from hedging instruments that are used to offset this variance are
reflected as a component of market valuation adjustments,
net.
|
|
u
|
The provision
for loan losses totaled $10 million in the third quarter, down from $15
million in the prior quarter. Although serious delinquencies (90+ days
past due) continued to rise in the third quarter, we note that the rate of
increase has been declining in recent quarters. There are
currently no Sequoia trusts in which we had previously expensed loan loss
provisions in excess of our
investment.
|
|
u
|
Market
valuation adjustments were negative $3 million, reflecting declining
values for REO properties at Sequoia, and a slight decrease in the
net values of assets and liabilities at the Fund and
Acacia.
|
|
|
THE REDWOOD
REVIEW 3RD QUARTER 2009
|
19
|
|
|
|
|
|
FINANCIAL
INSIGHTS
|
|
u
|
Taxable
income is pre-tax profit as calculated for tax purposes. REIT taxable
income excludes taxable income earned at our taxable subsidiaries. We must
distribute at least 90% of our REIT taxable income as dividends in order
to maintain our tax status as a
REIT.
|
|
u
|
Estimated
taxable income for the third quarter was negative $23 million ($0.30 per
share), as compared to negative $12 million ($0.16 per share) for the
second quarter. Our estimated taxable income for the first nine months of
2009 was a negative $49 million ($0.68 per share). Since we anticipate a
taxable loss at the REIT for the 2009 tax year, we expect all of this
year’s dividends to be characterized as a return of
capital.
|
|
u
|
Our quarterly
taxable income is likely to remain volatile as it is difficult to
accurately project the quarter in which anticipated credit losses will
occur.
|
|
u
|
There are
differences in accounting for GAAP and tax that can lead to significant
timing differences in the recognition of income and losses.
(Reconciliations of tax and GAAP income are shown in Table 2 in the
Financial Tables in this Review.) For example, we are not allowed to
anticipate credit losses for tax in a similar manner as for
GAAP.
|
|
u
|
As a result
of these differences, our taxable income is generally higher than our GAAP
income during the initial periods of owning high credit risk assets (e.g.,
our portfolio of subordinate securities.) Then, as we are realizing credit
losses on these subordinate securities, our taxable income is generally
less than GAAP income. This is the situation we are experiencing now and
we expect this relationship to continue as this portfolio continues to
experience credit losses.
|
|
u
|
During the
third quarter, we realized $67 million of credit losses on securities for
tax that we had previously provisioned for under GAAP. Realized credit
losses are based on our tax basis, which averaged 43%, on securities that
incurred principal face losses. After giving effect to sales of some of
our commercial mortgage-backed securities (CMBS) in October, we anticipate
an additional $0.3 billion of tax losses on securities, based on our
projection of face losses and assuming a similar tax basis as we have
recently experienced.
|
|
u
|
The makeup of
our investment portfolio has changed due to recent acquisitions of senior
securities that we expect will incur low levels of credit losses. Thus, we
expect overall timing differences between GAAP and taxable income to
decrease. However, this convergence may be prolonged due to recent efforts
by the government to promote loan modifications and reduce foreclosures —
thereby delaying the actual incurrence of credit losses on our subordinate
securities.
|
|
u
|
During the
third quarter, we sold securities resulting in net capital gains for tax
of less than $1 million, which were offset by prior capital losses. Also,
in October 2009 we sold CMBS that generated additional capital losses. The
REIT currently has $135 million in capital loss carry-forwards ($1.73
share) that can be used to offset future capital
gains.
|
|
20
|
THE REDWOOD
REVIEW 3RD QUARTER 2009
|
|
|
|
|
|
|
|
DIVIENDS
|
|
u
|
On November
10, 2008, our board of directors announced its intention to pay a regular
dividend of $0.25 per share per quarter in 2009.
|
|
u
|
On September
9, 2009, our board of directors declared a regular dividend of $0.25 per
share for the third quarter, which was paid on October 21, 2009 to
shareholders of record on September 30,
2009.
|
|
u
|
We expect to
report a taxable loss in 2009 due to the realization of credit losses. We
currently expect that Redwood’s 2009 regular dividend will constitute a
return of capital and, as such, will not be taxable to
shareholders.
|
|
u
|
There was no
undistributed REIT taxable income at September 30,
2009.
|
|
u
|
We do not
expect to pay a special dividend in
2009.
|
|
|
THE REDWOOD
REVIEW 3RD QUARTER 2009
|
21
|
|
|
|
|
|
CAPITAL AND
LIQUIDITY
|
|
u
|
Our capital
totaled $1,047 million at September 30, 2009, an increase of $95 million
from $952 million at June 30, 2009. Capital increased primarily as a
result of increases in the fair values of our assets. In addition, our
GAAP income exceeded our dividend distributions.
|
|
u
|
Our excess
capital position was $198 million at September 30, 2009, compared to $325
million at June 30, 2009. During the third quarter, our sources of capital
were: $68 million from portfolio cash flows and management fees in excess
of operating and interest expenses and $74 million from asset sales. Uses
of capital included $246 million for asset acquisitions, $19 million for
dividends, $3 million for the repurchase of long term debt, and $1 million
in net changes in the balance of unsettled trades and working
capital.
|
|
22
|
THE REDWOOD
REVIEW 3RD QUARTER 2009
|
|
|
|
|
|
|
|
RESIDENTIAL REAL ESTATE
SECURITIES
|
|
u
|
Market prices
for senior RMBS continued to rise during the third quarter driven by
broad-based demand, technical factors, and by a substantial amount of
excess liquidity that moved virtually all credit and equity markets
higher. In addition to government programs that injected substantial
liquidity into the market, money market funds had outflows of $395 billion
while bond funds had inflows of over $290 billion during the first nine
months of 2009.
|
|
u
|
The following
chart illustrates generically the prices that investors were willing to
pay for senior RMBS since the beginning of
2008.
|
|
|
THE REDWOOD
REVIEW 3RD QUARTER 2009
|
23
|
|
|
|
|
|
RESIDENTIAL REAL ESTATE
SECURITIES
|
|
u
|
We remain
pessimistic about housing prices and expect further declines in the near
term.
|
|
u
|
We are
primarily focused on supply overhang, as we believe it is the most
important driver of home prices at this time. The official
inventory statistics do not reflect the extent of the
problem. According to recent research from Amherst Securities
Group LP, a record number of delinquent loans could transition into as
many as seven million additional units that are likely to hit the market
within the next approximately 18 months, which is nearly two times the
most recent inventory level of 3.6 million units and larger than the
September annualized existing housing sales rate of 5.6 million units.
These numbers do not suggest to us that stabilization or recovery in
housing prices is likely in the near
term.
|
|
u
|
Additionally,
we believe that the improvements in recent housing data are not
representative of jumbo RMBS collateral. Home sales (and thus
all home statistics) remain heavily skewed to the lower end, mostly as a
result of government policy. According to September data from
the National Association of Realtors, 70% of home sales were on houses
priced less than $250,000, and less than 10% of sales were on houses
priced over $500,000. Reflecting the lack of government support
for higher priced houses that require jumbo mortgages, less than 3% of
sales were on houses priced over $750,000. Over 49% of sales this year
have been to first-time home buyers, while the move-up buyers that
traditionally support jumbo housing markets have played a significantly
reduced role in the overall transaction
volume.
|
|
u
|
Some market
observers are beginning to call a bottom in home prices, pointing to
increases in the indexes over the last four months. We are not in that
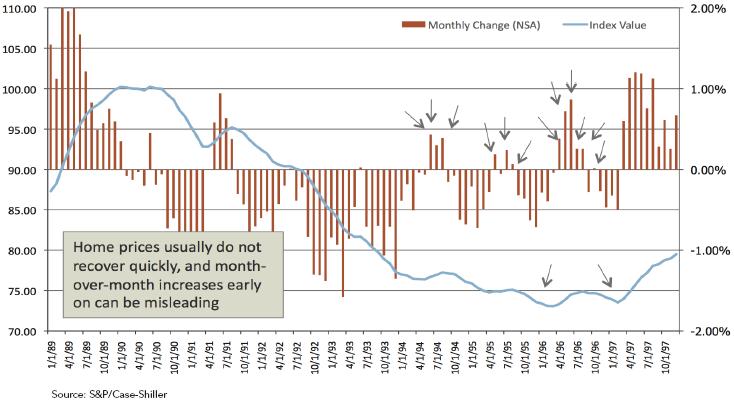
camp. As shown in the chart below, which reflects the Los Angeles housing
downturn of the early to mid 90’s, it is not uncommon for housing prices
to give a few upward “head fakes” over consecutive months while the market
continues to move lower (see the arrows we’ve added to the
chart).
|
|
24
|
THE REDWOOD
REVIEW 3RD QUARTER 2009
|
|
|
|
|
|
|
|
RESIDENTIAL REAL ESTATE
SECURITIES
|
|
u
|
We believe
the recent increases in the S&P/Case-Shiller Home Price index have
more to do with the decreasing prevalence of distressed sales. The number
of these sales, as a percentage of total sales, has dropped significantly
since the spring — according to the National Association of Realtors, the
share of existing home sales that were distressed decreased to 29% in
September, down from 50% in March. This introduces an upwards bias into
the month-over-month home price statistics; since the data points do not
reflect a consistent sample of homes, it is not clear that any homes have
actually increased in value, or if the stronger ones are just being
weighted more heavily in the index. We believe that the
decreased percentage of distressed sales is largely due to temporary
forces like seasonality and the home-buyer tax credit. Therefore, as the
summer moving season draws to a close, we expect involuntary transactions
to again increase as a percentage of existing sales and cause the index to
decline.
|
|
u
|
Nationally,
mortgage fundamentals continue to deteriorate. According to data from
LoanPerformance, serious delinquencies continue to climb rapidly and
losses were up in the third quarter. Prepayment rates slowed in the third
quarter. Voluntary prepayments on prime loans decreased to 15%
CPR by the end of
the third quarter — down from 22% CPR at the end of the second quarter.
Higher quality Alt-A loans also saw a downtick in prepayment rates
throughout the quarter, while lower quality
Alt-A loans continued to prepay at even slower
levels.
|
|
u
|
Interest
income generated by our residential securities was $28 million in the
third quarter, an annualized yield of 16.6% on our amortized cost of these
securities.
|
|
u
|
At September
30, 2009, the market value of our residential securities totaled $732
million, consisting of $337 million in prime senior securities, $279
million in non-prime senior securities, $93 million in re-REMIC
securities, and $23 million in subordinate securities. Each of these is
further discussed in a separate module
below.
|
|
u
|
During the
third quarter, we invested $246 million in securities. The table below
shows selected information on these
acquisitions.
|
|
Acquisitions
|
||||||||||||||||
|
Three Months Ended September 30,
2009
|
||||||||||||||||
|
($ in
millions)
|
||||||||||||||||
|
Weighted
|
At
Acquisiton
|
|||||||||||||||
|
Average
|
Credit
|
Seriously
|
||||||||||||||
|
Purchases
|
Price
%
|
Support
%
|
Delinquent
%
|
|||||||||||||
|
Prime
|
||||||||||||||||
|
Senior
|
$ | 137 | 75 | 8 | 7 | |||||||||||
|
Re-REMIC
|
25 | 31 | 9 | 5 | ||||||||||||
|
Subordinate
|
1 | 37 | 8 | 9 | ||||||||||||
|
Total Prime
|
163 | |||||||||||||||
|
Alt-A
|
||||||||||||||||
|
Senior
|
83 | 64 | 14 | 11 | ||||||||||||
|
Total
Acquisitions
|
$ | 246 | ||||||||||||||
|
|
THE REDWOOD
REVIEW 3RD QUARTER 2009
|
25
|
|
|
|
|
|
RESIDENTIAL REAL ESTATE
SECURITIES
|
|
u
|
Since the
beginning of 2008, our investment strategy has shifted toward acquiring
residential senior securities with what we believe is a comfortable margin
of safety to protect against a larger range of expected credit losses. Due
to the dislocations in the credit markets, we have acquired senior
securities at significant discounts to principal value. Our returns on
these investments will be based on how much principal and interest we
ultimately receive and how quickly we receive it.
|
|
u
|
We continue
to pursue opportunities with regulated entities to provide customized
credit-risk transfers and capital relief transactions that utilize our
core competencies in credit and structuring, although the accounting and
regulatory treatment for these transactions are in transition. As a
result, counterparties may not enter into these types of transactions
unless and until there is clarity that they will receive favorable capital
treatment.
|
|
u
|
At September
30, 2009, the net unamortized purchase discount on our residential
securities was $423 million, comprised of $126 million on prime senior
securities, $132 million on non-prime senior securities, $144 million on
re-REMIC securities, and $21 million on subordinate securities. The rate
at which we recognize this discount as income is dependent on how fast the
underlying loans prepay — the faster the prepayments, the higher the
yield.
|
|
u
|
The following
table breaks out the underlying loans of our prime residential securities
by size, loan type, and vintage.
|
|
Prime
Securities at Redwood
|
||||||||||||||||||||||||||||||||||||||||||||||||
|
Composition
by Product Type, Vintage, and Balance
|
||||||||||||||||||||||||||||||||||||||||||||||||
|
September
30, 2009
|
||||||||||||||||||||||||||||||||||||||||||||||||
|
<=
2004
|
2005
|
2006
|
2007
|
2008
|
Total
|
|||||||||||||||||||||||||||||||||||||||||||
|
Product
|
% of
Balance
|
Wtd Avg Loan Rate (1)
|
% of
Balance
|
Wtd Avg Loan Rate (1)
|
% of
Balance
|
Wtd Avg Loan Rate (1)
|
% of
Balance
|
Wtd Avg Loan Rate (1)
|
% of
Balance
|
Wtd Avg Loan Rate (1)
|
% of
Balance
|
Wtd Avg Loan Rate (1)
|
||||||||||||||||||||||||||||||||||||
|
Hybrid/ARM
(2)
|
25 | % | 4.26 | % | 41 | % | 5.39 | % | 30 | % | 5.94 | % | 14 | % | 6.47 | % | 9 | % | 6.13 | % | 28 | % | 4.92 | % | ||||||||||||||||||||||||
|
Fixed
|
12 | % | 5.68 | % | 5 | % | 6.08 | % | 14 | % | 6.30 | % | 46 | % | 6.38 | % | 73 | % | 6.58 | % | 14 | % | 6.01 | % | ||||||||||||||||||||||||
|
Jumbo
|
37 | % | 46 | % | 44 | % | 60 | % | 82 | % | 42 | % | ||||||||||||||||||||||||||||||||||||
|
Hybrid/ARM
(2)
|
35 | % | 4.37 | % | 48 | % | 5.45 | % | 40 | % | 5.99 | % | 6 | % | 6.45 | % | 3 | % | 6.38 | % | 36 | % | 4.92 | % | ||||||||||||||||||||||||
|
Fixed
|
28 | % | 5.64 | % | 6 | % | 6.05 | % | 16 | % | 6.27 | % | 34 | % | 6.38 | % | 15 | % | 6.46 | % | 22 | % | 5.82 | % | ||||||||||||||||||||||||
|
Conforming
|
63 | % | 54 | % | 56 | % | 40 | % | 18 | % | 58 | % | ||||||||||||||||||||||||||||||||||||
|
Totals
|
100 | % | 100 | % | 100 | % | 100 | % | 100 | % | 100 | % | ||||||||||||||||||||||||||||||||||||
|
(1) Average rate is based on
underlying loan balances.
|
|
(2) ARMs represent approximately
2% of our
portfolio.
|
|
u
|
The majority
— or 58% — of the loans underlying our securities are within the
Agency conforming loan limits. These limits vary by county and are as high
as $729,750 in high cost areas.
|
|
u
|
The table
above also provides the weighted average coupon rates for the respective
year of issuance. As of the end of October 2009, the current fixed
mortgage rate for a conforming Agency loan was approximately 5.2%. Should
mortgage rates decline, the ability of borrowers to refinance and the
attractiveness of financing will increase, although mortgage rates are
only one of the factors affecting refinancing.
|
|
26
|
THE REDWOOD
REVIEW 3RD QUARTER 2009
|
|
|
|
|
|
|
|
RESIDENTIAL REAL ESTATE
SECURITIES
|
|
u
|
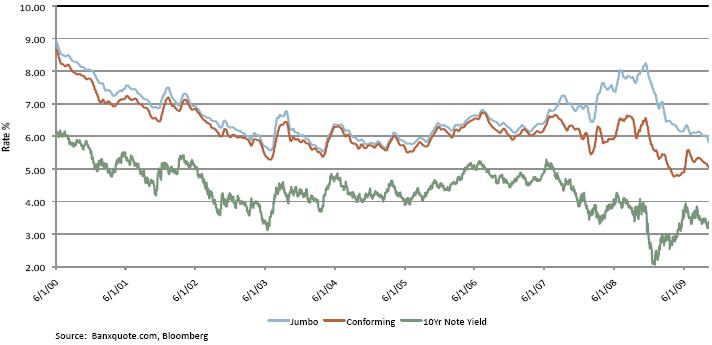
Historically,
conforming loan rates have generally been about 200 basis points over
10-year Treasury rates and jumbo mortgage rates have been roughly 25 basis
points over conforming loan rates. As illustrated in the chart below,
spreads have widened over the last two years during the credit crisis.
More recently, spreads between conforming loans and the 10-year have
normalized due to Treasury Department and Federal Reserve policy programs.
The spread between jumbo and conforming mortgages remains wide but has
improved from an average of 147 basis points in the first quarter of 2009
to 81 basis points in the third quarter, and more recently to 72 basis
points in mid-October.
|
|
u
|
For the past
18 months, there has been a high correlation between prepayments on loans
underlying Fannie Mae 5.5% coupon securities and prepayments on jumbo
fixed-rate loans. For most of that time period, prepayments on loans
underlying the Fannie Mae 5.5% coupon securities have been faster than
jumbo fixed-rate loan prepayments, primarily reflecting the wide spread
between the Agency and jumbo loan rates. As mentioned above, this spread
has been tightening, causing the difference between prepayment speeds to
narrow to its lowest level this year, as seen in the graph
below.
|

|
|
THE REDWOOD
REVIEW 3RD QUARTER 2009
|
27
|
|
|
|
|
|
RESIDENTIAL REAL ESTATE
SECURITIES
|
|
u
|
The following
table presents information on our residential prime senior securities at
Redwood at September 30, 2009. Most of our senior securities are from the
2005 vintage.
|
|
Credit
Support Analysis - Prime Senior Securities at
Redwood
|
||||||||||||||||||||
|
By
Vintage
|
||||||||||||||||||||
|
September 30,
2009
|
||||||||||||||||||||
|
($ in
millions)
|
||||||||||||||||||||
|
<=2004
|
2005
|
2006
|
2007
|
Total
|
||||||||||||||||
|
Current
face
|
$ | 19 | $ | 337 | $ | 18 | $ | 59 | $ | 433 | ||||||||||
|
Net unamortized
discount
|
(5 | ) | (103 | ) | (4 | ) | (14 | ) | (126 | ) | ||||||||||
|
Credit
reserve
|
- | (6 | ) | - | (5 | ) | (11 | ) | ||||||||||||
|
Unrealized gains
(losses)
|
1 | 36 | (1 | ) | 5 | 41 | ||||||||||||||
|
Fair value of AFS Prime Senior
Securities
|
$ | 15 | $ | 264 | $ | 13 | $ | 45 | $ | 337 | ||||||||||
|
Overall credit
support to Prime Senior Securities (1)
|
10.61 | % | 7.40 | % | 6.27 | % | 7.40 | % | 7.48 | % | ||||||||||
|
Serious
delinquencies as a % of collateral balance (1)
|
5.78 | % | 6.32 | % | 6.70 | % | 5.51 | % | 6.05 | % | ||||||||||
|
(1) Overall credit support and
serious delinquency rates are weighted by securitization
balances. Credit support and delinquencies may vary
significantly by
securitization.
|
|
u
|
The overall
credit support data presented in the table above represents the level of
support for the position owned by Redwood. The credit reserve represents
the losses we expect these securities to absorb. Over time, the
performance of these securities may require us to reassess the amount of
credit reserves we designate. We acquire securities assuming a range of
outcomes and believe our returns can still be attractive even if losses
increase above our current
estimates.
|
|
u
|
Comparing the
level of credit support available to seriously delinquent loans provides a
measure of the low level of credit sensitivity that exists within our
senior securities portfolio. For example, a senior security may have 7% of
credit support with serious delinquencies currently at 4%. Assuming a
historically high 50% loss severity on these delinquencies would produce
losses of 2%, leaving enough credit support for an additional 5% of losses
before the senior security would start to absorb credit
losses.
|
|
28
|
THE REDWOOD
REVIEW 3RD QUARTER 2009
|
|
|
|
|
|
|
|
RESIDENTIAL REAL ESTATE
SECURITIES
|
|
u
|
The following
table presents information on our residential non-prime senior securities
at Redwood at September 30, 2009. Most of our non-prime senior securities
are from 2005 and prior vintages.
|
|
Credit
Support Analysis - Non-Prime Senior Securities at
Redwood
|
||||||||||||||||||||
|
By
Vintage
|
||||||||||||||||||||
|
September 30,
2009
|
||||||||||||||||||||
|
($
in millions)
|
||||||||||||||||||||
|
<=2004
|
2005
|
2006
|
2007
|
Total
|
||||||||||||||||
|
Current
face
|
$ | 138 | $ | 231 | $ | 24 | $ | 2 | $ | 395 | ||||||||||
|
Net unamortized
discount
|
(41 | ) | (80 | ) | (10 | ) | (1 | ) | (132 | ) | ||||||||||
|
Credit
reserve
|
- | (10 | ) | - | - | (10 | ) | |||||||||||||
|
Unrealized gains
(losses)
|
13 | 12 | (2 | ) | - | 23 | ||||||||||||||
|
Fair value of Non-Prime Senior
Securities (AFS)
|
$ | 110 | $ | 153 | $ | 12 | $ | 1 | $ | 276 | ||||||||||
|
Overall credit
support to Non-Prime Senior Securities (1)
|
15.37 | % | 21.60 | % | 35.46 | % | 4.50 | % | 20.21 | % | ||||||||||
|
Serious
delinquencies as a % of collateral balance (1)
|
9.45 | % | 15.30 | % | 21.58 | % | 13.52 | % | 14.36 | % | ||||||||||
|
Fair value of Non-Prime Senior
Securities (trading)
|
$ | - | $ | 2 | $ | - | $ | 1 | $ | 3 | ||||||||||
|
Total fair value of Non-Prime
Senior Securities
|
$ | 110 | $ | 155 | $ | 12 | $ | 2 | $ | 279 | ||||||||||
|
(1) Overall credit support and
serious delinquency rates are weighted by securitization
balances. Credit support and delinquencies may vary
significantly by
securitization.
|
|
u
|
Serious
delinquencies in our non-prime senior portfolio are significantly higher
than in our prime senior portfolio. However, the levels of credit and
structural support are also significantly higher and, as a result, our
non-prime senior portfolio is better able to withstand the
higher levels of credit losses we expect to incur on these pools.
Please see the discussion on the previous page on comparing the level of
credit support to serious
delinquencies.
|
|
u
|
We sold our
remaining subprime senior security in the third quarter and recognized a
small gain.
|
|
|
THE REDWOOD
REVIEW 3RD QUARTER 2009
|
29
|
|
|
|
|
|
RESIDENTIAL REAL ESTATE
SECURITIES
|
|
u
|
The following
table presents information on our residential re-REMIC support securities
at Redwood at September 30, 2009.
|
|
Credit
Support Analysis - Re-REMIC Support Securities at
Redwood
|
||||||||||||||||||||
|
By
Vintage
|
||||||||||||||||||||
|
September 30,
2009
|
||||||||||||||||||||
|
($
in millions)
|
||||||||||||||||||||
|
<=2004
|
2005
|
2006
|
2007
|
Total
|
||||||||||||||||
|
Current
face
|
$ | 6 | $ | 35 | $ | 243 | $ | 35 | $ | 319 | ||||||||||
|
Net unamortized
discount
|
(4 | ) | (20 | ) | (104 | ) | (16 | ) | (144 | ) | ||||||||||
|
Credit
reserve
|
(1 | ) | (5 | ) | (80 | ) | (9 | ) | (95 | ) | ||||||||||
|
Unrealized
gains
|
- | - | 13 | - | 13 | |||||||||||||||
|
Fair value of AFS re-REMIC Support
Securities
|
$ | 1 | $ | 10 | $ | 72 | $ | 10 | $ | 93 | ||||||||||
|
Overall credit
support to re-REMIC support securities
(1)
|
8.13 | % | 7.80 | % | 3.41 | % | 6.83 | % | 6.70 | % | ||||||||||
|
Serious
delinquencies as a % of collateral balance (1)
|
4.39 | % | 5.49 | % | 3.11 | % | 4.86 | % | 4.68 | % | ||||||||||
|
(1) Overall credit support and
serious delinquency rates are weighted by securitization
balances. Credit support and delinquencies may vary
significantly by
securitization.
|
|
30
|
THE REDWOOD
REVIEW 3RD QUARTER 2009
|
|
|
|
|
|
|
|
RESIDENTIAL REAL ESTATE
SECURITIES
|
|
u
|
The table
below presents the components of fair value (which equals GAAP carrying
value) of residential subordinate securities at Redwood at September 30,
2009.
|
|
Residential
Subordinate Securities at Redwood
|
||||||||||||
|
September
30, 2009
|
||||||||||||
|
($
in millions)
|
||||||||||||
|
Vintage
|
||||||||||||
|
<=2004
|
>=2005
|
Total
|
||||||||||
|
Available for sale
(AFS)
|
||||||||||||
|
Current
face
|
$ | 214 | $ | 307 | $ | 521 | ||||||
|
Credit
reserve
|
(166 | ) | (283 | ) | (449 | ) | ||||||
|
Net unamortized
discount
|
(16 | ) | (5 | ) | (21 | ) | ||||||
|
Amortized
cost
|
32 | 19 | 51 | |||||||||
|
Unrealized
gains
|
1 | 1 | 2 | |||||||||
|
Unrealized
losses
|
(18 | ) | (13 | ) | (31 | ) | ||||||
|
Fair value of AFS Subordinate
Securities
|
$ | 15 | $ | 7 | $ | 22 | ||||||
|
Fair value of trading subordinate
securities
|
1 | - | 1 | |||||||||
|
Total fair value of Subordinate
Securities
|
$ | 16 | $ | 7 | $ | 23 | ||||||
|
u
|
Credit losses
totaled $97 million in our residential subordinate portfolio in the third
quarter, down from $127 million in the second quarter. We expect future
losses will extinguish the large majority of our securities in the 2005
and later category as reflected by our $283 million of credit reserves
compared to the $307 million face value of those securities. We expect
losses on the securities in the 2004 and earlier category will also be
high based on our level of reserves to face value, but we expect to
recover some principal over time. Until then, we will continue to earn
interest on the face value of those securities.
|
|
u
|
Due to the
structure of RMBS, once losses in a pool of mortgages exceed our
investment in that pool, we cannot suffer additional losses as the most we
have to lose is capped at our investment in the securities in that
pool.
|
|
|
THE REDWOOD
REVIEW 3RD QUARTER 2009
|
31
|
|
|
|
|
|
RESIDENTIAL REAL ESTATE
SECURITIES
|
|
u
|
The following
table presents information on our residential available for sale (AFS)
subordinate securities at Redwood at September 30, 2009, by their priority
to absorb losses within their respective
securitization.
|
|
Residential
AFS Subordinate Securities at Redwood
|
||||||||||||||||||||||||||||||||||||
|
By
Loss Ranking and Vintage
|
||||||||||||||||||||||||||||||||||||
|
September 30,
2009
|
||||||||||||||||||||||||||||||||||||
|
($ in
millions)
|
||||||||||||||||||||||||||||||||||||
|
<2004
|
2005-2008
|
Total
|
||||||||||||||||||||||||||||||||||
|
Face
|
Credit
Reserve
|
Market
Value
|
Face
|
Credit
Reserve
|
Market
Value
|
Face
|
Credit
Reserve
|
Market
Value
|
||||||||||||||||||||||||||||
|
Loss
rank
|
||||||||||||||||||||||||||||||||||||
|
6th
|
$21 | $4 | $4 | $73 | $52 | $3 | $94 | $56 | $7 | |||||||||||||||||||||||||||
|
5th
|
22 | 16 | 1 | 38 | 38 | - | 60 | 54 | 1 | |||||||||||||||||||||||||||
|
4th
|
14 | 11 | 1 | 32 | 32 | 1 | 46 | 43 | 2 | |||||||||||||||||||||||||||
|
3rd
|
41 | 36 | 2 | 86 | 85 | 1 | 127 | 121 | 3 | |||||||||||||||||||||||||||
|
2nd
|
35 | 30 | 3 | 52 | 51 | 1 | 87 | 81 | 4 | |||||||||||||||||||||||||||
|
1st
|
81 | 69 | 4 | 26 | 25 | 1 | 107 | 94 | 5 | |||||||||||||||||||||||||||
|
Total
|
$214 | $166 | $15 | $307 | $283 | $7 | $521 | $449 | $22 | |||||||||||||||||||||||||||
|
32
|
THE REDWOOD
REVIEW 3RD QUARTER 2009
|
|
|
|
|
|
|
|
COMMERCIAL REAL ESTATE
SECURITIES
|
|
u
|
Commercial
real estate values are in the process of establishing a new equilibrium.
According to the Moody’s/REAL Commercial Property Price Index (CPPI),
commercial property prices have fallen over 40% from their October 2007
peak. The consensus among many market participants is that prices will
continue to decline.
|
|
u
|
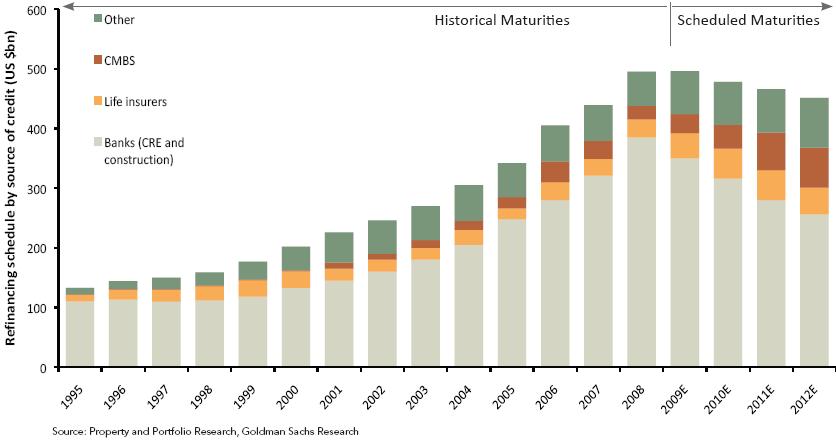
Approximately
half of the $3.4 trillion outstanding commercial mortgage loans are
scheduled to mature sometime before the end of 2012, as illustrated in the
chart below.
|
|
|
THE REDWOOD
REVIEW 3RD QUARTER 2009
|
33
|
|
|
|
|
|
COMMERCIAL REAL ESTATE
SECURITIES
|
|
u
|
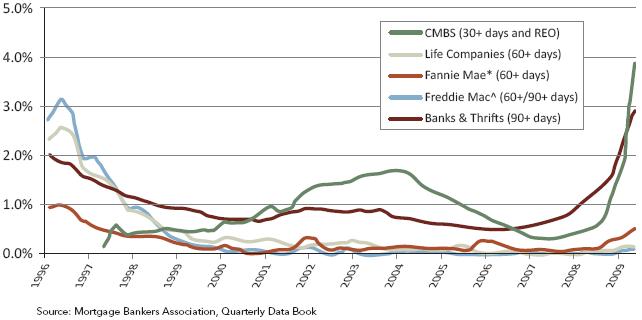
Traditional
mortgage market participants (including CMBS lenders, banks, and insurance
companies) have diminished capacity for new lending. Many of these lenders
are primarily focused on their own capital and risk management issues and
have significantly tightened their underwriting standards in response to
deteriorating fundamentals in the commercial sector (see chart
below).
|
|
u
|
Falling
commercial property values, more conservative lending standards, and debt
shortfalls should result in opportunities to carefully invest in
commercial assets with attractive long term cash flows. We are prepared to
take advantage of these opportunities and to provide solutions for
targeted borrowers and assets that require new capital.
|
|
u
|
Despite
deteriorating fundamentals, prices on most CMBS improved materially during
the third quarter. In part, the rally was fueled by the Federal
Reserve’s TALF program and the Treasury Department’s PPIP program, each of
which provide non-recourse leverage for the acquisition of certain types
of these securities.
|
|
u
|
Our legacy
portfolio of commercial securities (acquired prior to 2008) generated $3
million of cash flow during the third quarter, down from $4 million in the
second quarter as delinquencies increased and reduced our cash receipts.
|
|
u
|
In early
October, we sold the majority of our 2006 and 2007 vintage CMBS and
generated proceeds of $8 million. We continually manage our portfolio and
determined that it was prudent to sell these assets in
October.
|
|
u
|
Our remaining
investments in commercial securities consist of predominantly 2004 and
2005 subordinate bonds with a market value of $9 million. These securities
have a face value of $176 million and credit reserves of $162
million.
|
|
u
|
Realized
credit losses on our commercial subordinate securities of $21 million were
charged against our designated credit reserve in the third quarter of
2009, up from $5 million in the second quarter. The large majority of
these losses were incurred on the securities we sold in October.
|
|
34
|
THE REDWOOD
REVIEW 3RD QUARTER 2009
|
|
|
|
|
|
|
|
INVESTMENTS IN SECURITIZATION
ENTITIES
|
|
u
|
At September
30, 2009, our aggregate investments in Sequoia and Acacia represented 9%
of our GAAP book value.
|
|
u
|
Cash
generated by our investments in Sequoia and Acacia totaled $12 million in
the third quarter of 2009 compared to $15 million in the second quarter of
2009. The majority — $10 million— of this cash flow was generated from the
Sequoia IOs we own, which were primarily issued prior to
2006.
|
|
u
|
Our Sequoia
IOs have significant prepayment risk. These IOs earn the “spread” between
the coupon rate on the $2.5 billion notional amount of underlying
adjustable rate mortgage (ARM) loans and the cost of funds (indexed to
one-month LIBOR) on the ABS issued within each respective securitization
entity. Returns on these investments increase when prepayments slow and
decrease when prepayments speed up.
|
|
u
|
Prepayment
speeds remain low as the ARM loans at Sequoia are largely indexed to one
and six-month LIBOR. For September 2009, these loans had a weighted
average coupon of 2.69%. Given the current very low coupon rate, we expect
prepayment speeds on these loans to remain low, which is positive for the
future cash flow generation from our IO investments. The prepayment speed
on the hybrids, which represent 5% of the consolidated Sequoia loans, has
increased this year as these loans are nearing their reset dates and
borrowers are likely facing higher future payments and are refinancing
into other options.
|
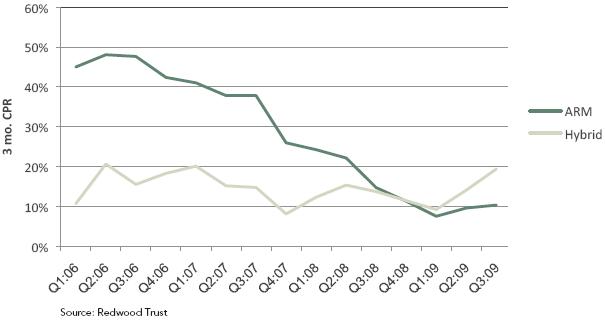
|
|
THE REDWOOD
REVIEW 3RD QUARTER 2009
|
35
|
|
|
|
|
|
INVESTMENTS IN SECURITIZATION
ENTITIES
|
|
u
|
The economic
value of our Sequoia investments at September 30, 2009, was $47 million,
consisting of $45 million of IOs and $2 million of senior and subordinate
securities.
|
|
u
|
The economic
value of our investments in Acacia at September 30, 2009, was $2 million
and is primarily derived from expected future management fees discounted
at 45%. As noted in prior Reviews, collateral rating downgrades by credit
rating agencies have now shut off the cash flows on all of our equity
investments in Acacia and these are valued at
zero.
|
|
u
|
Our
investments in consolidated securitization entities do not appear on our
balance sheet as assets; rather, they are reflected as the difference
between the consolidated assets of Sequoia and Acacia ($4.3 billion at
September 30, 2009) and the consolidated Sequoia and Acacia ABS issued to
third parties ($4.2 billion), which are carried on our consolidated
balance sheet at their amortized cost. Thus, at September 30, 2009, the
GAAP book value of Redwood’s investments in Sequoia and Acacia was $78
million. This differs from the $49 million estimated fair value of our
investments in these securitization
entities.
|
|
u
|
The
consolidation of the assets and liabilities of
securitization entities also leads to potentially volatile
reported earnings for a variety of reasons including; the amortization of
premium on the loans and liabilities at Sequoia, the credit loss provision
for the loans at Sequoia, the adoption of fair value for all the assets
and liabilities of Acacia, and deconsolidation events. Each of
these factors could cause income to vary significantly in any quarter.
|
|
u
|
In the third
quarter, we recognized income of $3 million from Sequoia and Acacia as
compared to $21 million in the second quarter. The primary
reason for this difference was the deconsolidation of a Sequoia entity in
the second quarter that resulted in a one-time gain of $19
million.
|
|
36
|
THE REDWOOD
REVIEW 3RD QUARTER 2009
|
|

|
|
|
|
|
ACCOUNTING
DISCUSSION
|
|
u
|
Market values
reported for our assets and liabilities (except for those held at
historical cost) reflect an “exit price,” or the amount we believe we
would realize if we sold an asset or would pay if we repurchased a
liability in an orderly transaction. This is the required accounting
standard even if we have no intention to sell assets or repurchase
liabilities.
|
|
u
|
Establishing
market values is inherently subjective given the volatile and illiquid
markets for our real estate assets and liabilities and requires us to make
a number of assumptions, including assumptions about the future of
interest rates, prepayment rates, discount rates, credit loss rates, and
the timing of credit losses. The assumptions we apply are specific to
each asset or liability.
|
|
u
|
Although we
rely on our internal calculations to compute the fair value of the
securities we own, we request and consider indications of value (marks)
from third-party dealers to assist us in our valuation process. The
availability of third-party marks continues to decline, in part because
some dealers no longer exist and others have ceased providing client
valuation services. For September 30, 2009, we received dealer marks on
75% of our securities and 89% of our ABS issued. In the aggregate,
our internal valuations of the securities on which we received dealer
marks were 4% lower (i.e., more conservative) than the aggregate dealer
marks. Our internal valuations of our ABS issued on which we received
dealer marks were 8% higher (i.e., more conservative) than the
aggregate dealer marks.
|
|
u
|
The rules
regarding mark-to-market (MTM) accounting are complex, may not be
consistent across portfolios or clearly reflect the underlying economics,
and continue to change. This accounting discussion is intended to provide
investors with a better understanding of the impact of MTM adjustments on
our reported results.
|
|
u
|
MTM
adjustments can result from changes in fair values caused either by a
change in expected cash flows (i.e., increased credit loss estimates that
reduce expected cash flows), a change in market discount rates (i.e., the
market requires a greater risk premium and/or interest rates rise), or a
combination of both. MTM adjustments may be recognized through our income
statement or through our balance sheet. MTM adjustments also arise from
other changes in assets and liabilities such as principal payments,
amortization of premiums and discounts, and, on occasion,
reclassifications required by new accounting
principles.
|
|
u
|
Subordinate
and most senior securities held at Redwood and the real estate securities
held by the Fund are accounted for as AFS securities. We carry AFS
securities on our balance sheet at their fair value. Positive changes in
the fair value of AFS securities in any period are accounted for as
increases to stockholders’ equity and do not flow through our income
statement.
|
|
38
|
THE REDWOOD
REVIEW 3RD QUARTER 2009
|
|
|
|
|
|
|
|
ACCOUNTING
DISCUSSION
|
|
u
|
Accounting
for negative changes in the fair value of AFS securities in any period
requires a multi-step process involving quantitative and judgmental
evaluations. The purpose of this process is to determine whether any
decline in the market value of a security below its cost basis
is “temporary” or “other-than-temporary” impairment. Temporary
impairments are recorded as a reduction of stockholders’ equity.
Other-than-temporary impairments are fully expensed through our income
statement to the extent we do not believe we will hold the security for a
duration in which it can recover in value. However, if we do not expect to
sell the security, a further evaluation is needed to determine the “credit
portion” of the other-than-temporary impairment. In this scenario, only
the credit portion is recorded through our income statement, with the
remaining “non-credit portion” recorded as a reduction of stockholders’
equity.
|
|
u
|
For the
Sequoia entities, we generally consolidate the loans and liabilities,
which are reported at amortized cost, except for REO, which are reported
at the lower of cost or fair value.
|
|
u
|
For
accounting purposes, we consolidate the balance sheets and income
statements of the Acacia securitization entities. All changes in fair
value for these assets and liabilities flow through the income statement.
These adjustments can have a positive or negative impact on income in any
period.
|
|
u
|
The following
diagram outlines the process for determining the amount of impairments and
what portion flows through our income statement and what portion flows
through our balance sheet.
|
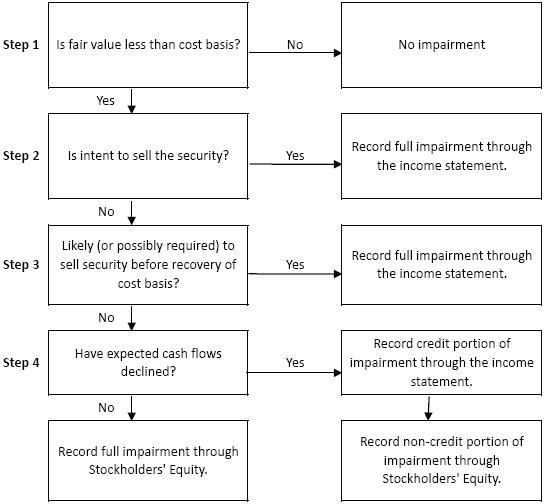
|
|
THE REDWOOD
REVIEW 3RD QUARTER 2009
|
39
|
|
|
|
|
|
ACCOUNTING
DISCUSSION
|
|
u
|
The first
step is to determine if the fair value is less than the cost basis. If
not, there is no impairment.
|
|
u
|
The second
step is to determine whether we have the intention to sell the security.
If so, the asset is other-than-temporarily impaired and we record the
entire difference between fair value and our cost basis through our income
statement.
|
|
u
|
The third
step is to ascertain whether we would be required to sell the security
before it recovers in value. If we would be required to sell, then the
asset is other-than-temporarily impaired and the entire MTM adjustment is
taken through the income statement. It should be noted that since we
currently fund the purchase of our securities with equity (and long-term
debt), we generally do not expect to be required to sell our
securities.
|
|
u
|
The fourth
step is to determine if there has been an adverse change in projected cash
flows. If there has been an adverse change, we then compare the present
value of expected future cash flows from the security to its amortized
cost. The discount rate used in this analysis is equal to the yield we
expected to earn on the asset in the previous reporting period.
|
|
•
|
If the
present value is greater than amortized cost, there is no
other-than-temporary impairment and MTM adjustments are recorded through
the balance sheet.
|
|
•
|
If the
present value is less than the amortized cost, there is
other-than-temporary impairment. The difference between the fair value and
amortized cost is then separated
into:
|
|
–
|
the amount
relating to credit loss (which is the difference between the market value
and the present value) which is recognized through the income statement,
and
|
|
–
|
the amount
relating to all other factors (which is the difference between the present
value and amortized cost) which is recognized through the balance
sheet.
|
|
40
|
THE REDWOOD
REVIEW 3RD QUARTER 2009
|
|
|
|
|
|
|
|
GLOSSARY
|
|
|
THE REDWOOD
REVIEW 3RD QUARTER 2009
|
41
|
|
|
|
|
|
GLOSSARY
|
|
42
|
THE REDWOOD
REVIEW 3RD QUARTER 2009
|
|
|
|
|
|
|
|
GLOSSARY
|
|
|
THE REDWOOD
REVIEW 3RD QUARTER 2009
|
43
|
|
|
|
|
|
GLOSSARY
|
|
44
|
THE REDWOOD
REVIEW 3RD QUARTER 2009
|
|
|
|
|
|
|
|
GLOSSARY
|
|
|
THE REDWOOD
REVIEW 3RD QUARTER 2009
|
45
|
|
|
|
|
|
GLOSSARY
|
|
46
|
THE REDWOOD
REVIEW 3RD QUARTER 2009
|
|
|
|
|
|
|
|
GLOSSARY
|
|
|
THE REDWOOD
REVIEW 3RD QUARTER 2009
|
47
|
|
48
|
THE REDWOOD
REVIEW 3RD QUARTER 2009
|
|

|
|
Table 1: GAAP Earnings ($ in
thousands, except per share data)
|
50
|
|
Nine
|
Nine
|
|||||||||||||||||||||||||||||||||||||||||||
|
2009
|
2009
|
2009
|
2008
|
2008
|
2008
|
2008
|
2007
|
2007
|
Months
|
Months
|
||||||||||||||||||||||||||||||||||
|
Q3
|
Q2
|
Q1
|
Q4
|
Q3
|
Q2
|
Q1
|
Q4
|
Q3
|
2009
|
2008
|
||||||||||||||||||||||||||||||||||
|
Interest
income
|
$ | 64,424 | $ | 74,332 | $ | 83,903 | $ | 124,452 | $ | 126,227 | $ | 140,444 | $ | 171,978 | $ | 193,728 | $ | 207,023 | $ | 222,659 | $ | 438,649 | ||||||||||||||||||||||
|
Discount
(premium) amortization on securities, net
|
9,575 | 3,864 | 4,917 | (1,189 | ) | 7,850 | 6,258 | 10,864 | 18,869 | 20,514 | 18,356 | 24,972 | ||||||||||||||||||||||||||||||||
|
Other
investment interest income
|
25 | 54 | 76 | 572 | 487 | 514 | 732 | 984 | 1,143 | 155 | 1,733 | |||||||||||||||||||||||||||||||||
|
Premium
amortization expense on loans
|
(3,642 | ) | (3,988 | ) | (7,459 | ) | (547 | ) | (3,372 | ) | (10,215 | ) | (7,509 | ) | (6,656 | ) | (8,349 | ) | (15,089 | ) | (21,096 | ) | ||||||||||||||||||||||
|
Total interest
income
|
70,382 | 74,262 | 81,437 | 123,288 | 131,192 | 137,001 | 176,065 | 206,925 | 220,331 | 226,081 | 444,258 | |||||||||||||||||||||||||||||||||
|
Interest
expense on short-term debt
|
- | - | - | (3 | ) | (65 | ) | (68 | ) | (183 | ) | (377 | ) | (5,858 | ) | - | (316 | ) | ||||||||||||||||||||||||||
|
Interest
expense on ABS
|
(22,071 | ) | (36,066 | ) | (44,517 | ) | (94,430 | ) | (88,294 | ) | (93,993 | ) | (123,431 | ) | (147,799 | ) | (155,661 | ) | (102,654 | ) | (305,718 | ) | ||||||||||||||||||||||
|
ABS issuance
expense amortization
|
(570 | ) | (586 | ) | (553 | ) | (1,470 | ) | (930 | ) | (1,921 | ) | (2,093 | ) | (4,644 | ) | (4,616 | ) | (1,709 | ) | (4,944 | ) | ||||||||||||||||||||||
|
ABS interest
rate agreement (expense) income
|
(1,123 | ) | (1,111 | ) | (1,098 | ) | (1,934 | ) | (1,259 | ) | (1,246 | ) | (1,245 | ) | 1,265 | 1,959 | (3,332 | ) | (3,750 | ) | ||||||||||||||||||||||||
|
ABS issuance
premium amortization income
|
234 | 313 | 335 | 476 | 557 | 1,955 | 2,183 | 1,930 | 2,096 | 882 | 4,695 | |||||||||||||||||||||||||||||||||
|
Total ABS
expense consolidated from trusts
|
(23,530 | ) | (37,450 | ) | (45,833 | ) | (97,358 | ) | (89,926 | ) | (95,205 | ) | (124,586 | ) | (149,248 | ) | (156,222 | ) | (106,813 | ) | (309,717 | ) | ||||||||||||||||||||||
|
Interest
expense on long-term debt
|
(1,307 | ) | (1,502 | ) | (1,809 | ) | (2,344 | ) | (2,164 | ) | (2,233 | ) | (2,533 | ) | (3,055 | ) | (3,150 | ) | (4,618 | ) | (6,930 | ) | ||||||||||||||||||||||
|
Net interest
income
|
45,545 | 35,310 | 33,795 | 23,583 | 39,037 | 39,495 | 48,763 | 54,245 | 55,101 | 114,650 | 127,295 | |||||||||||||||||||||||||||||||||
|
Provision for
credit reserve
|
(9,998 | ) | (14,545 | ) | (16,033 | ) | (18,659 | ) | (18,333 | ) | (10,061 | ) | (8,058 | ) | (4,972 | ) | (1,507 | ) | (40,576 | ) | (36,452 | ) | ||||||||||||||||||||||
|
Market
valuation adjustments, net
|
(11,058 | ) | (29,135 | ) | (43,244 | ) | (111,331 | ) | (127,146 | ) | (60,496 | ) | (193,929 | ) | (1,118,989 | ) | (102,766 | ) | (83,437 | ) | (381,571 | ) | ||||||||||||||||||||||
|
Net
interest income (loss) after provision and market valuation
adjustments
|
$ | 24,489 | $ | (8,370 | ) | $ | (25,482 | ) | $ | (106,407 | ) | $ | (106,442 | ) | $ | (31,062 | ) | $ | (153,224 | ) | $ | (1,069,716 | ) | $ | (49,172 | ) | $ | (9,363 | ) | $ | (290,728 | ) | ||||||||||||
|
Fixed
compensation expense
|
(3,726 | ) | (3,572 | ) | (4,028 | ) | (3,575 | ) | (4,331 | ) | (4,648 | ) | (5,674 | ) | (4,316 | ) | (4,560 | ) | (11,326 | ) | (14,653 | ) | ||||||||||||||||||||||
|
Variable
compensation expense
|
(5,216 | ) | (1,132 | ) | (556 | ) | 418 | (616 | ) | (330 | ) | (1,857 | ) | (434 | ) | 1,096 | (6,904 | ) | (2,803 | ) | ||||||||||||||||||||||||
|
Equity
compensation expense
|
(420 | ) | (2,337 | ) | (1,795 | ) | (2,377 | ) | (3,080 | ) | (3,502 | ) | (3,306 | ) | (2,767 | ) | (2,593 | ) | (4,552 | ) | (9,888 | ) | ||||||||||||||||||||||
|
Severance
expense
|
(398 | ) | - | (28 | ) | (1,814 | ) | - | - | - | (1,340 | ) | - | (426 | ) | - | ||||||||||||||||||||||||||||
|
Other
operating expense
|
(5,046 | ) | (3,778 | ) | (4,130 | ) | (5,954 | ) | (8,824 | ) | (5,775 | ) | (5,510 | ) | (7,412 | ) | (5,675 | ) | (12,954 | ) | (20,109 | ) | ||||||||||||||||||||||
|
Total
operating expenses
|
(14,806 | ) | (10,819 | ) | (10,537 | ) | (13,302 | ) | (16,851 | ) | (14,255 | ) | (16,347 | ) | (16,269 | ) | (11,732 | ) | (36,162 | ) | (47,453 | ) | ||||||||||||||||||||||
|
Realized gains
(losses) on sales, net
|
17,561 | 25,525 | 462 | 5,671 | (15 | ) | 2,757 | (3 | ) | 7,199 | (1,460 | ) | 43,548 | 2,739 | ||||||||||||||||||||||||||||||
|
Realized
(losses) gains on calls, net
|
- | - | - | - | (50 | ) | (43 | ) | 42 | (126 | ) | 3,284 | - | (51 | ) | |||||||||||||||||||||||||||||
|
Realized gains
(losses), net
|
17,561 | 25,525 | 462 | 5,671 | (65 | ) | 2,714 | 39 | 7,073 | 1,824 | 43,548 | 2,688 | ||||||||||||||||||||||||||||||||
|
Noncontrolling
interest
|
(363 | ) | (127 | ) | 716 | 2,366 | 2,194 | (2,369 | ) | (255 | ) | - | - | 226 | (430 | ) | ||||||||||||||||||||||||||||
|
Credit
(provision) for income taxes
|
247 | 514 | (105 | ) | (3,914 | ) | 9,860 | (937 | ) | (1,800 | ) | 1,467 | (1,837 | ) | 656 | 7,123 | ||||||||||||||||||||||||||||
|
Net
income (loss)
|
$ | 27,128 | $ | 6,723 | $ | (34,946 | ) | $ | (115,586 | ) | $ | (111,304 | ) | $ | (45,909 | ) | $ | (171,587 | ) | $ | (1,077,445 | ) | $ | (60,917 | ) | $ | (1,095 | ) | $ | (328,800 | ) | |||||||||||||
|
Diluted
average shares
|
78,223 | 66,446 | 53,632 | 33,366 | 33,334 | 32,871 | 32,511 | 29,531 | 27,892 | 65,363 | 32,907 | |||||||||||||||||||||||||||||||||
|
Net
income (loss) per share
|
$ | 0.35 | $ | 0.10 | $ | (0.65 | ) | $ | (3.46 | ) | $ | (3.34 | ) | $ | (1.40 | ) | $ | (5.28 | ) | $ | (36.49 | ) | $ | (2.18 | ) | $ | (0.02 | ) | $ | (9.99 | ) | |||||||||||||
|
THE REDWOOD
REVIEW
3RD QUARTER
2009
|
Table 1: GAAP
Earnings
|
|
|
|
Table 2: GAAP and Taxable
(Loss) Income Differences ($ in thousands, except per share
data)
|
|
|
Estimated
|
Actual
|
Actual
|
Estimated
|
Actual
|
||||||||||||||||||||||||||||||||||||||||
|
Nine
|
Nine
|
|||||||||||||||||||||||||||||||||||||||||||
|
2009
|
2009
|
2009
|
2008
|
2008
|
2008
|
2008
|
2007
|
2007
|
Months
|
Months
|
||||||||||||||||||||||||||||||||||
| Q3 | Q2 | Q1 | Q4 | Q3 | Q2 | Q1 | Q4 | Q3 |
2009
|
2008
|
||||||||||||||||||||||||||||||||||
|
GAAP net
income (loss)
|
$ | 27,128 | $ | 6,723 | $ | (34,946 | ) | $ | (115,586 | ) | $ | (111,304 | ) | $ | (45,909 | ) | $ | (171,587 | ) | $ | (1,077,445 | ) | $ | (60,917 | ) | $ | (1,095 | ) | $ | (328,800 | ) | |||||||||||||
|
Difference in
taxable income calculations
|
||||||||||||||||||||||||||||||||||||||||||||
|
Amortization
and credit losses
|
(48,668 | ) | (22,762 | ) | (21,941 | ) | (5,389 | ) | (6,496 | ) | (10,374 | ) | 1,007 | (15,080 | ) | 10,426 | (93,371 | ) | (15,863 | ) | ||||||||||||||||||||||||
|
Operating
expenses
|
(1,717 | ) | 902 | 453 | (1,273 | ) | 2,713 | 706 | 1,353 | 10,048 | (2,080 | ) | (362 | ) | 4,772 | |||||||||||||||||||||||||||||
|
Realized
(gains) losses, net
|
(10,936 | ) | (25,525 | ) | (462 | ) | (5,671 | ) | 65 | (2,714 | ) | (39 | ) | (4,819 | ) | (3,073 | ) | (36,923 | ) | (2,688 | ) | |||||||||||||||||||||||
|
Market
valuation adjustments, net
|
11,058 | 29,135 | 43,244 | 111,331 | 127,146 | 60,496 | 193,929 | 1,118,989 | 102,766 | 83,437 | 381,571 | |||||||||||||||||||||||||||||||||
|
(Credit)
provision for income taxes
|
(248 | ) | (514 | ) | 105 | 3,897 | (9,825 | ) | 1,447 | 1,159 | (2,214 | ) | 1,523 | (657 | ) | (7,219 | ) | |||||||||||||||||||||||||||
|
Total
differences in GAAP and taxable income
|
(50,511 | ) | (18,764 | ) | 21,399 | 102,895 | 113,603 | 49,561 | 197,409 | 1,106,924 | 109,562 | (47,876 | ) | 360,573 | ||||||||||||||||||||||||||||||
|
Taxable (loss)
income
|
$ | (23,383 | ) | $ | (12,041 | ) | $ | (13,547 | ) | $ | (12,691 | ) | $ | 2,299 | $ | 3,652 | $ | 25,822 | $ | 29,479 | $ | 48,645 | $ | (48,971 | ) | $ | 31,773 | |||||||||||||||||
|
REIT taxable
(loss) income
|
$ | (24,933 | ) | $ | (10,379 | ) | $ | (8,701 | ) | $ | (13,005 | ) | $ | 2,400 | $ | 4,414 | $ | 24,734 | $ | 32,125 | $ | 48,591 | $ | (44,013 | ) | $ | 31,548 | |||||||||||||||||
|
Taxable income
(loss) in taxable subsidiaries
|
1,550 | (1,662 | ) | (4,846 | ) | 314 | (101 | ) | (762 | ) | 1,088 | (2,646 | ) | 54 | (4,958 | ) | 225 | |||||||||||||||||||||||||||
|
Taxable (loss)
income
|
$ | (23,383 | ) | $ | (12,041 | ) | $ | (13,547 | ) | $ | (12,691 | ) | $ | 2,299 | $ | 3,652 | $ | 25,822 | $ | 29,479 | $ | 48,645 | $ | (48,971 | ) | $ | 31,773 | |||||||||||||||||
|
After-tax
|
||||||||||||||||||||||||||||||||||||||||||||
|
Retained REIT
taxable (loss) income
|
$ | - | $ | - | $ | - | $ | - | $ | - | $ | - | $ | - | $ | - | $ | - | $ | - | $ | - | ||||||||||||||||||||||
|
Retained
taxable income (loss) in taxable subsidiaries
|
1,023 | (1,097 | ) | (3,198 | ) | 207 | (43 | ) | (444 | ) | 633 | (1,325 | ) | 34 | (3,272 | ) | 147 | |||||||||||||||||||||||||||
|
Retained
taxable income (loss)
|
$ | 1,023 | $ | (1,097 | ) | (3,198 | ) | $ | 207 | $ | (43 | ) | $ | (444 | ) | $ | 633 | $ | (1,325 | ) | $ | 34 | $ | (3,272 | ) | $ | 147 | |||||||||||||||||
|
Shares used
for taxable EPS calculation
|
77,669 | 77,503 | 60,228 | 33,471 | 33,238 | 33,184 | 32,710 | 32,385 | 27,986 | 71,874 | 32,803 | |||||||||||||||||||||||||||||||||
|
REIT taxable (loss) income per
share (1)
|
$ | (0.32 | ) | $ | (0.13 | ) | $ | (0.14 | ) | $ | (0.39 | ) | $ | 0.07 | $ | 0.13 | $ | 0.76 | $ | 0.99 | $ | 1.74 | $ | (0.60 | ) | $ | 0.96 | |||||||||||||||||
|
Taxable income
(loss) in taxable subsidiaries per share
|
$ | 0.02 | $ | (0.02 | ) | $ | (0.08 | ) | $ | 0.01 | $ | (0.00 | ) | $ | (0.02 | ) | $ | 0.03 | $ | (0.08 | ) | $ | - | $ | (0.08 | ) | $ | 0.01 | ||||||||||||||||
|
Taxable (loss) income per
share
(1)
|
$ | (0.30 | ) | $ | (0.16 | ) | $ | (0.22 | ) | $ | (0.38 | ) | $ | 0.07 | $ | 0.11 | $ | 0.79 | $ | 0.91 | $ | 1.74 | $ | (0.68 | ) | $ | 0.97 | |||||||||||||||||
|
Retained
taxable income (loss) (after-tax)
|
$ | 0.01 | $ | (0.01 | ) | $ | (0.05 | ) | $ | 0.01 | $ | (0.01 | ) | $ | (0.01 | ) | $ | 0.02 | $ | (0.04 | ) | $ | - | $ | (0.05 | ) | $ | - | ||||||||||||||||
|
THE REDWOOD
REVIEW
3RD QUARTER
2009
|
Table 2: GAAP
and Taxable (Loss) Income Differences
|
51
|
|
|
Table 3: Retention and
Distribution of Taxable Income
($ in thousands, except per
share data)
|
52
|
|
Estimated
|
Actual
|
Actual
|
Estimated
|
Actual
|
||||||||||||||||||||||||||||||||||||||||
|
Nine
|
Nine
|
|||||||||||||||||||||||||||||||||||||||||||
|
2009
|
2009
|
2009
|
2008
|
2008
|
2008
|
2008
|
2007
|
2007
|
Months
|
Months
|
||||||||||||||||||||||||||||||||||
|
Q3
|
Q2
|
Q1
|
Q4
|
Q3
|
Q2
|
Q1
|
Q4
|
Q3 |
2009
|
2008
|
||||||||||||||||||||||||||||||||||
|
Dividends
declared
|
$ | 19,417 | $ | 19,376 | $ | 15,057 | $ | 25,103 | $ | 24,928 | $ | 24,887 | $ | 24,532 | $ | 80,496 | $ | 20,989 | $ | 53,850 | $ | 74,347 | ||||||||||||||||||||||
|
Dividend
deductions on stock issued through direct stock
purchase plan
|
2 | 6 | 30 | 45 | 165 | 288 | 192 | 2,605 | 81 | 38 | 645 | |||||||||||||||||||||||||||||||||
|
Total dividend
deductions
|
$ | 19,419 | $ | 19,382 | $ | 15,087 | $ | 25,148 | $ | 25,093 | $ | 25,175 | $ | 24,724 | $ | 83,101 | $ | 21,070 | $ | 53,888 | $ | 74,992 | ||||||||||||||||||||||
|
Regular
dividend per share
|
$ | 0.25 | $ | 0.25 | $ | 0.25 | $ | 0.75 | $ | 0.75 | $ | 0.75 | $ | 0.75 | $ | 0.75 | $ | 0.75 | $ | 0.75 | $ | 2.25 | ||||||||||||||||||||||
|
Special
dividend per share
|
- | - | - | - | - | - | - | 2.00 | - | - | - | |||||||||||||||||||||||||||||||||
|
Total dividends per share
(1)
|
$ | 0.25 | $ | 0.25 | $ | 0.25 | $ | 0.75 | $ | 0.75 | $ | 0.75 | $ | 0.75 | $ | 2.75 | $ | 0.75 | $ | 0.75 | $ | 2.25 | ||||||||||||||||||||||
|
Undistributed
REIT taxable income at beginning of period (pre-tax):
|
$ | - | $ | - | $ | - | $ | 21,128 | $ | 43,821 | $ | 64,582 | $ | 64,572 | $ | 115,548 | $ | 88,027 | $ | - | $ | 64,572 | ||||||||||||||||||||||
|
REIT taxable
income (loss) (pre-tax)
|
(24,933 | ) | (10,379 | ) | (8,701 | ) | (13,005 | ) | 2,400 | 4,414 | 24,734 | 32,125 | 48,591 | (44,013 | ) | 31,548 | ||||||||||||||||||||||||||||
|
Dividend of
2006 income
|
- | - | - | - | - | - | - | - | (7,682 | ) | - | - | ||||||||||||||||||||||||||||||||
|
Dividend of
2007 income
|
- | - | - | (14,673 | ) | (25,175 | ) | (24,724 | ) | (83,101 | ) | (13,388 | ) | - | (64,572 | ) | ||||||||||||||||||||||||||||
|
Dividend of
2008 income
|
- | - | - | (12,335 | ) | (10,420 | ) | - | - | - | - | - | (10,420 | ) | ||||||||||||||||||||||||||||||
|
Dividend of
2009 income
|
- | - | - | - | - | - | - | - | - | - | - | |||||||||||||||||||||||||||||||||
|
Undistributed
REIT taxable income (pre-tax) at period end:
|
$ | - | $ | - | $ | - | $ | - | $ | 21,128 | $ | 43,821 | $ | 64,582 | $ | 64,572 | $ | 115,548 | $ | - | $ | 21,128 | ||||||||||||||||||||||
|
Undistributed
REIT taxable income (pre-tax) at period end
|
- | - | - | |||||||||||||||||||||||||||||||||||||||||
|
From
2007
|
$ | - | $ | - | $ | - | $ | - | $ | - | $ | 14,673 | $ | 39,848 | $ | 64,572 | $ | 115,548 | $ | - | $ | |||||||||||||||||||||||
| - | - | - | - | 20,872 | 29,148 | 24,734 | - | - | - | 20,872 | ||||||||||||||||||||||||||||||||||
|
Total
|
$ | - | $ | $ | - | $ | - | $ | 20,872 | $ | 43,821 | $ | 64,582 | $ | 64,572 | $ | 115,548 | $ | - | $ | 20,872 | |||||||||||||||||||||||
|
Shares
outstanding at period end
|
77,669 | 77,503 | 60,228 | 33,471 | 33,238 | 33,184 | 32,710 | 32,385 | 27,986 | 77,669 | 33,238 | |||||||||||||||||||||||||||||||||
|
Undistributed
REIT taxable income (pre-tax) per share
outstanding at period end
|
$ | - | $ | - | $ | - | $ | - | $ | 0.63 | $ | 1.32 | $ | 1.97 | $ | 1.99 | $ | 4.13 | $ | - | $ | 0.63 | ||||||||||||||||||||||
|
THE REDWOOD
REVIEW
3RD QUARTER
2009
|
Table 3:
Retention and
Distribution of Taxable Income
|
|
|
|
Table 4: Book Value and
Other Ratios ($ in millions, except per
share data)
|
|
|
2009
|
2009
|
2009
|
2008
|
2008
|
2008
|
2008
|
January
1,
|
2007
|
2007
|
|||||||||||||||||||||||||||||||
|
Q3
|
Q2
|
Q1
|
Q4
|
Q3
|
Q2
|
Q1
|
2008
(1)
|
Q4
|
Q3
|
|||||||||||||||||||||||||||||||
|
Short-term
debt
|
$ | - | $ | - | $ | - | $ | - | $ | 7 | $ | 9 | $ | 2 | $ | 8 | $ | 8 | $ | 39 | ||||||||||||||||||||
|
Long-term
debt
|
140 | 150 | 150 | 150 | 150 | 150 | 150 | 150 | 150 | 150 | ||||||||||||||||||||||||||||||
|
Redwood debt (2)
|
$ | 140 | $ | 150 | $ | 150 | $ | 150 | $ | 157 | $ | 159 | $ | 152 | $ | 158 | $ | 158 | $ | 189 | ||||||||||||||||||||
|
GAAP
stockholders' equity
|
$ | 907 | $ | 802 | $ | 506 | $ | 302 | $ | 412 | $ | 564 | $ | 585 | $ | 751 | $ | (718 | ) | $ | 149 | |||||||||||||||||||
|
Redwood debt
to equity
|
0.2 | x | 0.2 | x | 0.3 | x | 0.5 | x | 0.4 | x | 0.3 | x | 0.3 | x | 0.2 | x | (0.2 | )x | 1.3 | x | ||||||||||||||||||||
|
Redwood debt
to (equity + debt)
|
13 | % | 16 | % | 23 | % | 33 | % | 28 | % | 22 | % | 21 | % | 17 | % | -28 | % | 56 | % | ||||||||||||||||||||
|
Redwood
debt
|
$ | 140 | $ | 150 | $ | 150 | $ | 150 | $ | 157 | $ | 159 | $ | 152 | $ | 158 | $ | 158 | $ | 189 | ||||||||||||||||||||
|
ABS
obligations of consolidated securitization entities
|
4,016 | 4,185 | 4,709 | 4,855 | 6,603 | 7,110 | 7,591 | 8,839 | 10,329 | 10,803 | ||||||||||||||||||||||||||||||
|
GAAP
debt
|
$ | 4,156 | $ | 4,335 | $ | 4,859 | $ | 5,005 | $ | 6,760 | $ | 7,269 | $ | 7,743 | $ | 8,997 | $ | 10,487 | $ | 10,992 | ||||||||||||||||||||
|
GAAP debt to
equity
|
4.6 | x | 5.4 | x | 9.6 | x | 16.6 | x | 16.4 | x | 12.9 | x | 13.2 | x | 12.0 | x | (14.6 | )x | 73.8 | x | ||||||||||||||||||||
|
GAAP debt to
(equity + GAAP debt)
|
82 | % | 84 | % | 91 | % | 94 | % | 94 | % | 93 | % | 93 | % | 92 | % | 107 | % | 99 | % | ||||||||||||||||||||
|
GAAP
stockholders' equity
|
$ | 907 | $ | 802 | $ | 506 | $ | 302 | $ | 412 | $ | 564 | $ | 585 | $ | 751 | $ | (718 | ) | $ | 149 | |||||||||||||||||||
|
Balance sheet
mark-to-market adjustments
|
21 | (78 | ) | (85 | ) | (57 | ) | (84 | ) | (68 | ) | (93 | ) | (99 | ) | (574 | ) | (735 | ) | |||||||||||||||||||||
|
Core equity
(non-GAAP)
|
$ | 886 | $ | 880 | $ | 591 | $ | 359 | $ | 496 | $ | 632 | $ | 678 | $ | 850 | $ | (145 | ) | $ | 884 | |||||||||||||||||||
|
Shares
outstanding at period end
|
77,669 | 77,503 | 60,228 | 33,471 | 33,238 | 33,184 | 32,710 | 32,385 | 32,385 | 27,986 | ||||||||||||||||||||||||||||||
|
GAAP equity
per share
|
$ | 11.68 | $ | 10.35 | $ | 8.40 | $ | 9.02 | $ | 12.40 | $ | 17.00 | $ | 17.89 | $ | 23.18 | $ | (22.18 | ) | $ | 5.32 | |||||||||||||||||||
|
Adjustments:
GAAP equity to economic value
(3)
|
||||||||||||||||||||||||||||||||||||||||
| $ | (0.37 | ) | $ | (0.35 | ) | $ | (0.15 | ) | $ | (0.95 | ) | $ | (1.65 | ) | $ | (1.96 | ) | $ | (1.65 | ) | $ | (1.45 | ) | $ | (1.45 | ) | $ | (5.50 | ) | |||||||||||
|
Investments in
Acacia
|
- | 0.01 | (0.03 | ) | (0.21 | ) | (0.18 | ) | (0.66 | ) | (0.58 | ) | (1.17 | ) | 44.19 | 26.26 | ||||||||||||||||||||||||
|
Long-term
debt
|
0.97 | 1.29 | 1.79 | 3.24 | 2.61 | 2.34 | 2.38 | 1.73 | 1.73 | 1.47 | ||||||||||||||||||||||||||||||
|
Estimate of
economic value per share (non-GAAP)
|
$ | 12.28 | $ | 11.30 | $ | 10.01 | $ | 11.10 | $ | 13.18 | $ | 16.72 | $ | 18.04 | $ | 22.29 | $ | 22.29 | $ | 27.55 | ||||||||||||||||||||
|
THE REDWOOD
REVIEW
3RD QUARTER
2009
|
Table 4:
Book Value
and Other Ratios
|
53
|
|
|
Table 5 : Profitability
Ratios1 ($ in
thousands)
|
54
|
|
Nine
|
Nine
|
|||||||||||||||||||||||||||||||||||||||||||
|
2009
|
2009
|
2009
|
2008
|
2008
|
2008
|
2008
|
2007
|
2007
|
Months
|
Months
|
||||||||||||||||||||||||||||||||||
|
Q3
|
Q2
|
Q1
|
Q4
|
Q3
|
Q2
|
Q1
|
Q4
|
Q3
|
2009
|
2008
|
||||||||||||||||||||||||||||||||||
|
Interest
income
|
$ | 70,382 | $ | 74,262 | $ | 81,437 | $ | 123,288 | $ | 131,192 | $ | 137,001 | $ | 176,065 | $ | 206,925 | $ | 220,331 | $ | 226,081 | $ | 444,258 | ||||||||||||||||||||||
|
Average
consolidated earning assets
|
$ | 5,128,893 | $ | 5,325,322 | $ | 5,553,470 | $ | 7,006,592 | $ | 7,594,682 | $ | 8,137,261 | $ | 9,090,678 | $ | 11,521,330 | $ | 12,193,242 | $ | 5,334,340 | $ | 8,276,335 | ||||||||||||||||||||||
|
Asset
yield
|
5.49 | % | 5.58 | % | 5.87 | % | 7.04 | % | 6.91 | % | 6.73 | % | 7.75 | % | 7.18 | % | 7.23 | % | 5.65 | % | 7.16 | % | ||||||||||||||||||||||
|
|
||||||||||||||||||||||||||||||||||||||||||||
|
Interest
expense
|
$ | (24,837 | ) | $ | (38,952 | ) | $ | (47,642 | ) | $ | (99,705 | ) | $ | (92,155 | ) | $ | (97,506 | ) | $ | (127,302 | ) | $ | (152,680 | ) | $ | (165,230 | ) | $ | (111,431 | ) | $ | (316,963 | ) | |||||||||||
|
Average
consolidated interest-bearing liabilities
|
$ | 4,193,650 | $ | 4,651,125 | $ | 4,940,304 | $ | 6,613,677 | $ | 7,106,052 | $ | 7,499,474 | $ | 8,383,296 | $ | 10,716,433 | $ | 11,376,762 | $ | 4,593,562 | $ | 7,660,908 | ||||||||||||||||||||||
|
Cost of
funds
|
2.37 | % | 3.35 | % | 3.86 | % | 6.03 | % | 5.19 | % | 5.20 | % | 6.07 | % | 5.70 | % | 5.81 | % | 3.23 | % | 5.52 | % | ||||||||||||||||||||||
|
Asset
yield
|
5.49 | % | 5.58 | % | 5.87 | % | 7.04 | % | 6.91 | % | 6.73 | % | 7.75 | % | 7.18 | % | 7.18 | % | 5.65 | % | 7.16 | % | ||||||||||||||||||||||
|
Cost of
funds
|
(2.37 | )% | (3.35 | )% | (3.86 | )% | (6.03 | )% | (5.19 | )% | (5.20 | )% | (6.07 | )% | (5.70 | )% | (5.81 | )% | (3.23 | )% | (5.52 | )% | ||||||||||||||||||||||
|
Interest rate
spread
|
3.12 | % | 2.23 | % | 2.01 | % | 1.01 | % | 1.72 | % | 1.53 | % | 1.67 | % | 1.49 | % | 1.37 | % | 2.42 | % | 1.64 | % | ||||||||||||||||||||||
|
Net interest
income
|
$ | 45,545 | $ | 35,310 | $ | 33,795 | $ | 23,583 | $ | 39,037 | $ | 39,495 | $ | 48,763 | $ | 54,245 | $ | 55,101 | $ | 114,650 | $ | 127,295 | ||||||||||||||||||||||
|
Average
consolidated earning assets
|
$ | 5,128,893 | $ | 5,325,322 | $ | 5,553,470 | $ | 7,006,592 | $ | 7,594,682 | $ | 8,137,261 | $ | 9,090,678 | $ | 11,521,330 | $ | 12,193,242 | $ | 5,334,340 | $ | 8,276,335 | ||||||||||||||||||||||
|
Net interest
margin
|
3.55 | % | 2.65 | % | 2.43 | % | 1.35 | % | 2.06 | % | 1.94 | % | 2.15 | % | 1.88 | % | 1.81 | % | 2.87 | % | 2.05 | % | ||||||||||||||||||||||
|
Operating
expenses
|
$ | (14,806 | ) | $ | (10,819 | ) | $ | (10,537 | ) | $ | (13,302 | ) | $ | (16,851 | ) | $ | (14,255 | ) | $ | (16,347 | ) | $ | (16,269 | ) | $ | (11,732 | ) | $ | (36,162 | ) | $ | (47,453 | ) | |||||||||||
|
Average total
assets
|
$ | 5,138,793 | $ | 5,315,643 | $ | 5,575,619 | $ | 7,040,306 | $ | 7,648,102 | $ | 8,203,461 | $ | 9,223,464 | $ | 10,866,153 | $ | 12,232,304 | $ | 5,341,751 | $ | 8,355,228 | ||||||||||||||||||||||
|
Average total
equity
|
$ | 833,227 | $ | 575,661 | $ | 556,861 | $ | 371,503 | $ | 533,755 | $ | 602,402 | $ | 720,035 | $ | 97,534 | $ | 851,869 | $ | 656,262 | $ | 589,675 | ||||||||||||||||||||||
|
Operating
expenses / net interest income
|
32.51 | % | 30.64 | % | 31.18 | % | 56.41 | % | 43.17 | % | 36.09 | % | 33.52 | % | 27.52 | % | 21.89 | % | 31.54 | % | 37.28 | % | ||||||||||||||||||||||
|
Operating
expenses / average total assets
|
1.15 | % | 0.81 | % | 0.76 | % | 0.76 | % | 0.88 | % | 0.70 | % | 0.71 | % | 0.55 | % | 0.38 | % | 0.90 | % | 0.76 | % | ||||||||||||||||||||||
|
Operating
expenses / average total equity
|
7.11 | % | 7.52 | % | 7.57 | % | 14.32 | % | 12.63 | % | 9.47 | % | 9.08 | % | 61.23 | % | 5.51 | % | 7.35 | % | 10.73 | % | ||||||||||||||||||||||
|
GAAP net
income (loss)
|
$ | 27,128 | $ | 6,723 | $ | (34,946 | ) | $ | (115,586 | ) | $ | (111,304 | ) | $ | (45,909 | ) | $ | (171,587 | ) | $ | (1,077,445 | ) | $ | (60,917 | ) | $ | (1,095 | ) | $ | (328,800 | ) | |||||||||||||
|
GAAP net
income (loss) / average total assets
|
2.11 | % | 0.51 | % | (2.51 | )% | (6.57 | )% | (5.82 | )% | (2.24 | )% | (7.44 | )% | (39.66 | )% | (1.99 | )% | (0.03 | )% | (5.25 | )% | ||||||||||||||||||||||
|
GAAP net
income (loss) / average equity (GAAP ROE)
|
13.02 | % | 4.67 | % | (25.10 | )% | (124.45 | )% | (83.41 | )% | (30.48 | )% | (95.32 | )% | (4418.75 | )% | (28.60 | )% | (0.22 | )% | (74.35 | )% | ||||||||||||||||||||||
|
GAAP net income (loss) /
average core equity (adjusted ROE) (2)
|
12.22 | % | 4.10 | % | (22.64 | )% | (103.09 | )% | (79.62 | )% | (28.42 | )% | (83.31 | )% | (610.31 | )% | (25.55 | )% | (0.20 | )% | (65.01 | )% | ||||||||||||||||||||||
|
THE REDWOOD
REVIEW
3RD QUARTER
2009
|
Table 5:
Profitability Ratios1
|
|
|
|
Table 6: Average Balance Sheet ($
in thousands)
|
|
|
Nine
|
Nine
|
|||||||||||||||||||||||||||||||||||
|
2009
|
2009
|
2009
|
2008
|
2008
|
2008
|
2008
|
Months
|
Months
|
||||||||||||||||||||||||||||
|
Q3
|
Q2
|
Q1
|
Q4
|
Q3
|
Q2
|
Q1
|
2009
|
2008
|
||||||||||||||||||||||||||||
|
Real estate
assets at Redwood
|
||||||||||||||||||||||||||||||||||||
|
Senior
Residential Securities
|
||||||||||||||||||||||||||||||||||||
|
Prime
|
$ | 264,773 | $ | 164,386 | $ | 77,651 | $ | 37,746 | $ | 27,880 | $ | 15,040 | $ | 663 | $ | 169,622 | $ | 14,528 | ||||||||||||||||||
|
Non-prime
|
270,353 | 168,383 | 87,464 | 63,050 | 63,818 | 50,056 | 7,061 | 176,070 | 40,312 | |||||||||||||||||||||||||||
|
Total
Senior Residential Securities
|
535,126 | 332,769 | 165,114 | 100,796 | 91,698 | 65,096 | 7,724 | 345,692 | 54,839 | |||||||||||||||||||||||||||
|
Residential
Re-REMIC Securities
|
69,980 | 26,419 | - | - | - | - | - | 32,389 | - | |||||||||||||||||||||||||||
|
Subordinate
Residential Securities
|
||||||||||||||||||||||||||||||||||||
|
Prime
|
58,637 | 43,020 | 47,070 | 88,943 | 147,513 | 177,996 | 145,756 | 49,618 | 157,088 | |||||||||||||||||||||||||||
|
Non-prime
|
2,218 | 2,767 | 3,450 | 4,105 | 4,450 | 17,184 | 54,464 | 2,807 | 25,366 | |||||||||||||||||||||||||||
|
Total
Subordinate Residential Securities
|
60,855 | 45,787 | 50,519 | 93,048 | 151,963 | 195,180 | 200,220 | 52,425 | 182,454 | |||||||||||||||||||||||||||
|
Commercial
subordinate securites
|
13,504 | 25,006 | 46,382 | 63,969 | 98,534 | 106,314 | 183,446 | 28,177 | 129,431 | |||||||||||||||||||||||||||
|
Commercial
loans
|
246 | 247 | 248 | 249 | 250 | 251 | 250 | 247 | 250 | |||||||||||||||||||||||||||
|
Residential
loans
|
2,315 | 2,435 | 2,600 | 2,960 | 3,671 | 3,759 | 4,507 | 2,449 | 3,979 | |||||||||||||||||||||||||||
|
CDO
|
2,255 | 2,595 | 3,429 | 3,856 | 8,628 | 15,492 | 21,297 | 2,755 | 15,139 | |||||||||||||||||||||||||||
|
Other real
estate investments
|
- | - | - | 50 | 75 | 2,328 | 5,836 | - | 2,746 | |||||||||||||||||||||||||||
|
Total
real estate assets at Redwood
|
684,281 | 435,258 | 268,293 | 264,927 | 354,819 | 388,420 | 423,280 | 464,134 | 388,840 | |||||||||||||||||||||||||||
|
Earning assets
at Acacia
|
298,615 | 321,206 | 404,596 | 575,709 | 830,311 | 982,169 | 1,439,913 | 341,084 | 1,084,131 | |||||||||||||||||||||||||||
| 3,864,796 | 4,305,159 | 4,568,212 | 5,966,898 | 6,170,944 | 6,483,475 | 6,895,529 | 4,243,479 | 6,516,649 | ||||||||||||||||||||||||||||
|
Earning assets
at the Fund
|
57,070 | 58,054 | 62,319 | 71,792 | 75,321 | 56,183 | 33,180 | 59,128 | 54,895 | |||||||||||||||||||||||||||
|
Cash and cash
equivalents
|
279,011 | 285,680 | 310,514 | 204,246 | 229,778 | 311,052 | 402,584 | 291,619 | 314,471 | |||||||||||||||||||||||||||
|
Earning
assets
|
5,183,773 | 5,405,357 | 5,613,934 | 7,083,573 | 7,661,173 | 8,221,299 | 9,194,486 | 5,399,446 | 8,358,986 | |||||||||||||||||||||||||||
|
Balance sheet
mark-to-market adjustments
|
(54,880 | ) | (80,035 | ) | (60,464 | ) | (76,981 | ) | (66,491 | ) | (84,038 | ) | (103,808 | ) | (65,106 | ) | (84,779 | ) | ||||||||||||||||||
|
Earning assets
- reported value
|
5,128,893 | 5,325,322 | 5,553,470 | 7,006,592 | 7,594,682 | 8,137,261 | 9,090,678 | 5,334,340 | 8,274,207 | |||||||||||||||||||||||||||
|
Other
assets
|
9,900 | (9,680 | ) | 22,148 | 33,714 | 53,420 | 66,200 | 132,786 | 7,411 | 84,135 | ||||||||||||||||||||||||||
|
Total
assets
|
$ | 5,138,793 | $ | 5,315,643 | $ | 5,575,619 | $ | 7,040,306 | $ | 7,648,102 | $ | 8,203,461 | $ | 9,223,464 | $ | 5,341,751 | $ | 8,358,342 | ||||||||||||||||||
|
Short-term
debt
|
$ | - | $ | - | $ | - | $ | 975 | $ | 7,825 | $ | 4,904 | $ | 21,477 | $ | - | $ | 11,402 | ||||||||||||||||||
|
Sequoia ABS
issued
|
3,765,292 | 4,211,937 | 4,460,951 | 5,804,702 | 6,040,634 | 6,349,661 | 6,745,556 | 4,143,512 | 6,378,617 | |||||||||||||||||||||||||||
|
Acacia ABS
issued
|
283,996 | 285,698 | 325,392 | 652,398 | 900,611 | 986,915 | 1,456,506 | 298,210 | 1,114,677 | |||||||||||||||||||||||||||
|
Other
liabilities
|
91,027 | 66,588 | 55,487 | 32,533 | (22,524 | ) | 72,870 | 126,790 | 71,164 | 59,045 | ||||||||||||||||||||||||||
|
Long-term
debt
|
139,190 | 147,430 | 147,193 | 146,944 | 146,705 | 146,480 | 146,242 | 144,575 | 146,476 | |||||||||||||||||||||||||||
|
Total
liabilities
|
4,279,505 | 4,711,653 | 4,989,023 | 6,637,552 | 7,073,251 | 7,560,830 | 8,496,572 | 4,657,461 | 7,710,218 | |||||||||||||||||||||||||||
|
Noncontrolling
interest
|
26,061 | 28,330 | 29,735 | 31,251 | 41,096 | 40,229 | 6,858 | 28,029 | 29,394 | |||||||||||||||||||||||||||
|
Core equity
(non-GAAP)
|
888,107 | 655,695 | 617,325 | 448,484 | 600,246 | 686,440 | 823,843 | 721,368 | 703,510 | |||||||||||||||||||||||||||
|
Balance sheet
mark-to-market adjustments
|
(54,880 | ) | (80,035 | ) | (60,464 | ) | (76,981 | ) | (66,491 | ) | (84,038 | ) | (103,808 | ) | (65,106 | ) | (84,779 | ) | ||||||||||||||||||
|
Total
equity
|
833,227 | 575,661 | 556,861 | 371,503 | 533,755 | 602,402 | 720,035 | 656,262 | 618,731 | |||||||||||||||||||||||||||
|
Total
liabilities and equity
|
$ | 5,138,793 | $ | 5,315,643 | $ | 5,575,619 | $ | 7,040,306 | $ | 7,648,102 | $ | 8,203,461 | $ | 9,223,464 | $ | 5,341,751 | $ | 8,358,342 | ||||||||||||||||||
|
THE REDWOOD
REVIEW
3RD QUARTER
2009
|
Table 6:
Average Balance Sheet
|
55
|
|
|
Table 7: Balances & Yields by
Securities Portfolio at Redwood ($ in
thousands)
|
56
|
|
2009
|
2009
|
2009
|
2008
|
2009
|
2009
|
2009
|
2008
|
|||||||||||||||||||||||||||
|
Q3
|
Q2
|
Q1
|
Q4
|
Q3
|
Q2
|
Q1
|
Q4
|
|||||||||||||||||||||||||||
|
Residential
Prime Senior
|
Residential
Non-Prime Subordinate
|
|||||||||||||||||||||||||||||||||
|
Current
face
|
$ | 431,289 | $ | 276,444 | $ | 160,009 | $ | 90,256 |
Current
face
|
$ | 158,613 | $ | 230,404 | $ | 327,766 | $ | 452,327 | |||||||||||||||||
|
Unamortized
discount
|
(124,295 | ) | (91,221 | ) | (64,884 | ) | (41,980 | ) |
Unamortized
discount
|
(16,556 | ) | (18,846 | ) | (19,512 | ) | (29,092 | ) | |||||||||||||||||
|
Credit
reserve
|
(11,069 | ) | (3,486 | ) | (621 | ) | - |
Credit
reserve
|
(140,046 | ) | (208,839 | ) | (305,422 | ) | (419,194 | ) | ||||||||||||||||||
|
Unrealized
gains (losses)
|
40,734 | 1,729 | (6,738 | ) | 2,689 |
Unrealized
(losses) gains
|
(806 | ) | 473 | 1,705 | 3,272 | |||||||||||||||||||||||
|
Fair
value
|
$ | 336,659 | $ | 183,466 | $ | 87,766 | $ | 50,965 |
Fair
value
|
$ | 1,205 | $ | 3,192 | $ | 4,537 | $ | 7,313 | |||||||||||||||||
|
Average
amortized cost
|
$ | 264,773 | $ | 164,386 | $ | 77,651 | $ | 37,746 |
Average
amortized cost
|
$ | 2,218 | $ | 2,767 | $ | 3,450 | $ | 4,105 | |||||||||||||||||
|
Interest
income
|
$ | 8,431 | $ | 5,475 | $ | 2,798 | $ | 992 |
Interest
income
|
$ | 1,271 | $ | 2,086 | $ | 6,315 | $ | 5,283 | |||||||||||||||||
|
Annualized
yield
|
12.74 | % | 13.32 | % | 14.41 | % | 10.51 | % |
Annualized
yield
|
229.25 | % | 301.61 | % | 732.26 | % | 514.79 | % | |||||||||||||||||
|
Residential
Non-Prime Senior
|
Commercial
Subordinate
|
|||||||||||||||||||||||||||||||||
|
Current
face
|
$ | 403,675 | $ | 396,135 | $ | 182,851 | $ | 108,871 |
Current
face
|
$ | 486,245 | $ | 506,746 | $ | 512,117 | $ | 514,169 | |||||||||||||||||
|
Unamortized
discount
|
(137,899 | ) | (141,761 | ) | (77,193 | ) | (50,687 | ) |
Unamortized
(discount) premium
|
(1,624 | ) | (120 | ) | 13,798 | 35,069 | |||||||||||||||||||
|
Credit
reserve
|
(10,098 | ) | (16,009 | ) | (4,159 | ) | (3,827 | ) |
Credit
reserve
|
(471,957 | ) | (492,459 | ) | (497,784 | ) | (497,047 | ) | |||||||||||||||||
|
Unrealized
gains (losses)
|
23,322 | (7,410 | ) | (27,116 | ) | (11,537 | ) |
Unrealized
gains (losses)
|
4,169 | 1,502 | (5,216 | ) | (9,701 | ) | ||||||||||||||||||||
|
Fair
value
|
$ | 279,000 | $ | 230,955 | $ | 74,383 | $ | 42,820 |
Fair
value
|
$ | 16,833 | $ | 15,669 | $ | 22,915 | $ | 42,490 | |||||||||||||||||
|
Average
amortized cost
|
$ | 270,353 | $ | 168,383 | $ | 87,464 | $ | 63,050 |
Average
amortized cost
|
$ | 13,504 | $ | 25,006 | $ | 46,382 | $ | 63,969 | |||||||||||||||||
|
Interest
income
|
$ | 10,513 | $ | 6,737 | $ | 3,311 | $ | 1,590 |
Interest
income
|
$ | 2,192 | $ | 1,599 | $ | 500 | $ | (1,000 | ) | ||||||||||||||||
|
Annualized
yield
|
15.55 | % | 16.00 | % | 15.14 | % | 10.09 | % |
Annualized
yield
|
64.93 | % | 25.58 | % | 4.31 | % | -6.25 | % | |||||||||||||||||
|
Residential
Re-REMIC
|
CDO
Subordinate
|
|||||||||||||||||||||||||||||||||
|
Current
face
|
$ | 318,703 | $ | 236,070 | $ | - | - |
Current
face
|
$ | 35,344 | $ | 35,311 | $ | 35,277 | $ | 38,405 | ||||||||||||||||||
|
Unamortized
discount
|
(144,351 | ) | (134,621 | ) | - | - |
Unamortized
discount
|
(19,632 | ) | (19,460 | ) | (19,086 | ) | (18,319 | ) | |||||||||||||||||||
|
Credit
reserve
|
(94,626 | ) | (45,874 | ) | - | - |
Credit
reserve
|
(13,600 | ) | (13,568 | ) | (13,534 | ) | (16,476 | ) | |||||||||||||||||||
|
Unrealized
gains (losses)
|
13,781 | (434 | ) | - | - |
Unrealized
gains
|
25 | 25 | - | - | ||||||||||||||||||||||||
|
Fair
value
|
$ | 93,507 | $ | 55,141 | $ | - | - |
Fair
value
|
$ | 2,137 | $ | 2,308 | $ | 2,657 | $ | 3,610 | ||||||||||||||||||
| - | - | |||||||||||||||||||||||||||||||||
|
Average
amortized cost
|
$ | 69,980 | $ | 26,419 | $ | - | - |
Average
amortized cost
|
$ | 2,255 | $ | 2,595 | $ | 25 | $ | 3,931 | ||||||||||||||||||
|
Interest
income
|
$ | 3,110 | $ | 573 | $ | - | - |
Interest
income
|
$ | 73 | $ | 163 | $ | 10 | $ | 376 | ||||||||||||||||||
|
Annualized
yield
|
17.77 | % | 8.67 | % | - | - |
Annualized
yield
|
12.97 | % | 25.09 | % | 153.66 | % | 38.21 | % | |||||||||||||||||||
|
Residential
Prime Subordinate
|
Note on
annualized yields: Cash flows from our investments can be very sporadic
and, to some
|
|||||||||||||||||||||||||||||||||
|
Current
face
|
$ | 379,276 | $ | 412,052 | $ | 419,631 | $ | 448,943 |
extent,
unexpected. The fair value of some assets is close to zero and any
interest income results
|
|||||||||||||||||||||||||
|
Unamortized
discount
|
(22,979 | ) | (28,545 | ) | (87,421 | ) | (90,582 | ) |
in unusally
high reported yields that are not sustainable.
|
|||||||||||||||||||||||||
|
Credit
reserve
|
(306,728 | ) | (319,653 | ) | (291,592 | ) | (308,447 | ) | ||||||||||||||||||||||||||
|
Unrealized
losses
|
(27,643 | ) | (37,112 | ) | (11,606 | ) | (6,127 | ) | ||||||||||||||||||||||||||
|
Fair
value
|
$ | 21,926 | $ | 26,742 | $ | 29,012 | $ | 43,787 | ||||||||||||||||||||||||||
|
Average
amortized cost
|
$ | 58,637 | $ | 43,020 | $ | 47,070 | $ | 88,943 | ||||||||||||||||||||||||||
|
Interest
income
|
$ | 4,299 | $ | 3,907 | $ | 8,220 | $ | 8,185 | ||||||||||||||||||||||||||
|
Annualized
yield
|
29.33 | % | 36.32 | % | 69.85 | % | 36.81 | % | ||||||||||||||||||||||||||
|
THE REDWOOD
REVIEW
3RD QUARTER
2009
|
Table 7:
Balances & Yields by Securities
Portfolio at
Redwood
|
|
|
|
Table 8: Securities Portfolio
Activity at Redwood ($ in thousands)
|
|
|
2009
|
2009
|
2009
|
2008
|
2009
|
2009
|
2009
|
2008
|
|||||||||||||||||||||||||||
|
Q3
|
Q2
|
Q1
|
Q4
|
Q3
|
Q2
|
Q1
|
Q4
|
|||||||||||||||||||||||||||
|
Residential
Prime Senior
|
Residential
Real Estate Loans
|
|||||||||||||||||||||||||||||||||
|
Beginning fair
value
|
$ | 183,466 | $ | 87,766 | $ | 50,965 | $ | 21,395 |
Beginning fair
value
|
$ | 2,336 | $ | 2,577 | $ | 2,624 | $ | 3,150 | |||||||||||||||||
|
Acquisitions
|
134,738 | 120,982 | 49,107 | 35,866 |
Principal
payments
|
(28 | ) | (185 | ) | (27 | ) | (40 | ) | |||||||||||||||||||||
|
Sales
|
(5,091 | ) | (35,713 | ) | - | - |
Premium
amortization
|
- | - | - | - | |||||||||||||||||||||||
|
Effect of
principal payments
|
(13,121 | ) | (6,499 | ) | (2,337 | ) | (347 | ) |
Transfers to
REO
|
- | - | - | (14 | ) | ||||||||||||||||||||
|
Change in fair
value, net
|
36,667 | 16,930 | (9,969 | ) | (5,949 | ) |
Changes in
fair value, net
|
(9 | ) | (56 | ) | (20 | ) | (472 | ) | |||||||||||||||||||
|
Ending
fair value
|
$ | 336,659 | $ | 183,466 | $ | 87,766 | $ | 50,965 |
Ending
fair value
|
$ | 2,299 | $ | 2,336 | $ | 2,577 | $ | 2,624 | |||||||||||||||||
|
Residential
Non-Prime Senior
|
Commercial
Subordinate
|
|||||||||||||||||||||||||||||||||
|
Beginning fair
value
|
$ | 230,955 | $ | 74,383 | $ | 42,820 | $ | 48,246 |
Beginning fair
value
|
$ | 15,669 | $ | 22,915 | $ | 42,490 | $ | 63,686 | |||||||||||||||||
|
Acquisitions
|
84,837 | 162,745 | 48,444 | 10,419 |
Acquisitions
|
- | - | - | - | |||||||||||||||||||||||||
|
Sales
|
(56,299 | ) | (14,613 | ) | (373 | ) | (867 | ) |
Sales
|
- | - | - | - | |||||||||||||||||||||
|
Effect of
principal payments
|
(11,083 | ) | (5,128 | ) | (1,573 | ) | (549 | ) |
Effect of
principal payments
|
- | - | - | - | |||||||||||||||||||||
|
Change in fair
value, net
|
30,590 | 13,568 | (14,935 | ) | (14,429 | ) |
Change in fair
value, net
|
1,164 | (7,246 | ) | (19,575 | ) | (21,196 | ) | ||||||||||||||||||||
|
Ending
fair value
|
$ | 279,000 | $ | 230,955 | $ | 74,383 | $ | 42,820 |
Ending
fair value
|
$ | 16,833 | $ | 15,669 | $ | 22,915 | $ | 42,490 | |||||||||||||||||
|
Re-REMIC
|
Commercial
Real Estate Loans
|
|||||||||||||||||||||||||||||||||
|
Beginning fair
value
|
$ | 55,141 | $ | - | $ | - | $ | - |
Beginning fair
value
|
$ | 247 | $ | 248 | $ | 249 | $ | 250 | |||||||||||||||||
|
Acquisitions
|
25,073 | 55,562 | - | - |
Principal
payments
|
(2 | ) | (2 | ) | (2 | ) | (2 | ) | |||||||||||||||||||||
|
Sales
|
- | - | - | - |
Discount
amortization
|
1 | 1 | 1 | 1 | |||||||||||||||||||||||||
|
Effect of
principal payments
|
- | - | - | - |
Credit
provision
|
- | - | - | - | |||||||||||||||||||||||||
|
Change in fair
value, net
|
13,293 | (421 | ) | - | - |
Changes in
fair value, net
|
- | - | - | - | ||||||||||||||||||||||||
|
Ending
fair value
|
$ | 93,507 | $ | 55,141 | $ | - | $ | - |
Ending
fair value
|
$ | 246 | $ | 247 | $ | 248 | $ | 249 | |||||||||||||||||
|
Residential
Prime Subordinate
|
CDO
Subordinate
|
|||||||||||||||||||||||||||||||||
| $ | 26,742 | $ | 29,012 | $ | 43,787 | $ | 86,272 |
Beginning fair
value
|
$ | 2,308 | $ | 2,657 | $ | 3,610 | $ | 4,065 | ||||||||||||||||||
|
Acquisitions
|
1,390 | 1,829 | - | - |
Acquisitions
|
- | - | - | - | |||||||||||||||||||||||||
|
Sales
|
(1,409 | ) | - | - | - |
Sales
|
- | - | - | - | ||||||||||||||||||||||||
|
Effect of
principal payments
|
(880 | ) | (1,050 | ) | (946 | ) | (1,311 | ) |
Effect of
principal payments
|
- | - | (37 | ) | (69 | ) | |||||||||||||||||||
|
Change in fair
value, net
|
(3,917 | ) | (3,049 | ) | (13,829 | ) | (41,174 | ) |
Change in fair
value, net
|
(171 | ) | (349 | ) | (916 | ) | (386 | ) | |||||||||||||||||
|
Ending
fair value
|
$ | 21,926 | $ | 26,742 | $ | 29,012 | $ | 43,787 |
Ending
fair value
|
$ | 2,137 | $ | 2,308 | $ | 2,657 | $ | 3,610 | |||||||||||||||||
|
Residential
Non-Prime Subordinate
|
||||||||||||||||||||||||||||||||||
|
Beginning fair
value
|
$ | 3,192 | $ | 4,537 | $ | 7,313 | $ | 5,073 | ||||||||||||||||||||||||||
|
Acquisitions
|
- | - | - | 3,630 | ||||||||||||||||||||||||||||||
|
Sales
|
- | - | - | - | ||||||||||||||||||||||||||||||
|
Effect of
principal payments
|
(38 | ) | (67 | ) | (98 | ) | (148 | ) | ||||||||||||||||||||||||||
|
Change in fair
value, net
|
(1,949 | ) | (1,278 | ) | (2,678 | ) | (1,242 | ) | ||||||||||||||||||||||||||
|
Ending
fair value
|
$ | 1,205 | $ | 3,192 | $ | 4,537 | $ | 7,313 | ||||||||||||||||||||||||||
|
THE REDWOOD
REVIEW
3RD QUARTER
2009
|
Table 8:
Securities Portfolio Activity at Redwood
|
57
|
|
|
Table
9A: Residential Prime Securities at Redwood and Underlying Loan
Characteristics
($
in
thousands)
|
58
|
|
2009
|
2009
|
2009
|
2008
|
2009
|
2009
|
2009
|
2008
|
||||||||||||||||||||||||||||
|
Q3
|
Q2
|
Q1
|
Q4
|
Q3
|
Q2
|
Q1
|
Q4
|
||||||||||||||||||||||||||||
|
Residential
Senior Prime
|
|||||||||||||||||||||||||||||||||||
|
Principal
value
|
$ | 431,289 | $ | 276,444 | $ | 160,009 | $ | 90,256 |
Southern
CA
|
27 | % | 24 | % | 24 | % | 24 | % | ||||||||||||||||||
|
Unamortized
discount
|
(124,295 | ) | (91,221 | ) | (64,884 | ) | (41,980 | ) |
Northern
CA
|
20 | % | 23 | % | 23 | % | 22 | % | ||||||||||||||||||
|
Discount
designated as credit reserve
|
(11,069 | ) | (3,486 | ) | (621 | ) | - |
Florida
|
6 | % | 5 | % | 5 | % | 5 | % | |||||||||||||||||||
|
Unrealized
gain (loss)
|
40,734 | 1,729 | (6,738 | ) | 2,689 |
New
York
|
7 | % | 7 | % | 7 | % | 7 | % | |||||||||||||||||||||
|
Fair
value
|
$ | 336,659 | $ | 183,466 | $ | 87,766 | $ | 50,965 |
Georgia
|
2 | % | 2 | % | 2 | % | 2 | % | ||||||||||||||||||
|
Fair value /
principal value
|
78 | % | 66 | % | 55 | % | 56 | % |
New
Jersey
|
3 | % | 3 | % | 3 | % | 3 | % | ||||||||||||||||||
|
Texas
|
2 | % | 2 | % | 2 | % | 3 | % | |||||||||||||||||||||||||||
|
Security
Type
|
Arizona
|
2 | % | 2 | % | 2 | % | 2 | % | ||||||||||||||||||||||||||
|
ARM
|
$ | - | $ | - | $ | - | $ | - |
Illinois
|
3 | % | 3 | % | 3 | % | 3 | % | ||||||||||||||||||
|
Hybrid
|
306,402 | 175,940 | 86,282 | 48,805 |
Colorado
|
2 | % | 2 | % | 2 | % | 2 | % | ||||||||||||||||||||||
|
Fixed
|
30,257 | 7,526 | 1,484 | 2,160 |
Virginia
|
4 | % | 4 | % | 4 | % | 4 | % | ||||||||||||||||||||||
|
Total fair
value
|
$ | 336,659 | $ | 183,466 | $ | 87,766 | $ | 50,965 |
Other
states
|
22 | % | 23 | % | 23 | % | 23 | % | ||||||||||||||||||
|
|
|
||||||||||||||||||||||||||||||||||
|
Residential
Senior Prime
|
Wtd Avg
Original LTV
|
68 | % | 68 | % | 68 | % | 68 | % | ||||||||||||||||||||||||||
|
Coupon
income
|
$ | 4,743 | $ | 3,066 | $ | 1,733 | $ | 749 |
Original LTV:
0 - 50
|
13 | % | 13 | % | 13 | % | 13 | % | ||||||||||||||||||
|
Discount
amortization
|
3,688 | 2,410 | 1,128 | 243 |
Original LTV:
50.01 - 60
|
12 | % | 12 | % | 12 | % | 12 | % | ||||||||||||||||||||||
|
Total interest
income
|
$ | 8,431 | $ | 5,476 | $ | 2,861 | $ | 992 |
Original LTV:
60.01 - 70
|
22 | % | 22 | % | 22 | % | 22 | % | ||||||||||||||||||
|
|
Original LTV:
70.01 - 80
|
50 | % | 49 | % | 49 | % | 49 | % | ||||||||||||||||||||||||||
|
Average
amortized cost
|
$ | 264,773 | $ | 164,386 | $ | 77,651 | $ | 37,746 |
Original LTV:
80.01 - 90
|
2 | % | 2 | % | 2 | % | 3 | % | ||||||||||||||||||
|
|
Original LTV:
90.01 - 100
|
1 | % | 1 | % | 1 | % | 1 | % | ||||||||||||||||||||||||||
|
Coupon income
%
|
7.17 | % | 7.46 | % | 8.93 | % | 7.94 | % |
Unknown
|
0 | % | 1 | % | 1 | % | 0 | % | ||||||||||||||||||
|
Discount
amortization %
|
5.57 | % | 5.86 | % | 5.81 | % | 2.58 | % |
|
||||||||||||||||||||||||||
|
Annualized
interest income / avg. amt. cost
|
12.74 | % | 13.32 | % | 14.74 | % | 10.51 | % |
Wtd Avg
FICO
|
740 | 741 | 741 | 741 | ||||||||||||||||||||||
|
|
FICO: <=
600
|
0 | % | 0 | % | 0 | % | 0 | % | ||||||||||||||||||||||||||
|
|
FICO: 601 -
620
|
0 | % | 0 | % | 0 | % | 0 | % | ||||||||||||||||||||||||||
|
Principal
value
|
$ | 379,276 | $ | 412,052 | $ | 419,631 | $ | 448,943 |
FICO: 621 -
640
|
1 | % | 1 | % | 1 | % | 1 | % | ||||||||||||||||||
|
Unamortized
discount
|
(22,979 | ) | (28,545 | ) | (87,421 | ) | (90,582 | ) |
FICO: 641 -
660
|
2 | % | 2 | % | 2 | % | 2 | % | ||||||||||||||||||
|
Discount
designated as credit reserve
|
(306,728 | ) | (319,653 | ) | (291,592 | ) | (308,447 | ) |
FICO: 661 -
680
|
5 | % | 5 | % | 5 | % | 5 | % | ||||||||||||||||||
|
Unrealized
loss
|
(27,643 | ) | (37,112 | ) | (11,606 | ) | (6,127 | ) |
FICO: 681 -
700
|
9 | % | 9 | % | 9 | % | 8 | % | ||||||||||||||||||
|
Fair
value
|
$ | 21,926 | $ | 26,742 | $ | 29,012 | $ | 43,787 |
FICO: 701 -
720
|
14 | % | 13 | % | 13 | % | 13 | % | ||||||||||||||||||
|
Fair value /
principal value
|
6 | % | 6 | % | 7 | % | 10 | % |
FICO: 721 -
740
|
14 | % | 14 | % | 14 | % | 14 | % | ||||||||||||||||||
|
FICO: 741 -
760
|
16 | % | 16 | % | 16 | % | 16 | % | |||||||||||||||||||||||||||
|
Security
Type
|
FICO: 761 -
780
|
19 | % | 19 | % | 19 | % | 19 | % | ||||||||||||||||||||||||||
|
ARM
|
$ | 1,301 | $ | 1,413 | $ | 1,736 | $ | 2,580 |
FICO: 781 -
800
|
14 | % | 15 | % | 15 | % | 15 | % | ||||||||||||||||||
|
Hybrid
|
14,780 | 18,544 | 20,325 | 32,482 |
FICO: >=
801
|
4 | % | 4 | % | 4 | % | 4 | % | ||||||||||||||||||||||
|
Fixed
|
5,845 | 6,785 | 6,951 | 8,725 |
Unknown
|
2 | % | 2 | % | 2 | % | 3 | % | ||||||||||||||||||||||
|
Total fair
value
|
$ | 21,926 | $ | 26,742 | $ | 29,012 | $ | 43,787 |
|
||||||||||||||||||||||||||
|
Conforming % (1)
|
59 | % | 59 | % | 60 | % | 61 | % | |||||||||||||||||||||||||||
|
Residential
Subordinate Prime
|
> $1 MM
%
|
8 | % | 8 | % | 8 | % | 8 | % | ||||||||||||||||||||||||||
|
Coupon
income
|
$ | 4,698 | $ | 5,155 | $ | 5,615 | $ | 6,219 |
|
||||||||||||||||||||||||||
|
(Premium)
discount amortization
|
(399 | ) | (1,248 | ) | 2,887 | 1,966 |
2nd Home
%
|
7 | % | 7 | % | 7 | % | 6 | % | ||||||||||||||||||||
|
Total interest
income
|
$ | 4,299 | $ | 3,907 | $ | 8,502 | $ | 8,185 |
Investment
Home %
|
2 | % | 2 | % | 1 | % | 1 | % | ||||||||||||||||||
|
|
|
||||||||||||||||||||||||||||||||||
|
Average
amortized cost
|
$ | 58,637 | $ | 43,020 | $ | 47,070 | $ | 88,943 |
|
||||||||||||||||||||||||||
|
|
Purchase
|
44 | % | 44 | % | 44 | % | 44 | % | ||||||||||||||||||||||||||
|
Coupon income
%
|
32.05 | % | 47.93 | % | 47.72 | % | 27.97 | % |
Cash Out
Refi
|
22 | % | 21 | % | 21 | % | 21 | % | ||||||||||||||||||
|
(Premium)
discount amortization %
|
-2.72 | % | -11.61 | % | 24.53 | % | 8.84 | % |
Rate-Term
Refi
|
33 | % | 34 | % | 34 | % | 35 | % | ||||||||||||||||||
|
Annualized
interest income / avg. amt. cost
|
29.33 | % | 36.32 | % | 72.25 | % | 36.81 | % |
Construction
|
0 | % | 0 | % | 0 | % | 0 | % | ||||||||||||||||||
|
Other
|
1 | % | 1 | % | 1 | % | 0 | % | |||||||||||||||||||||||||||
|
Underlying
Prime Loan Characteristics
|
|||||||||||||||||||||||||||||||||||
|
Full
Doc
|
55 | % | 56 | % | 55 | % | 55 | % | |||||||||||||||||||||||||||
|
Number of
loans
|
184,849 | 201,789 | 216,362 | 237,131 |
No
Doc
|
5 | % | 4 | % | 4 | % | 4 | % | ||||||||||||||||||||||
|
Total loan
face
|
$ | 84,519,707 | $ | 92,121,182 | $ | 98,573,943 | $ | 107,131,216 |
Other Doc
(Lim, Red, Stated, etc)
|
37 | % | 37 | % | 38 | % | 38 | % | ||||||||||||||||||
|
Average loan
size
|
$ | 457 | $ | 457 | $ | 456 | $ | 452 |
Unknown/Not
Categorized
|
3 | % | 3 | % | 3 | % | 3 | % | ||||||||||||||||||
|
Year 2008
origination
|
0 | % | 0 | % | 0 | % | 0 | % |
2-4
Family
|
1 | % | 1 | % | 1 | % | 1 | % | ||||||||||||||||||
|
Year 2007
origination
|
9 | % | 9 | % | 9 | % | 9 | % |
Condo
|
10 | % | 10 | % | 10 | % | 10 | % | ||||||||||||||||||
|
Year 2006
origination
|
12 | % | 12 | % | 14 | % | 14 | % |
Single
Family
|
88 | % | 88 | % | 88 | % | 87 | % | ||||||||||||||||||
|
Year 2005
origination
|
20 | % | 19 | % | 17 | % | 17 | % |
Other
|
1 | % | 1 | % | 1 | % | 2 | % | ||||||||||||||||||
|
Year 2004
origination and earlier
|
59 | % | 60 | % | 60 | % | 60 | % | |||||||||||||||||||||||||||
|
(1) The definition of a
conforming loan has significantly changed over time. For all periods
shown in this table, the conforming loan definition available in Febuary
2009 was used (which had a maximum loan balance of $729,750).
(2) Only the loan groups
providing direct cash flows to our securities are
included.
|
|||||||||||||||||||||||||||||||||||
|
THE REDWOOD
REVIEW
3RD QUARTER
2009
|
Table 9A:
Residential Prime Securities at Redwood and Underlying Loan
Characteristics
|
|
|
|
Table
9B: Residential Non-Prime Securities at Redwood and Underlying Loan
Characteristics
($
in thousands)
|
|
|
2009
|
2009
|
2009
|
2008
|
2009
|
2009
|
2009
|
2008
|
|||||||||||||||||||||||||||
|
Q3
|
Q2
|
Q1
|
Q4
|
Q3
|
Q2
|
Q1
|
Q4
|
|||||||||||||||||||||||||||
|
Residential
Senior Non-Prime
|
||||||||||||||||||||||||||||||||||
|
Principal
value
|
$ | 403,675 | $ | 396,135 | $ | 182,851 | $ | 108,871 |
Southern
CA
|
26 | % | 25 | % | 27 | % | 30 | % | |||||||||||||||||
|
Unamortized
discount
|
(137,899 | ) | (141,761 | ) | (77,193 | ) | (50,687 | ) |
Northern
CA
|
16 | % | 18 | % | 19 | % | 22 | % | |||||||||||||||||
|
Discount
designated as credit reserve
|
(10,098 | ) | (16,009 | ) | (4,159 | ) | (3,827 | ) |
Florida
|
9 | % | 9 | % | 10 | % | 10 | % | |||||||||||||||||
|
Unrealized
gain (loss)
|
23,322 | (7,410 | ) | (27,116 | ) | (11,537 | ) |
New
York
|
5 | % | 5 | % | 5 | % | 4 | % | ||||||||||||||||||
|
Fair
value
|
$ | 279,000 | $ | 230,955 | $ | 74,383 | $ | 42,820 |
Georgia
|
2 | % | 2 | % | 1 | % | 1 | % | |||||||||||||||||
|
Fair value /
principal value
|
69 | % | 58 | % | 41 | % | 39 | % |
New
Jersey
|
4 | % | 4 | % | 4 | % | 3 | % | |||||||||||||||||
|
Texas
|
2 | % | 2 | % | 1 | % | 1 | % | ||||||||||||||||||||||||||
|
Security
Type
|
Arizona
|
3 | % | 3 | % | 3 | % | 3 | % | |||||||||||||||||||||||||
|
Option
ARM
|
$ | 25,747 | $ | 18,586 | $ | 17,796 | $ | 23,820 |
Illinois
|
2 | % | 2 | % | 3 | % | 2 | % | |||||||||||||||||
|
Hybrid
|
154,998 | 158,886 | 50,616 | 13,519 |
Colorado
|
2 | % | 2 | % | 2 | % | 2 | % | |||||||||||||||||||||
|
Fixed
|
98,255 | 53,483 | 5,971 | 5,481 |
Virginia
|
3 | % | 3 | % | 3 | % | 3 | % | |||||||||||||||||||||
|
Total fair
value
|
$ | 279,000 | $ | 230,955 | $ | 74,383 | $ | 42,820 |
Other
states
|
26 | % | 25 | % | 22 | % | 19 | % | |||||||||||||||||
|
|
||||||||||||||||||||||||||||||||||
|
Residential
Senior Non-Prime
|
Wtd Avg
Original LTV
|
74 | % | 74 | % | 74 | % | 74 | % | |||||||||||||||||||||||||
|
Coupon
income
|
$ | 4,156 | $ | 2,871 | $ | 1,251 | $ | 879 |
Original LTV:
0 - 50
|
5 | % | 5 | % | 5 | % | 5 | % | |||||||||||||||||
|
Discount
amortization
|
6,357 | 3,865 | 2,194 | 711 |
Original LTV:
50.01 - 60
|
7 | % | 7 | % | 7 | % | 7 | % | |||||||||||||||||||||
|
Total interest
income
|
$ | 10,513 | $ | 6,736 | $ | 3,445 | $ | 1,590 |
Original LTV:
60.01 - 70
|
17 | % | 17 | % | 18 | % | 19 | % | |||||||||||||||||
|
Original LTV:
70.01 - 80
|
59 | % | 59 | % | 60 | % | 59 | % | ||||||||||||||||||||||||||
|
Average
amortized cost
|
$ | 270,353 | $ | 168,383 | $ | 87,464 | $ | 63,050 |
Original LTV:
80.01 - 90
|
8 | % | 8 | % | 7 | % | 7 | % | |||||||||||||||||
|
Original LTV:
90.01 - 100
|
4 | % | 4 | % | 3 | % | 3 | % | ||||||||||||||||||||||||||
|
Coupon income
%
|
6.15 | % | 6.82 | % | 5.72 | % | 5.58 | % |
Unknown
|
0 | % | 0 | % | 0 | % | 0 | % | |||||||||||||||||
|
Discount
amortization %
|
9.41 | % | 9.18 | % | 10.03 | % | 4.51 | % | ||||||||||||||||||||||||||
|
Annualized
interest income / avg. amt. cost
|
15.55 | % | 16.00 | % | 15.75 | % | 10.09 | % |
Wtd Avg
FICO
|
707 | 705 | 705 | 706 | |||||||||||||||||||||
|
FICO: <=
600
|
2 | % | 2 | % | 2 | % | 3 | % | ||||||||||||||||||||||||||
|
FICO: 601 -
620
|
2 | % | 3 | % | 3 | % | 3 | % | ||||||||||||||||||||||||||
|
Principal
value
|
$ | 158,613 | $ | 230,404 | $ | 327,766 | $ | 452,327 |
FICO: 621 -
640
|
5 | % | 5 | % | 5 | % | 5 | % | |||||||||||||||||
|
Unamortized
discount
|
(16,556 | ) | (18,846 | ) | (19,512 | ) | (29,092 | ) |
FICO: 641 -
660
|
8 | % | 8 | % | 8 | % | 7 | % | |||||||||||||||||
|
Discount
designated as credit reserve
|
(140,046 | ) | (208,839 | ) | (305,422 | ) | (419,194 | ) |
FICO: 661 -
680
|
13 | % | 12 | % | 12 | % | 12 | % | |||||||||||||||||
|
Unrealized
(loss) gain
|
(806 | ) | 473 | 1,705 | 3,272 |
FICO: 681 -
700
|
15 | % | 16 | % | 16 | % | 16 | % | ||||||||||||||||||||
|
Fair
value
|
$ | 1,205 | $ | 3,192 | $ | 4,537 | $ | 7,313 |
FICO: 701 -
720
|
14 | % | 14 | % | 14 | % | 14 | % | |||||||||||||||||
|
Fair value /
principal value
|
1 | % | 1 | % | 1 | % | 2 | % |
FICO: 721 -
740
|
12 | % | 12 | % | 12 | % | 13 | % | |||||||||||||||||
|
|
FICO: 741 -
760
|
11 | % | 11 | % | 11 | % | 11 | % | |||||||||||||||||||||||||
|
Security
Type
|
FICO: 761 -
780
|
9 | % | 9 | % | 9 | % | 9 | % | |||||||||||||||||||||||||
|
Option
ARM
|
$ | 907 | $ | 2,639 | $ | 3,618 | $ | 5,082 |
FICO: 781 -
800
|
6 | % | 5 | % | 5 | % | 5 | % | |||||||||||||||||
|
Hybrid
|
293 | 400 | 571 | 1,307 |
FICO: >=
801
|
2 | % | 2 | % | 2 | % | 2 | % | |||||||||||||||||||||
|
Fixed
|
5 | 153 | 348 | 924 |
Unknown
|
1 | % | 1 | % | 1 | % | 0 | % | |||||||||||||||||||||
|
Total fair
value
|
$ | 1,205 | $ | 3,192 | $ | 4,537 | $ | 7,313 |
|
|||||||||||||||||||||||||
|
|
Conforming % (1)
|
74 | % | 71 | % | 62 | % | 60 | % | |||||||||||||||||||||||||
|
Residential
Subordinate Non-Prime
|
> $1 MM
%
|
9 | % | 10 | % | 17 | % | 19 | % | |||||||||||||||||||||||||
|
Coupon
income
|
$ | 1,128 | $ | 2,318 | $ | 5,779 | $ | 4,503 |
|
|||||||||||||||||||||||||
|
(Premium)
discount amortization
|
143 | (703 | ) | 553 | 780 |
2nd Home
%
|
5 | % | 5 | % | 7 | % | 7 | % | ||||||||||||||||||||
|
Total interest
income
|
$ | 1,271 | $ | 1,615 | $ | 6,332 | $ | 5,283 |
Investment
Home %
|
8 | % | 8 | % | 7 | % | 7 | % | |||||||||||||||||
|
|
||||||||||||||||||||||||||||||||||
|
Average
amortized cost
|
$ | 2,218 | $ | 2,767 | $ | 3,450 | $ | 4,105 | ||||||||||||||||||||||||||
|
|
Purchase
|
40 | % | 41 | % | 37 | % | 35 | % | |||||||||||||||||||||||||
|
Coupon income
%
|
203.50 | % | 335.10 | % | 670.16 | % | 438.78 | % |
Cash Out
Refi
|
42 | % | 42 | % | 44 | % | 46 | % | |||||||||||||||||
|
Discount
(premium) amortization %
|
25.74 | % | -101.60 | % | 64.12 | % | 76.00 | % |
Rate-Term
Refi
|
17 | % | 16 | % | 19 | % | 19 | % | |||||||||||||||||
|
Annualized
interest income / avg. amt. cost
|
229.25 | % | 233.50 | % | 734.28 | % | 514.79 | % |
Construction
|
0 | % | 0 | % | 0 | % | 0 | % | |||||||||||||||||
|
Other
|
1 | % | 1 | % | 0 | % | 0 | % | ||||||||||||||||||||||||||
|
Underlying
Non-Prime Loan Characteristics
|
|
|||||||||||||||||||||||||||||||||
|
Full
Doc
|
34 | % | 32 | % | 27 | % | 24 | % | ||||||||||||||||||||||||||
|
Number of
loans
|
73,970 | 71,041 | 64,541 | 88,331 |
No
Doc
|
2 | % | 2 | % | 6 | % | 4 | % | |||||||||||||||||||||
|
Total loan
face
|
$ | 21,588,255 | $ | 22,498,418 | $ | 24,833,600 | $ | 36,262,301 |
Other Doc
(Lim, Red, Stated, etc)
|
62 | % | 64 | % | 66 | % | 71 | % | |||||||||||||||||
|
Average loan
size
|
$ | 292 | $ | 317 | $ | 385 | $ | 411 |
Unknown/Not
Categorized
|
2 | % | 2 | % | 1 | % | 1 | % | |||||||||||||||||
|
|
||||||||||||||||||||||||||||||||||
|
Year 2008
origination
|
0 | % | 0 | % | 0 | % | 0 | % |
2-4
Family
|
5 | % | 5 | % | 4 | % | 4 | % | |||||||||||||||||
|
Year 2007
origination
|
22 | % | 23 | % | 36 | % | 33 | % |
Condo
|
9 | % | 9 | % | 10 | % | 10 | % | |||||||||||||||||
|
Year 2006
origination
|
8 | % | 8 | % | 12 | % | 22 | % |
Single
Family
|
86 | % | 86 | % | 85 | % | 86 | % | |||||||||||||||||
|
Year 2005
origination
|
36 | % | 34 | % | 27 | % | 28 | % |
Other
|
0 | % | 0 | % | 1 | % | 0 | % | |||||||||||||||||
|
Year 2004
origination and earlier
|
34 | % | 35 | % | 25 | % | 17 | % | ||||||||||||||||||||||||||
|
(1) The definition of a conforming loan has significantly changed over time. For all periods shown in this table, the conforming loan definition available in Febuary 2009 was used (which had a maximum loan balance of $729,750). (2) Only the
loan groups providing direct cash flows to our securities are
included.
|
||||||||||||||||||||||||||||||||||
|
THE REDWOOD
REVIEW
3RD QUARTER
2009
|
Table 9B:
Residential Non-Prime Securities at Redwood and Underlying Loan
Characteristics
|
59
|
|
|
Table
10: Residential Real Estate Loan Characteristics
($
in
thousands)
|
60
|
|
2009
|
2009
|
2009
|
2008
|
2008
|
2008
|
2008
|
2007
|
2007
|
2007
|
|||||||||||||||||||||||||||||||
|
Q3
|
Q2
|
Q1
|
Q4
|
Q3
|
Q2
|
Q1
|
Q4
|
Q3
|
Q2
|
|||||||||||||||||||||||||||||||
|
Residential
loans
|
$ | 3,827,086 | $ | 3,952,147 | $ | 4,523,877 | $ | 4,617,269 | $ | 6,070,083 | $ | 6,322,868 | $ | 6,702,726 | $ | 7,106,018 | $ | 7,546,529 | $ | 8,256,759 | ||||||||||||||||||||
|
Number of
loans
|
13,232 | 13,648 | 14,880 | 15,203 | 18,037 | 18,706 | 19,801 | 21,000 | 21,981 | 24,452 | ||||||||||||||||||||||||||||||
|
Average loan
size
|
$ | 289 | $ | 290 | $ | 304 | $ | 304 | $ | 337 | $ | 338 | $ | 339 | $ | 338 | $ | 343 | $ | 338 | ||||||||||||||||||||
|
Adjustable
%
|
95 | % | 95 | % | 85 | % | 85 | % | 67 | % | 67 | % | 67 | % | 68 | % | 69 | % | 71 | % | ||||||||||||||||||||
|
Hybrid
%
|
5 | % | 5 | % | 15 | % | 15 | % | 33 | % | 33 | % | 33 | % | 32 | % | 31 | % | 29 | % | ||||||||||||||||||||
|
Fixed
%
|
0 | % | 0 | % | 0 | % | 0 | % | 0 | % | 0 | % | 0 | % | 0 | % | 0 | % | 0 | % | ||||||||||||||||||||
|
Amortizing
%
|
3 | % | 3 | % | 4 | % | 4 | % | 5 | % | 5 | % | 5 | % | 5 | % | 5 | % | 5 | % | ||||||||||||||||||||
|
Interest-only
%
|
97 | % | 97 | % | 96 | % | 96 | % | 95 | % | 95 | % | 95 | % | 95 | % | 95 | % | 95 | % | ||||||||||||||||||||
|
Negatively
amortizing %
|
0 | % | 0 | % | 0 | % | 0 | % | 0 | % | 0 | % | 0 | % | 0 | % | 0 | % | 0 | % | ||||||||||||||||||||
|
Southern
California
|
11 | % | 11 | % | 12 | % | 12 | % | 15 | % | 15 | % | 15 | % | 14 | % | 15 | % | 14 | % | ||||||||||||||||||||
|
Northern
California
|
8 | % | 8 | % | 9 | % | 9 | % | 11 | % | 11 | % | 11 | % | 10 | % | 10 | % | 11 | % | ||||||||||||||||||||
|
Florida
|
14 | % | 14 | % | 13 | % | 13 | % | 13 | % | 13 | % | 13 | % | 13 | % | 12 | % | 12 | % | ||||||||||||||||||||
|
New
York
|
7 | % | 7 | % | 6 | % | 6 | % | 6 | % | 6 | % | 6 | % | 6 | % | 6 | % | 6 | % | ||||||||||||||||||||
|
Georgia
|
5 | % | 5 | % | 5 | % | 5 | % | 4 | % | 4 | % | 4 | % | 4 | % | 4 | % | 4 | % | ||||||||||||||||||||
|
New
Jersey
|
4 | % | 4 | % | 4 | % | 4 | % | 4 | % | 4 | % | 4 | % | 4 | % | 4 | % | 4 | % | ||||||||||||||||||||
|
Texas
|
5 | % | 5 | % | 5 | % | 5 | % | 4 | % | 4 | % | 4 | % | 5 | % | 5 | % | 5 | % | ||||||||||||||||||||
|
Arizona
|
3 | % | 3 | % | 3 | % | 3 | % | 3 | % | 3 | % | 3 | % | 4 | % | 4 | % | 4 | % | ||||||||||||||||||||
|
Illinois
|
2 | % | 2 | % | 3 | % | 3 | % | 3 | % | 3 | % | 3 | % | 3 | % | 3 | % | 3 | % | ||||||||||||||||||||
|
Colorado
|
4 | % | 4 | % | 4 | % | 4 | % | 3 | % | 3 | % | 3 | % | 3 | % | 3 | % | 3 | % | ||||||||||||||||||||
|
Virginia
|
3 | % | 3 | % | 3 | % | 3 | % | 3 | % | 3 | % | 3 | % | 3 | % | 3 | % | 3 | % | ||||||||||||||||||||
|
Other states
(none greater than 3%)
|
34 | % | 34 | % | 33 | % | 33 | % | 31 | % | 30 | % | 30 | % | 31 | % | 31 | % | 31 | % | ||||||||||||||||||||
|
Year 2008
origination
|
0 | % | 0 | % | 0 | % | 0 | % | 0 | % | 0 | % | 0 | % | 0 | % | 0 | % | 0 | % | ||||||||||||||||||||
|
Year 2007
origination
|
2 | % | 2 | % | 2 | % | 2 | % | 13 | % | 13 | % | 13 | % | 13 | % | 12 | % | 11 | % | ||||||||||||||||||||
|
Year 2006
origination
|
5 | % | 5 | % | 15 | % | 15 | % | 21 | % | 21 | % | 20 | % | 20 | % | 19 | % | 18 | % | ||||||||||||||||||||
|
Year 2005
origination
|
4 | % | 4 | % | 4 | % | 4 | % | 5 | % | 5 | % | 5 | % | 5 | % | 5 | % | 5 | % | ||||||||||||||||||||
|
Year 2004
origination or earlier
|
89 | % | 89 | % | 79 | % | 79 | % | 61 | % | 61 | % | 62 | % | 62 | % | 64 | % | 66 | % | ||||||||||||||||||||
|
Wtd Avg
Original LTV
|
67 | % | 67 | % | 68 | % | 68 | % | 69 | % | 69 | % | 69 | % | 69 | % | 68 | % | 68 | % | ||||||||||||||||||||
|
Original LTV:
0 - 50
|
18 | % | 18 | % | 17 | % | 17 | % | 15 | % | 15 | % | 15 | % | 15 | % | 15 | % | 15 | % | ||||||||||||||||||||
|
Original LTV:
50 - 60
|
11 | % | 11 | % | 11 | % | 11 | % | 11 | % | 11 | % | 11 | % | 11 | % | 11 | % | 11 | % | ||||||||||||||||||||
|
Original LTV:
60 - 70
|
20 | % | 20 | % | 19 | % | 19 | % | 19 | % | 19 | % | 19 | % | 19 | % | 19 | % | 20 | % | ||||||||||||||||||||
|
Original LTV:
70 - 80
|
43 | % | 43 | % | 46 | % | 46 | % | 49 | % | 49 | % | 49 | % | 48 | % | 48 | % | 47 | % | ||||||||||||||||||||
|
Original LTV:
80 - 90
|
2 | % | 2 | % | 2 | % | 2 | % | 2 | % | 2 | % | 2 | % | 2 | % | 2 | % | 2 | % | ||||||||||||||||||||
|
Original LTV:
90 - 100
|
6 | % | 6 | % | 5 | % | 5 | % | 4 | % | 4 | % | 4 | % | 5 | % | 5 | % | 5 | % | ||||||||||||||||||||
|
Wtg Avg
FICO
|
2 | 731 | 731 | 732 | 732 | 732 | 732 | 732 | 732 | 732 | ||||||||||||||||||||||||||||||
|
FICO: <=
600
|
1 | % | 1 | % | 1 | % | 1 | % | 1 | % | 1 | % | 1 | % | 1 | % | 1 | % | 1 | % | ||||||||||||||||||||
|
FICO: 601
-620
|
1 | % | 1 | % | 1 | % | 1 | % | 1 | % | 1 | % | 1 | % | 1 | % | 1 | % | 1 | % | ||||||||||||||||||||
|
FICO: 621 -
640
|
2 | % | 2 | % | 2 | % | 2 | % | 1 | % | 1 | % | 2 | % | 1 | % | 2 | % | 2 | % | ||||||||||||||||||||
|
FICO: 641
-660
|
4 | % | 4 | % | 4 | % | 4 | % | 3 | % | 3 | % | 3 | % | 3 | % | 3 | % | 3 | % | ||||||||||||||||||||
|
FICO: 661 -
680
|
8 | % | 8 | % | 7 | % | 7 | % | 7 | % | 8 | % | 7 | % | 7 | % | 7 | % | 7 | % | ||||||||||||||||||||
|
FICO: 681 -
700
|
12 | % | 12 | % | 12 | % | 12 | % | 12 | % | 12 | % | 12 | % | 12 | % | 12 | % | 12 | % | ||||||||||||||||||||
|
FICO: 701 -
720
|
13 | % | 14 | % | 13 | % | 13 | % | 13 | % | 14 | % | 13 | % | 14 | % | 13 | % | 14 | % | ||||||||||||||||||||
|
FICO: 721 -
740
|
13 | % | 13 | % | 13 | % | 13 | % | 13 | % | 14 | % | 13 | % | 13 | % | 13 | % | 13 | % | ||||||||||||||||||||
|
FICO: 741 -
760
|
14 | % | 14 | % | 15 | % | 15 | % | 15 | % | 15 | % | 15 | % | 15 | % | 15 | % | 15 | % | ||||||||||||||||||||
|
FICO: 761 -
780
|
16 | % | 16 | % | 17 | % | 17 | % | 17 | % | 17 | % | 17 | % | 17 | % | 17 | % | 17 | % | ||||||||||||||||||||
|
FICO: 781 -
800
|
12 | % | 12 | % | 12 | % | 12 | % | 13 | % | 13 | % | 13 | % | 13 | % | 13 | % | 13 | % | ||||||||||||||||||||
|
FICO: >=
801
|
4 | % | 3 | % | 3 | % | 3 | % | 4 | % | 4 | % | 4 | % | 3 | % | 4 | % | 4 | % | ||||||||||||||||||||
|
Conforming % (1)
|
56 | % | 56 | % | 55 | % | 52 | % | 34 | % | 33 | % | 34 | % | 34 | % | 35 | % | 35 | % | ||||||||||||||||||||
|
% balance in
loans > $1mm per loan
|
16 | % | 16 | % | 14 | % | 14 | % | 15 | % | 15 | % | 15 | % | 15 | % | 15 | % | 15 | % | ||||||||||||||||||||
|
2nd home
%
|
12 | % | 12 | % | 11 | % | 11 | % | 11 | % | 11 | % | 11 | % | 11 | % | 11 | % | 11 | % | ||||||||||||||||||||
|
Investment
home %
|
4 | % | 4 | % | 3 | % | 3 | % | 3 | % | 3 | % | 3 | % | 3 | % | 3 | % | 3 | % | ||||||||||||||||||||
|
Purchase
|
31 | % | 31 | % | 34 | % | 34 | % | 36 | % | 36 | % | 36 | % | 36 | % | 36 | % | 35 | % | ||||||||||||||||||||
|
Cash out
refinance
|
36 | % | 35 | % | 34 | % | 34 | % | 32 | % | 32 | % | 32 | % | 32 | % | 32 | % | 32 | % | ||||||||||||||||||||
|
Rate-term
refinance
|
31 | % | 32 | % | 31 | % | 31 | % | 30 | % | 30 | % | 30 | % | 30 | % | 31 | % | 31 | % | ||||||||||||||||||||
|
Other
|
2 | % | 2 | % | 1 | % | 1 | % | 2 | % | 2 | % | 2 | % | 2 | % | 2 | % | 2 | % | ||||||||||||||||||||
|
(1) The
definition of a conforming loan has significantly changed over
time. For all periods shown in this table, the conforming loan
definition available during the corresponding period was
used. For September 30, 2009, the conforming loan definition
available in Febuary 2009 was used (which had a maximum loan balance of
$729,750).
|
||||||||||||||||||||||||||||||||||||||||
|
THE REDWOOD
REVIEW
3RD QUARTER
2009
|
Table 10:
Residential Real Estate Loan Characteristics
|
|
|
EXECUTIVE
OFFICERS:
|
DIRECTORS:
|
|
George
E. Bull, III
|
George
E. Bull, III
|
|
Chairman of
the Board and
|
Chairman of
the Board and
|
|
Chief
Executive Officer
|
Chief
Executive Officer
|
|
Martin
S. Hughes
|
Richard
D. Baum
|
|
President,
Chief Financial Officer,
|
Former Chief
Deputy Insurance
|
|
and
Co-Chief Operating Officer
|
Commissioner
for the State of California
|
|
|
|
|
Brett
D. Nicholas
|
Thomas
C. Brown
|
|
Chief
Investment Officer and
|
COO, McGuire
Real Estate and
|
|
Co-Chief
Operating Officer
|
Principal
Shareholder, Urban Bay Properties, Inc.
|
|
Harold
F. Zagunis
|
Mariann
Byerwalter
|
|
Chief Risk
Officer, Treasurer,
|
Chairman, JDN
Corporate
|
|
and Managing
Director
|
Advisory
LLC
|
|
Douglas
B. Hansen
|
|
|
Private
Investor
|
|
|
Greg
H. Kubicek
|
|
|
President,
The Holt Group, Inc.
|
|
|
Diane
L. Merdian
|
|
|
STOCK
LISTING:
|
Private
Investor
|
|
The Company’s
common stock is traded
|
|
|
on the New
York Stock Exchange under
|
Georganne
C. Proctor
|
|
the symbol
RWT
|
Executive
Vice President and
|
|
Chief
Financial Officer, TIAA-CREF
|
|
|
CORPORATE
HEADQUARTERS:
|
|
|
One Belvedere
Place, Suite 300
|
Charles
J. Toeniskoetter
|
|
Mill Valley,
California 94941
|
Chairman,
Toeniskoetter & Breeding, Inc.
|
|
Telephone:
(415) 389-7373
|
Development
|
|
Chairman
& CEO, Toeniskoetter Construction, Inc.
|
|
|
NEW YORK
OFFICE:
|
|
|
245 Park
Avenue, 39th Floor
|
David
L. Tyler
|
|
New York, New
York 10167
|
Private
Investor
|
|
Telephone:
(212) 792-4210
|
|
|
INVESTOR
RELATIONS:
|
|
|
Mike
McMahon
|
|
|
Managing
Director
|
|
|
Paula
Kwok
|
|
|
Assistant
Vice President
|
|
|
Investor
Relations Hotline: (866) 269-4976
|
TRANSFER
AGENT:
|
|
Email:
[email protected]
|
Computershare
|
| 2 North LaSalle Street | |
| GRAPHIC DESIGN: | Chicago, IL 60602 |
| Emily Spoon | Telephone: (888) 472-1955 |