 |
 |
|
TABLE
OF CONTENTS
|
|
Introduction
|
3
|
|
Shareholder
Letter
|
4
|
|
Quarterly
Overview
|
6
|
|
Financial
Insights
|
12
|
|
u
Book Value
|
12
|
|
u
Balance Sheet
|
14
|
|
u
GAAP Income
|
18
|
|
u
Taxable Income and Dividends
|
21
|
|
u
Cash Flow
|
23
|
|
Residential
Real Estate Securities
|
26
|
|
Commercial
Real Estate Securities
|
35
|
|
Investments
in Securitization Entities
|
37
|
|
Appendix
|
|
|
Accounting
Discussion
|
40
|
|
Glossary
|
42
|
|
Financial
Tables
|
49
|
|
THE REDWOOD
REVIEW 4TH QUARTER 2009
|
1
|
|
|
|
CAUTIONARY
STATEMENT
|
|
2
|
THE REDWOOD
REVIEW 4TH QUARTER 2009
|
|
|
|
|
INTRODUCTION
|
|
Selected
Financial Highlights
|
||||||||||||||||||||||||||
|
Quarter:Year
|
GAAP
Income (Loss) per Share
|
Taxable
Income (Loss) per Share(1)
|
Annualized
Return on Equity
|
GAAP
Book Value per Share (2)
|
Non-GAAP
Economic Value per Share (2)
|
Total
Dividends per Share
|
||||||||||||||||||||
|
Q407
|
$ | (36.49 | ) | $ | 0.92 | (4419 | %) | $ | 23.18 | $ | 22.29 | $ | 2.75 | |||||||||||||
|
Q108
|
$ | (5.28 | ) | $ | 0.79 | (95 | %) | $ | 17.89 | $ | 18.04 | $ | 0.75 | |||||||||||||
|
Q208
|
$ | (1.40 | ) | $ | 0.11 | (30 | %) | $ | 17.00 | $ | 16.72 | $ | 0.75 | |||||||||||||
|
Q308
|
$ | (3.34 | ) | $ | 0.07 | (83 | %) | $ | 12.40 | $ | 13.18 | $ | 0.75 | |||||||||||||
|
Q408
|
$ | (3.46 | ) | $ | (0.39 | ) | (124 | %) | $ | 9.02 | $ | 11.10 | $ | 0.75 | ||||||||||||
|
Q109
|
$ | (0.65 | ) | $ | (0.22 | ) | (25 | %) | $ | 8.40 | $ | 10.01 | $ | 0.25 | ||||||||||||
|
Q209
|
$ | 0.10 | $ | (0.16 | ) | 5 | % | $ | 10.35 | $ | 11.30 | $ | 0.25 | |||||||||||||
|
Q309
|
$ | 0.34 | $ | (0.30 | ) | 13 | % | $ | 11.68 | $ | 12.28 | $ | 0.25 | |||||||||||||
|
Q409
|
$ | 0.51 | $ | (0.44 | ) | 17 | % | $ | 12.50 | $ | 13.03 | $ | 0.25 | |||||||||||||
|
(1) Taxable
income (loss) per share for 2009 is an estimate until we file our 2009 tax
returns.
|
||||||
|
(2) The Q407
GAAP book value per share is after giving retroactive effect on December
31, 2007 to the adoption of FAS 159 on January 1, 2008. Without giving
retroactive effect to FAS 159, the GAAP book value per share was negative
$22.18.
|
||||||
|
(3) Non-GAAP
economic value per share is calculated using estimated bid-side values
(which take into account available bid-side marks) for our financial
assets and estimated offer-side values (which take into account available
offer-side marks) for our financial liabilities and we believe it more
accurately reflects liquidation value than does GAAP book value per
share. Non-GAAP economic value per share is reconciled to GAAP
book value per share in Table 4 in the Financial Tables in this
Review.
|
|
THE REDWOOD
REVIEW 4TH QUARTER 2009
|
3
|
 |
|
|
SHAREHOLDER
LETTER
|
|
4
|
THE REDWOOD
REVIEW 4TH QUARTER 2009
|
|
|
|
|
SHAREHOLDER
LETTER
|
|
u
|
We take
credit risk on high-quality
borrowers.
|
|
u
|
We keep our
balance sheet strong, because we cannot predict the future and we need to
be prepared for what might come.
|
|
u
|
We ask for
new capital from our shareholders only when we believe we have exceptional
opportunities in our business that should lead to higher levels of
earnings and dividends per share.
|
|
u
|
We are open
and honest in our communications and we follow high-quality accounting
practices.
|
|
u
|
We invest for
the long-term.
|

|
THE REDWOOD
REVIEW 4TH QUARTER 2009
|
5
|
 |
|
|
QUARTERLY
OVERVIEW
|
|
u
|
New secondary
market opportunities will likely develop as economic, political, and
regulatory events unfold in 2010.
|
|
|
u
|
The economy
and housing market are still not
“out-of-the-woods.”
|
|
|
u
|
The GSEs will
remain “wards of the state” at least through 2010.
|
|
|
u
|
New private
residential securitization is within sight, but hurdles
remain.
|
|
|
u
|
Attractive,
well-protected, long-term commercial investment opportunities are near.
|
|
|
u
|
We like our
competitive position.
|
|
6
|
THE REDWOOD
REVIEW 4TH QUARTER 2009
|
|
|
|
|
QUARTERLY
OVERVIEW
|
|
THE REDWOOD
REVIEW 4TH QUARTER 2009
|
7
|
|
|
|
QUARTERLY
OVERVIEW
|
|
8
|
THE REDWOOD
REVIEW 4TH QUARTER 2009
|
|
|
|
|
QUARTERLY
OVERVIEW
|
|
u
|
The math is
close, but some further tightening of AAA credit spreads is necessary. It
would be problematic if volatility and uncertainty creep back into the
fixed income markets and AAA credit spreads
widen.
|
|
u
|
The rating
agencies are still working out the kinks in their revised processes for
establishing subordination levels and evaluating originators. It would
also be problematic if rating agency subordination levels come out so high
that they would render securitizations uneconomic.
|
|
u
|
Lastly, is
the definition of skin-in-the-game (i.e., how much risk must be retained
by loan originators or securitization sponsors). Currently, there are
three proposals emanating from the House, the Senate, and the FDIC. For
our two cents, we certainly agree with the concept, but not with any of
the proposals, as they are fixated on absolute percentages, rather than on
ownership requirements proportionate to the risk inherent in the
underlying collateral.
|
|
THE REDWOOD
REVIEW 4TH QUARTER 2009
|
9
|
|
|
|
QUARTERLY
OVERVIEW
|
|
10
|
THE REDWOOD
REVIEW 4TH QUARTER 2009
|
|
|
|
|
QUARTERLY
OVERVIEW
|
 |
 |
|
Martin S.
Hughes
|
Brett D.
Nicholas
|
|
President,
Chief Financial Officer,
|
Chief
Investment Officer and
|
|
and
Co-Chief Operating Officer
|
Co-Chief
Operating Officer
|
|
THE REDWOOD
REVIEW 4TH QUARTER 2009
|
11
|
 |
|
|
FINANCIAL
INSIGHTS
|
|
u
|
The
following table shows the components of our GAAP Book Value and
Management’s Estimate of Non-GAAP Economic Value at December 31,
2009.
|
|
|
||||||||||||
|
Components
of Book Value*
|
||||||||||||
|
December
31, 2009
|
||||||||||||
|
($
in millions, except per share data)
|
||||||||||||
|
Management's
|
||||||||||||
|
Estimate
of
|
||||||||||||
|
GAAP
|
Non-GAAP
|
|||||||||||
|
Book
Value
|
Adj.
|
Economic
Value
|
||||||||||
|
Cash and cash
equivalents
|
$ | 243 | $ | 243 | ||||||||
|
Real estate
securities at Redwood
|
||||||||||||
|
Residential
|
771 | 771 | ||||||||||
|
Commercial
|
9 | 9 | ||||||||||
|
CDO
|
1 | 1 | ||||||||||
|
Total real
estate securities at Redwood
|
$ | 781 | $ | 781 | ||||||||
|
Investments in
the Fund
|
22 | 22 | ||||||||||
|
Investments in
Sequoia
|
72 | (29 | ) | 43 | ||||||||
|
Investments in
Acacia
|
3 | 3 | ||||||||||
|
Total cash,
securities, and investments
|
$ | 1,121 | $ | 1,092 | ||||||||
|
Long-erm
debt
|
(140 | ) | 71 | (69 | ) | |||||||
|
Other
assets/liabilities, net
|
(9 | ) | (9 | ) | ||||||||
|
Stockholders’
equity
|
$ | 972 | $ | 1,014 | ||||||||
|
Book
value per share
|
$ | 12.50 | $ | 13.03 | ||||||||
|
u
|
During the
fourth quarter, our GAAP book value increased by $0.82 per share to $12.50
per share. The increase resulted from $0.50 per share of positive market
valuation adjustments and $0.57 per share from earnings before market
valuation adjustments, less $0.25 per share of dividends.
|
|
u
|
During the
fourth quarter, our estimate of non-GAAP economic value increased by $0.75
per share to $13.03 per share. The increase resulted from $1.14 per share
from net cash flows and net positive market valuation adjustments on our
securities and investments, less $0.14 per share of cash operating and
interest expense and $0.25 per share of
dividends.
|
|
*
|
The
components of book value table presents our assets and liabilities as
calculated and reported under GAAP and as adjusted to reflect our estimate
of economic value, a non-GAAP metric. We show our investments in the
Redwood Opportunity Fund, L.P. (the Fund) and in Sequoia and Acacia
securitization entities in separate line items, similar to the equity
method of accounting, reflecting the reality that the underlying assets
and liabilities owned by these entities are legally not ours. We own
only the securities and interests that we have acquired from these
entities. See pages 16 and 17 for an explanation of the adjustments set
forth in this table.
|
|
12
|
THE REDWOOD
REVIEW 4TH QUARTER 2009
|
|
|
|
|
FINANCIAL
INSIGHTS
|
|
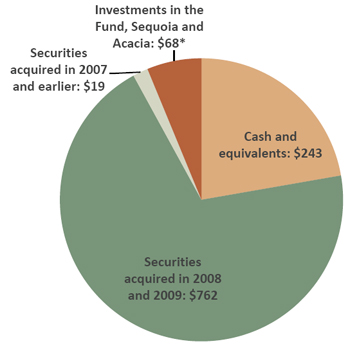
u
|
In the chart
below we present our December 31, 2009 securities portfolio by acquisition
period to highlight that 92% of the economic value of cash, securities,
and investments were held in cash or in recently acquired securities. Our
future earnings will be driven primarily by the performance of these
recent investments along with how we deploy our existing cash and future
cash flow.
|
|
* Estimate
of non-GAAP economic value;
See
page 12 for explanation and reconciliation.
|
|
u
|
At February
15, 2010, our cash and cash equivalents had increased since the end of the
fourth quarter to $270 million. Our cash is primarily invested in U.S.
Treasury Bills.
|
|
u
|
In 2010,
through February 15, 2010, we acquired $74 million of residential
securities and sold, at prices in excess of their year-end fair values,
$103 million of residential securities. As part of the management of our
portfolio, we sell securities when we believe conditions
merit.
|
|
THE REDWOOD
REVIEW 4TH QUARTER 2009
|
13
|
|
|
|
FINANCIAL
INSIGHTS
|
|
u
|
The following
table shows the components of our balance sheet at December 31, 2009.
|
|
Consolidating
Balance Sheet
|
||||||||||||||||||||
|
December
31, 2009
|
||||||||||||||||||||
|
($
in millions)
|
||||||||||||||||||||
|
Redwood
|
The
Fund
|
Securitization
Entities
|
Intercompany
|
Redwood
Consolidated
|
||||||||||||||||
|
Real estate
loans
|
$ | 3 | $ | - | $ | 3,737 | $ | - | $ | 3,740 | ||||||||||
|
Real estate
securities
|
781 | 37 | 270 | - | 1,088 | |||||||||||||||
|
Investments in
the Fund
|
22 | - | - | (22 | ) | - | ||||||||||||||
|
Investment in
Securitization Entities
|
75 | - | - | (75 | ) | - | ||||||||||||||
|
Other
investments
|
- | - | 20 | - | 20 | |||||||||||||||
|
Cash and cash
equivalents
|
243 | - | - | - | 243 | |||||||||||||||
|
Total earning
assets
|
1,124 | 37 | 4,027 | (97 | ) | 5,091 | ||||||||||||||
|
Other
assets
|
21 | 5 | 136 | - | 162 | |||||||||||||||
|
Total
assets
|
$ | 1,145 | $ | 42 | $ | 4,163 | $ | (97 | ) | $ | 5,253 | |||||||||
|
Short-term
debt
|
$ | - | $ | - | $ | - | $ | - | $ | - | ||||||||||
|
Other
liabilities
|
33 | 3 | 145 | - | 181 | |||||||||||||||
|
Asset-backed
securities issued
|
- | - | 3,943 | - | 3,943 | |||||||||||||||
|
Long-term
debt
|
140 | - | - | - | 140 | |||||||||||||||
|
Total
liabilities
|
173 | 3 | 4,088 | - | 4,264 | |||||||||||||||
|
Stockholders’
equity
|
972 | 22 | 75 | (97 | ) | 972 | ||||||||||||||
|
Noncontrolling
interest
|
- | 17 | - | - | 17 | |||||||||||||||
|
Total equity
|
972 | 39 | 75 | (97 | ) | 989 | ||||||||||||||
|
Total
liabilities and stockholders’ equity
|
$ | 1,145 | $ | 42 | $ | 4,163 | $ | (97 | ) | $ | 5,253 | |||||||||
|
u
|
We are
required under GAAP to consolidate all of the assets, liabilities, and
noncontrolling interest of the Fund due to our significant general and
limited partnership interests in the Fund and ongoing asset management
responsibilities.
|
|
u
|
We are
required to consolidate the assets and liabilities of certain Sequoia and
Acacia securitization entities that are treated as secured borrowing
transactions under GAAP. However, the securitized assets of these entities
are not available to Redwood. Similarly, the liabilities of these entities
are obligations payable only from the cash flow generated by their
securitized assets and are not obligations of
Redwood.
|
|
14
|
THE REDWOOD
REVIEW 4TH QUARTER 2009
|
|
|
|
|
FINANCIAL
INSIGHTS
|
|
u
|
The following
table presents the fair value of real estate securities at Redwood at
December 31, 2009. We segment our securities portfolio by vintage (the
year(s) the securities were issued), priority of cash flow (senior,
re-REMIC, and subordinate) and, for residential securities, by quality of
underlying loans (prime and non-prime).
|
|
Real
Estate Securities at Redwood
|
||||||||||||||||||||
|
December
31, 2009
|
||||||||||||||||||||
|
($
in millions)
|
||||||||||||||||||||
|
%
of Total
|
||||||||||||||||||||
|
<=2004
|
2005
|
2006-2009
|
Total
|
Securities
|
||||||||||||||||
|
Residential
|
||||||||||||||||||||
|
Seniors
|
||||||||||||||||||||
|
Prime
|
$ | 14 | $ | 248 | $ | 67 | $ | 329 | 42 | % | ||||||||||
|
Non-prime
|
118 | 183 | 14 | 315 | 40 | % | ||||||||||||||
|
Total
Seniors
|
$ | 132 | $ | 431 | $ | 81 | $ | 644 | 82 | % | ||||||||||
|
Re-REMIC
|
||||||||||||||||||||
|
Prime
|
$ | 4 | $ | 13 | $ | 89 | $ | 106 | 14 | % | ||||||||||
|
Total
Re-REMIC
|
$ | 4 | $ | 13 | $ | 89 | $ | 106 | 14 | % | ||||||||||
|
Subordinates
|
||||||||||||||||||||
|
Prime
|
$ | 14 | $ | 3 | $ | 2 | $ | 19 | 3 | % | ||||||||||
|
Non-prime
|
1 | 1 | - | 2 | 0 | % | ||||||||||||||
|
Total
Subordinates
|
$ | 15 | $ | 4 | $ | 2 | $ | 21 | 3 | % | ||||||||||
|
Total
Residential
|
$ | 151 | $ | 448 | $ | 172 | $ | 771 | 99 | % | ||||||||||
|
Commercial
Subordinates
|
$ | 7 | $ | 2 | $ | - | $ | 9 | 1 | % | ||||||||||
|
CDO
Subordinates
|
$ | - | $ | 1 | $ | - | $ | 1 | 0 | % | ||||||||||
|
Total
|
$ | 158 | $ | 451 | $ | 172 | $ | 781 | 100 | % | ||||||||||
|
u
|
The table
below details the net increase in the fair value of securities at Redwood
during the fourth and third quarters of 2009.
|
|
Real
Estate Securities at Redwood
|
||||||||
|
($
in millions)
|
||||||||
|
Three
Months Ended
|
||||||||
|
12/31/2009
|
9/30/2009
|
|||||||
|
Beginning
fair value
|
$ | 751 | $ | 517 | ||||
|
Acquisitions
|
68 | 246 | ||||||
|
Sales
|
(46 | ) | (63 | ) | ||||
|
Effect of
principal payments
|
(25 | ) | (25 | ) | ||||
|
Change in fair
value, net
|
33 | 76 | ||||||
|
Ending
fair value
|
$ | 781 | $ | 751 | ||||
|
THE REDWOOD
REVIEW 4TH QUARTER 2009
|
15
|
|
|
|
FINANCIAL
INSIGHTS
|
|
u
|
During the
fourth quarter, we bid on approximately $2.4 billion (market value) of
residential securities and we acquired $68 million of those securities,
consisting of $65 million of prime and non-prime senior securities and $3
million of prime re-REMIC securities. We also sold residential securities
with a basis of $46 million and realized gains of $20 million on these
sales.
|
|
u
|
Principal
payments reduced the fair value of our securities by $25 million during
the fourth quarter, unchanged from the third quarter. The rate of
unscheduled prepayments on our securities was generally unchanged over
these past
quarters.
|
|
u
|
Our
securities increased in value by $33 million during the fourth quarter,
reflecting an increase in prices that was due, in part, to continuing
demand from banks for older vintage prime securities, continued strong
inflows into taxable bond funds, and the renewed availability of leverage
for acquisitions of senior securities.
|
|
u
|
Our
investments in the Fund and Sequoia and Acacia securitization entities, as
reported under GAAP, totaled $97 million, or 9% of our cash, securities,
and investments at December 31, 2009.
|
|
u
|
The fair
value (which equals GAAP carrying value) of our investment in the Fund was
$22 million. The Fund is primarily invested in non-prime residential
securities and is managed by a subsidiary of Redwood. Our investment
represents a 52% interest in the
Fund.
|
|
u
|
Our
investments in Sequoia entities consist predominately of interest-only
securities (IOs) and, to a smaller extent, senior and subordinate
securities issued by these entities. The $72 million of GAAP carrying
value of our investments represents the difference between the carrying
costs of the assets and liabilities owned by the Sequoia entities. In
contrast, we calculated the $43 million estimate of non-GAAP economic
value for our investments in Sequoia entities using the same valuation
process that we follow to fair value our other real estate securities.
|
|
u
|
The GAAP
carrying value of our investments in Acacia entities was $3 million and
the fair value was $3 million. The GAAP value of our investments
represents the differences between the fair value of the assets and
liabilities owned by the Acacia entities. These investments consist of
equity interests and securities in the Acacia entities we sponsor, which
have minimal value, as well as the value of the future management fees we
expect to earn from these entities. We valued expected future management
fees at $3 million.
|
|
16
|
THE REDWOOD
REVIEW 4TH QUARTER 2009
|
|
|
|
|
FINANCIAL
INSIGHTS
|
|
u
|
We had no
short-term recourse debt at December 31, 2009. We currently fund our
investments with permanent capital (equity and long-term debt) that is not
subject to margin calls or financial
covenants.
|
|
u
|
At December
31, 2009, we had $140 million of long-term debt outstanding at a floating
interest rate of LIBOR plus 225 basis points. For GAAP purposes, this
long-term debt is reported at its outstanding principal amount. We
estimated the $69 million non-GAAP economic value of this debt using the
same valuation process used under GAAP to fair value our other financial
assets and liabilities. Economic value is difficult to estimate with
precision as the market for this debt is largely inactive.
|
|
u
|
In the first
quarter of 2010, we began to fix our interest cost on this $140 million of
long-term debt through the use of interest rate hedging agreements. By the
end of the first quarter of 2010, we expect to have hedged the rate on
most or all of this debt, and anticipate the effective fixed-rate to be
approximately 6.75% per annum. We don’t know where interest rates are
headed in the near term, but given that LIBOR cannot go much lower than
its current 0.25% monthly rate, we felt that it was the appropriate time
to buy insurance against possible rate increases and lock in attractive
financing for the next 27
years.
|
|
u
|
Our reported
capital totaled $1.1 billion at December 31, 2009, and included $140
million of long-term debt (due in 2037). Our capital increased by $65
million from September 30, 2009, primarily as a result of increases in the
fair values of our assets. In addition, our GAAP income exceeded our
dividend distributions, which also resulted in an increase to capital.
|
|
u
|
We use our
capital to invest in earning assets, fund our operations, fund working
capital needs, and meet lender capital requirements with respect to
collateralized borrowings, if any. Through our internal risk-adjusted
capital policy, we allocate capital for our earning assets to meet
liquidity needs that may arise.
|
|
u
|
Currently, we
have allocated risk-capital equal to 100% of the fair value of our
investments. The amount of remaining capital that exceeds our
risk-adjusted capital guidelines is excess capital that can be invested to
support business growth. Excess capital generally equals our cash balance
less pending investment settlements and other internal capital allocations
we have established for the prudent operations of our company. Our excess
capital at December 31, 2009 was $237 million and at February 15, 2010 was
$256 million.
|
|
u
|
Given the
amount of our excess capital, it seems unlikely we would seek to raise
additional capital in the near term. If circumstances should change, we
would likely look first at our own balance sheet for sources of cash
before considering other options.
|
|
THE REDWOOD
REVIEW 4TH QUARTER 2009
|
17
|
|
|
|
FINANCIAL
INSIGHTS
|
|
u
|
The following
table provides a summary of our GAAP income for the fourth and third
quarters of 2009.
|
|
GAAP
Income
|
||||||||
|
($
in millions, except per share data)
|
||||||||
|
Three
Months Ended
|
||||||||
|
12/31/2009
|
9/30/2009
|
|||||||
|
Interest
income
|
$ | 62 | $ | 70 | ||||
|
Interest
expense
|
(21 | ) | (25 | ) | ||||
|
Net interest
income
|
41 | 45 | ||||||
|
Provision for
loan losses
|
(9 | ) | (10 | ) | ||||
|
Market
valuation adjustments, net
|
(4 | ) | (11 | ) | ||||
|
Net interest
income (loss) after provision and market valuation
adjustments
|
28 | 24 | ||||||
|
Operating
expenses
|
(11 | ) | (15 | ) | ||||
|
Realized
gains, net
|
20 | 18 | ||||||
|
Noncontrolling
interest
|
- | - | ||||||
|
Benefit from
(provision for) income taxes
|
3 | - | ||||||
|
GAAP
income
|
$ | 40 | $ | 27 | ||||
|
GAAP
income per share
|
$ | 0.51 | $ | 0.34 | ||||
|
u
|
Our reported
GAAP income was $40 million, or $0.51 per share, for the fourth quarter of
2009, as compared to $27 million, or $0.34 per share, for the third
quarter of 2009.
|
|
u
|
Net interest
income totaled $41 million for the fourth quarter, a decrease of $4
million from the third quarter of 2009 as a result of holding fewer
securities funded with equity as well as the effects of coupon rates on
certain floating rate investments resetting lower during the
quarter.
|
|
u
|
Credit-related
charges on loans and securities decreased during the fourth quarter as
compared to the third quarter of 2009. The provision for loan losses
declined by $1 million as fewer Sequoia loans were outstanding and our
loss estimates did not increase significantly during the quarter. Negative
market valuation adjustments declined by $7 million as prices for
securities continued to stabilize and fewer credit-related impairment
charges were necessary. Credit trends on loans and securities continue to
generally follow our
expectations.
|
|
u
|
Our GAAP
income for the fourth quarter also reflects $20 million, or $0.26 per
share, of gains from the sale of securities during the fourth quarter.
Gains for the third quarter of 2009 totaled $18 million and were comprised
of $11 million from the sale of securities and a $7 million gain related
to the repurchase of long-term debt.
|
|
u
|
Operating
expenses totaled $11 million in the fourth quarter, a decrease of $4
million from the third quarter of 2009 due primarily to lower variable
compensation accruals. We currently anticipate that operating expenses
will trend higher in 2010 as we execute our residential and commercial
business plans.
|
|
u
|
Our future
earnings will be impacted by an accounting change that required us to
reverse $60 million of previous impairment charge by increasing our
retained earnings. Our future earnings will therefore not benefit from a
recovery in the value of the securities as they would have before the
change in GAAP accounting. The Accounting Discussion in the appendix of
this Review describes this
adjustment.
|
|
18
|
THE REDWOOD
REVIEW 4TH QUARTER 2009
|
|
|
|
|
FINANCIAL
INSIGHTS
|
|
u
|
The tables
below show the effect that Redwood, the Fund, and the Sequoia and Acacia
securitization entities had on our reported income for the fourth and
third quarters of 2009. These components of our income statement represent
investments and are not separate business
segments.
|
|
Consolidating
Income Statement
|
||||||||||||||||||||
|
Three
Months Ended December 31, 2009
|
||||||||||||||||||||
|
($
in millions)
|
||||||||||||||||||||
|
Redwood
|
The
Fund
|
Securitization
Entities
|
Intercompany
Adjustments
|
Redwood
Consolidated
|
||||||||||||||||
|
Interest
income
|
$ | 19 | $ | 1 | $ | 38 | $ | - | $ | 58 | ||||||||||
|
Net discount
(premium) amortization
|
6 | 1 | (3 | ) | - | 4 | ||||||||||||||
|
Total interest
income
|
25 | 2 | 35 | - | 62 | |||||||||||||||
|
Management
fees
|
1 | - | - | (1 | ) | - | ||||||||||||||
|
Interest
expense
|
(1 | ) | - | (20 | ) | (21 | ) | |||||||||||||
|
Net interest
income
|
25 | 2 | 15 | (1 | ) | 41 | ||||||||||||||
|
Provision for
loan losses
|
- | - | (9 | ) | - | (9 | ) | |||||||||||||
|
Market
valuation adjustments, net
|
(2 | ) | (1 | ) | (1 | ) | - | (4 | ) | |||||||||||
|
Net interest
income after provision and market valuation adjustments
|
23 | 1 | 5 | (1 | ) | 28 | ||||||||||||||
|
Operating
expenses
|
(11 | ) | (1 | ) | - | 1 | (11 | ) | ||||||||||||
|
Realized
gains, net
|
20 | - | - | - | 20 | |||||||||||||||
|
Income from
the Fund
|
- | - | - | - | - | |||||||||||||||
|
Income from
Securitization Entities
|
5 | - | - | (5 | ) | - | ||||||||||||||
|
Noncontrolling
interest
|
- | - | - | - | - | |||||||||||||||
|
Benefit from
income taxes
|
3 | - | - | - | 3 | |||||||||||||||
|
Net
income
|
$ | 40 | $ | - | $ | 5 | $ | (5 | ) | $ | 40 | |||||||||
|
Consolidating
Income Statement
|
||||||||||||||||||||
|
Three
Months Ended September 30, 2009
|
||||||||||||||||||||
|
($
in millions)
|
||||||||||||||||||||
|
Redwood
|
The
Fund
|
Securitization
Entities
|
Intercompany
Adjustments
|
Redwood
Consolidated
|
||||||||||||||||
|
Interest
income
|
$ | 21 | $ | - | $ | 43 | $ | - | $ | 64 | ||||||||||
|
Net discount
(premium) amortization
|
8 | 2 | (4 | ) | - | 6 | ||||||||||||||
|
Total interest
income
|
29 | 2 | 39 | - | 70 | |||||||||||||||
|
Management
fees
|
1 | - | - | (1 | ) | - | ||||||||||||||
|
Interest
expense
|
(1 | ) | - | (24 | ) | - | (25 | ) | ||||||||||||
|
Net interest
income
|
29 | 2 | 15 | (1 | ) | 45 | ||||||||||||||
|
Provision for
loan losses
|
- | - | (10 | ) | - | (10 | ) | |||||||||||||
|
Market
valuation adjustments, net
|
(8 | ) | (1 | ) | (2 | ) | - | (11 | ) | |||||||||||
|
Net interest
income after provision and market valuation adjustments
|
21 | 1 | 3 | (1 | ) | 24 | ||||||||||||||
|
Operating
expenses
|
(15 | ) | (1 | ) | - | 1 | (15 | ) | ||||||||||||
|
Realized
gains, net
|
18 | - | - | - | 18 | |||||||||||||||
|
Income from
the Fund
|
- | - | - | - | - | |||||||||||||||
|
Income from
Securitization Entities
|
3 | - | - | (3 | ) | - | ||||||||||||||
|
Noncontrolling
interest
|
- | - | - | - | - | |||||||||||||||
|
Benefit from
income taxes
|
- | - | - | - | - | |||||||||||||||
|
Net
income
|
$ | 27 | $ | - | $ | 3 | $ | (3 | ) | $ | 27 | |||||||||
|
THE REDWOOD
REVIEW 4TH QUARTER 2009
|
19
|
|
|
|
FINANCIAL
INSIGHTS
|
|
u
|
At Redwood,
net interest income was $25 million for the fourth quarter of 2009, as
compared to $29 million for the third quarter of 2009. Lower coupon income
due to lower benchmark LIBOR rates on adjustable-rate securities and a
lower average balance of securities in the fourth quarter contributed to
the decline in quarterly interest
income.
|
|
u
|
In the near
term, we continue to expect net interest income to be driven by our
residential senior securities, which comprised 82% of the securities we
held at December 31, 2009. During the fourth quarter, these securities
generated $17 million of interest income, or a 13% effective annual yield
that was comprised of 7% coupon interest and 6% discount amortization
income. In the longer term, net interest income will be affected by how we
deploy our remaining cash balances (which comprised 22% of our earning
assets at year end) and future cash
flow.
|
|
u
|
Negative
market valuation adjustments were $2 million, a significant decrease from
the third quarter, reflecting lower impairments as security prices have
increased and credit deterioration has generally remained consistent with
our assumptions. To the extent our loss expectations do not significantly
change, we expect impairments to remain near levels observed in recent
quarters.
|
|
u
|
We recognized
net income of $5 million in the fourth quarter from our investments in the
Fund and Sequoia and Acacia securitization
entities.
|
|
u
|
Net interest
income was $17 million in the fourth quarter, unchanged from the third
quarter. Net interest income remained constant as reduced principal
balances and lower benchmark rates affected both the assets and
liabilities of the securitization entities.
|
|
u
|
The provision
for loan losses totaled $9 million in the fourth quarter, down modestly
from $10 million in the third quarter of 2009. Although serious
delinquencies (90+ days past due) continued to rise in the fourth quarter,
the rate of increase has been declining. There are currently no Sequoia
entities for which we have expensed loan loss provisions in excess of our
reported investment for GAAP
purposes.
|
|
u
|
Market
valuation adjustments were negative $2 million, primarily reflecting
declining fair values for REO properties held by Sequoia
entities.
|
|
20
|
THE REDWOOD
REVIEW 4TH QUARTER 2009
|
|
|
|
|
FINANCIAL
INSIGHTS
|
|
u
|
Taxable
income is pre-tax profit as calculated for tax purposes. REIT taxable
income is income earned at the Redwood REIT together with income earned
at REIT subsidiaries and excludes undistributed taxable income earned
at our taxable subsidiaries. In discussing tax matters we sometimes refer
to the Redwood REIT together with its REIT subsidiaries as the “REIT
level” of our consolidated group of entities. We are required to
distribute at least 90% of our REIT taxable income in the form of
dividends to shareholders in order to maintain our tax status as a REIT.
Our board of directors can declare dividends in excess of this minimum
requirement.
|
|
u
|
Estimated
taxable income for the fourth quarter was negative $34 million, or $0.44
per share, as compared to negative $23 million, or $0.30 per share, for
the third quarter. Our estimated taxable income for 2009 was negative $83
million, or $1.12 per share.
|
|
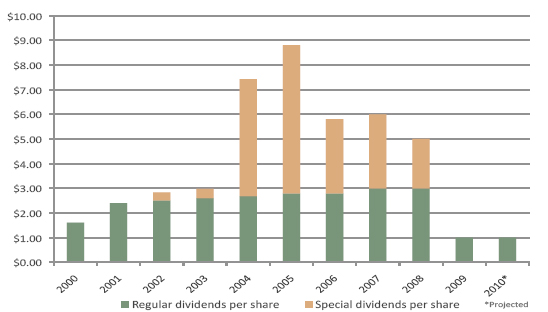
u
|
We paid $1.00
per share in regular dividends in 2009 and announced that these dividends
are characterized for tax purposes as a return of capital given our
estimated taxable loss at the REIT level for the 2009 tax year. There was
no undistributed REIT taxable income at December 31, 2009.
|
|
u
|
On November
16, 2009, our board of directors declared a regular dividend of $0.25 per
share for the fourth quarter, which was paid on January 21, 2010 to
shareholders of record on December 31, 2009, and announced its intention
to pay a regular dividend of $0.25 per share per quarter in 2010.
|
|
u
|
Depending on
the timing of credit losses, we may incur a taxable loss in 2010 for tax
purposes. In any case, we currently do not expect to generate sufficient
taxable income in 2010 to offset our net operating losses. Thus, we expect
that any 2010 dividends will be characterized as a return of capital and,
as such, would not be taxable to
shareholders.
|
|
u
|
The chart
below shows the regular and special dividends per share paid to
shareholders for the indicated periods and our projected regular dividend
for 2010.
|
|
THE REDWOOD
REVIEW 4TH QUARTER 2009
|
21
|
|
|
|
FINANCIAL
INSIGHTS
|
|
u
|
Differences
exist in accounting under GAAP and accounting for tax purposes that can
lead to a significant variance in the amount and timing of when income and
losses are recognized under these two accounting methods and, therefore,
when we may recognize taxable income and be required to distribute income
as dividends to shareholders. Reconciliations of GAAP and tax income are
shown in Table 2 in the Financial Tables in this Review.
|
|
u
|
As
anticipated, the most significant difference between our GAAP and taxable
income during the fourth quarter (and for all of 2009) was the realization
of credit losses. In the fourth quarter, we realized $54 million
of credit losses on securities for tax purposes that we had previously
provisioned for under GAAP. Realized credit losses are based on our tax
basis, which averaged 43% on securities that incurred principal face
losses. We anticipate an additional $302 million of tax losses on
securities in future periods (primarily in 2010), based on our projection
of principal face losses and assuming a similar tax basis as we have
recently
experienced.
|
|
u
|
Another
material difference during the fourth quarter between GAAP and taxable
income relates to $20 million in gains on sales recognized under GAAP. To
the extent we report gains from sales for GAAP purposes, there may be no
corresponding gains reported for tax purposes as these capital gains are
offset by our capital loss carry-forwards, which totaled $119 million at
the REIT level as of December 31,
2009.
|
|
u
|
As a result
of this year’s estimated tax losses, at the REIT level there is a net
operating loss (NOL) carry-forward for tax purposes of $70 million. Thus,
our dividend distribution requirements will remain at zero until we earn
sufficient REIT-level taxable income to exhaust this NOL and any future
additional NOLs. A portion of this year’s estimated taxable loss ($14
million) occurred at our taxable REIT subsidiaries, which will be carried
back to prior years and will result in tax refunds (a tax benefit was
recorded for GAAP purposes in the fourth
quarter).
|
|
u
|
The
composition of our investment portfolio has changed over the past two
years since most of our recent acquisitions have been senior securities
where we generally expect to incur minimal credit losses. For these
securities, the overall timing differences between GAAP and taxable income
is generally not significant. Thus, once the anticipated credit losses
occur on our subordinated securities (the $702 million of designated
credit reserves that have been established under GAAP for these
securities) and the loans held by consolidated Sequoia entities (which
have a credit reserve of $57 million), GAAP and taxable income should be
more in line with each other.
|
|
u
|
We generally
expect most of our anticipated credit losses to be realized over the next
few years.
However, these losses — and any subsequent convergence of GAAP and tax
income — may be prolonged due to ongoing efforts by the government to
promote loan modifications and reduce
foreclosures, which could delay the actual realization of credit losses on
our subordinate
securities.
|
|
22
|
THE REDWOOD
REVIEW 4TH QUARTER 2009
|
|
|
|
|
FINANCIAL
INSIGHTS
|
|
u
|
Redwood is
focused on generating long-term investment cash flow. Beginning in the
first quarter of 2008, we began discussing the detailed quarterly
components of our sources and uses of cash to supplement our other GAAP
financial statement disclosures. We knew that a cash analysis of this type
had limitations, but felt at the time that non-cash mark-to-market
adjustments and the consolidation of securitization entities made it
difficult for readers to measure our economic performance solely by
reading our GAAP income statement. In recent quarters, the impact of
mark-to-market charges has declined, both by virtue of changes in the mix
of our securities portfolio and by the adoption of recent accounting
principles, and we believe re-emphasizing more “GAAP income
centric” performance metrics is appropriate, however, we continue to
provide supplemental cash flow information to enhance the understanding of
our operating results.
|
|
u
|
In the fourth
quarter, cash flow continued to be strong and in line with our
expectations. Our business cash flows exceeded dividend distributions and
proceeds from sales generally offset our uses of cash for
acquisitions. We had a net inflow of cash and ended the year
with $243 million in cash.
|
|
u
|
The decline
in business cash flow from the third to the fourth quarter was due to
reduced principal balances on securities held in our portfolio and
slightly slower prepayments. Although prepayments slowed this quarter,
prepayments on loans underlying our securities were generally faster than
we expected at acquisition (which, since we bought these securities at
discounts, is a positive).
|
|
u
|
The sources
and uses of cash in the table below are derived from our GAAP Consolidated
Statement of Cash Flow for the fourth and third quarters of 2009 by
aggregating and netting all items in a manner consistent with the way
management analyzes them. This table excludes the gross cash flow
generated by our Sequoia and Acacia securitization entities and the Fund
(cash flow that is not available to Redwood), but does include the cash
flow distributed to Redwood as a result of our investments in these
entities. The beginning and ending cash balances presented in the table
below are GAAP
amounts.
|
|
Redwood
|
||||||||
|
Sources
and Uses of Cash
|
||||||||
|
($
in millions)
|
||||||||
|
Three
Months Ended
|
||||||||
|
12/31/09
|
9/30/09
|
|||||||
|
Beginning
cash balance
|
$ | 217 | $ | 337 | ||||
|
Business cash
flow:
|
||||||||
|
Cash flow from
securities and investments
|
$ | 68 | $ | 78 | ||||
|
Asset
management fees
|
1 | 1 | ||||||
|
Cash operating
expenses
|
(11 | ) | (10 | ) | ||||
|
Interest
expense on long-term debt
|
(1 | ) | (1 | ) | ||||
|
Total business
cash flow
|
57 | 68 | ||||||
|
Other sources
and uses:
|
||||||||
|
Proceeds from
asset sales
|
66 | 74 | ||||||
|
Proceeds from
equity issuance
|
- | - | ||||||
|
Changes in
working capital
|
(9 | ) | 6 | |||||
|
Acquistions
|
(68 | ) | (246 | ) | ||||
|
Repurchase of
long-term debt
|
- | (3 | ) | |||||
|
Dividends
|
(20 | ) | (19 | ) | ||||
|
Net other
uses
|
(31 | ) | (188 | ) | ||||
|
Net
sources (uses) of cash
|
$ | 26 | $ | (120 | ) | |||
|
Ending
cash balance
|
$ | 243 | $ | 217 | ||||
|
THE REDWOOD
REVIEW 4TH QUARTER 2009
|
23
|
|
|
|
FINANCIAL
INSIGHTS
|
|
u
|
The table
below presents cash flow, by type of security and investment, for the
fourth and third quarters of
2009.
|
|
Redwood
|
||||||||
|
Cash
Flow from Securities and Investments
|
||||||||
|
($
in millions)
|
||||||||
|
Three
Months Ended
|
||||||||
|
12/31/09
|
9/30/09
|
|||||||
|
Securities at
Redwood
|
||||||||
|
Residential
Seniors
|
$ | 41 | $ | 45 | ||||
|
Residential
Re-REMICs
|
4 | 3 | ||||||
|
Residential
Subordinates
|
10 | 14 | ||||||
|
Commercial and
CDO Subordinates
|
1 | 3 | ||||||
|
Total cash
flow from securities at Redwood
|
56 | 65 | ||||||
|
Investments in
the Fund
|
2 | 2 | ||||||
|
Investments in
Sequoia entities
|
10 | 11 | ||||||
|
Investments in
Acacia entities
|
- | - | ||||||
|
Total
cash flow from securities and investments
|
$ | 68 | $ | 78 | ||||
|
24
|
THE REDWOOD
REVIEW 4TH QUARTER 2009
|
|
|
|
|
FINANCIAL
INSIGHTS
|
|
u
|
Fourth
quarter cash flow from securities and investments included $29 million of
coupon interest and $39 million of principal payments, compared to $32
million of coupon interest and $46 million of principal payments in the
third quarter.
|
|
u
|
We evaluate
cash flow performance over the life of an investment. Interim
quarter–to-quarter analysis has limitations and readers should use caution
in drawing conclusions from quarterly cash flow data. In particular, we
note:
|
|
•
|
Cash flow
from securities and investments can be volatile from quarter to quarter
depending on the level of invested capital, the timing of credit losses,
and changes in prepayments and interest
rates.
|
|
•
|
The timing of
acquisitions and sales will have an impact on quarterly cash
flow.
|
|
•
|
Given the
nature of our investments (senior and subordinated securities acquired at
deep discounts and IOs) it is difficult to draw conclusions in any one
period about what portion of our cash flow represents “income” and what
represents a “return of capital.” It is only at the end of an asset’s life
that we can accurately determine what portion of the cumulative cash
received (whether principal or interest) was income and what was a return
of capital.
|
|
•
|
Many of our
investments may generate cash flow in a quarter that is not necessarily
reflective of the long-term economic yield we will earn on the
investments. For example, we acquired re-REMIC support securities at what
we believe to be attractive yields, although, due to their terms, the
securities are locked out of receiving any principal payments for years.
Because of the deferred receipt of principal payments (which modeled into
our acquisition assumptions), formulating any conclusions on the value or
performance of these securities by looking solely at the quarterly cash
flow may not be appropriate.
|
|
THE REDWOOD
REVIEW 4TH QUARTER 2009
|
25
|
 |
|
| RESIDENTIAL REAL ESTATE SECURITIES |
|
u
|
Market prices
continued to appreciate for non-agency residential mortgage-backed
securities (RMBS) during the fourth quarter of 2009, as investors with a
renewed appetite for risk, strong cash inflows into fixed-income mutual
funds, and a renewed availability of leverage for RMBS purchases all
contributed to increased prices.
|
|
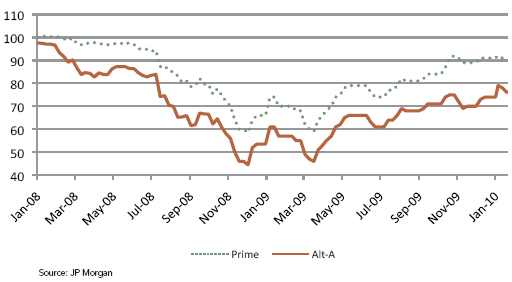
u
|
The following
chart illustrates generic prices that investors were willing to pay for
senior RMBS from the beginning of 2008 through January 2010.
|
|
26
|
THE REDWOOD
REVIEW 4TH QUARTER 2009
|
|
|
|
|
RESIDENTIAL REAL ESTATE
SECURITIES
|
|
u
|
During the
fourth quarter, we invested $68 million in RMBS and sold $58 million of
RMBS and $8 million of commercial securities. Generally, our intent is to
invest in assets that generate long-term cash flow. The return of greater
liquidity in the RMBS market, however, has allowed us to monetize some of
this future cash flow in the current period. We may continue to sell
assets into this market if we believe it is in the best interest of
our shareholders in the long term.
|
|
u
|
In the first
quarter of 2010 through February 15, we invested $74 million in RMBS and
sold $103 million of RMBS assets.
|
|
u
|
We believe
housing prices are much closer to the bottom of this housing cycle, but we
expect further price declines.
|
|
u
|
We note that
home price depreciation since 2006 (~29% in the Case Shiller Composite-20)
has been sufficient to restore nation-wide housing affordability to levels
consistent with long-term stability. Price-to-rent and price-to-income
metrics are within their historic range, which suggests that the
fundamentally driven reversion in home prices is nearing an end for the
nation as a whole, but not necessarily in each market.
|
|
u
|
Oversupply
continues to be the major obstacle to a recovery in home prices. Even in
markets where affordability has been restored, supply overhang is holding
prices down. This is the primary reason for our belief that housing prices
have further to decline.
|
|
u
|
Inventories,
on the surface, appear to be improving. The National Association of
Realtors’ (NAR) estimate of existing home inventories has steadily
declined since July 2009, and months’ supply has decreased from 10.1 in
April 2009 to 7.2 in December 2009. However, this obscures two key
facts:
|
|
•
|
The
improvement has been strongly concentrated in low-end markets which have
benefited from a tax credit and low-cost government backed loans. (The tax
credit is set to expire in April 2010 and mortgage rates may increase as
the Federal Reserve completes its program of acquiring $1.25 trillion of
agency mortgage-backed securities.)
|
|
•
|
The “shadow
inventory” of seriously delinquent mortgage properties remains a serious
concern. Amherst Securities estimates that over seven million of these
homes will eventually be sold as distressed properties. This represents an
additional 15 months of supply.
|
|
u
|
It appears
that the Administration’s Home Affordable Modification Program (HAMP) may
fall short of its goal of modifying the loans of three-to-four million
borrowers who are at risk of default. According to the Treasury
Department’s latest data for January 2010, 1.3 million borrowers have been
offered trial modifications through HAMP, and although 940,000
modification trials have been initiated, only 116,000 trials have been
made permanent.
|
|
THE REDWOOD
REVIEW 4TH QUARTER 2009
|
27
|
|
|
| RESIDENTIAL REAL ESTATE SECURITIES |
|
u
|
There are
various reasons often cited for HAMP's slow start,
including:
|
|
•
|
Loan
servicers are overwhelmed and unable to process modifications on a timely
basis.
|
|
•
|
Conflicts
between first and second-lien
holders.
|
|
•
|
Borrowers are
either unwilling or unable to complete the necessary documentation to
obtain a permanent modification.
|
|
•
|
Borrowers are
indicating a willingness to walk away from significant negative equity
positions rather than accept a modification that will likely keep them
making payments for an extended period on a home in which they have
negative equity.
|
|
u
|
While all of
these explanations have some validity, in our opinion, the most
significant factor is negative equity. First American CoreLogic, Inc.
estimates that 24% of U.S. households currently owe more than their homes
are worth, and Deutsche Bank projects that by early 2011, that figure will
increase to 48%. Unfortunately, as borrower equity continues to decline,
borrowers will have even less incentive to modify their loans unless
modifications include principal
reductions.
|
|
u
|
Although some
are in favor of loan modifications that include significant principal
reductions to address the negative equity issue, policy makers are
struggling to address the “moral
hazard” of appearing to reward at-risk and delinquent homeowners, while
other homeowners continue to make their payments. As foreclosures increase
and put additional pressure on housing values, we expect the debate over
loan modifications and principal reductions to be elevated. To the extent
that significant principal reductions on first lien mortgages become part
of HAMP or are implemented through other government actions, it could
undermine the value of existing RMBS (particularly RMBS backed by weaker
collateral) and cause the pricing of future mortgage credit risk to
increase.
|
|
u
|
Industry-wide,
the fourth quarter increase in the level of delinquencies continues to be
within our expectations. According to LoanPerformance, the non-agency
universe of borrowers who have missed two or more payments (60+ days) is
nearly 9% for prime borrowers and 30% for Alt-A borrowers. At Redwood, 60+
days delinquencies on loans underlying the prime RMBS we own are in line
with the industry, while 60+ days delinquencies on loans underlying the
Alt-A RMBS we own are performing better than the industry average.
|
|
u
|
According to
data from LoanPerformance, industry-wide prepayment rates on prime loans
averaged about 15% CPR for the fourth quarter, slightly slower than
prepayment rates in the third quarter. Prepayment rates on prime RMBS held
by Redwood have been modestly faster than the industry, reflecting the
concentration of securities we own in older
vintages.
|
|
28
|
THE REDWOOD
REVIEW 4TH QUARTER 2009
|
|
|
|
|
RESIDENTIAL REAL ESTATE
SECURITIES
|
|
u
|
Prepayment
speeds on many of the securities we own have generally been ahead of our
expectations from the time of acquisition. To the extent that prepayment
rates remain above our expectations, all else being equal, the yields on
our securities will increase over time as we are able to realize our
unamortized discount sooner.
|
|
u
|
Industry-wide,
prime prepayment speeds have been strongly correlated with loan age as
more seasoned loans are prepaying in the mid-to-high teens compared to
low-teens for more recent vintages.
|
|
u
|
Industry-wide,
prepayment rates for Alt-A loans were approximately 5% in the fourth
quarter according to data from LoanPerformance. The prepayment rates on
non-prime securities we own (which are predominately backed by Alt-A
loans) were modestly faster than the industry, reflecting the
concentration of our securities in older vintages. Given the more
stringent underwriting guidelines in the current environment, we expect
prepayment rates on Alt-A loans to remain at low levels.
|
|
u
|
The following
table breaks out the loans underlying the prime residential securities we
own by size, loan type, and
vintage.
|
|
Prime
Securities at Redwood
|
||||||||||||||||||||||||||||||||||||||||||||||||
|
Composition
by Product Type, Vintage, and Balance
|
||||||||||||||||||||||||||||||||||||||||||||||||
|
December
31, 2009
|
||||||||||||||||||||||||||||||||||||||||||||||||
|
<=
2004
|
2005
|
2006
|
2007
|
2008
|
Total
|
|||||||||||||||||||||||||||||||||||||||||||
|
Product
|
% of
Balance
|
Wtd Avg Loan Rate(1)
|
% of
Balance
|
Wtd Avg Loan Rate(1)
|
% of
Balance
|
Wtd Avg Loan Rate(1)
|
% of
Balance
|
Wtd Avg Loan Rate(1)
|
% of
Balance
|
Wtd Avg Loan Rate(1)
|
% of
Balance
|
Wtd Avg Loan Rate(1)
|
||||||||||||||||||||||||||||||||||||
|
Hybrid/ARM
|
26 | % | 4.00 | % | 45 | % | 5.39 | % | 32 | % | 5.93 | % | 17 | % | 6.46 | % | 10 | % | 6.13 | % | 29 | % | 4.83 | % | ||||||||||||||||||||||||
|
Fixed
|
12 | % | 5.68 | % | 2 | % | 6.04 | % | 13 | % | 6.28 | % | 44 | % | 6.38 | % | 71 | % | 6.60 | % | 14 | % | 6.00 | % | ||||||||||||||||||||||||
|
Jumbo
|
38 | % | 47 | % | 45 | % | 62 | % | 81 | % | 43 | % | ||||||||||||||||||||||||||||||||||||
|
Hybrid/ARM
|
35 | % | 4.08 | % | 51 | % | 5.46 | % | 42 | % | 5.97 | % | 7 | % | 6.42 | % | 3 | % | 6.38 | % | 36 | % | 4.78 | % | ||||||||||||||||||||||||
|
Fixed
|
27 | % | 5.64 | % | 2 | % | 6.01 | % | 14 | % | 6.25 | % | 32 | % | 6.37 | % | 17 | % | 6.46 | % | 21 | % | 5.81 | % | ||||||||||||||||||||||||
|
Conforming
|
62 | % | 53 | % | 55 | % | 38 | % | 19 | % | 57 | % | ||||||||||||||||||||||||||||||||||||
|
Totals
|
100 | % | 100 | % | 100 | % | 100 | % | 100 | % | 100 | % | ||||||||||||||||||||||||||||||||||||
|
u
|
The majority
(57%) of the loans underlying prime residential securities we own are
within the Agency conforming loan limits. These limits vary by county and
are as high as $729,750 in certain areas.
|
|
u
|
The table
above also provides the weighted average coupon rates for the respective
year of issuance and for our entire portfolio by product. For example,
within the conforming 2004 bucket, the average interest rate of the fixed
rate loans underlying our portfolio is 5.64%. In mid-February 2010, the
interest rate on a new conforming 30-year fixed rate mortgages was just
under 5.00%. Although at this rate many borrowers would appear to have an
incentive to refinance, the ability to refinance is dependent upon a
number of factors in addition to mortgage interest rates, including
loan-to-value ratios, ability to provide necessary documentation, and
employment status. As a result of these factors, we generally expect
prepayments to remain at historically slow levels.
|
|
THE REDWOOD
REVIEW 4TH QUARTER 2009
|
29
|
|
|
| RESIDENTIAL REAL ESTATE SECURITIES |
|
u
|
Interest
income generated by residential securities we own was $24 million in the
fourth quarter, an annualized yield of 14% on our amortized cost of these
securities.
|
|
u
|
At December
31, 2009, the fair value of residential securities we own totaled $771
million, consisting of $329 million in prime senior securities, $315
million in non-prime senior securities, $106 million in re-REMIC
securities, and $21 million in subordinate securities. Each of these is
further discussed below.
|
|
u
|
At December
31, 2009, the securities we held consisted of fixed-rate assets (22%),
adjustable-rate and hybrid assets that have reset to adjustable-rate
assets (22%), hybrid assets that will reset within 12 months (29%), hybrid
assets that will reset after 12 months (26%), and other
(1%).
|
|
u
|
At December
31, 2009, the investments we own in the Fund and securitization entities
consisted of fixed-rate assets (1%), adjustable-rate and hybrid assets
that have reset to adjustable-rate assets (88%), hybrid assets that will
reset within 12 months (6%), hybrid assets that will reset after 12 months
(<1%), and other
(6%).
|
|
30
|
THE REDWOOD
REVIEW 4TH QUARTER 2009
|
|
|
|
|
RESIDENTIAL REAL ESTATE
SECURITIES
|
|
u
|
Most of the
senior securities we own are from the 2005 vintage. The following table
presents information on residential prime senior securities at Redwood at
December 31, 2009.
|
|
Credit
Support Analysis - Prime Senior Securities at Redwood
|
||||||||||||||||||||
|
By
Vintage
|
||||||||||||||||||||
|
December
31, 2009
|
||||||||||||||||||||
|
($
in millions)
|
||||||||||||||||||||
|
<=2004
|
2005
|
2006
|
2007
|
Total
|
||||||||||||||||
|
Current
face
|
$ | 17 | $ | 306 | $ | 17 | $ | 71 | $ | 411 | ||||||||||
|
Net
unamortized discount
|
(4 | ) | (90 | ) | (5 | ) | (16 | ) | (115 | ) | ||||||||||
|
Credit
reserve
|
- | (6 | ) | - | (5 | ) | (11 | ) | ||||||||||||
|
Unrealized
gains (losses)
|
1 | 38 | (2 | ) | 7 | 44 | ||||||||||||||
|
Fair
value of AFS Prime Senior Securities
|
$ | 14 | $ | 248 | $ | 10 | $ | 57 | $ | 329 | ||||||||||
|
Overall credit
support to Prime Senior Securities (1)
|
10.87 | % | 7.34 | % | 6.29 | % | 7.68 | % | 7.55 | % | ||||||||||
|
Serious
delinquencies as a % of collateral balance (1)
|
7.83 | % | 6.83 | % | 7.85 | % | 6.40 | % | 6.78 | % | ||||||||||
|
u
|
The overall
credit support data presented in the table above represents the level of
support for prime securities owned by Redwood. At December 31, 2009, the
overall level of credit support was 7.55%, which means that losses in the
aggregate would have to exceed this amount of the current face amount of
the securities before Redwood would suffer losses. However, some
securities have either more or less credit support than others, so it is
possible for some securities to incur losses without aggregate losses
exceeding 7.55%. For example, in the fourth quarter we incurred
losses of $1 million on senior securities, even though aggregate losses
did not exceed 7.55%. Over time, the performance of these securities may
require a change in the amount of credit reserves we designate. We acquire
securities assuming a range of outcomes and believe our returns can still
be attractive even if losses increase above our current
estimates.
|
|
u
|
Comparing the
level of credit support available to seriously delinquent loans provides a
measure of the level of credit sensitivity that exists within our senior
securities portfolio. For example, the senior securities have 7.55% of
credit support with serious delinquencies currently at 6.78%. Assuming a
historically high 50% loss severity on these delinquencies would produce
losses of 3.39%, leaving enough credit support for an additional 4.16% of
losses before the senior securities would start to absorb credit
losses.
|
|
THE REDWOOD
REVIEW 4TH QUARTER 2009
|
31
|
|
|
| RESIDENTIAL REAL ESTATE SECURITIES |
|
u
|
Most of the
non-prime senior securities we own are from 2005 and prior vintages. The
following table presents information on residential non-prime senior
securities at Redwood at December 31,
2009.
|
|
Credit
Support Analysis - Non-Prime Senior Securities at
Redwood
|
||||||||||||||||||||
|
By
Vintage
|
||||||||||||||||||||
|
December
31, 2009
|
||||||||||||||||||||
|
($
in millions)
|
||||||||||||||||||||
|
<=2004
|
2005
|
2006
|
2007
|
Total
|
||||||||||||||||
|
Current
face
|
$ | 146 | $ | 253 | $ | 23 | $ | 2 | $ | 424 | ||||||||||
|
Net
unamortized discount
|
(42 | ) | (82 | ) | (10 | ) | - | (134 | ) | |||||||||||
|
Credit
reserve
|
(1 | ) | (12 | ) | - | - | (13 | ) | ||||||||||||
|
Unrealized
gains (losses)
|
15 | 18 | (1 | ) | - | 32 | ||||||||||||||
|
Fair
value of Non-Prime Senior Securities (AFS)
|
$ | 118 | $ | 177 | $ | 12 | $ | 2 | $ | 309 | ||||||||||
|
Overall credit
support to Non-Prime Senior Securities(1)
|
15.42 | % | 20.07 | % | 34.56 | % | 4.27 | % | 19.14 | % | ||||||||||
|
Serious
delinquencies as a % of collateral balance(1)
|
10.51 | % | 15.39 | % | 19.37 | % | 6.24 | % | 14.29 | % | ||||||||||
|
Fair
value of Non-Prime Senior Securities (trading)
|
$ | - | $ | 6 | $ | - | $ | - | $ | 6 | ||||||||||
|
Total
fair value of Non-Prime Senior Securities
|
$ | 118 | $ | 183 | $ | 12 | $ | 2 | $ | 315 | ||||||||||
|
u
|
Serious
delinquencies in our non-prime senior portfolio are significantly higher
than in our prime senior portfolio. However, the levels of credit and
structural support are also significantly higher and, as a result, our
non-prime senior portfolio is able to withstand the higher levels
of credit losses we expect to incur on these pools.
|
|
32
|
THE REDWOOD
REVIEW 4TH QUARTER 2009
|
|
|
|
|
RESIDENTIAL REAL ESTATE
SECURITIES
|
|
u
|
The following
table presents information on residential re-REMIC support securities at
Redwood at December 31,
2009.
|
|
Credit
Support Analysis - Re-REMIC Support Securities at
Redwood
|
||||||||||||||||||||
|
By
Vintage
|
||||||||||||||||||||
|
December
31, 2009
|
||||||||||||||||||||
|
($
in millions)
|
||||||||||||||||||||
|
<=2004
|
2005
|
2006
|
2007
|
Total
|
||||||||||||||||
|
Current
face
|
$ | 10 | $ | 33 | $ | 179 | $ | 35 | $ | 257 | ||||||||||
|
Net
unamortized discount
|
(6 | ) | (19 | ) | (70 | ) | (16 | ) | (111 | ) | ||||||||||
|
Credit
reserve
|
(1 | ) | (6 | ) | (66 | ) | (9 | ) | (82 | ) | ||||||||||
|
Unrealized
gains
|
1 | 5 | 32 | 4 | 42 | |||||||||||||||
|
Fair
value of AFS re-REMIC Support Securities
|
$ | 4 | $ | 13 | $ | 75 | $ | 14 | $ | 106 | ||||||||||
|
Overall credit
support to re-REMIC support securities (1)
|
8.99 | % | 10.64 | % | 4.90 | % | 6.48 | % | 7.37 | % | ||||||||||
|
Serious
delinquencies as a % of collateral
balance (1)
|
4.12 | % | 4.45 | % | 4.94 | % | 5.61 | % | 5.06 | % | ||||||||||
|
u
|
In the first
quarter through February 15, 2010, we sold $44 million of re-REMIC support
securities, primarily from the 2006 vintage, at prices in excess of GAAP
carrying value at December 31, 2009.
|
|
THE REDWOOD
REVIEW 4TH QUARTER 2009
|
33
|
|
|
| RESIDENTIAL REAL ESTATE SECURITIES |
|
u
|
The table
below presents the components of fair value (which equals GAAP carrying
value) of residential subordinate securities at Redwood at December 31,
2009.
|
|
Residential
Subordinate Securities at Redwood
|
||||||||||||
|
December
31, 2009
|
||||||||||||
|
($
in millions)
|
||||||||||||
|
Vintage
|
||||||||||||
|
<=2004
|
>=2005
|
Total
|
||||||||||
|
Available for
sale (AFS)
|
||||||||||||
|
Current
face
|
$ | 200 | $ | 220 | $ | 420 | ||||||
|
Credit
reserve
|
(157 | ) | (196 | ) | (353 | ) | ||||||
|
Net
unamortized discount
|
(15 | ) | (8 | ) | (23 | ) | ||||||
|
Amortized
cost
|
28 | 16 | 44 | |||||||||
|
Unrealized
gains
|
1 | 1 | 2 | |||||||||
|
Unrealized
losses
|
(15 | ) | (11 | ) | (26 | ) | ||||||
|
Fair
value of AFS subordinate securities
|
$ | 14 | $ | 6 | $ | 20 | ||||||
|
Fair
value of trading subordinate securities
|
1 | - | 1 | |||||||||
|
Total
fair value of subordinate securities
|
$ | 15 | $ | 6 | $ | 21 | ||||||
|
u
|
Credit losses
totaled $98 million in our residential subordinate portfolio in the fourth
quarter, a modest increase from $97 million in the third quarter of 2009.
We expect future losses will extinguish the large majority of the
securities in the 2005 and later category as reflected by the $196 million
of credit reserves we have provided for on the $220 million face value of
those securities. We expect losses on the securities in the 2004 and
earlier category will also be high based on our level of reserves to face
value, but we expect to recover some principal over time. Until then, we
will continue to earn interest on the face value of those securities.
|
|
u
|
Due to the
structure of RMBS, once losses in a pool of mortgages exceed our
investment in that pool, we cannot suffer additional losses as our
potential loss is capped at our investment in the securities in that
pool.
|
|
34
|
THE REDWOOD
REVIEW 4TH QUARTER 2009
|
|
|
 |
|
COMMERCIAL
REAL ESTATE SECURITIES
|
|
u
|
Due to
generally deteriorating fundamentals, all participants in the commercial
real estate markets must confront the reality of declining property
valuations, more conservative underwriting, lower advance rates, and fewer
providers of capital.
|
|
u
|
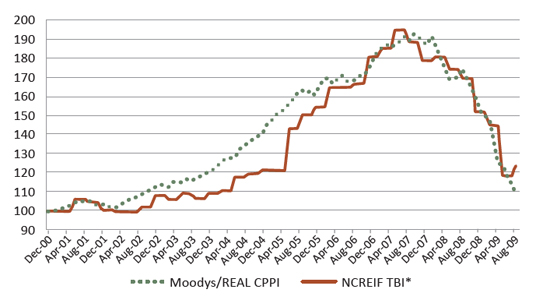
The chart
below shows the dramatic rise and fall of commercial real estate prices
since December 2000. In our opinion, it is still too early in the cycle to
be seduced by lower prices, as prices may decline
further.
|
|
u
|
Among other
factors, lower valuations and deleveraging have reduced the pipeline of
sales and financing transactions to historically low levels. As an
example, commercial real estate sales were down about 65% in 2009 as
compared to 2008, according to Real Capital
Analytics.
|
|
u
|
We generally
classify the existing commercial market into three distinct sectors: 1)
GOOD: high quality, stabilized assets that have been appropriately
revalued; 2) BAD: over-levered assets that have yet to establish new
valuation baselines and still face both operational and capital structure
risks; and, 3) UGLY: those assets where property fundamentals are under
extreme pressure, where the borrowers and lenders are uncertain of what
actions to take in the face of current market conditions, and where few
investors are willing to engage in refinancing transactions (outside of
opportunistic capital providers who have considerable patience and
operational infrastructure). Redwood’s current focus in the commercial
sector is squarely on the “GOOD” sector, where we will look for
opportunities to provide financing to bridge funding gaps that may arise
as owners refinance their maturing commercial real estate
loans.
|
|
THE REDWOOD
REVIEW 4TH QUARTER 2009
|
35
|
|
|
|
|
COMMERCIAL
REAL ESTATE
SECURITIES
|
|
u
|
The diagram
below shows the hypothetical capital structure that could be used to
refinance a maturing commercial real estate loan. In particular, the
diagram illustrates the funding gap that could result from the combination
of a reduced property value, a lower loan-to-value (LTV) ratio resulting
from more conservative underwriting by senior lenders, and the infusion of
new equity in an amount limited to 15% - 20% of the current value of the
property.
|
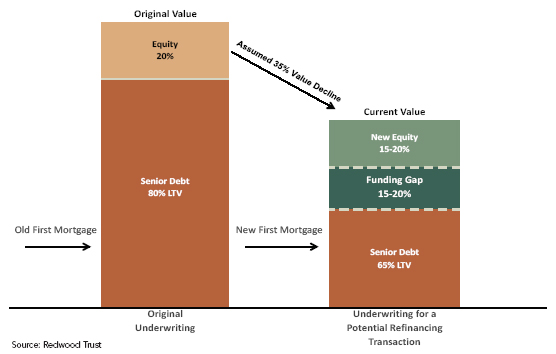
|
u
|
Providing
financing to fill the funding gap in the example illustrated above
represents one type of investment opportunity that Redwood plans to
evaluate as an opportunity for investment in commercial real estate credit
risk as a subordinate debt provider, mezzanine lender, or investor in
preferred equity.
|
|
u
|
Our legacy
portfolio of commercial securities (acquired prior to 2008) generated $1
million of cash flow during the fourth quarter, down from $3 million in
the third quarter. The decline in cash flow is attributable to the sale of
some of our securities during the quarter, as well as increasing
delinquencies in our portfolio, reducing cash
receipts.
|
|
u
|
In early
October, we sold the majority of our 2006 and 2007 vintage CMBS and
generated proceeds of $8 million.
|
|
u
|
Our remaining
investments in commercial securities consist of predominantly 2004 and
2005 subordinate bonds with a fair market value of $9 million. These
securities have a face value of $159 million and credit reserves of $146
million.
|
|
u
|
Realized
credit losses on our commercial subordinate securities of $11 million were
charged against our designated credit reserve in the fourth quarter of
2009.
|
|
36
|
THE REDWOOD
REVIEW 4TH QUARTER 2009
|
|
|
 |
|
INVESTMENTS
IN SECURITIZATION ENTITIES
|
|
u
|
Cash
generated by our investments in Sequoia and Acacia entities totaled $10
million in the fourth quarter of 2009 compared to $11 million in the third
quarter of 2009. The majority ($9 million) of this cash flow was generated
from Sequoia IOs we own, which were primarily issued in 2005 and earlier.
|
|
u
|
In the fourth
quarter, we reported GAAP income of $5 million from the Sequoia and Acacia
entities. This was an increase from the $3 million reported in the third
quarter due to a reduction in loan loss provision expense and lower
negative market valuation adjustments.
|
|
u
|
Since 1996,
Redwood has sponsored 46 Sequoia securitizations of prime residential
mortgage loans with aggregate original balances in excess of $33 billion.
The majority of the loans in these securitizations (95%) were ARMs and the
remaining were hybrid loans. Most of the securitizations (41) occurred in
2005 and earlier, and thus, the majority of the loans in these pools were
originated in 2005 and
earlier.
|
|
u
|
Our
investments in consolidated securitization entities do not appear on our
balance sheet as assets; rather, they are reflected as the difference
between the consolidated assets of Sequoia and Acacia entities ($4.2
billion at December 31, 2009) and the consolidated Sequoia and Acacia ABS
issued to third parties ($4.1 billion at December 31, 2009). The assets
and liabilities of consolidated Sequoia entities are carried on our
consolidated balance sheet at their amortized cost and the assets and
liabilities of consolidated Acacia entities are carried on our balance
sheet at their fair market values. At December 31, 2009, the GAAP book
value of Redwood’s investments in Sequoia and Acacia entities was $75
million, or 8% of our reported book
value.
|
|
u
|
The reported
book value of our investments in Sequoia and Acacia entities differs from
the $46 million estimated fair value of our investments in these
securitization entities, which consists of $41 million of IOs issued by
Sequoia entities, $2 million of senior and subordinate securities issued
by Sequoia entities, and a $3 million investment in Acacia entities
(derived from expected future management fees discounted at 45%).
|
|
u
|
The
consolidation of the assets and liabilities of securitization entities may
lead to potentially volatile reported earnings for a variety of reasons
including the amortization of premium on the loans and liabilities of
Sequoia entities, changes in credit loss provisions for loans held by
Sequoia entities, fair value adjustments for the assets and liabilities of
the Acacia entities, and deconsolidation events. Each of these factors
could cause income reported from these entities to vary significantly from
quarter to quarter.
|
|
THE REDWOOD
REVIEW 4TH QUARTER 2009
|
37
|
|
|
|
|
INVESTMENTS
IN SECURITIZATION
ENTITIES
|
|
u
|
Our Sequoia
IOs have significant prepayment risk. These IOs earn the “spread” between
the coupon rate on the $2.4 billion notional amount of underlying
adjustable-rate mortgage (ARM) loans and the cost of funds (indexed to
one-month LIBOR) on the ABS issued within each respective securitization
entity. Since these IOs do not receive any principal cash flows, the
longer they receive this interest rate spread, the higher the return.
Thus, slower rates of principal repayments (i.e., the longer a loan is
outstanding) increase cash flows and
returns.
|
|
u
|
Prepayment
speeds remain low, averaging less than 10% CPR for the fourth consecutive
quarter for the underlying loans in the Sequoia entities. In December
2009, these loans had a weighted average coupon of 2.20%. Given the
current very low coupon rates, we expect prepayment speeds on these loans
to remain low, which is positive for the future cash flow generation from
our IO investments.
|
|
u
|
In 2009, the
cash flow and earnings from our Sequoia IOs benefitted from the
historically large difference between six-month LIBOR (which is the index
on the majority of the loans underlying our IOs) and one-month LIBOR
(which is the index on the majority of the debt issued by these entities).
Over the past year, this spread has decreased and we do not anticipate
having this same benefit to our cash flow in future periods.
|
|
u
|
For the $29.6
billion in prime residential loan securitizations we sponsored in 2005 and
earlier, credit losses to date have totaled $26 million, or 0.09% (nine
basis points) of original balance. As of December 31, 2009, seriously
delinquent (over 90 days past due, in foreclosure, or REO) loans held in
these Sequoia entities totaled $122 million, or 0.4% of the original
balance and 4.3% of the outstanding balance. While we still expect
additional losses on these loans, we believe their credit
performance will remain better than anticipated at the time of
securitization.
|
|
u
|
The $3.6
billion of Sequoia securitizations that we sponsored in 2006 and 2007 have
not performed as well as Sequoia securitizations we sponsored before 2006.
To date, these pools have incurred $39 million of credit losses, or 1.1%
of original balance. As of December 31, 2009, seriously delinquent loans
held in these Sequoia entities totaled $264 million, or 7.3% of the
original balance and 11.2% of the outstanding balance. To date, credit
losses have not yet been incurred on any of the senior
securities issued by Sequoia entities in these securitizations,
although a few of these senior securities may incur losses in the future,
depending on the magnitude and timing of additional credit losses incurred
by the underlying
loans.
|
|
u
|
The
information provided in the preceding two paragraphs reflects all the
prime residential Sequoia securitizations, regardless of whether we are
currently consolidating the assets and liabilities for the specific
Sequoia entity as of the end of 2009. Thus, delinquency information
presented herein will differ from information provided regarding Sequoia
entities included in our consolidated balance sheet as of December 31,
2009.
|
|
38
|
THE REDWOOD
REVIEW 4TH QUARTER 2009
|

 |
|
|
ACCOUNTING
DISCUSSION
|
|
u
|
Establishing market values is
inherently subjective and requires us to make a number of assumptions,
including the future of interest rates, prepayment rates, discount rates,
credit loss rates, and the timing of credit losses. The assumptions we
apply are specific to each asset or liability. Market values reflect an
“exit price,” or the amount we believe we would realize if we sold an
asset or would pay if we repurchased a liability in an orderly
transaction, even though we generally have no intention to sell assets or
repurchase liabilities.
|
|
u
|
Although we rely on our
internal calculations to compute the fair value of our securities, we
request and consider indications of value (marks) from third-party dealers
to assist us in our mark-to-market valuation process. For December 31,
2009, we received dealer marks on 83% of our assets and 93% of our
liabilities. In the aggregate, our internal valuations of the securities
on which we received dealer marks were 3% lower (i.e., more conservative)
than the dealer marks and our internal valuations of our ABS issued on
which we received dealer marks were 9% higher (i.e., more conservative)
than the dealer marks.
|
|
40
|
THE REDWOOD
REVIEW 4TH QUARTER 2009
|
|
|
|
|
ACCOUNTING
DISCUSSION
|
|
u
|
As discussed in our second
quarter 2009 Redwood Review, on April 1, 2009, we were required to adopt a
new accounting principle affecting the determination of
other-than-temporary impairment (OTTI) and its recognition through the
income statement and balance sheet. The revised process is presented
below. Upon adoption, we made a one-time retained earnings
reclassification of $60 million of prior impairments. As a result of this
reclassification, our book value did not change. Under the new accounting
principle, as this impairment is recovered over time, rather than flow
through earnings (where the impairment was originally reported), it will
instead be credited to equity. The net impact is that our future
cumulative reported earnings will now be $60 million less than it would
have been prior to adopting this required accounting principle. We
estimate that most of these earnings would have been recognized in 2009
through 2011.
|
|
u
|
Accounting for negative
changes in the fair value of AFS securities in any period requires a
multi-step process involving quantitative and judgmental evaluations. The
following diagram outlines the process for determining the amount of
impairments and what portion flows through our income statement and what
portion flows through our balance
sheet.
|
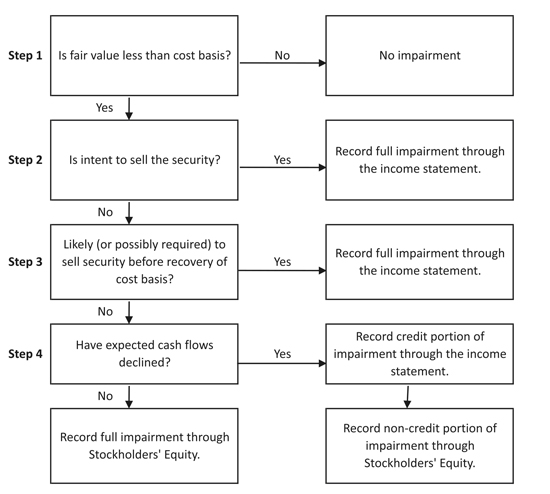
|
THE REDWOOD
REVIEW 4TH QUARTER 2009
|
41
|
 |
|
|
GLOSSARY
|
|
42
|
THE REDWOOD
REVIEW 4TH QUARTER 2009
|
|
|
|
|
GLOSSARY
|
|
THE REDWOOD
REVIEW 4TH QUARTER 2009
|
43
|
|
|
|
|
GLOSSARY
|
|
44
|
THE REDWOOD
REVIEW 4TH QUARTER 2009
|
|
|
|
|
GLOSSARY
|
|
THE REDWOOD
REVIEW 4TH QUARTER 2009
|
45
|
|
|
|
|
GLOSSARY
|
|
46
|
THE REDWOOD
REVIEW 4TH QUARTER 2009
|
|
|
|
|
GLOSSARY
|
|
THE REDWOOD
REVIEW 4TH QUARTER 2009
|
47
|
|
|
|
|
GLOSSARY
|
|
48
|
THE REDWOOD
REVIEW 4TH QUARTER 2009
|
|
|
Table
1: GAAP Earnings ($ in thousands, except per share
data)
|
50
|
|
Twelve
|
Twelve
|
|||||||||||||||||||||||||||||||||||||||||||
|
2009
|
2009
|
2009
|
2009
|
2008
|
2008
|
2008
|
2008
|
2007
|
Months
|
Months
|
||||||||||||||||||||||||||||||||||
|
Q4
|
Q3
|
Q2
|
Q1
|
Q4
|
Q3
|
Q2
|
Q1
|
Q4
|
2009
|
2008
|
||||||||||||||||||||||||||||||||||
|
Interest
income
|
$ | 57,717 | $ | 64,424 | $ | 74,332 | $ | 83,903 | $ | 124,452 | $ | 126,227 | $ | 140,444 | $ | 171,978 | $ | 193,728 | $ | 280,376 | $ | 563,101 | ||||||||||||||||||||||
|
Discount
amortization on securities, net
|
7,432 | 9,575 | 3,864 | 4,917 | (1,189 | ) | 7,850 | 6,258 | 10,864 | 18,869 | 25,788 | 23,783 | ||||||||||||||||||||||||||||||||
|
Other
investment interest income
|
12 | 25 | 54 | 76 | 572 | 487 | 514 | 732 | 984 | 167 | 2,305 | |||||||||||||||||||||||||||||||||
|
Premium
amortization expense on loans
|
(3,365 | ) | (3,642 | ) | (3,988 | ) | (7,459 | ) | (548 | ) | (3,372 | ) | (10,215 | ) | (7,509 | ) | (6,656 | ) | (18,454 | ) | (21,644 | ) | ||||||||||||||||||||||
|
Total
interest income
|
61,796 | 70,382 | 74,262 | 81,437 | 123,287 | 131,192 | 137,001 | 176,065 | 206,925 | 287,877 | 567,545 | |||||||||||||||||||||||||||||||||
|
Interest
expense on short-term debt
|
- | - | - | - | (2 | ) | (65 | ) | (68 | ) | (183 | ) | (377 | ) | - | (318 | ) | |||||||||||||||||||||||||||
|
Interest
expense on ABS
|
(17,930 | ) | (22,071 | ) | (36,066 | ) | (44,517 | ) | (94,431 | ) | (88,294 | ) | (93,993 | ) | (123,431 | ) | (147,799 | ) | (120,584 | ) | (400,149 | ) | ||||||||||||||||||||||
|
ABS
issuance expense amortization
|
(575 | ) | (570 | ) | (586 | ) | (553 | ) | (1,470 | ) | (930 | ) | (1,921 | ) | (2,093 | ) | (4,644 | ) | (2,284 | ) | (6,414 | ) | ||||||||||||||||||||||
|
ABS
interest rate agreement (expense) income
|
(1,123 | ) | (1,123 | ) | (1,111 | ) | (1,098 | ) | (1,934 | ) | (1,259 | ) | (1,246 | ) | (1,245 | ) | 1,265 | (4,455 | ) | (5,684 | ) | |||||||||||||||||||||||
|
ABS
issuance premium amortization income
|
223 | 234 | 313 | 335 | 476 | 557 | 1,955 | 2,183 | 1,930 | 1,105 | 5,171 | |||||||||||||||||||||||||||||||||
|
Total
ABS expense consolidated from trusts
|
(19,405 | ) | (23,530 | ) | (37,450 | ) | (45,833 | ) | (97,359 | ) | (89,926 | ) | (95,205 | ) | (124,586 | ) | (149,248 | ) | (126,218 | ) | (407,076 | ) | ||||||||||||||||||||||
|
Interest
expense on long-term debt
|
(1,167 | ) | (1,307 | ) | (1,502 | ) | (1,809 | ) | (2,345 | ) | (2,164 | ) | (2,233 | ) | (2,533 | ) | (3,055 | ) | (5,785 | ) | (9,275 | ) | ||||||||||||||||||||||
|
Net
interest income
|
41,224 | 45,545 | 35,310 | 33,795 | 23,581 | 39,037 | 39,495 | 48,763 | 54,245 | 155,874 | 150,876 | |||||||||||||||||||||||||||||||||
|
Provision
for credit reserve
|
(8,997 | ) | (9,998 | ) | (14,545 | ) | (16,033 | ) | (18,659 | ) | (18,333 | ) | (10,061 | ) | (8,058 | ) | (4,972 | ) | (49,573 | ) | (55,111 | ) | ||||||||||||||||||||||
|
Market
valuation adjustments, net
|
(4,191 | ) | (11,058 | ) | (29,135 | ) | (43,244 | ) | (111,331 | ) | (127,146 | ) | (60,496 | ) | (193,929 | ) | (1,118,989 | ) | (87,628 | ) | (492,902 | ) | ||||||||||||||||||||||
|
Net
interest income (loss) after provision and market valuation
adjustments
|
$ | 28,036 | $ | 24,489 | $ | (8,370 | ) | $ | (25,482 | ) | $ | (106,409 | ) | $ | (106,442 | ) | $ | (31,062 | ) | $ | (153,224 | ) | $ | (1,069,716 | ) | $ | 18,673 | $ | (397,137 | ) | ||||||||||||||
|
Fixed
compensation expense
|
(3,261 | ) | (3,726 | ) | (3,572 | ) | (4,028 | ) | (3,575 | ) | (4,331 | ) | (4,648 | ) | (5,674 | ) | (4,316 | ) | (14,587 | ) | (18,228 | ) | ||||||||||||||||||||||
|
Variable
compensation expense
|
(566 | ) | (5,216 | ) | (1,132 | ) | (556 | ) | 418 | (616 | ) | (330 | ) | (1,857 | ) | (434 | ) | (7,470 | ) | (2,385 | ) | |||||||||||||||||||||||
|
Equity
compensation expense
|
(1,553 | ) | (420 | ) | (2,337 | ) | (1,795 | ) | (2,378 | ) | (3,080 | ) | (3,502 | ) | (3,306 | ) | (2,767 | ) | (6,105 | ) | (12,266 | ) | ||||||||||||||||||||||
|
Severance
expense
|
- | (398 | ) | - | (28 | ) | (1,814 | ) | - | - | - | (1,340 | ) | (426 | ) | (1,814 | ) | |||||||||||||||||||||||||||
|
Other
operating expense
|
(5,453 | ) | (5,046 | ) | (3,778 | ) | (4,130 | ) | (6,104 | ) | (8,824 | ) | (5,775 | ) | (5,510 | ) | (7,412 | ) | (18,407 | ) | (26,213 | ) | ||||||||||||||||||||||
|
Total
operating expenses
|
(10,833 | ) | (14,806 | ) | (10,819 | ) | (10,537 | ) | (13,453 | ) | (16,851 | ) | (14,255 | ) | (16,347 | ) | (16,269 | ) | (46,995 | ) | (60,906 | ) | ||||||||||||||||||||||
|
Realized
gains (losses) on sales, net
|
19,618 | 17,561 | 25,525 | 462 | 5,823 | (15 | ) | 2,757 | (3 | ) | 7,199 | 63,166 | 8,562 | |||||||||||||||||||||||||||||||
|
Realized
(losses) gains on calls, net
|
- | - | - | - | - | (50 | ) | (43 | ) | 42 | (126 | ) | - | (51 | ) | |||||||||||||||||||||||||||||
|
Realized
gains (losses), net
|
19,618 | 17,561 | 25,525 | 462 | 5,823 | (65 | ) | 2,714 | 39 | 7,073 | 63,166 | 8,511 | ||||||||||||||||||||||||||||||||
|
Noncontrolling
interest
|
(143 | ) | (363 | ) | (127 | ) | 716 | 2,366 | 2,194 | (2,369 | ) | (255 | ) | - | 83 | 1,936 | ||||||||||||||||||||||||||||
|
Credit
(provision) for income taxes
|
3,612 | 247 | 514 | (105 | ) | (3,913 | ) | 9,860 | (937 | ) | (1,800 | ) | 1,467 | 4,268 | 3,210 | |||||||||||||||||||||||||||||
|
Net
income (loss)
|
$ | 40,290 | $ | 27,128 | $ | 6,723 | $ | (34,946 | ) | $ | (115,586 | ) | $ | (111,304 | ) | $ | (45,909 | ) | $ | (171,587 | ) | $ | (1,077,445 | ) | $ | 39,195 | $ | (444,386 | ) | |||||||||||||||
|
Diluted
average shares
|
78,101 | 78,223 | 66,446 | 53,632 | 33,366 | 33,334 | 32,871 | 32,511 | 29,531 | 68,991 | 33,023 | |||||||||||||||||||||||||||||||||
|
Net
income (loss) per share
|
$ | 0.51 | $ | 0.34 | $ | 0.10 | $ | (0.65 | ) | $ | (3.46 | ) | $ | (3.34 | ) | $ | (1.40 | ) | $ | (5.28 | ) | $ | (36.49 | ) | $ | 0.55 | $ | (13.46 | ) | |||||||||||||||
|
THE
REDWOOD REVIEW 4TH QUARTER 2009
|
Table
1: GAAP Earnings
|
|
|
|
Table
2: Taxable (Loss) Income and GAAP Income (Loss) Differences ($ in
thousands, except per share
data)
|
|
|
Estimated
2009
Q4(3)
|
Estimated
Twelve Months
2009
|
Actual Twelve
Months
2008
|
||||||||||||||||||||||||||||||||||
|
Taxable
|
GAAP
|
Taxable
|
GAAP
|
Taxable
|
GAAP
|
|||||||||||||||||||||||||||||||
|
Loss
|
Income
|
Differences
|
Loss
|
Income
|
Differences
|
Income
|
Loss
|
Differences
|
||||||||||||||||||||||||||||
|
Interest
income
|
$ | 39,011 | $ | 61,795 | $ | (22,784 | ) | $ | 193,106 | $ | 287,877 | $ | (94,771 | ) | $ | 201,857 | $ | 567,545 | $ | (365,688 | ) | |||||||||||||||
|
Interest
expense
|
(1,143 | ) | (20,573 | ) | 19,430 | (5,009 | ) | (132,003 | ) | 126,994 | (7,784 | ) | (416,669 | ) | 408,885 | |||||||||||||||||||||
|
Net interest
income
|
37,868 | 41,222 | (3,354 | ) | 188,097 | 155,874 | 32,223 | 194,073 | 150,876 | 43,197 | ||||||||||||||||||||||||||
|
Provision for loan
losses
|
- | (8,997 | ) | 8,997 | - | (49,573 | ) | 49,573 | - | (55,111 | ) | 55,111 | ||||||||||||||||||||||||
|
Realized credit
losses
|
(54,486 | ) | - | (54,486 | ) | (223,910 | ) | - | (223,910 | ) | (116,546 | ) | - | (116,546 | ) | |||||||||||||||||||||
|
Market valuation adjustments,
net
|
- | (4,190 | ) | 4,190 | - | (87,628 | ) | 87,628 | - | (492,902 | ) | 492,902 | ||||||||||||||||||||||||
|
Operating
expenses
|
(17,837 | ) | (10,835 | ) | (7,002 | ) | (54,237 | ) | (46,995 | ) | (7,242 | ) | (58,335 | ) | (60,906 | ) | 2,571 | |||||||||||||||||||
|
Realized gains on sales and calls,
net (1)
|
- | 19,618 | (19,618 | ) | 6,625 | 63,166 | (56,541 | ) | - | 8,511 | (8,511 | ) | ||||||||||||||||||||||||
|
(Provision for) benefit from
income taxes
|
(9 | ) | 3,613 | (3,622 | ) | (10 | ) | 4,268 | (4,278 | ) | (113 | ) | 3,210 | (3,323 | ) | |||||||||||||||||||||
|
Less: Net income attributable to
noncontrolling interest
|
- | 144 | (144 | ) | - | (83 | ) | 83 | - | (1,936 | ) | 1,936 | ||||||||||||||||||||||||
|
Taxable (loss)
income
|
$ | (34,464 | ) | $ | 40,287 | $ | (74,751 | ) | $ | (83,435 | ) | $ | 39,195 | $ | (122,630 | ) | $ | 19,079 | $ | (444,386 | ) | $ | 463,465 | |||||||||||||
|
REIT taxable (loss)
income
|
$ | (25,688 | ) | $ | (69,701 | ) | $ | 18,541 | ||||||||||||||||||||||||||||
|
Taxable (loss)
income in taxable subsidiaries
|
(8,776 | ) | (13,734 | ) | 538 | |||||||||||||||||||||||||||||||
|
Taxable (loss)
income
|
$ | (34,464 | ) | $ | (83,435 | ) | $ | 19,079 | ||||||||||||||||||||||||||||
|
Shares used for taxable EPS
calculation
|
77,737 | 71,800 | 32,283 | |||||||||||||||||||||||||||||||||
|
REIT taxable (loss) income per
share (2)
|
$ | (0.33 | ) | $ | (0.93 | ) | $ | 0.57 | ||||||||||||||||||||||||||||
|
Taxable (loss) income in taxable
subsidiaries per share
|
$ | (0.11 | ) | $ | (0.19 | ) | $ | 0.01 | ||||||||||||||||||||||||||||
|
Taxable (loss) income per
share
(2)
|
$ | (0.44 | ) | $ | (1.12 | ) | $ | 0.58 | ||||||||||||||||||||||||||||
|
THE
REDWOOD REVIEW 4TH QUARTER 2009
|
Table 2: GAAP
and Taxable (Loss) Income Differences
|
51
|
|
|
Table
3: Retention and Distribution of Taxable Income ($ in thousands, except
per share data)
|
52
|
|
Estimated
|
Actual
|
Actual
|
Estimated
|
Actual
|
||||||||||||||||||||||||||||||||||||||||
|
Twelve
|
Twelve
|
|||||||||||||||||||||||||||||||||||||||||||
|
2009
|
2009
|
2009
|
2009
|
2008
|
2008
|
2008
|
2008
|
2007
|
Months
|
Months
|
||||||||||||||||||||||||||||||||||
|
Q4
|
Q3
|
Q2
|
Q1
|
Q4
|
Q3
|
Q2
|
Q1
|
Q4
|
2009
|
2008
|
||||||||||||||||||||||||||||||||||
|
Dividends
declared
|
$ | 19,434 | $ | 19,417 | $ | 19,376 | $ | 15,057 | $ | 25,103 | $ | 24,928 | $ | 24,887 | $ | 24,532 | $ | 80,496 | $ | 73,284 | $ | 99,450 | ||||||||||||||||||||||
|
Dividend deductions on stock
issued through
|
||||||||||||||||||||||||||||||||||||||||||||
|
direct stock purchase
plan
|
6 | 2 | 2 | 30 | 45 | 165 | 288 | 192 | 2,605 | 40 | 690 | |||||||||||||||||||||||||||||||||
|
Total dividend
deductions
|
$ | 19,440 | $ | 19,419 | $ | 19,378 | $ | 15,087 | $ | 25,148 | $ | 25,093 | $ | 25,175 | $ | 24,724 | $ | 83,101 | $ | 73,324 | $ | 100,140 | ||||||||||||||||||||||
|
|
|
|
||||||||||||||||||||||||||||||||||||||||||
|
Regular dividend per
share
|
$ | 0.25 | $ | 0.25 | $ | 0.25 | $ | 0.25 | $ | 0.75 | $ | 0.75 | $ | 0.75 | $ | 0.75 | $ | 0.75 | $ | 1.00 | $ | 3.00 | ||||||||||||||||||||||
|
Special dividend per
share
|
- | - | - | - | - | - | - | - | 2.00 | - | - | |||||||||||||||||||||||||||||||||
|
Total dividends per
share
(1)
|
$ | 0.25 | $ | 0.25 | $ | 0.25 | $ | 0.25 | $ | 0.75 | $ | 0.75 | $ | 0.75 | $ | 0.75 | $ | 2.75 | $ | 1.00 | $ | 3.00 | ||||||||||||||||||||||
|
Undistributed REIT taxable income
at beginning of period (pre-tax):
|
$ | - | $ | - | $ | - | $ | - | $ | 21,128 | $ | 43,821 | $ | 64,582 | $ | 64,572 | $ | 115,548 | $ | - | $ | 64,572 | ||||||||||||||||||||||
|
REIT taxable (loss)
income (pre-tax)
|
(25,688 | ) | (24,933 | ) | (10,379 | ) | (8,701 | ) | (13,007 | ) | 2,400 | 4,414 | 24,734 | 32,125 | (69,701 | ) | 18,541 | |||||||||||||||||||||||||||
|
Dividend of 2007
income
|
- | - | - | - | (14,673 | ) | (25,175 | ) | (24,724 | ) | (83,101 | ) | - | (64,572 | ) | |||||||||||||||||||||||||||||
|
Dividend of 2008
income
|
- | - | - | - | (8,121 | ) | (10,420 | ) | - | - | - | - | (18,541 | ) | ||||||||||||||||||||||||||||||
|
Dividend of 2009
income
|
- | - | - | - | - | - | - | - | - | - | - | |||||||||||||||||||||||||||||||||
|
Undistributed REIT taxable income
(pre-tax) at period end:
|
$ | - | $ | - | $ | - | $ | - | $ | - | $ | 21,128 | $ | 43,821 | $ | 64,582 | $ | 64,572 | $ | - | $ | - | ||||||||||||||||||||||
|
Undistributed REIT taxable income
(pre-tax) at period end
|
- | - | - | |||||||||||||||||||||||||||||||||||||||||
|
From 2007
|
$ | - | $ | - | $ | - | $ | - | $ | - | $ | - | $ | 14,673 | $ | 39,848 | $ | 64,572 | $ | - | $ | - | ||||||||||||||||||||||
|
From 2008
|
- | - | - | - | - | 20,872 | 29,148 | 24,734 | - | - | - | |||||||||||||||||||||||||||||||||
|
Total
|
$ | - | $ | - | $ | $ | - | $ | - | $ | 20,872 | $ | 43,821 | $ | 64,582 | $ | 64,572 | $ | - | $ | - | |||||||||||||||||||||||
|
Shares outstanding at period
end
|
77,737 | 77,669 | 77,503 | 60,228 | 33,471 | 33,238 | 33,184 | 32,710 | 32,385 | 77,737 | 33,471 | |||||||||||||||||||||||||||||||||
|
Undistributed REIT taxable income
(pre-tax)
|
||||||||||||||||||||||||||||||||||||||||||||
|
per share outstanding at period
end
|
$ | - | $ | - | $ | - | $ | - | $ | - | $ | 0.63 | $ | 1.32 | $ | 1.97 | $ | 1.99 | $ | - | $ | - | ||||||||||||||||||||||
|
(1) Dividends in 2008
exceeded the year's taxable income plus undistributed income carried over
from prior years. Thus, the 2008 dividends included a $9.9 million
return of capital. The 2009 dividends are characterized as a return of
capital. The portion of Redwood's dividends characterized as a return of
capital is not taxable to a shareholder and reduces a shareholder's
basis for shares held at each quarterly distribution
date.
|
||||||||||||||||||||||||||||||||||||||||||||
|
THE
REDWOOD REVIEW 4TH QUARTER 2009
|
Table 3:
Retention and Distribution of Taxable Income
|
|
|
|
Table
4 : Book Value and Other Ratios ($ in millions, except per share
data)
|
|
|
2009
|
2009
|
2009
|
2009
|
2008
|
2008
|
2008
|
2008
|
January 1,
|
2007
|
|||||||||||||||||||||||||||||||
|
Q4
|
Q3
|
Q2
|
Q1
|
Q4
|
Q3
|
Q2
|
Q1
|
2008 (1)
|
Q4
|
|||||||||||||||||||||||||||||||
|
Short-term
debt
|
$ | - | $ | - | $ | - | $ | - | $ | - | $ | 7 | $ | 9 | $ | 2 | $ | 8 | $ | 8 | ||||||||||||||||||||
|
Long-term
debt
|
140 | 140 | 150 | 150 | 150 | 150 | 150 | 150 | 150 | 150 | ||||||||||||||||||||||||||||||
|
Redwood debt (2)
|
$ | 140 | $ | 140 | $ | 150 | $ | 150 | $ | 150 | $ | 157 | $ | 159 | $ | 152 | $ | 158 | $ | 158 | ||||||||||||||||||||
|
GAAP stockholders'
equity
|
$ | 972 | $ | 907 | $ | 802 | $ | 506 | $ | 302 | $ | 412 | $ | 564 | $ | 585 | $ | 751 | $ | (718 | ) | |||||||||||||||||||
|
Redwood debt to
equity
|
0.1 | x | 0.2 | x | 0.2 | x | 0.3 | x | 0.5 | x | 0.4 | x | 0.3 | x | 0.3 | x | 0.2 | x | (0.2 | )x | ||||||||||||||||||||
|
Redwood debt to (equity +
debt)
|
13 | % | 13 | % | 16 | % | 23 | % | 33 | % | 28 | % | 22 | % | 21 | % | 17 | % | -28 | % | ||||||||||||||||||||
|
Redwood
debt
|
$ | 140 | $ | 140 | $ | 150 | $ | 150 | $ | 150 | $ | 157 | $ | 159 | $ | 152 | $ | 158 | $ | 158 | ||||||||||||||||||||
|
ABS obligations of
consolidated securitization entities
|
3,943 | 4,016 | 4,185 | 4,709 | 4,855 | 6,603 | 7,110 | 7,591 | 8,839 | 10,329 | ||||||||||||||||||||||||||||||
|
GAAP
debt
|
$ | 4,083 | $ | 4,156 | $ | 4,335 | $ | 4,859 | $ | 5,005 | $ | 6,760 | $ | 7,269 | $ | 7,743 | $ | 8,997 | $ | 10,487 | ||||||||||||||||||||
|
GAAP debt to
equity
|
4.2 | x | 4.6 | x | 5.4 | x | 9.6 | x | 16.6 | x | 16.4 | x | 12.9 | x | 13.2 | x | 12.0 | x | (14.6 | )x | ||||||||||||||||||||
|
GAAP debt to (equity + GAAP
debt)
|
81 | % | 82 | % | 84 | % | 91 | % | 94 | % | 94 | % | 93 | % | 93 | % | 92 | % | 107 | % | ||||||||||||||||||||
|
GAAP stockholders'
equity
|
$ | 972 | $ | 907 | $ | 802 | $ | 506 | $ | 302 | $ | 412 | $ | 564 | $ | 585 | $ | 751 | $ | (718 | ) | |||||||||||||||||||
|
Balance sheet mark-to-market
adjustments
|
58 | 21 | (78 | ) | (85 | ) | (57 | ) | (84 | ) | (68 | ) | (93 | ) | (99 | ) | (574 | ) | ||||||||||||||||||||||
|
Core equity
(non-GAAP)
|
$ | 914 | $ | 886 | $ | 880 | $ | 591 | $ | 359 | $ | 496 | $ | 632 | $ | 678 | $ | 850 | $ | (145 | ) | |||||||||||||||||||
|
Shares outstanding at period
end
|
77,737 | 77,669 | 77,503 | 60,228 | 33,471 | 33,238 | 33,184 | 32,710 | 32,385 | 32,385 | ||||||||||||||||||||||||||||||
|
GAAP equity per
share
|
$ | 12.50 | $ | 11.68 | $ | 10.35 | $ | 8.40 | $ | 9.02 | $ | 12.40 | $ | 17.00 | $ | 17.89 | $ | 23.18 | $ | (22.18 | ) | |||||||||||||||||||
|
Adjustments: GAAP equity to economic
value (3)
|
||||||||||||||||||||||||||||||||||||||||
|
Investments in
Sequoia
|
$ | (0.37 | ) | $ | (0.37 | ) | $ | (0.35 | ) | $ | (0.15 | ) | $ | (0.95 | ) | $ | (1.65 | ) | $ | (1.96 | ) | $ | (1.65 | ) | $ | (1.45 | ) | $ | (1.45 | ) | ||||||||||
|
Investments in
Acacia
|
- | - | 0.01 | (0.03 | ) | (0.21 | ) | (0.18 | ) | (0.66 | ) | (0.58 | ) | (1.17 | ) | 44.19 | ||||||||||||||||||||||||
|
Long-term
debt
|
0.90 | 0.97 | 1.29 | 1.79 | 3.24 | 2.61 | 2.34 | 2.38 | 1.73 | 1.73 | ||||||||||||||||||||||||||||||
|
Estimate of economic value
per share (non-GAAP)
|
$ | 13.03 | $ | 12.28 | $ | 11.30 | $ | 10.01 | $ | 11.10 | $ | 13.18 | $ | 16.72 | $ | 18.04 | $ | 22.29 | $ | 22.29 | ||||||||||||||||||||
|
(1) On January 1, 2008 we elected
the fair value option for the assets and liabilities of Acacia entities
and certain other assets.
|
||||||||||||||||||||||||||||||||||||||||
|
(2) Excludes obligations of
consolidated securitization entities.
|
||||||||||||||||||||||||||||||||||||||||
|
(3) Differences between GAAP and
econcomic value per share are adjustments to reflect our estimate of the
economic value of investmenst in Sequoia and Acacia, and our long-term
debt. See pages 16 and 17.
|
||||||||||||||||||||||||||||||||||||||||
|
THE
REDWOOD REVIEW 4TH QUARTER 2009
|
Table 4: Book
Value and Other Ratios
|
53
|
|
|
Table
5 : Profitability Ratios (1) ($
in thousands)
|
54
|
|
Twelve
|
Twelve
|
|||||||||||||||||||||||||||||||||||||||||||
|
2009
|
2009
|
2009
|
2009
|
2008
|
2008
|
2008
|
2008
|
2007
|
Months
|
Months
|
||||||||||||||||||||||||||||||||||
|
Q4
|
Q3
|
Q2
|
Q1
|
Q4
|
Q3
|
Q2
|
Q1
|
Q4
|
2009
|
2008
|
||||||||||||||||||||||||||||||||||
|
Interest
income
|
$ | 61,796 | $ | 70,382 | $ | 74,262 | $ | 81,437 | $ | 123,287 | $ | 131,192 | $ | 137,001 | $ | 176,065 | $ | 206,925 | $ | 287,877 | $ | 567,545 | ||||||||||||||||||||||
|
Average consolidated earning
assets
|
$ | 5,175,337 | $ | 5,128,893 | $ | 5,325,322 | $ | 5,553,470 | $ | 7,006,592 | $ | 7,594,682 | $ | 8,137,261 | $ | 9,090,678 | $ | 11,521,330 | $ | 5,294,037 | $ | 7,962,454 | ||||||||||||||||||||||
|
Asset yield
|
4.78 | % | 5.49 | % | 5.58 | % | 5.87 | % | 7.04 | % | 6.91 | % | 6.73 | % | 7.75 | % | 7.18 | % | 5.44 | % | 7.13 | % | ||||||||||||||||||||||
|
Interest
expense
|
$ | (20,572 | ) | $ | (24,837 | ) | $ | (38,952 | ) | $ | (47,642 | ) | $ | (99,706 | ) | $ | (92,155 | ) | $ | (97,506 | ) | $ | (127,302 | ) | $ | (152,680 | ) | $ | (132,003 | ) | $ | (416,669 | ) | |||||||||||
|
Average consolidated
interest-bearing liabilities
|
$ | 4,096,928 | $ | 4,193,650 | $ | 4,651,125 | $ | 4,940,304 | $ | 6,613,677 | $ | 7,106,052 | $ | 7,499,474 | $ | 8,383,296 | $ | 10,716,433 | $ | 4,468,725 | $ | 7,397,670 | ||||||||||||||||||||||
|
Cost of
funds
|
2.01 | % | 2.37 | % | 3.35 | % | 3.86 | % | 6.03 | % | 5.19 | % | 5.20 | % | 6.07 | % | 5.70 | % | 2.95 | % | 5.63 | % | ||||||||||||||||||||||
|
Asset yield
|
4.78 | % | 5.49 | % | 5.58 | % | 5.87 | % | 7.04 | % | 6.91 | % | 6.73 | % | 7.75 | % | 7.18 | % | 5.44 | % | 7.13 | % | ||||||||||||||||||||||
|
Cost of
funds
|
(2.01 | %) | (2.37 | %) | (3.35 | %) | (3.86 | %) | (6.03 | %) | (5.19 | %) | (5.20 | %) | (6.07 | %) | (5.70 | %) | (2.95 | %) | (5.63 | %) | ||||||||||||||||||||||
|
Interest rate
spread
|
2.77 | % | 3.12 | % | 2.23 | % | 2.01 | % | 1.01 | % | 1.72 | % | 1.53 | % | 1.67 | % | 1.49 | % | 2.48 | % | 1.50 | % | ||||||||||||||||||||||
|
Net interest
income
|
$ | 41,224 | $ | 45,545 | $ | 35,310 | $ | 33,795 | $ | 23,581 | $ | 39,037 | $ | 39,495 | $ | 48,763 | $ | 54,245 | $ | 155,874 | $ | 150,876 | ||||||||||||||||||||||
|
Average consolidated earning
assets
|
$ | 5,175,337 | $ | 5,128,893 | $ | 5,325,322 | $ | 5,553,470 | $ | 7,006,592 | $ | 7,594,682 | $ | 8,137,261 | $ | 9,090,678 | $ | 11,521,330 | $ | 5,294,037 | $ | 7,962,454 | ||||||||||||||||||||||
|
Net interest
margin
|
3.19 | % | 3.55 | % | 2.65 | % | 2.43 | % | 1.35 | % | 2.06 | % | 1.94 | % | 2.15 | % | 1.88 | % | 2.94 | % | 1.89 | % | ||||||||||||||||||||||
|
Operating
expenses
|
$ | (10,833 | ) | $ | (14,806 | ) | $ | (10,819 | ) | $ | (10,537 | ) | $ | (13,453 | ) | $ | (16,851 | ) | $ | (14,255 | ) | $ | (16,347 | ) | $ | (16,269 | ) | $ | (46,995 | ) | $ | (60,906 | ) | |||||||||||
|
Average total
assets
|
$ | 5,293,887 | $ | 5,138,793 | $ | 5,315,643 | $ | 5,575,619 | $ | 7,040,306 | $ | 7,648,102 | $ | 8,203,461 | $ | 9,223,464 | $ | 10,866,153 | $ | 5,329,461 | $ | 8,026,050 | ||||||||||||||||||||||
|
Average total
equity
|
$ | 945,862 | $ | 833,227 | $ | 575,661 | $ | 556,861 | $ | 371,503 | $ | 533,755 | $ | 602,402 | $ | 720,035 | $ | 97,534 | $ | 729,032 | $ | 556,354 | ||||||||||||||||||||||
|
Operating expenses / net interest
income
|
26.28 | % | 32.51 | % | 30.64 | % | 31.18 | % | 57.05 | % | 43.17 | % | 36.09 | % | 33.52 | % | 27.52 | % | 30.15 | % | 40.37 | % | ||||||||||||||||||||||
|
Operating expenses / average total
assets
|
0.82 | % | 1.15 | % | 0.81 | % | 0.76 | % | 0.76 | % | 0.88 | % | 0.70 | % | 0.71 | % | 0.55 | % | 0.88 | % | 0.76 | % | ||||||||||||||||||||||
|
Operating expenses / average total
equity
|
4.58 | % | 7.11 | % | 7.52 | % | 7.57 | % | 14.49 | % | 12.63 | % | 9.47 | % | 9.08 | % | 61.23 | % | 6.45 | % | 10.95 | % | ||||||||||||||||||||||
|
GAAP net income
(loss)
|
$ | 40,290 | $ | 27,128 | $ | 6,723 | $ | (34,946 | ) | $ | (115,586 | ) | $ | (111,304 | ) | $ | (45,909 | ) | $ | (171,587 | ) | $ | (1,077,445 | ) | $ | 39,195 | $ | (444,386 | ) | |||||||||||||||
|
GAAP net income (loss) / average
total assets
|
3.04 | % | 2.11 | % | 0.51 | % | (2.51 | %) | (6.57 | %) | (5.82 | %) | (2.24 | %) | (7.44 | %) | (39.66 | %) | 0.74 | % | (5.54 | %) | ||||||||||||||||||||||
|
GAAP net income (loss) / average
equity (GAAP ROE)
|
17.04 | % | 13.02 | % | 4.67 | % | (25.10 | %) | (124.45 | %) | (83.41 | %) | (30.48 | %) | (95.32 | %) | (4418.75 | %) | 5.38 | % | (79.87 | %) | ||||||||||||||||||||||
|
GAAP net income (loss) / average
core equity (adjusted ROE) (2)
|
17.99 | % | 12.22 | % | 4.10 | % | (22.64 | %) | (103.09 | %) | (79.62 | %) | (28.42 | %) | (83.31 | %) | (610.31 | %) | 5.12 | % | (69.53 | %) | ||||||||||||||||||||||
|
Average core
equity
|
$ | 896,034 | $ | 888,107 | $ | 655,695 | $ | 617,325 | $ | 448,484 | $ | 559,150 | $ | 646,211 | $ | 823,843 | $ | 706,167 | $ | 765,393 | $ | 639,123 | ||||||||||||||||||||||
|
(1) All percentages in this table
are shown on an annualized basis.
|
||||||||||||||||||||||||||||||||||||||||||||
|
(2) Non-GAAP metric. Core
equity excludes accumulated other comprehensive income
(loss).
|
||||||||||||||||||||||||||||||||||||||||||||
|
THE
REDWOOD REVIEW 4TH QUARTER 2009
|
Table 5:
Profitability Ratios1
|
|
|
|
Table
6: Average Balance Sheet ($ in thousands)
|
|
|
Twelve
|
Twelve
|
|||||||||||||||||||||||||||||||||||||||
|
2009
|
2009
|
2009
|
2009
|
2008
|
2008
|
2008
|
2008
|
Months
|
Months
|
|||||||||||||||||||||||||||||||
|
Q4
|
Q3
|
Q2
|
Q1
|
Q4
|
Q3
|
Q2
|
Q1
|
2009
|
2008
|
|||||||||||||||||||||||||||||||
|
Real estate assets at
Redwood
|
||||||||||||||||||||||||||||||||||||||||
|
Senior Residential
Securities
|
||||||||||||||||||||||||||||||||||||||||
|
Prime
|
$ | 280,101 | $ | 264,773 | $ | 164,386 | $ | 77,651 | $ | 37,746 | $ | 27,880 | $ | 15,040 | $ | 663 | $ | 197,469 | $ | 14,528 | ||||||||||||||||||||
|
Non-prime
|
263,022 | 270,353 | 168,383 | 87,464 | 63,050 | 63,818 | 50,056 | 7,061 | 197,987 | 40,312 | ||||||||||||||||||||||||||||||
|
Total Senior Residential
Securities
|
543,124 | 535,126 | 332,769 | 165,114 | 100,796 | 91,698 | 65,096 | 7,724 | 395,456 | 54,839 | ||||||||||||||||||||||||||||||
|
Residential Re-REMIC
Securities
|
73,938 | 69,980 | 26,419 | - | - | - | - | - | 42,862 | - | ||||||||||||||||||||||||||||||
|
Subordinate Residential
Securities
|
||||||||||||||||||||||||||||||||||||||||
|
Prime
|
47,083 | 58,637 | 43,020 | 47,070 | 88,943 | 147,513 | 177,996 | 145,756 | 48,979 | 157,088 | ||||||||||||||||||||||||||||||
|
Non-prime
|
1,377 | 2,218 | 2,767 | 3,450 | 4,105 | 4,450 | 17,184 | 54,464 | 2,446 | 25,366 | ||||||||||||||||||||||||||||||
|
Total Subordinate Residential
Securities
|
48,460 | 60,855 | 45,787 | 50,519 | 93,048 | 151,963 | 195,180 | 200,220 | 51,425 | 182,454 | ||||||||||||||||||||||||||||||
|
Commercial subordinate
securites
|
8,090 | 13,504 | 25,006 | 46,382 | 63,969 | 98,534 | 106,314 | 183,446 | 23,114 | 129,431 | ||||||||||||||||||||||||||||||
|
Commercial
loans
|
245 | 246 | 247 | 248 | 249 | 250 | 251 | 250 | 247 | 250 | ||||||||||||||||||||||||||||||
|
Residential
loans
|
2,314 | 2,315 | 2,435 | 2,600 | 2,960 | 3,671 | 3,759 | 4,507 | 2,415 | 3,979 | ||||||||||||||||||||||||||||||
|
CDO
|
1,962 | 2,255 | 2,595 | 3,429 | 3,856 | 8,628 | 15,492 | 21,297 | 2,555 | 15,139 | ||||||||||||||||||||||||||||||
|
Other real estate
investments
|
- | - | - | - | 50 | 75 | 2,328 | 5,836 | - | 2,746 | ||||||||||||||||||||||||||||||
|
Total real estate assets at
Redwood
|
678,133 | 684,281 | 435,258 | 268,293 | 264,927 | 354,819 | 388,420 | 423,280 | 518,074 | 388,840 | ||||||||||||||||||||||||||||||
|
Earning assets at
Acacia
|
304,436 | 298,615 | 321,206 | 404,596 | 575,709 | 830,311 | 982,169 | 1,439,913 | 331,847 | 1,084,131 | ||||||||||||||||||||||||||||||
|
Earning assets at
Sequoia
|
3,767,112 | 3,864,796 | 4,305,159 | 4,568,212 | 5,966,898 | 6,170,944 | 6,483,475 | 6,895,529 | 4,123,409 | 6,516,649 | ||||||||||||||||||||||||||||||
|
Earning assets at the
Fund
|
53,990 | 57,070 | 58,054 | 62,319 | 71,792 | 75,321 | 56,183 | 33,180 | 57,833 | 54,895 | ||||||||||||||||||||||||||||||
|
Cash and cash
equivalents
|
321,838 | 279,011 | 285,680 | 310,514 | 204,246 | 229,778 | 311,052 | 402,584 | 299,236 | 314,471 | ||||||||||||||||||||||||||||||
|
Earning
assets
|
5,125,509 | 5,183,773 | 5,405,357 | 5,613,934 | 7,083,573 | 7,661,173 | 8,221,299 | 9,194,486 | 5,330,399 | 8,358,986 | ||||||||||||||||||||||||||||||
|
Balance sheet mark-to-market
adjustments
|
49,828 | (54,880 | ) | (80,035 | ) | (60,464 | ) | (76,981 | ) | (66,491 | ) | (84,038 | ) | (103,808 | ) | (36,361 | ) | (84,779 | ) | |||||||||||||||||||||
|
Earning assets - reported
value
|
5,175,337 | 5,128,893 | 5,325,322 | 5,553,470 | 7,006,592 | 7,594,682 | 8,137,261 | 9,090,678 | 5,294,037 | 8,274,207 | ||||||||||||||||||||||||||||||
|
Other
assets
|
118,550 | 9,900 | (9,680 | ) | 22,148 | 33,714 | 53,420 | 66,200 | 132,786 | 35,424 | 84,135 | |||||||||||||||||||||||||||||
|
Total
assets
|
$ | 5,293,887 | $ | 5,138,793 | $ | 5,315,643 | $ | 5,575,619 | $ | 7,040,306 | $ | 7,648,102 | $ | 8,203,461 | $ | 9,223,464 | $ | 5,329,461 | $ | 8,358,342 | ||||||||||||||||||||
|
Short-term
debt
|
$ | - | $ | - | $ | - | $ | - | $ | 975 | $ | 7,825 | $ | 4,904 | $ | 21,477 | $ | - | $ | 11,402 | ||||||||||||||||||||
|
Sequoia ABS
issued
|
3,666,201 | 3,765,292 | 4,211,937 | 4,460,951 | 5,804,702 | 6,040,634 | 6,349,661 | 6,745,556 | 4,023,203 | 6,378,617 | ||||||||||||||||||||||||||||||
|
Acacia ABS
issued
|
288,041 | 283,996 | 285,698 | 325,392 | 652,398 | 900,611 | 986,915 | 1,456,506 | 295,647 | 1,114,677 | ||||||||||||||||||||||||||||||
|
Other
liabilities
|
231,553 | 91,027 | 66,588 | 55,487 | 32,533 | (22,524 | ) | 72,870 | 126,790 | 111,589 | 59,045 | |||||||||||||||||||||||||||||
|
Long-term
debt
|
137,907 | 139,190 | 147,430 | 147,193 | 146,944 | 146,705 | 146,480 | 146,242 | 142,894 | 146,476 | ||||||||||||||||||||||||||||||
|
Total
liabilities
|
4,323,702 | 4,279,505 | 4,711,653 | 4,989,023 | 6,637,552 | 7,073,251 | 7,560,830 | 8,496,572 | 4,573,334 | 7,710,218 | ||||||||||||||||||||||||||||||
|
Noncontrolling
interest
|
24,322 | 26,061 | 28,330 | 29,735 | 31,251 | 41,096 | 40,229 | 6,858 | 27,094 | 29,394 | ||||||||||||||||||||||||||||||
|
Core equity
(non-GAAP)
|
896,034 | 888,107 | 655,695 | 617,325 | 448,484 | 600,246 | 686,440 | 823,843 | 765,393 | 703,510 | ||||||||||||||||||||||||||||||
|
Accumulated other comprehensive
income (loss)
|
49,829 | (54,880 | ) | (80,035 | ) | (60,464 | ) | (76,981 | ) | (66,491 | ) | (84,038 | ) | (103,808 | ) | (36,360 | ) | (84,779 | ) | |||||||||||||||||||||
|
Total
equity
|
945,863 | 833,227 | 575,661 | 556,861 | 371,503 | 533,755 | 602,402 | 720,035 | 729,033 | 618,731 | ||||||||||||||||||||||||||||||
|
Total liabilities and
equity
|
$ | 5,293,887 | $ | 5,138,793 | $ | 5,315,643 | $ | 5,575,619 | $ | 7,040,306 | $ | 7,648,102 | $ | 8,203,461 | $ | 9,223,464 | $ | 5,329,461 | $ | 8,358,342 | ||||||||||||||||||||
|
THE
REDWOOD REVIEW 4TH QUARTER 2009
|
Table 6:
Average Balance Sheet
|
55
|
|
|
Table
7 - Balances & Yields by Securities Portfolio at Redwood ($ in
thousands)
|
56
|
|
2009
|
2009
|
2009
|
2009
|
2008
|
2009
|
2009
|
2009
|
2009
|
2008
|
|||||||||||||||||||||||||||||||||
|
Q4
|
Q3
|
Q2
|
Q1
|
Q4
|
Q4
|
Q3
|
Q2
|
Q1 | Q4 | |||||||||||||||||||||||||||||||||
|
Residential Prime
Senior
|
Residential Non-Prime
Subordinate
|
|||||||||||||||||||||||||||||||||||||||||
|
Current
face
|
$ | 412,471 | $ | 431,289 | $ | 276,444 | $ | 160,009 | $ | 90,256 |
Current
face
|
$ | 86,802 | $ | 158,613 | $ | 230,404 | $ | 327,766 | $ | 452,327 | |||||||||||||||||||||
|
Unamortized
discount
|
(116,801 | ) | (124,295 | ) | (91,221 | ) | (64,884 | ) | (41,980 | ) |
Unamortized
discount
|
(14,863 | ) | (16,556 | ) | (18,846 | ) | (19,512 | ) | (29,092 | ) | |||||||||||||||||||||
|
Credit
reserve
|
(9,898 | ) | (11,069 | ) | (3,486 | ) | (621 | ) | - |
Credit
reserve
|
(70,806 | ) | (140,046 | ) | (208,839 | ) | (305,422 | ) | (419,194 | ) | ||||||||||||||||||||||
|
Unrealized gains
(losses)
|
43,436 | 40,734 | 1,729 | (6,738 | ) | 2,689 |
Unrealized gains
(losses)
|
162 | (806 | ) | 473 | 1,705 | 3,272 | |||||||||||||||||||||||||||||
|
Fair value
|
$ | 329,208 | $ | 336,659 | $ | 183,466 | $ | 87,766 | $ | 50,965 |
Fair value
|
$ | 1,295 | $ | 1,205 | $ | 3,192 | $ | 4,537 | $ | 7,313 | |||||||||||||||||||||
|
Average amortized
cost
|
$ | 280,101 | $ | 264,773 | $ | 164,386 | $ | 77,651 | $ | 37,746 |
Average amortized
cost
|
$ | 1,377 | $ | 2,218 | $ | 2,767 | $ | 3,450 | $ | 4,105 | |||||||||||||||||||||
|
Interest
income
|
$ | 8,610 | $ | 8,431 | $ | 5,475 | $ | 2,798 | $ | 992 |
Interest
income
|
$ | 359 | $ | 1,271 | $ | 2,086 | $ | 6,315 | $ | 5,283 | |||||||||||||||||||||
|
Annualized
yield
|
12.30 | % | 12.74 | % | 13.32 | % | 14.41 | % | 10.51 | % |
Annualized
yield
|
104.23 | % | 229.25 | % | 301.61 | % | 732.26 | % | 514.79 | % | |||||||||||||||||||||
|
Residential Non-Prime
Senior
|
Commercial
Subordinate
|
|||||||||||||||||||||||||||||||||||||||||
|
Current
face
|
$ | 430,698 | $ | 403,675 | $ | 396,135 | $ | 182,851 | $ | 108,871 |
Current
face
|
$ | 158,997 | $ | 486,245 | $ | 506,746 | $ | 512,117 | $ | 514,169 | |||||||||||||||||||||
|
Unamortized
discount
|
(134,649 | ) | (137,899 | ) | (141,761 | ) | (77,193 | ) | (50,687 | ) |
Unamortized (discount)
premium
|
(5,130 | ) | (1,624 | ) | (120 | ) | 13,798 | 35,069 | |||||||||||||||||||||||
|
Credit
reserve
|
(13,468 | ) | (10,098 | ) | (16,009 | ) | (4,159 | ) | (3,827 | ) |
Credit
reserve
|
(146,018 | ) | (471,957 | ) | (492,459 | ) | (497,784 | ) | (497,047 | ) | |||||||||||||||||||||
|
Unrealized gains
(losses)
|
32,371 | 23,322 | (7,410 | ) | (27,116 | ) | (11,537 | ) |
Unrealized gains
(losses)
|
1,351 | 4,169 | 1,502 | (5,216 | ) | (9,701 | ) | ||||||||||||||||||||||||||
|
Fair value
|
$ | 314,952 | $ | 279,000 | $ | 230,955 | $ | 74,383 | $ | 42,820 |
Fair value
|
$ | 9,200 | $ | 16,833 | $ | 15,669 | $ | 22,915 | $ | 42,490 | |||||||||||||||||||||
|
Average amortized
cost
|
$ | 263,022 | $ | 270,353 | $ | 168,383 | $ | 87,464 | $ | 63,050 |
Average amortized
cost
|
$ | 8,090 | $ | 13,504 | $ | 25,006 | $ | 46,382 | $ | 63,969 | |||||||||||||||||||||
|
Interest
income
|
$ | 8,489 | $ | 10,513 | $ | 6,737 | $ | 3,311 | $ | 1,590 |
Interest
income
|
$ | 1,233 | $ | 2,192 | $ | 1,599 | $ | 500 | $ | (1,000 | ) | ||||||||||||||||||||
|
Annualized
yield
|
12.91 | % | 15.55 | % | 16.00 | % | 15.14 | % | 10.09 | % |
Annualized
yield
|
60.97 | % | 64.93 | % | 25.58 | % | 4.31 | % | -6.25 | % | |||||||||||||||||||||
|
Residential
Re-REMIC
|
CDO
Subordinate
|
|||||||||||||||||||||||||||||||||||||||||
|
Current
face
|
$ | 255,975 | $ | 318,703 | $ | 236,070 | $ | - | - |
Current
face
|
$ | 35,371 | $ | 35,344 | $ | 35,311 | $ | 35,277 | $ | 38,405 | ||||||||||||||||||||||
|
Unamortized
discount
|
(109,807 | ) | (144,351 | ) | (134,621 | ) | - | - |
Unamortized
discount
|
(20,521 | ) | (19,632 | ) | (19,460 | ) | (19,086 | ) | (18,319 | ) | |||||||||||||||||||||||
|
Credit
reserve
|
(81,726 | ) | (94,626 | ) | (45,874 | ) | - | - |
Credit
reserve
|
(13,628 | ) | (13,600 | ) | (13,568 | ) | (13,534 | ) | (16,476 | ) | |||||||||||||||||||||||
|
Unrealized gains
(losses)
|
41,509 | 13,781 | (434 | ) | - | - |
Unrealized
gains
|
25 | 25 | 25 | - | - | ||||||||||||||||||||||||||||||
|
Fair value
|
$ | 105,951 | $ | 93,507 | $ | 55,141 | $ | - | - |
Fair value
|
$ | 1,247 | $ | 2,137 | $ | 2,308 | $ | 2,657 | $ | 3,610 | ||||||||||||||||||||||
| - | - | |||||||||||||||||||||||||||||||||||||||||
|
Average amortized
cost
|
$ | 73,938 | $ | 69,980 | $ | 26,419 | $ | - | - |
Average amortized
cost
|
$ | 1,962 | $ | 2,255 | $ | 2,595 | $ | 25 | $ | 3,931 | ||||||||||||||||||||||
|
Interest
income
|
$ | 2,941 | $ | 3,110 | $ | 573 | $ | - | - |
Interest
income
|
$ | 138 | $ | 73 | $ | 163 | $ | 10 | $ | 376 | ||||||||||||||||||||||
|
Annualized
yield
|
15.91 | % | 17.77 | % | 8.67 | % | - | - |
Annualized
yield
|
28.24 | % | 12.97 | % | 25.09 | % | 153.66 | % | 38.21 | % | |||||||||||||||||||||||
|
Residential Prime
Subordinate
|
Note on annualized yields: Cash
flows from our investments can be very sporadic and, to
some
|
|||||||||||||||||||||||||||||||||||||||||
|
Current
face
|
$ | 348,678 | $ | 379,276 | $ | 412,052 | $ | 419,631 | $ | 448,943 |
extent, unexpected. The fair
value of some assets is close to zero and any interest income results
in unusally high reported yields
that are not sustainable.
|
|||||||||||||||||||||||||||||||
|
Unamortized
discount
|
(22,099 | ) | (22,979 | ) | (28,545 | ) | (87,421 | ) | (90,582 | ) |
|
|||||||||||||||||||||||||||||||
|
Credit
reserve
|
(282,813 | ) | (306,728 | ) | (319,653 | ) | (291,592 | ) | (308,447 | ) | ||||||||||||||||||||||||||||||||
|
Unrealized
losses
|
(24,256 | ) | (27,643 | ) | (37,112 | ) | (11,606 | ) | (6,127 | ) | ||||||||||||||||||||||||||||||||
|
Fair value
|
$ | 19,510 | $ | 21,926 | $ | 26,742 | $ | 29,012 | $ | 43,787 | ||||||||||||||||||||||||||||||||
|
Average amortized
cost
|
$ | 47,083 | $ | 58,637 | $ | 43,020 | $ | 47,070 | $ | 88,943 | ||||||||||||||||||||||||||||||||
|
Interest
income
|
$ | 3,533 | $ | 4,299 | $ | 3,907 | $ | 8,220 | $ | 8,185 | ||||||||||||||||||||||||||||||||
|
Annualized
yield
|
30.02 | % | 29.33 | % | 36.32 | % | 69.85 | % | 36.81 | % | ||||||||||||||||||||||||||||||||
|
THE
REDWOOD REVIEW 4TH QUARTER 2009
|
Table 7:
Balances & Yields by Securities Portfolio at Redwood
|
|
|
|
Table
8: Securities Portfolio Activity at Redwood ($ in
thousands)
|
|
|
2009
|
2009
|
2009
|
2009
|
2008
|
2009
|
2009
|
2009
|
2009
|
2008
|
|||||||||||||||||||||||||||||||||
|
Q4
|
Q3 | Q2 | Q1 | Q4 | Q4 | Q3 | Q2 | Q1 | Q4 | |||||||||||||||||||||||||||||||||
|
Residential Prime
Senior
|
Residential Real Estate
Loans
|
|||||||||||||||||||||||||||||||||||||||||
|
Beginning fair
value
|
$ | 336,659 | $ | 183,466 | $ | 87,766 | $ | 50,965 | $ | 21,395 |
Beginning fair
value
|
$ | 2,299 | $ | 2,336 | $ | 2,577 | $ | 2,624 | $ | 3,150 | |||||||||||||||||||||
|
Acquisitions
|
27,607 | 134,738 | 120,982 | 49,107 | 35,866 |
Principal
payments
|
(30 | ) | (28 | ) | (185 | ) | (27 | ) | (40 | ) | ||||||||||||||||||||||||||
|
Sales
|
(24,104 | ) | (5,091 | ) | (35,713 | ) | - | - |
Premium
amortization
|
- | - | - | - | - | ||||||||||||||||||||||||||||
|
Effect of principal
payments
|
(13,632 | ) | (13,121 | ) | (6,499 | ) | (2,337 | ) | (347 | ) |
Transfers to
REO
|
- | - | - | - | (14 | ) | |||||||||||||||||||||||||
|
Change in fair value,
net
|
2,678 | 36,667 | 16,930 | (9,969 | ) | (5,949 | ) |
Changes in fair value,
net
|
105 | (9 | ) | (56 | ) | (20 | ) | (472 | ) | |||||||||||||||||||||||||
|
Ending fair
value
|
$ | 329,208 | $ | 336,659 | $ | 183,466 | $ | 87,766 | $ | 50,965 |
Ending fair
value
|
$ | 2,374 | $ | 2,299 | $ | 2,336 | $ | 2,577 | $ | 2,624 | |||||||||||||||||||||
|
Residential Non-Prime
Senior
|
Commercial
Subordinate
|
|||||||||||||||||||||||||||||||||||||||||
|
Beginning fair
value
|
$ | 279,000 | $ | 230,955 | $ | 74,383 | $ | 42,820 | $ | 48,246 |
Beginning fair
value
|
$ | 16,833 | $ | 15,669 | $ | 22,915 | $ | 42,490 | $ | 63,686 | |||||||||||||||||||||
|
Acquisitions
|
37,157 | 84,837 | 162,745 | 48,444 | 10,419 |
Acquisitions
|
- | - | - | - | - | |||||||||||||||||||||||||||||||
|
Sales
|
- | (56,299 | ) | (14,613 | ) | (373 | ) | (867 | ) |
Sales
|
(4,778 | ) | - | - | - | - | ||||||||||||||||||||||||||
|
Effect of principal
payments
|
(10,214 | ) | (11,083 | ) | (5,128 | ) | (1,573 | ) | (549 | ) |
Effect of principal
payments
|
- | - | - | - | - | ||||||||||||||||||||||||||
|
Change in fair value,
net
|
9,009 | 30,590 | 13,568 | (14,935 | ) | (14,429 | ) |
Change in fair value,
net
|
(2,855 | ) | 1,164 | (7,246 | ) | (19,575 | ) | (21,196 | ) | |||||||||||||||||||||||||
|
Ending fair
value
|
$ | 314,952 | $ | 279,000 | $ | 230,955 | $ | 74,383 | $ | 42,820 |
Ending fair
value
|
$ | 9,200 | $ | 16,833 | $ | 15,669 | $ | 22,915 | $ | 42,490 | |||||||||||||||||||||
|
Re-REMIC
|
Commercial Real Estate
Loans
|
|||||||||||||||||||||||||||||||||||||||||
|
Beginning fair
value
|
$ | 93,507 | $ | 55,141 | $ | - | $ | - | $ | - |
Beginning fair
value
|
$ | 246 | $ | 247 | $ | 248 | $ | 249 | $ | 250 | |||||||||||||||||||||
|
Acquisitions
|
3,367 | 25,073 | 55,562 | - | - |
Principal
payments
|
(2 | ) | (2 | ) | (2 | ) | (2 | ) | (2 | ) | ||||||||||||||||||||||||||
|
Sales
|
(17,368 | ) | - | - | - | - |
Discount
amortization
|
1 | 1 | 1 | 1 | 1 | ||||||||||||||||||||||||||||||
|
Effect of principal
payments
|
- | - | - | - | - |
Credit
provision
|
- | - | - | - | - | |||||||||||||||||||||||||||||||
|
Change in fair value,
net
|
26,445 | 13,293 | (421 | ) | - | - |
Changes in fair value,
net
|
- | - | - | - | - | ||||||||||||||||||||||||||||||
|
Ending fair
value
|
$ | 105,951 | $ | 93,507 | $ | 55,141 | $ | - | $ | - |
Ending fair
value
|
$ | 245 | $ | 246 | $ | 247 | $ | 248 | $ | 249 | |||||||||||||||||||||
|
Residential Prime
Subordinate
|
CDO
Subordinate
|
|||||||||||||||||||||||||||||||||||||||||
|
Beginning fair
value
|
$ | 21,926 | $ | 26,742 | $ | 29,012 | $ | 43,787 | $ | 86,272 |
Beginning fair
value
|
$ | 2,137 | $ | 2,308 | $ | 2,657 | $ | 3,610 | $ | 4,065 | |||||||||||||||||||||
|
Acquisitions
|
- | 1,390 | 1,829 | - | - |
Acquisitions
|
- | - | - | - | - | |||||||||||||||||||||||||||||||
|
Sales
|
- | (1,409 | ) | - | - | - |
Sales
|
- | - | - | - | - | ||||||||||||||||||||||||||||||
|
Effect of principal
payments
|
(526 | ) | (880 | ) | (1,050 | ) | (946 | ) | (1,311 | ) |
Effect of principal
payments
|
- | - | - | (37 | ) | (69 | ) | ||||||||||||||||||||||||
|
Change in fair value,
net
|
(1,890 | ) | (3,917 | ) | (3,049 | ) | (13,829 | ) | (41,174 | ) |
Change in fair value,
net
|
(890 | ) | (171 | ) | (349 | ) | (916 | ) | (386 | ) | |||||||||||||||||||||
|
Ending fair
value
|
$ | 19,510 | $ | 21,926 | $ | 26,742 | $ | 29,012 | $ | 43,787 |
Ending fair
value
|
$ | 1,247 | $ | 2,137 | $ | 2,308 | $ | 2,657 | $ | 3,610 | |||||||||||||||||||||
|
Residential Non-Prime
Subordinate
|
||||||||||||||||||||||||||||||||||||||||||
|
Beginning fair
value
|
$ | 1,205 | $ | 3,192 | $ | 4,537 | $ | 7,313 | $ | 5,073 | ||||||||||||||||||||||||||||||||
|
Acquisitions
|
- | - | - | - | 3,630 | |||||||||||||||||||||||||||||||||||||
|
Sales
|
- | - | - | - | - | |||||||||||||||||||||||||||||||||||||
|
Effect of principal
payments
|
(25 | ) | (38 | ) | (67 | ) | (98 | ) | (148 | ) | ||||||||||||||||||||||||||||||||
|
Change in fair value,
net
|
115 | (1,949 | ) | (1,278 | ) | (2,678 | ) | (1,242 | ) | |||||||||||||||||||||||||||||||||
|
Ending fair
value
|
$ | 1,295 | $ | 1,205 | $ | 3,192 | $ | 4,537 | $ | 7,313 | ||||||||||||||||||||||||||||||||
|
THE
REDWOOD REVIEW 4TH QUARTER 2009
|
Table 8:
Securities Portfolio Activity at Redwood
|
57
|
|
|
Table
9 A: Residential Prime Securities at Redwood and Underlying Loan
Characteristics ($ in thousands)
|
58
|
|
2009
|
2009
|
2009
|
2009
|
2008
|
2009
|
2009
|
2009
|
2009
|
2008
|
|||||||||||||||||||||||||||||||||
| Q4 | Q3 | Q2 | Q1 | Q4 | Q4 | Q3 | Q2 | Q1 | Q4 | |||||||||||||||||||||||||||||||||
|
Residential Senior
Prime
|
||||||||||||||||||||||||||||||||||||||||||
|
Principal
value
|
$ | 412,471 | $ | 431,289 | $ | 276,444 | $ | 160,009 | $ | 90,256 |
Southern CA
|
25 | % | 27 | % | 24 | % | 24 | % | 24 | % | |||||||||||||||||||||
|
Unamortized
discount
|
(116,801 | ) | (124,295 | ) | (91,221 | ) | (64,884 | ) | (41,980 | ) |
Northern CA
|
22 | % | 20 | % | 23 | % | 23 | % | 22 | % | |||||||||||||||||||||
|
Credit
reserve
|
(9,898 | ) | (11,069 | ) | (3,486 | ) | (621 | ) | - |
New York
|
7 | % | 6 | % | 7 | % | 7 | % | 7 | % | ||||||||||||||||||||||
|
Unrealized gain
(loss)
|
43,436 | 40,734 | 1,729 | (6,738 | ) | 2,689 |
Florida
|
6 | % | 7 | % | 5 | % | 5 | % | 5 | % | |||||||||||||||||||||||||
|
Fair value
|
$ | 329,208 | $ | 336,659 | $ | 183,466 | $ | 87,766 | $ | 50,965 |
Virginia
|
4 | % | 2 | % | 4 | % | 4 | % | 4 | % | |||||||||||||||||||||
|
Fair value / principal
value
|
80 | % | 78 | % | 66 | % | 55 | % | 56 | % |
New Jersey
|
3 | % | 3 | % | 3 | % | 3 | % | 3 | % | |||||||||||||||||||||
|
Illinois
|
3 | % | 2 | % | 3 | % | 3 | % | 3 | % | ||||||||||||||||||||||||||||||||
|
Security
Type
|
Georgia
|
2 | % | 2 | % | 2 | % | 2 | % | 2 | % | |||||||||||||||||||||||||||||||
|
ARM
|
$ | - | $ | - | $ | - | $ | - | $ | - |
Texas
|
2 | % | 3 | % | 2 | % | 2 | % | 3 | % | |||||||||||||||||||||
|
Hybrid
|
298,245 | 306,402 | 175,940 | 86,282 | 48,805 |
Arizona
|
2 | % | 2 | % | 2 | % | 2 | % | 2 | % | ||||||||||||||||||||||||||
|
Fixed
|
30,963 | 30,257 | 7,526 | 1,484 | 2,160 |
Colorado
|
2 | % | 4 | % | 2 | % | 2 | % | 2 | % | ||||||||||||||||||||||||||
|
Total fair
value
|
$ | 329,208 | $ | 336,659 | $ | 183,466 | $ | 87,766 | $ | 50,965 |
Other
states
|
22 | % | 22 | % | 23 | % | 23 | % | 23 | % | |||||||||||||||||||||
|
Residential Senior
Prime
|
Wtd Avg Original
LTV
|
68 | % | 68 | % | 68 | % | 68 | % | 68 | % | |||||||||||||||||||||||||||||||
|
Coupon
income
|
$ | 5,057 | $ | 4,743 | $ | 3,066 | $ | 1,733 | $ | 749 |
Original LTV: 0 -
50
|
13 | % | 13 | % | 13 | % | 13 | % | 13 | % | |||||||||||||||||||||
|
Discount
amortization
|
3,553 | 3,688 | 2,410 | 1,128 | 243 |
Original LTV: 50.01 -
60
|
11 | % | 12 | % | 12 | % | 12 | % | 12 | % | ||||||||||||||||||||||||||
|
Total interest
income
|
$ | 8,610 | $ | 8,431 | $ | 5,476 | $ | 2,861 | $ | 992 |
Original LTV: 60.01 -
70
|
22 | % | 22 | % | 22 | % | 22 | % | 22 | % | |||||||||||||||||||||
|
Original LTV: 70.01 -
80
|
50 | % | 50 | % | 49 | % | 49 | % | 49 | % | ||||||||||||||||||||||||||||||||
|
Average amortized
cost
|
$ | 280,101 | $ | 264,773 | $ | 164,386 | $ | 77,651 | $ | 37,746 |
Original LTV: 80.01 -
90
|
2 | % | 2 | % | 2 | % | 2 | % | 3 | % | |||||||||||||||||||||
|
Original LTV: 90.01 -
100
|
1 | % | 1 | % | 1 | % | 1 | % | 1 | % | ||||||||||||||||||||||||||||||||
|
Coupon income
%
|
7.22 | % | 7.17 | % | 7.46 | % | 8.93 | % | 7.94 | % |
Unknown
|
1 | % | 0 | % | 1 | % | 1 | % | 0 | % | |||||||||||||||||||||
|
Discount amortization
%
|
5.07 | % | 5.57 | % | 5.86 | % | 5.81 | % | 2.58 | % | ||||||||||||||||||||||||||||||||
|
Annualized
yield
|
12.30 | % | 12.74 | % | 13.32 | % | 14.74 | % | 10.51 | % |
Wtd Avg
FICO
|
740 | 740 | 741 | 741 | 741 | ||||||||||||||||||||||||||
|
FICO: <=
600
|
0 | % | 0 | % | 0 | % | 0 | % | 0 | % | ||||||||||||||||||||||||||||||||
|
Residential Subordinate
Prime
|
FICO: 601 -
620
|
0 | % | 0 | % | 0 | % | 0 | % | 0 | % | |||||||||||||||||||||||||||||||
|
Principal
value
|
$ | 348,678 | $ | 379,276 | $ | 412,052 | $ | 419,631 | $ | 448,943 |
FICO: 621 -
640
|
1 | % | 1 | % | 1 | % | 1 | % | 1 | % | |||||||||||||||||||||
|
Unamortized
discount
|
(22,099 | ) | (22,979 | ) | (28,545 | ) | (87,421 | ) | (90,582 | ) |
FICO: 641 -
660
|
2 | % | 2 | % | 2 | % | 2 | % | 2 | % | |||||||||||||||||||||
|
Credit
reserve
|
(282,813 | ) | (306,728 | ) | (319,653 | ) | (291,592 | ) | (308,447 | ) |
FICO: 661 -
680
|
5 | % | 5 | % | 5 | % | 5 | % | 5 | % | |||||||||||||||||||||
|
Unrealized
loss
|
(24,256 | ) | (27,643 | ) | (37,112 | ) | (11,606 | ) | (6,127 | ) |
FICO: 681 -
700
|
9 | % | 9 | % | 9 | % | 9 | % | 8 | % | |||||||||||||||||||||
|
Fair value
|
$ | 19,510 | $ | 21,926 | $ | 26,742 | $ | 29,012 | $ | 43,787 |
FICO: 701 -
720
|
14 | % | 14 | % | 13 | % | 13 | % | 13 | % | |||||||||||||||||||||
|
Fair value / principal
value
|
6 | % | 6 | % | 6 | % | 7 | % | 10 | % |
FICO: 721 -
740
|
14 | % | 14 | % | 14 | % | 14 | % | 14 | % | |||||||||||||||||||||
|
FICO: 741 -
760
|
16 | % | 16 | % | 16 | % | 16 | % | 16 | % | ||||||||||||||||||||||||||||||||
|
Security
Type
|
FICO: 761 -
780
|
19 | % | 19 | % | 19 | % | 19 | % | 19 | % | |||||||||||||||||||||||||||||||
|
ARM
|
$ | 1,202 | $ | 1,301 | $ | 1,413 | $ | 1,736 | $ | 2,580 |
FICO: 781 -
800
|
14 | % | 14 | % | 15 | % | 15 | % | 15 | % | |||||||||||||||||||||
|
Hybrid
|
13,028 | 14,780 | 18,544 | 20,325 | 32,482 |
FICO: >=
801
|
4 | % | 4 | % | 4 | % | 4 | % | 4 | % | ||||||||||||||||||||||||||
|
Fixed
|
5,280 | 5,845 | 6,785 | 6,951 | 8,725 |
Unknown
|
2 | % | 2 | % | 2 | % | 2 | % | 3 | % | ||||||||||||||||||||||||||
|
Total fair
value
|
$ | 19,510 | $ | 21,926 | $ | 26,742 | $ | 29,012 | $ | 43,787 | ||||||||||||||||||||||||||||||||
|
Conforming % (1)
|
58 | % | 59 | % | 59 | % | 60 | % | 61 | % | ||||||||||||||||||||||||||||||||
|
Residential Subordinate
Prime
|
> $1 MM
%
|
9 | % | 8 | % | 8 | % | 8 | % | 8 | % | |||||||||||||||||||||||||||||||
|
Coupon
income
|
$ | 3,972 | $ | 4,698 | $ | 5,155 | $ | 5,615 | $ | 6,219 | ||||||||||||||||||||||||||||||||
|
(Premium) discount
amortization
|
(439 | ) | (399 | ) | (1,248 | ) | 2,887 | 1,966 |
2nd Home %
|
7 | % | 7 | % | 7 | % | 7 | % | 6 | % | |||||||||||||||||||||||
|
Total interest
income
|
$ | 3,533 | $ | 4,299 | $ | 3,907 | $ | 8,502 | $ | 8,185 |
Investment Home
%
|
2 | % | 2 | % | 2 | % | 1 | % | 1 | % | |||||||||||||||||||||
|
Average amortized
cost
|
$ | 47,083 | $ | 58,637 | $ | 43,020 | $ | 47,070 | $ | 88,943 | ||||||||||||||||||||||||||||||||
|
Purchase
|
44 | % | 44 | % | 44 | % | 44 | % | 44 | % | ||||||||||||||||||||||||||||||||
|
Coupon income
%
|
33.74 | % | 32.05 | % | 47.93 | % | 47.72 | % | 27.97 | % |
Cash Out
Refi
|
22 | % | 22 | % | 21 | % | 21 | % | 21 | % | |||||||||||||||||||||
|
(Premium) discount amortization
%
|
-3.73 | % | -2.72 | % | -11.61 | % | 24.53 | % | 8.84 | % |
Rate-Term
Refi
|
33 | % | 33 | % | 34 | % | 34 | % | 35 | % | |||||||||||||||||||||
|
Annualized
yield
|
30.02 | % | 29.33 | % | 36.32 | % | 72.25 | % | 36.81 | % |
Construction
|
0 | % | 0 | % | 0 | % | 0 | % | 0 | % | |||||||||||||||||||||
|
Other
|
1 | % | 1 | % | 1 | % | 1 | % | 0 | % | ||||||||||||||||||||||||||||||||
|
Underlying Prime
Loan
Characteristics
|
||||||||||||||||||||||||||||||||||||||||||
|
Full Doc
|
55 | % | 55 | % | 56 | % | 55 | % | 55 | % | ||||||||||||||||||||||||||||||||
|
Number of
loans
|
168,449 | 184,849 | 201,789 | 216,362 | 237,131 |
No Doc
|
5 | % | 5 | % | 4 | % | 4 | % | 4 | % | ||||||||||||||||||||||||||
|
Total loan
face
|
$ | 76,332,218 | $ | 84,519,707 | $ | 92,121,182 | $ | 98,573,943 | $ | 107,131,216 |
Other Doc (Lim, Red, Stated,
etc)
|
37 | % | 37 | % | 37 | % | 38 | % | 38 | % | |||||||||||||||||||||
|
Average loan
size
|
$ | 453 | $ | 457 | $ | 457 | $ | 456 | $ | 452 |
Unknown/Not
Categorized
|
3 | % | 3 | % | 3 | % | 3 | % | 3 | % | |||||||||||||||||||||
|
Year 2008
origination
|
1 | % | 0 | % | 0 | % | 0 | % | 0 | % |
2-4 Family
|
2 | % | 1 | % | 1 | % | 1 | % | 1 | % | |||||||||||||||||||||
|
Year 2007
origination
|
10 | % | 9 | % | 9 | % | 9 | % | 9 | % |
Condo
|
10 | % | 10 | % | 10 | % | 10 | % | 10 | % | |||||||||||||||||||||
|
Year 2006
origination
|
12 | % | 12 | % | 12 | % | 14 | % | 14 | % |
Single
Family
|
87 | % | 88 | % | 88 | % | 88 | % | 87 | % | |||||||||||||||||||||
|
Year 2005
origination
|
19 | % | 20 | % | 19 | % | 17 | % | 17 | % |
Other
|
1 | % | 1 | % | 1 | % | 1 | % | 2 | % | |||||||||||||||||||||
|
Year 2004 origination and
earlier
|
58 | % | 59 | % | 60 | % | 60 | % | 60 | % | ||||||||||||||||||||||||||||||||
|
(1) The definition of a conforming
loan has significantly changed over time. For all periods shown in
this table, the conforming loan definition available in Febuary 2009 was
used (which had a maximum loan balance of
$729,750).
|
||||||||||||||||||||||||||||||||||||||||||
|
(2) Only the loan groups providing
direct cash flow to securities we own are included.
|
||||||||||||||||||||||||||||||||||||||||||
|
THE
REDWOOD REVIEW 4TH QUARTER 2009
|
Table 9A:
Residential Prime Securities at Redwood and Underlying Loan
Characteristics
|
|
|
|
Table
9 B: Residential Non-Prime Securities at Redwood and Underlying Loan
Characteristics ($ in thousands)
|
|
|
2009
|
2009
|
2009
|
2009
|
2008
|
2009
|
2009
|
2009
|
2009
|
2008
|
|||||||||||||||||||||||||||||||||
| Q4 | Q3 | Q2 | Q1 | Q4 | Q4 | Q3 | Q2 | Q1 | Q4 | |||||||||||||||||||||||||||||||||
|
Residential Senior
Non-Prime
|
||||||||||||||||||||||||||||||||||||||||||
|
Principal
value
|
$ | 430,698 | $ | 403,675 | $ | 396,135 | $ | 182,851 | $ | 108,871 |
Southern CA
|
25 | % | 26 | % | 25 | % | 27 | % | 30 | % | |||||||||||||||||||||
|
Unamortized
discount
|
(134,649 | ) | (137,899 | ) | (141,761 | ) | (77,193 | ) | (50,687 | ) |
Northern CA
|
18 | % | 16 | % | 18 | % | 19 | % | 22 | % | |||||||||||||||||||||
|
Credit
reserve
|
(13,468 | ) | (10,098 | ) | (16,009 | ) | (4,159 | ) | (3,827 | ) |
Florida
|
8 | % | 9 | % | 9 | % | 10 | % | 10 | % | |||||||||||||||||||||
|
Unrealized gain
(loss)
|
32,371 | 23,322 | (7,410 | ) | (27,116 | ) | (11,537 | ) |
New York
|
5 | % | 5 | % | 5 | % | 5 | % | 4 | % | |||||||||||||||||||||||
|
Fair value
|
$ | 314,952 | $ | 279,000 | $ | 230,955 | $ | 74,383 | $ | 42,820 |
New Jersey
|
4 | % | 2 | % | 4 | % | 4 | % | 3 | % | |||||||||||||||||||||
|
Fair value / principal
value
|
73 | % | 69 | % | 58 | % | 41 | % | 39 | % |
Arizona
|
3 | % | 4 | % | 3 | % | 3 | % | 3 | % | |||||||||||||||||||||
|
Virginia
|
3 | % | 2 | % | 3 | % | 3 | % | 3 | % | ||||||||||||||||||||||||||||||||
|
Security
Type
|
Georgia
|
2 | % | 3 | % | 2 | % | 1 | % | 1 | % | |||||||||||||||||||||||||||||||
|
ARM
|
$ | 2,015 | $ | - | $ | - | $ | - | $ | - |
Texas
|
2 | % | 2 | % | 2 | % | 1 | % | 1 | % | |||||||||||||||||||||
|
Option ARM
|
26,004 | 25,747 | 18,586 | 17,796 | 23,820 |
Illinois
|
2 | % | 2 | % | 2 | % | 3 | % | 2 | % | ||||||||||||||||||||||||||
|
Hybrid
|
160,494 | 154,998 | 158,886 | 50,616 | 13,519 |
Colorado
|
2 | % | 3 | % | 2 | % | 2 | % | 2 | % | ||||||||||||||||||||||||||
|
Fixed
|
126,439 | 98,255 | 53,483 | 5,971 | 5,481 |
Other
states
|
26 | % | 26 | % | 25 | % | 22 | % | 19 | % | ||||||||||||||||||||||||||
|
Total fair
value
|
$ | 314,952 | $ | 279,000 | $ | 230,955 | $ | 74,383 | $ | 42,820 | ||||||||||||||||||||||||||||||||
|
Wtd Avg Original
LTV
|
73 | % | 74 | % | 74 | % | 74 | % | 74 | % | ||||||||||||||||||||||||||||||||
|
Residential Senior
Non-Prime
|
Original LTV: 0 -
50
|
5 | % | 5 | % | 5 | % | 5 | % | 5 | % | |||||||||||||||||||||||||||||||
|
Coupon
income
|
$ | 4,000 | $ | 4,156 | $ | 2,871 | $ | 1,251 | $ | 879 |
Original LTV: 50.01 -
60
|
8 | % | 7 | % | 7 | % | 7 | % | 7 | % | |||||||||||||||||||||
|
Discount
amortization
|
4,489 | 6,357 | 3,865 | 2,194 | 711 |
Original LTV: 60.01 -
70
|
19 | % | 17 | % | 17 | % | 18 | % | 19 | % | ||||||||||||||||||||||||||
|
Total interest
income
|
$ | 8,489 | $ | 10,513 | $ | 6,736 | $ | 3,445 | $ | 1,590 |
Original LTV: 70.01 -
80
|
59 | % | 59 | % | 59 | % | 60 | % | 59 | % | |||||||||||||||||||||
|
Original LTV: 80.01 -
90
|
6 | % | 8 | % | 8 | % | 7 | % | 7 | % | ||||||||||||||||||||||||||||||||
|
Average amortized
cost
|
$ | 263,022 | $ | 270,353 | $ | 168,383 | $ | 87,464 | $ | 63,050 |
Original LTV: 90.01 -
100
|
3 | % | 4 | % | 4 | % | 3 | % | 3 | % | |||||||||||||||||||||
|
Unknown
|
0 | % | 0 | % | 0 | % | 0 | % | 0 | % | ||||||||||||||||||||||||||||||||
|
Coupon income
%
|
6.08 | % | 6.15 | % | 6.82 | % | 5.72 | % | 5.58 | % | ||||||||||||||||||||||||||||||||
|
Discount amortization
%
|
6.83 | % | 9.41 | % | 9.18 | % | 10.03 | % | 4.51 | % |
Wtd Avg
FICO
|
712 | 707 | 705 | 705 | 706 | ||||||||||||||||||||||||||
|
Annualized
yield
|
12.91 | % | 15.55 | % | 16.00 | % | 15.75 | % | 10.09 | % |
FICO: <=
600
|
1 | % | 2 | % | 2 | % | 2 | % | 3 | % | |||||||||||||||||||||
|
FICO: 601 -
620
|
2 | % | 2 | % | 3 | % | 3 | % | 3 | % | ||||||||||||||||||||||||||||||||
|
Residential Subordinate
Non-Prime
|
FICO: 621 -
640
|
4 | % | 5 | % | 5 | % | 5 | % | 5 | % | |||||||||||||||||||||||||||||||
|
Principal
value
|
$ | 86,802 | $ | 86,802 | $ | 230,404 | $ | 327,766 | $ | 452,327 |
FICO: 641 -
660
|
7 | % | 8 | % | 8 | % | 8 | % | 7 | % | |||||||||||||||||||||
|
Unamortized
discount
|
(14,863 | ) | (14,863 | ) | (18,846 | ) | (19,512 | ) | (29,092 | ) |
FICO: 661 -
680
|
12 | % | 13 | % | 12 | % | 12 | % | 12 | % | |||||||||||||||||||||
|
Credit
reserve
|
(70,806 | ) | (70,806 | ) | (208,839 | ) | (305,422 | ) | (419,194 | ) |
FICO: 681 -
700
|
15 | % | 15 | % | 16 | % | 16 | % | 16 | % | |||||||||||||||||||||
|
Unrealized (loss)
gain
|
162 | 162 | 473 | 1,705 | 3,272 |
FICO: 701 -
720
|
15 | % | 14 | % | 14 | % | 14 | % | 14 | % | ||||||||||||||||||||||||||
|
Fair value
|
$ | 1,295 | $ | 1,295 | $ | 3,192 | $ | 4,537 | $ | 7,313 |
FICO: 721 -
740
|
13 | % | 12 | % | 12 | % | 12 | % | 13 | % | |||||||||||||||||||||
|
Fair value / principal
value
|
1 | % | 1 | % | 1 | % | 1 | % | 2 | % |
FICO: 741 -
760
|
11 | % | 11 | % | 11 | % | 11 | % | 11 | % | |||||||||||||||||||||
|
FICO: 761 -
780
|
10 | % | 9 | % | 9 | % | 9 | % | 9 | % | ||||||||||||||||||||||||||||||||
|
Security
Type
|
FICO: 781 -
800
|
7 | % | 6 | % | 5 | % | 5 | % | 5 | % | |||||||||||||||||||||||||||||||
|
Option ARM
|
$ | 1,061 | $ | 907 | $ | 2,639 | $ | 3,618 | $ | 5,082 |
FICO: >=
801
|
2 | % | 2 | % | 2 | % | 2 | % | 2 | % | |||||||||||||||||||||
|
Hybrid
|
234 | 293 | 400 | 571 | 1,307 |
Unknown
|
1 | % | 1 | % | 1 | % | 1 | % | 0 | % | ||||||||||||||||||||||||||
|
Fixed
|
- | 5 | 153 | 348 | 924 | |||||||||||||||||||||||||||||||||||||
|
Total fair
value
|
$ | 1,295 | $ | 1,205 | $ | 3,192 | $ | 4,537 | $ | 7,313 |
Conforming % (1)
|
76 | % | 74 | % | 71 | % | 62 | % | 60 | % | |||||||||||||||||||||
|
> $1 MM
%
|
9 | % | 9 | % | 10 | % | 17 | % | 19 | % | ||||||||||||||||||||||||||||||||
|
Residential Subordinate
Non-Prime
|
||||||||||||||||||||||||||||||||||||||||||
|
Coupon
income
|
$ | 701 | $ | 1,128 | $ | 2,318 | $ | 5,779 | $ | 4,503 |
2nd Home %
|
5 | % | 5 | % | 5 | % | 7 | % | 7 | % | |||||||||||||||||||||
|
(Premium) discount
amortization
|
(342 | ) | 143 | (703 | ) | 553 | 780 |
Investment Home
%
|
9 | % | 8 | % | 8 | % | 7 | % | 7 | % | ||||||||||||||||||||||||
|
Total interest
income
|
$ | 359 | $ | 1,271 | $ | 1,615 | $ | 6,332 | $ | 5,283 | ||||||||||||||||||||||||||||||||
|
Average amortized
cost
|
$ | 1,377 | $ | 2,218 | $ | 2,767 | $ | 3,450 | $ | 4,105 |
Purchase
|
40 | % | 40 | % | 41 | % | 37 | % | 35 | % | |||||||||||||||||||||
|
Cash Out
Refi
|
42 | % | 42 | % | 42 | % | 44 | % | 46 | % | ||||||||||||||||||||||||||||||||
|
Coupon income
%
|
203.65 | % | 203.50 | % | 335.10 | % | 670.16 | % | 438.78 | % |
Rate-Term
Refi
|
17 | % | 17 | % | 16 | % | 19 | % | 19 | % | |||||||||||||||||||||
|
Discount (premium) amortization
%
|
-99.42 | % | 25.74 | % | -101.60 | % | 64.12 | % | 76.00 | % |
Construction
|
0 | % | 0 | % | 0 | % | 0 | % | 0 | % | |||||||||||||||||||||
|
Annualized
yield
|
104.23 | % | 229.25 | % | 233.50 | % | 734.28 | % | 514.79 | % |
Other
|
1 | % | 1 | % | 1 | % | 0 | % | 0 | % | |||||||||||||||||||||
|
Underlying Non-Prime
Loan
Characteristics
|
Full Doc
|
34 | % | 34 | % | 32 | % | 27 | % | 24 | % | |||||||||||||||||||||||||||||||
|
No Doc
|
2 | % | 2 | % | 2 | % | 6 | % | 4 | % | ||||||||||||||||||||||||||||||||
|
Number of
loans
|
73,102 | 73,970 | 71,041 | 64,541 | 88,331 |
Other Doc (Lim, Red, Stated,
etc)
|
62 | % | 62 | % | 64 | % | 66 | % | 71 | % | ||||||||||||||||||||||||||
|
Total loan
face
|
$ | 20,445,051 | $ | 21,588,255 | $ | 22,498,418 | $ | 24,833,600 | $ | 36,262,301 |
Unknown/Not
Categorized
|
2 | % | 2 | % | 2 | % | 1 | % | 1 | % | |||||||||||||||||||||
|
Average loan
size
|
$ | 280 | $ | 292 | $ | 317 | $ | 385 | $ | 411 | ||||||||||||||||||||||||||||||||
|
2-4 Family
|
5 | % | 5 | % | 5 | % | 4 | % | 4 | % | ||||||||||||||||||||||||||||||||
|
Year 2008
origination
|
0 | % | 0 | % | 0 | % | 0 | % | 0 | % |
Condo
|
9 | % | 9 | % | 9 | % | 10 | % | 10 | % | |||||||||||||||||||||
|
Year 2007
origination
|
11 | % | 22 | % | 23 | % | 36 | % | 33 | % |
Single
Family
|
86 | % | 86 | % | 86 | % | 85 | % | 86 | % | |||||||||||||||||||||
|
Year 2006
origination
|
5 | % | 8 | % | 8 | % | 12 | % | 22 | % |
Other
|
0 | % | 0 | % | 0 | % | 1 | % | 0 | % | |||||||||||||||||||||
|
Year 2005
origination
|
47 | % | 36 | % | 34 | % | 27 | % | 28 | % | ||||||||||||||||||||||||||||||||
|
Year 2004 origination and
earlier
|
37 | % | 34 | % | 35 | % | 25 | % | 17 | % | ||||||||||||||||||||||||||||||||
|
(1) The definition of a conforming
loan has significantly changed over time. For all periods shown in
this table, the conforming loan definition available in Febuary 2009 was
used (which had a maximum loan balance of
$729,750).
|
||||||||||||||||||||||||||||||||||||||||||
|
(2) Only the loan groups providing
direct cash flow to securities we own are included.
|
||||||||||||||||||||||||||||||||||||||||||
|
THE
REDWOOD REVIEW 4TH QUARTER 2009
|
Table 9B:
Residential Non-Prime Securities at Redwood and Underlying Loan
Characteristics
|
59
|
|
|
Table
10: Residential Real Estate Loan Characteristics ($ in thousands) (1)
|
60
|
|
2009
|
2009
|
2009
|
2009
|
2008
|
2008
|
2008
|
2008
|
2007
|
||||||||||||||||||||||||||||
| Q4 | Q3 | Q2 | Q1 | Q4 | Q3 | Q2 | Q1 | Q4 | ||||||||||||||||||||||||||||
|
Residential
loans
|
$ | 3,733,173 | $ | 3,827,086 | $ | 3,952,147 | $ | 4,523,877 | $ | 4,617,269 | $ | 6,070,083 | $ | 6,322,868 | $ | 6,702,726 | $ | 7,106,018 | ||||||||||||||||||
|
Number of
loans
|
12,930 | 13,232 | 13,648 | 14,880 | 15,203 | 18,037 | 18,706 | 19,801 | 21,000 | |||||||||||||||||||||||||||
|
Average loan
size
|
$ | 289 | $ | 289 | $ | 290 | $ | 304 | $ | 304 | $ | 337 | $ | 338 | $ | 339 | $ | 338 | ||||||||||||||||||
|
Adjustable
%
|
95 | % | 95 | % | 95 | % | 85 | % | 85 | % | 67 | % | 67 | % | 67 | % | 68 | % | ||||||||||||||||||
|
Hybrid %
|
5 | % | 5 | % | 5 | % | 15 | % | 15 | % | 33 | % | 33 | % | 33 | % | 32 | % | ||||||||||||||||||
|
Fixed %
|
0 | % | 0 | % | 0 | % | 0 | % | 0 | % | 0 | % | 0 | % | 0 | % | 0 | % | ||||||||||||||||||
|
Amortizing
%
|
3 | % | 3 | % | 3 | % | 4 | % | 4 | % | 5 | % | 5 | % | 5 | % | 5 | % | ||||||||||||||||||
|
Interest-only
%
|
97 | % | 97 | % | 97 | % | 96 | % | 96 | % | 95 | % | 95 | % | 95 | % | 95 | % | ||||||||||||||||||
|
Negatively amortizing
%
|
0 | % | 0 | % | 0 | % | 0 | % | 0 | % | 0 | % | 0 | % | 0 | % | 0 | % | ||||||||||||||||||
|
Florida
|
14 | % | 14 | % | 14 | % | 13 | % | 13 | % | 13 | % | 13 | % | 13 | % | 13 | % | ||||||||||||||||||
|
Southern
California
|
11 | % | 11 | % | 11 | % | 12 | % | 12 | % | 15 | % | 15 | % | 15 | % | 14 | % | ||||||||||||||||||
|
Northern
California
|
8 | % | 8 | % | 8 | % | 9 | % | 9 | % | 11 | % | 11 | % | 11 | % | 10 | % | ||||||||||||||||||
|
New York
|
7 | % | 7 | % | 7 | % | 6 | % | 6 | % | 6 | % | 6 | % | 6 | % | 6 | % | ||||||||||||||||||
|
Georgia
|
5 | % | 5 | % | 5 | % | 5 | % | 5 | % | 4 | % | 4 | % | 4 | % | 4 | % | ||||||||||||||||||
|
New Jersey
|
5 | % | 4 | % | 4 | % | 4 | % | 4 | % | 4 | % | 4 | % | 4 | % | 4 | % | ||||||||||||||||||
|
Texas
|
5 | % | 5 | % | 5 | % | 5 | % | 5 | % | 4 | % | 4 | % | 4 | % | 5 | % | ||||||||||||||||||
|
Colorado
|
4 | % | 4 | % | 4 | % | 4 | % | 4 | % | 3 | % | 3 | % | 3 | % | 3 | % | ||||||||||||||||||
|
Virginia
|
3 | % | 3 | % | 3 | % | 3 | % | 3 | % | 3 | % | 3 | % | 3 | % | 3 | % | ||||||||||||||||||
|
Arizona
|
2 | % | 3 | % | 3 | % | 3 | % | 3 | % | 3 | % | 3 | % | 3 | % | 4 | % | ||||||||||||||||||
|
Illinois
|
2 | % | 2 | % | 2 | % | 3 | % | 3 | % | 3 | % | 3 | % | 3 | % | 3 | % | ||||||||||||||||||
|
Other
states
|
34 | % | 34 | % | 34 | % | 33 | % | 33 | % | 31 | % | 30 | % | 30 | % | 31 | % | ||||||||||||||||||
|
Year 2008
origination
|
0 | % | 0 | % | 0 | % | 0 | % | 0 | % | 0 | % | 0 | % | 0 | % | 0 | % | ||||||||||||||||||
|
Year 2007
origination
|
2 | % | 2 | % | 2 | % | 2 | % | 2 | % | 13 | % | 13 | % | 13 | % | 13 | % | ||||||||||||||||||
|
Year 2006
origination
|
6 | % | 5 | % | 5 | % | 15 | % | 15 | % | 21 | % | 21 | % | 20 | % | 20 | % | ||||||||||||||||||
|
Year 2005
origination
|
4 | % | 4 | % | 4 | % | 4 | % | 4 | % | 5 | % | 5 | % | 5 | % | 5 | % | ||||||||||||||||||
|
Year 2004 origination or
earlier
|
88 | % | 89 | % | 89 | % | 79 | % | 79 | % | 61 | % | 61 | % | 62 | % | 62 | % | ||||||||||||||||||
|
Wtd Avg Original
LTV
|
67 | % | 67 | % | 67 | % | 68 | % | 68 | % | 69 | % | 69 | % | 69 | % | 69 | % | ||||||||||||||||||
|
Original LTV: 0 -
50
|
18 | % | 18 | % | 18 | % | 17 | % | 17 | % | 15 | % | 15 | % | 15 | % | 15 | % | ||||||||||||||||||
|
Original LTV: 50 -
60
|
11 | % | 11 | % | 11 | % | 11 | % | 11 | % | 11 | % | 11 | % | 11 | % | 11 | % | ||||||||||||||||||
|
Original LTV: 60 -
70
|
20 | % | 20 | % | 20 | % | 19 | % | 19 | % | 19 | % | 19 | % | 19 | % | 19 | % | ||||||||||||||||||
|
Original LTV: 70 -
80
|
43 | % | 43 | % | 43 | % | 46 | % | 46 | % | 49 | % | 49 | % | 49 | % | 48 | % | ||||||||||||||||||
|
Original LTV: 80 -
90
|
2 | % | 2 | % | 2 | % | 2 | % | 2 | % | 2 | % | 2 | % | 2 | % | 2 | % | ||||||||||||||||||
|
Original LTV: 90 -
100
|
6 | % | 6 | % | 6 | % | 5 | % | 5 | % | 4 | % | 4 | % | 4 | % | 5 | % | ||||||||||||||||||
|
Wtg Avg
FICO
|
730 | 730 | 731 | 731 | 732 | 732 | 732 | 732 | 732 | |||||||||||||||||||||||||||
|
FICO: <=
600
|
1 | % | 1 | % | 1 | % | 1 | % | 1 | % | 1 | % | 1 | % | 1 | % | 1 | % | ||||||||||||||||||
|
FICO: 601
-620
|
1 | % | 1 | % | 1 | % | 1 | % | 1 | % | 1 | % | 1 | % | 1 | % | 1 | % | ||||||||||||||||||
|
FICO: 621 -
640
|
2 | % | 2 | % | 2 | % | 2 | % | 2 | % | 1 | % | 1 | % | 2 | % | 1 | % | ||||||||||||||||||
|
FICO: 641
-660
|
4 | % | 4 | % | 4 | % | 4 | % | 4 | % | 3 | % | 3 | % | 3 | % | 3 | % | ||||||||||||||||||
|
FICO: 661 -
680
|
8 | % | 8 | % | 8 | % | 7 | % | 7 | % | 7 | % | 8 | % | 7 | % | 7 | % | ||||||||||||||||||
|
FICO: 681 -
700
|
12 | % | 12 | % | 12 | % | 12 | % | 12 | % | 12 | % | 12 | % | 12 | % | 12 | % | ||||||||||||||||||
|
FICO: 701 -
720
|
13 | % | 13 | % | 14 | % | 13 | % | 13 | % | 13 | % | 14 | % | 13 | % | 14 | % | ||||||||||||||||||
|
FICO: 721 -
740
|
13 | % | 13 | % | 13 | % | 13 | % | 13 | % | 13 | % | 14 | % | 13 | % | 13 | % | ||||||||||||||||||
|
FICO: 741 -
760
|
14 | % | 14 | % | 14 | % | 15 | % | 15 | % | 15 | % | 15 | % | 15 | % | 15 | % | ||||||||||||||||||
|
FICO: 761 -
780
|
16 | % | 16 | % | 16 | % | 17 | % | 17 | % | 17 | % | 17 | % | 17 | % | 17 | % | ||||||||||||||||||
|
FICO: 781 -
800
|
12 | % | 12 | % | 12 | % | 12 | % | 12 | % | 13 | % | 13 | % | 13 | % | 13 | % | ||||||||||||||||||
|
FICO: >=
801
|
4 | % | 4 | % | 3 | % | 3 | % | 3 | % | 4 | % | 4 | % | 4 | % | 3 | % | ||||||||||||||||||
|
Conforming % (2)
|
56 | % | 56 | % | 56 | % | 55 | % | 52 | % | 34 | % | 33 | % | 34 | % | 34 | % | ||||||||||||||||||
|
% balance in loans > $1mm per
loan
|
16 | % | 16 | % | 16 | % | 14 | % | 14 | % | 15 | % | 15 | % | 15 | % | 15 | % | ||||||||||||||||||
|
2nd home %
|
12 | % | 12 | % | 12 | % | 11 | % | 11 | % | 11 | % | 11 | % | 11 | % | 11 | % | ||||||||||||||||||
|
Investment home
%
|
4 | % | 4 | % | 4 | % | 3 | % | 3 | % | 3 | % | 3 | % | 3 | % | 3 | % | ||||||||||||||||||
|
Purchase
|
31 | % | 31 | % | 31 | % | 34 | % | 34 | % | 36 | % | 36 | % | 36 | % | 36 | % | ||||||||||||||||||
|
Cash out
refinance
|
36 | % | 36 | % | 35 | % | 34 | % | 34 | % | 32 | % | 32 | % | 32 | % | 32 | % | ||||||||||||||||||
|
Rate-term
refinance
|
31 | % | 31 | % | 32 | % | 31 | % | 31 | % | 30 | % | 30 | % | 30 | % | 30 | % | ||||||||||||||||||
|
Other
|
2 | % | 2 | % | 2 | % | 1 | % | 1 | % | 2 | % | 2 | % | 2 | % | 2 | % | ||||||||||||||||||
|
(1) This table presents
characteristics of residential real estate loans held by consolidated
Sequoia entities.
(2) The definition of a conforming
loan has significantly changed over time. For all periods shown in
this table, the conforming loan definition available during the
corresponding period was used. For December 31, 2009, the conforming
loan definition available in Febuary 2009 was used (which had a maximum
loan balance of $729,750).
|
||||||||||||||||||||||||||||||||||||
|
THE
REDWOOD REVIEW 4TH QUARTER 2009
|
Table 10:
Residential Real Estate Loan Characteristics
|
|
|
EXECUTIVE
OFFICERS:
George
E. Bull, III
Chairman of
the Board and
Chief
Executive Officer
Martin
S. Hughes
President,
Chief Financial Officer,
and Co-Chief
Operating Officer
Brett
D. Nicholas
Chief
Investment Officer and
Co-Chief
Operating Officer
Harold
F. Zagunis
Chief Risk
Officer and
Managing
Director
STOCK
LISTING:
The Company’s
common stock is traded
on the New
York Stock Exchange under
the symbol
RWT
CORPORATE
HEADQUARTERS:
One Belvedere
Place, Suite 300
Mill Valley,
California 94941
Telephone:
(415) 389-7373
NEW YORK
OFFICE:
245 Park
Avenue, 39th Floor
New York, New
York 10167
Telephone:
(212) 792-4209
INVESTOR
RELATIONS:
Mike
McMahon
Managing
Director
Paula
Kwok
Assistant
Vice President
Investor
Relations Hotline: (866) 269-4976
Email:
[email protected]
GRAPHIC
DESIGN:
Emily
Spoon
|
DIRECTORS:
George
E. Bull, III
Chairman of
the Board and
Chief
Executive Officer
Richard
D. Baum
Former Chief
Deputy Insurance
Commissioner
for the State of California
Thomas
C. Brown
COO, McGuire
Real Estate and
Principal
Shareholder, Urban Bay Properties, Inc.
Mariann
Byerwalter
Chairman, JDN
Corporate Advisory LLC
Douglas
B. Hansen
Private
Investor
Greg
H. Kubicek
President,
The Holt Group, Inc.
Jeffrey
T. Pero
Retired
Partner, Latham & Watkins LLP
Georganne
C. Proctor
Executive
Vice President Chief
Financial Officer,
and Chief
Integration Officer, TIAA-CREF
Charles
J. Toeniskoetter
Chairman,
Toeniskoetter & Breeding, Inc. Development
Chairman
& CEO, Toeniskoetter Construction, Inc.
David
L. Tyler
Private
Investor
TRANSFER
AGENT:
Computershare
2 North
LaSalle Street
Chicago, IL
60602
Telephone:
(888) 472-1955
|