|
|
 |
|
TABLE
OF CONTENTS
|
|
Introduction
|
3
|
| |
|
|
Shareholder
Letter
|
4
|
| |
|
|
Quarterly
Overview
|
6
|
| |
|
|
Financial
Insights
|
12
|
| |
|
|
u
Book Value
|
12
|
| |
|
|
u
Balance Sheet
|
14
|
| |
|
|
u
GAAP Income
|
18
|
| |
|
|
u
Taxable Income and Dividends
|
22
|
| |
|
|
u
Cash Flow
|
23
|
| |
|
|
New
Securitization Initiative
|
26
|
| |
|
|
Residential
Real Estate Securities
|
32
|
| |
|
|
Commercial
Real Estate
|
39
|
| |
|
|
Investments
in Securitization Entities
|
42
|
|
|
|
| |
|
|
Appendix
|
|
| |
|
|
Accounting
Discussion
|
46
|
| |
|
|
Glossary
|
47
|
| |
|
|
Financial
Tables
|
53
|
|
THE REDWOOD
REVIEW 1ST QUARTER 2010
|
1
|
|
|
|
CAUTIONARY
STATEMENT
|
Cautionary
Statement
This Redwood Review
contains forward-looking statements within the meaning of the safe harbor
provisions of the Private Securities Litigation Reform Act of 1995.
Forward-looking statements involve numerous risks and uncertainties. Our actual
results may differ from our expectations, estimates, and projections and,
consequently, you should not rely on these forward-looking statements as
predictions of future events. Forward-looking statements are not historical in
nature and can be identified by words such as “anticipate,” “estimate,” “will,”
“should,” “expect,” “believe,” “intend,” “seek,” “plan,” and similar expressions
or their negative forms, or by references to strategy, plans, or intentions.
These forward-looking statements are subject to risks and uncertainties,
including, among other things, those described in our Annual Report on Form 10-K
for the year ended December 31, 2009 under the caption “Risk Factors.” Other
risks, uncertainties, and factors that could cause actual results to differ
materially from those projected are described below and may be described from
time to time in reports we file with the Securities and Exchange Commission,
including reports on Forms 10-K, 10-Q, and 8-K. We undertake no obligation to
update or revise forward-looking statements, whether as a result of new
information, future events, or otherwise.
Statements regarding
the following subjects, among others, are forward-looking by their nature: (i)
our competitive position and our ability to compete efficiently in the future;
(ii) our future capital needs, our ability to access additional capital if
needed, and our expectations regarding the use of short-term debt financing,
including through warehouse credit and repurchase facilities; (iii) our future
investment strategy and our ability to find attractive investments and future
trends relating to our pace of acquiring or selling assets, including, without
limitation, statements relating to our efforts to acquire residential mortgage
loans in bulk transactions or on a flow basis and about the likelihood of, and
our participation in, future securitization transactions and our potential
future investment activity in the commercial real estate sector; (iv) the future
returns we may earn on our investment portfolio, our future interest income, and
our belief that the business of intermediating mortgage credit over time; (v)
future market and economic conditions, including, without limitation, future
conditions in the residential and commercial real estate markets and
related financing markets; (vi) our beliefs about the future direction of
housing market fundamentals, including, without limitation, home prices,
mortgage delinquencies, loan modification programs, foreclosure rates,
prepayment rates, inventory of homes for sale, and mortgage interest rates;
(vii) our views on the sustainability of government interventions into various
financial markets and the possible future effects of the government’s withdrawal
from such interventions; (viii) the future of the status of Fannie Mae and
Freddie Mac, the role of the Federal Housing Administration, and other issues
the resolution of which may depend on political factors and actions; (ix) our
expectations regarding future credit losses and impairments on our investments
(including as compared to our original expectations and credit reserve levels)
and our ability to generate attractive returns even if losses increase above
current estimates; (x) the drivers of our future earnings, future earnings
volatility, and future trends in operating expenses; (xi) our expectation that
we will consolidate onto our balance sheet the securitization transaction we
executed in April 2010, (xii) our board of directors’ intention to pay a regular
dividend of $0.25 per share per quarter in 2010; (xiii) our anticipation of
additional losses for tax accounting purposes; and (xiv) our expectations
relating to tax accounting that quarterly taxable income (loss) may be volatile,
that we will report a taxable loss in 2010, and that we expect any 2010
dividends will be characterized as a return of capital.
Important factors,
among others, that may affect our actual results include: general economic
trends, the performance of the housing, mortgage, credit, and broader financial
markets, and their effects on the prices of earning assets and the credit status
of borrowers; federal and state legislative and regulatory developments, and the
actions of governmental authorities, including those affecting the mortgage
industry or our business; our exposure to credit risk and the timing of credit
losses within our portfolio; the concentration of the credit risks we are
exposed to, including due to the structure of assets we hold and the
geographical concentration of real estate underlying assets we own; our exposure
to adjustable-rate and negative amortization mortgage loans; the efficacy and
expense of our efforts to manage or hedge credit risk, interest rate risk, and
other financial and operational risks; changes in credit ratings on assets we
own and changes in the rating agencies’ credit rating methodologies; changes in
interest rates; changes in mortgage prepayment rates; the availability of
high-quality assets for purchase at attractive prices and our ability to
reinvest cash we hold; changes in the values of assets we own; changes in
liquidity in the market for real estate securities; our ability to finance the
acquisition of real estate-related assets with short-term debt; the ability of
counterparties to satisfy their obligations to us; our involvement in
securitization transactions and the risks we are exposed to in executing
securitization transactions; exposure to litigation arising from our involvement
in securitization transactions; whether we have sufficient liquid assets to meet
short-term needs; our ability to successfully compete and retain or attract key
personnel; our ability to adapt our business model and strategies to changing
circumstances; changes in our investment, financing, and hedging strategies and
new risks we may be exposed to if we expand our business activities; exposure to
environmental liabilities and the effects of global climate change; failure to
comply with applicable laws and regulations; our failure to maintain appropriate
internal controls over financial reporting and disclosure controls and
procedures; changes in accounting principles and tax rules; our ability to
maintain our status as a real estate investment trust (REIT) for tax purposes;
limitations imposed on our business due to our REIT status and our status as
exempt from registration under the Investment Company Act of 1940; decisions
about raising, managing, and distributing capital; and other factors not
presently identified.
This Redwood Review
may contain statistics and other data that in some cases have been obtained from
or compiled from information made available by servicers and other third-party
service providers.
|
2
|
THE REDWOOD
REVIEW 1ST QUARTER 2010
|
Note
to Readers:
We file annual
reports (on Form 10-K) and quarterly reports (on Form 10-Q) with the Securities
and Exchange Commission. These filings and our earnings press releases provide
information about Redwood and our financial results in accordance with generally
accepted accounting principles (GAAP). We urge you to review these documents,
which are available through our web site, www.redwoodtrust.com.
This document,
called The Redwood Review, is an additional format for providing information
about Redwood through a discussion of many GAAP as well as non-GAAP metrics,
such as taxable income and economic book value. Supplemental information is also
provided in the Financial Tables in this Review to facilitate more detailed
understanding and analysis of Redwood. When we use non-GAAP metrics it is
because we believe that these figures provide additional insight into Redwood’s
business. In each case in which we discuss a non-GAAP metric you will find an
explanation of how it has been calculated, why we think the figure is important,
and reconciliations between the GAAP and non-GAAP figures.
We hope you find
this Review helpful to your understanding of our business. We thank you for your
input and suggestions, which have resulted in our changing the form and content
of The Redwood Review over time.
We welcome your
continued interest and comments.
|
|
|
|
|
|
|
|
|
Selected
Financial Highlights
|
|
|
|
|
|
|
|
|
|
Quarter:Year
|
GAAP
Income (Loss) per
Share
|
Taxable
Income (Loss) per
Share(1)
|
Annualized
Return
on
Equity
|
GAAP
Book
Value
per
Share
|
Non-GAAP
Economic
Value
per
Share (2)
|
Total
Dividends
per Share
|
|
Q108
|
($5.28)
|
$0.79
|
(95%)
|
$17.89
|
$18.04
|
$0.75
|
|
Q208
|
($1.40)
|
$0.11
|
(30%)
|
$17.00
|
$16.72
|
$0.75
|
|
Q308
|
($3.34)
|
$0.07
|
(83%)
|
$12.40
|
$13.18
|
$0.75
|
|
Q408
|
($3.46)
|
($0.39)
|
(124%)
|
$9.02
|
$11.10
|
$0.75
|
|
Q109
|
($0.65)
|
($0.22)
|
(25%)
|
$8.40
|
$10.01
|
$0.25
|
|
Q209
|
$0.10
|
($0.16)
|
5%
|
$10.35
|
$11.30
|
$0.25
|
|
Q309
|
$0.34
|
($0.30)
|
13%
|
$11.68
|
$12.28
|
$0.25
|
|
Q409
|
$0.51
|
($0.44)
|
17%
|
$12.50
|
$13.03
|
$0.25
|
|
Q110
|
$0.58
|
$0.01
|
19%
|
$12.84
|
$13.32
|
$0.25
|
|
(1) Taxable
income (loss) per share for 2009 and 2010 are estimates until we file our
tax returns.
|
| |
|
(2) Non-GAAP
economic value per share is calculated using estimated bid-side values
(which take into account available bid-side marks) for our financial
assets and estimated offer-side values (which take into account available
offer-side marks) for our financial liabilities and we believe it more
accurately reflects liquidation value than does GAAP book value per
share. Non-GAAP economic value per share is reconciled to GAAP
book value per share in Table 4 in the Financial Tables in this
Review.
|
|
THE REDWOOD
REVIEW 1ST QUARTER 2010
|
3
|
 |
|
|
SHAREHOLDER
LETTER
|
Dear
Fellow Shareholders:
Redwood Trust began
as an idea in 1994 that a company with integrity and strong principles could
invest in high-quality residential mortgage credit risk and build enduring
competitive advantages. This idea ultimately led to Redwood’s initial public
offering in August 1995.
From the beginning,
Redwood has always been focused on generating long-term value for shareholders,
and shareholders have always included management. Our decision to organize as an
internally-managed company, to require executive ownership, and to provide the
majority of incentive compensation in shares that vest over time, were all
decisions intended to closely align management with shareholders, who we regard
as our partners.
Our original
premise in establishing Redwood was that we could compete with companies many
times our size by investing in and managing prime mortgage credit risk,
operating efficiently, and maintaining a prudent capital structure. We focused
on prime mortgage credit because there was substantial history from which to
make investment decisions. We elected to be taxed as a real estate investment
trust so we could distribute pretax earnings to shareholders. We issued common
equity and structured debt to minimize liquidity risk since permanent capital
cannot be called away. As a result of our capital structure, we have been able
to invest in illiquid securities with long tail cash flows, hold them in periods
of substantial price volatility, and take advantage of opportunities to add to
our portfolio. Our strategies have served us well from the beginning, and in
particular during the past few years when many companies failed, including
highly regulated companies.
Our experience over
the past 16 years with prime mortgage borrowers who make sufficient down
payments has been good. Through our Sequoia program, which dates back to 1997,
we have securitized a total of $35 billion original principal amount of
residential mortgage loans through 48 transactions. To date, none of the
triple-A securities originally issued in those transactions has incurred credit
losses. Through March 2010, losses within these transactions have totaled 28
basis points of the aggregate original principal amount and have only impacted
the subordinate securities issued in these transactions.
Over the years the
pace of our investment activity has varied and we have not been afraid to sit on
the sidelines when appropriate, as we did in 1997 and 1998 and for most of 2008.
We have always understood that the mortgage business was cyclical and that there
were appropriate times to invest and other times that would require patience. We
have never been held hostage to externally determined earnings targets, nor do
we intend to be in the future.
Our founding
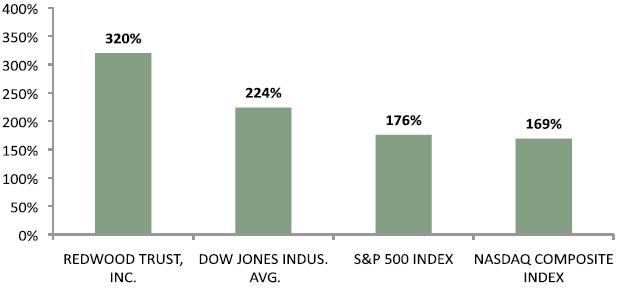
premises, principles, and strategies have served shareholders well. From our
initial public offering through April 2010, the total rate of return to
shareholders who reinvested their dividends has been 320%, which compares
favorably to the major indexes over this same period.
|
4
|
THE REDWOOD
REVIEW 1ST QUARTER 2010
|
|
|
|
|
SHAREHOLDER
LETTER
|
Comparative Total
Returns*
(August 5, 1995
- - April 30, 2010)
|
* Assumes dividends were
invested
Source:
Bloomberg
|
As I prepare to
step aside later this month from my daily responsibilities as Redwood’s Chief
Executive Officer, I am very pleased to be able to pass the leadership role to
others in the management team. When Redwood was established, the intention was
that the company would continue beyond the retirement of its founders. The Board
of Directors and I are confident that Marty Hughes and Brett Nicholas are well
prepared to lead Redwood for the next stage of the company’s growth. They played
a major role in successfully managing Redwood through the credit crisis,
executing our investment strategies, and re-establishing our residential
securitization credit enhancement business.
I am proud of the
Redwood team for successfully executing the first non-government backed
securitization of newly originated residential mortgages since the market froze
in mid-2008. This transaction proves that the private market will support a
responsible securitization with prime collateral and strong sponsorship.
However, this was only an ice breaker and much more work is required on the part
of policy makers, regulators, and industry participants to establish the new
ground rules that properly balance the interests of home owners, lenders, and
investors before the government can withdraw from its near total support of the
residential mortgage market. As a result, in addition to my responsibilities as
Chairman of the Board and working with the management team on strategic issues,
I will be focusing attention on regulatory and legislative matters to help
restore a healthy mortgage market.
I sincerely
appreciate the support my team and I have received over many years from you —
our shareholders and partners — as Redwood grew from an idea to a successful
industry-leading and robust company in the prime mortgage market.
George E. Bull,
III
Chairman
and CEO
|
THE REDWOOD
REVIEW 1ST QUARTER 2010
|
5
|
 |
|
|
QUARTERLY
OVERVIEW
|
First
Quarter 2010
A
Busy Start to 2010
We have had a busy
and productive start to 2010. We have been actively managing our investment
portfolio, working diligently on helping to restart the private label
securitization market, and continuing to make progress on re-establishing our
core business of structuring and investing in prime residential loans and
securities. It has been gratifying to be able to help break the ice by
cooperating with others to get the first prime jumbo residential mortgage
securitization since August 2008 off the ground. In this transaction, we worked
painstakingly to respond to the expressed needs of triple-A investors and to the
concerns and issues of regulators, policy makers, and rating agencies. This
securitization, however, represents just a small step along a continuum for
Redwood.
In this letter, we
will briefly review our first quarter results. Full details can be found in the
modules of the Redwood Review that follow. We will spend the bulk of this letter
addressing the topics about which you are likely most curious: our recent
securitization and our plans.
First
Quarter Results
Overall, we feel
reasonably good about our first quarter results. We reported $47 million in GAAP
net income, or $0.58 per share. This compares with $40 million in GAAP net
income, or $0.51 per share in the prior quarter. First quarter results included
the benefit of significant gains ($37 million in gains on sale of securities and
a $7 million gain on repurchasing Sequoia asset-backed securities). The outsized
contribution from gains was only partially offset by a $9 million loan loss
provision, $2 million in impairments, and $4 million in non-recurring equity
compensation costs related to the retirement of George E. Bull III, our CEO and
co-founder. While securities gains as a percentage of income has been quite high
in the past two quarters, we are not counting on sustaining gains at this pace
in the future.
We estimate that
taxable income will be $1 million for the first quarter. We would caution
against drawing a trend line from this quarter’s taxable income as the
realization of credit losses was slowed by governmental programs aimed at
stalling and reducing mortgage foreclosures. We expect realized credit losses to
pick back up as the backlog of defaulted loans is eventually processed. Thus, we
do not currently expect to have a REIT requirement to pay dividends based on
taxable income for 2010.
Book value per
share on a GAAP basis ended the quarter at $12.84, increasing by $0.34 from the
$12.50 reported at the end of 2009. Our estimate of non-GAAP economic book value
per share rose to $13.32 by March 31, 2010 as compared with $13.03 at the end of
2009. Book value increases reflect earnings plus positive market valuation
adjustments less dividends.
We invested $189
million and sold $124 million in non-agency mortgage-backed securities during
the first quarter. Our cash balance at quarter-end was $242 million. We have
been positioning our investment portfolio to seek to maintain its value in light
of possible higher interest rates. We continue to take advantage of strong
demand for non-agency RMBS to sell certain assets the market is bidding to a
level that no longer reflects the risk of continuing to hold them. At the same
time, during the first quarter we entered into swap agreements to fix the cost
of our long-term borrowings (at 6.75% for 27 years).
|
6
|
THE REDWOOD
REVIEW 1ST QUARTER 2010
|
First Quarter Results
(continued)
During April 2010,
we purchased $5 million in securities while selling $94 million in securities.
We also invested $28 million in the securitization we sponsored. While we are
acutely aware of the opportunity cost of holding cash, we will not let
impatience drive us to make poor risk/reward trade-offs. We are increasingly
willing to let cash build, as we see potentially significant opportunities to
invest our capital as we grow our residential and commercial businesses.
Further, we believe the world is still a dangerous place and there could be real
value in having excess cash.
Private
Securitizations: There is a real need in the market
While regulators
and stakeholders differ on financial reform proposals, one thing most everyone
seems to agree on is that the U.S. government cannot continue to support the
vast majority of the mortgage market. In fact, in the first quarter of 2010,
government-sponsored enterprises (GSEs) backed 96.5% of all home loans,
according to Inside Mortgage Finance. Private mortgage liquidity needs to return
to reduce reliance on Fannie Mae and Freddie Mac. While private securitization
will initially be aimed at prime jumbo (i.e., non-conforming) mortgage loans,
private securitization could also provide an alternative to the GSEs, for prime
mortgages as it has in the past. For example, over one quarter of the loans
underlying the $35 billion in Sequoia securitizations we sponsored earlier met
the conforming balance limits of the GSEs in place at the time of origination.
In addition, securitizations can also help broaden the product set of mortgages
by allowing banks to make loans that they might not want to hold on their
balance sheet (for example, 30-year fixed rate mortgages).
We think balancing
safety and soundness with economics will be critical to effective
securitization. We want to increase the level of private mortgage liquidity in a
manner that protects investors and deters excessive risk-taking. This is central
to providing credit to qualified homebuyers at the best possible interest rate.
In our opinion, the proposed rules governing risk retention (referred to as
“skin-in-the-game”) are especially
important.
In order to have a
securitization sponsor’s interests aligned properly with the interests of the
other securitization investors, there are various legislative and regulatory
proposals to require the sponsors to retain risk (or “eat their own
cooking”).
Setting risk retention requirements properly is important to keeping the risk in
check and to making credit available to good borrowers at a reasonable
interest rate. And that is the point of securitization in the first place: to
channel private sources of liquidity to good borrowers in the most efficient way
possible to keep the cost of credit affordable.
Proposals on risk
retention typically call for either the originator or the securitization sponsor
to retain risk. We have a lot to say on this topic later in this Review. In
summary, we believe that a securitization sponsor should retain risk. The level
of risk retained should vary based on product type (i.e., prime, Alt-A, or
sub-prime). A fixed, one-size fits all, approach for skin-in-the-game may render
a safe and much needed prime securitization uneconomic and may prove to be an
insufficient deterrent to prevent the return of risky lending and
securitization practices. Further, we believe that the sponsor should hold its
skin-in-the-game by retaining the most subordinated tranches that are the first
tranches to absorb credit losses.
|
THE REDWOOD
REVIEW 1ST QUARTER 2010
|
7
|
|
|
|
QUARTERLY
OVERVIEW
|
Details
on our Recent Securitization
We recently closed
a private securitization backed by $238 million of prime, jumbo residential
first mortgage loans that were originated by Citigroup within the past 11
months. The weighted average credit score of the borrower was 768 at
origination. The weighted average loan-to-value on these recently originated
loans was 57% at origination. The average loan size at origination was nearly
$933,000. The securitization has been rated by Moody’s.
As sponsor of the
securitization, Redwood invested $28 million in the transaction, taking a “belt
and suspenders” approach to risk retention. Specifically, we held all securities
rated below triple-A — or 6.5% of the face value of the transaction — plus the
interest-only securities. In addition, Redwood took a vertical slice — buying 5%
of the triple-A securities. We would not normally have retained triple-A
securities, but did so to accommodate alternative risk retention proposals until
final rules are adopted.
We customized this
securitization in response to the new environment. We listened
to all interested parties and tried to address their expressed
concerns. We believe that the best structured securitization has
separate parties acting as (1) originator/servicer, (2) trustee, and (3)
sponsor. Please see the New Securitization Initiative module later in this
Review for specifics relating to our securitization and issues surrounding risk
retention, disclosure, enforcement of representations and warranties, and
more.
What
Is Our Vision?
Our vision since
inception has been to build a company that produces high quality, long-term cash
flows. We believe our best long-term opportunity is to re-establish our core
residential credit business, a business in which we facilitate credit risk
transfers in the mortgage market. We are not building a securitization business,
per se. Securitization is a means to an end — it is an efficient way to direct
capital from investors to the mortgage originators who lend money to
borrowers.
We believe we are
well suited to structure and hold credit risk in residential mortgages. We
believe we are good at evaluating credit and other mortgage-related risks. We
understand how to structure risk to make it available to investors, according to
their appetite for risks and associated returns. We like taking subordinated
credit risk and we have a balance sheet that is built to hold illiquid assets.
We also have a high tolerance for complexity. Our team has never been stronger,
we have capital to invest, and we are not constrained by bank regulations. We
have solid relationships with originators and investors and understand that each
is our client.
|
8
|
THE REDWOOD
REVIEW 1ST QUARTER 2010
|
Our
Plans — Opening the Market
We worked long and
hard with a team of other institutions to help bring back private-market
securitizations. We have focused on addressing those issues and concerns of
relevant parties that seemed most important. Our goal was to be the leader in
issuing the first securitization following a roughly two-year hiatus. Although
the press has been mostly favorable, we were not driven by headlines. We wanted
to be first so we could be “under the tent,” helping to shape the new
structures, debating standards, and trying to inform government policy. We know
that many important issues will be decided in the early days of new
securitizations and we think we are well qualified to weigh in on those issues.
It was an arduous process for us and all who worked with us as together we tried
to “break the ice” to get securitization re-started. While we are encouraged by
the response to our first step, we expect it will take some time before
processes evolve and the nation again has a fully functioning private mortgage
securitization market.
Our
Plans — What’s Next
So how are we
approaching the business of intermediating mortgage credit risk? We approached
the process by thinking of how to bring the highest value to borrowers, lenders,
and triple-A investors. We led with a bulk purchase of loans from one
originator, immediately followed by a securitization to help finance that
purchase. We may do additional bulk purchases. Our primary goal, however, is to
establish relationships with lenders to purchase on a loan by loan basis newly
issued mortgages that meet our underwriting and collateral
criteria.
As we formulated
our plans, where did we start? In designing a prime residential mortgage-backed
securitization, we believe the process should start with triple-A investors who
represent more than 90% of the overall investment. We think a securitization has
to give the triple-A investors what they want: they should be able to dictate
the collateral and loan type they want and the information they need at
origination and on an ongoing basis. We want investors to come to rely on
Redwood for producing high quality triple-A securities they can depend on.
Further, triple-A investors can take comfort that our interests are aligned as
we are investing in the credit securities below them. In summary, we are trying
to bring the highest all-in value to triple-A investors and have them look first
to Redwood for ongoing mortgage investments.
We also made
process changes to benefit lenders. We have invested in technology that will
allow us to give lenders a price commitment to buy loans on a flow basis that
meet our collateral requirements. We want originators to have the flexibility to
sell us loans when they want. We want them to be positioned to offer their
customers additional products, including loans they may not want to keep on
their balance sheets. An efficient yield to the triple-A investors can be passed
through to the lender and on to the borrower. This should allow the originator
to offer better priced products to their qualified customers. This will also
allow banks to offload risk from their balance sheets, free up capital for
additional lending, and potentially reduce hedging costs.
|
THE REDWOOD
REVIEW 1ST QUARTER 2010
|
9
|
|
|
|
QUARTERLY
OVERVIEW
|
Capital
and Returns
We had two goals as
we contemplated this recent transaction: (1) help create the new standards in
the interests of borrowers and securitization investors and (2) create an
economic transaction. We did create an economic transaction that we expect will
deliver attractive investment returns to us over time. We invested more capital
in this transaction than we might have done for purely economic reasons: we
wanted to cover all bases on possible skin-in-the-game proposals. That is why we
held a horizontal and vertical slice of risk. Once the requirement for capital
in a securitization is set by the regulators, we may consider withdrawing some
or all of the capital in excess of the required amount.
We have enough
capital to support investments in this business for some time. If we need
additional capital in the future, we will ask for new capital from our
shareholders (as has been our history) only when we believe we have accretive
investment opportunities. We believe we are enhancing our franchise and we
expect to earn and protect franchise type returns by offering investors and
originators what they want at a fair price. The good news is that we perceive
significant investment opportunities over time as demand for prime
(non-conforming) mortgages returns and as the government gradually pulls back on
its support of the mortgage market.
Securitization
— Accounting for the Risks
The Financial
Accounting Standards Board (FASB) recently enacted new accounting guidelines
(FAS 166 and 167) to address those circumstances under which parties to a
securitization transaction are required to consolidate the assets and
liabilities of the securitization entity. These new accounting guidelines have
been pointed to by many as key to preventing the return of off-balance sheet
securitization liabilities or “shadow banking” transactions that were considered
to be a large contributor to the financial crisis.
We generally
believe that consolidation by at least one party to a securitization transaction
is important to making sure that risk is properly and fully disclosed. However,
based on our recent interpretation of FAS 166 and 167 and discussions with
various accounting firms and industry participants, it is our opinion that there
will be fewer securitization transactions consolidated than conventional wisdom
has thought. The new FASB guidelines require that any party with a significant
economic interest in a securitization entity and control over the most
significant activities of the securitization entity should consolidate the
assets and liabilities of the entity on its balance sheet. Seems simple, right?
Well, it is turning out not to be so simple. What constitutes a “significant
economic interest” and what constitutes “control” are each subject to
interpretation — and there are no bright lines. Further, there are cross
currents at play with respect to following policy makers’ suggestions to cede
the resolution of delinquent loans to servicers in order to streamline loan
modifications, as well as with respect to policy makers’ attempts to define what
skin-in-the-game should mean.
This is a
complicated and multi-faceted topic to understand, but given its importance to
the future of securitization, we attempt to explain it in the New Securitization
Initiative module later in the Review.
|
10
|
THE REDWOOD
REVIEW 1ST QUARTER 2010
|
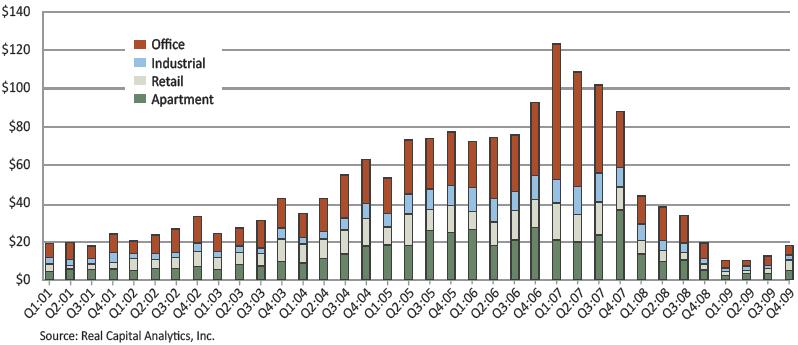
Commercial
Mortgage Opportunities: Are we there yet?
In a word: no.
There are huge investment opportunities in commercial real estate: anyone will
tell you that. Hundreds of billions of dollars will need to be refinanced each
year over the next several years — so the story goes. Yet lots of would-be
investors who want to intelligently put money to work in this important sector
sit idle. Gridlock in this market is caused not by lack of financing but by a
lack of realism. Lenders and borrowers alike are satisfied to pretend values
have not declined by 30% to 50%. Why would they want to recognize that type of
loss? In the commercial mortgage debacle of the early 1990s, write-offs were not
taken until they were forced by bank regulators.
Activity by
thoughtful investors is likely to be limited until the “extend and pretend”
environment has ended. Redwood expects there will be significant opportunities
once lenders and borrowers are more realistic about the value of their
collateral. Until that time, we will be willing to wait as needed, build our
team, and continue scouring the markets for information and appropriate
opportunities. We maintain a belief that the keys to success will include
patience, operational skill, and the supply of long-term debt. We will target
solid co-investors and properties that allow us to deploy capital in
high-quality subordinate debt investments.
Closing
Again, we would
like to thank you for your patience and continued support. We have been talking
about restarting securitization for some time and we are proud our team was able
to deliver. We have taken a first step. We will continue to work to improve the
process to ensure that lenders and investors get what they want, which makes
credit more available to homebuyers. We are encouraged that we will be able to
deploy a significant amount of capital over time in transferring and taking
mortgage credit risk. If you are a lender or a triple-A investor, we are open
for business. Please call us at 415-389-7373. We welcome your call.
|
|
|
|
Martin S.
Hughes
|
Brett D.
Nicholas
|
|
President
and Co-Chief Operating Officer
|
Chief
Investment Officer and
|
|
|
Co-Chief
Operating Officer
|
|
THE REDWOOD
REVIEW 1ST QUARTER 2010
|
11
|
 |
|
|
FINANCIAL
INSIGHTS
|
Book
Value
Summary
|
u
|
The following
table shows the components of our GAAP Book Value and Management’s
Estimate of Non-GAAP Economic Value at March 31,
2010.
|
|
|
|
|
|
|
|
|
|
|
|
|
Components
of Book Value*
|
|
March
31, 2010
|
|
($
in millions, except per share data)
|
|
|
|
|
|
|
|
Management's
|
|
|
|
|
|
|
|
|
Estimate
of
|
|
|
|
GAAP
|
|
|
|
Non-GAAP
|
|
|
|
Book
Value
|
Adj.
|
|
Economic
Value
|
|
|
Cash and cash
equivalents
|
$
|
242
|
|
|
|
$
|
242
|
|
|
|
|
|
|
|
|
|
|
|
|
|
Real estate
securities at Redwood
|
|
|
|
|
|
|
|
|
|
|
Residential
|
|
830
|
|
|
|
|
|
830
|
|
|
Commercial
|
|
9
|
|
|
|
|
|
9
|
|
|
CDO
|
|
1
|
|
|
|
|
|
1
|
|
|
Total real
estate securities at Redwood
|
$
|
840
|
|
|
|
|
$
|
840
|
|
|
|
|
|
|
|
|
|
|
|
|
|
Investments
in the Fund
|
|
16
|
|
|
|
|
|
16
|
|
|
Investments
in Sequoia
|
|
77
|
|
(29)
|
|
|
|
48
|
|
|
Investments
in Acacia
|
|
1
|
|
|
|
|
|
1
|
|
|
Total cash,
securities, and investments
|
$
|
1,176
|
|
|
|
|
$
|
1,147
|
|
|
|
|
|
|
|
|
|
|
|
|
|
Long-term
debt
|
|
(140)
|
|
67
|
|
|
|
(73)
|
|
|
|
|
|
|
|
|
|
|
|
|
|
Other
assets/liabilities, net
|
|
(38)
|
|
|
|
|
|
(38)
|
|
|
|
|
|
|
|
|
|
|
|
|
|
Stockholders'
equity
|
$
|
998
|
|
|
|
|
$
|
1,036
|
|
|
|
|
|
|
|
|
|
|
|
|
|
Book
value per share
|
$
|
12.84
|
|
|
|
|
$
|
13.32
|
|
|
u
|
During the
first quarter our GAAP book value increased by $0.34 per share to $12.84
per share. The change resulted from an aggregate of $0.59 per share from
earnings and market value increases on investments during the quarter,
partially offset by $0.25 per share of dividends paid to
shareholders.
|
|
u
|
During the
first quarter our estimate of non-GAAP economic value increased by $0.29
per share to $13.32 per share. The increase resulted from $0.76 per share
from net cash flows and net positive market valuation adjustments on our
securities and investments, less $0.22 per share of cash operating and
interest expense and $0.25 per share of
dividends.
|
*
The components of book value table presents our assets and liabilities as
calculated and reported under GAAP and as adjusted to reflect our estimate of
economic value, a non-GAAP metric. We show our investments in the Redwood
Opportunity Fund, L.P. (the Fund) and in Sequoia and Acacia securitization
entities in separate line items, similar to the equity method of accounting,
reflecting the reality that the underlying assets and liabilities owned by these
entities are legally not ours. We own only the securities and interests that we
have acquired from these entities. See page 16 for an explanation of the
adjustments set forth in this table.
|
12
|
THE REDWOOD
REVIEW 1ST QUARTER 2010
|
Book
Value (continued)
Summary
(continued)
|
u
|
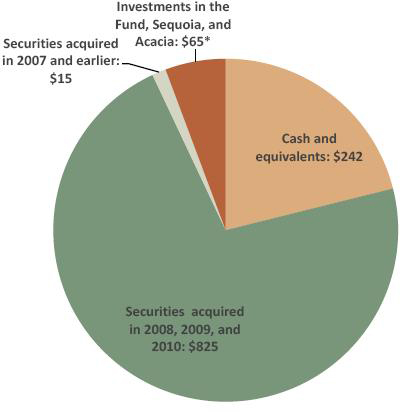
In the chart
below we present our March 31, 2010 securities portfolio by acquisition
period, which highlights that 93% of the economic value of cash,
securities, and investments were held in cash or in securities acquired
since the beginning of 2008. Our future earnings will be driven primarily
by the performance of these recent investments along with how we deploy
our existing cash and future cash
flow.
|
Cash, Securities,
and Investments at Redwood
March 31, 2010 ($ in
millions)
* Estimate of non-GAAP economic
value; see pages 12
and 16 for explanation and reconciliation to
GAAP.
|
u
|
During April
2010, we purchased $5 million of residential securities and sold $94
million of residential securities. These sales of securities were executed
at prices generally in excess of their fair values at the end of the first
quarter. As part of the management of our portfolio, we sell securities
when we believe conditions merit.
|
|
THE REDWOOD
REVIEW 1ST QUARTER 2010
|
13
|
|
|
|
FINANCIAL
INSIGHTS
|
Balance
Sheet
|
u
|
The following
table shows the components of our balance sheet at March 31,
2010.
|
|
|
|
|
|
|
|
|
|
|
|
|
|
|
|
|
|
|
|
Consolidating
Balance Sheet
|
|
|
March
31, 2010
|
|
|
($
in millions)
|
|
|
|
|
|
|
|
|
|
|
|
|
|
|
|
|
|
|
|
|
|
Redwood
|
|
|
The
Fund
|
|
|
Securitization
Entities
|
|
|
Intercompany
|
|
|
Redwood
Consolidated
|
|
|
Real estate
loans
|
|
$ |
2 |
|
|
$ |
- |
|
|
$ |
3,660 |
|
|
$ |
- |
|
|
$ |
3,662 |
|
|
Real estate
securities
|
|
|
840 |
|
|
|
27 |
|
|
|
269 |
|
|
|
- |
|
|
|
1,136 |
|
|
Investments
in the Fund
|
|
|
16 |
|
|
|
- |
|
|
|
- |
|
|
|
(16 |
) |
|
|
- |
|
|
Investment in
securitization entities
|
|
|
78 |
|
|
|
- |
|
|
|
- |
|
|
|
(78 |
) |
|
|
- |
|
|
Other
investments
|
|
|
- |
|
|
|
- |
|
|
|
11 |
|
|
|
- |
|
|
|
11 |
|
|
Cash and cash
equivalents
|
|
|
242 |
|
|
|
- |
|
|
|
- |
|
|
|
- |
|
|
|
242 |
|
|
Total earning
assets
|
|
|
1,178 |
|
|
|
27 |
|
|
|
3,940 |
|
|
|
(94 |
) |
|
|
5,051 |
|
|
|
|
|
|
|
|
|
|
|
|
|
|
|
|
|
|
|
|
|
|
|
|
Other
assets
|
|
|
23 |
|
|
|
3 |
|
|
|
118 |
|
|
|
- |
|
|
|
144 |
|
|
|
|
|
|
|
|
|
|
|
|
|
|
|
|
|
|
|
|
|
|
|
|
Total
assets
|
|
$ |
1,201 |
|
|
$ |
30 |
|
|
$ |
4,058 |
|
|
$ |
(94 |
) |
|
$ |
5,195 |
|
|
Short-term
debt
|
|
$ |
- |
|
|
$ |
- |
|
|
$ |
- |
|
|
$ |
- |
|
|
$ |
- |
|
|
Other
liabilities
|
|
|
63 |
|
|
|
1 |
|
|
|
143 |
|
|
|
- |
|
|
|
207 |
|
|
Asset-backed
securities issued
|
|
|
- |
|
|
|
- |
|
|
|
3,837 |
|
|
|
- |
|
|
|
3,837 |
|
|
Long-term
debt
|
|
|
140 |
|
|
|
- |
|
|
|
- |
|
|
|
- |
|
|
|
140 |
|
|
Total
liabilities
|
|
|
203 |
|
|
|
1 |
|
|
|
3,980 |
|
|
|
- |
|
|
|
4,184 |
|
|
|
|
|
|
|
|
|
|
|
|
|
|
|
|
|
|
|
|
|
|
|
|
Stockholders’
equity
|
|
|
998 |
|
|
|
16 |
|
|
|
78 |
|
|
|
(94 |
) |
|
|
998 |
|
|
Noncontrolling
interest
|
|
|
- |
|
|
|
13 |
|
|
|
- |
|
|
|
- |
|
|
|
13 |
|
|
Total equity
|
|
|
998 |
|
|
|
29 |
|
|
|
78 |
|
|
|
(94 |
) |
|
|
1,011 |
|
|
|
|
|
|
|
|
|
|
|
|
|
|
|
|
|
|
|
|
|
|
|
|
Total
liabilities and stockholders’ equity
|
|
$ |
1,201 |
|
|
$ |
30 |
|
|
$ |
4,058 |
|
|
$ |
(94 |
) |
|
$ |
5,195 |
|
|
u
|
We are
required under GAAP to consolidate all of the assets, liabilities, and
noncontrolling interest of the Fund due to our significant general and
limited partnership interests in the Fund and ongoing asset management
responsibilities.
|
|
u
|
We are
required to consolidate the assets and liabilities of certain Sequoia and
Acacia securitization entities that are treated as secured borrowing
transactions under GAAP. However, the securitized assets of these entities
are not available to Redwood. Similarly, the liabilities of these entities
are obligations payable only from the cash flow generated by their
securitized assets and are not obligations of
Redwood.
|
|
14
|
THE REDWOOD
REVIEW 1ST QUARTER 2010
|
Balance Sheet
(continued)
Real
Estate Securities
|
u
|
The following
table presents the fair value of real estate securities at Redwood at
March 31, 2010. We segment our securities portfolio by vintage (the
year(s) the securities were issued), priority of cash flow (senior,
re-REMIC, and subordinate) and, for residential securities, by quality of
underlying loans (prime and
non-prime).
|
|
|
|
|
|
|
|
|
|
|
|
|
|
|
|
|
|
|
Real
Estate Securities at Redwood
|
|
March
31, 2010
|
|
($
in millions)
|
|
|
|
|
|
|
|
|
|
|
|
|
|
|
|
%
of Total
|
|
|
|
|
<=2004
|
|
|
2005
|
|
|
|
2006-2008
|
|
|
Total
|
|
|
Securities
|
|
|
|
|
|
|
|
|
|
|
|
|
|
|
|
|
|
|
|
|
Residential
|
|
|
|
|
|
|
|
|
|
|
|
|
|
|
|
|
|
Seniors
|
|
|
|
|
|
|
|
|
|
|
|
|
|
|
|
|
|
Prime
|
|
$ |
14 |
|
|
$ |
286 |
|
|
$ |
72 |
|
|
$ |
372 |
|
|
|
44 |
% |
|
Non-prime
|
|
|
117 |
|
|
|
232 |
|
|
|
19 |
|
|
|
368 |
|
|
|
44 |
% |
|
Total
Seniors
|
|
$ |
131 |
|
|
$ |
518 |
|
|
$ |
91 |
|
|
$ |
740 |
|
|
|
88 |
% |
|
|
|
|
|
|
|
|
|
|
|
|
|
|
|
|
|
|
|
|
|
|
|
Re-REMIC
|
|
|
|
|
|
|
|
|
|
|
|
|
|
|
|
|
|
|
|
|
|
Prime
|
|
$ |
5 |
|
|
$ |
8 |
|
|
$ |
54 |
|
|
$ |
67 |
|
|
|
8 |
% |
|
Total
Re-REMIC
|
|
$ |
5 |
|
|
$ |
8 |
|
|
$ |
54 |
|
|
$ |
67 |
|
|
|
8 |
% |
|
|
|
|
|
|
|
|
|
|
|
|
|
|
|
|
|
|
|
|
|
|
|
Subordinates
|
|
|
|
|
|
|
|
|
|
|
|
|
|
|
|
|
|
|
|
|
|
Prime
|
|
$ |
12 |
|
|
$ |
3 |
|
|
$ |
2 |
|
|
$ |
17 |
|
|
|
2 |
% |
|
Non-prime
|
|
|
6 |
|
|
|
- |
|
|
|
- |
|
|
|
6 |
|
|
|
1 |
% |
|
Total
Subordinates
|
|
$ |
18 |
|
|
$ |
3 |
|
|
$ |
2 |
|
|
$ |
23 |
|
|
|
3 |
% |
|
|
|
|
|
|
|
|
|
|
|
|
|
|
|
|
|
|
|
|
|
|
|
Total
Residential
|
|
$ |
154 |
|
|
$ |
529 |
|
|
$ |
147 |
|
|
$ |
830 |
|
|
|
99 |
% |
|
|
|
|
|
|
|
|
|
|
|
|
|
|
|
|
|
|
|
|
|
|
|
Commercial
Subordinates
|
|
$ |
7 |
|
|
$ |
2 |
|
|
$ |
- |
|
|
$ |
9 |
|
|
|
1 |
% |
|
CDO
Subordinates
|
|
$ |
- |
|
|
$ |
1 |
|
|
$ |
- |
|
|
$ |
1 |
|
|
|
0 |
% |
|
|
|
|
|
|
|
|
|
|
|
|
|
|
|
|
|
|
|
|
|
|
|
Total
|
|
$ |
161 |
|
|
$ |
532 |
|
|
$ |
147 |
|
|
$ |
840 |
|
|
|
100 |
% |
|
u
|
During the
first quarter, our securities portfolio grew to $840 million from $781
million, primarily as a result of acquisitions of $180 million (excluding
the acquisition of $9 million of Sequoia asset-backed debt) exceeding
sales and paydowns. In addition, the value of securities held during the
first quarter increased by $15 million during the
period.
|
|
THE REDWOOD
REVIEW 1ST QUARTER 2010
|
15
|
|
|
|
FINANCIAL
INSIGHTS
|
Balance
Sheet (continued)
Investments
in the Fund and the Securitization Entities
|
u
|
Our
investments in the Fund and Sequoia and Acacia securitization entities, as
reported under GAAP, totaled $94 million, or 8% of our cash, securities,
and investments at March 31, 2010.
|
|
u
|
The fair
value (which equals GAAP carrying value) of our investment in the Fund was
$16 million. The Fund is primarily invested in non-prime residential
securities and is managed by a subsidiary of Redwood. Our investment
represents a 52% interest in the
Fund.
|
|
u
|
Our
investments in Sequoia entities consist predominately of interest-only
securities (IOs) and, to a smaller extent, senior and subordinate
securities issued by these entities. The $77 million of GAAP carrying
value of our investments represents the difference between the carrying
costs of the assets and liabilities owned by the Sequoia entities. In
contrast, we estimated the $48 million of non-GAAP economic value for our
investments in Sequoia entities using the same valuation process that we
follow to fair value our other real estate
securities.
|
|
u
|
The GAAP
carrying value and the fair value of our investments in Acacia entities
was $1 million, which primarily reflects the present value of the
management fees we expect to earn from these entities. The equity
interests and securities we own in the Acacia entities have minimal
value.
|
Debt
|
u
|
We had no
short-term recourse debt at March 31, 2010. We currently fund our
investments with permanent capital (equity and long-term debt) that is not
subject to margin calls or financial
covenants.
|
|
u
|
In future
periods, we expect to utilize short-term debt to finance the acquisition
of prime mortgage loans prior to securitizing those loans through our
Sequoia program. We are in discussion with counterparties to re-establish
warehouse credit facilities for this purpose. In the interim, we are
likely to use our excess cash to purchase mortgage loans. We are also
considering utilizing repurchase facilities, collateralized by certain of
our existing senior residential mortgage-backed securities (RMBS), to
temporarily finance our mortgage loan
acquisitions.
|
|
u
|
At March 31,
2010, we had $140 million of long-term debt outstanding, which, as a
result of interest rate hedging had an effective fixed interest rate of
6.75%, net of interest rate swap expense. For GAAP purposes, this
long-term debt, which is due in 2037, is reported at its outstanding
principal amount. We estimated the $73 million non-GAAP economic value of
this debt using the same valuation process that we follow to fair value
our other financial assets and liabilities. Economic value is difficult to
estimate with precision as the market for this debt is largely
inactive.
|
|
16
|
THE REDWOOD
REVIEW 1ST QUARTER 2010
|
Balance Sheet
(continued)
Capital
and Cash
|
u
|
At March 31,
2010, our total capital equaled $1.1 billion, including $998 million in
shareholders’ equity and $140 million of long-term debt. This represented
a $26 million increase from total capital at December 31,
2009.
|
|
u
|
At March 31,
2010, our cash totaled $242 million and our excess capital was $181
million. At April 30, 2010, our cash totaled $275 million and our excess
capital was $233 million.
|
|
u
|
While it is
painful to consider the opportunity cost of holding so much cash, we
believe our patience will serve Redwood investors well. Besides, many
argue that holding excess cash in a dangerous and uncertain world is not a
bad problem to have. Rather than reach for marginal investment
opportunities, we prefer to hold capital for sizeable investment
opportunities we anticipate in our core credit enhancement business within
a number of quarters. We note that when financial companies cave to
pressure and put money to work in ways that do not support their base
franchise, it often does not end well. We prefer investments that end
well.
|
|
u
|
We use our
capital to invest in earning assets, meet lender capital requirements, and
to fund our operations and working capital needs. The difference between
our current cash balance and excess capital is primarily unsettled trades
and the amount of capital set aside for our outstanding hedging
agreements. We allocate capital to our investments under our risk-adjusted
capital guidelines based on numerous factors including the liquidity of
the assets and the availability of
financing.
|
|
u
|
We currently
allocate capital equal to 100% of the fair value of all our investments —
meaning we fund these assets with capital. Over the past several years, we
have been well served by our lack of short-term borrowings. While our
asset values were adversely impacted by market conditions during 2008 and
2009, we were not forced to unload assets at fire-sale prices. Our
memories will be long on this topic and we will be thoughtful about
managing funding risk as we put our toe back into the short-term borrowing
water.
|
|
u
|
As we return
to creating attractive investment opportunities through our Sequoia
program we will increase our short-term borrowings in order to fund the
loans we accumulate prior to securitizations. We are looking to enter into
loan warehouse facilities and to borrow against our senior securities to
provide additional funding sources for our
acquisitions.
|
|
u
|
In addition,
we may change the amount of capital we allocate to the more liquid
securities we own. Consistent with our past practices, we will make these
changes only when we believe it is in the best long-term interest of our
shareholders. We believe we have significantly greater capital capacity
than reflected in our stated excess capital amounts, given our
conservative choice to allocate 100% capital to all our assets. Given our
capacity, we would likely look to our own balance sheet for sources of
liquidity before looking externally and are unlikely to seek additional
capital in the near
term.
|
|
THE REDWOOD
REVIEW 1ST QUARTER 2010
|
17
|
|
|
|
FINANCIAL
INSIGHTS
|
GAAP
Income
Summary
|
u
|
The following
table provides a summary of our GAAP income for the first quarter of 2010
and the fourth quarter of 2009.
|
|
|
|
|
|
|
|
|
|
GAAP
Income
|
|
|
($
in millions, except per share data)
|
|
|
|
Three
Months Ended
|
|
|
|
3/31/2010
|
|
|
12/31/2009
|
|
|
Interest
income
|
|
$ |
58 |
|
|
$ |
62 |
|
|
Interest
expense
|
|
|
(18 |
) |
|
|
(21 |
) |
|
Net interest
income
|
|
|
40 |
|
|
|
41 |
|
|
|
|
|
|
|
|
|
|
|
|
Provision for
loan losses
|
|
|
(9 |
) |
|
|
(9 |
) |
|
Market
valuation adjustments, net
|
|
|
(11 |
) |
|
|
(4 |
) |
|
Net interest
income (loss) after provision and market valuation
adjustments
|
|
|
20 |
|
|
|
28 |
|
|
|
|
|
|
|
|
|
|
|
|
Operating
expenses
|
|
|
(17 |
) |
|
|
(11 |
) |
|
Realized
gains, net
|
|
|
44 |
|
|
|
20 |
|
|
Noncontrolling
interest
|
|
|
- |
|
|
|
- |
|
|
Benefit from
(provision for) income taxes
|
|
|
- |
|
|
|
3 |
|
|
|
|
|
|
|
|
|
|
|
|
GAAP
income
|
|
$ |
47 |
|
|
$ |
40 |
|
|
|
|
|
|
|
|
|
|
|
|
GAAP
income per share
|
|
$ |
0.58 |
|
|
$ |
0.51 |
|
|
u
|
Our reported
GAAP income for the first quarter of 2010 was $47 million, or $0.58 per
share, as compared to $40 million, or $0.51 per share, for the fourth
quarter of 2009. Our increase in earnings reflects the continued strong
performance of our senior securities portfolio at Redwood and higher
realized gains on the sale of securities, partially offset by lower net
returns on the assets and liabilities at Acacia and non-recurring
operating expense.
|
|
18
|
THE REDWOOD
REVIEW 1ST QUARTER 2010
|
GAAP
Income (continued)
Summary
(continued)
|
u
|
The following
tables show the effect that Redwood, the Fund, and the Sequoia and Acacia
securitization entities had on our consolidated GAAP income for the first
quarter of 2010 and the fourth quarter of 2009. These components of our
income statement are not separate business
segments.
|
|
|
|
|
|
|
|
|
|
|
|
|
|
|
|
|
|
|
Consolidating
Income Statement
|
|
|
Three
Months Ended March 31, 2010
|
|
|
($
in millions)
|
|
|
|
|
|
|
|
|
|
|
|
|
|
|
|
|
|
|
|
|
Redwood
|
|
|
The
Fund
|
|
|
Securitization
Entities
|
|
|
Intercompany
Adjustments
|
|
|
Redwood
Consolidated
|
|
|
Interest
income
|
|
$ |
18 |
|
|
$ |
1 |
|
|
$ |
31 |
|
|
$ |
- |
|
|
$ |
50 |
|
|
Net discount
(premium) amortization
|
|
|
9 |
|
|
|
1 |
|
|
|
(2 |
) |
|
|
- |
|
|
|
8 |
|
|
Total
interest income
|
|
|
27 |
|
|
|
2 |
|
|
|
29 |
|
|
|
- |
|
|
|
58 |
|
|
|
|
|
|
|
|
|
|
|
|
|
|
|
|
|
|
|
|
|
|
|
|
Management
fees
|
|
|
1 |
|
|
|
- |
|
|
|
- |
|
|
|
(1 |
) |
|
|
- |
|
|
Interest
expense
|
|
|
(1 |
) |
|
|
- |
|
|
|
(17 |
) |
|
|
- |
|
|
|
(18 |
) |
|
Net interest
income
|
|
|
27 |
|
|
|
2 |
|
|
|
12 |
|
|
|
(1 |
) |
|
|
40 |
|
|
|
|
|
|
|
|
|
|
|
|
|
|
|
|
|
|
|
|
|
|
|
|
Provision for
loan losses
|
|
|
- |
|
|
|
- |
|
|
|
(9 |
) |
|
|
- |
|
|
|
(9 |
) |
|
Market
valuation adjustments, net
|
|
|
(3 |
) |
|
|
- |
|
|
|
(8 |
) |
|
|
- |
|
|
|
(11 |
) |
|
Net interest
income after provision and market valuation adjustments
|
|
|
24 |
|
|
|
2 |
|
|
|
(5 |
) |
|
|
(1 |
) |
|
|
20 |
|
|
|
|
|
|
|
|
|
|
|
|
|
|
|
|
|
|
|
|
|
|
|
|
Operating
expenses
|
|
|
(17 |
) |
|
|
(1 |
) |
|
|
- |
|
|
|
1 |
|
|
|
(17 |
) |
|
Realized
gains (losses), net
|
|
|
38 |
|
|
|
(1 |
) |
|
|
7 |
|
|
|
- |
|
|
|
44 |
|
|
Income from
the Fund
|
|
|
- |
|
|
|
- |
|
|
|
- |
|
|
|
- |
|
|
|
- |
|
|
Income from
Securitization Entities
|
|
|
2 |
|
|
|
- |
|
|
|
- |
|
|
|
(2 |
) |
|
|
- |
|
|
Noncontrolling
interest
|
|
|
- |
|
|
|
- |
|
|
|
- |
|
|
|
- |
|
|
|
- |
|
|
Benefit from
income taxes
|
|
|
- |
|
|
|
- |
|
|
|
- |
|
|
|
- |
|
|
|
- |
|
|
|
|
|
|
|
|
|
|
|
|
|
|
|
|
|
|
|
|
|
|
|
|
Net
income
|
|
$ |
47 |
|
|
$ |
- |
|
|
$ |
2 |
|
|
$ |
(2 |
) |
|
$ |
47 |
|
|
|
|
|
|
|
|
|
|
|
|
|
|
|
|
|
|
|
Consolidating
Income Statement
|
|
|
Three
Months Ended December 31, 2009
|
|
|
($
in millions)
|
|
|
|
|
|
|
|
|
|
|
|
|
|
|
|
|
|
|
|
|
Redwood
|
|
|
The
Fund
|
|
|
Securitization
Entities
|
|
|
Intercompany
Adjustments
|
|
|
Redwood
Consolidated
|
|
|
Interest
income
|
|
$ |
19 |
|
|
$ |
1 |
|
|
$ |
38 |
|
|
$ |
- |
|
|
$ |
58 |
|
|
Net discount
(premium) amortization
|
|
|
6 |
|
|
|
1 |
|
|
|
(3 |
) |
|
|
- |
|
|
|
4 |
|
|
Total
interest income
|
|
|
25 |
|
|
|
2 |
|
|
|
35 |
|
|
|
- |
|
|
|
62 |
|
|
|
|
|
|
|
|
|
|
|
|
|
|
|
|
|
|
|
|
|
|
|
|
Management
fees
|
|
|
1 |
|
|
|
- |
|
|
|
- |
|
|
|
(1 |
) |
|
|
- |
|
|
Interest
expense
|
|
|
(1 |
) |
|
|
- |
|
|
|
(20 |
) |
|
|
|
|
|
|
(21 |
) |
|
Net interest
income
|
|
|
25 |
|
|
|
2 |
|
|
|
15 |
|
|
|
(1 |
) |
|
|
41 |
|
|
|
|
|
|
|
|
|
|
|
|
|
|
|
|
|
|
|
|
|
|
|
|
Provision for
loan losses
|
|
|
- |
|
|
|
- |
|
|
|
(9 |
) |
|
|
- |
|
|
|
(9 |
) |
|
Market
valuation adjustments, net
|
|
|
(2 |
) |
|
|
(1 |
) |
|
|
(1 |
) |
|
|
- |
|
|
|
(4 |
) |
|
Net interest
income after provision and market valuation adjustments
|
|
|
23 |
|
|
|
1 |
|
|
|
5 |
|
|
|
(1 |
) |
|
|
28 |
|
|
|
|
|
|
|
|
|
|
|
|
|
|
|
|
|
|
|
|
|
|
|
|
Operating
expenses
|
|
|
(11 |
) |
|
|
(1 |
) |
|
|
- |
|
|
|
1 |
|
|
|
(11 |
) |
|
Realized
gains, net
|
|
|
20 |
|
|
|
- |
|
|
|
- |
|
|
|
- |
|
|
|
20 |
|
|
Income from
the Fund
|
|
|
- |
|
|
|
- |
|
|
|
- |
|
|
|
- |
|
|
|
- |
|
|
Income from
Securitization Entities
|
|
|
5 |
|
|
|
- |
|
|
|
- |
|
|
|
(5 |
) |
|
|
- |
|
|
Noncontrolling
interest
|
|
|
- |
|
|
|
- |
|
|
|
- |
|
|
|
- |
|
|
|
- |
|
|
Provision for
income taxes
|
|
|
3 |
|
|
|
- |
|
|
|
- |
|
|
|
- |
|
|
|
3 |
|
|
|
|
|
|
|
|
|
|
|
|
|
|
|
|
|
|
|
|
|
|
|
|
Net
income
|
|
$ |
40 |
|
|
$ |
- |
|
|
$ |
5 |
|
|
$ |
(5 |
) |
|
$ |
40 |
|
|
THE REDWOOD
REVIEW 1ST QUARTER 2010
|
19
|
|
|
|
FINANCIAL
INSIGHTS
|
GAAP
Income (continued)
Summary
(continued)
Redwood
|
u
|
At Redwood,
net interest income was $27 million for the first quarter of 2010, as
compared to $25 million for the fourth quarter of 2009. An increase in
amortization income on securities due to higher expected future interest
rates contributed to the increase in quarterly interest
income.
|
|
u
|
In the near
term, we continue to expect net interest income to be driven primarily by
our residential senior securities, which comprised 88% of the securities
we held at March 31, 2010. During the first quarter, these securities
generated $17 million of interest income, or a 13% effective annual yield
on amortized cost that was comprised of 6% coupon interest and 7% discount
amortization income. Over time, net interest income will be affected by
how we deploy our cash balances and future cash
flow.
|
|
u
|
Gains on sale
of securities amounted to $38 million (and generated total proceeds of
$124 million) in the first quarter, compared to $20 million of gains
reported in the fourth quarter of 2009. Of the $38 million of gains, $28
million were already reflected in our balance sheet as of the beginning of
the quarter and $10 million were increases in value during the
quarter.
|
|
u
|
Negative
market valuation adjustments (MVA) were $3 million in the first quarter, a
slight increase from the MVA in the prior quarter primarily due to
impairments on securities. To the extent our loss expectations do not
significantly change, we expect the pace of future impairments on
securities to remain near levels observed in recent
quarters.
|
|
u
|
Operating
expenses of $17 million for Redwood included $4 million of one-time
compensation costs related to the retirement of our CEO and co-founder,
George E. Bull, III. Additionally, operating expenses were reduced in the
fourth quarter to reflect an adjustment to our 2009 variable compensation
expense. The current quarter’s operating expenses (excluding the
non-recurring charge of $4 million) are at a level that we currently
believe to be a good estimate of the run-rate for the remainder of this
year.
|
Investments
in the Fund and Securitization Entities
|
u
|
We recognized
net income of $2 million in the first quarter from our investments in the
Fund and in the consolidated Sequoia and Acacia securitization
entities.
|
|
u
|
Net interest
income was $14 million in the first quarter, a decrease of $3 million from
the fourth quarter of 2009. This decrease was primarily due to the poor
credit performance on securities held at Acacia, resulting in lower
interest income.
|
|
u
|
The provision
for loan losses at Sequoia totaled $9 million in the first quarter,
unchanged from the fourth quarter of 2009. Although serious delinquencies
(90+ days past due) continued to rise to 4.32% in the first quarter from
3.98% at the end of the fourth quarter, the rate of increase was
consistent with the fourth quarter. There are currently three Sequoia
entities for which we have expensed aggregate loan loss provisions of $2
million in excess of our reported investment for GAAP purposes. At this
time we do not expect to deconsolidate any Sequoia entities in
2010.
|
|
20
|
THE REDWOOD
REVIEW 1ST QUARTER 2010
|
GAAP
Income (continued)
Summary
(continued)
Investments in the Fund and
Securitization Entities (continued)
|
u
|
Market
valuation adjustments were negative $8 million for interest rate hedges at
the Acacia securitization entities. This reflects the net changes in the
values of, and net interest payments associated with, these derivative
instruments.
|
|
u
|
Realized
gains of $6 million resulted from the gain of $7 million from the
repurchase of asset-backed securities issued by one of the Sequoia
entities, partially offset by losses of $1 million from the sale of
securities at the Fund.
|
|
u
|
Our
consolidated securitization entities are subject to a number of economic
uncertainties that can result in volatility to our reported income. For
example, changes in the market values of securitized assets may not move
in tandem with changes in the market values of securitized liabilities due
to liquidity and other market factors. Derivative hedging instruments in
Acacia may also not move in conjunction with the market values of the
hedged liabilities, and the timing of interest payments on these
derivatives may not occur in the same accounting period as the payments on
the hedged liabilities. In addition, varying accounting classifications
and treatments for certain of our Sequoia and Acacia entities can
contribute to volatility in our
earnings.
|
|
THE REDWOOD
REVIEW 1ST QUARTER 2010
|
21
|
|
|
|
FINANCIAL
INSIGHTS
|
Taxable
Income and Dividends
Summary
|
u
|
Taxable
income is pre-tax profit as calculated for tax purposes. REIT taxable
income is income earned at the Redwood REIT together with income earned at
REIT subsidiaries and excludes undistributed taxable income earned at our
taxable subsidiaries. We are required to distribute at least 90% of our
REIT taxable income in the form of dividends to shareholders in order to
maintain our tax status as a REIT. Our board of directors can declare
dividends in excess of this minimum
requirement.
|
Overview
|
u
|
Estimated
taxable income for the first quarter of 2010 was $1 million, or $0.01 per
share, as compared to negative $34 million, or $(0.44) per share, for the
fourth quarter of 2009.
|
|
u
|
Although
taxable income turned positive in the first quarter, we still expect to
realize a taxable loss for the full year in 2010. The timing of credit
losses on securities we own has a large impact on our quarterly taxable
income. In the first quarter, our credit losses were lower than in the
prior quarter ($24 million versus $54 million) due to ongoing efforts by
the government to promote loan modifications and reduce foreclosures.
These efforts will likely continue to affect timing of loss recognition.
We anticipate an additional $252 million of losses on securities in future
periods for tax purposes; for GAAP purposes we have reserves for these
anticipated losses.
|
|
u
|
There are
differences that exist in accounting under GAAP and for tax purposes that
can lead to significant variances in the amount and timing of when income
and losses are recognized under these two accounting methods. The most
significant difference continues to be the realization of credit losses.
Another difference is sales. Taxable gains may be offset by prior period
capital losses, which totaled $85 million at March 31, 2010. To the extent
we sell assets and recognize gains for GAAP there may be no gain included
in taxable income. Reconciliations of GAAP and tax income are shown in
Table 2 in the Financial Tables in this
Review.
|
|
u
|
Under the tax
code, REIT dividend distribution requirements are tied to taxable income.
Given our net operating loss carryforwards and our projection of a taxable
loss in 2010, we currently expect to have no dividend distribution
requirements. However, in November 2009, our board of directors announced
its intention to pay a quarterly regular dividend of $0.25 per share in
2010. We do not expect to pay any special dividends in
2010.
|
|
u
|
On March 17,
2010, our board of directors declared a regular dividend of $0.25 per
share for the first quarter, which was paid on April 21, 2010 to
shareholders of record on March 31,
2010.
|
|
u
|
As a result
of our tax loss expectations in 2010, we currently expect that this year’s
dividend distributions will be characterized as return of capital.
However, if credit losses remain at lower levels than experienced in
recent quarters and we do generate positive taxable income, a portion of
this year’s dividend distributions would be characterized as ordinary
income (to the extent of the 2010
income).
|
|
22
|
THE REDWOOD
REVIEW 1ST QUARTER 2010
|
Cash
Flow
|
u
|
In the first
quarter, our business cash flow remained strong and in line with our
expectations. Our business cash flow exceeded dividend distributions and
this excess funded our acquisitions. We ended the quarter with about the
same cash balance as we started the quarter — $242
million.
|
|
u
|
We believe
our current GAAP income statements are reflective of our current
underlying business trends, especially given the nature of the assets we
currently hold. We also consider cash flow one of a number of other
important operating metrics; however, we realize that quarterly cash flow
measures have limitations. In particular, we
note:
|
|
|
•
|
When
securities are purchased at large discounts from face value it is
difficult to determine what portion of the cash received is a return “of”
principal and what portion is a return “on” principal. It is only at the
end of an asset’s life that we can accurately determine what portion of
the cumulative cash received (whether principal or interest) was income
and what was a return of
capital.
|
|
|
•
|
Certain
investments may generate cash flow in a quarter that is not necessarily
reflective of the long-term economic yield we will earn on the
investments. For example, we acquired certain re-REMIC support securities
at what we believe to be attractive yields. Due to their terms, however,
these securities are locked out of receiving any principal payments for
years. Because of the deferred receipt of principal payments, formulating
any conclusions on the value or performance of these securities by looking
solely at the early quarterly cash flow may not be indicative of economic
returns.
|
|
|
•
|
Cash flow
from securities and investments can be volatile from quarter to quarter
depending on the level of invested capital, the timing of credit losses,
acquisitions, sales, and changes in prepayments and interest
rates.
|
|
THE REDWOOD
REVIEW 1ST QUARTER 2010
|
23
|
|
|
|
FINANCIAL
INSIGHTS
|
Cash
Flow (continued)
|
u
|
The sources
and uses of cash in the table below are derived from our GAAP Consolidated
Statement of Cash Flow for the first quarter of 2010 and the fourth
quarter of 2009 by aggregating and netting all items in a manner
consistent with the way management analyzes them. This table excludes the
gross cash flow generated by our Sequoia and Acacia securitization
entities and the Fund (cash flow that is not available to Redwood), but
does include the cash flow distributed to Redwood as a result of our
investments in these entities. The beginning and ending cash balances
presented in the table below are GAAP
amounts.
|
|
|
|
|
|
|
|
|
|
Redwood
Sources
and Uses of Cash
|
|
|
($
in millions)
|
|
|
|
|
Three
Months Ended
|
|
|
|
|
3/31/2010
|
|
|
12/31/2009
|
|
|
|
|
|
|
|
|
|
|
Beginning
cash balance
|
|
$ |
243 |
|
|
$ |
217 |
|
|
Business cash
flow:
|
|
|
|
|
|
|
|
|
|
Cash flow
from securities and investments
|
|
$ |
193 |
|
|
$ |
134 |
|
|
Asset
management fees
|
|
|
1 |
|
|
|
1 |
|
|
Cash
operating expenses
|
|
|
(16 |
) |
|
|
(11 |
) |
|
Interest
expense on long-term debt
|
|
|
(1 |
) |
|
|
(1 |
) |
|
Total
business cash flow
|
|
|
177 |
|
|
|
123 |
|
|
|
|
|
|
|
|
|
|
|
|
Other sources
and uses:
|
|
|
|
|
|
|
|
|
|
Changes in
working capital
|
|
|
(2 |
) |
|
|
(9 |
) |
|
Acquistions
(1)
|
|
|
(156 |
) |
|
|
(68 |
) |
|
Dividends
|
|
|
(20 |
) |
|
|
(20 |
) |
|
Net other
uses
|
|
|
(178 |
) |
|
|
(97 |
) |
|
|
|
|
|
|
|
|
|
|
|
Net
(uses) sources of cash
|
|
$ |
(1 |
) |
|
$ |
26 |
|
|
Ending
cash balance
|
|
$ |
242 |
|
|
$ |
243 |
|
|
(1)Total
acquisitions in the first quarter of 2010 were $189 million, $33 million
which are not reflected in this table because they did not settle until
early April 2010. In the fourth quarter of 2009, all acquisitions were
settled within the
period.
|
|
24
|
THE REDWOOD
REVIEW 1ST QUARTER 2010
|
|
u
|
As detailed
in the table below, we now include proceeds from sales as a component of
business cash flow. While it is generally our intention when we acquire
assets to hold them to maturity and receive principal and interest
payments over their lives, we sell assets from time to time as part of our
continuing management of risk and return expectations. A sale effectively
accelerates the receipt of these cash
flows.
|
|
|
|
|
|
|
|
|
|
Redwood
|
|
|
Cash
Flow from Securities and Investments
|
|
|
($
in millions)
|
|
|
|
|
|
|
|
|
|
|
|
|
Three
Months Ended
|
|
|
|
|
3/31/2010
|
|
|
12/31/2009
|
|
|
|
|
|
|
|
|
|
|
Securities at
Redwood
|
|
|
|
|
|
|
|
Residential
Seniors
|
|
|
|
|
|
|
|
Principal and
Interest
|
|
$ |
40 |
|
|
$ |
41 |
|
|
Proceeds from
Sales
|
|
|
73 |
|
|
|
27 |
|
|
Total
|
|
|
113 |
|
|
|
68 |
|
|
|
|
|
|
|
|
|
|
|
|
Residential
Re-REMICs
|
|
|
|
|
|
|
|
|
|
Principal and
Interest
|
|
|
3 |
|
|
|
4 |
|
|
Proceeds from
Sales
|
|
|
51 |
|
|
|
31 |
|
|
Total
|
|
|
54 |
|
|
|
35 |
|
|
|
|
|
|
|
|
|
|
|
|
Residential
Subordinates principal and interest
|
|
|
8 |
|
|
|
10 |
|
|
|
|
|
|
|
|
|
|
|
|
Commercial
and CDO Subordinates
|
|
|
|
|
|
|
|
|
|
Principal and
Interest
|
|
|
1 |
|
|
|
1 |
|
|
Proceeds from
Sales
|
|
|
- |
|
|
|
8 |
|
|
Total
|
|
|
1 |
|
|
|
9 |
|
|
Total cash
flow from securities at Redwood
|
|
|
176 |
|
|
|
122 |
|
|
|
|
|
|
|
|
|
|
|
|
Investments
in the Fund
|
|
|
9 |
|
|
|
2 |
|
|
Investments
in Sequoia entities
|
|
|
8 |
|
|
|
10 |
|
|
Investments
in Acacia entities
|
|
|
- |
|
|
|
- |
|
|
Total
cash flow from securities and investments
|
|
$ |
193 |
|
|
$ |
134 |
|
|
u
|
Total cash
flow from securities and investments was $193 million for the first
quarter, an increase of $59 million from the prior quarter, primarily due
to an increased level of sales.
|
|
u
|
Total
proceeds from the sale of securities were $124 million in the first
quarter. Redwood’s investment in the Fund generated $9 million of cash
flow due to sales of securities during the
period.
|
|
THE REDWOOD
REVIEW 1ST QUARTER 2010
|
25
|
 |
|
| NEW SECURITIZATION INITIATIVE |
Summary
In
April 2010, Redwood (through Sequoia) sponsored a $238 million residential prime
jumbo mortgage securitization, referred to as SEMT 2010-H1. This was the first
prime jumbo securitization to be backed by newly originated loans in nearly two
years and was well received by triple-A investors and, importantly, did not
require credit support from the government. SEMT 2010-H1 incorporates many of
the suggestions we received as a result of meetings and conversations with
triple-A investors, major originators and servicers, rating agencies,
legislators, regulators, trade groups, and others.
Although
this transaction was successful, market participants still have more work to do
before a functioning private mortgage securitization market can fully re-emerge.
In reviewing this transaction, we will focus on six areas where reform efforts
are underway: (1) due diligence, (2) representations and warranties and
enforcement, (3) skin-in-the-game, (4) disclosures, (5) trustee independence,
and (6) securitization accounting.
Due
Diligence
|
u
|
Redwood
performed due diligence relating to the mortgage loans backing this
securitization. The securitization process started with Redwood
identifying the general credit criteria, that is the loan size, LTV and
other credit and loan characteristics, that it wanted to characterize the
loans underlying this first securitization. In conjunction with this,
Redwood representatives met with the originator to understand the
originator’s underwriting process and procedures for originating jumbo
loans. Once the pool of loans were identified as having met the general
criteria, Redwood and a third party due diligence provider reviewed every
loan for compliance with the originator’s underwriting guidelines and
criteria and for adherence to all regulatory and legal requirements. In
addition, Redwood and its third party due diligence provider reviewed each
appraisal that the originator had obtained in originating the loans. Each
loan had to be submitted to these reviews in order to be included in the
final pool. This process enabled Redwood to buy only those loans that
conformed to our own specific acquisition criteria compared to prior
industry practices in which sellers would often assemble a package of
loans that were then put out for bid to all interested parties and the
buyers had to bid on the entire
package.
|
Representations
and Warranties and Enforcement
|
u
|
Representations
and warranties provided by originators of mortgage loans included in
securitizations have traditionally varied widely across transactions and
credit classes (prime, Alt-A, subprime, etc.). The American Securitization
Forum (ASF) has developed a set of industry standard representations and
warranties to facilitate a consistent approach to enable investors to
understand protections afforded them. Additionally, the rating agencies
have also published their required representations and warranties, some of
which are slightly different from the ASF. Redwood reviewed these various
sets and developed a set of representations and warranties that meet or
exceed both of these standards.
|
|
26
|
THE REDWOOD
REVIEW 1ST QUARTER 2010
|
|
|
|
|
NEW
SECURITIZATION
INITIATIVE
|
Representations and
Warranties and Enforcement (continued)
|
u
|
In our view,
the strength of the representations and warranties is only as good as the
enforcement mechanism. To address this issue, we included a binding
arbitration clause in SEMT 2010-H1. Binding arbitration enables the
responsible parties to reach resolution on a disagreement without ending
up in litigation. We believe this mechanism will facilitate more
productive and timely responses to what, in many cases, are not always
easily resolved issues.
|
|
u
|
To further
facilitate the post-securitization review for violations of
representations and warranties, all origination files were provided to
Redwood as the buyer of the loans.
|
Skin-in-the-Game
|
u
|
It is being
proposed by various policy makers that a fixed 5% of a securitization be
retained. Others are advocating higher fixed rate percentages. A fixed
percentage is enticing as it seems easy to understand and apply. However,
we strongly believe this approach is too simplistic and could disrupt the
flow of mortgage credit to prime borrowers while inappropriately providing
an incentive to engage in securitizations of higher risk mortgage loans.
Instead, we believe the amount of risk retention in a securitization
should vary according to the underlying
risk.
|
|
u
|
One approach,
for example, would be to tie risk retention requirements to the rating
agency subordination levels. We realize there is a desire on the part of
some to reduce the amount of reliance on credit agencies and encourage
investors to undertake their own analysis. However, in our
opinion, rating agencies provide useful information. Furthermore, the
rating process establishes subordination levels after taking into
consideration the quality of the collateral and structure of the
securitization, among other
factors.
|
|
u
|
For example,
if the risk retention percentage was set at 100% of the non-investment
grade subordinate securities, then a securitization backed by prime jumbo
mortgages with the senior AAA investment grade securities representing 94%
of the securitization, the mezzanine securities (AA, A, BBB) representing
3% of the securitization, and the subordinate or non-investment grade
securities (BB, B, Not Rated) representing 3% of the securitization, the
risk retention requirement would be 3%. Alternatively, for a
securitization with lesser quality subprime mortgage collateral in a
structure in which the senior AAA securities represent 70% of the
securitization, the mezzanine securities represent 10%, and the
subordinated securities represent 20%, the retention requirement for this
transaction would be 20%.
|
|
u
|
A very
important aspect of risk retention is how that risk is retained by
sponsors. We are strong a advocate of retaining a “horizontal slice” of
first-loss credit risk from the securitization structure. We are not
advocates of the “vertical slice” approach because we strongly believe
this structure does not properly incent sponsors to structure sound
securitizations and does not necessarily align the sponsors’ interests
with those of investors. In fact, only the horizontal slice structure
fully exposes the sponsor to the majority of the credit risk in a
securitization and, as the proposals note, having sponsors maintain the
credit risk supports the notion that their interests will be properly
aligned with investors’ interests.
|
|
THE REDWOOD
REVIEW 1ST QUARTER 2010
|
27
|
|
|
| NEW SECURITIZATION INITIATIVE |
Skin-in-the-Game
(continued)
|
u
|
Examples of
the horizontal and vertical slices for a hypothetical $250 million
securitization are displayed in the diagram below. In our recent
securitization we retained both a horizontal and vertical slice of risk in
order to satisfy alternate proposals until the final rule is adopted.
However, we do not advocate this as the solution, as it will deter useful
and productive securitizations.
|
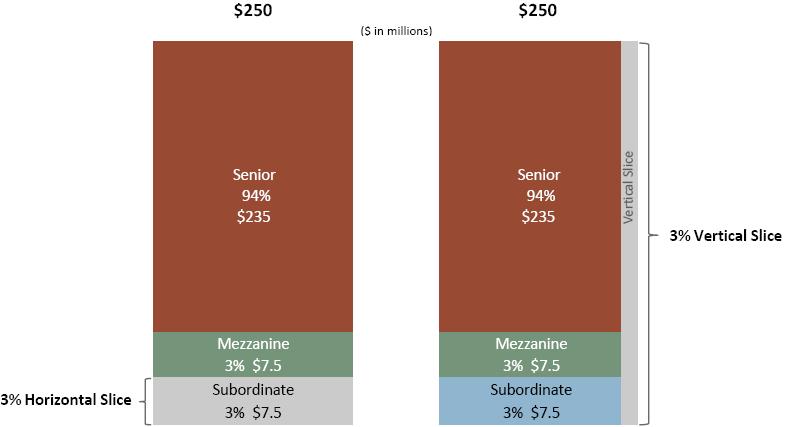
|
u
|
These are two
very different risk retention profiles. In the horizontal slice approach,
the sponsor’s entire investment ($7.5 million in this example) is in a
first loss position. Under the vertical slice approach, the sponsor has a
small amount ($450,000) in the subordinated securities and the majority of
its investment ($7.05 million) in the senior securities that are last in
line to incur credit losses. It is our opinion that the sponsor that has
all its capital in the first loss position has its interests most aligned
with the interests of all the security holders because the sponsor is
retaining the most significant portion of the
risk.
|
|
28
|
THE REDWOOD
REVIEW 1ST QUARTER 2010
|
|
|
|
|
NEW
SECURITIZATION
INITIATIVE
|
Skin-in-the-Game
(continued)
|
u
|
Advocates of
the vertical slice approach argue that by owning a piece of each (senior,
mezzanine, subordinate) security, the sponsor’s interests are more closely
aligned with all security holders than if it owned just the subordinate
securities. We believe this premise is based on prior subprime
securitizations in which the subordinate security holders that were also
the loan servicers had the ability to influence cash distributions to
their benefit resulting in a “tranche warfare” between the investment
grade and the subordinate non-investment grade security holders. It is
important to understand that subprime securitizations used
“over-collateralization” structures, which had the potential to distribute
large amounts of cash to the subordinate security holders if certain
collateral tests were met at or after the 36th month of the
securitization’s life. To insure compliance (and a payout) with the
collateral tests, some servicers bought delinquent loans out of
securitizations to the detriment of the senior security holders. We also
note that in prime securitizations, an alternative (shifting interest)
securitization structure is used, and this does not have the same features
that led to this tranche warfare that occurred in subprime
securitizations.
|
|
u
|
In addition
to using a securitization structure that requires the sponsor to retain a
horizontal slice of the securitization and thus eliminates the likelihood
of unaligned incentives, we believe the better approach to managing issues
between the different tranches of security holders is by changing the
collateral tests within the structure so that they reduce inter-tranche
conflicts. For example, in our recent securitization, for purposes of the
collateral tests, modified loans will be counted as delinquent for 12
months following the date of modification, reducing the immediate impact
of loan modifications on the allocation of cash flows between senior and
subordinate tranches.
|
|
u
|
It is
Redwood’s opinion that, while the vertical slice approach may address
certain aspects of the concerns among the different class of security
holders, it also substantially circumvents the rationale for the risk
retention requirement since the sponsor would only have a small percentage
of its investment in the subordinate securities. This opinion is supported
by many institutional investors that we have discussed this issue
with.
|
Disclosures
|
u
|
We are firmly
aligned with investors in the desire to have comprehensive disclosures
available. Comprehensive disclosure is not just the amount of information,
but consistency of definitions. For example, in the past, terms such as
“full doc” would mean different things to different investors and issuers.
So instead of relying on terms such as “full doc,” we disclose whether
assets were verified and for what period income was verified. We have also
adopted the ASF disclosure package reporting format as part of our ongoing
commitment to information consistency. This format includes an extensive
and consistent list of data points for investors to consider in their
investment decisions.
|
|
THE REDWOOD
REVIEW 1ST QUARTER 2010
|
29
|
|
|
| NEW SECURITIZATION
INITIATIVE |
Trustee
Independence
|
u
|
Another
concern for investors was the potential conflict of interest in deals in
which the originator, servicer, and trustee were the same entity (or
affiliates of each other), as it is difficult to assume that the trustee
would provide as much attention and oversight in pursuit of representation
and warranty violations against its own affiliate. To address this
concern, Redwood suggests using an independent third party to act as
trustee, as we did in our recent
securitization.
|
Securitization
Accounting
|
u
|
Redwood
supports the notion of requiring securitization sponsors or the
controlling party to consolidate securitizations in order to increase
transparency in financial statements. However, the new accounting
standards (FAS 166/167) may not result in as much consolidation as some
expect.
|
|
u
|
In a typical
residential mortgage securitization structure, if the sponsor of the
securitization is not the servicer (which is the case for
Redwood-sponsored securitizations), the sponsor generally would not
consolidate the transaction — regardless of how much skin-in-the-game is
retained — if it cedes authority over the resolution of delinquent loans
to the servicer in accordance with policy makers’ suggestions. At the same
time, the servicer likely wouldn’t consolidate this transaction either, as
it will have control but generally wouldn’t have a significant economic
interest. We think that is a surprising result — and probably not the
intended consequence of policy makers’ objectives to both shine light on
shadow banking transactions and have servicers control the resolution of
problem loans.
|
|
u
|
The
consolidation result becomes even more surprising if the securitization
sponsor is also the servicer. In such a case, the sponsor/servicer will
have control, so the consolidation determination will hinge on whether the
sponsor retained a significant economic interest in the transaction. The
accounting guidance is not specific regarding what “significant” means,
but some industry participants are interpreting this to mean more than 10%
of each tranche of the securitization sold to investors. This is where the
regulators’ definition of skin-in-the-game comes into the picture — and
where, again, reform efforts in one area can have an unintended
consequence on other areas. If skin-in-the-game is defined as a 5%
vertical slice (or a 5% ownership of each tranche of the securitization
sold to investors), then the sponsor/servicer could be considered not to
hold a significant economic interest and would, therefore, not be required
to consolidate — and neither would anyone else. On the other hand, if
skin-in-the-game is defined as a 5% horizontal slice (or the 5% most
subordinate or first loss tranche(s) of a securitization), then, it seems
to us, a more rational (and intended) consequence likely results — i.e.,
the sponsor/servicer would be required to consolidate the transaction.
Much will be riding on the outcome of the vertical and horizontal risk
retention issue.
|
|
30
|
THE REDWOOD
REVIEW 1ST QUARTER 2010
|
|
|
|
|
NEW
SECURITIZATION
INITIATIVE
|
Potential
Future Enhancements
|
u
|
We are
committed to an on going process of enhancing the Sequoia program and
securitizations of residential mortgage loans in general. However, it was
unrealistic to be able to include all potential enhancements in this first
deal. Other enhancements that we are working on
include:
|
|
|
•
|
Triple-A
investors have asked for direct access to mortgage loan files in order to
independently assess the borrowers’ credit and the underwriting decisions.
While we understand the intent, logistics and privacy concerns need to be
addressed before full access to files can be
offered.
|
|
|
•
|
Second liens
continue to be a concern in the market and investors are wary about a
potential material change in a borrower’s risk if a second lien on the
property is taken out after closing of the first lien. We are reviewing
what processes could be established to limit the ability of lenders to
place second liens on properties without the consent of first mortgage
holders, or that would enable ongoing disclosure to investors regarding
second lien balances in the deals we sponsor so that investors can
understand how their potential risk may change as a result of second
liens.
|
|
THE REDWOOD
REVIEW 1ST QUARTER 2010
|
31
|
 |
|
| RESIDENTIAL REAL ESTATE
SECURITIES |
Summary
Redwood
invests in securities that are backed by pools of residential real estate loans.
Some of our investments in residential real estate securities are backed by
prime residential loans, while others are backed by non-prime loans such as
Alt-A loans. Historically, we used our credit risk analysis capabilities to
guide us in the acquisition of subordinate securities, which carry concentrated
credit risk. More recently, our credit risk analysis has been applicable to
understanding the range of risks and returns applicable to senior securities,
which carry less concentrated credit risk, and since 2008 our acquisitions have
been heavily weighted to this type of security. The following discussion refers
only to the residential securities owned by Redwood, exclusive of the securities
owned by the Fund, Sequoia entities, and Acacia entities, and exclusive of
Redwood’s investments in these entities.
Market
Conditions and Portfolio Activity
|
u
|
During the
first quarter, market prices for non-agency RMBS initially decreased and
subsequently increased and ended the quarter at prices relatively close to
where they began. The following chart illustrates generic prices that
investors were willing to pay for senior RMBS from the beginning of 2008
through March 2010.
|
Senior RMBS
Prices
|
32
|
THE REDWOOD
REVIEW 1ST QUARTER 2010
|
|
|
|
|
RESIDENTIAL REAL ESTATE
SECURITIES
|
Market Conditions and
Portfolio Activity (continued)
|
u
|
During the
first quarter, we acquired $180 million and sold $124 million of RMBS. The
return of greater liquidity in the RMBS market allowed us to monetize some
of the future expected cash flow in the current period. We may continue to
sell assets into this market if we believe it is in the best interest of
our shareholders.
|
|
u
|
During April
2010, we purchased $5 million of securities and sold $94 million of
securities. (In addition, we invested $28 million in our new
securitization, SEMT 2010-H1, which is discussed in the New Securitization
Initiatives module.)
|
Housing
Prices
|
u
|
Fundamentals
have caused house price depreciation since 2006 (~29% in the Case Shiller
Composite-20), which has been sufficient to restore nationwide housing
affordability to levels we believe are consistent with long-term
stability. Price-to-rent and price-to-income metrics are within their
historic range, which suggests that the fundamentally driven reversion in
home prices is nearing an end for the nation as a whole. This may not
necessarily be true for each
market.
|
|
u
|
Further,
price risk stems from more “technical” issues. Oversupply continues to be
a major obstacle to a recovery in home prices. Even in markets where
affordability has been restored, supply overhang is holding prices down.
Excess supply is a key reason for our belief that housing prices have
further to decline.
|
|
u
|
Housing
inventories have increased since January. The National Association of
Realtors reported that the number of homes for sale in March increased 9%
quarter-over-quarter, and months of supply has increased 11% to 8 months
over the same period.
|
|
|
•
|
The relative
stability of home prices in 2009 was due in part to 9 months of declining
inventories. A reversal of this trend will have negative consequences for
housing markets in 2010.
|
|
|
•
|
This new
supply may represent new listings of seriously delinquent mortgage
properties. This “shadow inventory,” which Amherst Securities estimates at
over 7 million homes, potentially represents another 16 months of
supply.
|
|
|
•
|
A portion of
the increase reflects the seasonality of home listings, which normally
increase during the spring and summer. From 2000-2009, both inventories
and months of supply have increased 6% on average during the first quarter
of the calendar year. The first quarter 2010 readings noted above suggest
that there are other, non-seasonal forces
involved.
|
Loan
Modifications
|
u
|
The
Treasury’s goal through the Home Affordable Modification Program (HAMP) is
to help 3 to 4 million homeowners avoid foreclosure through 2012. This
program continues to move forward at a slower than originally anticipated
pace. According to the Treasury Department’s latest data for March 2010,
over 1.4 million borrowers have been offered trial modifications, 1.2
million modification trials have been initiated, and 230,801 trials have
been made permanent. Loan servicers continue to face a large backlog of
delinquent loans, conflicts remain between the interests of first- and
second-lien holders, borrowers are not providing documentation, and
borrowers with significant negative equity have little incentive to
continue making payments.
|
|
THE REDWOOD
REVIEW 1ST QUARTER 2010
|
33
|
|
|
| RESIDENTIAL REAL ESTATE
SECURITIES |
Loan Modifications
(continued)
|
u
|
In late
March, the Treasury amended the HAMP program to add principal reduction as
a potential option for servicers. As we noted in a prior Review, with
approximately 25% of borrowers having negative equity and projections for
that percentage to approximately double over the next two years, many
borrowers with negative equity have few incentives to continue making
their payments, particularly if they have little or no hope of recovering
lost value. It is too early to determine how successful principal
reductions will be since the program is voluntary for lenders and
borrowers must be current on their existing mortgages and must fully
document their loan applications.
|
|
u
|
The presence
of second mortgage liens on many houses complicates loan modification
efforts. In summary, second lien holders, who often have recourse to
borrowers for balance deficiencies, are often unwilling or have little
incentive to work with borrowers and holders of first mortgages,
particularly borrowers who are perceived to be engaging in strategic
defaults. Strategic defaults occur when borrowers have the capacity to pay
and decide not to pay their mortgages, often to gain negotiating leverage
to obtain loan modifications. In late March, the Treasury issued details
of its second-lien modification program, which includes financial
incentives for second-lien holders to participate. The second-lien program
will take some time to implement and additional details and procedures
still need to be worked out, which will likely further delay loan
modifications in the near term.
|
Delinquencies
|
u
|
Industry-wide,
the first quarter increase in the level of delinquencies continues to be
within our expectations. According to LoanPerformance, the percentage of
non-agency borrowers who have missed two or more payments (60+ days) is
nearly 10% for prime borrowers and 31% for Alt-A borrowers on an
industry-wide basis. At Redwood, 60+ days delinquencies on loans
underlying the prime and non-prime residential securities we own are
modestly lower than the industry.
|
Prepayments
|
u
|
According to
data from LoanPerformance, industry-wide prepayment rates on prime loans
were unchanged in the first quarter at 15% CPR. Prepayment rates on loans
underlying prime RMBS held by Redwood continue to be modestly faster than
the industry average, reflecting the concentration of securities we own in
older vintages.
|
|
u
|
Industry-wide,
prepayment rates for Alt-A loans were approximately 5% in the first
quarter according to data from LoanPerformance. The prepayment rates on
non-prime securities we own (which are predominately backed by Alt-A
loans) were also modestly faster than the industry average, also
reflecting the concentration of our securities in older vintages. Given
the more stringent underwriting guidelines in the current environment, we
expect prepayment rates on Alt-A loans to remain at low
levels.
|
|
34
|
THE REDWOOD
REVIEW 1ST QUARTER 2010
|
|
|
|
|
RESIDENTIAL REAL ESTATE
SECURITIES
|
Prepayments
(continued)
|
u
|
Industry-wide,
prime prepayment speeds have been strongly correlated with loan age as
more seasoned loans (which generally have more equity) are prepaying in
the mid-to-high teens compared to the low-teens for more recent
vintages.
|
|
u
|
Prepayment
speeds on many of the securities we own have generally been ahead of our
expectations from the time of acquisition. To the extent that prepayment
rates remain above our expectations, all else being equal, the yields on
our securities will increase as we will realize our unamortized discount
sooner.
|
Quarterly
Update
|
u
|
Interest
income generated by residential securities we own was $27 million in the
first quarter of 2010, an annualized yield of 16% on the amortized cost of
these securities. The increase in yield from the prior quarter reflects
the expectation of higher interest rates on floating rate securities,
consistent with many market forecasts for future benchmark LIBOR rates.
Note that this expectation also informed our decision to hedge our
floating rate long-term debt in the first
quarter.
|
|
u
|
At March 31,
2010, the fair value of residential securities we own totaled $830
million, consisting of $372 million in prime senior securities, $368
million in non-prime senior securities, $67 million in re-REMIC
securities, and $23 million in subordinate securities. Each of these is
further discussed below.
|
|
u
|
The
securities we held at March 31, 2010, consisted of fixed-rate assets
(38%), adjustable-rate assets that reset within the next year (43%),
hybrid assets that reset between 12 and 36 months (6%), and hybrid assets
that reset after 36 months (13%).
|
|
THE REDWOOD
REVIEW 1ST QUARTER 2010
|
35
|
|
|
| RESIDENTIAL REAL ESTATE
SECURITIES |
Residential
Prime Senior Securities Portfolio
What
is this?
Residential
prime securities are mortgage-backed securities backed by prime residential
mortgage loans. Senior securities are those interests in a securitization that
have the first right to cash flows and are last in line to absorb losses.
Information on prime senior securities we own and underlying loan
characteristics are set forth in Tables 6 through 9A in the Financial Tables in
this Review.
Quarterly
Update
|
u
|
The following
table presents information on residential prime senior securities at
Redwood at March 31, 2010.
|
|
|
|
|
|
|
|
|
|
|
|
|
|
|
|
|
|
|
Credit
Support Analysis - Prime Senior Securities at Redwood
|
|
By
Vintage
|
|
March
31, 2010
|
|
($
in millions)
|
|
|
|
|
|
|
|
|
|
|
|
|
|
|
|
|
|
|
|
<=2004
|
|
2005
|
|
2006
|
|
2007
|
|
Total
|
|
|
|
|
|
|
|
|
|
|
|
|
|
|
|
|
|
|
|
Current
face
|
|
$ |
17 |
|
|
$ |
340 |
|
|
$ |
16 |
|
|
$ |
78 |
|
|
$ |
451 |
|
|
Net
unamortized discount
|
|
|
(4 |
) |
|
|
(89 |
) |
|
|
(5 |
) |
|
|
(16 |
) |
|
|
(114 |
) |
|
Credit
reserve
|
|
|
- |
|
|
|
(9 |
) |
|
|
- |
|
|
|
(6 |
) |
|
|
(15 |
) |
|
Unrealized
gains (losses)
|
|
|
1 |
|
|
|
43 |
|
|
|
(1 |
) |
|
|
7 |
|
|
|
50 |
|
|
|
|
|
|
|
|
|
|
|
|
|
|
|
|
|
|
|
|
|
|
|
|
Fair
value of AFS Prime Senior Securities
|
|
$ |
14 |
|
|
$ |
285 |
|
|
$ |
10 |
|
|
$ |
63 |
|
|
$ |
372 |
|
|
|
|
|
|
|
|
|
|
|
|
|
|
|
|
|
|
|
|
|
|
|
|
Overall credit support to Prime
Senior Securities (1)
|
|
|
11.00 |
% |
|
|
7.33 |
% |
|
|
6.28 |
% |
|
|
7.03 |
% |
|
|
7.31 |
% |
|
Serious delinquencies as a % of
collateral balance (1)
|
|
|
7.87 |
% |
|
|
7.41 |
% |
|
|
8.59 |
% |
|
|
7.44 |
% |
|
|
7.48 |
% |
|
|
|
|
|
|
|
|
|
|
|
|
|
|
|
|
|
|
|
|
|
|
|
(1) Overall
credit support and serious delinquency rates are weighted by
securitization balances. Credit support and delinquencies may vary
significantly by securitization. Serious delinquencies include loans over
90-days past due, in foreclosure, and
REO.
|
|
u
|
The overall
credit support data presented in the table above represents the level of
support for prime securities owned by Redwood. At March 31, 2010, the
overall level of credit support was 7.31%, which means that losses in the
aggregate would have to exceed this amount of the current face amount of
the securities before Redwood would suffer losses. However, some
securities have either more or less credit support than others, so it is
possible for some securities to incur losses without aggregate losses
exceeding the overall credit support. For example, in the first quarter of
2010, we incurred credit losses of $2 million for GAAP purposes on senior
securities, even though aggregate losses did not exceed our overall credit
support. Over time, the performance of these securities may require a
change in the amount of credit reserves we designate. We acquire
securities assuming a range of outcomes and believe our returns can still
be attractive even if losses increase above our current
estimates.
|
|
u
|
Comparing the
level of credit support available to seriously delinquent loans provides a
measure of the level of credit sensitivity that exists within our senior
securities portfolio. For example, the senior securities have 7.31% of
credit support with serious delinquencies currently at 7.48%. Assuming a
historically high 50% loss severity on these loans would produce losses of
3.74%, leaving enough credit support for an additional 3.57% of losses
before the senior securities would start to absorb credit
losses.
|
|
36
|
THE REDWOOD
REVIEW 1ST QUARTER 2010
|
|
|
|
|
RESIDENTIAL REAL ESTATE
SECURITIES
|
Residential
Non-Prime Senior Securities Portfolio
What
is this?
Residential
non-prime securities are mortgage-backed securities backed by non-prime
residential mortgage loans. Non-prime residential loans include Alt-A and Option
ARM mortgage loans. Senior securities are those interests in a securitization
that have the first right to cash flows and are last in line to absorb losses.
Information on non-prime senior securities we own and underlying loan
characteristics are set forth in Tables 6 through 9B in the Financial Tables in
this Review.
Quarterly
Update
|
u
|
The following
table presents information on residential non-prime senior securities at
Redwood at March 31, 2010.
|
|
|
|
|
|
|
|
|
|
|
|
|
|
|
|
|
|
|
Credit
Support Analysis - Non-Prime Senior Securities at Redwood
|
|
|
By
Vintage
|
|
|
March
31, 2010
|
|
|
($
in millions)
|
|
|
|
|
|
|
|
|
|
|
|
|
|
|
|
|
|
|
|
|
|
<=2004
|
|
|
2005
|
|
|
2006
|
|
|
2007
|
|
|
Total
|
|
|
|
|
|
|
|
|
|
|
|
|
|
|
|
|
|
|
|
Current
face
|
|
$ |
142 |
|
|
$ |
302 |
|
|
$ |
26 |
|
|
$ |
2 |
|
|
$ |
472 |
|
|
Net
unamortized discount
|
|
|
(39 |
) |
|
|
(86 |
) |
|
|
(8 |
) |
|
|
- |
|
|
|
(133 |
) |
|
Credit
reserve
|
|
|
- |
|
|
|
(10 |
) |
|
|
(3 |
) |
|
|
- |
|
|
|
(13 |
) |
|
Unrealized
gains (losses)
|
|
|
14 |
|
|
|
20 |
|
|
|
2 |
|
|
|
- |
|
|
|
36 |
|
|
|
|
|
|
|
|
|
|
|
|
|
|
|
|
|
|
|
|
|
|
|
|
Fair
value of Non-Prime Senior Securities (AFS)
|
|
$ |
117 |
|
|
$ |
226 |
|
|
$ |
17 |
|
|
$ |
2 |
|
|
$ |
362 |
|
|
|
|
|
|
|
|
|
|
|
|
|
|
|
|
|
|
|
|
|
|
|
|
Overall credit support to
Non-Prime Senior Securities (1)
|
|
|
15.73 |
% |
|
|
16.39 |
% |
|
|
27.54 |
% |
|
|
4.22 |
% |
|
|
16.68 |
% |
|
Serious delinquencies as a % of
collateral balance (1)
|
|
|
11.02 |
% |
|
|
13.96 |
% |
|
|
22.46 |
% |
|
|
7.15 |
% |
|
|
13.78 |
% |
|
|
|
|
|
|
|
|
|
|
|
|
|
|
|
|
|
|
|
|
|
|
|
Fair
value of Non-Prime Senior Securities (trading)
|
|
$ |
- |
|
|
$ |
6 |
|
|
$ |
- |
|
|
$ |
- |
|
|
$ |
6 |
|
|
|
|
|
|
|
|
|
|
|
|
|
|
|
|
|
|
|
|
|
|
|
|
Total
fair value of Non-Prime Senior Securities
|
|
$ |
117 |
|
|
$ |
232 |
|
|
$ |
17 |
|
|
$ |
2 |
|
|
$ |
368 |
|
|
(1) Overall
credit support and serious delinquency rates are weighted by
securitization balances. Credit support and delinquencies may vary
significantly by securitization. Serious delinquencies include loans over
90-days past due, in foreclosure, and
REO.
|
|
u
|
Serious
delinquencies in our non-prime senior portfolio are significantly higher
than in our prime senior portfolio. However, the levels of credit and
structural support are also significantly higher and, as a result, our
non-prime senior portfolio is better able to withstand the higher levels
of credit losses we expect to incur on these
pools.
|
|
THE REDWOOD
REVIEW 1ST QUARTER 2010
|
37
|
|
|
| RESIDENTIAL REAL ESTATE
SECURITIES |
Residential
Non-Senior Securities Portfolio
What
is this?
Non-senior
securities include subordinate and re-REMIC securities. We combine them in this
section as together they currently represent a small portion of our investments.
Subordinate securities are those interests in a securitization that have the
last right to cash flows and are first in line to absorb losses and are backed
by prime and non-prime residential loans. A re-REMIC is a re-securitization of
asset-backed securities where the re-REMIC, the cash flows from, and any credit
losses absorbed by, the underlying asset-backed securities are allocated among
the securities issued in the re-securitization transaction in a variety of ways.
Information on our non-senior securities is set forth in Tables 6 through 9B in
the Financial Tables in this Review.
Quarterly
Update
|
u
|
The following
table presents information on residential non-senior securities at Redwood
at March 31, 2010.
|
|
|
|
|
|
|
|
|
|
|
|
|
Residential
Non-Senior Securities at Redwood
|
|
|
March
31, 2010
|
|
|
($
in millions)
|
|
| |
|
|
|
|
|
|
|
re-REMIC
|
|
|
Total
|
|
| |
|
|
|
|
|
|
|
|
|
|
Available for
sale (AFS)
|
|
|
|
|
|
|
|
|
|
|
Current
face
|
|
$ |
383 |
|
|
$ |
148 |
|
|
$ |
531 |
|
|
Credit
reserve
|
|
|
(312 |
) |
|
|
(43 |
) |
|
|
(355 |
) |
|
Net
unamortized discount
|
|
|
(26 |
) |
|
|
(69 |
) |
|
|
(95 |
) |
|
Amortized
cost
|
|
|
45 |
|
|
|
36 |
|
|
|
81 |
|
|
|
|
|
|
|
|
|
|
|
|
|
|
|
|
Unrealized
gains
|
|
|
2 |
|
|
|
31 |
|
|
|
33 |
|
|
Unrealized
losses
|
|
|
(24 |
) |
|
|
- |
|
|
|
(24 |
) |
|
|
|
|
|
|
|
|
|
|
|
|
|
|
|
Fair
value of AFS non-senior securities
|
|
$ |
23 |
|
|
$ |
67 |
|
|
$ |
90 |
|
|
u
|
Credit losses
totaled $45 million in our residential subordinate portfolio in the first
quarter, a significant reduction from $98 million of losses in the fourth
quarter of 2009. We expect future losses will extinguish the majority of
these securities as reflected by the $312 million of credit reserves we
have provided for the $383 million face value of those securities. Until
the losses occur, we will continue to earn interest on the face value of
those securities.
|
|
u
|
There were no
credit losses in our re-REMIC portfolio in the first quarter. We do
anticipate losses and have set aside $43 million of the $148 million in
face value as credit reserves.
|
|
u
|
Our existing
portfolio of re-REMIC securities consist of prime residential senior
securities that have recently been pooled and re-securitized to create a
two-tranche structure and we own the support (or junior) security within
that structure.
|
|
u
|
In the first
quarter, we sold certain re-REMIC securities as part of our continuing
process of managing our risk and return profiles. These sales resulted in
substantial realized gains.
|
|
38
|
THE REDWOOD
REVIEW 1ST QUARTER 2010
|
|
|
|
|
COMMERCIAL
REAL ESTATE SECURITIES
|
Summary
Redwood
invests in commercial real estate loans and securities. Our existing commercial
investments at Redwood are predominately subordinate securities. We currently
expect to invest in newly originated commercial loans in the near future if we
identify attractive investment opportunities. This discussion is exclusive of
commercial securities and loans owned by Acacia entities.
Market
Conditions
|
u
|
Property
level fundamentals continue to deteriorate. As a result, the universe of
commercial real estate loans in bankruptcy, foreclosure, REO, being
modified or extended, or in default continues to rise (as illustrated in
the chart below). The volume of securitized commercial loans that are in
special servicing continues to grow and currently stands at $76 billion,
or 9.55% of all securitized commercial loans according to Realpoint,
LLC.
|
Cumulative
Distress Volume
($ in billions)
|
u
|
Other signs
of the distress in the commercial mortgage and property markets include
the trends in delinquencies and vacancies. For $1.3 trillion of commercial
and multifamily loans on bank balance sheets, the FDIC reports the 90+
days delinquent and non-accrual rate rose to 3.9% in the fourth quarter of
2009, up from 1.6% from a year ago, and are likely to continue to rise at
a brisk pace. For the $797 billion CMBS market, data supplied by
Realpoint, LLC, shows delinquencies rose to 6.4% at March 31, 2010, up
from 1.7% a year ago. The national vacancy rate for shopping centers
(10.8%), is at the highest level since 1991, the vacancy rates for malls
(8.9%) is at its highest level since being tracked, while the vacancy rate
for office properties (17.2%) is at the highest level since 2004. The
apartment sector may be showing signs of stabilizing as multifamily
vacancy held flat at 8.0% compared to the prior
quarter.
|
|
THE REDWOOD
REVIEW 1ST QUARTER 2010
|
39
|
|
|
|
|
COMMERCIAL
REAL ESTATE
SECURITIES
|
Market Conditions
(continued)
|
u
|
Sales and
financing activity remain at historic lows, though it is worth noting that
sales volumes in recent quarters are trending upwards, as illustrated in
the chart below. Commercial mortgage originations increased in the fourth
quarter, but remain at a low level in absolute terms. Commercial loan
originations were 12% higher than the same period last
year.
|
Commercial/Multifamily
Property Sales
($ in billions)
|
u
|
In spite of
the negative trends in the commercial market, we have seen that debt
availability has improved noticeably for higher quality assets. With life
insurers, banks, and conduit lenders eager to finance stabilized
properties in strong markets, lending spreads for these types of
properties have compressed
significantly.
|
|
40
|
THE REDWOOD
REVIEW 1ST QUARTER 2010
|
|
|
|
|
COMMERCIAL
REAL ESTATE SECURITIES
|
Market Conditions
(continued)
|
u
|
In the near
future, the demand for commercial real estate financing is expected to
greatly exceed the anticipated capacity, which we believe may result in a
long-term, sustainable opportunity to deploy capital at attractive rates
of return. Some in the industry estimate $30 billion of public and private
capital is available to support the debt financing market. However, this
is only a fraction of the estimated $300 billion needed to refinance
commercial loans in just in the next year. In fact, loan maturities in
2011, 2012, and 2013 feature the largest volume of maturing loans in
history, totaling over $900 billion. As the graph below illustrates,
elevated levels of debt maturities are expected to continue for several
years.
|
Total Cumulative
Secured and Unsecured Debt
Commercial
Mortgage Maturities
(in billions)
Quarterly
Update
|
u
|
Our portfolio
of commercial securities (acquired prior to 2008) generated $1 million of
cash flow during the first quarter, the same as in the prior
quarter.
|
|
u
|
Realized
credit losses in the first quarter of 2010 on our commercial subordinate
securities were $7 million and were charged against our designated credit
reserve.
|
|
u
|
At March 31,
2010, our investments in commercial securities consisted of predominantly
2004 and 2005 vintage subordinate securities with a fair market value of
$9 million. These securities have a face value of $152 million and credit
reserves of $139 million.
|
|
THE REDWOOD
REVIEW 1ST QUARTER 2010
|
41
|
|
|
|
|
INVESTMENTS
IN SECURITIZATION ENTITIES
|
Summary
What
is this?
We
sponsor Sequoia and Acacia securitization entities that acquire mortgage loans
and securities and create and issue ABS backed by these loans and securities. In
April 2010, we sponsored our first Sequoia securitization since mid-2007 and we
plan to sponsor additional Sequoia securitizations in the future.
Our
investments in Sequoia entities include senior and subordinate securities issued
by these entities as well as interest-only securities (IOs) issued by these
entities. Our investments in Acacia entities include equity interests and other
securities issued by these entities. We also receive asset management fees from
Acacia entities.
Quarterly
Update
|
u
|
In the first
quarter, we reported GAAP income of $2 million from the Sequoia and Acacia
entities. This was a decrease from the $5 million reported in the fourth
quarter due to higher net negative market valuation adjustments on the
Acacia assets and liabilities.
|
|
u
|
Cash
generated by our investments in Sequoia and Acacia entities totaled $8
million in the first quarter of 2010 compared to $10 million in the fourth
quarter of 2009. The majority ($7 million) of this first quarter cash flow
was generated from Sequoia IOs we own which were primarily issued in 2005
and earlier.
|
|
u
|
Our
investments in consolidated securitization entities do not appear on our
balance sheet as assets; rather, they are reflected as the difference
between the consolidated assets of Sequoia and Acacia entities ($4.1
billion at March 31, 2010) and the consolidated Sequoia and Acacia ABS
issued to third parties ($4.0 billion at March 31, 2010). The assets and
liabilities of consolidated Sequoia entities are carried on our balance
sheet at their amortized cost and the assets and liabilities of
consolidated Acacia entities are carried on our balance sheet at their
fair market values. At March 31, 2010, the GAAP book value of our
investments in Sequoia and Acacia entities was $78 million, or 8% of our
reported book value.
|
|
u
|
The reported
book value of our investments in Sequoia and Acacia entities differs from
the $48 million estimated fair value of our investments in these
securitization entities, which consists of $38 million of IOs issued by
Sequoia entities, $10 million of senior and subordinate securities issued
by Sequoia entities, and a minimal amount representing the estimated fair
value of expected future management fees from Acacia discounted at
45%.
|
|
u
|
The
consolidation of the assets and liabilities of securitization entities may
lead to potentially volatile quarterly reported earnings for a variety of
reasons including the amortization of premium on the loans and liabilities
of Sequoia entities, changes in credit loss provisions for loans held by
Sequoia entities, fair value adjustments for the assets and liabilities of
the Acacia entities, and deconsolidation
events.
|
|
42
|
THE REDWOOD
REVIEW 1ST QUARTER 2010
|
|
|
|
|
INVESTMENTS
IN SECURITIZATION
ENTITIES
|
Quarterly Update
(continued)
|
u
|
Our Sequoia
IOs earn the “spread” between the coupon rate on the $2.3 billion notional
amount of underlying adjustable-rate mortgage (ARM) loans and the cost of
funds (indexed to one-month LIBOR) on the ABS issued within each
respective securitization entity. Since these IOs do not receive any
principal cash flows, the longer they receive this interest rate spread,
the higher the return. Thus, slower rates of principal repayments (i.e.,
the longer the underlying loans are outstanding) increase cash flows and
returns on these IOs. In March 2010, these loans had a weighted average
coupon of 1.92%. As we have seen for the past several quarters (and expect
to continue to experience as long as short-term rates remain low),
prepayment speeds on the underlying loans remain low, and averaged less
than 8% CPR in the first quarter.
|
|
u
|
For the 48
prime jumbo residential mortgage securitizations totaling $35 billion
issued by our Sequoia securitization entities (including five
securitizations for which a subsidiary of Redwood was the depositor but
which were not issued under the Sequoia program shelf registration
statement), cumulative losses total 0.28% of the original face amount of
the securities through
March 2010.
|
|
u
|
To date,
credit losses have not yet been incurred on any of the senior securities
issued by Sequoia entities in these securitizations, although a few of
these senior securities may incur losses in the future, depending on the
magnitude and timing of additional credit losses incurred by the
underlying loans.
|
|
u
|
The
information provided in the preceding two paragraphs references all
Sequoia securitizations, regardless of whether we are currently
consolidating the assets and liabilities for the specific Sequoia
securitization entity. Thus, delinquency information presented herein will
differ from information provided regarding Sequoia entities only included
in our consolidated balance sheet as of March 31,
2010.
|
|
u
|
In April
2010, we completed a $238 million prime jumbo residential mortgage
securitization through our Sequoia program. In this securitization 95% of
the senior securities were purchased by third parties, while Redwood
retained all of the subordinated securities (representing 6.5% of the
securitization), 5% of the senior securities, and the IO securities. We
anticipate consolidating this entity for financial reporting purposes,
pending our final interpretation of applicable GAAP pertaining to the
transfer of financial assets and consolidation of variable interest
entities. Additional information regarding this securitization is provided
in the New Securitization Initiative
module.
|
|
THE REDWOOD
REVIEW 1ST QUARTER 2010
|
43
|
44

Mark-to-Market
Valuation Process
|
u
|
Market values
reflect an “exit price,” or the amount we believe we would realize if we
sold an asset or would pay if we repurchased a liability in an orderly
transaction, even though we generally have no intention — nor would we be
required — to sell assets or repurchase liabilities. Establishing market
values is inherently subjective and requires us to make a number of
assumptions, including the future of interest rates, prepayment rates,
discount rates, credit loss rates, and the timing of credit losses. The
assumptions we apply are specific to each asset or
liability.
|
|
u
|
Although we
rely on our internal calculations to compute the fair value of our
securities, we request and consider indications of value (marks) from
third-party dealers to assist us in our mark-to-market valuation process.
For March 31, 2010, we received dealer marks on 81% of our assets and 92%
of our liabilities. In the aggregate, our internal valuations of the
securities on which we received dealer marks were 4% lower (i.e., more
conservative) than the dealer marks and our internal valuations of our ABS
issued on which we received dealer marks were 9% higher (i.e., more
conservative) than the dealer
marks.
|
Determining
Other-Than-Temporary Impairments
|
u
|
As discussed
in our second quarter 2009 Redwood Review, on April 1, 2009, we were
required to adopt a new accounting principle affecting the determination
of other-than-temporary impairment (OTTI) and its recognition through the
income statement and balance sheet. The revised multi-step process is
presented below. Upon adoption, we made a one-time retained earnings
reclassification of $60 million of prior impairments. As a result of this
reclassification, our book value did not change. As this impairment is
recovered over time, rather than flow through earnings (where the
impairment was originally reported), it will instead be credited to
equity. The net impact is that our cumulative reported earnings will now
be $60 million less than they would have been prior to adopting this
required accounting principle.
|
|
46
|
THE REDWOOD
REVIEW 1ST QUARTER 2010
|
ACACIA
Acacia is the brand
name for the collateralized debt obligation (CDO) securitizations Redwood
sponsored.
ADJUSTABLE-RATE
MORTGAGES (ARMs)
Adjustable-rate
mortgages are loans that have coupons that adjust at least once per year. We
make a distinction between ARMs (loans with a rate adjustment at least annually)
and hybrids (loans that have a fixed-rate period of 2-to-10 years and then
become adjustable-rate).
AGENCY
Agency refers to
government-sponsored enterprises (GSEs), including Federal National Mortgage
Association (Fannie Mae), Federal Home Loan Mortgage Corporation (Freddie Mac),
and Government National Mortgage Association (Ginnie Mae).
ALT-A
SECURITIES and ALT-A LOANS
Alt-A securities
are residential mortgage-backed securities backed by loans that have higher
credit quality than subprime and lower credit quality than prime. Alt-A
originally represented loans with alternative documentation, but the definition
has shifted over time to include loans with additional risk characteristics and
a higher percentage of investor loans. In an Alt-A loan, the borrower’s income
may not be verified, and in some cases, may not be disclosed on the loan
application. Alt-A loans may also have expanded criteria that allow for higher
debt-to-income ratios with higher accompanying loan-to-value ratios than would
otherwise be permissible for prime loans.
AMORTIZED
COST
Amortized cost is
the initial acquisition cost of an available-for-sale (AFS) security, minus
principal repayments or principal reductions through credit losses, plus or
minus premium or discount amortization. At the point in time an AFS security is
deemed other-than-temporarily impaired, the amortized cost is adjusted (by
changing the amount of unamortized premium or discount) by the amount of
other-than-temporary impairment taken through the income statement.
ASSET-BACKED
SECURITIES (ABS)
Asset-backed
securities (ABS) are securities backed by financial assets that generate cash
flows. Each ABS issued from a securitization entity has a unique priority with
respect to receiving principal and interest cash flows and absorbing any credit
losses from the assets owned by the entity.
AVAILABLE-FOR-SALE
(AFS)
An accounting
method for debt and equity securities in which the securities are reported at
their fair value on the balance sheet. Positive changes in the fair value are
accounted for as increases to stockholders’ equity and do not flow through the
income statement. Negative changes in fair value may be recognized through the
income statement or balance sheet, as further detailed in the Accounting
Discussion module.
BOOK
VALUE (GAAP)
Book value is the
value of our common equity in accordance with GAAP.
|
THE REDWOOD
REVIEW 1ST QUARTER 2010
|
47
|
COLLATERALIZED
DEBT OBLIGATION (CDO) SECURITIZATIONS
The securitization
of a diverse pool of assets.
COMMERCIAL
MORTGAGE-BACKED SECURITIES (CMBS)
A type of
mortgage-backed security that is secured by one or more loans on commercial
properties.
CONSTANT
(or CONDITIONAL) PREPAYMENT RATE (CPR)
Constant (or
conditional) prepayment rate (CPR) is an industry-standard measure of the speed
at which mortgage loans prepay. It approximates the annual percentage rate at
which a pool of loans is paying down due to unscheduled principal
prepayments.
CORE
EQUITY
Core equity is not
a measure calculated in accordance with GAAP. GAAP equity includes
mark-to-market adjustments for some of our assets and interest rate agreements
in “accumulated other comprehensive income (loss).” Core equity excludes
accumulated other comprehensive income (loss). Core equity in some ways
approximates what our equity value would be if we used historical amortized cost
accounting exclusively. A reconciliation of core equity to GAAP appears in the
Table 4 in the Financial Tables in this Review.
CREDIT
SUPPORT
Credit support is
the face amount of securities subordinate (or junior) to the applicable security
that protects the security from credit losses and is generally expressed as a
percentage of the securitization’s underlying pool balance.
DEBT
Debt is an
obligation of Redwood. See Long-term debt and Short-term debt.
ECONOMIC
VALUE (MANAGEMENT’S ESTIMATE OF ECONOMIC VALUE)
Economic value
closely relates to liquidation value and is calculated using the bid-side marks
(or estimated bid-side values) for all of our financial assets, and offered-side
marks (or estimated offered-side values) for all of our financial liabilities.
We calculate management’s estimate of economic value as a supplemental measure
to book value calculated under GAAP. Our economic value estimates on a per-share
basis are reconciled to GAAP book values per share in Table 4 in the Financial
Tables of this Review.
FASB
Financial
Accounting Standards Board.
THE
FUND
The Fund refers to
the Redwood Opportunity Fund, L.P., which is managed by Redwood Asset
Management, Inc., a wholly-owned subsidiary of Redwood.
GAAP
Generally Accepted
Accounting Principles in the United States.
|
48
|
THE REDWOOD
REVIEW 1ST QUARTER 2010
|
INTEREST-ONLY
SECURITIES (IOs)
Interest-only
securities (IOs) are specialized securities created by securitization entities
where the projected cash flows generated by the underlying assets exceed the
cash flows projected to be paid to the ABS issued that have principal balances.
Typically, IOs do not have a principal balance and they will not receive
principal payments. Interest payments to IOs usually equal an interest rate
formula multiplied by a “notional” principal balance. The notional principal
balances for IOs are typically reduced over time as the actual principal
balances of the underlying pools of assets pay down, thus reducing the cash
flows to the IOs over time. Cash flows on IOs are typically reduced more quickly
when asset prepayments accelerate.
LEVERAGE
RATIOS
When determining
Redwood’s financial leverage, traditional leverage ratios may be misleading in
some respects if consolidated ABS issued from securitization entities are
included as part of Redwood’s obligations when calculating this or similar
ratios. Because of the requirement to consolidate the independent securitization
entities for GAAP accounting purposes, it appears that Redwood is highly
leveraged, with total consolidated liabilities significantly greater than
equity. The obligations of these securitization entities are not obligations of
Redwood.
LONG-TERM
DEBT
Long-term debt is
debt that is an obligation of Redwood that is not payable within a year and
includes junior subordinated notes and trust preferred securities. We generally
treat long-term debt as part of our capital base when it is not payable in the
near future.
MARK-TO-MARKET
(MTM) ACCOUNTING
Mark-to-market
accounting uses estimated fair values of assets, liabilities, and hedges. Many
of our assets are carried on our balance sheet at their fair value rather than
amortized cost. Taxable income is generally not affected by market valuation
adjustments.
MARKET
VALUATION ADJUSTMENTS (MVA)
Market valuation
adjustments (MVA) are changes in market values for certain assets and
liabilities that are reported through our GAAP income statement. They include
all changes in market values for assets and liabilities accounted for at fair
value, such as trading securities and derivatives. They also include the credit
portion of other-than-temporary impairments on securities available-for-sale, as
well as impairments of loans held-for-sale and REO properties.
NON-GAAP
METRICS
Not all companies
and analysts calculate non-GAAP metrics in the same manner. As a result, certain
metrics as calculated by Redwood may not be comparable to similarly titled
metrics reported by other companies. Redwood uses non-GAAP metrics such as
management’s estimate of economic value and core equity to provide greater
transparency for investors. Our non-GAAP metrics are reconciled to GAAP in the
Financial Tables in this Review.
NON-PRIME
SECURITIES
Non-prime
securities are Alt-A, option ARM, and subprime securities. See definitions of
Alt-A, option ARM, and subprime securities.
|
THE REDWOOD
REVIEW 1ST QUARTER 2010
|
49
|
OPTION
ARM LOAN
An option ARM loan
is a residential mortgage loan that generally offers a borrower monthly payment
options such as: 1) a minimum payment that results in negative amortization; 2)
an interest-only payment; 3) a payment that would fully amortize the loan over
an original 30-year amortization schedule; and, 4) a payment that would fully
amortize the loan over a 15-year year amortization schedule. To the extent the
borrower has chosen an option that is not fully amortizing the loan (or
negatively amortizing the loan), after a period — usually five years or once the
negatively amortized loan balance reaches a certain level (generally 15% to 25%
higher than the original balance) — the loan payments are recast. This recast
provision resets the payment at a level that fully amortizes the loan over its
remaining life and the new payment may be materially different than under the
borrowers’ previous option.
PRIME
RESIDENTIAL REAL ESTATE LOANS
Prime loans are
residential loans with higher quality credit characteristics, such as borrowers
with higher FICO credit scores, lower loan-to-value ratios, lower debt-to-income
ratios, greater levels of other assets, and more documentation.
PRIME
SECURITIES
Prime securities
are residential mortgage-backed securities backed by prime loans, generally with
balances greater than conforming loan limits. Prime securities are typically
backed by loans that have relatively high weighted average FICO scores (700 or
higher), low weighted average LTVs (75% or less), limited concentrations of
investor properties, and a low percentages of loans with low FICO scores or high
loan-to-value ratios.
PROFITABILITY
RATIOS
Many financial
institution analysts use asset-based profitability ratios such as interest rate
spread and interest rate margin when analyzing financial institutions. These are
asset-based measures. Since we consolidate the assets and liabilities of
securitization entities for GAAP purposes, our total GAAP assets and liabilities
may vary over time, and may not be comparable to assets typically used in
profitability calculations for other financial institutions. As a result, we
believe equity-based profitability ratios may be more appropriate than
asset-based measures for analyzing Redwood’s operations and results. We believe,
for example, that net interest income as a percentage of equity is a useful
measure of profitability. For operating expenses, we believe useful measures are
operating efficiency ratio (operating expenses as a percentage of net interest
income) and operating expenses as a percentage of equity. We provide various
profitability ratios in Table 5 in the Financial Tables in this
Review.
REAL
ESTATE INVESTMENT TRUST (REIT)
A real estate
investment trust (REIT) is an entity that makes a tax election to be taxed as a
REIT, invests in real estate assets, and meets other REIT qualifications,
including the distribution as dividends of at least 90% of REIT taxable income.
A REIT’s profits are not taxed at the corporate level to the extent that these
profits are distributed as dividends to stockholders, providing an operating
cost savings. On the other hand, the requirement to pay out as dividends most of
the REIT’s profits means it can be harder for a REIT to grow using only
internally-generated funds (as opposed to raising new capital).
|
50
|
THE REDWOOD
REVIEW 1ST QUARTER 2010
|
REAL
ESTATE OWNED (REO)
Real estate owned
(REO) refers to real property owned by the lender or loan owner that has been
acquired through foreclosure.
REIT
SUBSIDIARY
A REIT subsidiary
is a subsidiary of a REIT that is taxed as a REIT.
REIT
TAXABLE INCOME
REIT taxable income
is not a measure calculated in accordance with GAAP. REIT taxable income is
pre-tax income calculated for tax purposes at Redwood including only its
qualifying REIT subsidiaries (i.e., excluding its taxable subsidiaries). REIT
taxable income is an important measure as it is the basis of our dividend
distribution requirements. We must distribute at least 90% of REIT taxable
income as dividends to shareholders over time. As a REIT, we are not subject to
corporate income taxes on the REIT taxable income we distribute. We pay income
tax on the REIT taxable income we retain (and we are permitted to retain up to
10% of total REIT taxable income). A reconciliation of REIT taxable income to
GAAP income appears in Table 2 in the Financial Tables in this
Review.
REMIC
A real estate
mortgage investment conduit (REMIC) is a special purpose vehicle used to pool
real estate mortgages and issue mortgage-backed securities. REMICs are typically
exempt from tax at the entity level. REMICs may invest only in qualified
mortgages and permitted investments, including single family or multifamily
mortgages, commercial mortgages, second mortgages, mortgage participations, and
federal agency pass-through securities.
RE-REMIC
SECURITY
A re-REMIC is a
resecuritization of asset-backed securities. The cash flows from and any credit
losses absorbed by the underlying assets can be redirected to the resulting
re-REMIC securities in a variety of ways.
RESIDENTIAL
MORTGAGE-BACKED SECURITIES (RMBS)
A type of
mortgage-backed security that is backed by a pool of mortgages on residential
properties.
RETURN
ON EQUITY (ROE) and ADJUSTED RETURN ON EQUITY
ROE is the amount
of profit we generate each year per dollar of equity capital and equals GAAP
income divided by GAAP equity. Adjusted ROE is not a measure calculated in
accordance with GAAP — it is GAAP income divided by core equity.
SENIOR
SECURITIES
Senior securities
have the least credit risk in a securitization transaction because they are
generally the last securities to absorb credit losses. In addition, the senior
securities have the highest claim on the principal and interest payments (after
the fees to servicers and trustees are paid.) To further reduce credit risk,
most if not all, principal collected from the underlying asset pool is used to
paydown the senior securities until certain performance tests are satisfied. If
certain performance tests are satisfied, principal payments are shared between
the senior securities and the subordinate securities, generally on a pro rata
basis. At issuance, senior securities are generally AAA-rated.
|
THE REDWOOD
REVIEW 1ST QUARTER 2010
|
51
|
SEQUOIA
Sequoia is the
brand name for securitizations of residential real estate loans Redwood
sponsors.
SHORT-TERM
DEBT
Short-term debt is
debt that is an obligation of Redwood and payable within a year. We may obtain
this debt from a variety of Wall Street firms, banks, and other institutions. In
the past, as another form of short-term debt, we have issued collateralized
commercial paper. We may issue these or other forms of short-term debt in the
future. We may use short-term debt to finance the accumulation of assets prior
to sale to a securitization entity and to finance investments in high-quality
loans and securities.
SUBORDINATE
SECURITIES (JUNIOR SECURITIES)
Subordinate
securities absorb the initial credit losses from a securitization structure,
thus protecting the senior securities. Subordinate securities have a lower
priority to receive principal and interest payments than the senior securities.
Subordinate securities receive little, if any, principal payments until certain
performance tests are satisfied. If certain performance tests are satisfied,
principal payments are shared between the senior securities and the subordinate
securities, generally on a pro rata basis. Subordinate securities generally
receive interest payments even if they do not receive principal payments. At
issuance, subordinate securities are generally rated AA or below.
SUBPRIME
SECURITIES
Subprime securities
are residential mortgage-backed securities backed by loans to borrowers who
typically have lower credit scores and/or other credit deficiencies that prevent
them from qualifying for prime or Alt-A mortgages and may have experienced
credit problems in the past, such as late payments or bankruptcies. To
compensate for the greater risks and higher costs to service the loans, subprime
borrowers pay higher interest rates, points, and origination fees.
Typical
characteristics of subprime loan pools include more than 60% of loans with FICO
scores below 680, weighted average LTVs over 85%, more than 70% of loans with
LTVs over 75%, and loans with LTVs over 80% with no mortgage
insurance.
TAXABLE
INCOME AND DIVIDENDS
Taxable income is
not a measure calculated in accordance with GAAP. Taxable income is pre-tax
income for Redwood and all its subsidiaries as calculated for tax purposes.
Taxable income calculations differ significantly from GAAP income calculations.
A reconciliation of taxable income to GAAP income appears in Table 2 in the
Financial Tables in this Review.
TAXABLE
SUBSIDIARY
A taxable
subsidiary is a subsidiary of a REIT that is not taxed as a REIT and thus pays
taxes on its income. A taxable subsidiary is not limited to investing in real
estate and it can choose to retain all of its after-tax profits.
|
52
|
THE REDWOOD
REVIEW 1ST QUARTER 2010
|