
 |
 |
|
TABLE
OF CONTENTS
|
|
Introduction
|
4
|
|
Shareholder
Letter
|
5
|
|
Financial
Insights
|
12
|
|
u
Book Value
|
12
|
|
u
Balance Sheet
|
14
|
|
u
GAAP Income
|
18
|
|
u
Taxable Income and Dividends
|
21
|
|
u
Cash Flow
|
22
|
|
Residential
Mortgage Loan Business
|
25
|
|
Investments
in New Sequoia
|
26
|
|
Residential
Real Estate Securities
|
27
|
|
Commercial
Real Estate
|
35
|
|
Investments
in Other Consolidated Entities
|
36
|
|
Appendix
|
|
|
Redwood’s GSE
Reform Proposal
|
38
|
|
Accounting
Discussion
|
44
|
|
Glossary
|
45
|
|
Financial
Tables
|
51
|
|
THE REDWOOD
REVIEW 2ND QUARTER 2010
|
1
|
|
|
|
CAUTIONARY
STATEMENT
|
|
2
|
THE REDWOOD
REVIEW 2ND QUARTER 2010
|
|
|
|
|
CAUTIONARY
STATEMENT
|
|
THE REDWOOD
REVIEW 2ND QUARTER 2010
|
3
|
|
|
|
INTRODUCTION
|
|
Selected
Financial Highlights
|
||||||
|
Quarter:Year
|
GAAP
Income
(Loss)
per
Share
|
Taxable
Income
(Loss) per Share(1)
|
Annualized
Return on
Equity
|
GAAP
Book
Value per
Share
|
Non-GAAP
Economic
Value
per
Share (2)
|
Total
Dividends per
Share
|
|
Q208
|
($1.40)
|
$0.11
|
(30%)
|
$17.00
|
$16.72
|
$0.75
|
|
Q308
|
($3.34)
|
$0.07
|
(83%)
|
$12.40
|
$13.18
|
$0.75
|
|
Q408
|
($3.46)
|
($0.39)
|
(124%)
|
$9.02
|
$11.10
|
$0.75
|
|
Q109
|
($0.65)
|
($0.22)
|
(25%)
|
$8.40
|
$10.01
|
$0.25
|
|
Q209
|
$0.10
|
($0.16)
|
(05%)
|
$10.35
|
$11.30
|
$0.25
|
|
Q309
|
$0.34
|
($0.30)
|
13%
|
$11.68
|
$12.28
|
$0.25
|
|
Q409
|
$0.51
|
($0.44)
|
17%
|
$12.50
|
$13.03
|
$0.25
|
|
Q110
|
$0.58
|
$0.01
|
19%
|
$12.84
|
$13.32
|
$0.25
|
|
Q210
|
$0.35
|
($0.03)
|
11%
|
$12.71
|
$13.37
|
$0.25
|
|
4
|
THE REDWOOD
REVIEW 2ND QUARTER 2010
|
|
|
 |
|
SHAREHOLDER
LETTER
|
|
THE REDWOOD
REVIEW 2ND QUARTER 2010
|
5
|
|
|
|
SHAREHOLDER
LETTER
|
|
6
|
THE REDWOOD
REVIEW 2ND QUARTER 2010
|
|
|
|
|
SHAREHOLDER
LETTER
|
|
THE REDWOOD
REVIEW 2ND QUARTER 2010
|
7
|
|
|
|
SHAREHOLDER
LETTER
|
|
8
|
THE REDWOOD
REVIEW 2ND QUARTER 2010
|
|
|
|
|
SHAREHOLDER
LETTER
|
|
THE REDWOOD
REVIEW 2ND QUARTER 2010
|
9
|
|
|
|
SHAREHOLDER
LETTER
|
|
10
|
THE REDWOOD
REVIEW 2ND QUARTER 2010
|
|
|
|
|
SHAREHOLDER
LETTER
|
 |
 |
|
Martin S.
Hughes
|
Brett D.
Nicholas
|
|
President
and
|
Executive
Vice President,
|
|
Chief
Executive Officer
|
Chief
Investment Officer, and
Chief
Operating Officer
|
|
THE REDWOOD
REVIEW 2ND QUARTER 2010
|
11
|
 |
|
|
FINANCIAL
INSIGHTS
|
|
u
|
The following
table shows the components of our GAAP Book Value and Management’s
Estimate of Non-GAAP Economic Value at June 30,
2010.
|
|
Components
of Book Value*
|
|||||||
|
June
30, 2010
|
|||||||
|
($
in millions, except per share data)
|
|||||||
|
Management's
|
|||||||
|
Estimate
of
|
|||||||
|
GAAP
|
Non-GAAP
|
||||||
|
Book
Value
|
Adj.
|
Economic
Value
|
|||||
|
Cash and cash
equivalents
|
$
|
288
|
|
$
|
288
|
||
|
Real estate securities at
Redwood
|
|||||||
|
Residential
|
725
|
725
|
|||||
|
Commercial
|
8
|
8
|
|||||
|
CDO
|
1
|
1
|
|||||
|
Total real estate securities at
Redwood
|
$
|
734
|
$
|
734
|
|||
|
Investments in the
Fund
|
15
|
15
|
|||||
|
Investments in
Sequoia
|
101
|
(25
|
) |
76
|
|||
|
Investments in
Acacia
|
3
|
(2
|
) |
1
|
|||
|
Total cash, securities, and
investments
|
$
|
1,141
|
$
|
1,114
|
|||
|
|
|||||||
|
Long-term
debt
|
(140)
|
78
|
(62)
|
||||
|
|
|||||||
|
Other assets/liabilities,
net
|
(10)
|
(10)
|
|||||
|
Stockholders'
equity
|
$
|
991
|
$
|
1,042
|
|||
|
Book value per
share
|
$
|
12.71
|
$
|
13.37
|
|||
|
u
|
During the
second quarter of 2010 our GAAP book value decreased by $0.13 per share to
$12.71 per share. The net decrease resulted from $0.41 per share from
earnings before market valuation adjustments plus $0.02 per share from our
equity issuance related to dividend reinvestment, less $0.26 per share of
unrealized loss on cash flow hedges, $0.05 per share of negative market
valuation adjustments, and $0.25 per share of dividends paid to
shareholders.
|
|
u
|
During the
second quarter our estimate of non-GAAP economic value increased by $0.05
per share to $13.37 per share. The net increase resulted from $0.23 per
share net cash flows and net positive market valuation adjustments on our
securities and investments plus $0.14 per share from valuation changes
related to our long-term debt and $0.02 per share from equity issuance
related to dividend reinvestment, less $0.09 per share of cash operating
and interest expense and $0.25 per share of dividends paid to
shareholders.
|
|
*
|
The components of book value
table presents our assets and liabilities as calculated and reported under
GAAP and as adjusted to reflect our estimate of economic value, a non-GAAP
metric. We show our investments in the Redwood Opportunity Fund, L.P. (the
Fund) and in Sequoia and Acacia securitization entities in separate line
items, similar to the equity method of accounting, reflecting the reality
that the underlying assets and liabilities owned by these entities are
legally not ours. We own only the securities and interests that we have
acquired from these entities. See pages 16 and 17 for an explanation of
the adjustments set forth in this
table.
|
|
12
|
THE REDWOOD
REVIEW 2ND QUARTER 2010
|
|
|
|
|
FINANCIAL
INSIGHTS
|
|
u
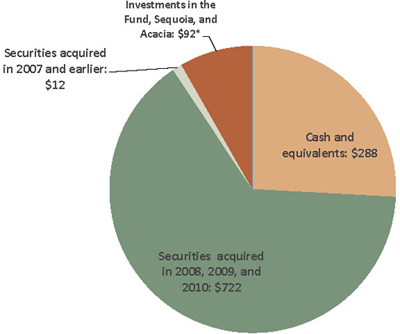
|
In the chart
below we present our securities portfolio by acquisition period, which
highlights that 91% of the economic value of our investments were held in
cash or in securities acquired since the beginning of 2008. Our future
earnings will be driven primarily by the performance of these investments
along with how we deploy our existing cash and future cash
flow.
|
|
*
|
Estimate
of non-GAAP economic value; see pages 12
and
16-17 for explanation and reconcilation to
GAAP.
|
|
THE REDWOOD
REVIEW 2ND QUARTER 2010
|
13
|
|
|
|
FINANCIAL
INSIGHTS
|
|
u
|
The following
table shows the components of our balance sheet at June 30,
2010.
|
|
Consolidating Balance
Sheet
|
||||||||||||||||||||
|
June 30,
2010
|
||||||||||||||||||||
|
($ in
millions)
|
||||||||||||||||||||
|
Redwood
Parent
|
2010
Sequoia
|
Other Consolidated
Entities
|
Intercompany
|
Redwood
Consolidated
|
||||||||||||||||
|
Real estate
loans
|
$ | 3 | $ | 226 | $ | 3,581 | $ | - | $ | 3,810 | ||||||||||
|
Real estate
securities
|
734 | - | 310 | (27 | ) | 1,017 | ||||||||||||||
|
Investments
in 2010 Sequoia
|
28 | - | - | (28 | ) | - | ||||||||||||||
|
Investment in
Other Consolidated Entities
|
91 | - | - | (91 | ) | - | ||||||||||||||
|
Other
investments
|
- | - | 4 | - | 4 | |||||||||||||||
|
Cash and cash
equivalents
|
288 | - | - | - | 288 | |||||||||||||||
|
Total earning
assets
|
1,144 | 226 | 3,895 | (146 | ) | 5,119 | ||||||||||||||
|
Other
assets
|
41 | 3 | 56 | - | 100 | |||||||||||||||
|
Total
assets
|
$ | 1,185 | $ | 229 | $ | 3,951 | $ | (146 | ) | $ | 5,219 | |||||||||
|
Short-term
debt
|
$ | - | $ | - | $ | - | $ | - | $ | - | ||||||||||
|
Other
liabilities
|
54 | 1 | 87 | - | 142 | |||||||||||||||
|
Asset-backed
securities issued
|
- | 200 | 3,761 | (27 | ) | 3,934 | ||||||||||||||
|
Long-term
debt
|
140 | - | - | - | 140 | |||||||||||||||
|
Total
liabilities
|
194 | 201 | 3,848 | (27 | ) | 4,216 | ||||||||||||||
|
Stockholders’
equity
|
991 | 28 | 91 | (119 | ) | 991 | ||||||||||||||
|
Noncontrolling
interest
|
- | - | 12 | - | 12 | |||||||||||||||
|
Total equity
|
991 | 28 | 103 | (119 | ) | 1,003 | ||||||||||||||
|
Total
liabilities and stockholders’ equity
|
$ | 1,185 | $ | 229 | $ | 3,951 | $ | (146 | ) | $ | 5,219 | |||||||||
|
u
|
We present
our consolidating balance to highlight the impact that consolidation has
on our GAAP consolidated balance sheet. As shown above, Redwood’s $119
million GAAP investment in the consolidated entities (including 2010
Sequoia) increased our consolidated assets and liabilities by over $4
billion.
|
|
u
|
We are
required under GAAP to consolidate all of the assets, liabilities, and
noncontrolling interests of the Fund (due to our significant general and
limited partnership interests in the Fund and ongoing asset management
responsibilities), and certain Sequoia and Acacia securitization entities
that are treated as secured borrowing transactions. However, the
securitized assets of these entities are not available to Redwood.
Similarly, the liabilities of these entities are obligations payable only
from the cash flow generated by their securitized assets and are not
obligations of Redwood.
|
|
u
|
The
consolidating balance sheet presents the 2010 Sequoia securitization
entity separate from all prior Sequoia securitizations to highlight our
renewed focus on growing our core business of creating credit investments.
As we complete additional securitizations, we expect new Sequoia
securitization entities to represent a larger portion of our consolidated
balance sheet as prior Sequoia securitization entities continue to pay
down.
|
|
14
|
THE REDWOOD
REVIEW 2ND QUARTER 2010
|
|
|
|
|
FINANCIAL
INSIGHTS
|
|
u
|
The following
table presents the fair value (which equals GAAP carrying value) of real
estate securities at Redwood at June 30, 2010. We segment our securities
portfolio by vintage (the year(s) the securities were issued), priority of
cash flow (senior, re-REMIC, and subordinate), and for residential
securities by quality of underlying loans (prime and
non-prime).
|
|
Real Estate Securities at
Redwood
|
||||||||||||||||||||
|
June 30,
2010
|
||||||||||||||||||||
|
($ in
millions)
|
||||||||||||||||||||
|
%
of Total
|
||||||||||||||||||||
|
<=2004
|
2005
|
2006-2008
|
Total
|
Securities
|
||||||||||||||||
|
Residential
|
||||||||||||||||||||
|
Seniors
|
||||||||||||||||||||
|
Prime
|
$ | 14 | $ | 227 | $ | 69 | $ | 310 | 42 | % | ||||||||||
|
Non-prime
|
114 | 197 | 9 | 320 | 44 | % | ||||||||||||||
|
Total
Seniors
|
$ | 128 | $ | 424 | $ | 78 | $ | 630 | 86 | % | ||||||||||
|
Re-REMIC
|
||||||||||||||||||||
|
Prime
|
$ | 5 | $ | 9 | $ | 55 | $ | 69 | 9 | % | ||||||||||
|
Total
Re-REMIC
|
$ | 5 | $ | 9 | $ | 55 | $ | 69 | 9 | % | ||||||||||
|
Subordinates
|
||||||||||||||||||||
|
Prime
|
$ | 12 | $ | 3 | $ | 1 | $ | 16 | 2 | % | ||||||||||
|
Non-prime
|
9 | 1 | - | 10 | 2 | % | ||||||||||||||
|
Total
Subordinates
|
$ | 21 | $ | 4 | $ | 1 | $ | 26 | 4 | % | ||||||||||
|
Total
Residential
|
$ | 154 | $ | 437 | $ | 134 | $ | 725 | 99 | % | ||||||||||
|
Commercial
Subordinates
|
$ | 7 | $ | 1 | $ | - | $ | 8 | 1 | % | ||||||||||
|
CDO
Subordinates
|
$ | - | $ | 1 | $ | - | $ | 1 | - | |||||||||||
|
Total
|
$ | 161 | $ | 439 | $ | 134 | $ | 734 | 100 | % | ||||||||||
|
THE REDWOOD
REVIEW 2ND QUARTER 2010
|
15
|
|
|
|
FINANCIAL
INSIGHTS
|
|
u
|
The table
below details the change in fair value of securities at Redwood during the
second and first quarters of 2010.
|
|
Real Estate Securities at
Redwood
|
||||||||
|
($ in
millions)
|
||||||||
|
Three
Months Ended
|
||||||||
|
6/30/10
|
3/31/10
|
|||||||
|
Beginning fair
value
|
$ | 840 | $ | 781 | ||||
|
Acquisitions
|
23 | 180 | ||||||
|
Sales
proceeds
|
(116 | ) | (124 | ) | ||||
|
Gain on
sale
|
16 | 38 | ||||||
|
Effect of principal
payments
|
(27 | ) | (22 | ) | ||||
|
Change in fair value,
net
|
(2 | ) | (13 | ) | ||||
|
Ending fair
value
|
$ | 734 | $ | 840 | ||||
|
u
|
During the
second quarter there was limited price volatility and relatively small
supply in the secondary RMBS markets. As a result, loss adjusted yields on
secondary RMBS assets remained relatively unattractive to us as compared
to recent historical levels and our rate of new acquisitions declined
accordingly.
|
|
u
|
During July,
we acquired $24 million of securities and we sold no
securities.
|
|
u
|
Our
investments in the Fund, Sequoia, and Acacia securitization entities, as
reported for GAAP, totaled $119 million, or 12% of our equity at June 30,
2010.
|
|
u
|
The GAAP
carrying value and the fair value of our investment in the Fund was $15
million. The Fund is primarily invested in non-prime residential
securities and is managed by a subsidiary of Redwood. Our investment
represents a 52% interest in the
Fund.
|
|
u
|
The GAAP
carrying value of our investments in Sequoia was $101 million and
management’s estimate of the non-GAAP economic value of those investments
was $76 million. We estimated the non-GAAP economic value for our
investments, consisting of $43 million of IOs and $33 million of senior
and subordinate securities, using the same valuation process that we
follow to fair value our other real estate securities. For GAAP, we
account for the assets and liabilities at historical cost and the net $101
million carrying value represents the difference between the carrying
costs of the assets ($3.9 billion at June 30, 2010) and liabilities ($3.8
billion at June 30, 2010) owned by the Sequoia
entities.
|
|
u
|
The GAAP
carrying value of our investments in Acacia entities was $3 million and
management’s estimate of the non-GAAP economic value of those investments
was $1 million, which primarily reflects the present value of the
management fees we expect to earn from these entities. The equity
interests and securities we own in the Acacia entities have minimal
value.
|
|
16
|
THE REDWOOD
REVIEW 2ND QUARTER 2010
|
|
|
|
|
FINANCIAL
INSIGHTS
|
|
u
|
We had no
short-term recourse debt at June 30, 2010. We continue to fund our
investments with permanent capital (equity and long-term debt) that is not
subject to margin calls or financial
covenants.
|
|
u
|
We expect to
utilize short-term debt to finance the acquisition of prime mortgage loans
prior to securitizing those loans through our Sequoia program. We remain
in discussion with counterparties to re-establish warehouse credit
facilities for this purpose. For now, we plan to use our excess cash to
purchase mortgage loans and are considering using repurchase facilities
collateralized by certain of our existing senior residential
mortgage-backed securities (RMBS) to temporarily finance our mortgage loan
acquisitions. During the second quarter, we utilized our repurchase
facilities for a short period of time to ensure that the operational
processes for using these facilities would function as
expected.
|
|
u
|
At June 30,
2010, we had $140 million of long-term debt outstanding with a stated
interest rate of LIBOR plus 225 basis points due in 2037. During the first
six months of 2010, through interest rate hedging arrangements, we
effectively fixed the interest rate on this long-term debt at 6.75%. We
calculated the $62 million estimate of non-GAAP economic value of this
long-term debt based on its stated interest rate using the same valuation
process used to fair value our other financial assets and liabilities. The
reduction in the estimated economic value of the debt in the second
quarter reflects wider credit spreads and lower future interest rates as
implied by the yield curve. As a result of declining interest rates during
the second quarter of 2010, the fair value of the interest rate hedges
related to this long-term debt declined by $20 million, as reflected in
shareholders’ equity on our balance sheet.
|
|
u
|
At June 30,
2010, our total capital equaled $1.1 billion, including $991 million in
shareholders’ equity and $140 million of long-term
debt.
|
|
u
|
At June 30,
2010, our cash totaled $288 million and our excess capital was $240
million. At July 31, 2010, our cash totaled $258 million and our excess
capital was $178 million.
|
|
u
|
We use our
capital to invest in earning assets, meet lender capital requirements, and
to fund our operations and working capital needs. The difference between
our cash balance and excess capital is primarily unsettled trades and
margin requirements for hedging agreements. We allocate capital to our
investments under our risk-adjusted capital guidelines based on numerous
factors including the liquidity of the assets and the availability of
financing.
|
|
u
|
We have
generally allocated capital equal to 100% of the fair value of all our
investments, a policy that has served us well over the past few years of
market turmoil. We have successfully managed through two tumultuous
periods (1998 and 2008) and we will remain thoughtful about managing
funding risk when we re-enter the short-term debt
market.
|
|
u
|
In July, as
discussed further below, we started to acquire residential mortgage loans
for future securitization. Since we have the ability to access financing
during the accumulation period, we have allocated less than 100% capital
on these residential loans under our risk-adjusted capital
policy.
|
|
u
|
In addition,
we may change the amount of capital we allocate to the more liquid
securities we own. Consistent with our past practices, we will make these
changes only when we believe it is in the best long-term interest of our
shareholders. We believe we have significantly greater capital capacity
than reflected in our stated excess capital amounts, given our
conservative choice to allocate 100% capital to most of our assets. Given
our capacity, we would likely look to our own balance sheet for sources of
liquidity before looking externally and are unlikely to seek additional
capital in the near term.
|
|
THE REDWOOD
REVIEW 2ND QUARTER 2010
|
17
|
|
|
|
FINANCIAL
INSIGHTS
|
|
u
|
The following
table provides a summary of our consolidated GAAP income for the second
and first quarters of 2010.
|
|
GAAP
Income
|
||||||||
|
($
in millions, except per share data)
|
||||||||
|
Three
Months Ended
|
||||||||
|
6/30/10
|
3/31/10
|
|||||||
|
Interest
income
|
$ | 56 | $ | 58 | ||||
|
Interest
expense
|
(21 | ) | (18 | ) | ||||
|
Net interest
income
|
35 | 40 | ||||||
|
Provision for loan
losses
|
(4 | ) | (9 | ) | ||||
|
Market valuation adjustments,
net
|
(7 | ) | (11 | ) | ||||
|
Net interest income (loss) after
provision and market valuation adjustments
|
24 | 20 | ||||||
|
Operating
expenses
|
(11 | ) | (17 | ) | ||||
|
Realized gains,
net
|
16 | 44 | ||||||
|
Noncontrolling
interest
|
- | - | ||||||
|
Benefit from (provision for)
income taxes
|
- | - | ||||||
|
|
||||||||
|
GAAP income
|
$ | 29 | $ | 47 | ||||
|
GAAP income per
share
|
$ | 0.35 | $ | 0.58 | ||||
|
u
|
Our
consolidated GAAP income for the second quarter of 2010 was $29 million,
or $0.35 per share, as compared to $47 million, or $0.58 per share, for
the first quarter of 2010. The decrease in earnings is a result of a
decline in realized gains from fewer sales of securities and a decline in
net interest income from holding fewer securities during the quarter,
partially offset by reductions in our loan loss provision and operating
expenses.
|
|
18
|
THE REDWOOD
REVIEW 2ND QUARTER 2010
|
|
|
|
|
FINANCIAL
INSIGHTS
|
|
u
|
The following
tables show the estimated effect that Redwood, our recent Sequoia
securitization, and our other consolidated entities (all consolidated
entities established in 2007 or prior) had on GAAP income for the second
quarter of 2010 and the first quarter of 2010. These components of our
income statement are not separate business
segments.
|
|
Consolidating
Income Statement
|
|||||||||||||||
|
Three
Months Ended June 30, 2010
|
|||||||||||||||
|
($
in millions)
|
|||||||||||||||
| Redwood Parent |
2010
Sequoia
|
Other Consolidated Entities | Intercompany Adjustments |
Redwood
Consolidated
|
|||||||||||
|
Interest
income
|
$ | 16 | $ | 1 | $ | 30 | $ | - | $ | 47 | |||||
|
Net discount (premium)
amortization
|
10 | - | (1 | ) | - | 9 | |||||||||
|
Total interest
income
|
26 | 1 | 29 | - | 56 | ||||||||||
|
|
|||||||||||||||
|
Management
fees
|
- | - | - | - | - | ||||||||||
|
Interest
expense
|
(2 | ) | (1 | ) | (18 | ) | - | (21 | ) | ||||||
|
Net interest
income
|
24 | - | 11 | - | 35 | ||||||||||
|
Provision for loan
losses
|
- | - | (4 | ) | - | (4 | ) | ||||||||
|
Market valuation adjustments,
net
|
(4 | ) | - | (3 | ) | - | (7 | ) | |||||||
|
Net interest income after
provision and market valuation adjustments
|
20 | - | 4 | - | 24 | ||||||||||
|
Operating
expenses
|
(11 | ) | - | - | - | (11 | ) | ||||||||
|
Realized gains,
net
|
16 | - | - | - | 16 | ||||||||||
|
Income from 2010
Sequoia
|
- | - | - | - | - | ||||||||||
|
Income from Other Consolidated
Entities
|
4 | - | - | (4 | ) | - | |||||||||
|
Noncontrolling
interest
|
- | - | - | - | - | ||||||||||
|
Provision for income
taxes
|
- | - | - | - | - | ||||||||||
|
Net income
|
$ | 29 | $ | - | $ | 4 | $ | (4 | ) | $ | 29 | ||||
|
Consolidating Income
Statement
|
|||||||||||||||
|
Three Months Ended March 31,
2010
|
|||||||||||||||
|
($ in
millions)
|
|||||||||||||||
|
Redwood
Parent
|
2010
Sequoia*
|
Other
Consolidated Entities
|
Intercompany
Adjustments
|
Redwood
Consolidated
|
|||||||||||
|
Interest
income
|
$ | 18 | $ | - | $ | 32 | $ | - | $ | 50 | |||||
|
Net discount (premium)
amortization
|
9 | - | (1 | ) | - | 8 | |||||||||
|
Total interest
income
|
27 | - | 31 | - | 58 | ||||||||||
|
Management
fees
|
1 | - | - | (1 | ) | - | |||||||||
|
Interest
expense
|
(1 | ) | - | (17 | ) | - | (18 | ) | |||||||
|
Net interest
income
|
27 | - | 14 | (1 | ) | 40 | |||||||||
|
Provision for loan
losses
|
- | - | (9 | ) | - | (9 | ) | ||||||||
|
Market valuation adjustments,
net
|
(3 | ) | - | (8 | ) | - | (11 | ) | |||||||
|
Net interest income after
provision and market valuation adjustments
|
24 | - | (3 | ) | (1 | ) | 20 | ||||||||
|
Operating
expenses
|
(17 | ) | - | (1 | ) | 1 | (17 | ) | |||||||
|
Realized gains,
net
|
38 | - | 6 | - | 44 | ||||||||||
|
Income from Other Consolidated
Entities
|
2 | - | - | (2 | ) | - | |||||||||
|
Noncontrolling
interest
|
- | - | - | - | - | ||||||||||
|
Provision for income
taxes
|
- | - | - | - | - | ||||||||||
|
Net income
|
$ | 47 | $ | - | $ | 2 | $ | (2 | ) | $ | 47 | ||||
|
THE REDWOOD
REVIEW 2ND QUARTER 2010
|
19
|
|
|
|
FINANCIAL
INSIGHTS
|
|
u
|
At Redwood,
net interest income was $24 million for the second quarter of 2010, as
compared to $27 million for the first quarter of 2010. The decrease in net
interest income was primarily due to lower average holdings of earning
assets due to sales of securities, as well as higher effective interest
costs on our long-term debt due to
hedging.
|
|
u
|
In the near
term, we continue to expect net interest income to be driven primarily by
our residential senior securities, which comprised 86% of the securities
we held at June 30, 2010. During the second quarter, these securities
generated $17 million of interest income, or a 13% effective annual yield
comprised of 6% coupon interest and 7% discount amortization
income.
|
|
u
|
Gains on
sales of securities were $16 million (and generated total proceeds of $116
million) for the second quarter of 2010, as compared to $38 million for
the first quarter of 2010. Of the $16 million of gains, $8 million were
already reflected in our balance sheet at the beginning of the quarter and
$8 million resulted from increases in value during the
quarter.
|
|
u
|
Negative
market valuation adjustments (MVA) were $4 million in the second quarter,
a $1 million increase from the prior quarter due to impairments on
securities. To the extent our loss expectations do not significantly
change, we expect the pace of future impairments on securities to remain
near levels observed in recent
quarters.
|
|
u
|
Operating
expenses at Redwood were $11 million in the second quarter of 2010, a
decrease of $6 million from the first quarter. The decline in operating
expenses was primarily due to $4 million of compensation expense in first
quarter that was non-recurring. Lower variable compensation expenses and
reduced legal accrual expenses associated with our recent Sequoia
securitization also contributed to the decrease in operating
expenses.
|
|
u
|
We recognized
net income of $4 million in the second quarter from our investments in the
Fund, Sequoia, and Acacia securitization entities established in 2008 or
prior.
|
|
u
|
Net interest
income was $11 million in the second quarter, a decrease of $3 million
from the first quarter of 2010. This decrease was primarily due to the
poor credit performance on securities held at Acacia, resulting in lower
interest income.
|
|
u
|
The provision
for loan losses for Sequoia entities totaled $4 million in the second
quarter, a decrease of $5 million from the first quarter of 2010. Serious
delinquencies (90+ days past due) declined to 4.04% (excluding the Sequoia
2010 securitization) in the second quarter from 4.32% at the end of the
first quarter as more loans were liquidated than transitioned to serious
delinquency status. There are currently four Sequoia entities for which we
have expensed aggregate loan loss provisions of $2 million in excess of
our reported investment for GAAP purposes. At this time we do not expect
to deconsolidate any Sequoia entities in
2010.
|
|
u
|
Market
valuation adjustments were negative $3 million in the second quarter, a
decrease of $5 million from the first quarter. Net market valuation
adjustments at Acacia entities represent most of this
difference.
|
|
20
|
THE REDWOOD
REVIEW 2ND QUARTER 2010
|
|
|
|
|
FINANCIAL
INSIGHTS
|
|
u
|
Redwood’s
estimated taxable loss for the second quarter of 2010 was $3 million, or
$0.03 per share, as compared to estimated taxable income of $1 million, or
$0.01 per share, for the first quarter of 2010. (Reconciliations of GAAP
and tax income are shown in Table 2 in the Financial Tables in this
Review.)
|
|
u
|
Credit losses
continue to be the significant driver of our taxable results and accounts
for the majority of the difference between GAAP and taxable income. In
both the second and first quarters credit losses as calculated for tax
purposes totaled $24 million and were expensed through our tax-based
earnings. (For earnings calculated under GAAP, credit losses were charged
to our credit reserves. Credit reserves are not allowed for tax
purposes.)
|
|
u
|
Another
difference between GAAP and taxable income is sales. Our tax-based gains
in the second quarter were offset by prior period capital losses, which
stood at $81 million as of June 30, 2010. For earnings calculated under
GAAP, we recognized gains of $16
million.
|
|
u
|
We continue
to expect to realize a taxable loss for the full year in 2010. However,
the timing of credit losses on securities we own has a large impact on our
quarterly taxable income. We anticipate an additional $197 million of
losses on securities in future periods for tax purposes; for GAAP
purposes, as noted above, we have already established credit reserves for
these anticipated losses.
|
|
u
|
Since we
currently expect a REIT taxable loss in 2010, we anticipate that this
year’s dividend distributions will be characterized as return of capital.
However, if credit losses remain at lower levels than we experienced in
2009 and we do generate positive taxable income, a portion of this year’s
dividend distributions would be characterized as ordinary income (to the
extent of the 2010 REIT taxable
income).
|
|
u
|
On May 18,
2010, our board of directors declared a regular dividend of $0.25 per
share for the second quarter, which was paid on July 21, 2010 to
shareholders of record on June 30, 2010. This is consistent with the board
of directors’ announcement in November 2009 that it intended to declare
and pay quarterly regular dividends at this rate throughout
2010.
|
|
THE REDWOOD
REVIEW 2ND QUARTER 2010
|
21
|
|
|
|
FINANCIAL
INSIGHTS
|
|
u
|
In the second
quarter, our business cash flow remained in line with our expectations.
Our business cash flow exceeded our cash operating expenses, acquisitions,
and dividend distributions. We ended the second quarter with $288 million
of cash, up from $242 million at the end of prior
quarter.
|
|
u
|
We believe
our current GAAP income statements are reflective of our current
underlying business trends, especially given the nature of the assets we
currently hold. We also consider cash flow one of a number of important
operating metrics; however, we realize that quarterly cash flow measures
have limitations. In particular, we
note:
|
|
•
|
When
securities are purchased at large discounts from face value it is
difficult to determine what portion of the cash received is a return “of”
principal and what portion is a return “on” principal. It is only at the
end of an asset’s life that we can accurately determine what portion of
the cumulative cash received (whether principal or interest) was income
and what was a return of capital.
|
|
•
|
Certain
investments may generate cash flow in a quarter that is not necessarily
reflective of the long-term economic yield we will earn on the
investments. For example, we acquired certain re-REMIC support securities
at what we believe will produce attractive yields. Due to their terms,
however, these securities are locked out of receiving any principal
payments for years. Because of the deferred receipt of principal payments,
formulating any conclusions on the value or performance of these
securities by looking solely at the early quarterly cash flow may not be
indicative of economic returns.
|
|
•
|
Cash flow
from securities and investments can be volatile from quarter to quarter
depending on the level of invested capital, the timing of credit losses,
acquisitions, sales, and changes in prepayments and interest
rates.
|
|
22
|
THE REDWOOD
REVIEW 2ND QUARTER 2010
|
|
|
|
|
FINANCIAL
INSIGHTS
|
|
u
|
The sources
and uses of cash in the table below are derived from our GAAP Consolidated
Statement of Cash Flow for the second and first quarters of 2010 by
aggregating and netting all items in a manner consistent with the way
management analyzes them. This table excludes the gross cash flow
generated by our Sequoia and Acacia securitization entities and the Fund
(cash flow that is not available to Redwood), but does include the cash
flow distributed to Redwood as a result of our investments in these
entities. The beginning and ending cash balances presented in the table
below are GAAP amounts.
|
|
u
|
As detailed
in the table below, we include proceeds from sales as a component of
business cash flow. While it is generally our intention when we acquire
assets to hold them to maturity and receive principal and interest
payments over their lives, we sell assets from time to time as part of our
continuing management of risk and return expectations. A sale effectively
accelerates the receipt of these cash
flows.
|
|
Redwood
|
||||||||
|
Sources
and Uses of Cash
|
||||||||
|
($
in millions)
|
||||||||
|
Three
Months Ended
|
||||||||
|
6/30/10
|
3/31/10
|
|||||||
|
Beginning cash
balance
|
$ | 242 | $ | 243 | ||||
|
Business cash
flow:
|
||||||||
|
Cash flow from securities and
investments
|
$ | 177 | $ | 193 | ||||
|
Cash operating
expenses
|
(10 | ) | (15 | ) | ||||
|
Interest expense on long-term
debt
|
(1 | ) | (1 | ) | ||||
|
Total business cash
flow
|
166 | 177 | ||||||
|
Other sources and
uses:
|
||||||||
|
Investment in 2010
Sequoia
|
(28 | ) | - | |||||
|
Changes in working
capital
|
3 | (2 | ) | |||||
|
Acquistions (1)
|
(55 | ) | (156 | ) | ||||
|
Derivative margins posted,
net
|
(20 | ) | - | |||||
|
Dividends
|
(20 | ) | (20 | ) | ||||
|
Net other
uses
|
(120 | ) | (178 | ) | ||||
|
|
||||||||
|
Net sources (uses) of
cash
|
$ | 46 | $ | (1 | ) | |||
|
Ending cash
balance
|
$ | 288 | $ | 242 | ||||
|
(1)
Total acquisitions in the second quarter of 2010 were $23 million, $1
million which are not reflected in this table because they did not settle
until early July. Also, $33 million of acquisitions made in the first
quarter that did not settle until early April are reflected in this
table.
|
||||||||
|
THE REDWOOD
REVIEW 2ND QUARTER 2010
|
23
|
|
|
|
FINANCIAL
INSIGHTS
|
|
u
|
Total cash
flow from securities and investments was $177 million for the second
quarter, a decrease of $16 million from first quarter, primarily due to a
decreased level of security sales at Redwood and the
Fund.
|
|
u
|
Total
proceeds from the sale of senior and re-REMIC securities at Redwood were
$116 million in the second quarter, compared to $124 million in first
quarter, primarily due to a decreased level of sales of re-REMIC
securities.
|
|
Redwood
|
||||||||
|
Cash Flow from Securities and
Investments
|
||||||||
|
($ in
millions)
|
||||||||
|
Three Months
Ended
|
||||||||
|
6/30/10
|
3/31/10
|
|||||||
|
Securities at
Redwood
|
||||||||
|
Residential
Seniors
|
||||||||
|
Principal and
Interest
|
$ | 42 | $ | 40 | ||||
|
Proceeds from
Sales
|
111 | 73 | ||||||
|
Total
|
153 | 113 | ||||||
|
Residential
Re-REMICs
|
||||||||
|
Principal and
Interest
|
2 | 3 | ||||||
|
Proceeds from
Sales
|
5 | 51 | ||||||
|
Total
|
7 | 54 | ||||||
|
Residential Subordinates principal
and interest
|
8 | 8 | ||||||
|
Commercial and CDO
Subordinates
|
||||||||
|
Principal and
Interest
|
1 | 1 | ||||||
|
Proceeds from
Sales
|
- | - | ||||||
|
Total
|
1 | 1 | ||||||
|
Total cash flow from securities
at Redwood
|
169 | 176 | ||||||
|
Investments in the
Fund
|
1 | 9 | ||||||
|
Investments in Sequoia
entities
|
7 | 8 | ||||||
|
Investments in Acacia
entities
|
- | - | ||||||
|
Total cash flow from securities
and investments
|
$ | 177 | $ | 193 | ||||
|
u
|
Redwood’s
investment in the Fund generated $1 million of cash flow in the second
quarter, compared to $9 million in the prior quarter, due to a decreased
level of sales in the second quarter. In the first quarter, our share of
the proceeds from asset sales by the Fund represented $7 million of the
cash received.
|
|
u
|
Cash flow
excluding proceeds from sales totaled $61 million in the second quarter,
compared to $69 million in the prior quarter, and continued to exceed cash
operating expenses ($10 million), interest expense ($1 million), and
dividends ($20 million).
|
|
24
|
THE REDWOOD
REVIEW 2ND QUARTER 2010
|
|
|
 |
|
RESIDENTAL
MORTGAGE LOAN BUSINESS
|
|
u
|
At June 30,
2010, our committed pipeline of residential mortgage loans totaled $80
million, consisting of 10/1 hybrids and 30-year fixed rate loans. At July
31, 2010, the pipeline totaled $154 million. During the period beginning
on April 1, 2010 and continuing through July 31, 2010, we completed the
purchase of $5 million in loans.
|
|
u
|
We are
encouraged by our progress and contemplate executing a new Sequoia
securitization once we acquire approximately $300 million of loans,
perhaps in the fourth quarter, depending on market conditions and other
factors.
|
|
u
|
Over time,
our goal is to establish our conduit as the leading source of liquidity
for the prime jumbo mortgage market, where originators are able to obtain
timely purchase commitment decisions and price
protection.
|
|
u
|
The size of
the jumbo market is potentially vast — suggesting an opportunity that well
exceeds our current capital available to invest. For example, if annual
residential originations return to $1.3 trillion (one-third of the peak
level in 2003) and jumbo loans account for 20%, jumbo loan originations
would amount to $260 billion. If half of these loans were securitized and
Redwood were to credit enhance 10%, or $13 billion, our annual investment
would be approximately $400 million, assuming we retained the subordinate
securities (at market prices) equal to 5% of the
securitizations.
|
|
u
|
We anticipate
that the current maximum GSE conforming loan limit of $729,750 will be
reduced from its current elevated level through either GSE reform or from
an improvement in the mortgage market that will eliminate the need for the
higher limits that were established during the financial crisis. Reduced
limits should increase the universe of loans available to the private
market, including Redwood.
|
|
THE REDWOOD
REVIEW 2ND QUARTER 2010
|
25
|
 |
|
| INVESTMENTS IN NEW SEQUOIA |
|
u
|
In April
2010, Redwood (through Sequoia) sponsored a $238 million residential prime
jumbo mortgage securitization, referred to as SEMT 2010-H1. This was the
first prime jumbo securitization in the mortgage market to be backed by
newly originated loans in nearly two years and was well received by
triple-A investors. As with all our Sequoia securitizations, this issuance
did not require credit support from the
government.
|
|
u
|
Second
quarter GAAP income of $0.2 million from this new securitization reflects
two months of income, net of one-time
expenses.
|
|
u
|
For GAAP
purposes, we account for our Sequoia securitizations as financings and the
assets and liabilities are carried on our balance sheet at their amortized
cost. As a result, our $28 million investment in new Sequoia does not
appear on our GAAP consolidated balance sheet as an investment; rather, it
is reflected as the difference between the $229 million of consolidated
assets of new Sequoia and the $201 million of consolidated ABS issued to
third parties, at June 30, 2010. (The difference between the $238 million
amount at issuance and the balance at June 30, 2010, represents principal
payments.)
|
|
26
|
THE REDWOOD
REVIEW 2ND QUARTER 2010
|
|
|
 |
|
RESIDENTIAL REAL ESTATE
SECURITIES
|
|
u
|
While the
market for Treasuries and equities experienced significant volatility
during the second quarter of 2010, the non-agency RMBS market had limited
price volatility over the period. While we did experience some dips in
pricing during the quarter, these were predominantly characterized by a
widening in the bid-ask spread, making it difficult to add assets at
prices we would have found attractive. The majority of supply, which
declined in the second quarter, came from the liquidation of
collateralized debt obligations and structured investment vehicles during
the second quarter. The liquidation sales have been well
bid.
|
 |
|
Source: JP
Morgan
|
|
THE REDWOOD
REVIEW 2ND QUARTER 2010
|
27
|
|
|
| RESIDENTIAL REAL ESTATE SECURITIES |
|
u
|
Oversupply
remains a primary obstacle to a housing market recovery and the situation
appears to be getting worse. The National Association of Realtors reported
a 10% increase in inventories in the second quarter, which increases the
supply to an 11-month high of 8.9 months of supply as of June
2010.
|
|
u
|
The relative
stability of home prices in 2009 was due in large part to falling
inventories. That trend appears to have reversed, as housing inventory is
up 22% year-to-date, which suggests another downward move in
prices.
|
|
u
|
Some of the
new supply represents listings of delinquent, distressed, or repossessed
homes. This “shadow inventory” is difficult to measure, but likely
represents a larger inventory of homes than the entire stock of currently
listed properties. Additional sources of supply could come from more
voluntary listings by previously reluctant home owners testing the
market.
|
|
u
|
It does not
appear that the increase in inventory over the last six months is due to
accelerated servicing of distressed collateral. Foreclosed homes are still
being repossessed into REO at a very slow pace at about 5% per month
compared to an average of 10% per month in pre-crisis 2007. This suggests
that there is still potential for a spike in distressed supply if
servicers accelerate foreclosures.
|
|
u
|
Housing
market activity remains skewed towards the low end of the price range,
with first-time home buyers responsible for 43% of June 2010 sales,
according to the NAR. Unburdened by existing mortgages, these buyers have
been taking advantage of historically low rates and prices, but their
demand is concentrated in less expensive markets, which are not Redwood’s
traditional focus.
|
|
u
|
On average,
we expect an additional 5-8% decline in the value of currently securitized
non-agency collateral over the next 12-18 months, with significant
geographic variation.
|
|
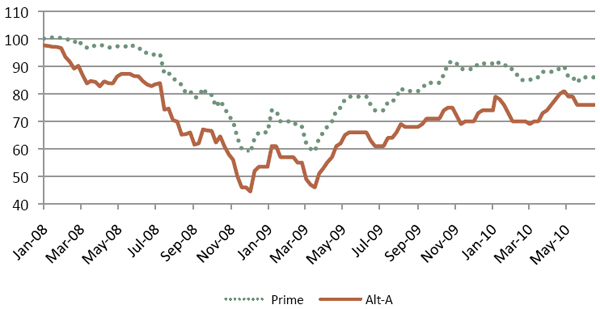
u
|
Serious (60+
days) delinquencies for prime and Alt-A loans continued to show
improvement in recent months. According to LoanPerformance, the rate of
increase in serious delinquencies has slowed for non-conforming prime
loans and has been declining in recent months for Alt-A loans. From March
2010 to June 2010, serious delinquencies increased for fixed-rate prime
loans from 8.1% to 8.3% and for hybrid loans from 11.8% to 12.2%, and for
Alt-A loans declined from 31.5% to 30.7%. At Redwood, 60+ days
delinquencies on loans underlying the prime and non-prime residential
securities we own are modestly lower than the
industry.
|
|
u
|
We have
noticed a significant improvement in roll rates (from performing to
delinquent) over the last few months for both prime and Alt-A collateral.
In the fourth quarter of 2009, about 1% of previously “always current”
prime borrowers went delinquent each month (2.1% per month for Alt-A).
Since then, that roll rate has fallen to 0.74% per month for prime (1.48%
per month for Alt-A) — a 26%
decrease.
|
|
u
|
This
transition — from “always current” to the first missed payment — is one of
the metrics we follow. It has been well correlated with labor market
conditions and mortgage liquidity. Thus these declining roll rates could
suggest that mortgage market conditions have improved noticeably over the
last three to six months, but it is too early to determine if this
improvement represents a sustainable
trend.
|
|
28
|
THE REDWOOD
REVIEW 2ND QUARTER 2010
|
|
|
|
|
RESIDENTIAL REAL ESTATE
SECURITIES
|
|
u
|
According to
data from LoanPerformance, industry-wide prepayment rates on non-agency
prime loans were nearly unchanged from the first quarter at 14% CPR.
Prepayment rates on loans underlying prime RMBS held by Redwood continue
to be modestly faster than the industry average, reflecting the
concentration of securities we own in older
vintages.
|
|
u
|
Industry-wide,
prepayment rates for non-agency Alt-A loans were 5% in the second quarter
according to data from LoanPerformance. The prepayment rates on non-prime
securities we own (which are predominately backed by Alt-A loans) were
also modestly faster than the industry average, also reflecting the
concentration of our securities in older vintages. Given the more
stringent underwriting guidelines in the current environment, we expect
prepayment rates on Alt-A loans to remain at low levels as many borrowers
may not qualify to refinance.
|
|
u
|
Industry-wide,
prime prepayment speeds have been strongly correlated with loan age as
more seasoned loans (which generally have more equity) are prepaying in
the mid-to-high teens compared to the low-teens for more recent
vintages.
|
|
u
|
Prepayment
speeds on many of the securities we own have generally been ahead of our
expectations from the time of acquisition. To the extent that prepayment
rates remain above our expectations, all else being equal, the yields on
our securities will increase as we will realize our unamortized discount
sooner.
|
|
u
|
Loan
modifications continue to move forward but at a slow pace. The goal of the
Administration’s Home Affordable Modification Program (HAMP) is to help
three to four million homeowners avoid foreclosure through 2012. The
program has been in existence since early 2009, and according to the
latest data for June 2010, of the 1.5 million borrowers who have been
offered trial modifications, only 398,000 borrowers have received
permanent modifications and 521,000 trial modifications have been
cancelled. In June, there were 51,000 new permanent modifications and
91,000 trial modifications were cancelled. However, new data from HAMP
shows that of the cancellations, approximately 45% have entered
alternative modification programs and fewer than 2% of borrowers went into
foreclosure. At Redwood, loan modifications have had little impact on the
securities we own, as part of our acquisition strategy has been to invest
in securities less likely to be impacted by modification, such as older
vintage prime and Alt-A securities.
|
|
u
|
Interest
income generated by residential securities we own was $25 million in the
second quarter of 2010, an annualized yield of 15% on the amortized cost
of these securities.
|
|
u
|
At June 30,
2010, the fair value of residential securities we own totaled $725
million, consisting of $310 million in prime senior securities, $320
million in non-prime senior securities, $69 million in re-REMIC
securities, and $26 million in subordinate securities. Each of these
categories is further discussed
below.
|
|
u
|
The
securities we held at June 30, 2010, consisted of fixed-rate assets (38%),
adjustable-rate assets that reset within the next year (42%), hybrid
assets that reset between 12 and 36 months from now (5%), and hybrid
assets that reset more than 36 months from now
(15%).
|
|
THE REDWOOD
REVIEW 2ND QUARTER 2010
|
29
|
|
|
| RESIDENTIAL REAL ESTATE SECURITIES |
|
u
|
The following
table presents information on residential prime senior securities at
Redwood at June 30, 2010. We account for all of these securities as
available-for-sale.
|
|
Credit Support Analysis - Prime
Senior Securities at Redwood
|
||||||||||||||||||||
|
By
Vintage
|
||||||||||||||||||||
|
June 30,
2010
|
||||||||||||||||||||
|
($ in
millions)
|
||||||||||||||||||||
|
<=2004
|
2005
|
2006
|
2007
|
Total
|
||||||||||||||||
|
Current
face
|
$ | 16 | $ | 270 | $ | 15 | $ | 70 | $ | 371 | ||||||||||
|
Net unamortized
discount
|
(3 | ) | (70 | ) | (4 | ) | (16 | ) | (93 | ) | ||||||||||
|
Credit
reserve
|
- | (7 | ) | - | (3 | ) | (10 | ) | ||||||||||||
|
Unrealized gains
(losses)
|
1 | 34 | (1 | ) | 8 | 42 | ||||||||||||||
|
Fair value of Prime Senior
Securities
|
$ | 14 | $ | 227 | $ | 10 | $ | 59 | $ | 310 | ||||||||||
|
Overall credit
support to Prime Senior Securities (1)
|
11.24 | % | 7.31 | % | 6.04 | % | 8.50 | % | 7.77 | % | ||||||||||
|
Serious
delinquencies as a % of collateral balance (1)
|
9.09 | % | 8.05 | % | 8.83 | % | 8.07 | % | 8.13 | % | ||||||||||
|
u
|
The overall
credit support data presented in the table above represents the level of
support for prime securities owned by Redwood weighted by the
securitization, or underlying collateral, balance rather than the book
value or market value of the securities, and we present similar tables for
our non-prime securities on page 32 and non-senior securities on page
33.
|
|
u
|
At June 30,
2010, the average overall level of credit support was 7.77%. For an
individual security with this level of credit support, this would mean
that losses experienced on the collateral would have to exceed 7.77%
before the security would suffer losses. Comparing the level of credit
support available to seriously delinquent loans provides one measure of
the level of credit sensitivity that exists within our senior securities
portfolio. For example, assuming an individual bond has the average
characteristics of the portfolio, 7.77% of credit support and serious
delinquencies of 8.13%, all of the seriously delinquent loans could be
liquidated with a 50% severity, generating losses of 4.07%. The security
would then have 3.7% credit support remaining to absorb future losses,
before the senior securities would start to absorb
losses.
|
|
30
|
THE REDWOOD
REVIEW 2ND QUARTER 2010
|
|
|
|
|
RESIDENTIAL REAL ESTATE
SECURITIES
|
|
u
|
We would
emphasize that no individual security has the average characteristics of
the portfolio. Individual securities may have more or less credit support
than the average, or more or less seriously delinquent loans than the
average. As such, certain securities have a more positive credit
enhancement to serious delinquency ratio while others have a less positive
or negative ratio. As a result, it is possible for some securities to
incur losses without aggregate losses exceeding the overall credit
support. For example, in the first quarter of 2010, we incurred credit
losses of $2 million for GAAP purposes on senior securities, even though
aggregate losses did not exceed our overall credit
support.
|
|
u
|
Securities
are acquired assuming a range of outcomes based on modeling of expected
performance at the individual loan level for both delinquent and current
loans. Over time, the performance of these securities may require a change
in the amount of credit reserves we designate. There were no credit losses
on our prime senior securities in the second
quarter.
|
|
u
|
The fair
market value of our prime senior securities was equal to 83% of the face
value of the portfolio, while our amortized cost was equal to 72% of the
face value at June 30, 2010. These securities generated $21 million of
cash from principal and interest in the second quarter compared to $19
million in the first quarter, excluding proceeds from sales. The
annualized yield in the second quarter for our prime senior securities was
11.3%.
|
|
THE REDWOOD
REVIEW 2ND QUARTER 2010
|
31
|
|
|
| RESIDENTIAL REAL ESTATE SECURITIES |
|
u
|
The following
table presents information on residential non-prime senior securities at
Redwood at June 30, 2010. We account for all of these securities as
available-for-sale.
|
|
Credit Support Analysis -
Non-Prime Senior Securities at Redwood
|
||||||||||||||||
|
By
Vintage
|
||||||||||||||||
|
June 30,
2010
|
||||||||||||||||
|
($ in
millions)
|
||||||||||||||||
|
<=2004
|
2005
|
2006
|
Total
|
|||||||||||||
|
Current
face
|
$ | 138 | $ | 251 | $ | 11 | $ | 400 | ||||||||
|
Net unamortized
discount
|
(38 | ) | (70 | ) | (2 | ) | (110 | ) | ||||||||
|
Credit
reserve
|
(1 | ) | (10 | ) | (1 | ) | (12 | ) | ||||||||
|
Unrealized
gains
|
14 | 10 | 1 | 25 | ||||||||||||
|
Fair value of Non-Prime Senior
Securities - AFS
|
$ | 113 | $ | 181 | $ | 9 | $ | 303 | ||||||||
|
Overall credit
support to Non-Prime Senior Securities (1)
|
16.25 | % | 13.97 | % | 20.42 | % | 14.74 | % | ||||||||
|
Serious
delinquencies as a % of collateral balance (1)
|
11.42 | % | 13.01 | % | 18.29 | % | 12.87 | % | ||||||||
|
Fair value of Non-Prime Senior
Securities - Trading
|
$ | 1 | $ | 16 | $ | - | $ | 17 | ||||||||
|
Total fair value of Non-Prime
Senior Securities
|
$ | 114 | $ | 197 | $ | 9 | $ | 320 | ||||||||
|
u
|
Serious
delinquencies in our non-prime senior portfolio are significantly higher
than in our prime senior portfolio. However, the levels of credit and
structural support are also significantly higher and, as a result, our
non-prime senior portfolio is better able to withstand the higher levels
of credit losses we expect to incur on these pools. In the second quarter,
our senior non-prime securities incurred credit losses of $3 million,
which was in line with our expectations. Please refer to the first two
bullets under the table on page 30 and the first bullet on the top of page
31 for further discussion on the characteristics and limitations of the
table on page 31, which discussion is also applicable to the table
above.
|
|
u
|
The fair
market value of our non-prime senior securities AFS was equal to 76% of
the face value of the portfolio while our amortized cost was equal to 70%
of the face value at June 30, 2010. (We also own non-prime senior
securities that are accounted for as trading securities, which are carried
at their fair market value of $17 million and which do not have GAAP
credit reserves or purchase discounts.) The combined non-prime senior
securities portfolio generated $21 million of cash from principal and
interest in the second and first quarters, excluding proceeds from sales.
The annualized yield in the second quarter for our non-prime senior
securities was 15.1%.
|
|
32
|
THE REDWOOD
REVIEW 2ND QUARTER 2010
|
|
|
|
|
RESIDENTIAL REAL ESTATE
SECURITIES
|
|
u
|
The following
table presents information on residential non-senior securities at Redwood
at June 30, 2010. We account for all of these securities as
available-for-sale.
|
|
Residential
Non-Senior Securities at Redwood
|
||||||||||||
|
June 30,
2010
|
||||||||||||
|
($ in
millions)
|
||||||||||||
|
Subordinate
|
Re-REMIC
|
Total
|
||||||||||
|
Current
face
|
$ | 343 | $ | 139 | 482 | |||||||
|
Credit
reserve
|
(256 | ) | (38 | ) | (294 | ) | ||||||
|
Net unamortized
discount
|
(43 | ) | (68 | ) | (111 | ) | ||||||
|
Amortized
cost
|
44 | 33 | 77 | |||||||||
|
Unrealized
gains
|
2 | 36 | 38 | |||||||||
|
Unrealized
losses
|
(20 | ) | - | (20 | ) | |||||||
|
Fair value of Non-senior
Securities
|
$ | 26 | $ | 69 | $ | 95 | ||||||
|
u
|
Credit losses
totaled $57 million in our residential subordinate portfolio in the second
quarter, compared to $45 million of losses in the first quarter of 2010.
We expect future losses will extinguish the majority of these securities
as reflected by the $256 million of credit reserves we have provided for
the $343 million face value of those securities. Until the losses occur,
we will continue to earn interest on the face value of those
securities.
|
|
u
|
The fair
market value of our subordinate securities was equal to 8% of the face
value while our amortized cost was equal to 13% of the face value of the
portfolio at June 30, 2010. These securities generated $8 million of cash
in both the second and first quarters of 2010. The annualized yield in the
second quarter for our non-senior securities portfolio was
34.2%.
|
|
THE REDWOOD
REVIEW 2ND QUARTER 2010
|
33
|
|
|
| RESIDENTIAL REAL ESTATE SECURITIES |
|
u
|
Our existing
portfolio of re-REMIC securities consists of prime residential senior
securities that were pooled and re-securitized in 2009 to create
two-tranche structures and we own support (or junior) securities within
those structures.
|
|
u
|
The fair
market value of our re-REMIC securities was equal to 50% of the face value
of the portfolio, while our amortized cost was equal to 24% of the face
value at June 30, 2010. These securities generated $2 million of cash
exclusively from interest in the second quarter, compared to $3 million in
the first quarter of 2010, excluding proceeds from sales. The annualized
yield in the second quarter for our re-REMIC securities portfolio was
16.1%.
|
|
u
|
There were no
credit losses in our re-REMIC portfolio in the second quarter. We
anticipate losses, which were included in our acquisition assumptions, and
have allocated $38 million of the purchase discount to credit reserves for
the $139 million face value.
|
|
34
|
THE REDWOOD
REVIEW 2ND QUARTER 2010
|
|
|
 |
|
COMMERCIAL
REAL ESTATE SECURITIES
|
|
u
|
There
continues to be an elevated level of distress in the commercial mortgage
market. As lenders continue to employ an “extend and pretend” strategy,
resolution of troubled assets is really just beginning. Real Capital
Analytics characterizes $187 billion of mortgages (approximately 6% of
total commercial mortgages outstanding) as distressed, and estimates that
just 15% of troubled assets have been resolved, 15% have been modified /
extended, and 70% still await
resolution.
|
|
u
|
Generally,
property level fundamentals continue to deteriorate, albeit at a
significantly slower pace compared to the rapid declines in occupancy
rates and rental rates witnessed in 2008 and 2009. In the second quarter
of 2010, the national vacancy rate on office properties increased by 10
basis points to 17.4% and the national vacancy rate on retail properties
increased by 10 basis points to 10.9%. The national vacancy rate on
multifamily properties declined for the first time in two years, dropping
20 basis points to 7.8% in the second quarter. The market seems to expect
growth in rents to remain relatively flat in the near
term.
|
|
u
|
The financing
market is increasingly split between high-quality, stabilized assets and
all other assets. Significant competition among lenders for the best
properties in strong markets has led to compressed lending spreads. In
fact, lending spreads have declined up to 200 basis points from the start
of the year, as life insurance companies, Fannie Mae, Freddie Mac, and,
more recently, CMBS conduit lenders are competing for the limited number
of loans on the best quality
assets.
|
|
u
|
Similar to
the single-family residential market, Fannie Mae and Freddie Mac are
increasingly dominating the multifamily market. In 2009, their combined
market share of originations increased to 85% from 79% in 2008, 41% in
2007, and in 33% in 2006.We expect the agency share of the market to
decline due to GSE reform, which should increase the share available for
the private market.
|
|
u
|
Our near-term
commercial mortgage investment strategy remains to target high-quality
subordinate and mezzanine investments. We now have the team, experience,
relationships, resources, discipline, patience, policies, and procedures
to capitalize on opportunities that should result from the trillion dollar
funding gap facing the commercial real estate industry in the coming
years.
|
|
u
|
Our portfolio
of commercial securities generated $1 million of cash flow in both the
second and first quarters of 2010.
|
|
u
|
Realized
credit losses in the second quarter of 2010 on our commercial subordinate
securities were $12 million, compared to $7 million in the prior quarter,
and were charged against our designated credit
reserve.
|
|
u
|
At June 30,
2010, our investments in commercial securities consisted of predominantly
2004 and 2005 vintage subordinate securities with a fair market value of
$8 million. These securities have a face value of $141 million and credit
reserves of $128 million.
|
|
THE REDWOOD
REVIEW 2ND QUARTER 2010
|
35
|
 |
|
|
INVESTMENTS
IN OTHER CONSOLIDATED ENTITIES
|
|
u
|
In the second
quarter, we reported GAAP income of $4 million from the legacy Sequoia and
Acacia entities. This was an increase from the $2 million reported in the
first quarter due to lower negative mark-to-market adjustments of $5
million, lower loss provision expense of $5 million, offset by a decrease
in realized gains of $6 million (as we did not repurchase any asset-backed
securities in the second quarter), and lower net interest income of $2
million.
|
|
u
|
Cash
generated by our investments in Sequoia and Acacia entities totaled $7
million in the second quarter of 2010 compared to $8 million in the first
quarter. All of this second quarter cash flow was generated from Sequoia
IOs we own which were primarily issued in 2005 and earlier. The decrease
in cash received is a result of the decline in the interest payments on
six month LIBOR loans as coupon rates on the underlying mortgages reset
down during the quarter.
|
|
u
|
For the 48
prime jumbo residential mortgage securitizations totaling $35 billion
issued by our legacy Sequoia securitization entities (including five
securitizations for which a subsidiary of Redwood was the depositor but
which were not issued under the Sequoia program shelf registration
statement and which we do not consolidate), cumulative losses total 0.32%
of the original face amount of the securities through June 30, 2010, up
from 0.28% through March 31, 2010.
|
|
u
|
To date,
credit losses have not yet been incurred on any of the senior securities
issued by Sequoia securitization entities, although some of these senior
securities may incur losses in the future, depending on the magnitude and
timing of additional credit losses incurred on the underlying
loans.
|
|
u
|
The
consolidation of the assets and liabilities of securitization entities may
lead to potentially volatile quarterly reported earnings for a variety of
reasons, including the amortization of premium on the loans and
liabilities of Sequoia entities, changes in credit loss provisions for
loans held by Sequoia entities, fair value adjustments for the assets and
liabilities of the Acacia entities, and deconsolidation
events.
|
|
36
|
THE REDWOOD
REVIEW 2ND QUARTER 2010
|

 |
|
|
REDWOOD’S GSE REFORM
PROPOSAL
|
 |
One
Belvedere Place
Suite
300
Mill
Valley, CA 94941
|
|
|
Phone
|
415.389.7373
|
|
|
Fax
|
415.381.1773
|
|
|
38
|
THE REDWOOD
REVIEW 2ND QUARTER 2010
|
|
|
|
|
REDWOOD’S GSE REFORM
PROPOSAL
|
|
THE REDWOOD
REVIEW 2ND QUARTER 2010
|
39
|
|
|
|
|
REDWOOD’S GSE REFORM
PROPOSAL
|
|
40
|
THE REDWOOD
REVIEW 2ND QUARTER 2010
|
|
|
|
|
REDWOOD’S GSE REFORM
PROPOSAL
|
|
THE REDWOOD
REVIEW 2ND QUARTER 2010
|
41
|
|
|
|
|
REDWOOD’S GSE REFORM
PROPOSAL
|
|
42
|
THE REDWOOD
REVIEW 2ND QUARTER 2010
|
|
|
|
|
REDWOOD’S GSE REFORM
PROPOSAL
|
|
Sincerely,
|
|
|
|
Martin S.
Hughes
Chief Executive
Officer
Redwood Trust,
Inc.
|
|
THE REDWOOD
REVIEW 2ND QUARTER 2010
|
43
|
 |
|
|
ACCOUNTING
DISCUSSION
|
|
u
|
Market values
reflect an “exit price,” or the amount we believe we would realize if we
sold an asset or would pay if we repurchased a liability in an orderly
transaction, even though we generally have no intention — nor would we be
required — to sell assets or repurchase liabilities. Establishing market
values is inherently subjective and requires us to make a number of
assumptions, including the future of interest rates, prepayment rates,
discount rates, credit loss rates, and the timing of credit losses. The
assumptions we apply are specific to each asset or
liability.
|
|
u
|
Although we
rely on our internal calculations to compute the fair value of our
securities, we request and consider indications of value (marks) from
third-party dealers to assist us in our mark-to-market valuation process.
For June 30, 2010, we received dealer marks on 78% of our assets and 88%
of our liabilities. In the aggregate, our internal valuations of the
securities on which we received dealer marks were 3% lower (i.e., more
conservative) than the dealer marks and our internal valuations of our ABS
issued on which we received dealer marks were 7% higher (i.e., more
conservative) than the dealer
marks.
|
|
u
|
As discussed
in our second quarter 2009 Redwood Review, on April 1, 2009, we were
required to adopt a new accounting principle affecting the determination
of other-than-temporary impairment (OTTI) and its recognition through the
income statement and balance sheet (outlined below). The revised
multi-step process is presented below. Upon adoption, we made a one-time
retained earnings reclassification of $60 million of prior impairments.
Our book value did not change as a result of this reclassification. As
this impairment is recovered over time, rather than flow through earnings
(where the impairment was originally reported), it will instead be
credited to equity. The net impact is that our cumulative reported
earnings will now be $60 million less than they would have been prior to
adopting this required accounting
principle.
|
|
44
|
THE REDWOOD
REVIEW 2ND QUARTER 2010
|
|
|
 |
|
GLOSSARY
|
|
THE REDWOOD
REVIEW 2ND QUARTER 2010
|
45
|
|
|
|
|
GLOSSARY
|
|
46
|
THE REDWOOD
REVIEW 2ND QUARTER 2010
|
|
|
|
|
GLOSSARY
|
|
THE REDWOOD
REVIEW 2ND QUARTER 2010
|
47
|
|
|
|
|
GLOSSARY
|
|
48
|
THE REDWOOD
REVIEW 2ND QUARTER 2010
|
|
|
|
|
GLOSSARY
|
|
THE REDWOOD
REVIEW 2ND QUARTER 2010
|
49
|
|
|
|
|
GLOSSARY
|
|
50
|
THE REDWOOD
REVIEW 2ND QUARTER 2010
|

|
Six
|
Six
|
||||||||||||||||||||||||||||||||||||||||||
|
2010
|
2010
|
2009
|
2009
|
2009
|
2009
|
2008
|
2008
|
2008
|
Months
|
Months
|
|||||||||||||||||||||||||||||||||
|
Q2
|
Q1
|
Q4
|
Q3
|
Q2
|
Q1
|
Q4
|
Q3
|
Q2
|
2010
|
2009
|
|||||||||||||||||||||||||||||||||
|
Interest
income
|
$ | 47,730 | $ | 50,451 | $ | 57,718 | $ | 64,424 | $ | 74,332 | $ | 83,903 | $ | 124,452 | $ | 126,227 | $ | 140,444 | $ | 98,181 | $ | 158,235 | |||||||||||||||||||||
|
Discount
amortization on securities, net
|
10,821 | 10,629 | 7,432 | 9,575 | 3,864 | 4,917 | (1,189 | ) | 7,850 | 6,258 | 21,450 | 8,781 | |||||||||||||||||||||||||||||||
|
Other
investment interest income
|
4 | 9 | 12 | 25 | 53 | 76 | 572 | 487 | 514 | 13 | 129 | ||||||||||||||||||||||||||||||||
|
Premium
amortization expense on loans
|
(1,985 | ) | (2,371 | ) | (3,365 | ) | (3,642 | ) | (3,988 | ) | (7,459 | ) | (548 | ) | (3,372 | ) | (10,215 | ) | (4,356 | ) | (11,447 | ) | |||||||||||||||||||||
|
Total
interest income
|
56,570 | 58,718 | 61,797 | 70,382 | 74,261 | 81,437 | 123,287 | 131,192 | 137,001 | 115,288 | 155,698 | ||||||||||||||||||||||||||||||||
|
Interest
expense on short-term debt
|
(36 | ) | - | - | - | - | - | (2 | ) | (65 | ) | (68 | ) | (36 | ) | - | |||||||||||||||||||||||||||
|
Interest
expense on ABS
|
(17,582 | ) | (16,145 | ) | (17,930 | ) | (22,071 | ) | (36,115 | ) | (44,517 | ) | (94,431 | ) | (88,294 | ) | (93,993 | ) | (33,727 | ) | (80,632 | ) | |||||||||||||||||||||
|
ABS
issuance expense amortization
|
(475 | ) | (634 | ) | (575 | ) | (570 | ) | (586 | ) | (553 | ) | (1,470 | ) | (930 | ) | (1,921 | ) | (1,109 | ) | (1,139 | ) | |||||||||||||||||||||
|
ABS
interest rate agreement expense
|
(1,127 | ) | (495 | ) | (1,123 | ) | (1,123 | ) | (1,111 | ) | (1,098 | ) | (1,934 | ) | (1,259 | ) | (1,246 | ) | (1,622 | ) | (2,209 | ) | |||||||||||||||||||||
|
ABS
issuance premium amortization income
|
196 | 208 | 223 | 234 | 313 | 335 | 476 | 557 | 1,955 | 404 | 648 | ||||||||||||||||||||||||||||||||
|
Total
ABS expense consolidated from trusts
|
(18,988 | ) | (17,066 | ) | (19,405 | ) | (23,530 | ) | (37,499 | ) | (45,833 | ) | (97,359 | ) | (89,926 | ) | (95,205 | ) | (36,054 | ) | (83,332 | ) | |||||||||||||||||||||
|
Interest
expense on long-term debt
|
(2,140 | ) | (1,116 | ) | (1,167 | ) | (1,307 | ) | (1,502 | ) | (1,808 | ) | (2,345 | ) | (2,164 | ) | (2,233 | ) | (3,256 | ) | (3,310 | ) | |||||||||||||||||||||
|
Net
interest income
|
35,406 | 40,536 | 41,225 | 45,545 | 35,260 | 33,795 | 23,581 | 39,037 | 39,495 | 75,942 | 69,056 | ||||||||||||||||||||||||||||||||
|
Provision
for loan losses
|
(4,321 | ) | (9,476 | ) | (8,997 | ) | (9,998 | ) | (14,545 | ) | (16,032 | ) | (18,659 | ) | (18,333 | ) | (10,061 | ) | (13,797 | ) | (30,577 | ) | |||||||||||||||||||||
|
Market
valuation adjustments, net
|
(7,125 | ) | (11,237 | ) | (4,191 | ) | (11,058 | ) | (29,135 | ) | (43,244 | ) | (111,331 | ) | (127,146 | ) | (60,496 | ) | (18,362 | ) | (72,379 | ) | |||||||||||||||||||||
|
Net
interest income (loss) after provision and market valuation
adjustments
|
23,960 | 19,823 | 28,037 | 24,489 | (8,420 | ) | (25,481 | ) | (106,409 | ) | (106,442 | ) | (31,062 | ) | 43,783 | (33,900 | ) | ||||||||||||||||||||||||||
|
Fixed
compensation expense
|
(3,661 | ) | (4,109 | ) | (3,261 | ) | (3,726 | ) | (3,572 | ) | (4,028 | ) | (3,575 | ) | (4,331 | ) | (4,648 | ) | (7,770 | ) | (7,600 | ) | |||||||||||||||||||||
|
Variable
compensation expense
|
(1,303 | ) | (1,880 | ) | (566 | ) | (5,216 | ) | (1,132 | ) | (556 | ) | 418 | (616 | ) | (330 | ) | (3,183 | ) | (1,688 | ) | ||||||||||||||||||||||
|
Equity
compensation expense
|
(2,077 | ) | (6,059 | ) | (1,553 | ) | (420 | ) | (2,337 | ) | (1,795 | ) | (2,378 | ) | (3,080 | ) | (3,502 | ) | (8,136 | ) | (4,132 | ) | |||||||||||||||||||||
|
Severance
expense
|
(229 | ) | (81 | ) | - | (398 | ) | - | (28 | ) | (1,814 | ) | - | - | (310 | ) | (28 | ) | |||||||||||||||||||||||||
|
Other
operating expense
|
(3,957 | ) | (5,177 | ) | (5,453 | ) | (5,046 | ) | (3,728 | ) | (4,132 | ) | (6,104 | ) | (8,824 | ) | (5,775 | ) | (9,134 | ) | (7,860 | ) | |||||||||||||||||||||
|
Total
operating expenses
|
(11,227 | ) | (17,306 | ) | (10,833 | ) | (14,806 | ) | (10,769 | ) | (10,539 | ) | (13,453 | ) | (16,851 | ) | (14,255 | ) | (28,533 | ) | (21,308 | ) | |||||||||||||||||||||
|
Realized
gains (losses) on sales, net
|
16,080 | 44,338 | 19,617 | 17,561 | 25,525 | 463 | 5,823 | (15 | ) | 2,757 | 60,418 | 25,988 | |||||||||||||||||||||||||||||||
|
Realized
losses on calls, net
|
- | - | - | - | - | - | - | (50 | ) | (43 | ) | - | - | ||||||||||||||||||||||||||||||
|
Realized
gains (losses), net
|
16,080 | 44,338 | 19,617 | 17,561 | 25,525 | 463 | 5,823 | (65 | ) | 2,714 | 60,418 | 25,988 | |||||||||||||||||||||||||||||||
|
Noncontrolling
interest
|
(186 | ) | 15 | (143 | ) | (363 | ) | (127 | ) | 716 | 2,366 | 2,194 | (2,369 | ) | (171 | ) | 589 | ||||||||||||||||||||||||||
|
(Provision
for) benefit from income taxes
|
(26 | ) | (26 | ) | 3,612 | 247 | 514 | (105 | ) | (3,913 | ) | 9,860 | (937 | ) | (52 | ) | 409 | ||||||||||||||||||||||||||
|
Net
income (loss)
|
$ | 28,601 | $ | 46,844 | $ | 40,290 | $ | 27,128 | $ | 6,723 | $ | (34,946 | ) | $ | (115,586 | ) | $ | (111,304 | ) | $ | (45,909 | ) | $ | 75,445 | $ | (28,222 | ) | ||||||||||||||||
|
Diluted
average shares
|
78,852 | 78,542 | 78,101 | 78,223 | 66,446 | 53,632 | 33,366 | 33,334 | 32,871 | 78,662 | 59,138 | ||||||||||||||||||||||||||||||||
|
Net
income (loss) per share
|
$ | 0.35 | $ | 0.58 | $ | 0.51 | $ | 0.34 | $ | 0.10 | $ | (0.65 | ) | $ | (3.46 | ) | $ | (3.34 | ) | $ | (1.40 | ) | $ | 0.94 | $ | (0.48 | ) | ||||||||||||||||
|
THE
REDWOOD REVIEW 2ND QUARTER 2010
|
Table
1: GAAP Earnings
|
|
|
|
($ in thousands, except per share
data)
|
|
|
Estimated 2010
Q2 (2)
|
Estimated
Twelve Months 2009
|
Actual
Twelve Months 2008
|
||||||||||||||||||||||||||||||||||
|
Taxable
|
GAAP
|
Taxable
|
GAAP
|
Taxable
|
GAAP
|
|||||||||||||||||||||||||||||||
|
Loss
|
Income
|
Differences
|
Loss
|
Income
|
Differences
|
Income
|
Loss
|
Differences
|
||||||||||||||||||||||||||||
|
Interest
income
|
$ | 33,828 | $ | 56,570 | $ | (22,742 | ) | $ | 193,106 | $ | 287,877 | $ | (94,771 | ) | $ | 201,857 | $ | 567,545 | $ | (365,688 | ) | |||||||||||||||
|
Interest
expense
|
(2,382 | ) | (21,164 | ) | 18,782 | (5,009 | ) | (132,003 | ) | 126,994 | (7,784 | ) | (416,669 | ) | 408,885 | |||||||||||||||||||||
|
Net interest
income
|
31,446 | 35,406 | (3,960 | ) | 188,097 | 155,874 | 32,223 | 194,073 | 150,876 | 43,197 | ||||||||||||||||||||||||||
|
Provision for loan
losses
|
- | (4,321 | ) | 4,321 | - | (49,573 | ) | 49,573 | - | (55,111 | ) | 55,111 | ||||||||||||||||||||||||
|
Realized credit
losses
|
(24,427 | ) | - | (24,427 | ) | (223,910 | ) | - | (223,910 | ) | (116,546 | ) | - | (116,546 | ) | |||||||||||||||||||||
|
Market valuation adjustments,
net
|
- | (7,125 | ) | 7,125 | - | (87,628 | ) | 87,628 | - | (492,902 | ) | 492,902 | ||||||||||||||||||||||||
|
Operating
expenses
|
(9,569 | ) | (11,227 | ) | 1,658 | (54,237 | ) | (46,995 | ) | (7,242 | ) | (58,335 | ) | (60,906 | ) | 2,571 | ||||||||||||||||||||
|
Realized gains,
net
|
- | 16,080 | (16,080 | ) | 6,625 | 63,166 | (56,541 | ) | - | 8,511 | (8,511 | ) | ||||||||||||||||||||||||
|
(Provision for) benefit from
income taxes
|
- | (26 | ) | 26 | (10 | ) | 4,268 | (4,278 | ) | (113 | ) | 3,210 | (3,323 | ) | ||||||||||||||||||||||
|
Less: Net income attributable to
noncontrolling interest
|
- | 186 | (186 | ) | - | (83 | ) | 83 | - | (1,936 | ) | 1,936 | ||||||||||||||||||||||||
| - | - | |||||||||||||||||||||||||||||||||||
|
Taxable (loss)
income
|
$ | (2,550 | ) | $ | 28,601 | $ | (31,151 | ) | $ | (83,435 | ) | $ | 39,195 | $ | (122,630 | ) | $ | 19,079 | $ | (444,386 | ) | $ | 463,465 | |||||||||||||
| - | ||||||||||||||||||||||||||||||||||||
|
REIT taxable
income (loss)
|
$ | 2,883 | $ | (69,701 | ) | $ | 18,541 | |||||||||||||||||||||||||||||
|
Taxable (loss) income at taxable
subsidiaries
|
(5,433 | ) | (13,734 | ) | 538 | |||||||||||||||||||||||||||||||
|
Taxable income
(loss)
|
$ | (2,550 | ) | $ | (83,435 | ) | $ | 19,079 | ||||||||||||||||||||||||||||
|
Shares used for taxable EPS
calculation
|
77,908 | 71,800 | 32,283 | |||||||||||||||||||||||||||||||||
|
REIT taxable income (loss) per
share (3)
|
$ | 0.05 | $ | (0.93 | ) | $ | 0.57 | |||||||||||||||||||||||||||||
|
Taxable (loss) income at taxable
subsidiaries per share
|
$ | (0.08 | ) | $ | (0.19 | ) | $ | 0.01 | ||||||||||||||||||||||||||||
|
Taxable income (loss) per
share
(3)
|
$ | (0.03 | ) | $ | (1.12 | ) | $ | 0.58 | ||||||||||||||||||||||||||||
|
THE
REDWOOD REVIEW 2ND QUARTER 2010
|
Table
2:Taxable Income (Loss) and GAAP Income (Loss) Differences
|
53
|
|
|
||
|
Estimated
|
Estimated
|
Actual
|
Estimated
|
Estimated
|
||||||||||||||||||||||||||||||||||||||||
|
Six
|
Six
|
|||||||||||||||||||||||||||||||||||||||||||
|
2010
|
2010
|
2009
|
2009
|
2009
|
2009
|
2008
|
2008
|
2008
|
Months
|
Months
|
||||||||||||||||||||||||||||||||||
|
Q2
|
Q1
|
Q4
|
Q3
|
Q2
|
Q1
|
Q4
|
Q3
|
Q2
|
2010
|
2009
|
||||||||||||||||||||||||||||||||||
|
Dividends
declared
|
$ | 19,477 | $ | 19,438 | $ | 19,434 | $ | 19,417 | $ | 19,376 | $ | 15,057 | $ | 25,103 | $ | 24,928 | $ | 24,887 | $ | 38,915 | $ | 34,433 | ||||||||||||||||||||||
|
Dividend deductions on stock
issued through
|
||||||||||||||||||||||||||||||||||||||||||||
|
direct stock purchase
plan
|
21 | 37 | 6 | 2 | 2 | 30 | 45 | 165 | 288 | 58 | 32 | |||||||||||||||||||||||||||||||||
|
Total dividend
deductions
|
$ | 19,498 | $ | 19,475 | $ | 19,440 | $ | 19,419 | $ | 19,378 | $ | 15,087 | $ | 25,148 | $ | 25,093 | $ | 25,175 | $ | 38,973 | $ | 34,465 | ||||||||||||||||||||||
|
|
|
|
||||||||||||||||||||||||||||||||||||||||||
|
Regular dividend per
share
|
$ | 0.25 | $ | 0.25 | $ | 0.25 | $ | 0.25 | $ | 0.25 | $ | 0.25 | $ | 0.75 | $ | 0.75 | $ | 0.75 | $ | 0.50 | $ | 0.50 | ||||||||||||||||||||||
|
Special dividend per
share
|
- | - | - | - | - | - | - | - | - | - | - | |||||||||||||||||||||||||||||||||
|
Total dividends per
share
(1)
|
$ | 0.25 | $ | 0.25 | $ | 0.25 | $ | 0.25 | $ | 0.25 | $ | 0.25 | $ | 0.75 | $ | 0.75 | $ | 0.75 | $ | 0.50 | $ | 0.50 | ||||||||||||||||||||||
|
Undistributed REIT taxable income
at beginning of period (pre-tax)
|
$ | - | $ | - | $ | - | $ | - | $ | - | $ | - | $ | 21,128 | $ | 43,821 | $ | 64,582 | $ | - | $ | - | ||||||||||||||||||||||
|
REIT taxable income
(loss) (pre-tax)
|
2,883 | 9,831 | (25,688 | ) | (24,933 | ) | (10,379 | ) | (8,701 | ) | (13,007 | ) | 2,400 | 4,414 | 12,714 | (19,080 | ) | |||||||||||||||||||||||||||
|
Dividend of 2007
income
|
- | - | - | - | - | - | - | (14,673 | ) | (25,175 | ) | - | - | |||||||||||||||||||||||||||||||
|
Dividend of 2008
income
|
- | - | - | - | - | - | (8,121 | ) | (10,420 | ) | - | - | - | |||||||||||||||||||||||||||||||
|
Dividend of 2009
income
|
- | - | - | - | - | - | - | - | - | - | - | |||||||||||||||||||||||||||||||||
|
Dividend of 2010
income
|
- | - | - | - | - | - | - | - | - | - | - | |||||||||||||||||||||||||||||||||
|
Undistributed REIT taxable income
(pre-tax) at period end
|
$ | - | $ | - | $ | - | $ | - | $ | - | $ | - | $ | - | $ | 21,128 | $ | 43,821 | $ | - | $ | - | ||||||||||||||||||||||
|
Undistributed REIT taxable income
(pre-tax) at period end
|
||||||||||||||||||||||||||||||||||||||||||||
|
From 2007
|
$ | - | $ | - | $ | - | $ | - | $ | - | $ | - | $ | - | $ | - | $ | 14,673 | $ | - | $ | - | ||||||||||||||||||||||
|
From 2008
|
- | - | - | - | - | - | - | 20,872 | 29,148 | - | - | |||||||||||||||||||||||||||||||||
|
From 2009
|
- | - | - | - | - | - | - | - | - | - | - | |||||||||||||||||||||||||||||||||
|
From 2010
|
- | - | - | - | - | - | - | - | - | - | - | |||||||||||||||||||||||||||||||||
|
Total
|
$ | - | $ | - | $ | - | $ | - | $ | - | $ | - | $ | - | $ | 20,872 | $ | 43,821 | $ | - | $ | - | ||||||||||||||||||||||
|
|
|
|
||||||||||||||||||||||||||||||||||||||||||
|
Shares outstanding at period
end
|
77,908 | 77,751 | 77,737 | 77,669 | 77,503 | 60,228 | 33,471 | 33,238 | 33,184 | 77,908 | 77,503 | |||||||||||||||||||||||||||||||||
|
Undistributed REIT taxable income
(pre-tax)
|
||||||||||||||||||||||||||||||||||||||||||||
|
per share outstanding at period
end
|
$ | - | $ | - | $ | - | $ | - | $ | - | $ | - | $ | - | $ | 0.63 | $ | 1.32 | $ | - | $ | - | ||||||||||||||||||||||
|
THE
REDWOOD REVIEW 2ND QUARTER 2010
|
Table
3: Retention and Distribution of Taxable Income
|
|
|
2010
|
2010
|
2009
|
2009
|
2009
|
2009
|
2008
|
2008
|
2008
|
||||||||||||||||||||||||||||
|
Q2
|
Q1
|
Q4
|
Q3
|
Q2
|
Q1
|
Q4
|
Q3
|
Q2
|
||||||||||||||||||||||||||||
|
Short-term
debt
|
$ | - | $ | - | $ | - | $ | - | $ | - | $ | - | $ | - | $ | 7 | $ | 9 | ||||||||||||||||||
|
Long-term
debt
|
140 | 140 | 140 | 140 | 150 | 150 | 150 | 150 | 150 | |||||||||||||||||||||||||||
|
Redwood debt (1)
|
$ | 140 | $ | 140 | $ | 140 | $ | 140 | $ | 150 | $ | 150 | $ | 150 | $ | 157 | $ | 159 | ||||||||||||||||||
|
GAAP stockholders'
equity
|
$ | 991 | $ | 998 | $ | 972 | $ | 907 | $ | 802 | $ | 506 | $ | 302 | $ | 412 | $ | 564 | ||||||||||||||||||
|
Redwood debt to
equity
|
0.1 | x | 0.1 | x | 0.1 | x | 0.2 | x | 0.2 | x | 0.3 | x | 0.5 | x | 0.4 | x | 0.3 | x | ||||||||||||||||||
|
Redwood debt to (equity +
debt)
|
12 | % | 12 | % | 13 | % | 13 | % | 16 | % | 23 | % | 33 | % | 28 | % | 22 | % | ||||||||||||||||||
|
Redwood
debt
|
$ | 140 | $ | 140 | $ | 140 | $ | 140 | $ | 150 | $ | 150 | $ | 150 | $ | 157 | $ | 159 | ||||||||||||||||||
|
ABS obligations of consolidated
securitization entities
|
3,961 | 3,837 | 3,943 | 4,016 | 4,185 | 4,709 | 4,855 | 6,603 | 7,110 | |||||||||||||||||||||||||||
|
GAAP
obligation
|
$ | 4,101 | $ | 3,977 | $ | 4,083 | $ | 4,156 | $ | 4,335 | $ | 4,859 | $ | 5,005 | $ | 6,760 | $ | 7,269 | ||||||||||||||||||
|
GAAP obligation to
equity
|
4.0 | x | 4.0 | x | 4.2 | x | 4.6 | x | 5.4 | x | 9.6 | x | 16.6 | x | 16.4 | x | 12.9 | x | ||||||||||||||||||
|
GAAP obligation to (equity + GAAP
debt)
|
81 | % | 80 | % | 81 | % | 82 | % | 84 | % | 91 | % | 94 | % | 94 | % | 93 | % | ||||||||||||||||||
|
GAAP stockholders'
equity
|
$ | 991 | $ | 998 | $ | 972 | $ | 907 | $ | 802 | $ | 506 | $ | 302 | $ | 412 | $ | 564 | ||||||||||||||||||
|
Balance sheet mark-to-market
adjustments
|
34 | 57 | 58 | 21 | (78 | ) | (85 | ) | (57 | ) | (84 | ) | (68 | ) | ||||||||||||||||||||||
|
Core equity
(non-GAAP)
|
$ | 957 | $ | 941 | $ | 914 | $ | 886 | $ | 880 | $ | 591 | $ | 359 | $ | 496 | $ | 632 | ||||||||||||||||||
|
Shares outstanding at period
end
|
77,908 | 77,751 | 77,737 | 77,669 | 77,503 | 60,228 | 33,471 | 33,238 | 33,184 | |||||||||||||||||||||||||||
|
GAAP equity per
share
|
$ | 12.71 | $ | 12.84 | $ | 12.50 | $ | 11.68 | $ | 10.35 | $ | 8.40 | $ | 9.02 | $ | 12.40 | $ | 17.00 | ||||||||||||||||||
|
Adjustments: GAAP equity to
economic value (2)
|
||||||||||||||||||||||||||||||||||||
|
Investments in
Sequoia
|
$ | (0.31 | ) | $ | (0.37 | ) | $ | (0.37 | ) | $ | (0.37 | ) | $ | (0.35 | ) | $ | (0.15 | ) | $ | (0.95 | ) | $ | (1.65 | ) | $ | (1.96 | ) | |||||||||
|
Investments in
Acacia
|
(0.03 | ) | - | - | - | 0.01 | (0.03 | ) | (0.21 | ) | (0.18 | ) | (0.66 | ) | ||||||||||||||||||||||
|
Long-term
debt
|
1.00 | 0.85 | 0.90 | 0.97 | 1.29 | 1.79 | 3.24 | 2.61 | 2.34 | |||||||||||||||||||||||||||
|
Estimate of economic value per
share (non-GAAP)
|
$ | 13.37 | $ | 13.32 | $ | 13.03 | $ | 12.28 | $ | 11.30 | $ | 10.01 | $ | 11.10 | $ | 13.18 | $ | 16.72 | ||||||||||||||||||
|
THE
REDWOOD REVIEW 2ND QUARTER 2010
|
Table 4: Book
Value and Other Ratios
|
55
|
|
|
||
|
Six
|
Six
|
|||||||||||||||||||||||||||||||||||||||||||
|
2010
|
2010
|
2009
|
2009
|
2009
|
2009
|
2008
|
2008
|
2008
|
Months
|
Months
|
||||||||||||||||||||||||||||||||||
|
Q2
|
Q1
|
Q4
|
Q3
|
Q2
|
Q1
|
Q4
|
Q3
|
Q2
|
2010
|
2009
|
||||||||||||||||||||||||||||||||||
|
Interest
income
|
$ | 56,570 | $ | 58,718 | $ | 61,797 | $ | 70,382 | $ | 74,261 | $ | 81,437 | $ | 123,287 | $ | 131,192 | $ | 137,001 | $ | 115,288 | $ | 155,698 | ||||||||||||||||||||||
|
Average consolidated earning
assets
|
$ | 5,139,945 | $ | 5,070,987 | $ | 5,175,337 | $ | 5,128,893 | $ | 5,325,322 | $ | 5,553,470 | $ | 7,006,592 | $ | 7,594,682 | $ | 8,137,261 | $ | 5,053,599 | $ | 5,509,070 | ||||||||||||||||||||||
|
Asset yield
|
4.40 | % | 4.63 | % | 4.78 | % | 5.49 | % | 5.58 | % | 5.87 | % | 7.04 | % | 6.91 | % | 6.73 | % | 4.56 | % | 5.65 | % | ||||||||||||||||||||||
|
Interest
expense
|
$ | (21,164 | ) | $ | (18,182 | ) | $ | (20,572 | ) | $ | (24,837 | ) | $ | (39,001 | ) | $ | (47,641 | ) | $ | (99,706 | ) | $ | (92,155 | ) | $ | (97,506 | ) | $ | (39,346 | ) | $ | (86,642 | ) | |||||||||||
|
Average consolidated
interest-bearing liabilities
|
$ | 4,077,992 | $ | 4,215,751 | $ | 4,096,928 | $ | 4,193,650 | $ | 4,651,125 | $ | 4,940,304 | $ | 6,613,677 | $ | 7,106,052 | $ | 7,499,474 | $ | 4,046,996 | $ | 4,788,503 | ||||||||||||||||||||||
|
Cost of
funds
|
2.08 | % | 1.73 | % | 2.01 | % | 2.37 | % | 3.35 | % | 3.86 | % | 6.03 | % | 5.19 | % | 5.20 | % | 1.94 | % | 3.62 | % | ||||||||||||||||||||||
|
Asset yield
|
4.40 | % | 4.63 | % | 4.78 | % | 5.49 | % | 5.58 | % | 5.87 | % | 7.04 | % | 6.91 | % | 6.73 | % | 4.56 | % | 5.65 | % | ||||||||||||||||||||||
|
Cost of
funds
|
(2.08 | %) | (1.73 | %) | (2.01 | %) | (2.37 | %) | (3.35 | %) | (3.86 | %) | (6.03 | %) | (5.19 | %) | (5.20 | %) | (1.94 | %) | (3.62 | %) | ||||||||||||||||||||||
|
Interest rate
spread
|
2.33 | % | 2.91 | % | 2.77 | % | 3.12 | % | 2.22 | % | 2.01 | % | 1.01 | % | 1.72 | % | 1.53 | % | 2.62 | % | 2.03 | % | ||||||||||||||||||||||
|
Net interest
income
|
$ | 35,406 | $ | 40,536 | $ | 41,225 | $ | 45,545 | $ | 35,260 | $ | 33,795 | $ | 23,581 | $ | 39,037 | $ | 39,495 | $ | 75,942 | $ | 69,055 | ||||||||||||||||||||||
|
Average consolidated earning
assets
|
$ | 5,139,945 | $ | 5,070,987 | $ | 5,175,337 | $ | 5,128,893 | $ | 5,325,322 | $ | 5,553,470 | $ | 7,006,592 | $ | 7,594,682 | $ | 8,137,261 | $ | 5,053,599 | $ | 5,509,070 | ||||||||||||||||||||||
|
Net interest
margin
|
2.76 | % | 3.20 | % | 3.19 | % | 3.55 | % | 2.65 | % | 2.43 | % | 1.35 | % | 2.06 | % | 1.94 | % | 3.01 | % | 2.51 | % | ||||||||||||||||||||||
|
Operating
expenses
|
$ | (11,227 | ) | $ | (17,306 | ) | $ | (10,833 | ) | $ | (14,806 | ) | $ | (10,769 | ) | $ | (10,539 | ) | $ | (13,453 | ) | $ | (16,851 | ) | $ | (14,255 | ) | $ | (28,533 | ) | $ | (21,308 | ) | |||||||||||
|
Average total
assets
|
$ | 5,263,730 | $ | 5,219,636 | $ | 5,293,887 | $ | 5,138,793 | $ | 5,315,643 | $ | 5,575,619 | $ | 7,040,306 | $ | 7,648,102 | $ | 8,203,461 | $ | 5,241,805 | $ | 5,444,913 | ||||||||||||||||||||||
|
Average total
equity
|
$ | 1,005,212 | $ | 985,350 | $ | 945,862 | $ | 833,227 | $ | 575,661 | $ | 556,861 | $ | 371,503 | $ | 533,755 | $ | 602,402 | $ | 995,336 | $ | 566,313 | ||||||||||||||||||||||
|
Operating expenses / net interest
income
|
31.71 | % | 42.69 | % | 26.28 | % | 32.51 | % | 30.54 | % | 31.18 | % | 57.05 | % | 43.17 | % | 36.09 | % | 75.14 | % | 61.71 | % | ||||||||||||||||||||||
|
Operating expenses / average total
assets
|
0.85 | % | 1.33 | % | 0.82 | % | 1.15 | % | 0.81 | % | 0.76 | % | 0.76 | % | 0.88 | % | 0.70 | % | 1.09 | % | 0.78 | % | ||||||||||||||||||||||
|
Operating expenses / average total
equity
|
4.47 | % | 7.03 | % | 4.58 | % | 7.11 | % | 7.48 | % | 7.57 | % | 14.49 | % | 12.63 | % | 9.47 | % | 5.73 | % | 7.53 | % | ||||||||||||||||||||||
|
GAAP net income
(loss)
|
$ | 28,601 | $ | 46,844 | $ | 40,290 | $ | 27,128 | $ | 6,723 | $ | (34,946 | ) | $ | (115,586 | ) | $ | (111,304 | ) | $ | (45,909 | ) | $ | 75,445 | $ | (28,223 | ) | |||||||||||||||||
|
GAAP net income (loss) / average
total assets
|
2.17 | % | 3.59 | % | 3.04 | % | 2.11 | % | 0.51 | % | (2.51 | %) | (6.57 | %) | (5.82 | %) | (2.24 | %) | 2.88 | % | (1.04 | %) | ||||||||||||||||||||||
|
GAAP net income (loss) / average
equity (GAAP ROE)
|
11.38 | % | 19.02 | % | 17.04 | % | 13.02 | % | 4.67 | % | (25.10 | %) | (124.45 | %) | (83.41 | %) | (30.48 | %) | 15.16 | % | (9.97 | %) | ||||||||||||||||||||||
|
GAAP net income (loss) / average
core equity (adjusted ROE) (2)
|
12.00 | % | 20.09 | % | 17.99 | % | 12.22 | % | 4.10 | % | (22.64 | %) | (103.09 | %) | (79.62 | %) | (28.42 | %) | 16.00 | % | (8.87 | %) | ||||||||||||||||||||||
|
Average core equity
(2)
|
$ | 953,720 | $ | 932,721 | $ | 896,034 | $ | 888,107 | $ | 655,695 | $ | 617,325 | $ | 448,484 | $ | 559,150 | $ | 646,211 | $ | 943,278 | $ | 636,616 | ||||||||||||||||||||||
|
THE
REDWOOD REVIEW 2ND QUARTER 2010
|
Table
5: Profitability Ratios
|
|
|
|
Table
6: Average Balance Sheet ($ in
thousands)
|
|
|
Six
|
Six
|
||||||||||||||||||||||||||||||||||||
|
2010
|
2010
|
2009
|
2009
|
2009
|
2009
|
2008
|
2008
|
2008
|
Months
|
Months
|
|||||||||||||||||||||||||||
|
Q2
|
Q1
|
Q4
|
Q3
|
Q2
|
Q1
|
Q4
|
Q3
|
Q2
|
2010
|
2009
|
|||||||||||||||||||||||||||
|
Real estate
assets at Redwood
|
|||||||||||||||||||||||||||||||||||||
|
Senior
Residential Securities
|
|||||||||||||||||||||||||||||||||||||
|
Prime
|
$ | 278,472 | $ | 283,477 | $ | 280,101 | $ | 264,773 | $ | 164,386 | $ | 77,651 | $ | 37,746 | $ | 27,880 | $ | 15,040 | $ | 280,961 | $ | 121,258 | |||||||||||||||
|
Non-prime
|
302,461 | 310,948 | 263,022 | 270,353 | 168,383 | 87,464 | 63,050 | 63,818 | 50,056 | 306,681 | 128,147 | ||||||||||||||||||||||||||
|
Total
Senior Residential Securities
|
580,933 | 594,426 | 543,124 | 535,126 | 332,769 | 165,114 | 100,796 | 91,698 | 65,096 | 587,642 | 249,405 | ||||||||||||||||||||||||||
|
Residential
Re-REMIC Securities
|
34,385 | 45,852 | 73,938 | 69,980 | 26,419 | - | - | - | - | 40,087 | 13,282.00 | ||||||||||||||||||||||||||
|
Subordinate
Residential Securities
|
|||||||||||||||||||||||||||||||||||||
|
Prime
|
38,079 | 41,701 | 47,083 | 58,637 | 43,020 | 47,070 | 88,943 | 147,513 | 177,996 | 39,880 | 45,034 | ||||||||||||||||||||||||||
|
Non-prime
|
7,708 | 4,253 | 1,377 | 2,218 | 2,767 | 3,450 | 4,105 | 4,450 | 17,184 | 5,990 | 3,106 | ||||||||||||||||||||||||||
|
Total
Subordinate Residential Securities
|
45,787 | 45,954 | 48,460 | 60,855 | 45,787 | 50,519 | 93,048 | 151,963 | 195,180 | 45,870 | 48,140 | ||||||||||||||||||||||||||
|
Commercial
subordinate securites
|
7,417 | 7,670 | 8,090 | 13,504 | 25,006 | 46,382 | 63,969 | 98,534 | 106,314 | 7,543 | 35,635 | ||||||||||||||||||||||||||
|
Commercial
loans
|
243 | 244 | 245 | 246 | 247 | 248 | 249 | 250 | 251 | 243 | 248 | ||||||||||||||||||||||||||
|
Residential
loans
|
2,299 | 2,313 | 2,314 | 2,315 | 2,435 | 2,600 | 2,960 | 3,671 | 3,759 | 2,306 | 2,517 | ||||||||||||||||||||||||||
|
CDO
|
1,207 | 1,222 | 1,962 | 2,255 | 2,595 | 3,429 | 3,856 | 8,628 | 15,492 | 1,215 | 3,010 | ||||||||||||||||||||||||||
|
Other real
estate investments
|
- | - | - | - | - | - | 50 | 75 | 2,328 | - | - | ||||||||||||||||||||||||||
|
Total
real estate assets at Redwood
|
672,270 | 697,681 | 678,133 | 684,281 | 435,258 | 268,293 | 264,927 | 354,819 | 388,420 | 684,905 | 352,237 | ||||||||||||||||||||||||||
|
Earning assets
at Acacia
|
290,060 | 299,843 | 304,436 | 298,615 | 321,206 | 404,596 | 575,709 | 830,311 | 982,169 | 294,924 | 362,671 | ||||||||||||||||||||||||||
|
Earning assets
at pre-2010 Sequoia
|
3,589,882 | 3,666,884 | 3,767,112 | 3,864,796 | 4,305,159 | 4,568,212 | 5,966,898 | 6,170,944 | 6,483,475 | 3,628,170 | 4,435,959 | ||||||||||||||||||||||||||
|
Earning assets
at 2010 Sequoia
|
161,502 | - | - | - | - | - | - | - | - | 81,197 | |||||||||||||||||||||||||||
|
Earning assets
at the Fund
|
35,526 | 42,134 | 53,990 | 57,070 | 58,054 | 62,319 | 71,792 | 75,321 | 56,183 | 38,812 | 60,175 | ||||||||||||||||||||||||||
|
Cash and cash
equivalents
|
339,212 | 311,816 | 321,838 | 279,011 | 285,680 | 310,514 | 204,246 | 229,778 | 311,052 | 325,590 | 298,028 | ||||||||||||||||||||||||||
|
Earning
assets
|
5,088,452 | 5,018,358 | 5,125,509 | 5,183,773 | 5,405,357 | 5,613,934 | 7,083,573 | 7,661,173 | 8,221,299 | 5,053,599 | 5,509,070 | ||||||||||||||||||||||||||
|
Balance sheet
mark-to-market adjustments
|
51,493 | 52,629 | 49,828 | (54,880 | ) | (80,035 | ) | (60,464 | ) | (76,981 | ) | (66,491 | ) | (84,038 | ) | 52,058 | (70,303 | ) | |||||||||||||||||||
|
Earning assets
- reported value
|
5,139,945 | 5,070,987 | 5,175,337 | 5,128,893 | 5,325,322 | 5,553,470 | 7,006,592 | 7,594,682 | 8,137,261 | 5,105,656 | 5,438,767 | ||||||||||||||||||||||||||
|
Other
assets
|
123,785 | 148,649 | 118,550 | 9,900 | (9,680 | ) | 22,148 | 33,714 | 53,420 | 66,200 | 136,148 | 6,146 | |||||||||||||||||||||||||
|
Total
assets
|
$ | 5,263,730 | $ | 5,219,636 | $ | 5,293,887 | $ | 5,138,793 | $ | 5,315,643 | $ | 5,575,619 | $ | 7,040,306 | $ | 7,648,102 | $ | 8,203,461 | $ | 5,241,805 | $ | 5,444,913 | |||||||||||||||
|
Short-term
debt
|
$ | 7,920 | $ | - | $ | - | $ | - | $ | - | $ | - | $ | 975 | $ | 7,825 | $ | 4,904 | $ | 3,982 | $ | - | |||||||||||||||
|
Old Sequoia
ABS issued
|
3,518,773 | 3,589,269 | 3,666,201 | 3,765,292 | 4,211,937 | 4,460,951 | 5,804,702 | 6,040,634 | 6,349,661 | 3,553,827 | 4,335,756 | ||||||||||||||||||||||||||
|
New Sequoia
ABS issued
|
144,201 | - | - | - | - | - | - | - | - | 72,499 | - | ||||||||||||||||||||||||||
|
Acacia ABS
issued
|
268,715 | 288,241 | 288,041 | 283,996 | 285,698 | 325,392 | 652,398 | 900,611 | 986,915 | 278,424 | 305,435 | ||||||||||||||||||||||||||
|
Other
liabilities
|
164,764 | 200,096 | 231,553 | 91,027 | 66,588 | 55,487 | 32,533 | (22,524 | ) | 72,870 | 182,332 | 61,068 | |||||||||||||||||||||||||
|
Long-term
debt
|
138,383 | 138,145 | 137,907 | 139,190 | 147,430 | 147,193 | 146,944 | 146,705 | 146,480 | 138,264 | 147,312 | ||||||||||||||||||||||||||
|
Total
liabilities
|
4,242,755 | 4,215,751 | 4,323,702 | 4,279,505 | 4,711,653 | 4,989,023 | 6,637,552 | 7,073,251 | 7,560,830 | 4,229,328 | 4,849,571 | ||||||||||||||||||||||||||
|
Noncontrolling
interest
|
15,763 | 18,535 | 24,322 | 26,061 | 28,330 | 29,735 | 31,251 | 41,096 | 40,229 | 17,141 | 29,029 | ||||||||||||||||||||||||||
|
Core equity
(1)
|
953,720 | 932,721 | 896,034 | 888,107 | 655,695 | 617,325 | 448,484 | 600,246 | 686,440 | 943,278 | 636,616 | ||||||||||||||||||||||||||
|
Accumulated
other comprehensive income (loss)
|
51,493 | 52,629 | 49,829 | (54,880 | ) | (80,035 | ) | (60,464 | ) | (76,981 | ) | (66,491 | ) | (84,038 | ) | 52,058 | (70,303 | ) | |||||||||||||||||||
|
Total
equity
|
1,005,212 | 985,350 | 945,863 | 833,227 | 575,661 | 556,861 | 371,503 | 533,755 | 602,402 | 995,336 | 566,313 | ||||||||||||||||||||||||||
|
Total
liabilities and equity
|
$ | 5,263,730 | $ | 5,219,636 | $ | 5,293,887 | $ | 5,138,793 | $ | 5,315,643 | $ | 5,575,619 | $ | 7,040,306 | $ | 7,648,102 | $ | 8,203,461 | $ | 5,241,805 | $ | 5,444,913 | |||||||||||||||
|
THE
REDWOOD REVIEW 2ND QUARTER 2010
|
Table 6:
Average Balance Sheet
|
57
|
|
|
||
|
|
Table 7:
Balances & Yields by Securities Portfolio at Redwood ($ in
thousands)
|
58
|
|
2010
|
2010
|
2009
|
2009
|
2009
|
2009
|
2008
|
2010
|
2010
|
2009
|
2009
|
2009
|
2009
|
2008
|
|||||||||||||||||||||||||||||||||||||||||||||
|
Q2
|
Q1
|
Q4
|
Q3
|
Q2
|
Q1
|
Q4
|
Q2
|
Q1
|
Q4
|
Q3
|
Q2
|
Q1
|
Q4
|
|||||||||||||||||||||||||||||||||||||||||||||
|
Residential Prime
Senior
|
Residential Non-Prime
Subordinate
|
|||||||||||||||||||||||||||||||||||||||||||||||||||||||||
|
Current
face
|
$ | 371,066 | $ | 450,647 | $ | 412,471 | $ | 431,289 | $ | 276,444 | $ | 160,009 | $ | 90,256 |
Current
face
|
$ | 44,659 | $ | 68,700 | $ | 86,802 | $ | 158,613 | $ | 230,404 | $ | 327,766 | $ | 452,327 | |||||||||||||||||||||||||||||
|
Unamortized
discount
|
(93,502 | ) | (113,757 | ) | (116,801 | ) | (124,295 | ) | (91,221 | ) | (64,884 | ) | (41,980 | ) |
Unamortized
discount
|
(19,586 | ) | (15,123 | ) | (14,863 | ) | (16,556 | ) | (18,846 | ) | (19,512 | ) | (29,092 | ) | |||||||||||||||||||||||||||||
|
Credit
reserve
|
(10,084 | ) | (14,637 | ) | (9,898 | ) | (11,069 | ) | (3,486 | ) | (621 | ) | - |
Credit
reserve
|
(15,775 | ) | (47,805 | ) | (70,806 | ) | (140,046 | ) | (208,839 | ) | (305,422 | ) | (419,194 | ) | ||||||||||||||||||||||||||||||
|
Unrealized gains
(losses)
|
42,222 | 49,887 | 43,436 | 40,734 | 1,729 | (6,738 | ) | 2,689 |
Unrealized gains
(losses)
|
732 | 772 | 162 | (806 | ) | 473 | 1,705 | 3,272 | |||||||||||||||||||||||||||||||||||||||||
|
Fair value
|
$ | 309,702 | $ | 372,140 | $ | 329,208 | $ | 336,659 | $ | 183,466 | $ | 87,766 | $ | 50,965 |
Fair value
|
$ | 10,030 | $ | 6,544 | $ | 1,295 | $ | 1,205 | $ | 3,192 | $ | 4,537 | $ | 7,313 | |||||||||||||||||||||||||||||
|
Average amortized
cost
|
$ | 278,472 | $ | 283,477 | $ | 280,101 | $ | 264,773 | $ | 164,386 | $ | 77,651 | $ | 37,746 |
Average amortized
cost
|
$ | 7,708 | $ | 4,253 | $ | 1,377 | $ | 2,218 | $ | 2,767 | $ | 3,450 | $ | 4,105 | |||||||||||||||||||||||||||||
|
Interest
income
|
$ | 7,868 | $ | 8,455 | $ | 8,610 | $ | 8,431 | $ | 5,475 | $ | 2,798 | $ | 992 |
Interest
income
|
$ | 613 | $ | 144 | $ | 359 | $ | 1,271 | $ | 2,086 | $ | 6,315 | $ | 5,283 | |||||||||||||||||||||||||||||
|
Annualized
yield
|
11.30 | % | 11.93 | % | 12.30 | % | 12.74 | % | 13.32 | % | 14.41 | % | 10.51 | % |
Annualized
yield
|
31.83 | % | 13.54 | % | 104.23 | % | 229.25 | % | 301.61 | % | 732.26 | % | 514.79 | % | |||||||||||||||||||||||||||||
|
Residential Non-Prime
Senior
|
Commercial
Subordinate
|
|||||||||||||||||||||||||||||||||||||||||||||||||||||||||
|
Current
face
|
$ | 401,049 | $ | 475,949 | $ | 430,698 | $ | 403,675 | $ | 396,135 | $ | 182,851 | $ | 108,871 |
Current
face
|
$ | 140,547 | $ | 152,408 | $ | 158,997 | $ | 486,245 | $ | 506,746 | $ | 512,117 | $ | 514,169 | |||||||||||||||||||||||||||||
|
Unamortized
discount
|
(94,316 | ) | (119,303 | ) | (134,649 | ) | (137,899 | ) | (141,761 | ) | (77,193 | ) | (50,687 | ) |
Unamortized (discount)
premium
|
(5,534 | ) | (5,660 | ) | (5,130 | ) | (1,624 | ) | (120 | ) | 13,798 | 35,069 | |||||||||||||||||||||||||||||||
|
Credit
reserve
|
(10,894 | ) | (13,830 | ) | (13,468 | ) | (10,098 | ) | (16,009 | ) | (4,159 | ) | (3,827 | ) |
Credit
reserve
|
(127,627 | ) | (139,320 | ) | (146,018 | ) | (471,957 | ) | (492,459 | ) | (497,784 | ) | (497,047 | ) | |||||||||||||||||||||||||||||
|
Unrealized gains
(losses)
|
24,559 | 24,556 | 32,371 | 23,322 | (7,410 | ) | (27,116 | ) | (11,537 | ) |
Unrealized gains
(losses)
|
224 | 1,448 | 1,351 | 4,169 | 1,502 | (5,216 | ) | (9,701 | ) | ||||||||||||||||||||||||||||||||||||||
|
Fair value
|
$ | 320,398 | $ | 367,372 | $ | 314,952 | $ | 279,000 | $ | 230,955 | $ | 74,383 | $ | 42,820 |
Fair value
|
$ | 7,610 | $ | 8,876 | $ | 9,200 | $ | 16,833 | $ | 15,669 | $ | 22,915 | $ | 42,490 | |||||||||||||||||||||||||||||
|
Average amortized
cost
|
$ | 302,461 | $ | 310,948 | $ | 263,022 | $ | 270,353 | $ | 168,383 | $ | 87,464 | $ | 63,050 |
Average amortized
cost
|
$ | 7,417 | $ | 7,670 | $ | 8,090 | $ | 13,504 | $ | 25,006 | $ | 46,382 | $ | 63,969 | |||||||||||||||||||||||||||||
|
Interest
income
|
$ | 11,426 | $ | 13,011 | $ | 8,489 | $ | 10,513 | $ | 6,737 | $ | 3,311 | $ | 1,590 |
Interest
income
|
$ | 696 | $ | 716 | $ | 1,233 | $ | 2,192 | $ | 1,599 | $ | 500 | $ | (1,000 | ) | ||||||||||||||||||||||||||||
|
Annualized
yield
|
15.11 | % | 16.74 | % | 12.91 | % | 15.55 | % | 16.00 | % | 15.14 | % | 10.09 | % |
Annualized
yield
|
37.55 | % | 37.36 | % | 60.97 | % | 64.93 | % | 25.58 | % | 4.31 | % | (6.25 | %) | |||||||||||||||||||||||||||||
|
Residential
Re-REMIC
|
CDO
Subordinate
|
|||||||||||||||||||||||||||||||||||||||||||||||||||||||||
|
Current
face
|
$ | 139,426 | $ | 146,964 | $ | 255,975 | $ | 318,703 | $ | 236,070 | $ | - | $ | - |
Current
face
|
$ | 35,422 | $ | 35,397 | $ | 35,371 | $ | 35,344 | $ | 35,311 | $ | 35,277 | $ | 38,405 | |||||||||||||||||||||||||||||
|
Unamortized
discount
|
(68,049 | ) | (68,806 | ) | (109,807 | ) | (144,351 | ) | (134,621 | ) | - | - |
Unamortized
discount
|
(20,613 | ) | (20,522 | ) | (20,521 | ) | (19,632 | ) | (19,460 | ) | (19,086 | ) | (18,319 | ) | |||||||||||||||||||||||||||||||
|
Credit
reserve
|
(37,962 | ) | (42,299 | ) | (81,726 | ) | (94,626 | ) | (45,874 | ) | - | - |
Credit
reserve
|
(13,678 | ) | (13,653 | ) | (13,628 | ) | (13,600 | ) | (13,568 | ) | (13,534 | ) | (16,476 | ) | |||||||||||||||||||||||||||||||
|
Unrealized gains
(losses)
|
35,655 | 31,054 | 41,509 | 13,781 | (434 | ) | - | - |
Unrealized
gains
|
- | - | 25 | 25 | 25 | - | - | ||||||||||||||||||||||||||||||||||||||||||
|
Fair value
|
$ | 69,070 | $ | 66,913 | $ | 105,951 | $ | 93,507 | $ | 55,141 | $ | - | $ | - |
Fair value
|
$ | 1,131 | $ | 1,222 | $ | 1,247 | $ | 2,137 | $ | 2,308 | $ | 2,657 | $ | 3,610 | |||||||||||||||||||||||||||||
|
Average amortized
cost
|
$ | 34,385 | $ | 45,852 | $ | 73,938 | $ | 69,980 | $ | 26,419 | $ | - | $ | - |
Average amortized
cost
|
$ | 1,207 | $ | 1,222 | $ | 1,962 | $ | 2,255 | $ | 2,595 | $ | 25 | $ | 3,931 | |||||||||||||||||||||||||||||
|
Interest
income
|
$ | 1,382 | $ | 1,925 | $ | 2,941 | $ | 3,110 | $ | 573 | $ | - | $ | - |
Interest
income
|
$ | 134 | $ | 54 | $ | 138 | $ | 73 | $ | 163 | $ | 10 | $ | 376 | |||||||||||||||||||||||||||||
|
Annualized
yield
|
16.08 | % | 16.79 | % | 15.91 | % | 17.77 | % | 8.67 | % | - | - |
Annualized
yield
|
44.38 | % | 17.59 | % | 28.24 | % | 12.97 | % | 25.09 | % | 153.66 | % | 38.21 | % | |||||||||||||||||||||||||||||||
|
Residential Prime
Subordinate
|
Note on annualized yields: Cash
flows from our investments can be very sporadic and, to
some
|
|||||||||||||||||||||||||||||||||||||||||||||||||||||||||
|
Current
face
|
$ | 298,707 | $ | 325,045 | $ | 348,678 | $ | 379,276 | $ | 412,052 | $ | 419,631 | $ | 448,943 |
extent, unexpected. The
amortized cost of some assets is close to zero and any interest income
results
|
|||||||||||||||||||||||||||||||||||||||||||
|
Unamortized
discount
|
(23,279 | ) | (23,783 | ) | (22,099 | ) | (22,979 | ) | (28,545 | ) | (87,421 | ) | (90,582 | ) |
in unusally high reported yields
that are not sustainable.
|
|||||||||||||||||||||||||||||||||||||||||||
|
Credit
reserve
|
(240,357 | ) | (261,854 | ) | (282,813 | ) | (306,728 | ) | (319,653 | ) | (291,592 | ) | (308,447 | ) | ||||||||||||||||||||||||||||||||||||||||||||
|
Unrealized
losses
|
(18,665 | ) | (22,812 | ) | (24,256 | ) | (27,643 | ) | (37,112 | ) | (11,606 | ) | (6,127 | ) | ||||||||||||||||||||||||||||||||||||||||||||
|
Fair value
|
$ | 16,406 | $ | 16,596 | $ | 19,510 | $ | 21,926 | $ | 26,742 | $ | 29,012 | $ | 43,787 | ||||||||||||||||||||||||||||||||||||||||||||
|
Average amortized
cost
|
$ | 38,079 | $ | 41,701 | $ | 47,083 | $ | 58,637 | $ | 43,020 | $ | 47,070 | $ | 88,943 | ||||||||||||||||||||||||||||||||||||||||||||
|
Interest
income
|
$ | 3,297 | $ | 2,944 | $ | 3,533 | $ | 4,299 | $ | 3,907 | $ | 8,220 | $ | 8,185 | ||||||||||||||||||||||||||||||||||||||||||||
|
Annualized
yield
|
34.63 | % | 28.24 | % | 30.02 | % | 29.33 | % | 36.32 | % | 69.85 | % | 36.81 | % | ||||||||||||||||||||||||||||||||||||||||||||
|
THE
REDWOOD REVIEW 2ND QUARTER 2010
|
Table
7: Balances & Yields by Securities
|
|
|
Portfolio at
Redwood
|
||
|
|
Table
8: Securities Portfolio Activity at Redwood ($ in
thousands)
|
|
|
2010
|
2010
|
2009
|
2009
|
2009
|
2009
|
2008
|
2010
|
2010
|
2009
|
2009
|
2009
|
2009
|
2008
|
|||||||||||||||||||||||||||||||||||||||||||||
|
Q2
|
Q1
|
Q4
|
Q3
|
Q2
|
Q1
|
Q4
|
Q2
|
Q1
|
Q4
|
Q3
|
Q2
|
Q1
|
Q4
|
|||||||||||||||||||||||||||||||||||||||||||||
|
Residential Prime
Senior
|
Residential Real Estate
Loans
|
|||||||||||||||||||||||||||||||||||||||||||||||||||||||||
|
Beginning fair
value
|
$ | 372,140 | $ | 329,208 | $ | 336,659 | $ | 183,466 | $ | 87,766 | $ | 50,965 | $ | 21,395 |
Beginning fair
value
|
$ | 2,227 | $ | 2,374 | $ | 2,299 | $ | 2,336 | $ | 2,577 | $ | 2,624 | $ | 3,150 | |||||||||||||||||||||||||||||
|
Acquisitions
|
1,055 | 56,010 | 27,607 | 134,738 | 120,982 | 49,107 | 35,866 |
Principal
payments
|
46 | (27 | ) | (30 | ) | (28 | ) | (185 | ) | (27 | ) | (40 | ) | |||||||||||||||||||||||||||||||||||||
|
Sales
|
(43,485 | ) | (8,780 | ) | (24,104 | ) | (5,091 | ) | (35,713 | ) | - | - |
Premium
amortization
|
- | - | - | - | - | - | - | ||||||||||||||||||||||||||||||||||||||
|
Effect of principal
payments
|
(13,065 | ) | (11,220 | ) | (13,632 | ) | (13,121 | ) | (6,499 | ) | (2,337 | ) | (347 | ) |
Transfers to
REO
|
(165 | ) | - | - | - | - | - | (14 | ) | ||||||||||||||||||||||||||||||||||
|
Change in fair value,
net
|
(6,943 | ) | 6,922 | 2,678 | 36,667 | 16,930 | (9,969 | ) | (5,949 | ) |
Changes in fair value,
net
|
296 | (120 | ) | 105 | (9 | ) | (56 | ) | (20 | ) | (472 | ) | |||||||||||||||||||||||||||||||||||
|
Ending fair
value
|
$ | 309,702 | $ | 372,140 | $ | 329,208 | $ | 336,659 | $ | 183,466 | $ | 87,766 | $ | 50,965 |
Ending fair
value
|
$ | 2,404 | $ | 2,227 | $ | 2,374 | $ | 2,299 | $ | 2,336 | $ | 2,577 | $ | 2,624 | |||||||||||||||||||||||||||||
|
Residential Non-Prime
Senior
|
Commercial
Subordinate
|
|||||||||||||||||||||||||||||||||||||||||||||||||||||||||
|
Beginning fair
value
|
$ | 367,372 | $ | 314,952 | $ | 279,000 | $ | 230,955 | $ | 74,383 | $ | 42,820 | $ | 48,246 |
Beginning fair
value
|
$ | 8,876 | $ | 9,200 | $ | 16,833 | $ | 15,669 | $ | 22,915 | $ | 42,490 | $ | 63,686 | |||||||||||||||||||||||||||||
|
Acquisitions
|
16,113 | 118,195 | 37,157 | 84,837 | 162,745 | 48,444 | 10,419 |
Acquisitions
|
- | - | - | - | - | - | - | |||||||||||||||||||||||||||||||||||||||||||
|
Sales
|
(54,285 | ) | (49,361 | ) | - | (56,299 | ) | (14,613 | ) | (373 | ) | (867 | ) |
Sales
|
- | - | (4,778 | ) | - | - | - | - | ||||||||||||||||||||||||||||||||||||
|
Effect of principal
payments
|
(12,582 | ) | (10,242 | ) | (10,214 | ) | (11,083 | ) | (5,128 | ) | (1,573 | ) | (549 | ) |
Effect of principal
payments
|
- | - | - | - | - | - | - | ||||||||||||||||||||||||||||||||||||
|
Change in fair value,
net
|
3,779 | (6,171 | ) | 9,009 | 30,590 | 13,568 | (14,935 | ) | (14,429 | ) |
Change in fair value,
net
|
(1,266 | ) | (324 | ) | (2,855 | ) | 1,164 | (7,246 | ) | (19,575 | ) | (21,196 | ) | ||||||||||||||||||||||||||||||||||
|
Ending fair
value
|
$ | 320,397 | $ | 367,372 | $ | 314,952 | $ | 279,000 | $ | 230,955 | $ | 74,383 | $ | 42,820 |
Ending fair
value
|
$ | 7,610 | $ | 8,876 | $ | 9,200 | $ | 16,833 | $ | 15,669 | $ | 22,915 | $ | 42,490 | |||||||||||||||||||||||||||||
|
Re-REMIC
|
Commercial Real Estate
Loans
|
|||||||||||||||||||||||||||||||||||||||||||||||||||||||||
|
Beginning fair
value
|
$ | 66,913 | $ | 105,951 | $ | 93,507 | $ | 55,141 | $ | - | $ | - | $ | - |
Beginning fair
value
|
$ | 244 | $ | 245 | $ | 246 | $ | 247 | $ | 248 | $ | 249 | $ | 250 | |||||||||||||||||||||||||||||
|
Acquisitions
|
- | - | 3,367 | 25,073 | 55,562 | - | - |
Principal
payments
|
(2 | ) | (2 | ) | (2 | ) | (2 | ) | (2 | ) | (2 | ) | (2 | ) | ||||||||||||||||||||||||||||||||||||
|
Sales
|
(1,960 | ) | (27,932 | ) | (17,368 | ) | - | - | - | - |
Discount
amortization
|
1 | 1 | 1 | 1 | 1 | 1 | 1 | ||||||||||||||||||||||||||||||||||||||||
|
Effect of principal
payments
|
- | - | - | - | - | - | - |
Credit
provision
|
- | - | - | - | - | - | - | |||||||||||||||||||||||||||||||||||||||||||
|
Change in fair value,
net
|
4,117 | (11,106 | ) | 26,445 | 13,293 | (421 | ) | - | - |
Changes in fair value,
net
|
- | - | - | - | - | - | - | |||||||||||||||||||||||||||||||||||||||||
|
Ending fair
value
|
$ | 69,070 | $ | 66,913 | $ | 105,951 | $ | 93,507 | $ | 55,141 | $ | - | $ | - |
Ending fair
value
|
$ | 243 | $ | 244 | $ | 245 | $ | 246 | $ | 247 | $ | 248 | $ | 249 | |||||||||||||||||||||||||||||
|
Residential Prime
Subordinate
|
CDO
Subordinate
|
|||||||||||||||||||||||||||||||||||||||||||||||||||||||||
|
Beginning fair
value
|
$ | 16,596 | $ | 19,510 | $ | 21,926 | $ | 26,742 | $ | 29,012 | $ | 43,787 | $ | 86,272 |
Beginning fair
value
|
$ | 1,222 | $ | 1,247 | $ | 2,137 | $ | 2,308 | $ | 2,657 | $ | 3,610 | $ | 4,065 | |||||||||||||||||||||||||||||
|
Acquisitions
|
2,223 | - | - | 1,390 | 1,829 | - | - |
Acquisitions
|
- | - | - | - | - | - | - | |||||||||||||||||||||||||||||||||||||||||||
|
Sales
|
- | - | - | (1,409 | ) | - | - | - |
Sales
|
- | - | - | - | - | - | - | ||||||||||||||||||||||||||||||||||||||||||
|
Effect of principal
payments
|
(474 | ) | (415 | ) | (526 | ) | (880 | ) | (1,050 | ) | (946 | ) | (1,311 | ) |
Effect of principal
payments
|
- | - | - | - | - | (37 | ) | (69 | ) | ||||||||||||||||||||||||||||||||||
|
Change in fair value,
net
|
(1,939 | ) | (2,499 | ) | (1,890 | ) | (3,917 | ) | (3,049 | ) | (13,829 | ) | (41,174 | ) |
Change in fair value,
net
|
(90 | ) | (25 | ) | (890 | ) | (171 | ) | (349 | ) | (916 | ) | (386 | ) | |||||||||||||||||||||||||||||
|
Ending fair
value
|
$ | 16,406 | $ | 16,596 | $ | 19,510 | $ | 21,926 | $ | 26,742 | $ | 29,012 | $ | 43,787 |
Ending fair
value
|
$ | 1,132 | $ | 1,222 | $ | 1,247 | $ | 2,137 | $ | 2,308 | $ | 2,657 | $ | 3,610 | |||||||||||||||||||||||||||||
|
Residential Non-Prime
Subordinate
|
||||||||||||||||||||||||||||||||||||||||||||||||||||||||||
|
Beginning fair
value
|
$ | 6,544 | $ | 1,295 | $ | 1,205 | $ | 3,192 | $ | 4,537 | $ | 7,313 | $ | 5,073 | ||||||||||||||||||||||||||||||||||||||||||||
|
Acquisitions
|
3,894 | 5,472 | - | - | - | - | 3,630 | |||||||||||||||||||||||||||||||||||||||||||||||||||
|
Sales
|
- | - | - | - | - | - | - | |||||||||||||||||||||||||||||||||||||||||||||||||||
|
Effect of principal
payments
|
(352 | ) | (111 | ) | (25 | ) | (38 | ) | (67 | ) | (98 | ) | (148 | ) | ||||||||||||||||||||||||||||||||||||||||||||
|
Change in fair value,
net
|
(56 | ) | (112 | ) | 115 | (1,949 | ) | (1,278 | ) | (2,678 | ) | (1,242 | ) | |||||||||||||||||||||||||||||||||||||||||||||
|
Ending fair
value
|
$ | 10,030 | $ | 6,544 | $ | 1,295 | $ | 1,205 | $ | 3,192 | $ | 4,537 | $ | 7,313 | ||||||||||||||||||||||||||||||||||||||||||||
|
THE
REDWOOD REVIEW 2ND QUARTER 2010
|
Table 8:
Securities Portfolio Activity at Redwood
|
59
|
|
|
||
|
|
Table
9A: Residential Prime Securities at Redwood and Underlying Loan
Characteristics
($
in thousands)
|
60
|
|
2010
|
2010
|
2009
|
2009
|
2009
|
2009
|
2008
|
2010
|
2010
|
2009
|
2009
|
2009
|
2009
|
2008
|
|||||||||||||||||||||||||||||||||||||||||||||
|
Q2
|
Q1
|
Q4
|
Q3
|
Q2
|
Q1
|
Q4
|
Q2
|
Q1
|
Q4
|
Q3
|
Q2
|
Q1
|
Q4
|
|||||||||||||||||||||||||||||||||||||||||||||
|
Residential Senior
Prime
|
||||||||||||||||||||||||||||||||||||||||||||||||||||||||||
|
Principal
value
|
$ | 371,066 | $ | 450,647 | $ | 412,471 | $ | 431,289 | $ | 276,444 | $ | 160,009 | $ | 90,256 |
Southern CA
|
25 | % | 25 | % | 25 | % | 27 | % | 24 | % | 24 | % | 24 | % | |||||||||||||||||||||||||||||
|
Unamortized
discount
|
(93,502 | ) | (113,757 | ) | (116,801 | ) | (124,295 | ) | (91,221 | ) | (64,884 | ) | (41,980 | ) |
Northern CA
|
22 | % | 22 | % | 22 | % | 20 | % | 23 | % | 23 | % | 22 | % | |||||||||||||||||||||||||||||
|
Credit
reserve
|
(10,084 | ) | (14,637 | ) | (9,898 | ) | (11,069 | ) | (3,486 | ) | (621 | ) | - |
New York
|
6 | % | 7 | % | 7 | % | 6 | % | 7 | % | 7 | % | 7 | % | ||||||||||||||||||||||||||||||
|
Unrealized gains
(losses)
|
42,222 | 49,887 | 43,436 | 40,734 | 1,729 | (6,738 | ) | 2,689 |
Florida
|
6 | % | 6 | % | 6 | % | 7 | % | 5 | % | 5 | % | 5 | % | |||||||||||||||||||||||||||||||||||
|
Fair value
|
$ | 309,702 | $ | 372,140 | $ | 329,208 | $ | 336,659 | $ | 183,466 | $ | 87,766 | $ | 50,965 |
Virginia
|
4 | % | 4 | % | 4 | % | 2 | % | 4 | % | 4 | % | 4 | % | |||||||||||||||||||||||||||||
|
Fair value / principal
value
|
83 | % | 83 | % | 80 | % | 78 | % | 66 | % | 55 | % | 56 | % |
New Jersey
|
3 | % | 3 | % | 3 | % | 3 | % | 3 | % | 3 | % | 3 | % | |||||||||||||||||||||||||||||
|
Illinois
|
3 | % | 3 | % | 3 | % | 2 | % | 3 | % | 3 | % | 3 | % | ||||||||||||||||||||||||||||||||||||||||||||
|
Security
Type
|
Georgia
|
2 | % | 2 | % | 2 | % | 2 | % | 2 | % | 2 | % | 2 | % | |||||||||||||||||||||||||||||||||||||||||||
|
ARM
|
$ | - | $ | - | $ | - | $ | - | $ | - | $ | - | $ | - |
Texas
|
2 | % | 2 | % | 2 | % | 3 | % | 2 | % | 2 | % | 3 | % | |||||||||||||||||||||||||||||
|
Hybrid
|
272,866 | 333,760 | 298,245 | 306,402 | 175,940 | 86,282 | 48,805 |
Arizona
|
2 | % | 2 | % | 2 | % | 2 | % | 2 | % | 2 | % | 2 | % | ||||||||||||||||||||||||||||||||||||
|
Fixed
|
36,836 | 38,380 | 30,963 | 30,257 | 7,526 | 1,484 | 2,160 |
Colorado
|
2 | % | 2 | % | 2 | % | 4 | % | 2 | % | 2 | % | 2 | % | ||||||||||||||||||||||||||||||||||||
|
Total fair
value
|
$ | 309,702 | $ | 372,140 | $ | 329,208 | $ | 336,659 | $ | 183,466 | $ | 87,766 | $ | 50,965 |
Other
states
|
23 | % | 22 | % | 22 | % | 22 | % | 23 | % | 23 | % | 23 | % | |||||||||||||||||||||||||||||
|
Residential Senior
Prime
|
Wtd Avg Original
LTV
|
68 | % | 68 | % | 68 | % | 68 | % | 68 | % | 68 | % | 68 | % | |||||||||||||||||||||||||||||||||||||||||||
|
Coupon
income
|
$ | 4,356 | $ | 4,870 | $ | 5,057 | $ | 4,743 | $ | 3,066 | $ | 1,733 | $ | 749 |
Original LTV: 0 -
50
|
13 | % | 13 | % | 13 | % | 13 | % | 13 | % | 13 | % | 13 | % | |||||||||||||||||||||||||||||
|
Discount
amortization
|
3,512 | 3,585 | 3,553 | 3,688 | 2,410 | 1,128 | 243 |
Original LTV: 50.01 -
60
|
12 | % | 11 | % | 11 | % | 12 | % | 12 | % | 12 | % | 12 | % | ||||||||||||||||||||||||||||||||||||
|
Total interest
income
|
$ | 7,868 | $ | 8,455 | $ | 8,610 | $ | 8,431 | $ | 5,476 | $ | 2,861 | $ | 992 |
Original LTV: 60.01 -
70
|
22 | % | 22 | % | 22 | % | 22 | % | 22 | % | 22 | % | 22 | % | |||||||||||||||||||||||||||||
|
Original LTV: 70.01 -
80
|
50 | % | 51 | % | 50 | % | 50 | % | 49 | % | 49 | % | 49 | % | ||||||||||||||||||||||||||||||||||||||||||||
|
Average amortized
cost
|
$ | 278,472 | $ | 283,477 | $ | 280,101 | $ | 264,773 | $ | 164,386 | $ | 77,651 | $ | 37,746 |
Original LTV: 80.01 -
90
|
2 | % | 2 | % | 2 | % | 2 | % | 2 | % | 2 | % | 3 | % | |||||||||||||||||||||||||||||
|
Original LTV: 90.01 -
100
|
1 | % | 1 | % | 1 | % | 1 | % | 1 | % | 1 | % | 1 | % | ||||||||||||||||||||||||||||||||||||||||||||
|
Coupon income
%
|
6.26 | % | 6.87 | % | 7.22 | % | 7.17 | % | 7.46 | % | 8.93 | % | 7.94 | % |
Unknown
|
0 | % | 0 | % | 1 | % | 0 | % | 1 | % | 1 | % | 0 | % | |||||||||||||||||||||||||||||
|
Discount amortization
%
|
5.04 | % | 5.06 | % | 5.07 | % | 5.57 | % | 5.86 | % | 5.81 | % | 2.58 | % | ||||||||||||||||||||||||||||||||||||||||||||
|
Annualized
yield
|
11.30 | % | 11.93 | % | 12.30 | % | 12.74 | % | 13.32 | % | 14.74 | % | 10.51 | % |
Wtd Avg
FICO
|
739 | 740 | 740 | 740 | 741 | 741 | 741 | ||||||||||||||||||||||||||||||||||||
|
FICO: <=
600
|
0 | % | 0 | % | 0 | % | 0 | % | 0 | % | 0 | % | 0 | % | ||||||||||||||||||||||||||||||||||||||||||||
|
Residential Subordinate
Prime
|
FICO: 601 -
620
|
0 | % | 0 | % | 0 | % | 0 | % | 0 | % | 0 | % | 0 | % | |||||||||||||||||||||||||||||||||||||||||||
|
Principal
value
|
$ | 298,707 | $ | 325,045 | $ | 348,678 | $ | 379,276 | $ | 412,052 | $ | 419,631 | $ | 448,943 |
FICO: 621 -
640
|
1 | % | 1 | % | 1 | % | 1 | % | 1 | % | 1 | % | 1 | % | |||||||||||||||||||||||||||||
|
Unamortized
discount
|
(23,279 | ) | (23,783 | ) | (22,099 | ) | (22,979 | ) | (28,545 | ) | (87,421 | ) | (90,582 | ) |
FICO: 641 -
660
|
2 | % | 2 | % | 2 | % | 2 | % | 2 | % | 2 | % | 2 | % | |||||||||||||||||||||||||||||
|
Credit
reserve
|
(240,357 | ) | (261,854 | ) | (282,813 | ) | (306,728 | ) | (319,653 | ) | (291,592 | ) | (308,447 | ) |
FICO: 661 -
680
|
5 | % | 5 | % | 5 | % | 5 | % | 5 | % | 5 | % | 5 | % | |||||||||||||||||||||||||||||
|
Unrealized
loss
|
(18,665 | ) | (22,812 | ) | (24,256 | ) | (27,643 | ) | (37,112 | ) | (11,606 | ) | (6,127 | ) |
FICO: 681 -
700
|
9 | % | 9 | % | 9 | % | 9 | % | 9 | % | 9 | % | 8 | % | |||||||||||||||||||||||||||||
|
Fair value
|
$ | 16,406 | $ | 16,596 | $ | 19,510 | $ | 21,926 | $ | 26,742 | $ | 29,012 | $ | 43,787 |
FICO: 701 -
720
|
14 | % | 14 | % | 14 | % | 14 | % | 13 | % | 13 | % | 13 | % | |||||||||||||||||||||||||||||
|
Fair value / principal
value
|
5 | % | 5 | % | 6 | % | 6 | % | 6 | % | 7 | % | 10 | % |
FICO: 721 -
740
|
15 | % | 14 | % | 14 | % | 14 | % | 14 | % | 14 | % | 14 | % | |||||||||||||||||||||||||||||
|
FICO: 741 -
760
|
16 | % | 16 | % | 16 | % | 16 | % | 16 | % | 16 | % | 16 | % | ||||||||||||||||||||||||||||||||||||||||||||
|
Security
Type
|
FICO: 761 -
780
|
19 | % | 19 | % | 19 | % | 19 | % | 19 | % | 19 | % | 19 | % | |||||||||||||||||||||||||||||||||||||||||||
|
ARM
|
$ | 3,262 | $ | 1,164 | $ | 1,202 | $ | 1,301 | $ | 1,413 | $ | 1,736 | $ | 2,580 |
FICO: 781 -
800
|
13 | % | 14 | % | 14 | % | 14 | % | 15 | % | 15 | % | 15 | % | |||||||||||||||||||||||||||||
|
Hybrid
|
8,884 | 10,334 | 13,028 | 14,780 | 18,544 | 20,325 | 32,482 |
FICO: >=
801
|
3 | % | 4 | % | 4 | % | 4 | % | 4 | % | 4 | % | 4 | % | ||||||||||||||||||||||||||||||||||||
|
Fixed
|
4,260 | 5,098 | 5,280 | 5,845 | 6,785 | 6,951 | 8,725 |
Unknown
|
3 | % | 2 | % | 2 | % | 2 | % | 2 | % | 2 | % | 3 | % | ||||||||||||||||||||||||||||||||||||
|
Total fair
value
|
$ | 16,406 | $ | 16,596 | $ | 19,510 | $ | 21,926 | $ | 26,742 | $ | 29,012 | $ | 43,787 | ||||||||||||||||||||||||||||||||||||||||||||
|
Conforming % (2)
|
58 | % | 57 | % | 58 | % | 59 | % | 59 | % | 60 | % | 61 | % | ||||||||||||||||||||||||||||||||||||||||||||
|
Residential Subordinate
Prime
|
> $1 MM
%
|
9 | % | 9 | % | 9 | % | 8 | % | 8 | % | 8 | % | 8 | % | |||||||||||||||||||||||||||||||||||||||||||
|
Coupon
income
|
$ | 3,201 | $ | 3,172 | $ | 3,972 | $ | 4,698 | $ | 5,155 | $ | 5,615 | $ | 6,219 | ||||||||||||||||||||||||||||||||||||||||||||
|
Discount (premium)
amortization
|
96 | (228 | ) | (439 | ) | (399 | ) | (1,248 | ) | 2,887 | 1,966 |
2nd Home %
|
7 | % | 7 | % | 7 | % | 7 | % | 7 | % | 7 | % | 6 | % | ||||||||||||||||||||||||||||||||
|
Total interest
income
|
$ | 3,297 | $ | 2,944 | $ | 3,533 | $ | 4,299 | $ | 3,907 | $ | 8,502 | $ | 8,185 |
Investment Home
%
|
2 | % | 2 | % | 2 | % | 2 | % | 2 | % | 1 | % | 1 | % | |||||||||||||||||||||||||||||
|
Average amortized
cost
|
$ | 38,079 | $ | 41,701 | $ | 47,083 | $ | 58,637 | $ | 43,020 | $ | 47,070 | $ | 88,943 | ||||||||||||||||||||||||||||||||||||||||||||
|
Purchase
|
43 | % | 45 | % | 44 | % | 44 | % | 44 | % | 44 | % | 44 | % | ||||||||||||||||||||||||||||||||||||||||||||
|
Coupon income
%
|
33.62 | % | 30.43 | % | 33.74 | % | 32.05 | % | 47.93 | % | 47.72 | % | 27.97 | % |
Cash Out
Refi
|
22 | % | 22 | % | 22 | % | 22 | % | 21 | % | 21 | % | 21 | % | |||||||||||||||||||||||||||||
|
Discount (premium) amortization
%
|
1.01 | % | (2.19 | %) | (3.73 | %) | (2.72 | %) | (11.61 | %) | 24.53 | % | 8.84 | % |
Rate-Term
Refi
|
34 | % | 33 | % | 33 | % | 33 | % | 34 | % | 34 | % | 35 | % | |||||||||||||||||||||||||||||
|
Annualized
yield
|
34.63 | % | 28.24 | % | 30.02 | % | 29.33 | % | 36.32 | % | 72.25 | % | 36.81 | % |
Construction
|
0 | % | 0 | % | 0 | % | 0 | % | 0 | % | 0 | % | 0 | % | |||||||||||||||||||||||||||||
|
Other
|
1 | % | 0 | % | 1 | % | 1 | % | 1 | % | 1 | % | 0 | % | ||||||||||||||||||||||||||||||||||||||||||||
|
Underlying Prime Loan
Characteristics (1)
|
||||||||||||||||||||||||||||||||||||||||||||||||||||||||||
|
Full Doc
|
55 | % | 55 | % | 55 | % | 55 | % | 56 | % | 55 | % | 55 | % | ||||||||||||||||||||||||||||||||||||||||||||
|
Number of
loans
|
140,951 | 156,375 | 168,449 | 184,849 | 201,789 | 216,362 | 237,131 |
No Doc
|
5 | % | 5 | % | 5 | % | 5 | % | 4 | % | 4 | % | 4 | % | ||||||||||||||||||||||||||||||||||||
|
Total loan
face
|
$ | 59,814,476 | $ | 71,413,439 | $ | 76,332,218 | $ | 84,519,707 | $ | 92,121,182 | $ | 98,573,943 | $ | 107,131,216 |
Other Doc (Lim, Red, Stated,
etc)
|
38 | % | 37 | % | 37 | % | 37 | % | 37 | % | 38 | % | 38 | % | |||||||||||||||||||||||||||||
|
Average loan
size
|
$ | 424 | $ | 457 | $ | 453 | $ | 457 | $ | 457 | $ | 456 | $ | 452 |
Unknown/Not
Categorized
|
2 | % | 3 | % | 3 | % | 3 | % | 3 | % | 3 | % | 3 | % | |||||||||||||||||||||||||||||
|
Year 2008
origination
|
0 | % | 0 | % | 1 | % | 0 | % | 0 | % | 0 | % | 0 | % |
2-4 Family
|
1 | % | 2 | % | 2 | % | 1 | % | 1 | % | 1 | % | 1 | % | |||||||||||||||||||||||||||||
|
Year 2007
origination
|
7 | % | 10 | % | 10 | % | 9 | % | 9 | % | 9 | % | 9 | % |
Condo
|
10 | % | 10 | % | 10 | % | 10 | % | 10 | % | 10 | % | 10 | % | |||||||||||||||||||||||||||||
|
Year 2006
origination
|
14 | % | 12 | % | 12 | % | 12 | % | 12 | % | 14 | % | 14 | % |
Single
Family
|
87 | % | 87 | % | 87 | % | 88 | % | 88 | % | 88 | % | 87 | % | |||||||||||||||||||||||||||||
|
Year 2005
origination
|
20 | % | 21 | % | 19 | % | 20 | % | 19 | % | 17 | % | 17 | % |
Other
|
1 | % | 1 | % | 1 | % | 1 | % | 1 | % | 1 | % | 2 | % | |||||||||||||||||||||||||||||
|
Year 2004 origination and
earlier
|
59 | % | 57 | % | 58 | % | 59 | % | 60 | % | 60 | % | 60 | % | ||||||||||||||||||||||||||||||||||||||||||||
|
THE
REDWOOD REVIEW 2ND QUARTER 2010
|
Table
9A: Residential Prime Securities at Redwood
|
|
|
and Underlying Loan
Characteristics
|
||
|
|
Table
9B: Residential Non-Prime Securities at Redwood and Underlying Loan
Characteristics
($
in thousands)
|
|
|
2010
|
2010
|
2009
|
2009
|
2009
|
2009
|
2008
|
2010
|
2010
|
2009
|
2009
|
2009
|
2009
|
2008
|
|||||||||||||||||||||||||||||||||||||||||||||
|
Q2
|
Q1
|
Q4
|
Q3
|
Q2
|
Q1
|
Q4
|
Q2
|
Q1
|
Q4
|
Q3
|
Q2
|
Q1
|
Q4 | |||||||||||||||||||||||||||||||||||||||||||||
|
Residential Senior
Non-Prime
|
||||||||||||||||||||||||||||||||||||||||||||||||||||||||||
|
Principal
value
|
$ | 401,049 | $ | 475,949 | $ | 430,698 | $ | 403,675 | $ | 396,135 | $ | 182,851 | $ | 108,871 |
Southern CA
|
22 | % | 23 | % | 25 | % | 26 | % | 25 | % | 27 | % | 30 | % | |||||||||||||||||||||||||||||
|
Unamortized
discount
|
(94,316 | ) | (119,303 | ) | (134,649 | ) | (137,899 | ) | (141,761 | ) | (77,193 | ) | (50,687 | ) |
Northern CA
|
14 | % | 17 | % | 18 | % | 16 | % | 18 | % | 19 | % | 22 | % | |||||||||||||||||||||||||||||
|
Credit
reserve
|
(10,894 | ) | (13,830 | ) | (13,468 | ) | (10,098 | ) | (16,009 | ) | (4,159 | ) | (3,827 | ) |
Florida
|
9 | % | 8 | % | 8 | % | 9 | % | 9 | % | 10 | % | 10 | % | |||||||||||||||||||||||||||||
|
Unrealized gains
(losses)
|
24,559 | 24,556 | 32,371 | 23,322 | (7,410 | ) | (27,116 | ) | (11,537 | ) |
New York
|
5 | % | 5 | % | 5 | % | 5 | % | 5 | % | 5 | % | 4 | % | |||||||||||||||||||||||||||||||||
|
Fair value
|
$ | 320,398 | $ | 367,372 | $ | 314,952 | $ | 279,000 | $ | 230,955 | $ | 74,383 | $ | 42,820 |
New Jersey
|
4 | % | 3 | % | 4 | % | 2 | % | 4 | % | 4 | % | 3 | % | |||||||||||||||||||||||||||||
|
Fair value / principal
value
|
80 | % | 77 | % | 73 | % | 69 | % | 58 | % | 41 | % | 39 | % |
Arizona
|
4 | % | 3 | % | 3 | % | 4 | % | 3 | % | 3 | % | 3 | % | |||||||||||||||||||||||||||||
|
Virginia
|
3 | % | 3 | % | 3 | % | 2 | % | 3 | % | 3 | % | 3 | % | ||||||||||||||||||||||||||||||||||||||||||||
|
Security
Type
|
Georgia
|
2 | % | 2 | % | 2 | % | 3 | % | 2 | % | 1 | % | 1 | % | |||||||||||||||||||||||||||||||||||||||||||
|
ARM
|
$ | 5,467 | $ | 5,806 | $ | 2,015 | $ | - | $ | - | $ | - | $ | - |
Texas
|
3 | % | 3 | % | 2 | % | 2 | % | 2 | % | 1 | % | 1 | % | |||||||||||||||||||||||||||||
|
Option ARM
|
12,408 | 28,891 | 26,004 | 25,747 | 18,586 | 17,796 | 23,820 |
Illinois
|
3 | % | 2 | % | 2 | % | 2 | % | 2 | % | 3 | % | 2 | % | ||||||||||||||||||||||||||||||||||||
|
Hybrid
|
118,199 | 122,084 | 160,494 | 154,998 | 158,886 | 50,616 | 13,519 |
Colorado
|
3 | % | 3 | % | 2 | % | 3 | % | 2 | % | 2 | % | 2 | % | ||||||||||||||||||||||||||||||||||||
|
Fixed
|
184,324 | 210,592 | 126,439 | 98,255 | 53,483 | 5,971 | 5,481 |
Other
states
|
30 | % | 28 | % | 26 | % | 26 | % | 25 | % | 22 | % | 19 | % | ||||||||||||||||||||||||||||||||||||
|
Total fair
value
|
$ | 320,398 | $ | 367,373 | $ | 314,952 | $ | 279,000 | $ | 230,955 | $ | 74,383 | $ | 42,820 | ||||||||||||||||||||||||||||||||||||||||||||
|
Wtd Avg Original
LTV
|
73 | % | 73 | % | 73 | % | 74 | % | 74 | % | 74 | % | 74 | % | ||||||||||||||||||||||||||||||||||||||||||||
|
Residential Senior
Non-Prime
|
Original LTV: 0 -
50
|
7 | % | 6 | % | 5 | % | 5 | % | 5 | % | 5 | % | 5 | % | |||||||||||||||||||||||||||||||||||||||||||
|
Coupon
income
|
$ | 5,016 | $ | 5,994 | $ | 4,000 | $ | 4,156 | $ | 2,871 | $ | 1,251 | $ | 879 |
Original LTV: 50.01 -
60
|
8 | % | 8 | % | 8 | % | 7 | % | 7 | % | 7 | % | 7 | % | |||||||||||||||||||||||||||||
|
Discount
amortization
|
6,410 | 7,017 | 4,489 | 6,357 | 3,865 | 2,194 | 711 |
Original LTV: 60.01 -
70
|
18 | % | 18 | % | 19 | % | 17 | % | 17 | % | 18 | % | 19 | % | ||||||||||||||||||||||||||||||||||||
|
Total interest
income
|
$ | 11,426 | $ | 13,011 | $ | 8,489 | $ | 10,513 | $ | 6,736 | $ | 3,445 | $ | 1,590 |
Original LTV: 70.01 -
80
|
58 | % | 58 | % | 59 | % | 59 | % | 59 | % | 60 | % | 59 | % | |||||||||||||||||||||||||||||
|
Original LTV: 80.01 -
90
|
6 | % | 7 | % | 6 | % | 8 | % | 8 | % | 7 | % | 7 | % | ||||||||||||||||||||||||||||||||||||||||||||
|
Average amortized
cost
|
$ | 302,461 | $ | 310,948 | $ | 263,022 | $ | 270,353 | $ | 168,383 | $ | 87,464 | $ | 63,050 |
Original LTV: 90.01 -
100
|
3 | % | 3 | % | 3 | % | 4 | % | 4 | % | 3 | % | 3 | % | |||||||||||||||||||||||||||||
|
Unknown
|
0 | % | 0 | % | 0 | % | 0 | % | 0 | % | 0 | % | 0 | % | ||||||||||||||||||||||||||||||||||||||||||||
|
Coupon income
%
|
6.63 | % | 7.71 | % | 6.08 | % | 6.15 | % | 6.82 | % | 5.72 | % | 5.58 | % | ||||||||||||||||||||||||||||||||||||||||||||
|
Discount amortization
%
|
8.48 | % | 9.03 | % | 6.83 | % | 9.41 | % | 9.18 | % | 10.03 | % | 4.51 | % |
Wtd Avg
FICO
|
711 | 712 | 712 | 707 | 705 | 705 | 706 | ||||||||||||||||||||||||||||||||||||
|
Annualized
yield
|
15.11 | % | 16.74 | % | 12.91 | % | 15.55 | % | 16.00 | % | 15.75 | % | 10.09 | % |
FICO: <=
600
|
2 | % | 2 | % | 1 | % | 2 | % | 2 | % | 2 | % | 3 | % | |||||||||||||||||||||||||||||
|
FICO: 601 -
620
|
2 | % | 2 | % | 2 | % | 2 | % | 3 | % | 3 | % | 3 | % | ||||||||||||||||||||||||||||||||||||||||||||
|
Residential Subordinate
Non-Prime
|
FICO: 621 -
640
|
5 | % | 4 | % | 4 | % | 5 | % | 5 | % | 5 | % | 5 | % | |||||||||||||||||||||||||||||||||||||||||||
|
Principal
value
|
$ | 44,659 | $ | 68,700 | $ | 86,802 | $ | 86,802 | $ | 230,404 | $ | 327,766 | $ | 452,327 |
FICO: 641 -
660
|
7 | % | 7 | % | 7 | % | 8 | % | 8 | % | 8 | % | 7 | % | |||||||||||||||||||||||||||||
|
Unamortized
discount
|
(19,586 | ) | (15,123 | ) | (14,863 | ) | (14,863 | ) | (18,846 | ) | (19,512 | ) | (29,092 | ) |
FICO: 661 -
680
|
12 | % | 11 | % | 12 | % | 13 | % | 12 | % | 12 | % | 12 | % | |||||||||||||||||||||||||||||
|
Credit
reserve
|
(15,775 | ) | (47,805 | ) | (70,806 | ) | (70,806 | ) | (208,839 | ) | (305,422 | ) | (419,194 | ) |
FICO: 681 -
700
|
14 | % | 14 | % | 15 | % | 15 | % | 16 | % | 16 | % | 16 | % | |||||||||||||||||||||||||||||
|
Unrealized
gain
|
732 | 772 | 162 | 162 | 473 | 1,705 | 3,272 |
FICO: 701 -
720
|
14 | % | 15 | % | 15 | % | 14 | % | 14 | % | 14 | % | 14 | % | ||||||||||||||||||||||||||||||||||||
|
Fair value
|
$ | 10,030 | $ | 6,544 | $ | 1,295 | $ | 1,295 | $ | 3,192 | $ | 4,537 | $ | 7,313 |
FICO: 721 -
740
|
12 | % | 13 | % | 13 | % | 12 | % | 12 | % | 12 | % | 13 | % | |||||||||||||||||||||||||||||
|
Fair value / principal
value
|
22 | % | 10 | % | 1 | % | 1 | % | 1 | % | 1 | % | 2 | % |
FICO: 741 -
760
|
11 | % | 12 | % | 11 | % | 11 | % | 11 | % | 11 | % | 11 | % | |||||||||||||||||||||||||||||
|
FICO: 761 -
780
|
10 | % | 10 | % | 10 | % | 9 | % | 9 | % | 9 | % | 9 | % | ||||||||||||||||||||||||||||||||||||||||||||
|
Security
Type
|
FICO: 781 -
800
|
7 | % | 7 | % | 7 | % | 6 | % | 5 | % | 5 | % | 5 | % | |||||||||||||||||||||||||||||||||||||||||||
|
Option ARM
|
$ | 623 | $ | 645 | $ | 1,061 | $ | 907 | $ | 2,639 | $ | 3,618 | $ | 5,082 |
FICO: >=
801
|
2 | % | 2 | % | 2 | % | 2 | % | 2 | % | 2 | % | 2 | % | |||||||||||||||||||||||||||||
|
Hybrid
|
4,773 | 505 | 234 | 293 | 400 | 571 | 1,307 |
Unknown
|
2 | % | 1 | % | 1 | % | 1 | % | 1 | % | 1 | % | 0 | % | ||||||||||||||||||||||||||||||||||||
|
Fixed
|
8,930 | 5,395 | - | 5 | 153 | 348 | 924 | |||||||||||||||||||||||||||||||||||||||||||||||||||
|
Total fair
value
|
$ | 14,326 | $ | 6,545 | $ | 1,295 | $ | 1,205 | $ | 3,192 | $ | 4,537 | $ | 7,313 |
Conforming % (2)
|
85 | % | 81 | % | 76 | % | 74 | % | 71 | % | 62 | % | 60 | % | |||||||||||||||||||||||||||||
|
> $1 MM
%
|
4 | % | 6 | % | 9 | % | 9 | % | 10 | % | 17 | % | 19 | % | ||||||||||||||||||||||||||||||||||||||||||||
|
Residential Subordinate
Non-Prime
|
||||||||||||||||||||||||||||||||||||||||||||||||||||||||||
|
Coupon
income
|
$ | 313 | $ | 169 | $ | 701 | $ | 1,128 | $ | 2,318 | $ | 5,779 | $ | 4,503 |
2nd Home %
|
4 | % | 5 | % | 5 | % | 5 | % | 5 | % | 7 | % | 7 | % | |||||||||||||||||||||||||||||
|
Discount (premium)
amortization
|
300 | (25 | ) | (342 | ) | 143 | (703 | ) | 553 | 780 |
Investment Home
%
|
13 | % | 11 | % | 9 | % | 8 | % | 8 | % | 7 | % | 7 | % | |||||||||||||||||||||||||||||||||
|
Total interest
income
|
$ | 613 | $ | 144 | $ | 359 | $ | 1,271 | $ | 1,615 | $ | 6,332 | $ | 5,283 | ||||||||||||||||||||||||||||||||||||||||||||
|
Average amortized
cost
|
$ | 7,708 | $ | 4,253 | $ | 1,377 | $ | 2,218 | $ | 2,767 | $ | 3,450 | $ | 4,105 |
Purchase
|
40 | % | 39 | % | 40 | % | 40 | % | 41 | % | 37 | % | 35 | % | |||||||||||||||||||||||||||||
|
Cash Out
Refi
|
41 | % | 42 | % | 42 | % | 42 | % | 42 | % | 44 | % | 46 | % | ||||||||||||||||||||||||||||||||||||||||||||
|
Coupon income
%
|
16.25 | % | 15.89 | % | 203.65 | % | 203.50 | % | 335.10 | % | 670.16 | % | 438.78 | % |
Rate-Term
Refi
|
18 | % | 18 | % | 17 | % | 17 | % | 16 | % | 19 | % | 19 | % | |||||||||||||||||||||||||||||
|
Discount (premium) amortization
%
|
15.58 | % | (2.35 | %) | (99.42 | %) | 25.74 | % | (101.60 | %) | 64.12 | % | 76.00 | % |
Construction
|
0 | % | 0 | % | 0 | % | 0 | % | 0 | % | 0 | % | 0 | % | |||||||||||||||||||||||||||||
|
Annualized
yield
|
31.83 | % | 13.54 | % | 104.23 | % | 229.25 | % | 233.50 | % | 734.28 | % | 514.79 | % |
Other
|
1 | % | 1 | % | 1 | % | 1 | % | 1 | % | 0 | % | 0 | % | |||||||||||||||||||||||||||||
|
Underlying Non-Prime Loan
Characteristics (1)
|
Full Doc
|
36 | % | 37 | % | 34 | % | 34 | % | 32 | % | 27 | % | 24 | % | |||||||||||||||||||||||||||||||||||||||||||
|
No Doc
|
3 | % | 3 | % | 2 | % | 2 | % | 2 | % | 6 | % | 4 | % | ||||||||||||||||||||||||||||||||||||||||||||
|
Number of
loans
|
72,621 | 79,448 | 73,102 | 73,970 | 71,041 | 64,541 | 88,331 |
Other Doc (Lim, Red, Stated,
etc)
|
59 | % | 59 | % | 62 | % | 62 | % | 64 | % | 66 | % | 71 | % | ||||||||||||||||||||||||||||||||||||
|
Total loan
face
|
$ | 16,931,963 | $ | 19,644,742 | $ | 20,445,051 | $ | 21,588,255 | $ | 22,498,418 | $ | 24,833,600 | $ | 36,262,301 |
Unknown/Not
Categorized
|
2 | % | 1 | % | 2 | % | 2 | % | 2 | % | 1 | % | 1 | % | |||||||||||||||||||||||||||||
|
Average loan
size
|
$ | 233 | $ | 247 | $ | 280 | $ | 292 | $ | 317 | $ | 385 | $ | 411 | ||||||||||||||||||||||||||||||||||||||||||||
|
2-4 Family
|
8 | % | 6 | % | 5 | % | 5 | % | 5 | % | 4 | % | 4 | % | ||||||||||||||||||||||||||||||||||||||||||||
|
Year 2008
origination
|
0 | % | 0 | % | 0 | % | 0 | % | 0 | % | 0 | % | 0 | % |
Condo
|
8 | % | 8 | % | 9 | % | 9 | % | 9 | % | 10 | % | 10 | % | |||||||||||||||||||||||||||||
|
Year 2007
origination
|
7 | % | 10 | % | 11 | % | 22 | % | 23 | % | 36 | % | 33 | % |
Single
Family
|
84 | % | 86 | % | 86 | % | 86 | % | 86 | % | 85 | % | 86 | % | |||||||||||||||||||||||||||||
|
Year 2006
origination
|
18 | % | 9 | % | 5 | % | 8 | % | 8 | % | 12 | % | 22 | % |
Other
|
0 | % | 0 | % | 0 | % | 0 | % | 0 | % | 1 | % | 0 | % | |||||||||||||||||||||||||||||
|
Year 2005
origination
|
45 | % | 50 | % | 47 | % | 36 | % | 34 | % | 27 | % | 28 | % | ||||||||||||||||||||||||||||||||||||||||||||
|
Year 2004 origination and
earlier
|
30 | % | 31 | % | 37 | % | 34 | % | 35 | % | 25 | % | 17 | % | ||||||||||||||||||||||||||||||||||||||||||||
|
THE
REDWOOD REVIEW 2ND QUARTER 2010
|
Table 9B:
Residential Non-Prime Securities at Redwood
|
61
|
|
and Underlying Loan
Characteristics
|
||
|
|
Table 10: Residential Real Estate
Loan Characteristics ($ in thousands)1
|
62
|
|
2010
|
2010
|
2009
|
2009
|
2009
|
2009
|
2008
|
2008
|
2008
|
||||||||||||||||||||||||||||
|
Q2
|
Q1
|
Q4
|
Q3
|
Q2
|
Q1
|
Q4
|
Q3
|
Q2
|
||||||||||||||||||||||||||||
|
Residential
loans
|
$ | 3,807,334 | $ | 3,661,063 | $ | 3,733,173 | $ | 3,827,086 | $ | 3,952,147 | $ | 4,523,877 | $ | 4,617,269 | $ | 6,070,083 | $ | 6,322,868 | ||||||||||||||||||
|
Number of
loans
|
12,725 | 12,721 | 12,930 | 13,232 | 13,648 | 14,880 | 15,203 | 18,037 | 18,706 | |||||||||||||||||||||||||||
|
Average loan
size
|
$ | 299 | $ | 288 | $ | 289 | $ | 289 | $ | 290 | $ | 304 | $ | 304 | $ | 337 | $ | 338 | ||||||||||||||||||
|
Adjustable
%
|
90 | % | 96 | % | 95 | % | 95 | % | 95 | % | 85 | % | 85 | % | 67 | % | 67 | % | ||||||||||||||||||
|
Hybrid %
|
10 | % | 4 | % | 5 | % | 5 | % | 5 | % | 15 | % | 15 | % | 33 | % | 33 | % | ||||||||||||||||||
|
Fixed %
|
0 | % | 0 | % | 0 | % | 0 | % | 0 | % | 0 | % | 0 | % | 0 | % | 0 | % | ||||||||||||||||||
|
Amortizing
%
|
4 | % | 3 | % | 3 | % | 3 | % | 3 | % | 4 | % | 4 | % | 5 | % | 5 | % | ||||||||||||||||||
|
Interest-only
%
|
96 | % | 97 | % | 97 | % | 97 | % | 97 | % | 96 | % | 96 | % | 95 | % | 95 | % | ||||||||||||||||||
|
Florida
|
13 | % | 14 | % | 14 | % | 14 | % | 14 | % | 13 | % | 13 | % | 13 | % | 13 | % | ||||||||||||||||||
|
Southern
California
|
11 | % | 11 | % | 11 | % | 11 | % | 11 | % | 12 | % | 12 | % | 15 | % | 15 | % | ||||||||||||||||||
|
Northern
California
|
9 | % | 8 | % | 8 | % | 8 | % | 8 | % | 9 | % | 9 | % | 11 | % | 11 | % | ||||||||||||||||||
|
New York
|
8 | % | 7 | % | 7 | % | 7 | % | 7 | % | 6 | % | 6 | % | 6 | % | 6 | % | ||||||||||||||||||
|
Georgia
|
5 | % | 5 | % | 5 | % | 5 | % | 5 | % | 5 | % | 5 | % | 4 | % | 4 | % | ||||||||||||||||||
|
New Jersey
|
4 | % | 5 | % | 5 | % | 4 | % | 4 | % | 4 | % | 4 | % | 4 | % | 4 | % | ||||||||||||||||||
|
Texas
|
5 | % | 5 | % | 5 | % | 5 | % | 5 | % | 5 | % | 5 | % | 4 | % | 4 | % | ||||||||||||||||||
|
Colorado
|
4 | % | 4 | % | 4 | % | 4 | % | 4 | % | 4 | % | 4 | % | 3 | % | 3 | % | ||||||||||||||||||
|
Virginia
|
3 | % | 3 | % | 3 | % | 3 | % | 3 | % | 3 | % | 3 | % | 3 | % | 3 | % | ||||||||||||||||||
|
Arizona
|
2 | % | 2 | % | 2 | % | 3 | % | 3 | % | 3 | % | 3 | % | 3 | % | 3 | % | ||||||||||||||||||
|
Illinois
|
3 | % | 2 | % | 2 | % | 2 | % | 2 | % | 3 | % | 3 | % | 3 | % | 3 | % | ||||||||||||||||||
|
Other
states
|
33 | % | 34 | % | 34 | % | 34 | % | 34 | % | 33 | % | 33 | % | 31 | % | 30 | % | ||||||||||||||||||
|
Year 2009
origination
|
6 | % | 0 | % | 0 | % | 0 | % | 0 | % | 0 | % | 0 | % | 0 | % | 0 | % | ||||||||||||||||||
|
Year 2008
origination
|
0 | % | 0 | % | 0 | % | 0 | % | 0 | % | 0 | % | 0 | % | 0 | % | 0 | % | ||||||||||||||||||
|
Year 2007
origination
|
2 | % | 2 | % | 2 | % | 2 | % | 2 | % | 2 | % | 2 | % | 13 | % | 13 | % | ||||||||||||||||||
|
Year 2006
origination
|
5 | % | 6 | % | 6 | % | 5 | % | 5 | % | 15 | % | 15 | % | 21 | % | 21 | % | ||||||||||||||||||
|
Year 2005
origination
|
4 | % | 4 | % | 4 | % | 4 | % | 4 | % | 4 | % | 4 | % | 5 | % | 5 | % | ||||||||||||||||||
|
Year 2004 origination or
earlier
|
83 | % | 88 | % | 88 | % | 89 | % | 89 | % | 79 | % | 79 | % | 61 | % | 61 | % | ||||||||||||||||||
|
Wtd Avg Original
LTV
|
66 | % | 67 | % | 67 | % | 67 | % | 67 | % | 68 | % | 68 | % | 69 | % | 69 | % | ||||||||||||||||||
|
Original LTV: 0 -
50
|
19 | % | 18 | % | 18 | % | 18 | % | 18 | % | 17 | % | 17 | % | 15 | % | 15 | % | ||||||||||||||||||
|
Original LTV: 50 -
60
|
12 | % | 11 | % | 11 | % | 11 | % | 11 | % | 11 | % | 11 | % | 11 | % | 11 | % | ||||||||||||||||||
|
Original LTV: 60 -
70
|
20 | % | 20 | % | 20 | % | 20 | % | 20 | % | 19 | % | 19 | % | 19 | % | 19 | % | ||||||||||||||||||
|
Original LTV: 70 -
80
|
42 | % | 43 | % | 43 | % | 43 | % | 43 | % | 46 | % | 46 | % | 49 | % | 49 | % | ||||||||||||||||||
|
Original LTV: 80 -
90
|
2 | % | 2 | % | 2 | % | 2 | % | 2 | % | 2 | % | 2 | % | 2 | % | 2 | % | ||||||||||||||||||
|
Original LTV: 90 -
100
|
5 | % | 6 | % | 6 | % | 6 | % | 6 | % | 5 | % | 5 | % | 4 | % | 4 | % | ||||||||||||||||||
|
Wtg Avg
FICO
|
733 | 730 | 730 | 730 | 731 | 731 | 732 | 732 | 732 | |||||||||||||||||||||||||||
|
FICO: <=
600
|
1 | % | 1 | % | 1 | % | 1 | % | 1 | % | 1 | % | 1 | % | 1 | % | 1 | % | ||||||||||||||||||
|
FICO: 601
-620
|
1 | % | 1 | % | 1 | % | 1 | % | 1 | % | 1 | % | 1 | % | 1 | % | 1 | % | ||||||||||||||||||
|
FICO: 621 -
640
|
2 | % | 2 | % | 2 | % | 2 | % | 2 | % | 2 | % | 2 | % | 1 | % | 1 | % | ||||||||||||||||||
|
FICO: 641
-660
|
4 | % | 4 | % | 4 | % | 4 | % | 4 | % | 4 | % | 4 | % | 3 | % | 3 | % | ||||||||||||||||||
|
FICO: 661 -
680
|
7 | % | 8 | % | 8 | % | 8 | % | 8 | % | 7 | % | 7 | % | 7 | % | 8 | % | ||||||||||||||||||
|
FICO: 681 -
700
|
11 | % | 12 | % | 12 | % | 12 | % | 12 | % | 12 | % | 12 | % | 12 | % | 12 | % | ||||||||||||||||||
|
FICO: 701 -
720
|
13 | % | 13 | % | 13 | % | 13 | % | 14 | % | 13 | % | 13 | % | 13 | % | 14 | % | ||||||||||||||||||
|
FICO: 721 -
740
|
13 | % | 13 | % | 13 | % | 13 | % | 13 | % | 13 | % | 13 | % | 13 | % | 14 | % | ||||||||||||||||||
|
FICO: 741 -
760
|
14 | % | 14 | % | 14 | % | 14 | % | 14 | % | 15 | % | 15 | % | 15 | % | 15 | % | ||||||||||||||||||
|
FICO: 761 -
780
|
17 | % | 16 | % | 16 | % | 16 | % | 16 | % | 17 | % | 17 | % | 17 | % | 17 | % | ||||||||||||||||||
|
FICO: 781 -
800
|
13 | % | 12 | % | 12 | % | 12 | % | 12 | % | 12 | % | 12 | % | 13 | % | 13 | % | ||||||||||||||||||
|
FICO: >=
801
|
4 | % | 4 | % | 4 | % | 4 | % | 3 | % | 3 | % | 3 | % | 4 | % | 4 | % | ||||||||||||||||||
|
Conforming % (2)
|
53 | % | 56 | % | 56 | % | 56 | % | 56 | % | 55 | % | 52 | % | 34 | % | 33 | % | ||||||||||||||||||
|
% balance in loans > $1mm per
loan
|
18 | % | 16 | % | 16 | % | 16 | % | 16 | % | 14 | % | 14 | % | 15 | % | 15 | % | ||||||||||||||||||
|
2nd home %
|
12 | % | 12 | % | 12 | % | 12 | % | 12 | % | 11 | % | 11 | % | 11 | % | 11 | % | ||||||||||||||||||
|
Investment home
%
|
4 | % | 4 | % | 4 | % | 4 | % | 4 | % | 3 | % | 3 | % | 3 | % | 3 | % | ||||||||||||||||||
|
Purchase
|
31 | % | 31 | % | 31 | % | 31 | % | 31 | % | 34 | % | 34 | % | 36 | % | 36 | % | ||||||||||||||||||
|
Cash out
refinance
|
34 | % | 36 | % | 36 | % | 36 | % | 35 | % | 34 | % | 34 | % | 32 | % | 32 | % | ||||||||||||||||||
|
Rate-term
refinance
|
34 | % | 31 | % | 31 | % | 31 | % | 32 | % | 31 | % | 31 | % | 30 | % | 30 | % | ||||||||||||||||||
|
Other
|
1 | % | 2 | % | 2 | % | 2 | % | 2 | % | 1 | % | 1 | % | 2 | % | 2 | % | ||||||||||||||||||
|
THE
REDWOOD REVIEW 2ND QUARTER 2010
|
Table
10: Residential Real Estate Loan Characteristics
|
|
|
|
||
|
SENIOR
OFFICERS:
|
DIRECTORS:
|
|
Martin
S. Hughes
|
George
E. Bull, III
|
|
President
and
|
Chairman of
the Board
|
|
Chief
Executive Officer
|
|
|
Richard
D. Baum
|
|
|
Brett
D. Nicholas
|
Former Chief
Deputy Insurance
|
|
Executive
Vice President,
|
Commissioner
for the State of California
|
|
Chief
Investment Officer,
|
|
|
and Chief
Operating Officer
|
Thomas C.
Brown
|
|
COO, McGuire
Real Estate and
|
|
|
Diane
L. Merdian
|
Principal
Shareholder, Urban Bay Properties, Inc.
|
|
Chief
Financial Officer
|
|
|
Mariann
Byerwalter
|
|
|
Harold
F. Zagunis
|
Chairman, JDN
Corporate Advisory LLC
|
|
Chief Risk
Officer
|
|
|
Douglas
B. Hansen
|
|
|
Private
Investor
|
|
|
Greg
H. Kubicek
|
|
|
President,
The Holt Group, Inc.
|
|
|
STOCK
LISTING:
|
|
|
The Company’s
common stock is traded
|
Jeffrey
T. Pero
|
|
on the New
York Stock Exchange under
|
Retired
Partner, Latham & Watkins LLP
|
|
the symbol
RWT
|
|
|
Georganne
C. Proctor
|
|
|
CORPORATE
HEADQUARTERS:
|
Executive
Vice President and Chief Integration Officer, TIAA-CREF
|
|
One Belvedere
Place, Suite 300
|
|
|
Mill Valley,
California 94941
|
Charles
J. Toeniskoetter
|
|
Telephone:
(415) 389-7373
|
Chairman,
Toeniskoetter & Breeding, Inc. Development
|
|
Chairman
& CEO, Toeniskoetter Construction, Inc.
|
|
|
NEW
YORK OFFICE:
|
|
|
245 Park
Avenue, 39th Floor
|
|
|
New York, New
York 10167
|
|
|
INVESTOR
RELATIONS:
|
|
|
Mike
McMahon
|
|
|
Managing
Director
|
|
|
Paula
Kwok
|
|
|
Assistant
Vice President
|
|
|
Investor
Relations Hotline: (866) 269-4976
|
TRANSFER
AGENT:
|
|
Email:
[email protected]
|
Computershare
|
|
2 North
LaSalle Street
|
|
|
GRAPHIC
DESIGN:
|
Chicago, IL
60602
|
|
Emily
Spoon
|
Telephone:
(888)
472-1955
|