
 |
 |
|
TABLE
OF CONTENTS
|
|
|
|
|
TABLE
OF CONTENTS
|
|
Introduction
|
4
|
|
Shareholder
Letter
|
5
|
|
Financial
Insights
|
11
|
|
u
Book Value
|
11
|
|
u
Balance Sheet
|
12
|
|
u
GAAP Income
|
17
|
|
u
Taxable Income and Dividends
|
22
|
|
u
Cash Flow
|
23
|
|
Residential
Mortgage Loan Business
|
24
|
|
Investments
in 2010 Sequoia
|
25
|
|
Residential
Real Estate Securities
|
26
|
|
Commercial
Real Estate
|
35
|
|
Legacy
Investments in Other Consolidated Entities
|
37
|
|
Appendix
|
|
|
Accounting
Discussion
|
40
|
|
Glossary
|
41
|
|
Financial
Tables
|
47
|
|
THE REDWOOD
REVIEW 3RD QUARTER 2010
|
1
|
|
|
|
CAUTIONARY
STATEMENT
|
|
2
|
THE REDWOOD
REVIEW 3RD QUARTER 2010
|
|
|
|
|
CAUTIONARY
STATEMENT
|
|
THE REDWOOD
REVIEW 3RD QUARTER 2010
|
3
|
|
|
|
INTRODUCTION
|
|
Selected
Financial Highlights
|
||||||
|
Quarter:Year
|
GAAP
Income (Loss) per Share
|
Taxable Income (Loss) per Share(1)
|
Annualized
Return on Equity
|
GAAP
Book Value per Share
|
Non-GAAP Economic Value per Share (2)
|
Dividends
per Share
|
|
Q308
|
($3.34)
|
$0.07
|
(83%)
|
$12.40
|
$13.18
|
$0.75
|
|
Q408
|
($3.46)
|
($0.39)
|
(124%)
|
$9.02
|
$11.10
|
$0.75
|
|
Q109
|
($0.65)
|
($0.22)
|
(25%)
|
$8.40
|
$10.01
|
$0.25
|
|
Q209
|
$0.10
|
($0.16)
|
5%
|
$10.35
|
$11.30
|
$0.25
|
|
Q309
|
$0.34
|
($0.30)
|
13%
|
$11.68
|
$12.28
|
$0.25
|
|
Q409
|
$0.51
|
($0.44)
|
17%
|
$12.50
|
$13.03
|
$0.25
|
|
Q110
|
$0.58
|
$0.01
|
19%
|
$12.84
|
$13.32
|
$0.25
|
|
Q210
|
$0.35
|
($0.03)
|
11%
|
$12.71
|
$13.37
|
$0.25
|
|
Q310
|
$0.25
|
($0.11)
|
8%
|
$13.02
|
$13.73
|
$0.25
|
|
4
|
THE REDWOOD
REVIEW 3RD QUARTER 2010
|
|
|
 |
|
SHAREHOLDER
LETTER
|
|
THE REDWOOD
REVIEW 3RD QUARTER 2010
|
5
|
|
|
|
SHAREHOLDER
LETTER
|
|
6
|
THE REDWOOD
REVIEW 3RD QUARTER 2010
|
|
|
|
|
SHAREHOLDER
LETTER
|
|
THE REDWOOD
REVIEW 3RD QUARTER 2010
|
7
|
|
|
|
SHAREHOLDER
LETTER
|
|
8
|
THE REDWOOD
REVIEW 3RD QUARTER 2010
|
|
|
|
|
SHAREHOLDER
LETTER
|
|
THE REDWOOD
REVIEW 3RD QUARTER 2010
|
9
|
|
|
|
SHAREHOLDER
LETTER
|
 |
 |
|
Martin S.
Hughes
|
Brett D.
Nicholas
|
|
President
and
|
Executive
Vice President,
|
|
Chief Executive
Officer
|
Chief
Investment Officer, and
|
|
|
Chief
Operating Officer
|
|
10
|
THE REDWOOD
REVIEW 3RD QUARTER 2010
|
|
|
 |
|
FINANCIAL
INSIGHTS
|
|
u
|
The following
table shows the components of our GAAP book value and management’s
estimate of non-GAAP economic value at September 30,
2010.
|
|
Components
of Book Value*
|
||||||||
|
September
30, 2010
|
||||||||
|
($
in millions, except per share data)
|
||||||||
|
Management's
|
||||||||
|
Estimate
of
|
||||||||
|
GAAP
|
Non-GAAP
|
|||||||
|
Book
Value
|
Adj.
|
Economic
Value
|
||||||
|
Cash and cash
equivalents
|
$
|
189
|
|
$
|
189
|
|||
|
Real estate
loans at Redwood
|
64
|
64
|
||||||
|
Real estate
securities at Redwood
|
||||||||
|
Residential
|
788
|
788
|
||||||
|
Commercial
|
8
|
8
|
||||||
|
CDO
|
1
|
1
|
||||||
|
Total real
estate securities at Redwood
|
$
|
797
|
$
|
797
|
||||
|
Investments
in the Fund
|
14
|
14
|
||||||
|
Investments
in Sequoia
|
97
|
(19)
|
78
|
|||||
|
Investments
in Acacia
|
4
|
(3)
|
1
|
|||||
|
Other
assets
|
59
|
59
|
||||||
|
Total
assets
|
$
|
1,224
|
$
|
1,202
|
||||
|
|
|
|||||||
|
Long-term
debt
|
(140)
|
77
|
(63)
|
|||||
|
|
||||||||
|
Other
liabilities
|
(68)
|
(68)
|
||||||
|
Stockholders'
equity
|
$
|
1,016
|
$
|
1,071
|
||||
|
Book
value per share
|
$
|
13.02
|
$
|
13.73
|
||||
|
u
|
During the
third quarter of 2010 our GAAP book value increased by $0.31 per share to
$13.02 per share. The increase resulted from $0.27 per share from earnings
before market valuation adjustments, $0.42 per share of positive market
valuation adjustments, plus $0.01 per share from equity issuance related
to dividend reinvestment, less $0.14 per share of unrealized loss on cash
flow hedges and $0.25 per share of dividends paid to
shareholders.
|
|
u
|
During the
third quarter our estimate of non-GAAP economic value increased by $0.36
per share to $13.73 per share. The net increase resulted from $0.69 per
share from net cash flows and net positive market valuation adjustments on
our securities and investments plus $0.01 per share from equity issuance
related to dividend reinvestment, less $0.01 per share from valuation
changes related to our long-term debt, $0.08 per share of cash operating
and interest expense, and $0.25 per share of dividends paid to
shareholders.
|
|
*
|
The components
of book value table presents our assets and liabilities as calculated and
reported under GAAP and as adjusted to reflect our estimate of economic
value, a non-GAAP metric. We show our investments in the Redwood
Opportunity Fund, L.P. (the Fund) and in Sequoia and Acacia securitization
entities in separate line items, similar to the equity method of
accounting, reflecting the reality that the underlying assets and
liabilities owned by these entities are legally not ours. We own only the
securities and interests that we have acquired from these entities. See
page 15 for an explanation of the adjustments set forth in this
table.
|
|
THE REDWOOD
REVIEW 3RD QUARTER 2010
|
11
|
|
|
|
FINANCIAL
INSIGHTS
|
|
u
|
The following
table shows the components of our balance sheet at September 30,
2010.
|
|
Consolidating
Balance Sheet
|
|||||||||||||||
|
September
30, 2010
|
|||||||||||||||
|
($
in millions)
|
|||||||||||||||
|
At
Redwood
|
2010
Sequoia
|
Other
Consolidated
Entities
|
Intercompany
|
Redwood
Consolidated
|
|||||||||||
|
Real estate
loans
|
$
|
64
|
$
|
193
|
$
|
3,495
|
$
|
-
|
$
|
3,752
|
|||||
|
Real estate
securities
|
797
|
-
|
311
|
-
|
1,108
|
||||||||||
|
Investments in 2010
Sequoia
|
26
|
-
|
-
|
(26)
|
-
|
||||||||||
|
Investment in Other Consolidated
Entities
|
89
|
-
|
-
|
(89)
|
-
|
||||||||||
|
Cash and cash
equivalents
|
189
|
-
|
-
|
-
|
189
|
||||||||||
|
Total earning
assets
|
1,165
|
193
|
3,806
|
(115)
|
5,049
|
||||||||||
|
|
|
||||||||||||||
|
Other
assets
|
59
|
2
|
52
|
-
|
113
|
||||||||||
|
|
|
|
|||||||||||||
|
Total
assets
|
$
|
1,224
|
$
|
195
|
$
|
3,858
|
$
|
(115)
|
$
|
5,162
|
|||||
|
Short-term
debt
|
$
|
-
|
$
|
-
|
$
|
-
|
$
|
-
|
$
|
-
|
|||||
|
Other
liabilities
|
68
|
1
|
|
94
|
-
|
|
163
|
||||||||
|
Asset-backed securities
issued
|
-
|
168
|
3,664
|
-
|
3,832
|
||||||||||
|
Long-term
debt
|
140
|
-
|
-
|
-
|
|
140
|
|||||||||
|
Total
liabilities
|
208
|
169
|
3,758
|
-
|
|
4,135
|
|||||||||
|
|
|
|
|
|
|||||||||||
|
Stockholders’
equity
|
1,016
|
26
|
89
|
(115)
|
|
1,016
|
|||||||||
|
Noncontrolling
interest
|
-
|
-
|
11
|
-
|
11
|
||||||||||
|
Total equity
|
1,016
|
26
|
100
|
(115)
|
1,027
|
||||||||||
|
|
|
||||||||||||||
|
Total liabilities and
stockholders’ equity
|
$
|
1,224
|
$
|
195
|
$
|
3,858
|
$
|
(115)
|
$
|
5,162
|
|||||
|
u
|
We present this table to
highlight the impact that consolidation has on our GAAP balance sheet. As
shown, Redwood’s $115 million GAAP investment in the consolidated entities
(including 2010 Sequoia) increased our consolidated assets by $4.0 billion
and liabilities by $3.9 billion.
|
|
u
|
We are
required under GAAP to consolidate all of the assets, liabilities, and
noncontrolling interests of the Fund (due to our significant general and
limited partnership interests in the Fund and ongoing asset management
responsibilities), and certain Sequoia and Acacia securitization entities
that are treated as secured borrowing transactions. However, the assets of
these entities are not available to Redwood. Similarly, the liabilities of
these entities are obligations payable only from the cash flow generated
by their assets and are not obligations of
Redwood.
|
|
u
|
The
consolidating balance sheet presents the 2010 Sequoia securitization
entity separately from all other consolidated entities to highlight our
renewed focus on growing our core business of creating credit investments.
As we complete additional securitizations, we expect new Sequoia
securitization entities to represent a larger portion of our consolidated
balance sheet.
|
|
12
|
THE REDWOOD
REVIEW 3RD QUARTER 2010
|
|
|
|
|
FINANCIAL
INSIGHTS
|
|
u
|
The following
table presents the fair value (which equals GAAP carrying value) of real
estate securities at Redwood at September 30, 2010. We segment our
securities portfolio by vintage (the year(s) the securities were issued),
priority of cash flow (senior, re-REMIC, and subordinate), and by quality
of underlying loans (prime and non-prime securities) for
residential.
|
|
Real
Estate Securities at Redwood
|
|||||||||||||||
|
September
30, 2010
|
|||||||||||||||
|
($
in millions)
|
|||||||||||||||
|
%
of Total
|
|||||||||||||||
|
<=2004
|
2005
|
2006-2008
|
Total
|
Securities
|
|||||||||||
|
Residential
|
|||||||||||||||
|
Seniors
|
|||||||||||||||
|
Prime
|
$
|
14
|
$
|
226
|
$
|
76
|
$
|
316
|
40%
|
||||||
|
Non-prime
|
|
117
|
228
|
|
9
|
|
354
|
44%
|
|||||||
|
Total
Seniors
|
$
|
131
|
$
|
454
|
$
|
85
|
$
|
670
|
84%
|
||||||
|
|
|
|
|||||||||||||
|
Re-REMIC
|
|
|
|
||||||||||||
|
Prime
|
$
|
5
|
$
|
11
|
$
|
59
|
$
|
75
|
9%
|
||||||
|
Total
Re-REMIC
|
$
|
5
|
$
|
11
|
$
|
59
|
$
|
75
|
9%
|
||||||
|
|
|
|
|||||||||||||
|
Subordinates
|
|
|
|
|
|||||||||||
|
Prime
|
$
|
26
|
$
|
5
|
$
|
2
|
$
|
33
|
4%
|
||||||
|
Non-prime
|
10
|
-
|
|
-
|
|
10
|
2%
|
||||||||
|
Total
Subordinates
|
$
|
36
|
$
|
5
|
$
|
2
|
$
|
43
|
6%
|
||||||
|
|
|
|
|
||||||||||||
|
Total
Residential
|
$
|
172
|
$
|
470
|
$
|
146
|
$
|
788
|
99%
|
||||||
|
|
|
|
|
||||||||||||
|
Commercial
Subordinates
|
$
|
7
|
$
|
1
|
$
|
-
|
$
|
8
|
1%
|
||||||
|
CDO
Subordinates
|
$
|
-
|
$
|
1
|
$
|
-
|
$
|
1
|
0%
|
||||||
|
|
|
|
|
||||||||||||
|
Total Real Estate
Securities
|
$
|
179
|
$
|
472
|
$
|
146
|
$
|
797
|
100%
|
||||||
|
THE REDWOOD
REVIEW 3RD QUARTER 2010
|
13
|
|
|
|
FINANCIAL
INSIGHTS
|
|
u
|
The table below details the
change in fair value of securities at Redwood during the third and second
quarters of 2010.
|
|
Real
Estate Securities at Redwood
|
||||||
|
($
in millions)
|
||||||
|
Three
Months Ended
|
||||||
| 9/30/10 | 6/30/10 | |||||
|
Beginning fair
value
|
$ |
734
|
$ |
840
|
||
|
Acquisitions
|
50
|
23
|
||||
|
Sales
|
-
|
(116)
|
||||
|
Effect
of principal payments
|
(21)
|
(27)
|
||||
|
Change
in fair value, net
|
34
|
14
|
||||
|
Ending
fair value
|
$ |
797
|
$ |
734
|
||
|
u
|
During the third quarter, the
market value of our real estate securities increased by $63 million as
acquisitions, and increases in fair value, exceeded the effect of
principal payments, as itemized in the table above.
|
|
u
|
Our acquisitions in the third
quarter included $10 million of prime senior securities, $33 million of
non-prime senior securities, and $7 million of prime subordinate
securities. Of the $50 million of securities acquired, $43 million were
from 2005 and earlier vintages.
|
|
u
|
During October, we acquired $16
million of securities. We did not sell securities in October.
|
|
14
|
THE REDWOOD
REVIEW 3RD QUARTER 2010
|
|
|
|
|
FINANCIAL
INSIGHTS
|
|
u
|
Our investments in the Fund,
Sequoia, and Acacia securitization entities, as reported for GAAP, totaled
$115 million, or 11% of our equity at September 30, 2010.
|
|
u
|
The GAAP
carrying value and the fair value of our investment in the Fund was $14
million. The Fund is primarily invested in non-prime residential
securities and is managed by a subsidiary of Redwood. Our investment
represents a 52% interest in the
Fund.
|
|
u
|
The GAAP
carrying value of our investments in Sequoia was $97 million and
management’s estimate of the non-GAAP economic value of those investments
was $78 million. We estimated the non-GAAP economic value for our
investments, consisting of $44 million of IOs and $34 million of senior
and subordinate securities, using the same valuation process that we
follow to fair value our other real estate securities. For GAAP, we
account for the assets and liabilities at historical cost and the net $97
million carrying value represents the difference between the carrying
costs of the assets ($3.7 billion at September 30, 2010) and liabilities
($3.6 billion at September 30, 2010) owned by the Sequoia
entities.
|
|
u
|
The GAAP carrying value of our
investments in Acacia entities was $4 million and management’s estimate of
the non-GAAP economic value of those investments was $1 million, which
primarily reflects
the present value of the management fees we expect to earn from these
entities. The equity interests and securities we own in the Acacia
entities have minimal value.
|
|
u
|
We had no short-term recourse
debt at September 30, 2010. We continue to fund our investments with
permanent capital (equity and long-term debt) that is not subject to
margin calls or financial covenants.
|
|
u
|
We expect to
utilize short-term debt to finance the acquisition of prime mortgage loans
prior to securitizing those loans through our Sequoia program. We are
currently using our excess cash to purchase mortgage loans. We plan to use
existing repurchase facilities collateralized by our residential senior
securities to facilitate the continued acquisition of loans prior to
securitization. In addition, we are in discussions with various
counterparties to re-establish warehouse facilities that will provide
additional resources to accumulate
loans.
|
|
u
|
At September
30, 2010, we had $140 million of long-term debt outstanding with a stated
interest rate of LIBOR plus 225 basis points due in 2037. Earlier in 2010,
through interest rate hedging arrangements, we effectively fixed the
interest rate on this long-term debt at 6.75% (excluding issuance costs).
We calculated the $63 million estimate of non-GAAP economic value of this
long-term debt based on its stated interest rate using the same valuation
process used to fair value our other financial assets and liabilities. As
a result of declining interest rates in the third quarter, the fair value
of the interest rate hedges related to this long-term debt declined by $11
million, and is reflected in shareholders’ equity on our balance
sheet.
|
|
THE REDWOOD
REVIEW 3RD QUARTER 2010
|
15
|
|
|
|
FINANCIAL
INSIGHTS
|
|
u
|
At September
30, 2010, our total capital amounted to $1.1 billion, including $1.0
billion in shareholders’ equity and $140 million of long-term debt. We use
our capital to invest in earning assets, meet lender capital requirements,
and to fund our operations and working capital
needs.
|
|
u
|
Our cash
balance was $189 million at September 30, 2010. During the third quarter
we used some of our excess cash to fund the acquisition of residential
loans we are accumulating to securitize, which was the main reason our
cash balance declined by roughly $100 million from the beginning of the
quarter.
|
|
u
|
We intend to
continue to use excess cash to fund the accumulation of loans prior to
securitization. In addition, we will look to our senior RMBS portfolio and
the residential loans themselves to provide a source of temporary
liquidity through borrowing facilities for this
purpose.
|
|
u
|
We manage our capital through our
risk-adjusted capital policy which has served us well over the past few
years of market turmoil. We have successfully managed through two
tumultuous periods (1998 and 2008) and we remain thoughtful about the
liquidity risk associated with short-term recourse debt.
|
|
u
|
Under our
risk-adjusted capital guidelines, we estimate that our investment capacity
is $222 million at September 30, 2010, down slightly from $240 million at
June 30, 2010.
|
|
u
|
Over the past
several years we generally allocated capital equal to 100% of the fair
value of all our investments through our risk-adjusted capital policy.
Now, with more stability in the funding markets and greater ability to
access financing through a variety of counterparties, we may consider
allocating less than 100% capital to some of the more liquid assets in our
portfolio.
|
|
u
|
We believe we
have sufficient access to cash to fund our acquisition of loans and have
sufficient capital to fund our investment growth opportunities for the
foreseeable future.
|
|
16
|
THE REDWOOD
REVIEW 3RD QUARTER 2010
|
|
|
|
|
FINANCIAL
INSIGHTS
|
|
u
|
The following
table provides a summary of our consolidated GAAP income for the third and
second quarters of 2010.
|
|
GAAP
Income
|
||||||
|
($
in millions, except per share data)
|
||||||
|
Three
Months Ended
|
||||||
|
9/30/10
|
6/30/10
|
|||||
|
Interest
income
|
$
|
59
|
$
|
56
|
||
|
Interest
expense
|
(24)
|
(21)
|
||||
|
Net interest
income
|
35
|
35
|
||||
|
Provision for loan
losses
|
(2)
|
(4)
|
||||
|
Market valuation adjustments,
net
|
(2)
|
(7)
|
||||
|
Net interest income after
provision and market valuation adjustments
|
31
|
24
|
||||
|
Operating
expenses
|
(12)
|
(11)
|
||||
|
Realized gains on sales and calls,
net
|
2
|
16
|
||||
|
Noncontrolling
interest
|
(1)
|
-
|
||||
|
Benefit from (provision for)
income taxes
|
-
|
-
|
||||
|
GAAP income
|
$
|
20
|
$
|
29
|
||
|
GAAP income per
share
|
$
|
0.25
|
$
|
0.35
|
||
|
u
|
Our consolidated GAAP income for
the third quarter of 2010 was $20 million, or $0.25 per share, as compared
to $29 million, or $0.35 per share, for the second quarter of 2010. The
decrease in income is the result of lower gains, partially offset by lower
negative market valuation adjustments. We had minimal gains from the
sale of les than $1 million of securities in the third quarter (but
did generate gains of $2 million from securities called from us), compared
to gains of $16 million on sales of $100 million in the second
quarter.
|
|
THE REDWOOD
REVIEW 3RD QUARTER 2010
|
17
|
|
|
|
FINANCIAL
INSIGHTS
|
|
u
|
The following
tables show the estimated effect that Redwood, our recent Sequoia
securitization, and our other consolidated entities had on GAAP income for
the third quarter of 2010 and the second quarter of 2010. These components
of our income statement are not separate business
segments.
|
|
Consolidating
Income Statement
|
|||||||||||||||
|
Three
Months Ended September 30, 2010
|
|||||||||||||||
|
($
in millions)
|
|||||||||||||||
|
At
Redwood
|
2010
Sequoia
|
Other
Consolidated
Entities
|
Intercompany
Adjustments
|
Redwood
Consolidated
|
|||||||||||
|
Interest
income
|
$
|
17
|
$
|
2
|
$
|
30
|
$
|
-
|
$
|
49
|
|||||
|
Net discount (premium)
amortization
|
10
|
-
|
-
|
-
|
10
|
||||||||||
|
Total interest
income
|
27
|
2
|
30
|
-
|
59
|
||||||||||
|
Interest
expense
|
(3)
|
(1)
|
(20)
|
-
|
(24)
|
||||||||||
|
Net interest
income
|
24
|
1
|
10
|
-
|
35
|
||||||||||
|
Provision for loan
losses
|
-
|
-
|
(2)
|
-
|
(2)
|
||||||||||
|
Market valuation adjustments,
net
|
-
|
-
|
(2)
|
-
|
(2)
|
||||||||||
|
Net interest income after
provision and market valuation adjustments
|
24
|
1
|
6
|
-
|
31
|
||||||||||
|
Operating
expenses
|
(12)
|
-
|
-
|
-
|
(12)
|
||||||||||
|
Realized gains on sales and calls,
net
|
2
|
-
|
-
|
-
|
2
|
||||||||||
|
Income from 2010
Sequoia
|
1
|
-
|
-
|
(1)
|
-
|
||||||||||
|
Income from Other Consolidated
Entities
|
5
|
-
|
-
|
(5)
|
-
|
||||||||||
|
Noncontrolling
interest
|
-
|
-
|
(1)
|
-
|
(1)
|
||||||||||
|
Provision for income
taxes
|
-
|
-
|
-
|
-
|
-
|
||||||||||
|
Net income
|
$
|
20
|
$
|
1
|
$
|
5
|
$
|
(6)
|
$
|
20
|
|||||
|
Consolidating
Income Statement
|
|||||||||||||||
|
Three
Months Ended June 30, 2010
|
|||||||||||||||
|
($
in millions)
|
|||||||||||||||
|
At
Redwood
|
2010
Sequoia
|
Other
Consolidated
Entities
|
Intercompany
Adjustments
|
Redwood
Consolidated
|
|||||||||||
|
Interest
income
|
$
|
16
|
$
|
1
|
$
|
30
|
$
|
-
|
$
|
47
|
|||||
|
Net discount (premium)
amortization
|
10
|
-
|
(1)
|
-
|
9
|
||||||||||
|
Total interest
income
|
26
|
1
|
29
|
-
|
56
|
||||||||||
|
Interest
expense
|
(2)
|
(1)
|
(18)
|
-
|
(21)
|
||||||||||
|
Net interest
income
|
24
|
-
|
11
|
-
|
35
|
||||||||||
|
Provision for loan
losses
|
-
|
-
|
(4)
|
-
|
(4)
|
||||||||||
|
Market valuation adjustments,
net
|
(4)
|
-
|
(3)
|
-
|
(7)
|
||||||||||
|
Net interest income after
provision and market valuation adjustments
|
20
|
-
|
4
|
-
|
24
|
||||||||||
|
Operating
expenses
|
(11)
|
-
|
-
|
-
|
(11)
|
||||||||||
|
Realized gains on sales and calls,
net
|
16
|
-
|
-
|
-
|
16
|
||||||||||
|
Income from 2010
Sequoia
|
-
|
-
|
-
|
-
|
-
|
||||||||||
|
Income from Other Consolidated
Entities
|
4
|
-
|
-
|
(4)
|
-
|
||||||||||
|
Noncontrolling
interest
|
-
|
-
|
-
|
-
|
-
|
||||||||||
|
Provision for income
taxes
|
-
|
-
|
-
|
-
|
-
|
||||||||||
|
Net income
|
$
|
29
|
$
|
-
|
$
|
4
|
$
|
(4)
|
$
|
29
|
|||||
|
18
|
THE REDWOOD
REVIEW 3RD QUARTER 2010
|
|
|
|
|
FINANCIAL
INSIGHTS
|
|
u
|
Net interest income after market
value adjustments at Redwood increased to $24 million in the third quarter
from $20 million in the second quarter as net interest income was flat and
negative MVA decreased by $4 million.
|
|
u
|
In the near
term, we continue to expect interest income to be driven by our
residential securities, which accounted for the majority of total interest
income generated at Redwood during the third quarter. While interest
income on these securities increased $1 million to $23 million during the
third quarter, the effective yield decreased by 1% as our average
amortized cost basis increased as a result of acquisitions during the
quarter.
|
|
u
|
Senior residential securities
account for the majority of total interest income from residential
securities and we expect yields on existing securities to remain
relatively stable over time. Primary factors that cause volatility in
income recognition include changes in prepayment rates, credit
losses, and interest rates.
|
|
u
|
Interest
expense was $3 million in the third quarter of 2010, a $1 million increase
from the prior quarter. This increase was primarily attributable to
interest rate agreements used to fix the interest expense of our long-term
floating rate debt. As of the end of the third quarter, the interest
expense of our long-term debt is fully fixed through interest rate swaps
and we anticipate our periodic expense yield to remain
stable.
|
|
u
|
The following
table presents the components of Redwood’s market valuation
adjustments.
|
|
Market
Valuation Adjustments at Redwood
|
||||||
|
($
in millions)
|
||||||
|
Three
Months Ended
|
||||||
|
9/30/10
|
6/30/10
|
|||||
|
Trading
securities
|
$
|
5
|
$
|
2
|
||
|
Impairment on AFS
securities
|
(2)
|
(4)
|
||||
|
Derivatives
|
(3)
|
(2)
|
||||
|
Total Market Valuation
Adjustments
|
$
|
-
|
$
|
(4)
|
||
|
u
|
Net negative
market valuation adjustments were minimal in the third quarter, a $4
million improvement from the prior quarter. This improvement was primarily
a result of increased valuations on certain residential securities that we
mark-to-market each quarter through the income statement, as well as a
decrease in impairments on available-for-sale securities of $2 million
from the prior quarter. Offsetting these improvements was a $1 million
increase in negative market valuation adjustments related to derivative
financial instruments. We continue to increase our use of derivatives to
manage certain risks associated with our accumulation of residential loans
as part of our residential loan
business.
|
|
THE REDWOOD
REVIEW 3RD QUARTER 2010
|
19
|
|
|
|
FINANCIAL
INSIGHTS
|
|
u
|
During the
third quarter of 2010 there were no sales of securities and $2 million of
gains on called securities. When a security we own is called we receive a
cash payment equal to the outstanding principal and, to the extent this is
above our carrying value, a gain is realized. Sales of securities
generated gains of $16 million (and generated total proceeds of $116
million) for the second quarter of
2010.
|
|
u
|
The following table presents the
components of Redwood’s operating expenses.
|
|
Operating
Expenses at Redwood
|
||||||
|
($
in millions)
|
||||||
|
Three
Months Ended
|
||||||
|
9/30/10
|
6/30/10
|
|||||
|
Fixed compensation
expense
|
$
|
3
|
$
|
4
|
||
|
Variable compensation
expense
|
2
|
1
|
||||
|
Equity compensation
expense
|
2
|
2
|
||||
|
Total compensation
expense
|
$
|
7
|
$
|
7
|
||
|
Systems
|
2
|
2
|
||||
|
Office
costs
|
2
|
2
|
||||
|
Accounting and
legal
|
1
|
-
|
||||
|
Total non-compensation
expense
|
$
|
5
|
$
|
4
|
||
|
Total Operating
Expense
|
$
|
12
|
$
|
11
|
||
|
u
|
Operating expenses at Redwood
were $12 million during the third quarter, up $1 million from the second
quarter, and remained in line with our expectations.
|
|
u
|
We recognized
net income of $5 million in the third quarter from our investments in the
Fund, Sequoia, and Acacia securitization entities, an increase of $1
million from the second quarter. This increase was due to a lower
provision for loan losses and lower negative market valuation
adjustments.
|
|
u
|
Net interest income declined from
the second quarter by $1 million to $10 million.
|
|
u
|
The provision
for loan losses for Sequoia entities totaled $2 million in the third
quarter, a decrease of $2 million from the second quarter of 2010.
Excluding the Sequoia 2010 securitization (which has no delinquencies)
serious delinquencies (90+ days past due) declined to 3.75% in the third
quarter from 4.04% at the end of the second quarter as more loans were
liquidated than transitioned to serious delinquency status. The allowance
for loan losses as a percent of serious delinquencies increased to 45% at
the end of the third quarter, from 42% at the end of the second quarter.
There are currently four Sequoia entities for which we have expensed
aggregate loan loss provisions of $2 million in excess of our reported
investment for GAAP purposes. At this time we do not expect to
deconsolidate any Sequoia entities in
2010.
|
|
u
|
Market valuation adjustments were
negative $2 million in the third quarter, an improvement $1 million from
the second quarter. This improvement was primarily a result of lower
other-than-temporary impairments at the Fund.
|
|
20
|
THE REDWOOD
REVIEW 3RD QUARTER 2010
|
|
|
|
|
FINANCIAL
INSIGHTS
|
|
u
|
Redwood’s
estimated taxable loss for the third quarter of 2010 was $9 million, or
$0.11 per share, as compared to estimated taxable loss of $3 million, or
$0.03 per share, for the second quarter of 2010. (Reconciliations of GAAP
and tax income are shown in Table 2 in the Financial Tables in this
Review.)
|
|
u
|
Credit losses continue to be the
significant driver of our taxable results and account for the majority of
the difference between GAAP and taxable income. In the third and second
quarters, credit losses as calculated for tax purposes totaled $31 million
and $24 million, respectively. Under GAAP, these credit losses were
charged against our previously established credit reserves.
|
|
u
|
We continue
to expect to realize a taxable loss for the full year in 2010. However,
the timing of credit losses on securities we own has a large impact on our
quarterly taxable income. We anticipate an additional $201 million of
losses on securities in future periods for tax purposes; for GAAP
purposes, as noted above, we have already established credit reserves for
these anticipated losses.
|
|
u
|
We currently
expect a REIT taxable loss in 2010, and thus anticipate that this year’s
dividend distributions will be characterized as return of capital.
However, if fourth quarter credit losses are sufficiently delayed, then a
portion of this year’s dividend distributions could be characterized as
ordinary income. Through the third quarter of 2010, estimated REIT taxable
income was $4 million.
|
|
u
|
On September
9, 2010, our board of directors declared a regular dividend of $0.25 per
share for the third quarter, which was paid on October 21, 2010 to
shareholders of record on September 30, 2010. This is consistent with the
board of directors’ announcement in November 2009 that it intended to
declare and pay quarterly regular dividends at this rate throughout
2010.
|
|
THE REDWOOD
REVIEW 3RD QUARTER 2010
|
21
|
|
|
|
FINANCIAL
INSIGHTS
|
|
u
|
In the third quarter, our cash
flow remained in line with our expectations. We ended the third quarter
with $189 million of cash, down from $288 million at the end of the prior
quarter, reflecting the acquisition of securities and loans.
|
|
u
|
We believe
our current GAAP income statements are reflective of our current
underlying business trends, especially given the nature of the assets we
currently hold. We also consider cash flow one of a number of important
operating metrics; however, we realize that quarterly cash flow measures
have limitations. In particular, we
note:
|
|
•
|
When
securities are purchased at large discounts from face value it is
difficult to determine what portion of the cash received is a return “of”
principal and what portion is a return “on” principal. It is only at the
end of an asset’s life that we can accurately determine what portion of
the cumulative cash received (whether principal or interest) was income
and what was a return of
capital.
|
|
•
|
Certain investments may generate
cash flow in a quarter that is not necessarily reflective of the long-term
economic yield we will earn on the investments. For example, we acquired
certain re-REMIC support securities at prices that we believe will produce
attractive yields. Due to their terms, however, these securities are
locked out of receiving any principal payments for years. Because of the
deferred receipt of principal payments, formulating any conclusions on the
value or performance of these securities by looking solely at the early
quarterly cash flow may not be indicative of economic returns.
|
|
•
|
Cash flow
from securities and investments can be volatile from quarter to quarter
depending on the level of invested capital, the timing of credit losses,
acquisitions, sales, and changes in prepayments and interest
rates.
|
|
•
|
We may use excess cash to acquire
assets and not borrow against our securities and loans even when financing
is available. As a result, our cash balances will likely not reflect the
amount of cash we could have available through borrowing to invest in new
opportunities.
|
|
22
|
THE REDWOOD
REVIEW 3RD QUARTER 2010
|
|
|
|
|
FINANCIAL
INSIGHTS
|
|
u
|
The sources
and uses of cash in the table below are derived from our GAAP Consolidated
Statement of Cash Flow for the third and second quarters of 2010 by
aggregating and netting all items in a manner consistent with the way
management analyzes them. This table excludes the gross cash flow
generated by our Sequoia and Acacia securitization entities and the Fund
(cash flow that is not available to Redwood), but does include the cash
flow distributed to Redwood as a result of our investments in these
entities. The beginning and ending cash balances presented in the table
below are GAAP amounts.
|
|
Redwood
|
||||||
|
Sources
and Uses of Cash
|
||||||
|
($
in millions)
|
||||||
|
Three
Months Ended
|
||||||
|
9/30/10
|
6/30/10
|
|||||
|
Beginning cash
balance
|
$
|
288
|
$
|
242
|
||
|
Sources of
cash
|
||||||
|
Securities at Redwood - principal
and interest
|
||||||
|
Residential
senior
|
36
|
42
|
||||
|
Residential
Re-REMIC
|
2
|
2
|
||||
|
Residential
subordinate
|
9
|
8
|
||||
|
Commercial and
CDO
|
2
|
1
|
||||
|
Securities at Redwood -
sales
|
-
|
116
|
||||
|
Investments in Consolidated
Entities
|
11
|
8
|
||||
|
Total sources of
cash
|
60
|
177
|
||||
|
|
|
|||||
|
Uses of
cash
|
||||||
|
Acquisitions of
loans
|
(62)
|
-
|
||||
|
Acquisitions of
securities
|
(48)
|
(55)
|
||||
|
Investment in 2010
Sequoia
|
-
|
(28)
|
||||
|
Cash operating
expenses
|
(9)
|
(10)
|
||||
|
Interest expense on long-term
debt
|
(2)
|
(1)
|
||||
|
Derivative margin
posted
|
(17)
|
(20)
|
||||
|
Dividends
|
(20)
|
(20)
|
||||
|
Changes in working
capital
|
(1)
|
3
|
||||
|
Total uses of
cash
|
(159)
|
(131)
|
||||
|
Net (uses) sources of
cash
|
$
|
(99)
|
$
|
46
|
||
|
Ending cash
balance
|
$
|
189
|
$
|
288
|
||
|
(1)Total
acquisitions in the third quarter of 2010 were $50 million, $3 million
which are not reflected in this table because they did not settle until
early October. Also, $1 million of acquisitions made in the second quarter
that did not settle until early July are reflected in this
table.
|
||||||
|
u
|
As shown in
the table above, total sources of cash were $60 million for the third
quarter of 2010, compared to $177 million in the second quarter, due
primarily to a substantial reduction in sales of securities. There were no
sales of securities in the third quarter, compared to $116 million in
second quarter.
|
|
u
|
Cash flow
excluding proceeds from sales totaled $60 million in the third quarter,
compared to $61 million in the prior quarter, and continued to exceed the
sum of cash operating expenses, interest, and
dividends.
|
|
THE REDWOOD
REVIEW 3RD QUARTER 2010
|
23
|
 |
|
|
RESIDENTIAL
MORTGAGE LOAN BUSINESS
|
|
u
|
At September
30, 2010, the pipeline of residential mortgage loans we plan to purchase
through our conduit totaled $219 million, up from $154 million at June 30,
2010. At September 30, 2010, loans purchased and held on our balance sheet
for future securitization totaled $62 million. At October 31, 2010, the
pipeline totaled $138 million and loans purchased and held on our balance
sheet for future securitization totaled $160
million.
|
|
u
|
We are encouraged by our progress
and contemplate executing another Sequoia securitization once we acquire
approximately $300 million of loans, which is now targeted for the first
quarter of 2011, assuming favorable market and regulatory
conditions.
|
|
u
|
Over time, our goal is to
establish our conduit as the leading source of liquidity for the prime
jumbo mortgage market, where originators are able to obtain timely
purchase commitment decisions and price protection.
|
|
u
|
The size of the jumbo market is
potentially vast — suggesting an opportunity that well exceeds our
current capital
available to invest. For example, if annual residential mortgage
originations return to $1.3 trillion (one-third of the peak level in
2003) and jumbo loans account for 20%, jumbo loan originations would
amount to $260 billion. If 30% of these loans were securitized and Redwood
were to credit enhance 10%, or $7.8 billion, our annual investment would
be approximately $270 million, assuming we retained only the subordinate
securities (at market prices) equal to 5% of the
securitizations.
|
|
u
|
The temporary
GSE conforming loan limit for high cost areas of $729,750, which was
established during the financial crisis, was recently extended until
September 20, 2011, as a result of policymaker concerns about the capacity
of the private market to fund non-government backed mortgage loans.
Without the extension, the maximum conforming loan limit would have
declined to $625,500 in January. Inside Mortgage Finance estimates the
extension will facilitate the funding of between $25 billion to $30
billion of loans by the GSEs.
|
|
u
|
Although
policymakers remain unconvinced about the private sector’s capacity or
willingness to fund non-government backed mortgage loans, we believe that
the private sector is, in fact, willing to provide this funding and we
estimate that, at September 30, 2010, Redwood alone had the immediate
capacity to provide through securitization first-loss credit support for
approximately $6 billion of securitized prime residential mortgage loans
assuming retention of the subordinated securities equal to 5% of the
securitizations. Furthermore, it is Redwood’s intention to provide credit
support for even more loans over time, and we believe we could access
additional capital that would be needed to do
so.
|
|
24
|
THE REDWOOD
REVIEW 3RD QUARTER 2010
|
|
|
 |
|
INVESTMENTIN 2010
SEQUOIA
|
|
u
|
In the third
quarter, the first full quarter of reporting for the 2010 Sequoia
securitization transaction we sponsored in April 2010, we reported GAAP
income of $1 million from interest on our investments, and our investments
in this securitization entity generated cash of $2
million.
|
|
u
|
At September 30, 2010, our
investment in our 2010 Sequoia securitization totaled $26 million. Our
investment consists of senior and subordinate securities and
IOs.
|
|
u
|
There were no
delinquencies in the loans underlying our 2010 Sequoia securitization at
September 30, 2010.
|
|
u
|
Prepayments
on this pool of loans have been high (nearly 40% CPR from inception
through September 30, 2010) due to both a decline in mortgage rates and
the borrowers’ ability to refinance — a reflection of the creditworthiness
of many of these borrowers and their equity in the underlying
properties.
|
|
u
|
For GAAP purposes, we account for
this Sequoia securitization as a financing and the assets and liabilities
are carried on our balance sheet at their amortized cost. As a result, our
$26 million investment in 2010 Sequoia does not appear on our GAAP
consolidated balance sheet as an investment; rather, it is reflected as
the difference, at September 30, 2010, between the $195 million of
consolidated assets of 2010 Sequoia and the $169 million of consolidated
ABS issued to third parties.
|
|
THE REDWOOD
REVIEW 3RD QUARTER 2010
|
25
|
 |
|
| RESIDENTIAL REAL ESTATE SECURITIES |
|
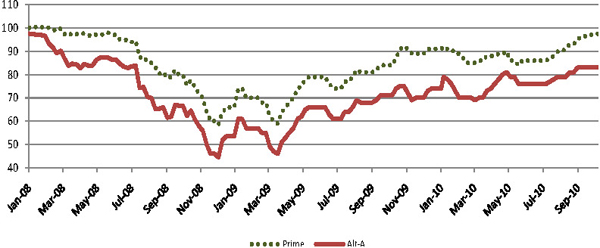
u
|
Prices for non-agency RMBS
continued to move higher during the third quarter as buyers out numbered
sellers. Across all fixed income sectors, asset managers of every type
(banks, insurance companies, hedge funds, money managers) continue to be
challenged to find places to deploy cash. Prices ended the quarter up
several points, particularly for longer duration fixed-rate assets, which
benefitted from the rally in the Treasury market.
|
|
Senior RMBS
Prices
|
 |
|
Source: JP
Morgan
|
|
u
|
As discussed
earlier in our shareholder letter, the uncertainty surrounding foreclosure
timelines has not impacted prices of non-agency RMBS, but we are
monitoring developments surrounding the foreclosure controversy
closely.
|
|
26
|
THE REDWOOD
REVIEW 3RD QUARTER 2010
|
|
|
|
|
RESIDENTIAL REAL ESTATE
SECURITIES
|
|
u
|
House sales
activity slowed considerably in the third quarter — the National
Association of Realtors (NAR) reported that the pace of existing home
sales was down 20% since the homebuyer tax credit expired in May. It
appears that the tax credit pulled forward a significant amount of housing
demand into the first half of the year, at the expense of the second half.
However, sales have increased in August and September since the initial
drop in July, suggesting that this may have been a one-time event and not
the beginning of a new downward
trend.
|
|
u
|
House
inventories have stabilized after rising almost 18% in the first half of
the year. NAR reported existing home inventories of 4 million units in
September, only 4% higher than June 2010. Many analysts have focused on
the 20% jump in “months supply” (inventory divided by monthly sales) over
this period, but that was almost entirely a consequence of reduced sales
after the tax credit expired, not increased inventories. Nevertheless,
oversupply remains a primary obstacle to a housing market
recovery.
|
|
u
|
On average,
we expect an additional 5-8% decline in the value of currently securitized
non-agency collateral over the next 6 -12 months, with significant
geographic variation. We also expect a prolonged trough at that level
before home prices return to an upwards
trajectory.
|
|
u
|
Delinquency
trends are generally stable to improving slightly, but are at elevated
levels. According to LoanPerformance, serious (60+ day) delinquencies rose
by 0.4% quarter over quarter to 10.4% for prime loans and fell 0.61%
quarter over quarter to 32.6% for Alt-A loans. We caution that some of the
improvement is related to loan modifications. The delinquencies on loans
underlying Redwood’s portfolio are modestly lower than the industry as a
whole.
|
|
u
|
Early-stage roll rates (from
loans always current to 30 days delinquent) continue to improve for both
prime and Alt-A collateral. Only 0.6% of previously ‘always current’ prime
loans missed their first payment in September, down from 0.9% in January,
while the same metric for Alt-A loans fell to 1.4% from 2.1% over the same
period. Over time, a drop in this roll rate will cause overall
delinquencies to fall, but for now the slowdown in new delinquencies is
being balanced out by an extension in liquidation timelines.
|
|
u
|
Prepayments
remain elevated for borrowers with equity in their homes and good credit,
and very low for all others. Prime borrowers with loan-to-value (LTV)
ratios below 100% prepaid at 22% CPR in September (up from 16% in June),
while Alt-A borrowers with equity in their homes only prepaid at 9% CPR
(up from 7%). This suggests that tight underwriting continues to be an
impediment to refinancing activity. Borrowers without equity prepaid very
slowly regardless of credit quality, with prime and Alt-A loans with LTV
ratios above 100% ratios prepaying at only 6% and 2% CPR,
respectively.
|
|
THE REDWOOD
REVIEW 3RD QUARTER 2010
|
27
|
|
|
| RESIDENTIAL REAL ESTATE SECURITIES |
|
u
|
Interest
income generated by residential AFS securities we own was $24 million in
the third quarter of 2010, an annualized yield of 13.3% on the amortized
cost of these securities.
|
|
u
|
At September 30, 2010, the fair
value of residential securities we own totaled $788 million, consisting of
$316 million in prime senior securities, $354 million in non-prime senior
securities, $75 million in re-REMIC securities, and $43 million in
subordinate securities. Each of these categories is further discussed
below.
|
|
u
|
The securities we held at
September 30, 2010, consisted of fixed-rate assets (39%), adjustable-rate
assets that reset within the next year (42%), hybrid assets that reset
between 12 and 36 months from now (5%), and hybrid assets that reset more
than 36 months from now (14%).
|
|
28
|
THE REDWOOD
REVIEW 3RD QUARTER 2010
|
|
|
|
|
RESIDENTIAL REAL ESTATE
SECURITIES
|
|
u
|
The following table presents
information on residential prime senior securities at Redwood at
September 30, 2010.
For GAAP, we account for all of these securities as
available-for-sale.
|
|
Credit
Support Analysis - Prime Senior Securities at
Redwood
|
|||||||||||||||
|
By
Vintage
|
|||||||||||||||
|
September
30, 2010
|
|||||||||||||||
|
<=2004
|
2005
|
2006
|
2007
|
Total
|
|||||||||||
|
Current
face
|
$
|
16
|
$
|
265
|
$
|
13
|
$
|
75
|
$
|
369
|
|||||
|
Net unamortized
discount
|
(3)
|
(66)
|
(4)
|
(16)
|
(89)
|
||||||||||
|
Credit
reserve
|
-
|
(9)
|
-
|
(4)
|
(13)
|
||||||||||
|
Unrealized gains
|
1
|
37
|
1
|
11
|
50
|
||||||||||
|
Fair value of prime senior
securities
|
$
|
14
|
$
|
227
|
$
|
10
|
$
|
66
|
$
|
317
|
|||||
|
Overall credit
support to prime senior securities (1)
|
11.84%
|
7.29%
|
5.23%
|
9.38%
|
8.11%
|
||||||||||
|
Serious
delinquencies as a % of collateral balance (1)
|
9.99%
|
6.80%
|
9.53%
|
7.45%
|
7.38%
|
||||||||||
|
u
|
The overall credit support data
presented in the table above represents the level of support for prime
securities owned by Redwood weighted by the securitization, or underlying
collateral, balance rather than the book value or market value of the
securities. We present a similar table for our non-prime securities on
page 31.
|
|
u
|
At September 30, 2010, the
average overall level of credit support was 8.11%. For an individual
security with this
level of credit support, this would mean that losses experienced on the
collateral would have to exceed 8.11% before the security would suffer
losses. Comparing the level of credit support available to seriously
delinquent loans provides one measure of the level of credit sensitivity
that exists within our senior securities portfolio. For example, assuming
an individual bond has the average characteristics of the portfolio, 8.11%
of credit support and serious delinquencies of 7.38%, all of the seriously
delinquent loans could be liquidated with a 50% severity, generating
losses of 3.69%. The security would then have 4.42% credit support
remaining to absorb future losses, before the senior securities would
start to absorb losses.
|
|
THE REDWOOD
REVIEW 3RD QUARTER 2010
|
29
|
|
|
| RESIDENTIAL REAL ESTATE SECURITIES |
|
u
|
We would emphasize that no
individual security has the average characteristics of the portfolio.
Individual securities may have more or less credit support than the
average, or more or less seriously delinquent loans than the average. As
such, certain securities have a more positive credit enhancement to
serious delinquency ratio while others have a less positive or negative
ratio. As a result, it is possible for some securities to incur losses
without aggregate losses exceeding the overall credit support. For
example, in the first quarter of 2010, we incurred credit losses of $2
million for GAAP purposes on senior securities, even though aggregate
losses did not exceed our overall credit support. (There were no credit
losses on our prime senior securities in either the third or second
quarters of 2010.)
|
|
u
|
Securities
are acquired assuming a range of outcomes based on modeling of expected
performance at the individual loan level for both delinquent and current
loans. Over time, the performance of these securities may require a change
in the amount of credit reserves we
designate.
|
|
u
|
The fair
market value of our prime senior securities was equal to 86% of the face
value of the portfolio, while our amortized cost was equal to 72% of the
face value at September 30, 2010. These securities generated $19 million
of cash from principal and interest in the third quarter compared to $20
million in the second quarter, excluding proceeds from sales. The
annualized yield in the third quarter for our prime senior securities was
11.3%
|
|
30
|
THE REDWOOD
REVIEW 3RD QUARTER 2010
|
|
|
|
|
RESIDENTIAL REAL ESTATE
SECURITIES
|
|
u
|
The following
table presents information on residential non-prime senior securities at
Redwood at September 30, 2010. We account for the large majority of these
securities as available-for-sale and others as trading
securities.
|
|
Credit
Support Analysis - Non-Prime Senior Securities at
Redwood
|
||||||||||||
|
By
Vintage
|
||||||||||||
|
September
30, 2010
|
||||||||||||
|
($
in millions)
|
||||||||||||
|
<=2004
|
2005
|
2006
|
Total
|
|||||||||
|
Current
face
|
$
|
139
|
$
|
281
|
$
|
11
|
$
|
431
|
||||
|
Net
unamortized discount
|
(36)
|
(73)
|
(3)
|
(112)
|
||||||||
|
Credit
reserve
|
(1)
|
(13)
|
(1)
|
(15)
|
||||||||
|
Unrealized
gains
|
14
|
13
|
1
|
28
|
||||||||
|
Fair value of
non-prime senior securities - AFS
|
$
|
116
|
$
|
208
|
$
|
8
|
$
|
332
|
||||
|
Overall
credit support to non-prime senior securities (1)
|
18.16%
|
12.28%
|
22.90%
|
15.04%
|
||||||||
|
Serious
delinquencies as a % of collateral balance (1)
|
15.75%
|
14.69%
|
14.82%
|
15.18%
|
||||||||
|
Fair value of
non-prime senior securities - trading
|
$
|
1
|
$
|
20
|
$
|
-
|
$
|
21
|
||||
|
Fair value of
non-prime senior securities
|
$
|
117
|
$
|
228
|
$
|
8
|
$
|
353
|
||||
| (1) Overall credit support and serious delinquency rates are weighted by securitization balances. Credit support and delinquencies may vary significantly by securitization. Serious delinquencies include loans over 90-days past due, in foreclosure, and REO. | ||||||||||||
|
u
|
Serious
delinquencies in our non-prime senior portfolio are significantly higher
than in our prime senior portfolio. However, the levels of credit and
structural support are also significantly higher and, as a result, our
non-prime senior portfolio is better able to withstand the higher levels
of credit losses we expect to incur on these pools. In the third quarter,
our senior non-prime securities incurred credit losses of $1 million,
compared to $3 million in the second quarter. Please refer to the first
two bullets under the table on page 29 and the first bullet on the top of
page 30 for further discussion on the characteristics and limitations of
the table on page 29, which discussion is also applicable to the table
above.
|
|
THE REDWOOD
REVIEW 3RD QUARTER 2010
|
31
|
|
|
| RESIDENTIAL REAL ESTATE SECURITIES |
|
u
|
The fair
market value of our non-prime senior securities AFS was equal to 77% of
the face value of the portfolio while our amortized cost was equal to 71%
of the face value at September 30, 2010. (We also own non-prime senior
securities that are accounted for as trading securities, which are carried
at their fair market value of $21 million and which do not have GAAP
credit reserves or purchase
discounts.)
|
|
u
|
The non-prime AFS senior
securities portfolio generated $15 million of cash from principal and
interest in the third quarter. The annualized yield in the third quarter
for our non-prime AFS senior securities was 11.5%. The non-prime trading
senior securities portfolio generated $2 million of cash from principal
and interest in the third quarter. The annualized yield in the third
quarter for our non-prime trading senior securities was 47.1%.
|
|
32
|
THE REDWOOD
REVIEW 3RD QUARTER 2010
|
|
|
|
|
RESIDENTIAL REAL ESTATE
SECURITIES
|
|
u
|
The following
table presents information on residential non-senior securities at Redwood
at September 30, 2010. We account for all of these securities as
available-for-sale.
|
|
Residential
Non-Senior Securities at Redwood
|
|||||||||
|
September
30, 2010
|
|||||||||
|
($
in millions)
|
|||||||||
| Subordinate |
Re-REMIC
|
Total
|
|||||||
|
Current
face
|
$
|
318
|
$
|
139
|
$
|
457
|
|||
|
Credit
reserve
|
(229)
|
(41)
|
(270)
|
||||||
|
Net unamortized
discount
|
(43)
|
(65)
|
(108)
|
||||||
|
Amortized
cost
|
46
|
33
|
79
|
||||||
|
Unrealized
gains
|
7
|
42
|
49
|
||||||
|
Unrealized
losses
|
(10)
|
-
|
(10)
|
||||||
|
Fair value of non-senior
securities
|
$
|
43
|
$
|
75
|
$
|
118
|
|||
|
u
|
Credit losses
totaled $28 million in our residential subordinate portfolio in the third
quarter, compared to $57 million of losses in the second quarter of 2010.
We expect future losses will extinguish the majority of these securities
as reflected by the $229 million of credit reserves we have provided for
the $318 million face value of those securities. Until the losses occur,
we will continue to earn interest on the face value of those
securities.
|
|
u
|
The fair
market value of our subordinate securities was equal to 14% of the face
value, while our amortized cost was equal to 14% of the face value of the
portfolio at September 30, 2010. These securities generated $9 million of
cash in the third quarter compared to $8 million in the second quarter.
The annualized yield for our subordinate securities portfolio was
34.9%.
|
|
THE REDWOOD
REVIEW 3RD QUARTER 2010
|
33
|
|
|
| RESIDENTIAL REAL ESTATE SECURITIES |
|
u
|
Our existing
portfolio of re-REMIC securities consists of prime residential senior
securities that were pooled and re-securitized in 2009 to create
two-tranche structures and we own support (or junior) securities within
those structures.
|
|
u
|
The fair market value of our
re-REMIC securities was equal to 54% of the face value of the portfolio,
while our amortized cost was equal to 24% of the face value at September
30, 2010. These securities generated $2 million of cash exclusively from
interest in both the third and second quarters of 2010, excluding proceeds
from sales. The annualized yield in the third quarter for our re-REMIC
securities portfolio was 17.5%.
|
|
u
|
There were no
credit losses in our re-REMIC portfolio in the third quarter. We
anticipate losses, which were included in our acquisition assumptions, and
have allocated $41 million of the purchase discount to credit
reserves.
|
|
34
|
THE REDWOOD
REVIEW 3RD QUARTER 2010
|
|
|
 |
|
COMMERCIAL
REAL ESTATE
|
|
u
|
Property
level fundamentals are slowly beginning to show signs of marginal
improvement. In the second quarter of 2010 net absorption turned positive
for apartments, office, retail, and industrial space, and vacancy rates
declined for all property types except office properties, which held
steady. This marks the first quarter since 2007 where vacancy rates across
commercial real estate have improved. Rental rates, which often lag
vacancies, continued to decline for most property types, although the pace
of decline has slowed markedly.
|
|
u
|
Despite these signs of
improvement in commercial real estate, the commercial mortgage market is
still experiencing elevated levels of distress. However, this market has
become increasing fragmented and there is high demand for stabilized
assets from both commercial mortgage lenders and equity investors. This
has resulted in attractive first mortgage rates, albeit at lower leverage
levels, for borrowers with high quality assets.
|
|
u
|
After a two
year hiatus, the CMBS market has re-emerged. Annual volume is expected to
exceed $10 billion for new issuance in 2010 and Standard and Poor’s
estimates that total CMBS volume will increase to over $35 billion in
2011.
|
|
u
|
Commercial
mortgage borrowers seeking full leverage (higher LTV) loans are faced with
a formidable funding gap relative to the lower LTVs loans offered by
senior lenders. Mezzanine providers, lenders, and borrowers are working
towards providing the needed
financing.
|
|
u
|
Our
commercial strategy is to build a portfolio of attractive commercial real
estate investments by providing long-term debt solutions for
well-capitalized borrowers with successful track records on high quality
commercial real estate.
|
|
u
|
We continue
to collaborate with portfolio and CMBS lenders to opportunistically source
mezzanine and other subordinate debt investments. We are actively pursuing
a commercial business that will allow us to create a portfolio of
high-quality credit assets generating long-term cash
flows.
|
|
THE REDWOOD
REVIEW 3RD QUARTER 2010
|
35
|
|
|
|
|
COMMERCIAL
REAL ESTATE
|
|
u
|
At September
30, 2010, our investments in commercial securities consisted of
predominantly 2004 and 2005 vintage subordinate securities with a fair
market value of $8 million. These securities have a face value of $109
million and credit reserves of $97
million.
|
|
u
|
As reflected
by the large credit reserve relative to face value, we continue to expect
to incur significant credit losses on these securities. The timing,
however, of these credit losses is difficult to forecast and credit losses
will likely vary significantly every quarter. This volatility was
experienced over the last two quarters as credit losses in the third
quarter totaled $31 million compared to $12 million in the second
quarter.
|
|
u
|
Many of these
securities are not receiving periodic principal or interest due to the
level of delinquencies in the underlying pool of loans. However, as
specially serviced loans are resolved, there may be lump sum payments. For
this reason, the cash flow generated by these securities in the third
quarter increased to $2 million from $1 million the previous quarter. The
timing and amount of cash distributed from these resolutions is difficult
to anticipate and we expect our cash flow from our commercial subordinate
securities will continue to vary.
|
|
u
|
In early
October, we originated a $12 million mezzanine loan concurrently with
a $46 million first mortgage provided by a large bank. It exemplifies the
type of loan we want to make and the level of risk we believe is
appropriate in order to earn double-digit rates of return without
short-term financial leverage. The loan is related to a landmark office
building in Chicago that features stable operations, ample debt service
coverage, and overall leverage of 71% based on a new baseline valuation
determined at the time we made the loan. The institutional borrower is an
experienced owner/operator of more than 10 million square feet of
commercial real estate. We believe we will have similar opportunities to
originate additional loans in the near future and are currently analyzing
a significant pipeline of
transactions.
|
|
36
|
THE REDWOOD
REVIEW 3RD QUARTER 2010
|
|
|
 |
|
LEGACY
INVESTMENTS IN OTHER CONSOLIDATED
ENTITIES
|
|
u
|
In the third
quarter, we reported GAAP income of $5 million from legacy Sequoia and
Acacia entities. This was an increase from the $4 million reported in the
second quarter due primarily to lower loan loss provision
expense.
|
|
u
|
Cash generated by our investments
in legacy Sequoia and Acacia entities totaled $7 million in the third and
second quarters of 2010.
|
|
u
|
Cumulative losses for all 53
legacy Sequoia residential mortgage securitizations (totaling $35 billion
at issuance) totaled 0.36% of the original face amount of the securities
through September 30, 2010.
|
|
u
|
To date, credit losses have not
yet been incurred on any of the senior securities issued by legacy Sequoia
securitization entities, although some of these senior securities may
incur losses in the future, depending on the magnitude and timing of
additional credit losses incurred on the underlying loans.
|
|
u
|
The consolidation of the assets
and liabilities of securitization entities may lead to potentially
volatile quarterly reported earnings for a variety of reasons, including
the amortization of premium on the loans and liabilities of Sequoia
entities, changes in credit loss provisions for loans held by Sequoia
entities, fair value adjustments for the assets and liabilities of the
Acacia entities, and deconsolidation events.
|
|
THE REDWOOD
REVIEW 3RD QUARTER 2010
|
37
|
|
38
|
|

 |
|
|
ACCOUNTING
DISCUSSION
|
|
u
|
Market values reflect an “exit
price,” or the amount we believe we would realize if we sold an asset or
would pay if we repurchased a liability in an orderly transaction, even
though we generally have no intention — nor would we be required — to sell
assets or repurchase liabilities. Establishing market values is inherently
subjective and requires us to make a number of assumptions, including the
future of interest rates, prepayment rates, discount rates, credit loss
rates, and the timing of credit losses. The assumptions we apply are
specific to each asset or liability.
|
|
u
|
Although we rely on our internal
calculations to compute the fair value of our securities, we request and
consider indications of value (marks) from third-party dealers to assist
us in our mark-to-market valuation process. For September 30, 2010, we
received dealer marks on 78% of our consolidated assets and 94% of our
consolidated liabilities. In the aggregate, our internal valuations of the
securities on which we received dealer marks were 1% lower (i.e., more
conservative) than the dealer marks and our internal valuations of our ABS
issued on which we received dealer marks were 3% higher (i.e., more
conservative) than the dealer marks.
|
|
u
|
As discussed
in our second quarter 2009 Redwood Review, on April 1, 2009, we were
required to adopt a new accounting principle affecting the determination
of other-than-temporary impairment (OTTI) and its recognition through the
income statement and balance sheet (outlined below). The revised
multi-step process is presented below. Upon adoption, we made a one-time
retained earnings reclassification of $60 million of prior impairments.
Our book value did not change as a result of this reclassification. As
this impairment is recovered over time, rather than flow through earnings
(where the impairment was originally reported), it will instead be
credited to equity. The net impact is that our cumulative reported
earnings will now be $60 million less than they would have been prior to
adopting this required accounting
principle.
|
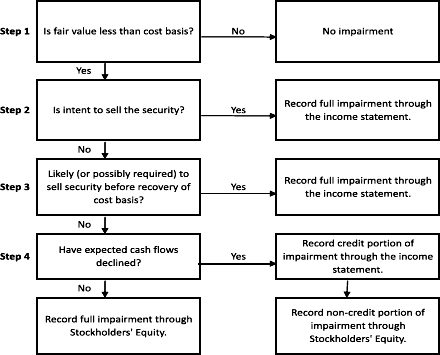
|
40
|
THE REDWOOD
REVIEW 3RD QUARTER 2010
|
|
|
 |
|
GLOSSARY
|
|
THE REDWOOD
REVIEW 3RD QUARTER 2010
|
41
|
|
|
|
|
GLOSSARY
|
|
42
|
THE REDWOOD
REVIEW 3RD QUARTER 2010
|
|
|
|
|
GLOSSARY
|
|
THE REDWOOD
REVIEW 3RD QUARTER 2010
|
43
|
|
|
|
|
GLOSSARY
|
|
44
|
THE REDWOOD
REVIEW 3RD QUARTER 2010
|
|
|
|
|
GLOSSARY
|
|
THE REDWOOD
REVIEW 3RD QUARTER 2010
|
45
|
|
|
|
|
GLOSSARY
|
|
46
|
THE REDWOOD
REVIEW 3RD QUARTER 2010
|

|
Nine
|
Nine
|
|||||||||||||||||||||||||||||||||||||||||||
|
2010
|
2010
|
2010
|
2009
|
2009
|
2009
|
2009
|
2008
|
2008
|
Months
|
Months
|
||||||||||||||||||||||||||||||||||
|
Q3
|
Q2
|
Q1
|
Q4
|
Q3
|
Q2
|
Q1
|
Q4
|
Q3
|
2010
|
2009
|
||||||||||||||||||||||||||||||||||
|
Interest
income
|
$ | 49,249 | $ | 47,730 | $ | 50,449 | $ | 57,718 | $ | 64,425 | $ | 74,332 | $ | 83,903 | $ | 124,452 | $ | 126,227 | $ | 147,428 | $ | 222,660 | ||||||||||||||||||||||
|
Discount
amortization on securities, net
|
10,991 | 10,821 | 10,629 | 7,432 | 9,575 | 3,864 | 4,917 | (1,189 | ) | 7,850 | 32,441 | 18,356 | ||||||||||||||||||||||||||||||||
|
Other
investment interest income
|
2 | 4 | 9 | 12 | 25 | 53 | 76 | 572 | 487 | 15 | 154 | |||||||||||||||||||||||||||||||||
|
Premium
amortization expense on loans
|
(1,227 | ) | (1,985 | ) | (2,371 | ) | (3,365 | ) | (3,642 | ) | (3,988 | ) | (7,459 | ) | (548 | ) | (3,372 | ) | (5,583 | ) | (15,089 | ) | ||||||||||||||||||||||
|
Total interest
income
|
59,015 | 56,570 | 58,716 | 61,797 | 70,382 | 74,261 | 81,437 | 123,287 | 131,192 | 174,301 | 226,081 | |||||||||||||||||||||||||||||||||
|
Interest
expense on short-term debt
|
(2 | ) | (36 | ) | - | - | - | - | - | (2 | ) | (65 | ) | (38 | ) | - | ||||||||||||||||||||||||||||
|
Interest
expense on ABS
|
(19,582 | ) | (17,582 | ) | (16,144 | ) | (17,930 | ) | (22,071 | ) | (36,115 | ) | (44,517 | ) | (94,431 | ) | (88,294 | ) | (53,308 | ) | (102,703 | ) | ||||||||||||||||||||||
|
ABS issuance
expense amortization
|
(575 | ) | (475 | ) | (634 | ) | (575 | ) | (570 | ) | (586 | ) | (553 | ) | (1,470 | ) | (930 | ) | (1,684 | ) | (1,709 | ) | ||||||||||||||||||||||
|
ABS interest
rate agreement expense
|
(1,104 | ) | (1,127 | ) | (495 | ) | (1,123 | ) | (1,123 | ) | (1,111 | ) | (1,098 | ) | (1,934 | ) | (1,259 | ) | (2,726 | ) | (3,332 | ) | ||||||||||||||||||||||
|
ABS issuance
premium amortization income
|
187 | 196 | 208 | 223 | 234 | 313 | 335 | 476 | 557 | 591 | 882 | |||||||||||||||||||||||||||||||||
|
Total ABS
expense consolidated from trusts
|
(21,074 | ) | (18,988 | ) | (17,065 | ) | (19,405 | ) | (23,530 | ) | (37,499 | ) | (45,833 | ) | (97,359 | ) | (89,926 | ) | (57,127 | ) | (106,862 | ) | ||||||||||||||||||||||
|
Interest
expense on long-term debt
|
(2,619 | ) | (2,140 | ) | (1,116 | ) | (1,167 | ) | (1,307 | ) | (1,502 | ) | (1,808 | ) | (2,345 | ) | (2,164 | ) | (5,875 | ) | (4,617 | ) | ||||||||||||||||||||||
|
Net interest
income
|
35,320 | 35,406 | 40,535 | 41,225 | 45,545 | 35,260 | 33,795 | 23,581 | 39,037 | 111,261 | 114,602 | |||||||||||||||||||||||||||||||||
|
Provision for
loan losses
|
(2,436 | ) | (4,321 | ) | (9,476 | ) | (8,997 | ) | (9,998 | ) | (14,545 | ) | (16,032 | ) | (18,659 | ) | (18,333 | ) | (16,233 | ) | (40,575 | ) | ||||||||||||||||||||||
|
Market
valuation adjustments, net
|
(1,573 | ) | (7,125 | ) | (11,237 | ) | (4,191 | ) | (11,058 | ) | (29,135 | ) | (43,244 | ) | (111,331 | ) | (127,146 | ) | (19,935 | ) | (83,437 | ) | ||||||||||||||||||||||
|
Net
interest income (loss) after provision and market valuation
adjustments
|
31,311 | 23,960 | 19,822 | 28,037 | 24,489 | (8,420 | ) | (25,481 | ) | (106,409 | ) | (106,442 | ) | 75,093 | (9,410 | ) | ||||||||||||||||||||||||||||
|
Fixed
compensation expense
|
(3,314 | ) | (3,661 | ) | (4,109 | ) | (3,261 | ) | (3,726 | ) | (3,572 | ) | (4,029 | ) | (3,575 | ) | (4,331 | ) | (11,084 | ) | (11,327 | ) | ||||||||||||||||||||||
|
Variable
compensation expense
|
(2,206 | ) | (1,303 | ) | (1,880 | ) | (566 | ) | (5,216 | ) | (1,132 | ) | (556 | ) | 418 | (616 | ) | (5,389 | ) | (6,904 | ) | |||||||||||||||||||||||
|
Equity
compensation expense
|
(1,507 | ) | (2,077 | ) | (6,059 | ) | (1,553 | ) | (420 | ) | (2,337 | ) | (1,795 | ) | (2,378 | ) | (3,080 | ) | (9,643 | ) | (4,552 | ) | ||||||||||||||||||||||
|
Severance
expense
|
(48 | ) | (229 | ) | (81 | ) | - | (398 | ) | - | (28 | ) | (1,814 | ) | - | (358 | ) | (426 | ) | |||||||||||||||||||||||||
|
Other
operating expense
|
(5,170 | ) | (3,957 | ) | (5,177 | ) | (5,453 | ) | (5,046 | ) | (3,728 | ) | (4,132 | ) | (6,104 | ) | (8,824 | ) | (14,304 | ) | (12,906 | ) | ||||||||||||||||||||||
|
Total
operating expenses
|
(12,245 | ) | (11,227 | ) | (17,306 | ) | (10,833 | ) | (14,806 | ) | (10,769 | ) | (10,540 | ) | (13,453 | ) | (16,851 | ) | (40,778 | ) | (36,115 | ) | ||||||||||||||||||||||
|
Realized gains
(losses) on sales, net
|
72 | 16,080 | 44,339 | 19,618 | 17,561 | 25,525 | 462 | 5,823 | (15 | ) | 60,491 | 43,548 | ||||||||||||||||||||||||||||||||
|
Realized gains
(losses) on calls, net
|
1,494 | - | - | - | - | - | - | - | (50 | ) | 1,494 | - | ||||||||||||||||||||||||||||||||
|
Realized gains
(losses), net
|
1,566 | 16,080 | 44,339 | 19,618 | 17,561 | 25,525 | 462 | 5,823 | (65 | ) | 61,985 | 43,548 | ||||||||||||||||||||||||||||||||
|
Noncontrolling
interest
|
(532 | ) | (186 | ) | 15 | (143 | ) | (363 | ) | (127 | ) | 716 | 2,366 | 2,194 | (703 | ) | 226 | |||||||||||||||||||||||||||
|
(Provision
for) benefit from income taxes
|
(202 | ) | (26 | ) | (26 | ) | 3,612 | 247 | 514 | (105 | ) | (3,913 | ) | 9,860 | (254 | ) | 656 | |||||||||||||||||||||||||||
|
Net income
(loss)
|
$ | 19,898 | $ | 28,601 | $ | 46,844 | $ | 40,291 | $ | 27,128 | $ | 6,723 | $ | (34,948 | ) | $ | (115,586 | ) | $ | (111,304 | ) | $ | 95,343 | $ | (1,095 | ) | ||||||||||||||||||
|
Diluted
average shares
|
78,961 | 78,852 | 78,542 | 78,101 | 78,223 | 66,446 | 53,632 | 33,366 | 33,334 | 77,794 | 65,363 | |||||||||||||||||||||||||||||||||
|
Net income
(loss) per share
|
$ | 0.25 | $ | 0.35 | $ | 0.58 | $ | 0.51 | $ | 0.34 | $ | 0.10 | $ | (0.65 | ) | $ | (3.46 | ) | $ | (3.34 | ) | $ | 1.18 | $ | (0.02 | ) | ||||||||||||||||||
|
THE
REDWOOD REVIEW 3RD QUARTER 2010
|
Table
1: GAAP Earnings
|
|
|
|
($
in thousands, except per share data)
|
|
|
Estimated 2010 Q3
(2)
|
Actual Twelve
Months 2009
|
Actual Twelve
Months 2008
|
||||||||||||||||||||||||||||||||||
|
Taxable
|
GAAP
|
Taxable
|
GAAP
|
Taxable
|
GAAP
|
|||||||||||||||||||||||||||||||
|
Loss
|
Income
|
Differences
|
Loss
|
Income
|
Differences
|
Income
|
Loss
|
Differences
|
||||||||||||||||||||||||||||
|
Interest
income
|
$ | 36,957 | $ | 59,015 | $ | (22,058 | ) | $ | 192,921 | $ | 287,877 | $ | (94,956 | ) | $ | 201,857 | $ | 567,545 | $ | (365,688 | ) | |||||||||||||||
|
Interest
expense
|
(2,921 | ) | (23,695 | ) | 20,774 | (5,009 | ) | (132,003 | ) | 126,994 | (7,784 | ) | (416,669 | ) | 408,885 | |||||||||||||||||||||
|
Net interest
income
|
34,036 | 35,320 | (1,284 | ) | 187,912 | 155,874 | (32,038 | ) | 194,073 | 150,876 | 43,197 | |||||||||||||||||||||||||
|
Provision for
loan losses
|
- | (2,436 | ) | 2,436 | - | (49,573 | ) | 49,573 | - | (55,111 | ) | 55,111 | ||||||||||||||||||||||||
|
Realized
credit losses
|
(31,232 | ) | - | (31,232 | ) | (223,902 | ) | - | (223,902 | ) | (116,546 | ) | - | (116,546 | ) | |||||||||||||||||||||
|
Market
valuation adjustments, net
|
- | (1,573 | ) | 1,573 | - | (87,628 | ) | 87,628 | - | (492,902 | ) | 492,902 | ||||||||||||||||||||||||
|
Operating
expenses
|
(11,376 | ) | (12,245 | ) | 869 | (54,178 | ) | (46,995 | ) | (7,183 | ) | (58,335 | ) | (60,906 | ) | 2,571 | ||||||||||||||||||||
|
Realized
gains, net
|
- | 1,566 | (1,566 | ) | 6,625 | 63,166 | (56,541 | ) | - | 8,511 | (8,511 | ) | ||||||||||||||||||||||||
|
(Provision
for) benefit from income taxes
|
- | (202 | ) | 202 | (10 | ) | 4,268 | (4,278 | ) | (113 | ) | 3,210 | (3,323 | ) | ||||||||||||||||||||||
|
Less: Net
income attributable to noncontrolling interest
|
- | 532 | (532 | ) | - | (83 | ) | 83 | - | (1,936 | ) | 1,936 | ||||||||||||||||||||||||
|
Taxable (loss)
income
|
$ | (8,572 | ) | $ | 19,898 | $ | (28,470 | ) | $ | (83,553 | ) | $ | 39,195 | $ | (122,748 | ) | $ | 19,079 | $ | (444,386 | ) | $ | 463,465 | |||||||||||||
|
REIT taxable
(loss) income
|
$ | (8,763 | ) | $ | (69,819 | ) | $ | 18,541 | ||||||||||||||||||||||||||||
|
Taxable income (loss) at taxable
subsidiaries
|
191 | (13,734 | ) | 538 | ||||||||||||||||||||||||||||||||
|
Taxable (loss)
income
|
$ | (8,572 | ) | $ | (83,553 | ) | $ | 19,079 | ||||||||||||||||||||||||||||
|
Shares used
for taxable EPS calculation
|
77,984 | 71,800 | 32,283 | |||||||||||||||||||||||||||||||||
|
REIT taxable (loss) income per share (3)
|
$ | (0.11 | ) | $ | (0.93 | ) | $ | 0.57 | ||||||||||||||||||||||||||||
|
Taxable income (loss) at taxable
subsidiaries per share
|
$ | 0.00 | $ | (0.19 | ) | $ | 0.01 | |||||||||||||||||||||||||||||
|
Taxable (loss)
income per share (3)
|
$ | (0.11 | ) | $ | (1.12 | ) | $ | 0.58 | ||||||||||||||||||||||||||||
|
THE
REDWOOD REVIEW 3RD QUARTER 2010
|
Table 2:
Taxable Income (Loss) and GAAP Income (Loss) Differences
|
49
|
|
|
|
Estimated
|
Actual
|
Actual
|
Estimated
|
Actual
|
||||||||||||||||||||||||||||||||||||||||
|
Nine
|
Nine
|
|||||||||||||||||||||||||||||||||||||||||||
|
2010
|
2010
|
2010
|
2009
|
2009
|
2009
|
2009
|
2008
|
2008
|
Months
|
Months
|
||||||||||||||||||||||||||||||||||
| Q3 | Q2 | Q1 | Q4 | Q3 | Q2 | Q1 | Q4 |
Q3
|
2010
|
2009
|
||||||||||||||||||||||||||||||||||
|
Dividends
declared
|
$ | 19,496 | $ | 19,477 | $ | 19,438 | $ | 19,434 | $ | 19,417 | $ | 19,376 | $ | 15,057 | $ | 25,103 | $ | 24,928 | $ | 58,411 | $ | 53,850 | ||||||||||||||||||||||
|
Dividend deductions on stock issued through direct stock purchase
plan
|
21 | 21 | 37 | 6 | 2 | 2 | 30 | 45 | 165 | 79 | 34 | |||||||||||||||||||||||||||||||||
|
Total dividend
deductions
|
$ | 19,517 | $ | 19,498 | $ | 19,475 | $ | 19,440 | $ | 19,419 | $ | 19,378 | $ | 15,087 | $ | 25,148 | $ | 25,093 | $ | 58,490 | $ | 53,884 | ||||||||||||||||||||||
|
Regular dividend per share (1)
|
$ | 0.25 | $ | 0.25 | $ | 0.25 | $ | 0.25 | $ | 0.25 | $ | 0.25 | $ | 0.25 | $ | 0.75 | $ | 0.75 | $ | 0.75 | $ | 0.75 | ||||||||||||||||||||||
|
Undistributed
REIT taxable income at beginning of period (pre-tax)
|
$ | - | $ | - | $ | - | $ | - | $ | - | $ | - | $ | - | $ | 21,128 | $ | 43,821 | $ | - | $ | - | ||||||||||||||||||||||
|
REIT taxable
income (loss) (pre-tax)
|
(8,763 | ) | 2,883 | 9,831 | (25,806 | ) | (24,933 | ) | (10,379 | ) | (8,701 | ) | (13,007 | ) | 2,400 | 3,951 | (44,013 | ) | ||||||||||||||||||||||||||
|
Dividend of
2007 income
|
- | - | - | - | - | - | - | - | (14,673 | ) | - | - | ||||||||||||||||||||||||||||||||
|
Dividend of
2008 income
|
- | - | - | - | - | - | - | (8,121 | ) | (10,420 | ) | - | - | |||||||||||||||||||||||||||||||
|
Dividend of
2009 income
|
- | - | - | - | - | - | - | - | - | - | - | |||||||||||||||||||||||||||||||||
|
Dividend of 2010
income
|
- | - | - | - | - | - | - | - | - | - | - | |||||||||||||||||||||||||||||||||
|
Undistributed
REIT taxable income (pre-tax) at period end
|
$ | - | $ | - | $ | - | $ | - | $ | - | $ | - | $ | - | $ | - | $ | 21,128 | $ | - | $ | - | ||||||||||||||||||||||
|
Undistributed
REIT taxable income (pre-tax) at period end
|
||||||||||||||||||||||||||||||||||||||||||||
|
From
2008
|
$ | - | $ | - | $ | - | $ | - | $ | - | $ | - | $ | - | $ | - | $ | 20,872 | $ | - | $ | - | ||||||||||||||||||||||
|
From
2009
|
- | - | - | - | - | - | - | - | - | - | - | |||||||||||||||||||||||||||||||||
|
From
2010
|
- | - | - | - | - | - | - | - | - | - | - | |||||||||||||||||||||||||||||||||
|
Total
|
$ | - | $ | - | $ | - | $ | - | $ | - | $ | - | $ | - | $ | - | $ | 20,872 | $ | - | $ | - | ||||||||||||||||||||||
|
Shares
outstanding at period end
|
77,984 | 77,908 | 77,751 | 77,737 | 77,669 | 77,503 | 60,228 | 33,471 | 33,238 | 77,984 | 77,669 | |||||||||||||||||||||||||||||||||
|
Undistributed
REIT taxable income (pre-tax) per share outstanding at period
end
|
$ | - | $ | - | $ | - | $ | - | $ | - | $ | - | $ | - | $ | - | $ | 0.63 | $ | - | $ | - | ||||||||||||||||||||||
|
THE
REDWOOD REVIEW 3RD QUARTER 2010
|
Table
3: Retention and Distribution of Taxable Income
|
|
|
2010
|
2010
|
2010
|
2009
|
2009
|
2009
|
2009
|
2008
|
2008
|
||||||||||||||||||||||||||||
|
Q3
|
Q2
|
Q1
|
Q4
|
Q3
|
Q2
|
Q1
|
Q4
|
Q3
|
||||||||||||||||||||||||||||
|
Short-term
debt
|
$ | - | $ | - | $ | - | $ | - | $ | - | $ | - | $ | - | $ | - | $ | 7 | ||||||||||||||||||
|
Long-term
debt
|
140 | 140 | 140 | 140 | 140 | 150 | 150 | 150 | 150 | |||||||||||||||||||||||||||
|
Redwood debt (1)
|
$ | 140 | $ | 140 | $ | 140 | $ | 140 | $ | 140 | $ | 150 | $ | 150 | $ | 150 | $ | 157 | ||||||||||||||||||
|
GAAP
stockholders' equity
|
$ | 1,016 | $ | 991 | $ | 998 | $ | 972 | $ | 907 | $ | 802 | $ | 506 | $ | 302 | $ | 412 | ||||||||||||||||||
|
Redwood debt
to equity
|
0.1 | x | 0.1 | x | 0.1 | x | 0.1 | x | 0.2 | x | 0.2 | x | 0.3 | x | 0.5 | x | 0.4 | x | ||||||||||||||||||
|
Redwood debt
to (equity + debt)
|
12 | % | 12 | % | 12 | % | 13 | % | 13 | % | 16 | % | 23 | % | 33 | % | 28 | % | ||||||||||||||||||
|
Redwood
debt
|
$ | 140 | $ | 140 | $ | 140 | $ | 140 | $ | 140 | $ | 150 | $ | 150 | $ | 150 | $ | 157 | ||||||||||||||||||
|
ABS obligations of consolidated
securitization entities
|
3,832 | 3,961 | 3,837 | 3,943 | 4,016 | 4,185 | 4,709 | 4,855 | 6,603 | |||||||||||||||||||||||||||
|
GAAP
obligation
|
$ | 3,972 | $ | 4,101 | $ | 3,977 | $ | 4,083 | $ | 4,156 | $ | 4,335 | $ | 4,859 | $ | 5,005 | $ | 6,760 | ||||||||||||||||||
|
GAAP
obligation to equity
|
3.9 | x | 4.0 | x | 4.0 | x | 4.2 | x | 4.6 | x | 5.4 | x | 9.6 | x | 16.6 | x | 16.4 | x | ||||||||||||||||||
|
GAAP
obligation to (equity + GAAP debt)
|
80 | % | 81 | % | 80 | % | 81 | % | 82 | % | 84 | % | 91 | % | 94 | % | 94 | % | ||||||||||||||||||
|
GAAP
stockholders' equity
|
$ | 1,016 | $ | 991 | $ | 998 | $ | 972 | $ | 907 | $ | 802 | $ | 506 | $ | 302 | $ | 412 | ||||||||||||||||||
|
Balance sheet mark-to-market
adjustments
|
61 | 38 | 58 | 65 | 23 | (77 | ) | (85 | ) | (57 | ) | (84 | ) | |||||||||||||||||||||||
|
Core equity
(non-GAAP)
|
$ | 955 | $ | 953 | $ | 940 | $ | 907 | $ | 884 | $ | 879 | $ | 591 | $ | 359 | $ | 496 | ||||||||||||||||||
|
Shares
outstanding at period end
|
77,984 | 77,908 | 77,751 | 77,737 | 77,669 | 77,503 | 60,228 | 33,471 | 33,238 | |||||||||||||||||||||||||||
|
GAAP equity
per share
|
$ | 13.02 | $ | 12.71 | $ | 12.84 | $ | 12.50 | $ | 11.68 | $ | 10.35 | $ | 8.40 | $ | 9.02 | $ | 12.40 | ||||||||||||||||||
|
Adjustments: GAAP equity to
economic value (2) |
||||||||||||||||||||||||||||||||||||
|
Investments in
Sequoia
|
$ | (0.24 | ) | $ | (0.31 | ) | $ | (0.37 | ) | $ | (0.37 | ) | $ | (0.37 | ) | $ | (0.35 | ) | $ | (0.15 | ) | $ | (0.95 | ) | $ | (1.65 | ) | |||||||||
|
Investments in
Acacia
|
(0.04 | ) | (0.03 | ) | - | - | - | 0.01 | (0.03 | ) | (0.21 | ) | (0.18 | ) | ||||||||||||||||||||||
|
Long-term
debt
|
0.99 | 1.00 | 0.85 | 0.90 | 0.97 | 1.29 | 1.79 | 3.24 | 2.61 | |||||||||||||||||||||||||||
|
Estimate of economic value per
share (non-GAAP)
|
$ | 13.73 | $ | 13.37 | $ | 13.32 | $ | 13.03 | $ | 12.28 | $ | 11.30 | $ | 10.01 | $ | 11.10 | $ | 13.18 | ||||||||||||||||||
|
THE
REDWOOD REVIEW 3RD QUARTER 2010
|
Table 4: Book
Value and Other Ratios
|
51
|
|
|
|
Nine
|
Nine
|
|||||||||||||||||||||||||||||||||||||||||||
|
2010
|
2010
|
2010
|
2009
|
2009
|
2009
|
2009
|
2008
|
2008
|
Months
|
Months
|
||||||||||||||||||||||||||||||||||
|
Q3
|
Q2
|
Q1
|
Q4
|
Q3
|
Q2
|
Q1
|
Q4
|
Q3
|
2010
|
2009
|
||||||||||||||||||||||||||||||||||
|
Interest
income
|
$ | 59,015 | $ | 56,570 | $ | 58,716 | $ | 61,797 | $ | 70,382 | $ | 74,261 | $ | 81,437 | $ | 123,287 | $ | 131,192 | $ | 174,301 | $ | 226,080 | ||||||||||||||||||||||
|
Average consolidated earning
assets
|
$ | 5,030,680 | $ | 5,139,945 | $ | 5,070,987 | $ | 5,175,337 | $ | 5,128,893 | $ | 5,325,322 | $ | 5,553,470 | $ | 7,006,592 | $ | 7,594,682 | $ | 5,080,390 | $ | 5,334,340 | ||||||||||||||||||||||
|
Asset
yield
|
4.69 | % | 4.40 | % | 4.63 | % | 4.78 | % | 5.49 | % | 5.58 | % | 5.87 | % | 7.04 | % | 6.91 | % | 4.57 | % | 5.65 | % | ||||||||||||||||||||||
|
Interest
expense
|
$ | (23,695 | ) | $ | (21,164 | ) | $ | (18,181 | ) | $ | (20,572 | ) | $ | (24,837 | ) | $ | (39,001 | ) | $ | (47,641 | ) | $ | (99,706 | ) | $ | (92,155 | ) | $ | (63,040 | ) | $ | (111,479 | ) | |||||||||||
|
Average consolidated
interest-bearing liabilities
|
$ | 4,016,680 | $ | 4,077,992 | $ | 4,015,655 | $ | 4,096,928 | $ | 4,193,650 | $ | 4,651,125 | $ | 4,940,304 | $ | 6,613,677 | $ | 7,106,052 | $ | 4,036,779 | $ | 4,586,297 | ||||||||||||||||||||||
|
Cost of
funds
|
2.36 | % | 2.08 | % | 1.81 | % | 2.01 | % | 2.37 | % | 3.35 | % | 3.86 | % | 6.03 | % | 5.19 | % | 2.08 | % | 3.24 | % | ||||||||||||||||||||||
|
Asset
yield
|
4.69 | % | 4.40 | % | 4.63 | % | 4.78 | % | 5.49 | % | 5.58 | % | 5.87 | % | 7.04 | % | 6.91 | % | 4.57 | % | 5.65 | % | ||||||||||||||||||||||
|
Cost of
funds
|
(2.36 | %) | (2.08 | %) | (1.81 | %) | (2.01 | %) | (2.37 | %) | (3.35 | %) | (3.86 | %) | (6.03 | %) | (5.19 | %) | (2.08 | %) | (3.24 | %) | ||||||||||||||||||||||
|
Interest rate
spread
|
2.33 | % | 2.33 | % | 2.82 | % | 2.77 | % | 3.12 | % | 2.22 | % | 2.01 | % | 1.01 | % | 1.72 | % | 2.49 | % | 2.41 | % | ||||||||||||||||||||||
|
Net interest
income
|
$ | 35,320 | $ | 35,406 | $ | 40,535 | $ | 41,225 | $ | 45,545 | $ | 35,260 | $ | 33,795 | $ | 23,581 | $ | 39,037 | $ | 111,261 | $ | 114,600 | ||||||||||||||||||||||
|
Average consolidated earning
assets
|
$ | 5,030,680 | $ | 5,139,945 | $ | 5,070,987 | $ | 5,175,337 | $ | 5,128,893 | $ | 5,325,322 | $ | 5,553,470 | $ | 7,006,592 | $ | 7,594,682 | $ | 5,080,390 | $ | 5,334,340 | ||||||||||||||||||||||
|
Net interest
margin
|
2.81 | % | 2.76 | % | 3.20 | % | 3.19 | % | 3.55 | % | 2.65 | % | 2.43 | % | 1.35 | % | 2.06 | % | 2.92 | % | 2.86 | % | ||||||||||||||||||||||
|
Operating
expenses
|
$ | (12,245 | ) | $ | (11,227 | ) | $ | (17,306 | ) | $ | (10,833 | ) | $ | (14,806 | ) | $ | (10,769 | ) | $ | (10,540 | ) | $ | (13,453 | ) | $ | (16,851 | ) | $ | (40,778 | ) | $ | (36,115 | ) | |||||||||||
|
Average total
assets
|
$ | 5,161,498 | $ | 5,263,730 | $ | 5,219,636 | $ | 5,293,887 | $ | 5,138,793 | $ | 5,315,643 | $ | 5,575,619 | $ | 7,040,306 | $ | 7,648,102 | $ | 5,214,742 | $ | 5,341,751 | ||||||||||||||||||||||
|
Average total
equity
|
$ | 1,003,372 | $ | 1,005,212 | $ | 985,350 | $ | 945,862 | $ | 833,227 | $ | 575,661 | $ | 556,861 | $ | 371,503 | $ | 533,755 | $ | 998,044 | $ | 656,262 | ||||||||||||||||||||||
|
Operating
expenses / net interest income
|
34.67 | % | 31.71 | % | 42.69 | % | 26.28 | % | 32.51 | % | 30.54 | % | 31.19 | % | 57.05 | % | 43.17 | % | 48.87 | % | 42.02 | % | ||||||||||||||||||||||
|
Operating
expenses / average total assets
|
0.95 | % | 0.85 | % | 1.33 | % | 0.82 | % | 1.15 | % | 0.81 | % | 0.76 | % | 0.76 | % | 0.88 | % | 1.04 | % | 0.90 | % | ||||||||||||||||||||||
|
Operating
expenses / average total equity
|
4.88 | % | 4.47 | % | 7.03 | % | 4.58 | % | 7.11 | % | 7.48 | % | 7.57 | % | 14.49 | % | 12.63 | % | 5.45 | % | 7.34 | % | ||||||||||||||||||||||
|
GAAP net
income (loss)
|
$ | 19,898 | $ | 28,601 | $ | 46,844 | $ | 40,291 | $ | 27,128 | $ | 6,723 | $ | (34,948 | ) | $ | (115,586 | ) | $ | (111,304 | ) | $ | 95,343 | $ | (1,097 | ) | ||||||||||||||||||
|
GAAP net
income (loss) / average total assets
|
1.54 | % | 2.17 | % | 3.59 | % | 3.04 | % | 2.11 | % | 0.51 | % | (2.51 | %) | (6.57 | %) | (5.82 | %) | 2.44 | % | (0.03 | %) | ||||||||||||||||||||||
|
GAAP net
income (loss) / average equity (GAAP ROE)
|
7.93 | % | 11.38 | % | 19.02 | % | 17.04 | % | 13.02 | % | 4.67 | % | (25.10 | %) | (124.45 | %) | (83.41 | %) | 12.74 | % | (0.22 | %) | ||||||||||||||||||||||
|
GAAP net income (loss) / average core equity
(adjusted ROE) (2)
|
8.25 | % | 12.00 | % | 20.09 | % | 17.99 | % | 12.22 | % | 4.10 | % | (22.64 | %) | (103.09 | %) | (79.62 | %) | 13.38 | % | (0.20 | %) | ||||||||||||||||||||||
|
Average core equity
(2)
|
$ | 964,249 | $ | 953,720 | $ | 932,721 | $ | 896,034 | $ | 888,107 | $ | 655,695 | $ | 617,325 | $ | 448,484 | $ | 559,150 | $ | 950,345 | $ | 721,368 | ||||||||||||||||||||||
|
THE
REDWOOD REVIEW 3RD QUARTER 2010
|
Table
5: Profitability Ratios
|
|
|
|
Table
6: Average Balance Sheet ($ in
thousands)
|
|
|
Nine
|
Nine
|
|||||||||||||||||||||||||||||||||||||||||||
|
2010
|
2010
|
2010
|
2009
|
2009
|
2009
|
2009
|
2008
|
2008
|
Months
|
Months
|
||||||||||||||||||||||||||||||||||
|
Q3
|
Q2
|
Q1
|
Q4
|
Q3
|
Q2
|
Q1
|
Q4
|
Q3
|
2010
|
2009
|
||||||||||||||||||||||||||||||||||
|
Real estate
assets at Redwood
|
||||||||||||||||||||||||||||||||||||||||||||
|
Senior
Residential Securities
|
||||||||||||||||||||||||||||||||||||||||||||
|
Prime
|
$ | 270,286 | $ | 278,472 | $ | 283,477 | $ | 280,101 | $ | 264,773 | $ | 164,386 | $ | 77,651 | $ | 37,746 | $ | 27,880 | $ | 277,363 | $ | 169,622 | ||||||||||||||||||||||
|
Non-prime
|
316,089 | 302,461 | 310,948 | 263,022 | 270,353 | 168,383 | 87,464 | 63,050 | 63,818 | 309,852 | 176,070 | |||||||||||||||||||||||||||||||||
|
Total
Senior Residential Securities
|
586,375 | 580,933 | 594,426 | 543,124 | 535,126 | 332,769 | 165,114 | 100,796 | 91,698 | 587,215 | 345,692 | |||||||||||||||||||||||||||||||||
|
Residential
Re-REMIC Securities
|
33,250 | 34,385 | 45,852 | 73,938 | 69,980 | 26,419 | - | - | - | 37,783 | 32,389 | |||||||||||||||||||||||||||||||||
|
Subordinate
Residential Securities
|
||||||||||||||||||||||||||||||||||||||||||||
|
Prime
|
35,794 | 38,079 | 41,701 | 47,083 | 58,637 | 43,020 | 47,070 | 88,943 | 147,513 | 38,503 | 49,618 | |||||||||||||||||||||||||||||||||
|
Non-prime
|
9,181 | 7,708 | 4,253 | 1,377 | 2,218 | 2,767 | 3,450 | 4,105 | 4,450 | 7,065 | 2,807 | |||||||||||||||||||||||||||||||||
|
Total
Subordinate Residential Securities
|
44,975 | 45,787 | 45,954 | 48,460 | 60,855 | 45,787 | 50,519 | 93,048 | 151,963 | 45,568 | 52,425 | |||||||||||||||||||||||||||||||||
|
Commercial
subordinate securites
|
7,274 | 7,417 | 7,670 | 8,090 | 13,504 | 25,006 | 46,382 | 63,969 | 98,534 | 7,452 | 28,177 | |||||||||||||||||||||||||||||||||
|
Commercial
loans
|
242 | 243 | 244 | 245 | 246 | 247 | 248 | 249 | 250 | 243 | 247 | |||||||||||||||||||||||||||||||||
|
Residential
loans
|
16,463 | 2,299 | 2,313 | 2,314 | 2,315 | 2,435 | 2,600 | 2,960 | 3,671 | 7,077 | 2,449 | |||||||||||||||||||||||||||||||||
|
CDO
|
1,103 | 1,207 | 1,222 | 1,962 | 2,255 | 2,595 | 3,429 | 3,856 | 8,628 | 1,177 | 2,755 | |||||||||||||||||||||||||||||||||
|
Other real
estate investments
|
- | - | - | - | - | - | - | 50 | 75 | - | - | |||||||||||||||||||||||||||||||||
|
Total
real estate assets at Redwood
|
689,682 | 672,270 | 697,681 | 678,133 | 684,281 | 435,258 | 268,293 | 264,927 | 354,819 | 686,515 | 464,134 | |||||||||||||||||||||||||||||||||
|
Earning assets
at Acacia
|
292,468 | 290,060 | 299,843 | 304,436 | 298,615 | 321,206 | 404,596 | 575,709 | 830,311 | 294,097 | 341,084 | |||||||||||||||||||||||||||||||||
|
Earning assets
at pre-2010 Sequoia
|
3,505,497 | 3,589,882 | 3,666,884 | 3,767,112 | 3,864,796 | 4,305,159 | 4,568,212 | 5,966,898 | 6,170,944 | 3,586,830 | 4,243,479 | |||||||||||||||||||||||||||||||||
|
Earning assets
at 2010 Sequoia
|
204,504 | 161,502 | - | - | - | - | - | - | - | 122,751 | - | |||||||||||||||||||||||||||||||||
|
Earning assets
at the Fund
|
34,334 | 35,526 | 42,134 | 53,990 | 57,070 | 58,054 | 62,319 | 71,792 | 75,321 | 37,303 | 59,128 | |||||||||||||||||||||||||||||||||
|
Cash and cash
equivalents
|
265,071 | 339,212 | 311,816 | 321,838 | 279,011 | 285,680 | 310,514 | 204,246 | 229,778 | 305,195 | 291,619 | |||||||||||||||||||||||||||||||||
|
Earning
assets
|
4,991,557 | 5,088,452 | 5,018,358 | 5,125,509 | 5,183,773 | 5,405,357 | 5,613,934 | 7,083,573 | 7,661,173 | 5,032,691 | 5,399,446 | |||||||||||||||||||||||||||||||||
|
Balance sheet
mark-to-market adjustments
|
39,123 | 51,493 | 52,629 | 49,828 | (54,880 | ) | (80,035 | ) | (60,464 | ) | (76,981 | ) | (66,491 | ) | 47,699 | (65,106 | ) | |||||||||||||||||||||||||||
|
Earning assets
- reported value
|
5,030,680 | 5,139,945 | 5,070,987 | 5,175,337 | 5,128,893 | 5,325,322 | 5,553,470 | 7,006,592 | 7,594,682 | 5,080,390 | 5,334,340 | |||||||||||||||||||||||||||||||||
|
Other
assets
|
130,818 | 123,785 | 148,649 | 118,550 | 9,900 | (9,680 | ) | 22,148 | 33,714 | 53,420 | 134,352 | 7,411 | ||||||||||||||||||||||||||||||||
|
Total
assets
|
$ | 5,161,498 | $ | 5,263,730 | $ | 5,219,636 | $ | 5,293,887 | $ | 5,138,793 | $ | 5,315,643 | $ | 5,575,619 | $ | 7,040,306 | $ | 7,648,102 | $ | 5,214,742 | $ | 5,341,751 | ||||||||||||||||||||||
|
Short-term
debt
|
$ | - | $ | 7,920 | $ | - | $ | - | $ | - | $ | - | $ | - | $ | 975 | $ | 7,825 | $ | 2,640 | $ | - | ||||||||||||||||||||||
|
Pre-2010 Sequoia
ABS issued
|
3,439,201 | 3,518,773 | 3,589,269 | 3,666,201 | 3,765,292 | 4,211,937 | 4,460,951 | 5,804,702 | 6,040,634 | 3,515,198 | 4,143,512 | |||||||||||||||||||||||||||||||||
|
New Sequoia
ABS issued
|
184,615 | 144,201 | - | - | - | - | - | - | - | 110,282 | - | |||||||||||||||||||||||||||||||||
|
Acacia ABS
issued
|
254,244 | 268,715 | 288,241 | 288,041 | 283,996 | 285,698 | 325,392 | 652,398 | 900,611 | 270,276 | 298,210 | |||||||||||||||||||||||||||||||||
|
Other
liabilities
|
126,428 | 164,764 | 200,096 | 231,553 | 91,027 | 66,588 | 55,487 | 32,533 | (22,524 | ) | 163,493 | 71,164 | ||||||||||||||||||||||||||||||||
|
Long-term
debt
|
138,620 | 138,383 | 138,145 | 137,907 | 139,190 | 147,430 | 147,193 | 146,944 | 146,705 | 138,384 | 144,575 | |||||||||||||||||||||||||||||||||
|
Total
liabilities
|
4,143,108 | 4,242,755 | 4,215,751 | 4,323,702 | 4,279,505 | 4,711,653 | 4,989,023 | 6,637,552 | 7,073,251 | 4,200,272 | 4,657,461 | |||||||||||||||||||||||||||||||||
|
Noncontrolling
interest
|
15,018 | 15,763 | 18,535 | 24,322 | 26,061 | 28,330 | 29,735 | 31,251 | 41,096 | 16,426 | 28,029 | |||||||||||||||||||||||||||||||||
|
Core equity
(1)
|
964,249 | 953,720 | 932,721 | 896,034 | 888,107 | 655,695 | 617,325 | 448,484 | 600,246 | 950,345 | 721,368 | |||||||||||||||||||||||||||||||||
|
Accumulated
other comprehensive income (loss)
|
39,123 | 51,493 | 52,629 | 49,829 | (54,880 | ) | (80,035 | ) | (60,464 | ) | (76,981 | ) | (66,491 | ) | 47,699 | (65,106 | ) | |||||||||||||||||||||||||||
|
Total
equity
|
1,003,372 | 1,005,212 | 985,350 | 945,863 | 833,227 | 575,661 | 556,861 | 371,503 | 533,755 | 998,044 | 656,262 | |||||||||||||||||||||||||||||||||
|
Total
liabilities and equity
|
$ | 5,161,498 | $ | 5,263,730 | $ | 5,219,636 | $ | 5,293,887 | $ | 5,138,793 | $ | 5,315,643 | $ | 5,575,619 | $ | 7,040,306 | $ | 7,648,102 | $ | 5,214,742 | $ | 5,341,751 | ||||||||||||||||||||||
|
THE
REDWOOD REVIEW 3RD QUARTER 2010
|
Table 6:
Average Balance Sheet
|
53
|
|
|
|
|
Table 7:
Balances & Yields by Securities Portfolio at Redwood ($ in thousands)
(1)
|
54
|
|
2010
|
2010
|
2010
|
2009
|
2009
|
2009
|
2009
|
2010
|
2010
|
2010
|
2009
|
2009
|
2009
|
2009
|
|||||||||||||||||||||||||||||||||||||||||||||
|
Q3
|
Q2
|
Q1
|
Q4
|
Q3
|
Q2
|
Q1
|
Q3
|
Q2
|
Q1
|
Q4
|
Q3
|
Q2
|
Q1
|
|||||||||||||||||||||||||||||||||||||||||||||
|
Residential
Prime Senior AFS
|
Residential
Non-Prime Subordinate AFS
|
|||||||||||||||||||||||||||||||||||||||||||||||||||||||||
|
Current
face
|
$ | 368,191 | $ | 371,066 | $ | 450,647 | $ | 412,471 | $ | 431,289 | $ | 276,444 | $ | 160,009 |
Current
face
|
$ | 27,461 | $ | 32,443 | $ | 56,128 | $ | 71,963 | $ | 143,357 | $ | 210,475 | $ | 307,754 | |||||||||||||||||||||||||||||
|
Unamortized
discount
|
(88,978 | ) | (93,502 | ) | (113,757 | ) | (116,801 | ) | (124,295 | ) | (91,221 | ) | (64,884 | ) |
Unamortized
(discount) premium
|
(7,279 | ) | (7,558 | ) | (2,742 | ) | (242 | ) | (1,524 | ) | 852 | 227 | |||||||||||||||||||||||||||||||
|
Credit
reserve
|
(12,822 | ) | (10,084 | ) | (14,637 | ) | (9,898 | ) | (11,069 | ) | (3,486 | ) | (621 | ) |
Credit
reserve
|
(11,323 | ) | (15,775 | ) | (47,805 | ) | (70,806 | ) | (140,046 | ) | (208,839 | ) | (305,422 | ) | |||||||||||||||||||||||||||||
|
Unrealized
gains (losses), net
|
49,543 | 42,222 | 49,887 | 43,436 | 40,734 | 1,729 | (6,738 | ) |
Unrealized
gains (losses), net
|
953 | 732 | 772 | 162 | (806 | ) | 473 | 1,705 | |||||||||||||||||||||||||||||||||||||||||
|
Fair
value
|
$ | 315,934 | $ | 309,702 | $ | 372,140 | $ | 329,208 | $ | 336,659 | $ | 183,466 | $ | 87,766 |
Fair
value
|
$ | 9,812 | $ | 9,842 | $ | 6,353 | $ | 1,077 | $ | 981 | $ | 2,961 | $ | 4,264 | |||||||||||||||||||||||||||||
|
Average
amortized cost
|
$ | 270,286 | $ | 278,472 | $ | 283,477 | $ | 280,101 | $ | 264,773 | $ | 164,386 | $ | 77,602 |
Average
amortized cost
|
$ | 8,988 | $ | 7,519 | $ | 4,047 | $ | 1,156 | $ | 1,994 | $ | 2,503 | $ | 3,149 | |||||||||||||||||||||||||||||
|
Interest
income
|
$ | 7,617 | $ | 7,868 | $ | 8,455 | $ | 8,610 | $ | 8,431 | $ | 5,475 | $ | 2,798 |
Interest
income
|
$ | 545 | $ | 603 | $ | 129 | $ | 8 | $ | 392 | $ | 1,615 | $ | 3,911 | |||||||||||||||||||||||||||||
|
Annualized
yield
|
11.27 | % | 11.30 | % | 11.93 | % | 12.30 | % | 12.74 | % | 13.32 | % | 14.42 | % |
Annualized
yield
|
24.25 | % | 32.10 | % | 12.75 | % | 2.67 | % | 78.65 | % | 258.13 | % | 496.86 | % | |||||||||||||||||||||||||||||
|
Residential
Non-Prime Senior AFS
|
Commercial
Subordinate AFS
|
|||||||||||||||||||||||||||||||||||||||||||||||||||||||||
|
Current
face
|
$ | 431,143 | $ | 399,988 | $ | 471,894 | $ | 423,961 | $ | 395,311 | $ | 387,431 | $ | 173,962 |
Current
face
|
$ | 109,275 | $ | 140,547 | $ | 152,408 | $ | 158,997 | $ | 486,245 | $ | 506,746 | $ | 512,117 | |||||||||||||||||||||||||||||
|
Unamortized
discount
|
(111,709 | ) | (110,018 | ) | (133,479 | ) | (133,995 | ) | (132,036 | ) | (133,753 | ) | (69,015 | ) |
Unamortized
(discount) premium
|
(5,610 | ) | (5,534 | ) | (5,660 | ) | (5,130 | ) | (1,624 | ) | (120 | ) | 13,798 | ||||||||||||||||||||||||||||||
|
Credit
reserve
|
(14,193 | ) | (10,894 | ) | (13,830 | ) | (13,468 | ) | (10,098 | ) | (16,009 | ) | (4,159 | ) |
Credit
reserve
|
(96,657 | ) | (127,627 | ) | (139,320 | ) | (146,018 | ) | (471,957 | ) | (492,459 | ) | (497,784 | ) | |||||||||||||||||||||||||||||
|
Unrealized
gains (losses), net
|
27,588 | 24,559 | 24,556 | 32,371 | 23,322 | (7,410 | ) | (27,116 | ) |
Unrealized
gains (losses), net
|
904 | 224 | 1,448 | 1,351 | 4,169 | 1,502 | (5,216 | ) | ||||||||||||||||||||||||||||||||||||||||
|
Fair
value
|
$ | 332,829 | $ | 303,635 | $ | 349,141 | $ | 308,869 | $ | 276,499 | $ | 230,259 | $ | 73,672 |
Fair
value
|
$ | 7,912 | $ | 7,610 | $ | 8,876 | $ | 9,200 | $ | 16,833 | $ | 15,669 | $ | 22,915 | |||||||||||||||||||||||||||||
|
Average
amortized cost
|
$ | 297,197 | $ | 286,462 | $ | 292,210 | $ | 259,911 | $ | 269,501 | $ | 167,679 | $ | 86,599 |
Average
amortized cost
|
$ | 7,274 | $ | 7,417 | $ | 7,670 | $ | 8,090 | $ | 13,504 | $ | 25,006 | $ | 46,382 | |||||||||||||||||||||||||||||
|
Interest
income
|
$ | 8,583 | $ | 9,007 | $ | 10,208 | $ | 7,907 | $ | 10,374 | $ | 6,607 | $ | 3,311 |
Interest
income
|
$ | 2,135 | $ | 696 | $ | 716 | $ | 1,233 | $ | 2,192 | $ | 1,599 | $ | 500 | |||||||||||||||||||||||||||||
|
Annualized
yield
|
11.55 | % | 12.58 | % | 13.97 | % | 12.17 | % | 15.40 | % | 15.76 | % | 15.29 | % |
Annualized
yield
|
117.40 | % | 37.55 | % | 37.36 | % | 60.97 | % | 64.93 | % | 25.58 | % | 4.31 | % | |||||||||||||||||||||||||||||
|
Residential
Re-REMIC AFS
|
CDO
Subordinate AFS
|
|||||||||||||||||||||||||||||||||||||||||||||||||||||||||
|
Current
face
|
$ | 139,426 | $ | 139,426 | $ | 146,964 | $ | 255,975 | $ | 318,703 | $ | 236,070 | $ | - |
Current
face
|
$ | 14,786 | $ | 14,761 | $ | 14,736 | $ | 14,710 | $ | 14,683 | $ | 14,650 | $ | 14,616 | |||||||||||||||||||||||||||||
|
Unamortized
discount
|
(65,691 | ) | (68,049 | ) | (68,806 | ) | (109,807 | ) | (144,351 | ) | (134,621 | ) | - |
Unamortized
discount
|
(1,082 | ) | (1,083 | ) | (1,083 | ) | (1,082 | ) | (1,083 | ) | (1,082 | ) | (1,057 | ) | ||||||||||||||||||||||||||||||
|
Credit
reserve
|
(40,656 | ) | (37,962 | ) | (42,299 | ) | (81,726 | ) | (94,626 | ) | (45,874 | ) | - |
Credit
reserve
|
(13,704 | ) | (13,678 | ) | (13,653 | ) | (13,628 | ) | (13,600 | ) | (13,568 | ) | (13,534 | ) | ||||||||||||||||||||||||||||||
|
Unrealized
gains (losses), net
|
41,812 | 35,655 | 31,054 | 41,509 | 13,781 | (434 | ) | - |
Unrealized
gains, net
|
- | - | - | 25 | 25 | 25 | - | ||||||||||||||||||||||||||||||||||||||||||
|
Fair
value
|
$ | 74,891 | $ | 69,070 | $ | 66,913 | $ | 105,951 | $ | 93,507 | $ | 55,141 | $ | - |
Fair
value
|
$ | - | $ | - | $ | - | $ | 25 | $ | 25 | $ | 25 | $ | 25 | |||||||||||||||||||||||||||||
|
Average
amortized cost
|
$ | 33,250 | $ | 34,385 | $ | 45,852 | $ | 73,938 | $ | 69,980 | $ | 26,419 | $ | - |
Average
amortized cost
|
$ | - | $ | - | $ | - | $ | - | $ | - | $ | 21 | $ | 25 | |||||||||||||||||||||||||||||
|
Interest
income
|
$ | 1,458 | $ | 1,382 | $ | 1,925 | $ | 2,941 | $ | 3,110 | $ | 573 | $ | - |
Interest
income
|
$ | 8 | $ | 82 | $ | 12 | $ | 96 | $ | 24 | $ | 96 | $ | 10 | |||||||||||||||||||||||||||||
|
Annualized
yield
|
17.55 | % | 16.08 | % | 16.79 | % | 15.91 | % | 17.77 | % | 8.67 | % | - |
Annualized
yield
|
N/A | N/A | N/A | N/A | 12.97 | % | 25.09 | % | 153.66 | % | ||||||||||||||||||||||||||||||||||
|
Residential
Prime Subordinate AFS
|
Fair
Value Securities
|
|||||||||||||||||||||||||||||||||||||||||||||||||||||||||
|
Current
face
|
$ | 278,171 | $ | 297,932 | $ | 324,226 | $ | 347,848 | $ | 378,417 | $ | 411,166 | $ | 418,714 |
|
|||||||||||||||||||||||||||||||||||||||||||
|
Unamortized
discount
|
(23,488 | ) | (22,886 | ) | (23,310 | ) | (21,588 | ) | (22,597 | ) | (28,259 | ) | (87,196 | ) |
|
|||||||||||||||||||||||||||||||||||||||||||
|
Credit
reserve
|
(217,996 | ) | (240,357 | ) | (261,854 | ) | (282,813 | ) | (306,728 | ) | (319,653 | ) | (291,592 | ) |
|
|||||||||||||||||||||||||||||||||||||||||||
|
Unrealized
losses, net
|
(3,663 | ) | (18,665 | ) | (22,812 | ) | (24,256 | ) | (27,643 | ) | (37,112 | ) | (11,606 | ) |
|
|||||||||||||||||||||||||||||||||||||||||||
|
Fair
value
|
$ | 33,024 | $ | 16,024 | $ | 16,250 | $ | 19,191 | $ | 21,449 | $ | 26,142 | $ | 28,320 |
Fair
value
|
$ | 22,826 | $ | 18,464 | $ | 19,990 | $ | 7,842 | $ | 5,314 | $ | 3,810 | $ | 4,308 | |||||||||||||||||||||||||||||
|
Average
amortized cost
|
$ | 35,443 | $ | 37,731 | $ | 41,373 | $ | 46,637 | $ | 58,063 | $ | 42,353 | $ | 46,021 |
Average fair
value
|
$ | 20,539 | $ | 17,743 | $ | 20,494 | $ | 5,740 | $ | 3,905 | $ | 4,209 | $ | 2,316 | |||||||||||||||||||||||||||||
|
Interest
income
|
$ | 3,328 | $ | 3,219 | $ | 2,847 | $ | 3,406 | $ | 4,135 | $ | 3,703 | $ | 8,220 |
Interest
income
|
$ | 2,350 | $ | 2,559 | $ | 2,957 | $ | 1,102 | $ | 1,231 | $ | 872 | $ | 2,858 | |||||||||||||||||||||||||||||
|
Annualized
yield
|
37.55 | % | 34.13 | % | 27.53 | % | 29.21 | % | 28.49 | % | 34.97 | % | 71.44 | % |
Annualized
yield
|
45.76 | % | 57.68 | % | 57.72 | % | 76.79 | % | 126.12 | % | 82.86 | % | 493.71 | % | |||||||||||||||||||||||||||||
|
THE
REDWOOD REVIEW 3RD QUARTER 2010
|
Table
7: Balances & Yields by Securities Portfolio at
Redwood
|
|
|
|
|
|
Table
8: Securities Portfolio Activity at Redwood ($ in
thousands)
|
|
|
2010
|
2010
|
2010
|
2009
|
2009
|
2009
|
2009
|
2010
|
2010
|
2010
|
2009
|
2009
|
2009
|
2009
|
|||||||||||||||||||||||||||||||||||||||||||||
|
Q3
|
Q2
|
Q1
|
Q4
|
Q3
|
Q2
|
Q1
|
Q3
|
Q2
|
Q1
|
Q4
|
Q3
|
Q2
|
Q1
|
|||||||||||||||||||||||||||||||||||||||||||||
|
Residential
Prime Senior
|
Residential
Real Estate Loans
|
|||||||||||||||||||||||||||||||||||||||||||||||||||||||||
|
Beginning fair
value
|
$ | 309,702 | $ | 372,140 | $ | 329,208 | $ | 336,659 | $ | 183,466 | $ | 87,766 | $ | 50,965 |
Beginning fair
value
|
$ | 2,404 | $ | 2,227 | $ | 2,374 | $ | 2,299 | $ | 2,336 | $ | 2,577 | $ | 2,624 | |||||||||||||||||||||||||||||
|
Acquisitions
|
9,954 | 1,055 | 56,010 | 27,607 | 134,738 | 120,982 | 49,107 |
Principal
payments
|
62,135 | - | - | - | - | - | - | |||||||||||||||||||||||||||||||||||||||||||
|
Sales
|
- | (43,485 | ) | (8,780 | ) | (24,104 | ) | (5,091 | ) | (35,713 | ) | - |
(Premium)
discount amortization
|
(601 | ) | 46 | (27 | ) | (30 | ) | (28 | ) | (185 | ) | (27 | ) | ||||||||||||||||||||||||||||||||
|
Effect of
principal payments
|
(12,186 | ) | (13,065 | ) | (11,220 | ) | (13,632 | ) | (13,121 | ) | (6,499 | ) | (2,337 |
)
|
Transfers to
REO
|
(63 | ) | (165 | ) | - | - | - | - | - | ||||||||||||||||||||||||||||||||||
|
Change in fair
value, net
|
8,464 | (6,943 | ) | 6,922 | 2,678 | 36,667 | 16,930 | (9,969 |
)
|
Changes in
fair value, net
|
(388 | ) | 296 | (120 | ) | 105 | (9 | ) | (56 | ) | (20 | ) | ||||||||||||||||||||||||||||||||||||
|
Ending fair
value
|
$ | 315,934 | $ | 309,702 | $ | 372,140 | $ | 329,208 | $ | 336,659 | $ | 183,466 | $ | 87,766 |
Ending fair
value
|
$ | 63,487 | $ | 2,404 | $ | 2,227 | $ | 2,374 | $ | 2,299 | $ | 2,336 | $ | 2,577 | |||||||||||||||||||||||||||||
|
Residential
Non-Prime Senior
|
Commercial
Subordinate
|
|||||||||||||||||||||||||||||||||||||||||||||||||||||||||
|
Beginning fair
value
|
$ | 320,397 | $ | 367,372 | $ | 314,952 | $ | 279,000 | $ | 230,955 | $ | 74,383 | $ | 42,820 |
Beginning fair
value
|
$ | 7,610 | $ | 8,876 | $ | 9,200 | $ | 16,833 | $ | 15,669 | $ | 22,915 | $ | 42,490 | |||||||||||||||||||||||||||||
|
Acquisitions
|
32,777 | 16,113 | 118,195 | 37,157 | 84,837 | 162,745 | 48,444 |
Acquisitions
|
- | - | - | - | - | - | - | |||||||||||||||||||||||||||||||||||||||||||
|
Sales
|
- | (54,285 | ) | (49,361 | ) | - | (56,299 | ) | (14,613 | ) | (373 |
)
|
Sales
|
- | - | - | (4,778 | ) | - | - | - | |||||||||||||||||||||||||||||||||||||
|
Effect of
principal payments
|
(9,657 | ) | (12,582 | ) | (10,242 | ) | (10,214 | ) | (11,083 | ) | (5,128 | ) | (1,573 |
)
|
Effect of
principal payments
|
- | - | - | - | - | - | - | ||||||||||||||||||||||||||||||||||||
|
Change in fair
value, net
|
10,589 | 3,779 | (6,171 | ) | 9,009 | 30,590 | 13,568 | (14,935 |
)
|
Change in fair
value, net
|
302 | (1,266 | ) | (324 | ) | (2,855 | ) | 1,164 | (7,246 | ) | (19,575 | ) | ||||||||||||||||||||||||||||||||||||
|
Ending fair
value
|
$ | 354,106 | $ | 320,397 | $ | 367,372 | $ | 314,952 | $ | 279,000 | $ | 230,955 | $ | 74,383 |
Ending fair
value
|
$ | 7,912 | $ | 7,610 | $ | 8,876 | $ | 9,200 | $ | 16,833 | $ | 15,669 | $ | 22,915 | |||||||||||||||||||||||||||||
|
Re-REMIC
|
Commercial
Real Estate Loans
|
|||||||||||||||||||||||||||||||||||||||||||||||||||||||||
|
Beginning fair
value
|
$ | 69,070 | $ | 66,913 | $ | 105,951 | $ | 93,507 | $ | 55,141 | $ | - | $ | - |
Beginning fair
value
|
$ | 243 | $ | 244 | $ | 245 | $ | 246 | $ | 247 | $ | 248 | $ | 249 | |||||||||||||||||||||||||||||
|
Acquisitions
|
- | - | - | 3,367 | 25,073 | 55,562 | - |
Principal
payments
|
(2 | ) | (2 | ) | (2 | ) | (2 | ) | (2 | ) | (2 | ) | (2 | ) | ||||||||||||||||||||||||||||||||||||
|
Sales
|
- | (1,960 | ) | (27,932 | ) | (17,368 | ) | - | - | - |
Discount
amortization
|
1 | 1 | 1 | 1 | 1 | 1 | 1 | ||||||||||||||||||||||||||||||||||||||||
|
Effect of
principal payments
|
- | - | - | - | - | - | - |
Credit
provision
|
- | - | - | - | - | - | - | |||||||||||||||||||||||||||||||||||||||||||
|
Change in fair
value, net
|
5,821 | 4,117 | (11,106 | ) | 26,445 | 13,293 | (421 | ) | - |
Changes in
fair value, net
|
- | - | - | - | - | - | - | |||||||||||||||||||||||||||||||||||||||||
|
Ending fair
value
|
$ | 74,891 | $ | 69,070 | $ | 66,913 | $ | 105,951 | $ | 93,507 | $ | 55,141 | $ | - |
Ending fair
value
|
$ | 242 | $ | 243 | $ | 244 | $ | 245 | $ | 246 | $ | 247 | $ | 248 | |||||||||||||||||||||||||||||
|
Residential
Prime Subordinate
|
CDO
Subordinate
|
|||||||||||||||||||||||||||||||||||||||||||||||||||||||||
|
Beginning fair
value
|
$ | 16,406 | $ | 16,596 | $ | 19,510 | $ | 21,926 | $ | 26,742 | $ | 29,012 | $ | 43,787 |
Beginning fair
value
|
$ | 1,132 | $ | 1,222 | $ | 1,247 | $ | 2,137 | $ | 2,308 | $ | 2,657 | $ | 3,610 | |||||||||||||||||||||||||||||
|
Acquisitions
|
7,088 | 2,223 | - | - | 1,390 | 1,829 | - |
Acquisitions
|
- | - | - | - | - | - | - | |||||||||||||||||||||||||||||||||||||||||||
|
Sales
|
- | - | - | - | (1,409 | ) | - | - |
Sales
|
- | - | - | - | - | - | - | ||||||||||||||||||||||||||||||||||||||||||
|
Effect of
principal payments
|
883 | (474 | ) | (415 | ) | (526 | ) | (880 | ) | (1,050 | ) | (946 |
)
|
Effect of
principal payments
|
- | - | - | - | - | - | (37 | ) | ||||||||||||||||||||||||||||||||||||
|
Change in fair
value, net
|
9,007 | (1,939 | ) | (2,499 | ) | (1,890 | ) | (3,917 | ) | (3,049 | ) | (13,829 |
)
|
Change in fair
value, net
|
(172 | ) | (90 | ) | (25 | ) | (890 | ) | (171 | ) | (349 | ) | (916 | ) | ||||||||||||||||||||||||||||||
|
Ending fair
value
|
$ | 33,384 | $ | 16,406 | $ | 16,596 | $ | 19,510 | $ | 21,926 | $ | 26,742 | $ | 29,012 |
Ending fair
value
|
$ | 960 | $ | 1,132 | $ | 1,222 | $ | 1,247 | $ | 2,137 | $ | 2,308 | $ | 2,657 | |||||||||||||||||||||||||||||
|
|
||||||||||||||||||||||||||||||||||||||||||||||||||||||||||
|
Residential
Non-Prime Subordinate
|
||||||||||||||||||||||||||||||||||||||||||||||||||||||||||
|
Beginning fair
value
|
$ | 10,030 | $ | 6,544 | $ | 1,295 | $ | 1,205 | $ | 3,192 | $ | 4,537 | $ | 7,313 | ||||||||||||||||||||||||||||||||||||||||||||
|
Acquisitions
|
- | 3,894 | 5,472 | - | - | - | - | |||||||||||||||||||||||||||||||||||||||||||||||||||
|
Sales
|
- | - | - | - | - | - | - | |||||||||||||||||||||||||||||||||||||||||||||||||||
|
Effect of
principal payments
|
(320 | ) | (352 | ) | (111 | ) | (25 | ) | (38 | ) | (67 | ) | (98 |
)
|
||||||||||||||||||||||||||||||||||||||||||||
|
Change in fair
value, net
|
331 | (56 | ) | (112 | ) | 115 | (1,949 | ) | (1,278 | ) | (2,678 |
)
|
||||||||||||||||||||||||||||||||||||||||||||||
|
Ending fair
value
|
$ | 10,041 | $ | 10,030 | $ | 6,544 | $ | 1,295 | $ | 1,205 | $ | 3,192 | $ | 4,537 | ||||||||||||||||||||||||||||||||||||||||||||
|
THE
REDWOOD REVIEW 3RD QUARTER 2010
|
Table 8:
Securities Portfolio Activity at Redwood
|
55
|
|
|
|
|
Table
9A: Residential Prime Securities at Redwood and Underlying Loan
Characteristics ($
in thousands)
|
56
|
|
2010
|
2010
|
2010
|
2009
|
2009
|
2009
|
2009
|
2010
|
2010
|
2010
|
2009
|
2009
|
2009
|
2009
|
|||||||||||||||||||||||||||||||||||||||||||||
|
Q3
|
Q2
|
Q1
|
Q4
|
Q3
|
Q2
|
Q1
|
Q3
|
Q2
|
Q1
|
Q4
|
Q3
|
Q2
|
Q1
|
|||||||||||||||||||||||||||||||||||||||||||||
|
Residential
Senior Prime
|
||||||||||||||||||||||||||||||||||||||||||||||||||||||||||
|
Principal
value
|
$ | 368,191 | $ | 371,066 | $ | 450,647 | $ | 412,471 | $ | 431,289 | $ | 276,444 | $ | 160,009 |
Southern
CA
|
25 | % | 25 | % | 25 | % | 25 | % | 27 | % | 24 | % | 24 | % | |||||||||||||||||||||||||||||
|
Unamortized
discount
|
(88,978 | ) | (93,502 | ) | (113,757 | ) | (116,801 | ) | (124,295 | ) | (91,221 | ) | (64,884 | ) |
Northern
CA
|
22 | % | 22 | % | 22 | % | 22 | % | 20 | % | 23 | % | 23 | % | |||||||||||||||||||||||||||||
|
Credit
reserve
|
(12,822 | ) | (10,084 | ) | (14,637 | ) | (9,898 | ) | (11,069 | ) | (3,486 | ) | (621 | ) |
New
York
|
7 | % | 6 | % | 7 | % | 7 | % | 6 | % | 7 | % | 7 | % | |||||||||||||||||||||||||||||
|
Unrealized
gains (losses)
|
49,543 | 42,222 | 49,887 | 43,436 | 40,734 | 1,729 | (6,738 | ) |
Florida
|
6 | % | 6 | % | 6 | % | 6 | % | 7 | % | 5 | % | 5 | % | |||||||||||||||||||||||||||||||||||
|
Fair
value
|
$ | 315,934 | $ | 309,702 | $ | 372,140 | $ | 329,208 | $ | 336,659 | $ | 183,466 | $ | 87,766 |
Virginia
|
4 | % | 4 | % | 4 | % | 4 | % | 2 | % | 4 | % | 4 | % | |||||||||||||||||||||||||||||
|
Fair value /
principal value
|
86 | % | 83 | % | 83 | % | 80 | % | 78 | % | 66 | % | 55 | % |
New
Jersey
|
3 | % | 3 | % | 3 | % | 3 | % | 3 | % | 3 | % | 3 | % | |||||||||||||||||||||||||||||
|
Illinois
|
3 | % | 3 | % | 3 | % | 3 | % | 2 | % | 3 | % | 3 | % | ||||||||||||||||||||||||||||||||||||||||||||
|
Security
Type
|
Georgia
|
2 | % | 2 | % | 2 | % | 2 | % | 2 | % | 2 | % | 2 | % | |||||||||||||||||||||||||||||||||||||||||||
|
ARM
|
$ | - | $ | - | $ | - | $ | - | $ | - | $ | - | $ | - |
Texas
|
2 | % | 2 | % | 2 | % | 2 | % | 3 | % | 2 | % | 2 | % | |||||||||||||||||||||||||||||
|
Hybrid
|
273,281 | 272,866 | 333,760 | 298,245 | 306,402 | 175,940 | 86,282 |
Arizona
|
2 | % | 2 | % | 2 | % | 2 | % | 2 | % | 2 | % | 2 | % | ||||||||||||||||||||||||||||||||||||
|
Fixed
|
42,653 | 36,836 | 38,380 | 30,963 | 30,257 | 7,526 | 1,484 |
Colorado
|
2 | % | 2 | % | 2 | % | 2 | % | 4 | % | 2 | % | 2 | % | ||||||||||||||||||||||||||||||||||||
|
Total fair
value
|
$ | 315,934 | $ | 309,702 | $ | 372,140 | $ | 329,208 | $ | 336,659 | $ | 183,466 | $ | 87,766 |
Other
states
|
22 | % | 23 | % | 22 | % | 22 | % | 22 | % | 23 | % | 23 | % | |||||||||||||||||||||||||||||
|
Residential
Senior Prime
|
Wtd Avg
Original LTV
|
68 | % | 68 | % | 68 | % | 68 | % | 68 | % | 68 | % | 68 | % | |||||||||||||||||||||||||||||||||||||||||||
|
Coupon
income
|
$ | 3,989 | $ | 4,356 | $ | 4,870 | $ | 5,057 | $ | 4,743 | $ | 3,066 | $ | 1,733 |
Original LTV:
0 - 50
|
13 | % | 13 | % | 13 | % | 13 | % | 13 | % | 13 | % | 13 | % | |||||||||||||||||||||||||||||
|
Discount
amortization
|
3,628 | 3,512 | 3,585 | 3,553 | 3,688 | 2,410 | 1,128 |
Original LTV:
50.01 - 60
|
11 | % | 12 | % | 11 | % | 11 | % | 12 | % | 12 | % | 12 | % | ||||||||||||||||||||||||||||||||||||
|
Total interest
income
|
$ | 7,617 | $ | 7,868 | $ | 8,455 | $ | 8,610 | $ | 8,431 | $ | 5,476 | $ | 2,861 |
Original LTV:
60.01 - 70
|
22 | % | 22 | % | 22 | % | 22 | % | 22 | % | 22 | % | 22 | % | |||||||||||||||||||||||||||||
|
Original LTV:
70.01 - 80
|
49 | % | 50 | % | 51 | % | 50 | % | 50 | % | 49 | % | 49 | % | ||||||||||||||||||||||||||||||||||||||||||||
|
Average
amortized cost
|
$ | 270,286 | $ | 278,472 | $ | 283,477 | $ | 280,101 | $ | 264,773 | $ | 164,386 | $ | 77,602 |
Original LTV:
80.01 - 90
|
3 | % | 2 | % | 2 | % | 2 | % | 2 | % | 2 | % | 2 | % | |||||||||||||||||||||||||||||
|
Original LTV:
90.01 - 100
|
2 | % | 1 | % | 1 | % | 1 | % | 1 | % | 1 | % | 1 | % | ||||||||||||||||||||||||||||||||||||||||||||
|
Coupon income
%
|
5.90 | % | 6.26 | % | 6.87 | % | 7.22 | % | 7.17 | % | 7.46 | % | 8.93 | % |
Unknown
|
0 | % | 0 | % | 0 | % | 1 | % | 0 | % | 1 | % | 1 | % | |||||||||||||||||||||||||||||
|
Discount
amortization %
|
5.37 | % | 5.04 | % | 5.06 | % | 5.07 | % | 5.57 | % | 5.86 | % | 5.81 | % | ||||||||||||||||||||||||||||||||||||||||||||
|
Annualized
yield
|
11.27 | % | 11.30 | % | 11.93 | % | 12.30 | % | 12.74 | % | 13.32 | % | 14.75 | % |
Wtd Avg
FICO
|
738 | 739 | 740 | 740 | 740 | 741 | 741 | ||||||||||||||||||||||||||||||||||||
|
FICO: <=
600
|
0 | % | 0 | % | 0 | % | 0 | % | 0 | % | 0 | % | 0 | % | ||||||||||||||||||||||||||||||||||||||||||||
|
Residential
Subordinate Prime
|
FICO: 601 -
620
|
0 | % | 0 | % | 0 | % | 0 | % | 0 | % | 0 | % | 0 | % | |||||||||||||||||||||||||||||||||||||||||||
|
Principal
value
|
$ | 278,417 | $ | 298,707 | $ | 324,045 | $ | 348,678 | $ | 379,276 | $ | 412,052 | $ | 419,631 |
FICO: 621 -
640
|
1 | % | 1 | % | 1 | % | 1 | % | 1 | % | 1 | % | 1 | % | |||||||||||||||||||||||||||||
|
Unamortized
discount
|
(23,374 | ) | (23,279 | ) | (23,783 | ) | (22,099 | ) | (22,979 | ) | (28,545 | ) | (87,421 | ) |
FICO: 641 -
660
|
2 | % | 2 | % | 2 | % | 2 | % | 2 | % | 2 | % | 2 | % | |||||||||||||||||||||||||||||
|
Credit
reserve
|
(217,996 | ) | (240,357 | ) | (261,854 | ) | (282,813 | ) | (306,728 | ) | (319,653 | ) | (291,592 | ) |
FICO: 661 -
680
|
5 | % | 5 | % | 5 | % | 5 | % | 5 | % | 5 | % | 5 | % | |||||||||||||||||||||||||||||
|
Unrealized
loss
|
(3,663 | ) | (18,665 | ) | (22,812 | ) | (24,256 | ) | (27,643 | ) | (37,112 | ) | (11,606 | ) |
FICO: 681 -
700
|
10 | % | 9 | % | 9 | % | 9 | % | 9 | % | 9 | % | 9 | % | |||||||||||||||||||||||||||||
|
Fair
value
|
$ | 33,384 | $ | 16,406 | $ | 16,596 | $ | 19,510 | $ | 21,926 | $ | 26,742 | $ | 29,012 |
FICO: 701 -
720
|
14 | % | 14 | % | 14 | % | 14 | % | 14 | % | 13 | % | 13 | % | |||||||||||||||||||||||||||||
|
Fair value /
principal value
|
12 | % | 5 | % | 5 | % | 6 | % | 6 | % | 6 | % | 7 | % |
FICO: 721 -
740
|
15 | % | 15 | % | 14 | % | 14 | % | 14 | % | 14 | % | 14 | % | |||||||||||||||||||||||||||||
|
FICO: 741 -
760
|
16 | % | 16 | % | 16 | % | 16 | % | 16 | % | 16 | % | 16 | % | ||||||||||||||||||||||||||||||||||||||||||||
|
Security
Type
|
FICO: 761 -
780
|
19 | % | 19 | % | 19 | % | 19 | % | 19 | % | 19 | % | 19 | % | |||||||||||||||||||||||||||||||||||||||||||
|
ARM
|
$ | 5,526 | $ | 3,262 | $ | 1,164 | $ | 1,202 | $ | 1,301 | $ | 1,413 | $ | 1,736 |
FICO: 781 -
800
|
13 | % | 13 | % | 14 | % | 14 | % | 14 | % | 15 | % | 15 | % | |||||||||||||||||||||||||||||
|
Hybrid
|
18,695 | 8,884 | 10,334 | 13,028 | 14,780 | 18,544 | 20,325 |
FICO: >=
801
|
3 | % | 3 | % | 4 | % | 4 | % | 4 | % | 4 | % | 4 | % | ||||||||||||||||||||||||||||||||||||
|
Fixed
|
9,163 | 4,260 | 5,098 | 5,280 | 5,845 | 6,785 | 6,951 |
Unknown
|
2 | % | 3 | % | 2 | % | 2 | % | 2 | % | 2 | % | 2 | % | ||||||||||||||||||||||||||||||||||||
|
Total fair
value
|
$ | 33,384 | $ | 16,406 | $ | 16,596 | $ | 19,510 | $ | 21,926 | $ | 26,742 | $ | 29,012 | ||||||||||||||||||||||||||||||||||||||||||||
|
Conforming balance % (2)
|
58 | % | 58 | % | 57 | % | 58 | % | 59 | % | 59 | % | 60 | % | ||||||||||||||||||||||||||||||||||||||||||||
|
Residential
Subordinate Prime
|
> $1 MM
%
|
9 | % | 9 | % | 9 | % | 9 | % | 8 | % | 8 | % | 8 | % | |||||||||||||||||||||||||||||||||||||||||||
|
Coupon
income
|
$ | 2,910 | $ | 3,201 | $ | 3,172 | $ | 3,972 | $ | 4,698 | $ | 5,155 | $ | 5,615 | ||||||||||||||||||||||||||||||||||||||||||||
|
Discount
(premium) amortization
|
495 | 96 | (228 | ) | (439 | ) | (399 | ) | (1,248 | ) | 2,887 |
2nd Home
%
|
7 | % | 7 | % | 7 | % | 7 | % | 7 | % | 7 | % | 7 | % | ||||||||||||||||||||||||||||||||
|
Total interest
income
|
$ | 3,405 | $ | 3,297 | $ | 2,944 | $ | 3,533 | $ | 4,299 | $ | 3,907 | $ | 8,502 |
Investment
Home %
|
2 | % | 2 | % | 2 | % | 2 | % | 2 | % | 2 | % | 1 | % | |||||||||||||||||||||||||||||
|
Average
amortized cost
|
$ | 35,794 | $ | 38,079 | $ | 41,701 | $ | 46,637 | $ | 58,063 | $ | 42,353 | $ | 46,021 | ||||||||||||||||||||||||||||||||||||||||||||
|
Purchase
|
43 | % | 43 | % | 45 | % | 44 | % | 44 | % | 44 | % | 44 | % | ||||||||||||||||||||||||||||||||||||||||||||
|
Coupon income
%
|
32.52 | % | 33.62 | % | 30.43 | % | 34.07 | % | 32.37 | % | 48.69 | % | 48.81 | % |
Cash Out
Refi
|
22 | % | 22 | % | 22 | % | 22 | % | 22 | % | 21 | % | 21 | % | |||||||||||||||||||||||||||||
|
Discount
(premium) amortization %
|
5.53 | % | 1.01 | % | (2.19 | %) | (3.76 | %) | (2.75 | %) | (11.79 | %) | 25.09 | % |
Rate-Term
Refi
|
34 | % | 34 | % | 33 | % | 33 | % | 33 | % | 34 | % | 34 | % | |||||||||||||||||||||||||||||
|
Annualized
yield
|
38.05 | % | 34.63 | % | 28.24 | % | 30.30 | % | 29.62 | % | 36.90 | % | 73.90 | % |
Construction
|
0 | % | 0 | % | 0 | % | 0 | % | 0 | % | 0 | % | 0 | % | |||||||||||||||||||||||||||||
|
Other
|
1 | % | 1 | % | 0 | % | 1 | % | 1 | % | 1 | % | 1 | % | ||||||||||||||||||||||||||||||||||||||||||||
|
Underlying Prime Loan Characteristics (1)
|
||||||||||||||||||||||||||||||||||||||||||||||||||||||||||
|
Full
Doc
|
50 | % | 55 | % | 55 | % | 55 | % | 55 | % | 56 | % | 55 | % | ||||||||||||||||||||||||||||||||||||||||||||
|
Number of
loans
|
124,536 | 140,951 | 156,375 | 168,449 | 184,849 | 201,789 | 216,362 |
No
Doc
|
5 | % | 5 | % | 5 | % | 5 | % | 5 | % | 4 | % | 4 | % | ||||||||||||||||||||||||||||||||||||
|
Total loan
face
|
$ | 52,490,472 | $ | 59,814,476 | $ | 71,413,439 | $ | 76,332,218 | $ | 84,519,707 | $ | 92,121,182 | $ | 98,573,943 |
Other Doc
(Lim, Red, Stated, etc)
|
42 | % | 38 | % | 37 | % | 37 | % | 37 | % | 37 | % | 38 | % | |||||||||||||||||||||||||||||
|
Average loan
size
|
$ | 421 | $ | 424 | $ | 457 | $ | 453 | $ | 457 | $ | 457 | $ | 456 |
Unknown/Not
Categorized
|
3 | % | 2 | % | 3 | % | 3 | % | 3 | % | 3 | % | 3 | % | |||||||||||||||||||||||||||||
|
Year 2008
origination
|
0 | % | 0 | % | 0 | % | 1 | % | 0 | % | 0 | % | 0 | % |
2-4
Family
|
1 | % | 1 | % | 2 | % | 2 | % | 1 | % | 1 | % | 1 | % | |||||||||||||||||||||||||||||
|
Year 2007
origination
|
11 | % | 7 | % | 10 | % | 10 | % | 9 | % | 9 | % | 9 | % |
Condo
|
10 | % | 10 | % | 10 | % | 10 | % | 10 | % | 10 | % | 10 | % | |||||||||||||||||||||||||||||
|
Year 2006
origination
|
11 | % | 14 | % | 12 | % | 12 | % | 12 | % | 12 | % | 14 | % |
Single
Family
|
88 | % | 87 | % | 87 | % | 87 | % | 88 | % | 88 | % | 88 | % | |||||||||||||||||||||||||||||
|
Year 2005
origination
|
16 | % | 20 | % | 21 | % | 19 | % | 20 | % | 19 | % | 17 | % |
Other
|
1 | % | 1 | % | 1 | % | 1 | % | 1 | % | 1 | % | 1 | % | |||||||||||||||||||||||||||||
|
Year 2004
origination and earlier
|
62 | % | 59 | % | 57 | % | 58 | % | 59 | % | 60 | % | 60 | % | ||||||||||||||||||||||||||||||||||||||||||||
|
THE
REDWOOD REVIEW 3RD QUARTER 2010
|
Table
9A: Residential Prime Securities at Redwood and Underlying Loan
Characteristics
|
|||
|
|
|
|
Table
9B: Residential Non-Prime Securities at Redwood and Underlying Loan
Characteristics ($
in thousands)
|
|
|
2010
|
2010
|
2010
|
2009
|
2009
|
2009
|
2009
|
2010
|
2010
|
2010
|
2009
|
2009
|
2009
|
2009
|
|||||||||||||||||||||||||||||||||||||||||||||
|
Q3
|
Q2
|
Q1
|
Q4
|
Q3
|
Q2
|
Q1
|
Q3
|
Q2
|
Q1
|
Q4
|
Q3
|
Q2
|
Q1
|
|||||||||||||||||||||||||||||||||||||||||||||
|
Residential
Senior Non-Prime
|
||||||||||||||||||||||||||||||||||||||||||||||||||||||||||
|
Principal
value
|
$ | 431,143 | $ | 401,049 | $ | 475,950 | $ | 430,698 | $ | 403,675 | $ | 396,135 | $ | 182,851 |
Southern
CA
|
21 | % | 22 | % | 23 | % | 25 | % | 26 | % | 25 | % | 27 | % | |||||||||||||||||||||||||||||
|
Unamortized
discount
|
(111,709 | ) | (94,316 | ) | (119,303 | ) | (134,649 | ) | (137,899 | ) | (141,761 | ) | (77,193 | ) |
Northern
CA
|
14 | % | 14 | % | 17 | % | 18 | % | 16 | % | 18 | % | 19 | % | |||||||||||||||||||||||||||||
|
Credit
reserve
|
(14,193 | ) | (10,894 | ) | (13,830 | ) | (13,468 | ) | (10,098 | ) | (16,009 | ) | (4,159 | ) |
Florida
|
9 | % | 9 | % | 8 | % | 8 | % | 9 | % | 9 | % | 10 | % | |||||||||||||||||||||||||||||
|
Unrealized
gains (losses)
|
27,588 | 24,559 | 24,556 | 32,371 | 23,322 | (7,410 | ) | (27,116 | ) |
New
York
|
5 | % | 5 | % | 5 | % | 5 | % | 5 | % | 5 | % | 5 | % | ||||||||||||||||||||||||||||||||||
|
Fair
value
|
$ | 332,829 | $ | 320,398 | $ | 367,373 | $ | 314,952 | $ | 279,000 | $ | 230,955 | $ | 74,383 |
Arizona
|
4 | % | 4 | % | 3 | % | 3 | % | 4 | % | 3 | % | 3 | % | |||||||||||||||||||||||||||||
|
Fair value /
principal value
|
77 | % | 80 | % | 77 | % | 73 | % | 69 | % | 58 | % | 41 | % |
New
Jersey
|
3 | % | 4 | % | 3 | % | 4 | % | 2 | % | 4 | % | 4 | % | |||||||||||||||||||||||||||||
|
Virginia
|
3 | % | 3 | % | 3 | % | 3 | % | 2 | % | 3 | % | 3 | % | ||||||||||||||||||||||||||||||||||||||||||||
|
Security
Type
|
Georgia
|
2 | % | 2 | % | 2 | % | 2 | % | 3 | % | 2 | % | 1 | % | |||||||||||||||||||||||||||||||||||||||||||
|
ARM
|
$ | 4,721 | $ | 5,467 | $ | 5,806 | $ | 2,015 | $ | - | $ | - | $ | - |
Texas
|
3 | % | 3 | % | 3 | % | 2 | % | 2 | % | 2 | % | 1 | % | |||||||||||||||||||||||||||||
|
Option
ARM
|
12,813 | 12,408 | 28,891 | 26,004 | 25,747 | 18,586 | 17,796 |
Illinois
|
3 | % | 3 | % | 2 | % | 2 | % | 2 | % | 2 | % | 3 | % | ||||||||||||||||||||||||||||||||||||
|
Hybrid
|
117,887 | 118,199 | 122,084 | 160,494 | 154,998 | 158,886 | 50,616 |
Colorado
|
3 | % | 3 | % | 3 | % | 2 | % | 3 | % | 2 | % | 2 | % | ||||||||||||||||||||||||||||||||||||
|
Fixed
|
197,408 | 184,324 | 210,592 | 126,439 | 98,255 | 53,483 | 5,971 |
Other
states
|
30 | % | 30 | % | 28 | % | 26 | % | 26 | % | 25 | % | 22 | % | ||||||||||||||||||||||||||||||||||||
|
Total fair
value
|
$ | 332,829 | $ | 320,398 | $ | 367,373 | $ | 314,952 | $ | 279,000 | $ | 230,955 | $ | 74,383 | ||||||||||||||||||||||||||||||||||||||||||||
|
Wtd Avg
Original LTV
|
73 | % | 73 | % | 73 | % | 73 | % | 74 | % | 74 | % | 74 | % | ||||||||||||||||||||||||||||||||||||||||||||
|
Residential
Senior Non-Prime
|
Original LTV:
0 - 50
|
7 | % | 7 | % | 6 | % | 5 | % | 5 | % | 5 | % | 5 | % | |||||||||||||||||||||||||||||||||||||||||||
|
Coupon
income
|
$ | 4,819 | $ | 5,016 | $ | 5,994 | $ | 4,000 | $ | 4,156 | $ | 2,871 | $ | 1,251 |
Original LTV:
50.01 - 60
|
8 | % | 8 | % | 8 | % | 8 | % | 7 | % | 7 | % | 7 | % | |||||||||||||||||||||||||||||
|
Discount
amortization
|
5,989 | 6,410 | 7,017 | 4,489 | 6,357 | 3,865 | 2,194 |
Original LTV:
60.01 - 70
|
18 | % | 18 | % | 18 | % | 19 | % | 17 | % | 17 | % | 18 | % | ||||||||||||||||||||||||||||||||||||
|
Total interest
income
|
$ | 10,808 | $ | 11,426 | $ | 13,011 | $ | 8,489 | $ | 10,513 | $ | 6,736 | $ | 3,445 |
Original LTV:
70.01 - 80
|
58 | % | 58 | % | 58 | % | 59 | % | 59 | % | 59 | % | 60 | % | |||||||||||||||||||||||||||||
|
Original LTV:
80.01 - 90
|
6 | % | 6 | % | 7 | % | 6 | % | 8 | % | 8 | % | 7 | % | ||||||||||||||||||||||||||||||||||||||||||||
|
Average
amortized cost
|
$ | 297,197 | $ | 302,461 | $ | 310,948 | $ | 263,022 | $ | 270,353 | $ | 168,383 | $ | 87,464 |
Original LTV:
90.01 - 100
|
3 | % | 3 | % | 3 | % | 3 | % | 4 | % | 4 | % | 3 | % | |||||||||||||||||||||||||||||
|
Unknown
|
0 | % | 0 | % | 0 | % | 0 | % | 0 | % | 0 | % | 0 | % | ||||||||||||||||||||||||||||||||||||||||||||
|
Coupon income
%
|
6.49 | % | 6.63 | % | 7.71 | % | 6.08 | % | 6.15 | % | 6.82 | % | 5.72 | % | ||||||||||||||||||||||||||||||||||||||||||||
|
Discount
amortization %
|
8.06 | % | 8.48 | % | 9.03 | % | 6.83 | % | 9.41 | % | 9.18 | % | 10.03 | % |
Wtd Avg
FICO
|
711 | 711 | 712 | 712 | 707 | 705 | 705 | ||||||||||||||||||||||||||||||||||||
|
Annualized
yield
|
14.55 | % | 15.11 | % | 16.74 | % | 12.91 | % | 15.55 | % | 16.00 | % | 15.75 | % |
FICO: <=
600
|
2 | % | 2 | % | 2 | % | 1 | % | 2 | % | 2 | % | 2 | % | |||||||||||||||||||||||||||||
|
FICO: 601 -
620
|
2 | % | 2 | % | 2 | % | 2 | % | 2 | % | 3 | % | 3 | % | ||||||||||||||||||||||||||||||||||||||||||||
|
Residential
Subordinate Non-Prime
|
FICO: 621 -
640
|
4 | % | 5 | % | 4 | % | 4 | % | 5 | % | 5 | % | 5 | % | |||||||||||||||||||||||||||||||||||||||||||
|
Principal
value
|
$ | 39,659 | $ | 44,659 | $ | 68,700 | $ | 86,802 | $ | 158,613 | $ | 230,404 | $ | 327,766 |
FICO: 641 -
660
|
7 | % | 7 | % | 7 | % | 7 | % | 8 | % | 8 | % | 8 | % | |||||||||||||||||||||||||||||
|
Unamortized
discount
|
(19,248 | ) | (19,586 | ) | (15,123 | ) | (14,863 | ) | (16,556 | ) | (18,846 | ) | (19,512 | ) |
FICO: 661 -
680
|
12 | % | 12 | % | 11 | % | 12 | % | 13 | % | 12 | % | 12 | % | |||||||||||||||||||||||||||||
|
Credit
reserve
|
(11,323 | ) | (15,775 | ) | (47,805 | ) | (70,806 | ) | (140,046 | ) | (208,839 | ) | (305,422 | ) |
FICO: 681 -
700
|
14 | % | 14 | % | 14 | % | 15 | % | 15 | % | 16 | % | 16 | % | |||||||||||||||||||||||||||||
|
Unrealized
gain
|
953 | 732 | 772 | 162 | (806 | ) | 473 | 1,705 |
FICO: 701 -
720
|
14 | % | 14 | % | 15 | % | 15 | % | 14 | % | 14 | % | 14 | % | |||||||||||||||||||||||||||||||||||
|
Fair
value
|
$ | 10,041 | $ | 10,030 | $ | 6,544 | $ | 1,295 | $ | 1,205 | $ | 3,192 | $ | 4,537 |
FICO: 721 -
740
|
12 | % | 12 | % | 13 | % | 13 | % | 12 | % | 12 | % | 12 | % | |||||||||||||||||||||||||||||
|
Fair value /
principal value
|
25 | % | 22 | % | 10 | % | 1 | % | 1 | % | 1 | % | 1 | % |
FICO: 741 -
760
|
12 | % | 11 | % | 12 | % | 11 | % | 11 | % | 11 | % | 11 | % | |||||||||||||||||||||||||||||
|
FICO: 761 -
780
|
10 | % | 10 | % | 10 | % | 10 | % | 9 | % | 9 | % | 9 | % | ||||||||||||||||||||||||||||||||||||||||||||
|
Security
Type
|
FICO: 781 -
800
|
7 | % | 7 | % | 7 | % | 7 | % | 6 | % | 5 | % | 5 | % | |||||||||||||||||||||||||||||||||||||||||||
|
Option
ARM
|
$ | 631 | $ | 623 | $ | 645 | $ | 1,061 | $ | 907 | $ | 2,639 | $ | 3,618 |
FICO: >=
801
|
2 | % | 2 | % | 2 | % | 2 | % | 2 | % | 2 | % | 2 | % | |||||||||||||||||||||||||||||
|
Hybrid
|
558 | 477 | 504 | 234 | 293 | 400 | 571 |
Unknown
|
2 | % | 2 | % | 1 | % | 1 | % | 1 | % | 1 | % | 1 | % | ||||||||||||||||||||||||||||||||||||
|
Fixed
|
8,852 | 8,930 | 5,395 | - | 5 | 153 | 348 | |||||||||||||||||||||||||||||||||||||||||||||||||||
|
Total fair
value
|
$ | 10,041 | $ | 10,030 | $ | 6,544 | $ | 1,295 | $ | 1,205 | $ | 3,192 | $ | 4,537 |
Conforming balance % (2)
|
86 | % | 85 | % | 81 | % | 76 | % | 74 | % | 71 | % | 62 | % | |||||||||||||||||||||||||||||
|
> $1 MM
%
|
3 | % | 4 | % | 6 | % | 9 | % | 9 | % | 10 | % | 17 | % | ||||||||||||||||||||||||||||||||||||||||||||
|
Residential
Subordinate Non-Prime
|
||||||||||||||||||||||||||||||||||||||||||||||||||||||||||
|
Coupon
income
|
$ | 179 | $ | 313 | $ | 169 | $ | 701 | $ | 1,128 | $ | 2,318 | $ | 5,779 |
2nd Home
%
|
4 | % | 4 | % | 5 | % | 5 | % | 5 | % | 5 | % | 7 | % | |||||||||||||||||||||||||||||
|
Discount
(premium) amortization
|
376 | 300 | (25 | ) | (342 | ) | 143 | (703 | ) | 553 |
Investment
Home %
|
13 | % | 13 | % | 11 | % | 9 | % | 8 | % | 8 | % | 7 | % | |||||||||||||||||||||||||||||||||
|
Total interest
income
|
$ | 555 | $ | 613 | $ | 144 | $ | 359 | $ | 1,271 | $ | 1,615 | $ | 6,332 | ||||||||||||||||||||||||||||||||||||||||||||
|
Average
amortized cost
|
$ | 9,181 | $ | 7,708 | $ | 4,253 | $ | 1,377 | $ | 2,218 | $ | 2,767 | $ | 3,450 |
Purchase
|
42 | % | 40 | % | 39 | % | 40 | % | 40 | % | 41 | % | 37 | % | |||||||||||||||||||||||||||||
|
Cash Out
Refi
|
41 | % | 41 | % | 42 | % | 42 | % | 42 | % | 42 | % | 44 | % | ||||||||||||||||||||||||||||||||||||||||||||
|
Coupon income
%
|
7.80 | % | 16.25 | % | 15.89 | % | 203.65 | % | 203.50 | % | 335.10 | % | 670.16 | % |
Rate-Term
Refi
|
16 | % | 18 | % | 18 | % | 17 | % | 17 | % | 16 | % | 19 | % | |||||||||||||||||||||||||||||
|
Discount
(premium) amortization %
|
16.38 | % | 15.58 | % | (2.35 | %) | (99.42 | %) | 25.74 | % | -101.60 | % | 64.12 | % |
Construction
|
0 | % | 0 | % | 0 | % | 0 | % | 0 | % | 0 | % | 0 | % | |||||||||||||||||||||||||||||
|
Annualized
yield
|
24.18 | % | 31.83 | % | 13.54 | % | 104.23 | % | 229.25 | % | 233.50 | % | 734.28 | % |
Other
|
1 | % | 1 | % | 1 | % | 1 | % | 1 | % | 1 | % | 0 | % | |||||||||||||||||||||||||||||
|
Underlying Non-Prime Loan Characteristics (1)
|
Full
Doc
|
38 | % | 36 | % | 37 | % | 34 | % | 34 | % | 32 | % | 27 | % | |||||||||||||||||||||||||||||||||||||||||||
|
No
Doc
|
3 | % | 3 | % | 3 | % | 2 | % | 2 | % | 2 | % | 6 | % | ||||||||||||||||||||||||||||||||||||||||||||
|
Number of
loans
|
67,713 | 72,621 | 79,448 | 73,102 | 73,970 | 71,041 | 64,541 |
Other Doc
(Lim, Red, Stated, etc)
|
57 | % | 59 | % | 59 | % | 62 | % | 62 | % | 64 | % | 66 | % | ||||||||||||||||||||||||||||||||||||
|
Total loan
face
|
$ | 15,181,465 | $ | 16,931,963 | $ | 19,644,742 | $ | 20,445,051 | $ | 21,588,255 | $ | 22,498,418 | $ | 24,833,600 |
Unknown/Not
Categorized
|
2 | % | 2 | % | 1 | % | 2 | % | 2 | % | 2 | % | 1 | % | |||||||||||||||||||||||||||||
|
Average loan
size
|
$ | 224 | $ | 233 | $ | 247 | $ | 280 | $ | 292 | $ | 317 | $ | 385 | ||||||||||||||||||||||||||||||||||||||||||||
|
2-4
Family
|
8 | % | 8 | % | 6 | % | 5 | % | 5 | % | 5 | % | 4 | % | ||||||||||||||||||||||||||||||||||||||||||||
|
Year 2008
origination
|
0 | % | 0 | % | 0 | % | 0 | % | 0 | % | 0 | % | 0 | % |
Condo
|
8 | % | 8 | % | 8 | % | 9 | % | 9 | % | 9 | % | 10 | % | |||||||||||||||||||||||||||||
|
Year 2007
origination
|
0 | % | 7 | % | 10 | % | 11 | % | 22 | % | 23 | % | 36 | % |
Single
Family
|
84 | % | 84 | % | 86 | % | 86 | % | 86 | % | 86 | % | 85 | % | |||||||||||||||||||||||||||||
|
Year 2006
origination
|
18 | % | 18 | % | 9 | % | 5 | % | 8 | % | 8 | % | 12 | % |
Other
|
0 | % | 0 | % | 0 | % | 0 | % | 0 | % | 0 | % | 1 | % | |||||||||||||||||||||||||||||
|
Year 2005
origination
|
49 | % | 45 | % | 50 | % | 47 | % | 36 | % | 34 | % | 27 | % | ||||||||||||||||||||||||||||||||||||||||||||
|
Year 2004
origination and earlier
|
33 | % | 30 | % | 31 | % | 37 | % | 34 | % | 35 | % | 25 | % | ||||||||||||||||||||||||||||||||||||||||||||
|
THE
REDWOOD REVIEW 3RD QUARTER 2010
|
Table 9B:
Residential Non-Prime Securities at Redwood and Underlying Loan
Characteristics
|
57
|
||
|
|
|
|
Table 10: Residential Real Estate
Loan Characteristics ($ in thousands)1
|
58
|
|
2010
|
2010
|
2010
|
2009
|
2009
|
2009
|
2009
|
2008
|
2008
|
||||||||||||||||||||||||||||
|
Q3
|
Q2
|
Q1
|
Q4
|
Q3
|
Q2
|
Q1
|
Q4
|
Q3
|
||||||||||||||||||||||||||||
|
Residential
loans
|
$ | 3,754,053 | $ | 3,807,334 | $ | 3,661,063 | $ | 3,733,173 | $ | 3,827,086 | $ | 3,952,147 | $ | 4,523,877 | $ | 4,617,269 | $ | 6,070,083 | ||||||||||||||||||
|
Number of
loans
|
12,500 | 12,725 | 12,721 | 12,930 | 13,232 | 13,648 | 14,880 | 15,203 | 18,037 | |||||||||||||||||||||||||||
|
Average loan
size
|
$ | 300 | $ | 299 | $ | 288 | $ | 289 | $ | 289 | $ | 290 | $ | 304 | $ | 304 | $ | 337 | ||||||||||||||||||
|
Adjustable
%
|
90 | % | 90 | % | 96 | % | 95 | % | 95 | % | 95 | % | 85 | % | 85 | % | 67 | % | ||||||||||||||||||
|
Hybrid
%
|
10 | % | 10 | % | 4 | % | 5 | % | 5 | % | 5 | % | 15 | % | 15 | % | 33 | % | ||||||||||||||||||
|
Fixed
%
|
0 | % | 0 | % | 0 | % | 0 | % | 0 | % | 0 | % | 0 | % | 0 | % | 0 | % | ||||||||||||||||||
|
Amortizing
%
|
5 | % | 4 | % | 3 | % | 3 | % | 3 | % | 3 | % | 4 | % | 4 | % | 5 | % | ||||||||||||||||||
|
Interest-only
%
|
95 | % | 96 | % | 97 | % | 97 | % | 97 | % | 97 | % | 96 | % | 96 | % | 95 | % | ||||||||||||||||||
|
Florida
|
13 | % | 13 | % | 14 | % | 14 | % | 14 | % | 14 | % | 13 | % | 13 | % | 13 | % | ||||||||||||||||||
|
Southern
California
|
11 | % | 11 | % | 11 | % | 11 | % | 11 | % | 11 | % | 12 | % | 12 | % | 15 | % | ||||||||||||||||||
|
Northern
California
|
10 | % | 9 | % | 8 | % | 8 | % | 8 | % | 8 | % | 9 | % | 9 | % | 11 | % | ||||||||||||||||||
|
New
York
|
8 | % | 8 | % | 7 | % | 7 | % | 7 | % | 7 | % | 6 | % | 6 | % | 6 | % | ||||||||||||||||||
|
Georgia
|
5 | % | 5 | % | 5 | % | 5 | % | 5 | % | 5 | % | 5 | % | 5 | % | 4 | % | ||||||||||||||||||
|
New
Jersey
|
4 | % | 4 | % | 5 | % | 5 | % | 4 | % | 4 | % | 4 | % | 4 | % | 4 | % | ||||||||||||||||||
|
Texas
|
5 | % | 5 | % | 5 | % | 5 | % | 5 | % | 5 | % | 5 | % | 5 | % | 4 | % | ||||||||||||||||||
|
Colorado
|
4 | % | 4 | % | 4 | % | 4 | % | 4 | % | 4 | % | 4 | % | 4 | % | 3 | % | ||||||||||||||||||
|
Virginia
|
3 | % | 3 | % | 3 | % | 3 | % | 3 | % | 3 | % | 3 | % | 3 | % | 3 | % | ||||||||||||||||||
|
Arizona
|
2 | % | 2 | % | 2 | % | 2 | % | 3 | % | 3 | % | 3 | % | 3 | % | 3 | % | ||||||||||||||||||
|
Illinois
|
2 | % | 3 | % | 2 | % | 2 | % | 2 | % | 2 | % | 3 | % | 3 | % | 3 | % | ||||||||||||||||||
|
Other
states
|
33 | % | 33 | % | 34 | % | 34 | % | 34 | % | 34 | % | 33 | % | 33 | % | 31 | % | ||||||||||||||||||
|
Year 2010
origination
|
2 | % | 0 | % | 0 | % | 0 | % | 0 | % | 0 | % | 0 | % | 0 | % | 0 | % | ||||||||||||||||||
|
Year 2009
origination
|
5 | % | 6 | % | 0 | % | 0 | % | 0 | % | 0 | % | 0 | % | 0 | % | 0 | % | ||||||||||||||||||
|
Year 2008
origination
|
0 | % | 0 | % | 0 | % | 0 | % | 0 | % | 0 | % | 0 | % | 0 | % | 0 | % | ||||||||||||||||||
|
Year 2007
origination
|
2 | % | 2 | % | 2 | % | 2 | % | 2 | % | 2 | % | 2 | % | 2 | % | 13 | % | ||||||||||||||||||
|
Year 2006
origination
|
5 | % | 5 | % | 6 | % | 6 | % | 5 | % | 5 | % | 15 | % | 15 | % | 21 | % | ||||||||||||||||||
|
Year 2005
origination
|
4 | % | 4 | % | 4 | % | 4 | % | 4 | % | 4 | % | 4 | % | 4 | % | 5 | % | ||||||||||||||||||
|
Year 2004
origination or earlier
|
82 | % | 83 | % | 88 | % | 88 | % | 89 | % | 89 | % | 79 | % | 79 | % | 61 | % | ||||||||||||||||||
|
Wtd Avg
Original LTV
|
66 | % | 66 | % | 67 | % | 67 | % | 67 | % | 67 | % | 68 | % | 68 | % | 69 | % | ||||||||||||||||||
|
Original LTV:
0 - 50
|
19 | % | 19 | % | 18 | % | 18 | % | 18 | % | 18 | % | 17 | % | 17 | % | 15 | % | ||||||||||||||||||
|
Original LTV:
50 - 60
|
12 | % | 12 | % | 11 | % | 11 | % | 11 | % | 11 | % | 11 | % | 11 | % | 11 | % | ||||||||||||||||||
|
Original LTV:
60 - 70
|
21 | % | 20 | % | 20 | % | 20 | % | 20 | % | 20 | % | 19 | % | 19 | % | 19 | % | ||||||||||||||||||
|
Original LTV:
70 - 80
|
41 | % | 42 | % | 43 | % | 43 | % | 43 | % | 43 | % | 46 | % | 46 | % | 49 | % | ||||||||||||||||||
|
Original LTV:
80 - 90
|
2 | % | 2 | % | 2 | % | 2 | % | 2 | % | 2 | % | 2 | % | 2 | % | 2 | % | ||||||||||||||||||
|
Original LTV:
90 - 100
|
5 | % | 5 | % | 6 | % | 6 | % | 6 | % | 6 | % | 5 | % | 5 | % | 4 | % | ||||||||||||||||||
|
Wtg Avg
FICO
|
733 | 733 | 730 | 730 | 730 | 731 | 731 | 732 | 732 | |||||||||||||||||||||||||||
|
FICO: <=
600
|
1 | % | 1 | % | 1 | % | 1 | % | 1 | % | 1 | % | 1 | % | 1 | % | 1 | % | ||||||||||||||||||
|
FICO: 601
-620
|
1 | % | 1 | % | 1 | % | 1 | % | 1 | % | 1 | % | 1 | % | 1 | % | 1 | % | ||||||||||||||||||
|
FICO: 621 -
640
|
2 | % | 2 | % | 2 | % | 2 | % | 2 | % | 2 | % | 2 | % | 2 | % | 1 | % | ||||||||||||||||||
|
FICO: 641
-660
|
4 | % | 4 | % | 4 | % | 4 | % | 4 | % | 4 | % | 4 | % | 4 | % | 3 | % | ||||||||||||||||||
|
FICO: 661 -
680
|
7 | % | 7 | % | 8 | % | 8 | % | 8 | % | 8 | % | 7 | % | 7 | % | 7 | % | ||||||||||||||||||
|
FICO: 681 -
700
|
11 | % | 11 | % | 12 | % | 12 | % | 12 | % | 12 | % | 12 | % | 12 | % | 12 | % | ||||||||||||||||||
|
FICO: 701 -
720
|
13 | % | 13 | % | 13 | % | 13 | % | 13 | % | 14 | % | 13 | % | 13 | % | 13 | % | ||||||||||||||||||
|
FICO: 721 -
740
|
13 | % | 13 | % | 13 | % | 13 | % | 13 | % | 13 | % | 13 | % | 13 | % | 13 | % | ||||||||||||||||||
|
FICO: 741 -
760
|
14 | % | 14 | % | 14 | % | 14 | % | 14 | % | 14 | % | 15 | % | 15 | % | 15 | % | ||||||||||||||||||
|
FICO: 761 -
780
|
17 | % | 17 | % | 16 | % | 16 | % | 16 | % | 16 | % | 17 | % | 17 | % | 17 | % | ||||||||||||||||||
|
FICO: 781 -
800
|
13 | % | 13 | % | 12 | % | 12 | % | 12 | % | 12 | % | 12 | % | 12 | % | 13 | % | ||||||||||||||||||
|
FICO: >=
801
|
4 | % | 4 | % | 4 | % | 4 | % | 4 | % | 3 | % | 3 | % | 3 | % | 4 | % | ||||||||||||||||||
|
Conforming balance % (2)
|
53 | % | 53 | % | 56 | % | 56 | % | 56 | % | 56 | % | 55 | % | 52 | % | 34 | % | ||||||||||||||||||
|
% balance in
loans > $1mm per loan
|
18 | % | 18 | % | 16 | % | 16 | % | 16 | % | 16 | % | 14 | % | 14 | % | 15 | % | ||||||||||||||||||
|
2nd home
%
|
12 | % | 12 | % | 12 | % | 12 | % | 12 | % | 12 | % | 11 | % | 11 | % | 11 | % | ||||||||||||||||||
|
Investment
home %
|
4 | % | 4 | % | 4 | % | 4 | % | 4 | % | 4 | % | 3 | % | 3 | % | 3 | % | ||||||||||||||||||
|
Purchase
|
31 | % | 31 | % | 31 | % | 31 | % | 31 | % | 31 | % | 34 | % | 34 | % | 36 | % | ||||||||||||||||||
|
Cash out
refinance
|
34 | % | 34 | % | 36 | % | 36 | % | 36 | % | 35 | % | 34 | % | 34 | % | 32 | % | ||||||||||||||||||
|
Rate-term
refinance
|
34 | % | 34 | % | 31 | % | 31 | % | 31 | % | 32 | % | 31 | % | 31 | % | 30 | % | ||||||||||||||||||
|
Other
|
1 | % | 1 | % | 2 | % | 2 | % | 2 | % | 2 | % | 1 | % | 1 | % | 2 | % | ||||||||||||||||||
|
THE
REDWOOD REVIEW 3RD QUARTER 2010
|
Table
10: Residential Real Estate Loan Characteristics
|
|
|
|
|
SENIOR
OFFICERS:
|
DIRECTORS:
|
|
|
Martin
S. Hughes
|
George
E. Bull, III
|
|
|
President
and
|
Chairman of
the Board
|
|
|
Chief
Executive Officer
|
||
|
Richard
D. Baum
|
||
|
Brett
D. Nicholas
|
Former Chief
Deputy Insurance
|
|
|
Executive
Vice President,
|
Commissioner
for the State of California
|
|
|
Chief
Investment Officer,
|
||
|
and Chief
Operating Officer
|
Thomas
C. Brown
|
|
|
COO, McGuire
Real Estate and
|
||
|
Diane
L. Merdian
|
Principal
Shareholder, Urban Bay Properties, Inc.
|
|
|
Chief
Financial Officer
|
||
|
Mariann
Byerwalter
|
||
|
Harold
F. Zagunis
|
Chairman, JDN
Corporate Advisory LLC
|
|
|
Chief Risk
Officer
|
||
|
Douglas
B. Hansen
|
||
|
Private
Investor
|
||
|
Greg
H. Kubicek
|
||
|
President,
The Holt Group, Inc.
|
||
|
STOCK
LISTING:
|
||
|
The Company’s
common stock is traded
|
Jeffrey
T. Pero
|
|
|
on the New
York Stock Exchange under
|
Retired
Partner, Latham & Watkins LLP
|
|
|
the symbol
RWT
|
||
|
Georganne
C. Proctor
|
||
|
CORPORATE
HEADQUARTERS:
|
Former Chief
Financial Officer of TIAA-CREF
|
|
|
One Belvedere
Place, Suite 300
|
||
|
Mill Valley,
California 94941
|
Charles
J. Toeniskoetter
|
|
|
Telephone:
(415) 389-7373
|
Chairman,
Toeniskoetter & Breeding, Inc. Development
|
|
|
Chairman
& CEO, Toeniskoetter Construction, Inc.
|
||
|
NEW
YORK OFFICE:
|
||
|
245 Park
Avenue, 39th Floor
|
||
|
New York, New
York 10167
|
||
|
INVESTOR
RELATIONS:
|
TRANSFER
AGENT:
|
|
|
Mike
McMahon
|
Computershare Trust Company, N.A. | |
|
Managing
Director
|
2 North
LaSalle Street
|
|
|
Chicago, IL
60602
|
||
|
Paula
Kwok
|
Telephone:
(888) 472-1955
|
|
|
Assistant
Vice President
|
||
|
Investor
Relations Hotline: (866) 269-4976
|
|
|
|
Email:
[email protected]
|
|