|
|
 |
|
TABLE OF CONTENTS
|
|
Introduction
|
4
|
| |
|
|
Shareholder Letter
|
5
|
| |
|
|
Financial Insights
|
10
|
| |
|
|
u Book Value
|
10
|
| |
|
|
u Balance Sheet
|
11
|
| |
|
|
u GAAP Income
|
16
|
| |
|
|
u Taxable Income and Dividends
|
20
|
| |
|
|
u Cash Flow
|
22
|
| |
|
|
Market Update on Private Residential Mortgage Securitization
|
23 |
| |
|
|
Housing Outlook
|
27 |
| |
|
|
Residential Mortgage Loan Business
|
30
|
| |
|
|
Investments in New Sequoia
|
31
|
| |
|
|
Residential Real Estate Securities
|
32
|
| |
|
|
Commercial Real Estate
|
40
|
| |
|
|
Legacy Investments in Other Consolidated Entities
|
42
|
| |
|
| |
|
|
Appendix
|
|
| |
|
|
Accounting Discussion
|
44
|
| |
|
|
Glossary
|
45
|
| |
|
|
Financial Tables
|
51
|
|
THE REDWOOD REVIEW 4TH QUARTER 2010
|
1
|
|
|
|
CAUTIONARY STATEMENT
|
Cautionary Statement
This Redwood Review contains forward-looking statements within the meaning of the safe harbor provisions of the Private Securities Litigation Reform Act of 1995. Forward-looking statements involve numerous risks and uncertainties. Our actual results may differ from our expectations, estimates, and projections and, consequently, you should not rely on these forward-looking statements as predictions of future events. Forward-looking statements are not historical in nature and can be identified by words such as “anticipate,” “estimate,” “will,” “should,” “expect,” “believe,” “intend,” “seek,” “plan,” and similar
expressions or their negative forms, or by references to strategy, plans, or intentions. These forward-looking statements are subject to risks and uncertainties, including, among other things, those described in our most recent Annual Report on Form 10-K under the caption “Risk Factors.” Other risks, uncertainties, and factors that could cause actual results to differ materially from those projected are described below and may be described from time to time in reports we file with the Securities and Exchange Commission, including reports on Forms 10-K, 10-Q, and 8-K. We undertake no obligation to update or revise forward-looking statements, whether as a result of new information, future events, or otherwise.
Statements regarding the following subjects, among others, are forward-looking by their nature: (i) our competitive position and our ability to compete in the future, including our ability to effectively compete to acquire residential mortgage loans and our ability to compete to invest in commercial real estate loans; (ii) our future investment strategy and our ability to find attractive investments and future trends relating to our pace of acquiring or selling assets, including, without limitation, statements relating to our efforts to acquire residential mortgage loans and make commercial real estate investments; (iii) the $119 million of loans that we have identified for purchase from originators through our conduit
program and that we plan to subsequently acquire, references to future securitizations of loans we have acquired, which future securitizations may not be completed, and, more generally, statements regarding the likelihood and timing of, and our participation in, future securitization transactions and our ability to finance loan acquisitions through the execution of securitization transactions; (iv) that we plan to securitize residential mortgage loans we own and plan to acquire, our expectation that new Sequoia securitization entities will represent a larger portion of our balance sheet in the future, and our expectations that there will be an increase in types of commercial lending transaction on which we want to lend and that a significant portion of the capital we have to invest in 2011 will go into commercial assets, so that commercial assets could rise to account for 20% of, or a
meaningful amount of, our invested capital in the next year or two; (v) that we do not anticipate a need to issue equity in the near term, our estimates of our short-term borrowing capacity and our short-term investment capacity, our statements regarding our ability to access additional short-term borrowings and capital, and our expectations regarding an increase in the balance of our outstanding short-term debt; (vi) the future returns we may earn on our investment portfolio, including future trends in interest income and interest expense, and our statements that in the near-term we expect interest income will be primarily derived from our residential securities and that in future periods we expect our residential and commercial loan businesses to contribute more significantly to interest income; (vii) future market and economic conditions, including, without limitation, future
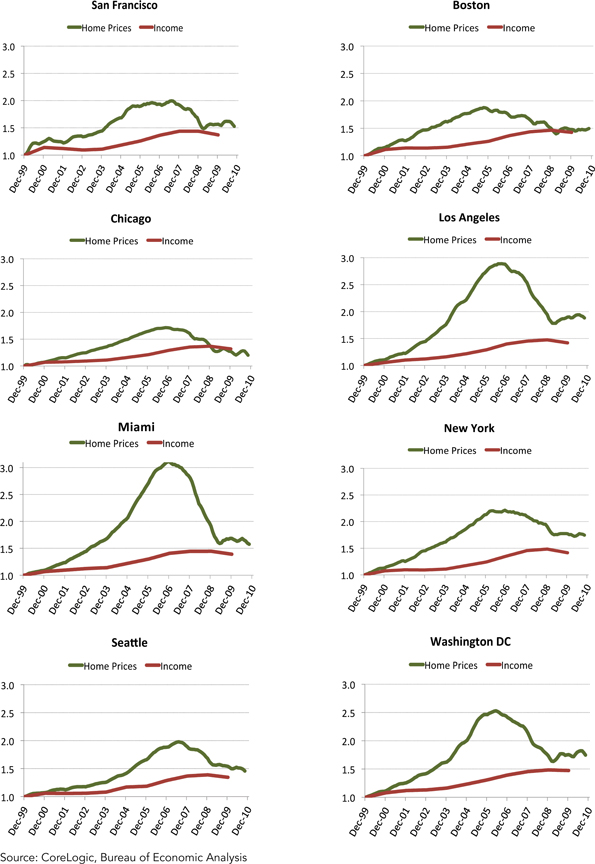
conditions in the residential and commercial real estate markets and related financing markets (including our statement that we believe there is an abundance of private sector money seeking investment in appropriately structured and originated mortgage-backed securities at attractive, risk-adjusted yields), and the related potential opportunities for our residential and commercial businesses; (viii) our beliefs about the future direction of housing market fundamentals, including, without limitation, home prices, demand for housing, delinquency rates, foreclosure rates, prepayment rates, inventory of homes for sale, and mortgage interest rates and their potential impact on our business and results of operations and our statements regarding how the historical relationship between income and home prices may imply that a significant “double dip” in housing prices is unlikely;
(ix) our beliefs about the future direction of commercial real estate fundamentals, including, without limitation, vacancy rates, rental rates, default rates, and availability of financing; (x) the impact of recent and future legislative and regulatory changes that affect our business and the mortgage finance markets, the manner in which the reform of the GSEs, including Fannie Mae and Freddie Mac, may take place and the timeline for that reform, and our statements that if reform of the GSEs is implemented as set forth in the Treasury Department’s recent released plan it will be a positive long-term development and favorable for Redwood’s business model and that we believe we are well positioned to take advantage of opportunities we expect will result from a meaningful reduction in the federal government’s role in supporting mortgage finance and that any such advantage
is more likely to begin to affect our results in 2012; (xi) our expectations regarding credit reserves, credit losses and impairments on our investments (including as compared to our original expectations and credit reserve levels) and the timing of those losses and impairments, and our statement that the amount of credit reserves we designate may require changes in the future; (xii) future earnings, future earnings volatility, and future trends in operating expenses and the factors that may affect those trends; (xiii) our board of directors’ intention to pay a regular dividend of $0.25 per share per quarter in 2011; and (xiv) our expectations relating to tax accounting, including our anticipation of additional losses for tax accounting purposes, that we currently anticipate reporting a taxable loss for the full year 2011, and our expectations regarding taxable income for 2010 and
the tax characterization of the 2010 dividends we paid.
|
2
|
THE REDWOOD REVIEW 4TH QUARTER 2010
|
Cautionary Statement (continued)
Important factors, among others, that may affect our actual results include: general economic trends, the performance of the housing, commercial real estate, mortgage, credit, and broader financial markets, and their effects on the prices of earning assets and the credit status of borrowers; federal and state legislative and regulatory developments, and the actions of governmental authorities, including those affecting the mortgage industry or our business; our exposure to credit risk and the timing of credit losses within our portfolio; the concentration of the credit risks we are exposed to, including due to the structure of assets we hold and the geographical concentration of real estate underlying assets we own; our
exposure to adjustable-rate and negative amortization mortgage loans; the efficacy and expense of our efforts to manage or hedge credit risk, interest rate risk, and other financial and operational risks; changes in credit ratings on assets we own and changes in the rating agencies’ credit rating methodologies; changes in interest rates; changes in mortgage prepayment rates; the availability of assets for purchase at attractive prices and our ability to reinvest cash we hold; changes in the values of assets we own; changes in liquidity in the market for real estate securities and loans; our ability to finance the acquisition of real estate-related assets with short-term debt; the ability of counterparties to satisfy their obligations to us; our involvement in securitization transactions and the risks we are exposed to in engaging in securitization transactions; exposure to
litigation arising from our involvement in securitization transactions; whether we have sufficient liquid assets to meet short-term needs; our ability to successfully compete and retain or attract key personnel; our ability to adapt our business model and strategies to changing circumstances; changes in our investment, financing, and hedging strategies and new risks we may be exposed to if we expand our business activities; exposure to environmental liabilities and the effects of global climate change; failure to comply with applicable laws and regulations; our failure to maintain appropriate internal controls over financial reporting and disclosure controls and procedures; the impact on our reputation that could result from our actions or omissions or from those of others; changes in accounting principles and tax rules; our ability to maintain our status as a real estate investment
trust (REIT) for tax purposes; limitations imposed on our business due to our REIT status and our status as exempt from registration under the Investment Company Act of 1940; decisions about raising, managing, and distributing capital; and other factors not presently identified.
This Redwood Review may contain statistics and other data that in some cases have been obtained from or compiled from information made available by servicers and other third-party service providers.
|
THE REDWOOD REVIEW 4TH QUARTER 2010
|
3
|
|
|
|
INTRODUCTION
|
Note to Readers:
We file annual reports (on Form 10-K) and quarterly reports (on Form 10-Q) with the Securities and Exchange Commission. These filings and our earnings press releases provide information about Redwood and our financial results in accordance with generally accepted accounting principles (GAAP). We urge you to review these documents, which are available through our web site, www.redwoodtrust.com.
This document, called The Redwood Review, is an additional format for providing information about Redwood through a discussion of many GAAP as well as non-GAAP metrics, such as taxable income and economic book value. Supplemental information is also provided in the Financial Tables in this Review to facilitate more detailed understanding and analysis of Redwood. When we use non-GAAP metrics it is because we believe that these figures provide additional insight into Redwood’s business. In each case in which we discuss a non-GAAP metric you will find an explanation of how it has been calculated, why we think the figure is important, and reconciliations between the GAAP and non-GAAP figures.
References herein to “Redwood,” the “company,” “we,” “us,” and “our” include Redwood Trust, Inc. and its consolidated subsidiaries. References to “at Redwood” exclude all consolidated securitization entities in order to present our operations in the way management analyzes them.
We hope you find this Review helpful to your understanding of our business. We thank you for your input and suggestions, which have resulted in our changing the form and content of The Redwood Review over time.
We welcome your continued interest and comments.
| |
|
|
|
|
|
|
|
Selected Financial Highlights
|
| |
|
|
|
|
|
|
| |
|
|
|
|
Non-GAAP
|
|
| |
GAAP Income
|
|
|
|
Economic
|
|
| |
(Loss) per
|
Taxable Income
|
Annualized
|
GAAP Book
|
Value per
|
Dividends per
|
|
Quarter:Year
|
Share
|
(Loss) per Share (1)
|
Return on Equity
|
Value per Share
|
Share (2)
|
Share
|
|
Q408
|
($3.46)
|
($0.39)
|
(124%)
|
$9.02
|
$11.10
|
$0.75
|
|
Q109
|
($0.65)
|
($0.22)
|
(25%)
|
$8.40
|
$10.01
|
$0.25
|
|
Q209
|
$0.10
|
($0.16)
|
5%
|
$10.35
|
$11.30
|
$0.25
|
|
Q309
|
$0.34
|
($0.30)
|
13%
|
$11.68
|
$12.28
|
$0.25
|
|
Q409
|
$0.51
|
($0.44)
|
17%
|
$12.50
|
$13.03
|
$0.25
|
|
Q110
|
$0.58
|
$0.01
|
19%
|
$12.84
|
$13.32
|
$0.25
|
|
Q210
|
$0.35
|
($0.03)
|
11%
|
$12.71
|
$13.37
|
$0.25
|
|
Q310
|
$0.25
|
($0.11)
|
8%
|
$13.02
|
$13.73
|
$0.25
|
|
Q410
|
$0.18
|
($0.07)
|
6%
|
$13.63
|
$14.31
|
$0.25
|
(1) Taxable income (loss) per share for 2010 are estimates until we file tax returns for that year.
(2) Non-GAAP economic value per share is calculated using estimated bid-side values (which take into account available bid-side marks) for our financial assets and estimated offer-side values (which take into account available offer-side marks) for our financial liabilities and we believe it more accurately reflects liquidation value than does GAAP book value per share. Non-GAAP economic value per share is reconciled to GAAP book value per share in Table 3 in the Financial Tables in this Review.
|
4
|
THE REDWOOD REVIEW 4TH QUARTER 2010
|
|
|
 |
|
SHAREHOLDER LETTER
|
Dear Fellow Shareholders:
Overview
As we reflect on 2010 and look forward to 2011, an old refrain comes to mind: “sometimes you have to look back…to see how far you have come…” With this refrain as a backdrop, we will share our perspective on our recent progress and on what is yet to come.
A year ago, we observed in our letter that new private securitization was within sight, hurdles remained, commercial investment opportunities were near, and we liked our competitive position. At the time we made these comments, we had not completed a residential mortgage-backed securitization since August 2007 because the market was frozen in the wake of the financial crisis. Our commercial team was in its early formative stage and we had just recently hired our department head.
We were right about new private securitization being within sight. In April 2010, we completed the first non-agency residential mortgage-backed securitization backed by newly originated loans since mid-2008. Going into 2010, we had plans to help restart private mortgage securitization, but we had no assurances that we could do so. In fact, residential mortgage-backed securities (RMBS) investors were still aggressively buying seasoned senior RMBS at yields well above jumbo mortgage rates, making the securitization math unworkable at that time.
We accomplished most of our residential plans in 2010. After completing the securitization in April, we launched our residential mortgage conduit program and began signing up originators. By year-end 2010, we had acquired $253 million of loans and had a pipeline of $119 million of additional loans from conduit program originators identified for subsequent acquisition. We submitted our Government Sponsored Enterprises (GSE) reform plan to regulators in July and published the Redwood Guide to Restoring Private-Sector Residential Mortgage Securitization in November. We had several opportunities to discuss both our write-ups with regulators and policy makers.
We believed then and we believe now that the best time to build a business is when operating conditions are challenging to the point of obscuring long-term opportunities. At that point, competitors are few and naysayers are plentiful. It was against such a challenging backdrop that, in the fall of 2009, we started rebuilding our Sequoia securitization platform. We did so based on our beliefs that the government’s role in backing roughly 90% of annual mortgage originations was unsustainable; private securitization would return; we had several competitive advantages in private securitization; building a better jumbo mortgage conduit would likely and ultimately benefit our shareholders; and Redwood should take a leading
role in restarting private securitization.
Taking a longer view, we believe we are well positioned to take advantage of the opportunities we expect will result from a meaningful reduction in the federal government’s role in supporting mortgage finance, which will take time and more likely begin to affect our results in 2012. We would, of course, like more volume now for our residential mortgage conduit to make the activity efficient, profitable, and beneficial for shareholders. With respect to new securitization activity conducted through our Sequoia platform, we refer you to our recent press release, which is attached to the Form 8-K we filed with the Securities and Exchange Commission on February 18, 2011.
|
THE REDWOOD REVIEW 4TH QUARTER 2010
|
5
|
|
|
|
SHAREHOLDER LETTER
|
Overview (continued)
On the commercial side, our business is now fully up and running. We invested $30 million in the fourth quarter of 2010 as we funded our first three mezzanine loans. Early in February 2011, we originated another $6 million loan. Our team is in place, we have built processes and strengthened relationships, and our lending opportunities are expanding. We currently expect a significant portion of the capital we invest in 2011 to go into commercial assets, so that commercial could rise to 20% of our invested capital in the next year or two.
As we look back, we realize we have come a long way over the past year. There is a real sense of momentum in our residential and commercial businesses, even though progress in 2010 was slower than we would have liked. We are patient as we invest and build our businesses, mindful of the mistakes made when companies push too hard for rapid growth and confident that we are laying a proper foundation. We expect continued opportunities and challenges in 2011 and beyond.
In the interest of providing topical and timely insights, we have included two special sections later in this Review, specifically addressing our outlook for housing and private residential mortgage securitization and the Treasury’s report on GSE reform.
Fourth Quarter 2010
GAAP earnings for the fourth quarter of 2010 were $15 million or $0.18 per share, down somewhat from the $20 million or $0.25 per share we earned in the prior quarter. The most notable difference in the recent quarter was that our loan loss provision came in higher — at $8 million in the fourth quarter 2010, up from $2 million in the third quarter 2010. The fourth quarter included no market valuation adjustments and $2 million in realized gains — equal to the level posted in the prior quarter.
Book value increased by $0.61 per share to $13.63 per share. The increase resulted from $0.18 per share in reported earnings, $0.39 per share in net valuation increases on securities not reflected in earnings, $0.27 per share in increases in value of hedges related to long-term debt, and $0.02 per share in other items, less $0.25 per share from dividends paid to shareholders. Our estimate of non-GAAP economic value is $14.31 per share at year-end 2010, which is $0.68 per share or $55 million higher than year-end 2010 GAAP book value per share.
Looking Ahead
As we look ahead to 2011, we believe that:
| |
u
|
Well managed, efficient funding will be increasingly important
|
| |
u
|
High quality commercial real estate is recovering, attracting more capital
|
| |
u
|
Housing prices are approaching a bottom, but pressures persist on a local basis
|
| |
u
|
Uncertainty will likely create risks and opportunities
|
| |
u
|
GSE reform is increasingly likely
|
We expand on each of these topics on the following pages.
|
6
|
THE REDWOOD REVIEW 4TH QUARTER 2010
|
|
|
|
|
SHAREHOLDER LETTER
|
Well Managed, Efficient Funding Will Be Increasingly Important
In recent years, our quarter-end cash balance was a relatively good proxy for the amount of excess capital we had available to invest since we were only using cash to fund long-term investments. More recently, we are using cash, along with short-term borrowings, to fund the accumulation of residential loans, on a temporary basis, prior to securitization. As a consequence, our cash balance now and going forward will reveal little about the capital we have available for long-term investments. Hence, the drop in our cash balance from $189 million at September 30, 2010 to $47 million at year-end 2010 is not meaningful as an indicator of investment capacity.
To gauge the amount of capital readily available for long-term investment, we look at the amount of the cash we estimate we could raise by financing all our residential loans with short-term borrowings less the amount of cash we estimate we would need over the short term for operations, working capital, and a liquidity cushion. On this basis, our investment capacity was $224 million at year-end 2010 and has not changed much thus far in 2011. In addition, with a little lead time, we could raise additional investment capacity by permanently financing a portion of our securities portfolio either through a resecuritization or by other means.
We intend to more fully employ our capital in 2011, which will involve increased borrowing activity. Our estimates of investment capacity presume that we are able to borrow on a secured basis. We continue to have a healthy respect for the dangers of liquidity risk and recognize that funding illiquid assets with recourse debt can end quite badly.
High Quality Commercial Real Estate is Recovering, Attracting More Capital
The commercial real estate market is experiencing a significant increase in the volume of financing transactions. As we have noted in recent quarters, liquidity has increasingly returned in earnest for stabilized commercial assets. Fundamentals appear to have at least stabilized in select metropolitan markets, especially for multifamily properties, strong anchored retail space, and class-A office space in central business districts.
The increased capital flows to commercial real estate can be seen in the recent resurgence in the commercial mortgage-backed securities (CMBS) market. For high quality commercial loans, the stars are lining up for CMBS issuance velocity. Investor demand is strong, triple-A spreads continue to tighten, and borrowers are able to refinance at attractive rates and on easing credit terms. Furthermore, many banks and Wall Street firms are building CMBS platforms that will “feed the beast.” There are no meaningful regulatory challenges to commercial real estate finance, which distinguishes commercial from residential real estate.
Last year, CMBS issuance totaled roughly $10 billion excluding agency originations. Market observers expect CMBS issuance of approximately $40 to $50 billion for 2011. The environment for building our commercial business and making investments is favorable, particularly since we expect an increase in the flow of the types of quality transactions on which we want to lend.
|
THE REDWOOD REVIEW 4TH QUARTER 2010
|
7
|
|
|
|
SHAREHOLDER LETTER
|
High Quality Commercial Real Estate is Recovering, Attracting More Capital (continued)
Redwood Trust is actively engaged as an originator and underwriter of commercial mezzanine loans on high quality, stabilized assets. Our progress and results have been promising. We recently originated and closed four mezzanine loans and we have many possible new opportunities. As is the case with all of our investment activities, we are focused on getting credit right. We have built the in-house expertise, platform, market recognition, and relationships to allow us to prosper over time. It is our objective to be well positioned to originate attractive, risk-adjusted commercial investments on a sustainable basis, as market conditions ebb and flow.
Our balance sheet is well suited for retaining long-term credit risk. Our capital and origination process provide reliability, flexibility, and advantages to borrowers, including the advantage of permanent funding of longer-term assets. Currently, we are focused on providing long-term solutions to the challenge of financing the gap between the amount of equity a borrower will put into a property and the amount of financing available from the senior lender. We like what we see in the commercial real estate markets. Currently, we expect a meaningful portion of our capital invested in 2011 to go into commercial assets.
Housing Prices Are Approaching a Bottom, but Pressures Persist on a Local Basis
Affordability looks better than it has in years, considering income and house prices. Improved affordability will eventually form a bottom for housing prices. On a nationwide basis, we think an additional 5 to 10% decline will be necessary to get to that point. However there remains, as always, significant regional variation. While some markets appear to have bottomed, other markets could see drops beyond this range. We acknowledge that there are risks to the outlook for housing prices and once housing has bottomed, we do not expect appreciable gains in prices for years, for two reasons. First, we believe the “shadow inventory” waiting to come on the market will provide an ongoing headwind to price appreciation.
Second, we believe tighter residential mortgage loan underwriting standards are here to stay for many years. Ultimately, we believe that a house is going back to being a home first and an investment only secondarily. Importantly, our investment decisions are made with our views on local housing prices in mind. Please see the separate module on housing on page 27 in this Review for further commentary.
Uncertainty Will Likely Create Risks and Opportunities
There are many sources of uncertainty that could potentially impact our residential businesses, including our residential portfolio business. For example, uncertainty exists around residential mortgage foreclosures, regulatory details to be determined that will affect private residential mortgage securitization, and the pace at which the government scales back its support of housing finance. In our residential portfolio business, we will continue to manage our approximately $800 million in mortgage securities with an eye to protecting credit and enhancing returns, as possible. In fact, while we do not anticipate significant further across-the-board price appreciation, we will stay vigilant for opportunities that result from
uncertainty and changes in perceptions in the market. For example, negative headlines on housing could help create investment opportunities in select non-agency RMBS. We view the volatility that often comes with uncertainty as potentially a good source of opportunities. On the margin, we expect to continue to manage the risk/reward of our portfolio.
|
8
|
THE REDWOOD REVIEW 4TH QUARTER 2010
|
|
|
|
|
SHAREHOLDER LETTER
|
GSE Reform is Increasingly Likely
The good news is that we are now discussing and debating GSE reform rather than just kicking the can down the road. Treasury has delivered its proposal on housing finance reform, including three specific options. We expect that a version of one of these options will ultimately be enacted. Meanwhile, we believe temporary loan limits for high cost areas will likely be allowed to expire on September 30, 2011. Lowering loan limits – which help determine how big a role Fannie and Freddie play in financing housing – is an easy way to effectively take a “first step” in GSE reform. Lowering limits makes sense in the context of price declines, it limits the additional burden to the taxpayer, and it opens a
door for the private sector to return to financing mortgages in a more significant way.
Please see the more detailed discussion of the Treasury Proposal beginning on page 23 in this Review. For background, please see our website for Redwood’s proposal on reforming the GSEs, entitled “Fixing the U.S. Mortgage Market,” posted July 30, 2010. We believe that supporting the return of the private sector to residential mortgage securitization is critical to moving forward on GSE reform.
Concluding Thoughts
We are building for the future, which requires patience by management and especially by shareholders. We have laid a strong foundation for our commercial business and our residential conduit business. In commercial, there are encouraging signs that we are well positioned and that the market freeze (in our target market) is coming to an end. In our residential business, we feel highly confident that the government’s market share will be coming down for some time to come — though the timing of when it will begin is impossible to predict. Working through the stops and starts associated with the major shifts in housing finance will continue to be challenging. Whether that takes 6 or 12 months longer than we plan
will not ultimately be what matters most. In the end, we expect to have a well positioned, first-rate franchise in private residential securitization that focuses on providing originators and investors with what they want. We appreciate your support and confidence and we will continue to work hard to keep your trust.
 |
 |
|
Martin S. Hughes
|
Brett D. Nicholas
|
|
President and
|
Executive Vice President,
|
|
Chief Executive Officer
|
Chief Investment Officer, and
|
| |
Chief Operating Officer
|
|
THE REDWOOD REVIEW 4TH QUARTER 2010
|
9
|
 |
|
|
FINANCIAL INSIGHTS
|
Book Value
Summary
|
|
The following table shows the components of our GAAP book value and management’s estimate of non-GAAP economic value at December 31, 2010.
|
|
Components of Book Value*
December 31, 2010
($ in millions, except per share data)
|
|
| |
|
GAAP
Book Value
|
|
|
Adj.
|
|
|
Management's
Estimate of
Non-GAAP
Economic Value
|
|
| |
|
|
|
|
|
|
|
|
|
|
Cash and cash equivalents
|
|
$ |
47 |
|
|
|
|
|
$ |
47 |
|
| |
|
|
|
|
|
|
|
|
|
|
|
|
Real estate loans at Redwood
|
|
|
|
|
|
|
|
|
|
|
|
|
Residential
|
|
|
255 |
|
|
|
|
|
|
255 |
|
|
Commercial
|
|
|
30 |
|
|
|
|
|
|
30 |
|
|
Total real estate loans at Redwood
|
|
$ |
285 |
|
|
|
|
|
$ |
285 |
|
| |
|
|
|
|
|
|
|
|
|
|
|
|
Real estate securities at Redwood
|
|
|
|
|
|
|
|
|
|
|
|
|
Residential
|
|
|
814 |
|
|
|
|
|
|
814 |
|
|
Commercial
|
|
|
8 |
|
|
|
|
|
|
8 |
|
|
CDO
|
|
|
1 |
|
|
|
|
|
|
1 |
|
|
Total real estate securities at Redwood
|
|
$ |
823 |
|
|
|
|
|
$ |
823 |
|
| |
|
|
|
|
|
|
|
|
|
|
|
|
Investments in the Fund
|
|
|
14 |
|
|
|
|
|
|
14 |
|
|
Investments in Sequoia
|
|
|
87 |
|
|
|
(9 |
) |
|
|
78 |
|
|
Investments in Acacia
|
|
|
4 |
|
|
|
(3 |
) |
|
|
1 |
|
|
Other assets
|
|
|
35 |
|
|
|
|
|
|
|
35 |
|
|
Total assets
|
|
$ |
1,295 |
|
|
|
|
|
|
$ |
1,283 |
|
| |
|
|
|
|
|
|
|
|
|
|
|
|
|
Short-term debt
|
|
|
(44 |
) |
|
|
|
|
|
|
(44 |
) |
|
Long-term debt
|
|
|
(140 |
) |
|
|
65 |
|
|
|
(75 |
) |
| |
|
|
|
|
|
|
|
|
|
|
|
|
|
Other liabilities
|
|
|
(46 |
) |
|
|
|
|
|
|
(46 |
) |
| |
|
|
|
|
|
|
|
|
|
|
|
|
|
Stockholders' equity
|
|
$ |
1,065 |
|
|
|
|
|
|
$ |
1,118 |
|
| |
|
|
|
|
|
|
|
|
|
|
|
|
|
Book value per share
|
|
$ |
13.63 |
|
|
|
|
|
|
$ |
14.31 |
|
|
|
During the fourth quarter of 2010, our GAAP book value increased by $0.61 per share to $13.63 per share. The increase resulted from $0.18 per share in reported earnings, $0.39 per share in net valuation increases on securities not reflected in earnings, $0.27 per share in increases in value of hedges related to long-term debt, and $0.02 per share in other items, less $0.25 per share from dividends paid to shareholders.
|
|
|
During the fourth quarter of 2010, our estimate of non-GAAP economic value increased by $0.58 per share to $14.31 per share. The increase resulted from $0.80 per share in cash flows and net positive market valuation adjustments on our securities and investments, $0.12 per share from the hedged valuation increase related to our long-term debt, plus $0.05 per share from changes in working capital and other items, less $0.14 per share of cash operating and interest expense and $0.25 per share of dividends paid to shareholders.
|
|
*
|
The components of book value table presents our assets and liabilities as calculated and reported under GAAP and as adjusted to reflect our estimate of economic value, a non-GAAP metric. We show our investments in the Redwood Opportunity Fund, L.P. (the Fund) and in Sequoia and Acacia securitization entities in separate line items, similar to the equity method of accounting, reflecting the reality that the underlying assets and liabilities owned by these entities are legally not ours. We own only the securities and interests that we have acquired from these entities. See pages 13 and 14 for an explanation of the adjustments set forth in this table.
|
|
10
|
THE REDWOOD REVIEW 4TH QUARTER 2010
|
|
|
|
|
FINANCIAL INSIGHTS
|
Balance Sheet
|
|
The following table shows the components of our balance sheet at December 31, 2010.
|
Consolidating Balance Sheet
December 31, 2010
($ in millions)
|
|
| |
|
| |
|
At
Redwood
|
|
|
New
Sequoia
|
|
|
Other
Consolidated
Entities
|
|
|
Intercompany
|
|
|
Redwood
Consolidated
|
|
| |
|
|
|
|
|
|
|
|
|
|
|
|
|
|
|
|
Real estate loans
|
|
$ |
285 |
|
|
$ |
145 |
|
|
$ |
3,417 |
|
|
$ |
- |
|
|
$ |
3,847 |
|
|
Real estate securities
|
|
|
823 |
|
|
|
- |
|
|
|
332 |
|
|
|
- |
|
|
|
1,155 |
|
|
Investments in New Sequoia
|
|
|
24 |
|
|
|
- |
|
|
|
- |
|
|
|
(24 |
) |
|
|
- |
|
|
Investment in Other Consolidated Entities
|
|
|
81 |
|
|
|
- |
|
|
|
- |
|
|
|
(81 |
) |
|
|
- |
|
|
Cash and cash equivalents
|
|
|
47 |
|
|
|
- |
|
|
|
- |
|
|
|
- |
|
|
|
47 |
|
|
Total earning assets
|
|
|
1,260 |
|
|
|
145 |
|
|
|
3,749 |
|
|
|
(105 |
) |
|
|
5,049 |
|
| |
|
|
|
|
|
|
|
|
|
|
|
|
|
|
|
|
|
|
|
|
|
Other assets
|
|
|
35 |
|
|
|
2 |
|
|
|
58 |
|
|
|
- |
|
|
|
95 |
|
| |
|
|
|
|
|
|
|
|
|
|
|
|
|
|
|
|
|
|
|
|
|
Total assets
|
|
$ |
1,295 |
|
|
$ |
147 |
|
|
$ |
3,807 |
|
|
$ |
(105 |
) |
|
$ |
5,144 |
|
| |
|
|
|
|
|
|
|
|
|
|
|
|
|
|
|
|
|
|
|
|
|
Short-term debt
|
|
$ |
44 |
|
|
$ |
- |
|
|
$ |
- |
|
|
$ |
- |
|
|
$ |
44 |
|
|
Other liabilities
|
|
|
46 |
|
|
|
- |
|
|
|
77 |
|
|
|
- |
|
|
|
123 |
|
|
Asset-backed securities issued
|
|
|
- |
|
|
|
123 |
|
|
|
3,638 |
|
|
|
- |
|
|
|
3,761 |
|
|
Long-term debt
|
|
|
140 |
|
|
|
- |
|
|
|
- |
|
|
|
- |
|
|
|
140 |
|
|
Total liabilities
|
|
|
230 |
|
|
|
123 |
|
|
|
3,715 |
|
|
|
- |
|
|
|
4,068 |
|
| |
|
|
|
|
|
|
|
|
|
|
|
|
|
|
|
|
|
|
|
|
|
Stockholders’ equity
|
|
|
1,065 |
|
|
|
24 |
|
|
|
81 |
|
|
|
(105 |
) |
|
|
1,065 |
|
|
Noncontrolling interest
|
|
|
- |
|
|
|
- |
|
|
|
11 |
|
|
|
- |
|
|
|
11 |
|
|
Total equity
|
|
|
1,065 |
|
|
|
24 |
|
|
|
92 |
|
|
|
(105 |
) |
|
|
1,076 |
|
| |
|
|
|
|
|
|
|
|
|
|
|
|
|
|
|
|
|
|
|
|
|
Total liabilities and stockholders’ equity
|
|
$ |
1,295 |
|
|
$ |
147 |
|
|
$ |
3,807 |
|
|
$ |
(105 |
) |
|
$ |
5,144 |
|
|
|
We present this table to highlight the impact that consolidation has on our GAAP balance sheet. As shown, Redwood’s $105 million GAAP investment in the consolidated entities (including New Sequoia) increased our consolidated assets by $3.9 billion and liabilities by $3.8 billion.
|
|
|
We are required under GAAP to consolidate all of the assets and liabilities of the Fund (due to our significant general and limited partnership interests in the Fund and ongoing asset management responsibilities) and certain Sequoia and Acacia securitization entities that are treated as secured borrowing transactions. However, the securitized assets of these entities are not available to Redwood. Similarly, the liabilities of these entities are obligations payable only from the cash flow generated by their securitized assets and are not obligations of Redwood.
|
|
|
The consolidating balance sheet presents the New Sequoia securitization entity separately from all Other Consolidated Entities to highlight our renewed focus on growing our core business of creating residential credit investments. As we complete additional securitizations, we expect New Sequoia securitization entities to represent a larger portion of our consolidated balance sheet as prior Sequoia securitization entities continue to pay down.
|
|
THE REDWOOD REVIEW 4TH QUARTER 2010
|
11
|
|
|
|
FINANCIAL INSIGHTS
|
Balance Sheet (continued)
Real Estate Loans
|
|
At December 31, 2010, we had $285 million of real estate loans held for investment, comprised of $255 million of residential loans and $30 million of commercial loans. We intend to securitize most of the residential loans (and others we have identified for future acquisition), at which point they will be reflected in the “New Sequoia” column on the consolidating balance sheet shown on page 11.
|
|
|
The commercial loans were originated in the fourth quarter and we intend to hold these loans for investment.
|
Real Estate Securities
|
|
The following table presents the fair value (which equals GAAP carrying value) of real estate securities at Redwood at December 31, 2010. We segment our securities portfolio by vintage (the year(s) the securities were issued), priority of cash flow (senior, re-REMIC, and subordinate), and by quality of underlying loans (prime and non-prime securities) for residential.
|
Real Estate Securities at Redwood
December 31, 2010
($ in millions)
|
|
| |
|
<=2004
|
|
|
2005
|
|
|
2006-2008 |
|
|
Total
|
|
|
% of Total
Securities
|
|
| |
|
|
|
|
|
|
|
|
|
|
|
|
|
|
|
|
Residential
|
|
|
|
|
|
|
|
|
|
|
|
|
|
|
|
|
|
Seniors
|
|
|
|
|
|
|
|
|
|
|
|
|
|
|
|
|
|
Prime
|
|
$ |
13 |
|
|
$ |
228 |
|
|
$ |
75 |
|
|
$ |
316 |
|
|
|
38 |
% |
|
Non-prime*
|
|
|
117 |
|
|
|
220 |
|
|
|
9 |
|
|
|
346 |
|
|
|
42 |
% |
|
Total Seniors
|
|
$ |
130 |
|
|
$ |
448 |
|
|
$ |
84 |
|
|
$ |
662 |
|
|
|
80 |
% |
| |
|
|
|
|
|
|
|
|
|
|
|
|
|
|
|
|
|
|
|
|
|
Re-REMIC
|
|
|
|
|
|
|
|
|
|
|
|
|
|
|
|
|
|
|
|
|
|
Prime
|
|
$ |
6 |
|
|
$ |
12 |
|
|
$ |
67 |
|
|
$ |
85 |
|
|
|
10 |
% |
|
Total Re-REMIC
|
|
$ |
6 |
|
|
$ |
12 |
|
|
$ |
67 |
|
|
$ |
85 |
|
|
|
10 |
% |
| |
|
|
|
|
|
|
|
|
|
|
|
|
|
|
|
|
|
|
|
|
|
Subordinates
|
|
|
|
|
|
|
|
|
|
|
|
|
|
|
|
|
|
|
|
|
|
Prime
|
|
$ |
42 |
|
|
$ |
7 |
|
|
$ |
5 |
|
|
$ |
54 |
|
|
|
7 |
% |
|
Non-prime*
|
|
|
13 |
|
|
|
- |
|
|
|
- |
|
|
|
13 |
|
|
|
2 |
% |
|
Total Subordinates
|
|
$ |
55 |
|
|
$ |
7 |
|
|
$ |
5 |
|
|
$ |
67 |
|
|
|
9 |
% |
| |
|
|
|
|
|
|
|
|
|
|
|
|
|
|
|
|
|
|
|
|
|
Total Residential
|
|
$ |
191 |
|
|
$ |
467 |
|
|
$ |
156 |
|
|
$ |
814 |
|
|
|
99 |
% |
| |
|
|
|
|
|
|
|
|
|
|
|
|
|
|
|
|
|
|
|
|
|
Commercial subordinates
|
|
$ |
7 |
|
|
$ |
1 |
|
|
$ |
- |
|
|
$ |
8 |
|
|
|
1 |
% |
|
CDO subordinates
|
|
$ |
- |
|
|
$ |
1 |
|
|
$ |
- |
|
|
$ |
1 |
|
|
|
0 |
% |
| |
|
|
|
|
|
|
|
|
|
|
|
|
|
|
|
|
|
|
|
|
|
Total real estate securities
|
|
$ |
198 |
|
|
$ |
469 |
|
|
$ |
156 |
|
|
$ |
823 |
|
|
|
100 |
% |
| |
*
|
Non-prime residential securities consist of $356 million of Alt-A senior and subordinate and $3 million of subprime subordinate securities.
|
|
12
|
THE REDWOOD REVIEW 4TH QUARTER 2010
|
|
|
|
|
FINANCIAL INSIGHTS
|
Balance Sheet (continued)
Real Estate Securities (continued)
|
|
The table below details the change in fair value of securities at Redwood during the fourth and third quarters of 2010.
|
|
Real Estate Securities at Redwood
($ in millions)
|
|
| |
|
Three Months Ended
|
|
| |
|
12/31/10
|
|
|
9/30/10
|
|
|
Beginning fair value
|
|
$ |
797 |
|
|
$ |
734 |
|
| |
|
|
|
|
|
|
|
|
|
Acquisitions
|
|
|
26 |
|
|
|
50 |
|
|
Sales
|
|
|
- |
|
|
|
- |
|
|
Effect of principal payments
|
|
|
(29 |
) |
|
|
(21 |
) |
|
Change in fair value, net
|
|
|
29 |
|
|
|
34 |
|
| |
|
|
|
|
|
|
|
|
|
Ending fair value
|
|
$ |
823 |
|
|
$ |
797 |
|
|
|
Our acquisitions in the fourth quarter included $6 million of prime senior securities, $1 million of non-prime senior securities, $15 million of prime subordinate securities, and $4 million of non-prime subordinate securities. Of the $26 million of securities acquired, $24 million were from 2005 and earlier vintages.
|
|
|
During January 2011, we did not acquire or sell any securities at Redwood.
|
Investments in the Fund and the Securitization Entities
|
|
Our investments in the Fund, Sequoia, and Acacia securitization entities, as reported for GAAP, totaled $105 million, or 10% of our equity at December 31, 2010.
|
|
|
The GAAP carrying value and the fair value of our investment in the Fund was $14 million. The Fund is primarily invested in non-prime residential securities and is managed by a subsidiary of Redwood. Our investment represents a 52% interest in the Fund.
|
|
|
The GAAP carrying value of our investments in Sequoia was $87 million and management’s estimate of the non-GAAP economic value of those investments was $78 million. We estimate the non-GAAP economic value for our investments, consisting of $48 million of IOs and $30 million of senior and subordinate securities, using the same valuation process that we follow to fair value our other real estate securities. For GAAP, we account for the assets and liabilities at historical cost and the net $87 million carrying value represents the difference between the carrying costs of the assets ($3.6 billion) and liabilities ($3.5 billion) owned by the Sequoia entities.
|
|
|
The GAAP carrying value of our investments in Acacia entities was $4 million and management’s estimate of the non-GAAP economic value of those investments was $1 million, which primarily reflects the present value of the management fees we expect to earn from these entities. The equity interests and securities we own in the Acacia entities have minimal value.
|
|
THE REDWOOD REVIEW 4TH QUARTER 2010
|
13
|
|
|
|
FINANCIAL INSIGHTS
|
Balance Sheet (continued)
Debt
|
u
|
We noted in prior Redwood Reviews that we expected to utilize short-term debt to finance the acquisition of prime mortgage loans prior to securitizing them through our Sequoia securitization platform. At December 31, 2010, we had $44 million of short-term recourse debt (collateralized by mortgage-backed securities) that was used to fund the acquisition of mortgage loans that we intend to securitize. Our outstanding balance of short-term debt will increase until the securitization has been completed.
|
|
u
|
At December 31, 2010, we had $140 million of long-term debt outstanding with a stated interest rate of three-month LIBOR plus 225 basis points due in 2037. Earlier in 2010, we effectively fixed the interest rate on this long-term debt through interest rate swaps at a rate of approximately 6.75%.
|
|
u
|
We calculated the $75 million estimate of non-GAAP economic value of this long-term debt based on its stated interest rate using the same valuation process used to fair value our other financial assets and liabilities. During the fourth quarter, we repurchased $500,000 of our long-term debt at a price of 54% of face value, which is consistent with our estimate of its fair value at the end of the fourth quarter.
|
|
14
|
THE REDWOOD REVIEW 4TH QUARTER 2010
|
|
|
|
|
FINANCIAL INSIGHTS
|
Balance Sheet (continued)
Capital and Cash
|
u
|
At December 31, 2010, our total capital was $1.2 billion, including $1.1 billion in shareholders’ equity and $140 million of long-term debt. We use our capital to invest in earning assets, meet lender capital requirements, and to fund our operations and working capital needs.
|
|
u
|
We manage our capital through our risk-adjusted capital policy, which has served us well since the company was founded. We have successfully managed through two tumultuous periods (1998 and 2008) and we remain thoughtful about managing funding risk as we use short-term debt.
|
|
u
|
Our cash balance was $47 million at year-end 2010. We currently hold cash for two main reasons. First, we hold sufficient cash to comply with covenants, to meet potential margin calls, and to cover near term cash operating expenses. Second, we hold cash in anticipation of having opportunities to invest at attractive yields.
|
|
u
|
Cash was a good barometer of our ability to invest when we used only cash to fund long-term investments. We are now using cash and short-term borrowings to fund the accumulation of loans on a temporary basis. Thus, cash tells us little about the capital we have available for long-term investments.
|
|
u
|
We estimate that our short-term investment capacity was $224 million at December 31, 2010, up slightly from $222 million at September 30, 2010. This (immediately available) capacity to make long-term investments equals the amount of cash we could raise by financing our loans with short-term borrowings, less the amount of cash we set aside for operating expenses, pending trades, and potential margin requirements.
|
|
u
|
Beyond the short term, we could raise additional capacity for long-term investment by re-securitizing a portion of our securities portfolio or by other means.
|
|
u
|
In the near term, we do not anticipate a need to issue equity. Although we plan to invest much of our excess capital in 2011, we are more likely to look to our residential securities portfolio as a source of liquidity for additional investment capacity. We always retain the flexibility to raise equity capital in the future, but we seek to ask shareholders for new capital only when we believe we have accretive investment opportunities that exceed our investment capacity.
|
|
THE REDWOOD REVIEW 4TH QUARTER 2010
|
15
|
|
|
|
FINANCIAL INSIGHTS
|
Summary
|
|
The following table provides a summary of our consolidated GAAP income for the fourth and third quarters of 2010.
|
GAAP Income
($ in millions, except per share data)
|
|
| |
|
Three Months Ended
|
|
| |
|
12/31/10
|
|
|
9/30/10
|
|
|
Interest income
|
|
$ |
56 |
|
|
$ |
59 |
|
|
Interest expense
|
|
|
(22 |
) |
|
|
(24 |
) |
|
Net interest income
|
|
|
34 |
|
|
|
35 |
|
| |
|
|
|
|
|
|
|
|
|
Provision for loan losses
|
|
|
(8 |
) |
|
|
(2 |
) |
|
Market valuation adjustments, net
|
|
|
- |
|
|
|
(2 |
) |
|
Net interest income after provision and market valuation adjustments
|
|
|
26 |
|
|
|
31 |
|
| |
|
|
|
|
|
|
|
|
|
Operating expenses
|
|
|
(13 |
) |
|
|
(12 |
) |
|
Realized gains on sales and calls, net
|
|
|
2 |
|
|
|
2 |
|
|
Noncontrolling interest
|
|
|
- |
|
|
|
(1 |
) |
|
Provision for income taxes
|
|
|
- |
|
|
|
- |
|
|
GAAP income
|
|
$ |
15 |
|
|
$ |
20 |
|
| |
|
|
|
|
|
|
|
|
|
GAAP income per share
|
|
$ |
0.18 |
|
|
$ |
0.25 |
|
|
|
Our consolidated GAAP income for the fourth quarter of 2010 was $15 million, or $0.18 per share, as compared to $20 million or $0.25 per share, for the third quarter of 2010. The decrease in income is the result of a higher provision for loan losses, partially offset by lower negative market valuation adjustments.
|
|
|
Additional information related to GAAP income at Redwood, New Sequoia, and Other Consolidated Entities is discussed in the following pages.
|
|
16
|
THE REDWOOD REVIEW 4TH QUARTER 2010
|
|
|
|
|
FINANCIAL INSIGHTS
|
GAAP Income (continued)
Summary (continued)
|
u
|
The following tables show the estimated effect that Redwood, New Sequoia, and our OtherConsolidated Entities had on GAAP income for the fourth quarter of 2010 and the third quarter of 2010. These components of our income statement are not separate business segments.
|
|
Consolidating Income Statement
Three Months Ended December 31, 2010
($ in millions)
|
|
| |
|
At
Redwood
|
|
|
New
Sequoia
|
|
|
Other
Consolidated
Entities
|
|
|
Intercompany
Adjustments
|
|
|
Redwood
Consolidated
|
|
| |
|
|
|
|
|
|
|
|
|
|
|
|
|
|
|
|
Interest income
|
|
$ |
16 |
|
|
$ |
2 |
|
|
$ |
27 |
|
|
$ |
- |
|
|
$ |
45 |
|
|
Net discount (premium) amortization
|
|
|
12 |
|
|
|
- |
|
|
|
(1 |
) |
|
|
- |
|
|
|
11 |
|
|
Total interest income
|
|
|
28 |
|
|
|
2 |
|
|
|
26 |
|
|
|
- |
|
|
|
56 |
|
| |
|
|
|
|
|
|
|
|
|
|
|
|
|
|
|
|
|
|
|
|
|
Interest expense
|
|
|
(3 |
) |
|
|
(1 |
) |
|
|
(18 |
) |
|
|
- |
|
|
|
(22 |
) |
|
Net interest income
|
|
|
25 |
|
|
|
1 |
|
|
|
8 |
|
|
|
- |
|
|
|
34 |
|
| |
|
|
|
|
|
|
|
|
|
|
|
|
|
|
|
|
|
|
|
|
|
Provision for loan losses
|
|
|
- |
|
|
|
- |
|
|
|
(8 |
) |
|
|
- |
|
|
|
(8 |
) |
|
Market valuation adjustments, net
|
|
|
2 |
|
|
|
- |
|
|
|
(2 |
) |
|
|
- |
|
|
|
- |
|
|
Net interest income (loss) after provision and market valuation adjustments
|
|
|
27 |
|
|
|
1 |
|
|
|
(2 |
) |
|
|
- |
|
|
|
26 |
|
| |
|
|
|
|
|
|
|
|
|
|
|
|
|
|
|
|
|
|
|
|
|
Operating expenses
|
|
|
(13 |
) |
|
|
- |
|
|
|
- |
|
|
|
- |
|
|
|
(13 |
) |
|
Realized gains on sales and calls, net
|
|
|
1 |
|
|
|
- |
|
|
|
1 |
|
|
|
- |
|
|
|
2 |
|
|
Income from New Sequoia
|
|
|
1 |
|
|
|
- |
|
|
|
- |
|
|
|
(1 |
) |
|
|
- |
|
|
Loss from Other Consolidated Entities
|
|
|
(1 |
) |
|
|
- |
|
|
|
- |
|
|
|
1 |
|
|
|
- |
|
|
Noncontrolling interest
|
|
|
- |
|
|
|
- |
|
|
|
- |
|
|
|
- |
|
|
|
- |
|
|
Provision for income taxes
|
|
|
- |
|
|
|
- |
|
|
|
- |
|
|
|
- |
|
|
|
- |
|
| |
|
|
|
|
|
|
|
|
|
|
|
|
|
|
|
|
|
|
|
|
|
Net income (loss)
|
|
$ |
15 |
|
|
$ |
1 |
|
|
$ |
(1 |
) |
|
$ |
- |
|
|
$ |
15 |
|
|
Consolidating Income Statement
Three Months Ended September 30, 2010
($ in millions)
|
|
| |
|
At
Redwood
|
|
|
New
Sequoia
|
|
|
Other
Consolidated
Entities
|
|
|
Intercompany
Adjustments
|
|
|
Redwood
Consolidated
|
|
| |
|
|
|
|
|
|
|
|
|
|
|
|
|
|
|
|
Interest income
|
|
$ |
17 |
|
|
$ |
2 |
|
|
$ |
30 |
|
|
$ |
- |
|
|
$ |
49 |
|
|
Net discount (premium) amortization
|
|
|
10 |
|
|
|
- |
|
|
|
- |
|
|
|
- |
|
|
|
10 |
|
|
Total interest income
|
|
|
27 |
|
|
|
2 |
|
|
|
30 |
|
|
|
- |
|
|
|
59 |
|
| |
|
|
|
|
|
|
|
|
|
|
|
|
|
|
|
|
|
|
|
|
|
Interest expense
|
|
|
(3 |
) |
|
|
(1 |
) |
|
|
(20 |
) |
|
|
- |
|
|
|
(24 |
) |
|
Net interest income
|
|
|
24 |
|
|
|
1 |
|
|
|
10 |
|
|
|
- |
|
|
|
35 |
|
| |
|
|
|
|
|
|
|
|
|
|
|
|
|
|
|
|
|
|
|
|
|
Provision for loan losses
|
|
|
- |
|
|
|
- |
|
|
|
(2 |
) |
|
|
- |
|
|
|
(2 |
) |
|
Market valuation adjustments, net
|
|
|
- |
|
|
|
- |
|
|
|
(2 |
) |
|
|
- |
|
|
|
(2 |
) |
|
Net interest income after provision and market valuation adjustments
|
|
|
24 |
|
|
|
1 |
|
|
|
6 |
|
|
|
- |
|
|
|
31 |
|
| |
|
|
|
|
|
|
|
|
|
|
|
|
|
|
|
|
|
|
|
|
|
Operating expenses
|
|
|
(12 |
) |
|
|
- |
|
|
|
- |
|
|
|
- |
|
|
|
(12 |
) |
|
Realized gains on sales and calls, net
|
|
|
2 |
|
|
|
- |
|
|
|
- |
|
|
|
- |
|
|
|
2 |
|
|
Income from New Sequoia
|
|
|
1 |
|
|
|
- |
|
|
|
- |
|
|
|
(1 |
) |
|
|
- |
|
|
Income from Other Consolidated Entities
|
|
|
5 |
|
|
|
- |
|
|
|
- |
|
|
|
(5 |
) |
|
|
- |
|
|
Noncontrolling interest
|
|
|
- |
|
|
|
- |
|
|
|
(1 |
) |
|
|
- |
|
|
|
(1 |
) |
|
Provision for income taxes
|
|
|
- |
|
|
|
- |
|
|
|
- |
|
|
|
- |
|
|
|
- |
|
| |
|
|
|
|
|
|
|
|
|
|
|
|
|
|
|
|
|
|
|
|
|
Net income
|
|
$ |
20 |
|
|
$ |
1 |
|
|
$ |
5 |
|
|
$ |
(6 |
) |
|
$ |
20 |
|
|
THE REDWOOD REVIEW 4TH QUARTER 2010
|
17
|
|
|
|
FINANCIAL INSIGHTS
|
GAAP Income (continued)
Redwood Parent
|
|
Net interest income at Redwood increased to $26 million in the fourth quarter from $24 million inthe third quarter, primarily as a result of higher interest earned on residential senior securities and unsecuritized residential loans.
|
|
|
Interest income from senior residential securities increased $1 million to $25 million during the fourthquarter as a result of slightly faster prepayment speeds on certain securities. The amount of income we recognize on senior securities is most affected by changes in prepayment rates, and to a lesser extent, changes in interest rates and credit performance.
|
|
|
In the near term, we expect interest income will be primarily derived from our residential securities.However, our rate of investment activity for this portfolio has declined in recent quarters. In future periods, we expect our expanding residential and commercial loan businesses to contribute more significantly to interest income.
|
|
|
During the fourth quarter, loans accumulated for securitization generated $2 million of interest income.The amount of interest income we will earn in future periods from loans accumulated for securitization will vary with the amount of loans acquired, the timing of the loan acquisitions, and the timing of securitizations.
|
|
|
Interest expense totaled $2 million in the fourth quarter, of which the large majority was related toour long-term debt and the related hedges. To hedge the variability in our long-term debt interest expense, we entered into interest rate swaps with aggregate notional values totaling $140 million during the first quarter of 2010, fixing our gross interest expense yield at 6.75%. These swaps are accounted for as cash flow hedges with all interest income recorded as a component of net interest income and other valuation changes recorded as a component of equity through the life of the hedge.
|
|
|
Net positive market valuation adjustments were $2 million in the fourth quarter. These were the resultof a $4 million change in the value of derivatives used to manage certain risks associated with our accumulation of residential loans. Partially offsetting this positive change were impairments of $1 million and a $1 million decline in the value of certain residential securities we mark-to-market through the income statement.
|
|
|
During the fourth quarter of 2010, we recognized $1 million of gains on called securities. When asecurity we own is called we receive a cash payment equal to the outstanding principal and, to the extent this is above our carrying value, a gain is realized. There were no sales of securities during the fourth quarter.
|
|
18
|
THE REDWOOD REVIEW 4TH QUARTER 2010
|
GAAP Income (continued)
Redwood Parent (continued)
|
u
|
The following table presents the components of Redwood’s operating expenses for the fourth and third quarters of 2010.
|
| |
|
|
Operating Expenses at Redwood
|
|
|
($ in millions)
|
|
| |
|
Three Months Ended
|
|
| |
|
12/31/10
|
|
|
9/30/10
|
|
|
Fixed compensation expense
|
|
$ |
3 |
|
|
$ |
3 |
|
|
Variable compensation expense
|
|
|
2 |
|
|
|
2 |
|
|
Equity compensation expense
|
|
|
2 |
|
|
|
2 |
|
|
Total compensation expense
|
|
$ |
7 |
|
|
$ |
7 |
|
| |
|
|
|
|
|
|
|
|
|
Systems
|
|
|
2 |
|
|
|
2 |
|
|
Office costs
|
|
|
2 |
|
|
|
2 |
|
|
Accounting and legal
|
|
|
2 |
|
|
|
1 |
|
|
Total non-compensation expense
|
|
$ |
6 |
|
|
$ |
5 |
|
| |
|
|
|
|
|
|
|
|
|
Total operating expense
|
|
$ |
13 |
|
|
$ |
12 |
|
|
u
|
In the fourth quarter, operating expenses at Redwood were $13 million and remained in line with our expectations.
|
New Sequoia
|
u
|
Information about New Sequoia’s contribution to Redwood’s earnings and other related comments are in the Investments in New Sequoia module on page 31.
|
Other Consolidated Entities
|
|
We recognized a net loss of $1 million in the fourth quarter from our investments in the Fund, Sequoia, and Acacia securitization entities, a decrease of $6 million from the third quarter. This decrease was primarily due to a higher provision for loan losses at Sequoia entities. The provision totaled $8 million in the fourth quarter, an increase of $6 million from the third quarter of 2010. Serious delinquencies (90+ days past due) increased to 3.90% (excluding the Sequoia 2010 securitization) in the fourth quarter from 3.75% at the end of the third quarter, as more loans transitioned to serious delinquency status. While it is too early to make any definitive statements about delinquency trends for the first quarter of 2011, we did not observe an increase in January.
|
|
|
The allowance for loan losses as a percent of serious delinquencies increased to 47% at the end of the fourth quarter, from 45% at the end of the third quarter. There are currently eight Sequoia entities for which we have expensed aggregate loan loss provisions of $3 million in excess of our reported investment for GAAP purposes. We did not deconsolidate any Sequoia entities in 2010.
|
|
THE REDWOOD REVIEW 4TH QUARTER 2010
|
19
|
Taxable Income and Dividends
Summary
As a REIT, Redwood is required to distribute at least 90% of its REIT taxable income (and meet certain other requirements), although Redwood’s board of directors can declare dividends in excess of this minimum requirement. REIT taxable income is defined as income as calculated for tax accounting that is earned at Redwood and its qualified REIT subsidiaries. Redwood also earns taxable income at its taxable subsidiaries which it is not required to distribute. To the extent Redwood retains REIT taxable income that is not distributed to shareholders, it is taxed at corporate tax rates. A reconciliation of GAAP and taxable income is set forth in Table 2 in the Financial Tables in this Review.
Overview
|
|
Redwood’s estimated taxable loss for the fourth quarter of 2010 was $6 million, or $0.07 per share, as compared to an estimated taxable loss of $9 million, or $0.11 per share, for the third quarter of 2010. For the full year in 2010, Redwood’s estimated taxable loss was $16 million, or $0.20 per share, as compared to a taxable loss of $84 million, or $1.12 per share in 2009.
|
|
|
Credit losses continue to be a significant driver of our taxable results and account for the majority of the difference between GAAP and taxable income. In the fourth and third quarters, credit losses as calculated for tax purposes totaled $20 million and $31 million, respectively, and were charged directly to taxable earnings since the tax code does not allow for the establishment of credit reserves.
|
|
|
We currently expect to realize a taxable loss for the full year in 2011 since we anticipate an additional $208 million of losses on securities in future periods for tax purposes. However, the timing of credit losses on securities we own has a large impact on our quarterly taxable income. If losses are delayed as a result of loan modifications, mortgage servicing related issues, or for other reasons, the realization of these anticipated losses will take longer than if the pace of foreclosure activity increases. In the interim, we will continue to earn interest on these securities.
|
|
|
On November 15, 2010, our board of directors declared a regular dividend of $0.25 per share for the fourth quarter, which was paid on January 21, 2011 to shareholders of record on December 31, 2010. The board of directors also announced its intention to continue to pay a regular dividend of $0.25 per share per quarter in 2011.
|
|
|
Under the federal income tax rules applicable to REITs, Redwood’s 2010 dividend distributions are expected to be characterized for income tax purposes as 62% ordinary income and 38% return of capital. None of Redwood’s 2010 dividend distributions is expected to be characterized for federal income tax purposes as long-term capital gain dividends.
|
|
20
|
THE REDWOOD REVIEW 4TH QUARTER 2010
|
Taxable Income and Dividends (continued)
Overview (continued)
|
|
Unlike 2010, Redwood’s 2009 dividends were characterized for tax purposes as 100% return of capital. In both 2010 and 2009 Redwood did not have dividend distribution requirements. The primary difference that resulted in our dividend being characterized as a return of capital in 2009 was that in 2009 earnings plus net long-term capital gains, before any carry-back, were negative while in 2010, earnings plus net long-term capital gains, before applying any carry-back, were positive.
|
|
|
The characterization of our 2011 dividend for tax purposes as either ordinary income, capital gains, or return of capital will depend upon numerous factors, including the amount of earnings and any net long-term capital gains (for tax purposes) we generate during the year. At this time, it is too early to characterize the potential tax status of our anticipated dividends in 2011, but we will monitor the status on a quarterly basis.
|
|
THE REDWOOD REVIEW 4TH QUARTER 2010
|
21
|
|
|
|
FINANCIAL INSIGHTS
|
Cash Flow
|
|
In the fourth quarter, our cash flow was in line with our expectations.
|
|
|
The sources and uses of cash in the table below are derived from our GAAP Consolidated Statement of Cash Flow for the fourth and third quarters of 2010 by aggregating and netting all items in a manner consistent with the way management analyzes them. This table excludes the gross cash flow generated by our Sequoia and Acacia securitization entities and the Fund (cash flow that is not available to Redwood), but does include the cash flow distributed to Redwood as a result of our investments in these entities. The beginning and ending cash balances presented in the table below are GAAP amounts.
|
| |
|
|
Redwood
Sources and Uses of Cash
($ in millions)
|
|
| |
|
|
|
| |
|
Three Months Ended
|
|
| |
|
12/31/10
|
|
|
9/30/10
|
|
|
Beginning cash balance
|
|
$ |
189 |
|
|
$ |
288 |
|
|
Sources of cash
|
|
|
|
|
|
|
|
|
|
Loans at Redwood
|
|
|
6 |
|
|
|
- |
|
|
Securities at Redwood - principal and interest
|
|
|
|
|
|
|
|
|
|
Residential senior
|
|
|
42 |
|
|
|
36 |
|
|
Residential Re-REMIC
|
|
|
2 |
|
|
|
2 |
|
|
Residential subordinate
|
|
|
8 |
|
|
|
9 |
|
|
Commercial and CDO
|
|
|
1 |
|
|
|
2 |
|
|
Securities at Redwood - sales
|
|
|
- |
|
|
|
- |
|
|
Investments in Consolidated Entities
|
|
|
11 |
|
|
|
11 |
|
|
Short-term debt financing
|
|
|
44 |
|
|
|
- |
|
|
Derivative margin returned, net
|
|
|
26 |
|
|
|
- |
|
|
Changes in working capital
|
|
|
3 |
|
|
|
- |
|
|
Total sources of cash
|
|
|
143 |
|
|
|
60 |
|
| |
|
|
|
|
|
|
|
|
|
Uses of cash
|
|
|
|
|
|
|
|
|
|
Acquisitions of residential loans
|
|
|
(195 |
) |
|
|
(62 |
) |
|
Originations of commercial loans
|
|
|
(30 |
) |
|
|
- |
|
|
Acquisitions of securities (1)
|
|
|
(29 |
) |
|
|
(48 |
) |
|
Cash operating expenses
|
|
|
(9 |
) |
|
|
(9 |
) |
|
Interest expense on long-term debt
|
|
|
(2 |
) |
|
|
(2 |
) |
|
Derivative margin posted, net
|
|
|
- |
|
|
|
(17 |
) |
|
Dividends
|
|
|
(20 |
) |
|
|
(20 |
) |
|
Changes in working capital
|
|
|
- |
|
|
|
(1 |
) |
|
Total uses of cash
|
|
|
(285 |
) |
|
|
(159 |
) |
| |
|
|
|
|
|
|
|
|
|
Net uses of cash
|
|
$ |
(142 |
) |
|
$ |
(99 |
) |
|
Ending cash balance
|
|
$ |
47 |
|
|
$ |
189 |
|
| |
|
|
|
|
|
|
|
|
| (1) Total acquisitions of securities in the fourth quarter of 2010 were $26 million. Securities acquisitions of $3 million made in the third quarter that did not settle until early October are also reflected in this table. |
|
|
Cash generated in the fourth quarter from our loans and securities at Redwood and investments in consolidated entities totaled $70 million (compared to $60 million in the third quarter) and exceeded our cash operating expenses of $9 million, interest expense of $2 million, and dividends of $20 million.
|
|
|
The $10 million increase resulted from a $6 million increase in cash flow from our investment in senior securities due to faster prepayments and $6 million from our recently acquired mortgage loans that we intend to securitize, partially offset by $2 million lower cash flow from our decreasing balance of subordinate securities.
|
|
|
Our largest uses of cash in the fourth quarter were for the acquisition of $195 million of residential loans, the origination of $30 million of commercial loans, and acquisitions of seasoned RMBS of $29 million.
|
|
|
Cash flow from securities and investments can be volatile from quarter to quarter depending on the level of invested capital, the timing of credit losses, acquisitions, sales, and changes in prepayments and interest rates.
|
|
22
|
THE REDWOOD REVIEW 4TH QUARTER 2010
|
|
|
|
MARKET UPDATE ON PRIVATE RESIDENTIAL MORTGAGE SECURITIZATION
|
Market Update — Private Residential Mortgage Securitization
Calling this a “market update” may be a bit of a stretch, since only one new-issue residential mortgage-backed securitization has closed in the past two plus years. In our opinion, if the recent Obama Administration’s recommendations to Congress contained in the Treasury Department’s white paper “Reforming America’s Housing Finance Market” are enacted, it will be a game changer.
As specifically cited in Treasury’s paper, the reform plan is designed to “pave the way for a robust private mortgage market by reducing government support for housing and winding down Fannie Mae and Freddie Mac on a responsible timeline.” Although implementation of reforms will take time, if reform is implemented as set forth in the plan, it will be a positive long-term development for private residential mortgage investors such as Redwood Trust.
What Has Been the Biggest Impediment to Reviving Private Residential Mortgage-Backed Securitization?
During the financial crisis, government intervention into the mortgage market through the GSEs and the FHA was essential to maintaining the flow of mortgage liquidity to support housing. Private mortgage financing through securitization had dried up and banks were generally unable to step up and fill the void, as their balance sheets were under pressure.
As we sit here today, post crisis, we cannot help but notice that other private asset-backed securities (ABS) markets (credit cards, auto loans, and now even CMBS) are up and functioning, while residential ABS issuance has barely budged. Many have asked, “Why?” To us, there are several contributing factors that are discussed below, but the sine qua non is the über level of attractive government financing that is currently crowding out traditional private market financing.
When you look at how the other ABS markets have recovered, success begets success. Look at the CMBS market for example. It was closed for business a year ago and now estimates are for CMBS issuance in 2011 to be in the $40 to $50 billion range. In one June 2010 CMBS transaction, the senior security was sold at a spread of 1.75% over 10-year Treasuries, compared to a comparable February 2011 transaction that was sold at a spread of 1.17% over 10-year Treasuries. The additional market liquidity provided through securitization has been a win for sponsors, for investors, and especially for borrowers.
Major banks are benefiting by selling about 90% of their mortgage originations into a very attractive, government bid. Further, banks currently have low funding costs and ample balance sheet capacity to hold the remaining jumbo mortgage loans in their portfolios. As a result, there is no financial motivation for banks to securitize loans or sell loans to others such as Redwood for private securitization to gain any significant issuance velocity. We say this not to bash banks or regulators — it just is what it is. The bottom line is that faster velocity in private residential issuance will come when there is a change to the status quo. The Obama Administration’s reform plan, if enacted, should do just
that.
|
THE REDWOOD REVIEW 4TH QUARTER 2010
|
23
|
 |
|
|
MARKET UPDATE ON PRIVATE RESIDENTIAL MORTGAGE SECURITIZATION
|
Highlights of the Housing Reform Plan
The Administration’s GSE reform plan proposes a dramatic transformation of the role of government in the housing finance market by substantially reducing its role in favor of the private market, which would become the primary source of mortgage credit and the bearer of credit losses. Over the last three years the government has guaranteed nearly 90% of mortgage originations, compared to an average of 51% over the past 25 years.
Under the Administration’s plan, the wind down of Fannie Mae and Freddie Mac would occur over 5 to 7 years. The government sponsored conforming loan limits may be reduced at a significantly faster pace. Separately, the Federal Housing Administration (FHA) would become the primary public housing policy entity for first-time and low- and moderate-income homebuyers. The FHA would also return to its historical market share of 10-15% from closer to 30% more recently. The plan calls for the government’s future role to be primarily limited to oversight and consumer protection, targeted assistance for low- and moderate-income homeowners and renters through the FHA, and support for market stability and crisis
response.
Some of the key reforms laid out in the plan would require Congressional action, while others would only require regulatory or policy changes. Specifically, the plan calls for:
|
|
Allowing the high cost conforming loan limit to roll back from the current level of $729,750 to $625,500 as scheduled under existing law on September 30, 2011. If the plan goes forward, further decreases seem likely in future periods, although these further decreases would require a change in law.
|
|
|
Increasing the fees that Fannie Mae and Freddie Mac charge for guaranteeing their MBS to a rate that is consistent with private capital market standards and increasing the down payment requirement to a minimum of 10%. These reforms could be implemented by the Federal Housing Finance Agency and would help level the playing field between government and private mortgage financing.
|
|
|
Requiring the GSEs to reduce their retained portfolios by at least 10% per year, which would reduce the future risk profile of the GSEs.
|
To implement the proposed reforms, the report outlined three options for Congress and the Administration to consider. Option 1 calls for a privatized system of housing finance with a limited government role to be implemented largely through the FHA for targeted groups. Option 2 is similar to Option 1, but additionally calls for implementing a government guarantee mechanism that would scale up during times of crisis. Option 3 is similar to Option 1, but additionally calls for the government to offer reinsurance for the securities issued by private entities. This last option is similar to our GSE reform plan submitted to Treasury last summer. All three options should be favorable for Redwood’s business
model.
|
24
|
THE REDWOOD REVIEW 4TH QUARTER 2010
|
|
|
|
MARKET UPDATE ON PRIVATE RESIDENTIAL MORTGAGE SECURITIZATION
|
Can the Government Price Credit Risk Better than the Private Sector?
Option 3 calls for the government to remain in the mortgage guarantee business as a catastrophic reinsurer behind private capital. The government would charge premiums “which would be used to cover future claims and recoup losses to protect taxpayers.” We recall comments by Edward DeMarco, FHFA Acting Director, in his statement to a House subcommittee on September 15, 2010, when he stated “it is reasonable to question whether all conventional mortgages warrant a government guarantee.”1 He then made the following three observations. First, he questioned whether the government would be any better than the private sector at
pricing mortgage tail risk and he noted that if a government backstop is underpriced, “taxpayers eventually may foot the bill again.” Second, he questioned whether the government would become political in allocating its credit backstop, resulting in potentially more credit problems. Finally, he noted that a credit backstop in addition to all other existing tax policies aimed at housing (such as deductibility of interest expense) would further direct resources to housing against alternative uses of funds.
Get Ready for Debates
We understand and appreciate the sincere concern expressed by many that a disruption in the status quo would lead to significantly higher mortgage rates for average Americans. The debates have already begun and are likely to intensify. Complicating any decision to move ahead with mortgage reform is a classic “Catch-22” situation.
On the one hand, so the argument goes, if the government pulls back at time when the private markets are not fully functioning, then credit will become scarcer and mortgage rates will rise — with an attendant negative impact on the housing market.2 On the other hand, the single biggest reason why there is a dearth of non-agency securitization is the ease and attractiveness of selling to a government subsidized bid. It is a circular, self-fulfilling argument.
Sooner or later (we hope sooner), the status quo needs to be tested through a gradual, well-planned process that has safeguards at each incremental phase to ensure that the private sector is ready to step in to offer attractive mortgage financing as the government steps back. In our opinion, the status quo is an untenable, unsustainable burden on taxpayers. The government cannot continue to support 90-plus percent of a $10.5 trillion mortgage market — especially when you consider that U.S. Treasury debt now exceeds $14 trillion.
Some have pinned the reason for the small amount of issuance on a lack of triple-A or credit investor appetite for non-agency investments. We think this argument is a red herring. Yes, triple-A investors are mad as hell and some have sworn never to buy a private label RMBS again. Yes, investors have demands around disclosure transparency, alignment of interests, loan quality, structural investor protections, and servicing. However, if one meets investor demands (many of which we believe are reasonable), we believe there is an abundance of private money through banks, insurance companies, and mutual funds that is searching for attractive, risk-adjusted yields.
1 Statement of Edward J. DeMarco, Action Director, Federal Housing Finance Agency, before the U.S. House of Representatives Subcommittee on Capital Markets, Insurance, and Government-Sponsored Enterprises, The Future of Housing Finance: A Progress Update on the GSEs, September 15, 2010.
2 The average spread between jumbo mortgage rates and conforming mortgage rates from 2000 through 2007 was 0.24%. The average of this spread increased to 0.45% from 2000 through 2010, including an average spread of 1.24% during the crisis years of 2008 and 2009. The current spread is closer to 0.50%. (Source: Bloomberg and Banxquote.)
|
THE REDWOOD REVIEW 4TH QUARTER 2010
|
25
|
|
|
|
MARKET UPDATE ON PRIVATE RESIDENTIAL MORTGAGE SECURITIZATION
|
Other Impediments to Private Mortgage-Backed Securitization
Over the past year, participants in the origination and securitization process have seen numerous regulatory proposals and, of course, the Dodd-Frank Act put forth various ideas and frameworks for reforming the regulatory regime that governs residential mortgage securitization. Uncertainty about where all of these proposals will settle has been an obvious headwind. Hopefully, we will soon move from uncertainty to certainty on the crucial implementation details for Dodd-Frank and related regulations. We have all had enough of the handicapping, guessing, and odds-setting on what the final proposals for how qualified residential mortgages will be defined and what risk retention will look like. Once the rules of road are known,
market participants throughout the mortgage chain can begin to adjust their policies, practices, and operations. In reality, it will only be after participants in this market begin to function under new rules that we will have the best empirical evidence of whether the regulatory framework needs tweaking in one direction or another.
In terms of process, another big hurdle relates to the rating agencies. In particular, we think the industry needs the rating agencies to establish some level of consistency for what we refer to as their “front end” processes – i.e., originator reviews, servicer reviews, data requirements, and due diligence standards. This is where consistency makes sense and uniform standards will encourage issuers to retain more than one rating agency. In the absence of some level of consistency, it becomes very difficult to accomplish a multi-rated residential deal. Obviously, each rating agency should have its own ratings methodology in order to preserve its independence and offer investors a range of credit views.
Consistency on the front-end won’t undermine this independence and, in fact, will likely result in more multi-rated deals.
While Redwood will keep stubbornly scratching away to get the plumbing working from origination all the way through securitization, it would be helpful if major banks and/or financial firms, who have the loans and expertise, stepped up and completed non-agency residential securitizations with an eye toward attaining consistency around securitization best practices. This would be an important step forward that the private sector could take in response to the initial steps the government is taking to back away from its current, near full support for this market. These other players have a long-term interest in a well functioning residential securitization market, even though they may not need it in the short term.
|
26
|
THE REDWOOD REVIEW 4TH QUARTER 2010
|
Summary
We continually update our outlook for the housing market, which is a critical component of our investment activities and management of our mortgage-backed securities portfolio. While the information provided below is focused on our macro outlook for housing, for investment purposes our housing outlook is much more micro oriented, based on each market down to either zip codes or metropolitan statistical areas.
Quarterly Update
|
|
We expect housing to struggle as an asset class for several more years, although we currently believe that a significant “double dip” is unlikely. Over the long term, home prices have closely followed income trends, and it appears that this relationship will be a moderating force on home values for the foreseeable future.
|
|
|
Nationally, homes remain overpriced compared to income (based on the historical correlation), but this gap is small and closing as shown in the chart below. We expect that another 5 to 10% decline will be necessary to close this gap, with significant regional variation. But this is not the feared “double dip” currently being discussed in the media. We view the more recent renewed decline in prices as the natural conclusion of the affordability-driven correction that began in 2006, which had an approximate 18 month “time out” as a result of heightened efforts to support housing through tax credits and loan modification programs and then exacerbated by delays in foreclosures resulting from mortgage servicing related issues.
|
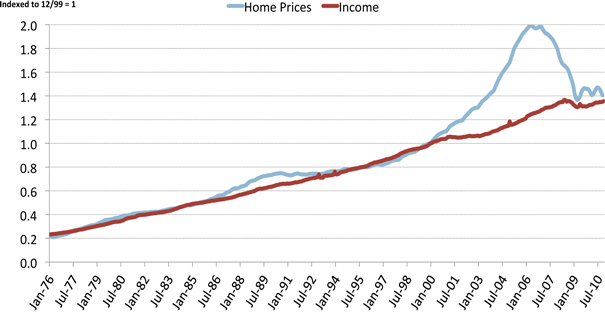 |
| |
| Source: CoreLogic National Home Price Index, Bureau of Labor Statistics |
|
|
Historically, home prices have tended to find a backstop in the form of potential home buyers, who have limit price declines. Home prices usually don’t go to zero — as home prices tend to find support when those prices fall to a level consistent with local incomes. At that point, those who were priced out of bubble markets find home ownership to be within reach.
|
|
THE REDWOOD REVIEW 4TH QUARTER 2010
|
27
|
Quarterly Update (continued)
|
|
These “backstop buyers” will be encouraged by the relative costs of homeownership versus renting. Trulia Real Estate Search (a provider of residential real estate information) estimates that buying a home is already cheaper than renting in 72% of major US cities, though key jumbo areas like California and New York are not there yet. Rents are on the rise and apartment markets are tightening almost everywhere. According to Reis Inc. (a provider of commercial real estate performance data), 77 out of 82 major markets saw rent increases in the fourth quarter, including troubled housing markets like Phoenix and Miami.
|
|
|
The primary downside risk to our forecast is oversupply. S&P claims the “shadow inventory” of distressed properties would amount to 44 months of supply if they were all listed today. However, we do not expect all these properties to be brought to market at the same time. Total current inventories are actually well below their peak in 2008 according to the National Association of Realtors, and while listings rose 8.4% in 2010, it would take almost 5 years at this rate of increase to add the number of properties from S&P’s forecast. We believe that the current, elevated level of home supply will persist for a long time – potentially years – as servicers work their way through the backlog. Currently, it seems that the millions of distressed homes in the backlog are
being brought to market at a measured pace, not in a wave.
|
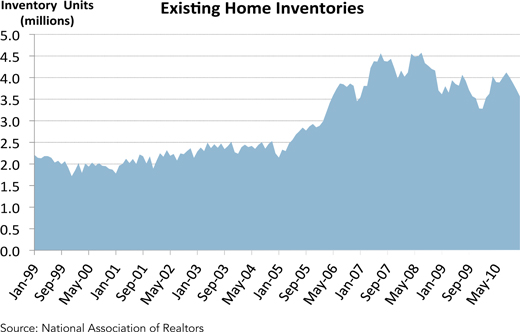
|
|
Rising mortgage rates pose an additional downside risk to our home price forecast. Rising rates reduce the amount of home one can afford with a given level of income. Thus, rising interest rates increase the amount of home price decline that will be necessary to restore home affordability to healthy levels. On the other hand, under certain circumstances, the inflation that usually accompanies higher rates may lead to increased nominal home prices, which would be good for underwater borrowers and could potentially reduce future loss severities.
|
|
28
|
THE REDWOOD REVIEW 4TH QUARTER 2010
|
Quarterly Update (continued)
|
|
The charts below reflect the affordability trends in selected markets throughout the U.S.
|
|
THE REDWOOD REVIEW 4TH QUARTER 2010
|
29
|
 |
|
RESIDENTIAL MORTGAGE LOAN BUSINESS
|
Summary
We purchase newly originated loans (primarily prime jumbo loans) that meet our collateral criteria from approved lenders on a flow or bulk basis. Loans acquired through this process (our “conduit”) are expected to be securitized through new Sequoia securitization entities. Our conduit allows lenders to reduce their exposure to interest and credit risk associated with residential mortgage loans, free up capital for additional lending, and potentially reduce hedging costs as a result of our price commitments.
Quarterly Update
|
|
At December 31, 2010, residential loans purchased and held on our balance sheet for future securitization totaled $253 million, up from $64 million at September 30, 2010. At December 31, 2010, the pipeline of rate-locked residential mortgage loans we plan to purchase through our conduit totaled $119 million, down from $219 million at September 30, 2010. At February 17, 2011, the pipeline totaled $88 million and loans purchased and held on our balance sheet for future securitization totaled $321 million (including $295 million allocated to securitization activity referred to in our recent press release dated February 18, 2011).
|
|
|
Our goal is to establish our conduit as a leading source of liquidity for the prime jumbo mortgage market, where originators are able to obtain timely purchase commitment decisions and price protection.
|
|
|
Over time, we want to bolster the Sequoia platform’s reputation among institutional investors as: 1) an issuer of high-quality residential mortgage-backed securities; 2) an issuer whose interests are closely aligned with those of investors as a result of Redwood and/or its subsidiaries retaining the first loss subordinate securities; and, 3) an issuer that has no origination or servicing related conflicts of interest.
|
|
|
The size of the jumbo market is potentially vast — suggesting an opportunity that well exceeds our current capital available to invest. For example, if annual residential mortgage originations return to $1.5 trillion and jumbo loans account for 20% (the median from 1993 through 2010), jumbo loan originations would amount to $300 billion.
|
|
30
|
THE REDWOOD REVIEW 4TH QUARTER 2010
|
|
|
|
INVESTMENTS IN NEW SEQUOIA
|
Summary
This module reflects our investment in Sequoia securitization entities created in 2010 and subsequent periods. Sequoia securitization entities are entities that acquire residential mortgage loans through our conduit and issue asset-backed securities (ABS) backed by these loans. Generally, the loans that New Sequoia entities have acquired are prime-quality loans that have been originated in 2009 and later periods. Most of the senior or investment-grade rated ABS issued by New Sequoia entities have been sold to third-party investors; Redwood has retained the subordinate or non-investment grade securities.
Quarterly Update
|
|
In the fourth quarter of 2010, we reported GAAP income of $1 million from interest on our investments, and our investments in this securitization entity generated cash of $3 million.
|
|
|
We did not complete a Sequoia securitization in the fourth quarter. With respect to new securitization activity, we refer you to our recent press release, dated February 18, 2011. We continue to acquire loans for future securitizations.
|
|
|
At December 31, 2010, our investment in our 2010 Sequoia securitization totaled $24 million. Our investment consists of senior and subordinate securities and IOs.
|
|
|
For GAAP purposes, we account for our Sequoia securitizations as financings and the assets and liabilities are carried on our balance sheet at their amortized cost. As a result, our $24 million investment in 2010 Sequoia does not appear on our GAAP consolidated balance sheet as an investment; rather, it is reflected as the difference, at December 31, 2010, between the $147 million of consolidated assets of New Sequoia and the $123 million of consolidated ABS issued to third parties. (See Redwood’s consolidating balance sheet on page 11.)
|
|
|
There were no delinquencies in the loans underlying our 2010 Sequoia securitization at December 31, 2010.
|
|
THE REDWOOD REVIEW 4TH QUARTER 2010
|
31
|
|
|
|
RESIDENTIAL REAL ESTATE SECURITIES
|
Summary
Redwood invests in securities that are backed by pools of residential real estate loans. Some of our investments in residential real estate securities are backed by prime residential loans, while others are backed by non-prime loans such as Alt-A loans. The following discussion refers only to the residential securities owned by Redwood, exclusive of the securities owned by the Fund, Sequoia entities, and Acacia entities, and exclusive of Redwood’s investments in these entities.
Market Conditions and Portfolio Activity
|
|
Prices for non-agency RMBS continued to move higher, in spite of higher interest rates during the quarter. Across all fixed income sectors, asset managers of every type (banks, insurance companies, hedge funds, money managers) appear to be taking their direction from the massive liquidity provided by the Federal Reserve. Global investor sentiment suggests a belief that any slowdown or any crisis will be backstopped by the Fed and by the European Central Bank. In such an environment, risk taking is encouraged, which is exactly what we are seeing across all credit markets. As a result, investors continue to be challenged to find places to deploy cash, which helped push prices up by several points during the
quarter.
|
Delinquencies
|
|
Delinquencies ticked up slightly, and remained at elevated levels at December 31, 2010. According to LoanPerformance data, serious (60+ day) delinquencies rose by 0.8% quarter over quarter to 11.2% for prime loans and 0.5% quarter over quarter to 33.1% for Alt-A loans. The delinquencies on loans underlying Redwood’s portfolio are modestly lower than the industry as a whole, looking at similar loan types.
|
|
|
Early-stage roll rates (from loans always current to 30 days delinquent) were flat in the quarter, and remain much lower than they were one year ago. Of previously ‘always current’ prime loans, 0.6% missed their first payment in December 2010, down from 0.9% in December 2009, while the same metric for Alt-A loans fell to 1.5% from 2.4% over the same period. Over time, a drop in this roll rate will cause overall delinquencies to fall, but for now the slowdown in new delinquencies is being balanced by an extension in liquidation timelines.
|
Prepayments
|
|
Prepayments accelerated in the fourth quarter, but mostly for borrowers with equity in their homes and good credit. Prime borrowers with loan-to-value (LTV) ratios below 100% prepaid at 27% CPR in December (up from 22% in September), while Alt-A borrowers with equity prepaid at only 11% CPR (up from 9%). The difference between Prime and Alt-A speeds suggests that tight underwriting continues to impede refinancing activity. Borrowers without equity prepaid very slowly regardless of credit quality, with prime and Alt-A loans with LTV ratios above 100% prepaying at only 7% and 1% CPR respectively, in line with last quarter.
|
|
32
|
THE REDWOOD REVIEW 4TH QUARTER 2010
|
|
|
|
RESIDENTIAL REAL ESTATE SECURITIES
|
Quarterly Update
|
|
Interest income generated by our residential AFS securities was $23 million in the fourth quarter of 2010, resulting in an annualized yield of 14.0% on the amortized cost of these securities.
|
|
|
At December 31, 2010, the fair value of residential securities we own totaled $814 million, consisting of $316 million in prime senior securities, $346 million in non-prime senior securities, $85 million in re-REMIC securities, and $67 million in subordinate securities. Each of these categories is further discussed on the following pages.
|
|
|
At December 31, 2010, 36% of the securities we held were fixed-rate assets, 43% were adjustable-rate assets that reset within the next year, 7% were hybrid assets that reset between 12 and 36 months, and 14% were hybrid assets that reset after 36 months.
|
|
THE REDWOOD REVIEW 4TH QUARTER 2010
|
33
|
 |
|
RESIDENTIAL REAL ESTATE SECURITIES
|
Residential Prime Senior Securities Portfolio
What is this?
Residential prime securities are mortgage-backed securities backed by prime residential mortgage loans. Senior securities are those interests in a securitization that have the first right to cash flows and are last in line to absorb losses. Information on prime senior securities we own and underlying loan characteristics are set forth in Tables 5 through 8A in the Financial Tables in this Review.
Quarterly Update
|
|
The following table presents information on residential prime senior securities at Redwood at December 31, 2010. For GAAP, we account for all of these securities as available-for-sale.
|
| |
|
|
Credit Support Analysis - Prime Senior Securities at Redwood
|
|
|
By Vintage
|
|
|
December 31, 2010
|
|
|
($ in millions)
|
|
| |
|
|
|
|
|
|
|
|
|
|
|
|
|
|
|
| |
|
<=2004
|
|
|
2005
|
|
|
2006
|
|
|
2007
|
|
|
Total
|
|
|
Current face
|
|
$ |
15 |
|
|
$ |
261 |
|
|
$ |
12 |
|
|
$ |
70 |
|
|
$ |
358 |
|
|
Net unamortized discount
|
|
|
(3 |
) |
|
|
(63 |
) |
|
|
(4 |
) |
|
|
(14 |
) |
|
|
(84 |
) |
|
Credit reserve
|
|
|
- |
|
|
|
(11 |
) |
|
|
- |
|
|
|
(4 |
) |
|
|
(15 |
) |
|
Unrealized gains
|
|
|
1 |
|
|
|
41 |
|
|
|
2 |
|
|
|
13 |
|
|
|
57 |
|
| |
|
|
|
|
|
|
|
|
|
|
|
|
|
|
|
|
|
|
|
|
|
Fair value of prime senior securities
|
|
$ |
13 |
|
|
$ |
228 |
|
|
$ |
10 |
|
|
$ |
65 |
|
|
$ |
316 |
|
| |
|
|
|
|
|
|
|
|
|
|
|
|
|
|
|
|
|
|
|
|
|
Overall credit support to prime senior securities (1)
|
|
|
11.52 |
% |
|
|
6.96 |
% |
|
|
5.46 |
% |
|
|
7.88 |
% |
|
|
7.41 |
% |
|
Serious delinquencies as a % of collateral balance (1)
|
|
|
9.66 |
% |
|
|
8.43 |
% |
|
|
9.13 |
% |
|
|
8.50 |
% |
|
|
8.52 |
% |
(1) Overall credit support and serious delinquency rates are weighted by securitization balances. Credit support and delinquencies may vary significantly by securitization. Serious delinquencies include loans over 90-days past due, in foreclosure, and REO.
|
|
The overall credit support data presented in the table above represents the level of support for prime securities owned by Redwood weighted by the securitization, or underlying collateral, balance rather than the book value or market value of the securities. We present similar tables for our non-prime securities on page 36 and non-senior securities on page 38.
|
|
|
At December 31, 2010, the average overall level of credit support was 7.41%. For an individual security with this level of credit support, this would mean that losses experienced on the collateral would have to exceed 7.41% before the security would suffer losses. Comparing the level of credit support available to seriously delinquent loans provides one measure of the level of credit sensitivity that exists within our senior securities portfolio. For example, assuming an individual senior bond has the average characteristics of the portfolio, 7.41% of credit support and serious delinquencies of 8.52%, all of the seriously delinquent loans could be liquidated with a 50% severity, generating losses of 4.26%. This hypothetical
security would then have 3.15% credit support remaining to absorb future losses, before the senior securities would start to absorb losses.
|
|
34
|
THE REDWOOD REVIEW 4TH QUARTER 2010
|
|
|
|
RESIDENTIAL REAL ESTATE SECURITIES
|
Residential Prime Senior Securities Portfolio (continued)
Quarterly Update (continued)
|
|
We would emphasize that no individual security has the average characteristics of the portfolio. Individual securities may have more or less credit support than the average, or more or less seriously delinquent loans than the average. As such, certain securities have a more positive credit enhancement to serious delinquency ratio while others have a less positive or negative ratio. As a result, it is possible for some individual securities to incur losses without aggregate portfolio losses exceeding the overall portfolio credit support. For example, in the first quarter of 2010, we incurred credit losses of $2 million for GAAP purposes on senior securities, even though aggregate losses did not exceed our overall credit
support. There were no credit losses on our prime senior securities in the last three quarters of 2010.
|
|
|
Securities are acquired assuming a range of outcomes based on modeling of expected performance at the individual loan level for both delinquent and current loans. Over time, the performance of these securities may require a change in the amount of credit reserves we designate.
|
|
|
The fair value of our prime senior securities was equal to 88% of the face value of the portfolio (compared to 86% in the prior quarter), while our amortized cost was equal to 72% of the face value at December 31, 2010. These securities generated $21 million of cash from principal and interest in the fourth quarter compared to $19 million in the third quarter. The annualized yield in the fourth quarter for our prime senior securities was 12.7%.
|
|
THE REDWOOD REVIEW 4TH QUARTER 2010
|
35
|
|
|
RESIDENTIAL REAL ESTATE SECURITIES
|
Residential Non-Prime Senior Securities Portfolio
What is this?
Residential non-prime securities are mortgage-backed securities backed by non-prime residential mortgage loans. Non-prime residential loans include Alt-A and Option ARM mortgage loans. Senior securities are those interests in a securitization that have the first right to cash flows and are last in line to absorb losses. Information on non-prime senior securities we own and underlying loan characteristics are set forth in Tables 5 through 8B in the Financial Tables in this Review.
Quarterly Update
|
|
The following table presents information on residential non-prime senior securities at Redwood at December 31, 2010. We account for the large majority of these securities as available-for-sale and others as trading securities.
|
|
Credit Support Analysis - Non-Prime Senior Securities at Redwood
By Vintage
December 31, 2010
($ in millions)
|
|
| |
|
|
|
|
|
|
|
|
|
|
|
|
| |
|
<=2004
|
|
|
2005
|
|
|
2006
|
|
|
Total
|
|
|
Current face
|
|
$ |
136 |
|
|
$ |
269 |
|
|
$ |
11 |
|
|
$ |
416 |
|
|
Net unamortized discount
|
|
|
(34 |
) |
|
|
(69 |
) |
|
|
(2 |
) |
|
|
(105 |
) |
|
Credit reserve
|
|
|
(1 |
) |
|
|
(14 |
) |
|
|
(1 |
) |
|
|
(16 |
) |
|
Unrealized gains
|
|
|
15 |
|
|
|
15 |
|
|
|
1 |
|
|
|
31 |
|
| |
|
|
|
|
|
|
|
|
|
|
|
|
|
|
|
|
|
Fair value of non-prime senior securities - AFS
|
|
$ |
116 |
|
|
$ |
201 |
|
|
$ |
9 |
|
|
$ |
326 |
|
| |
|
|
|
|
|
|
|
|
|
|
|
|
|
|
|
|
|
Overall credit support to non-prime senior securities (1)
|
|
|
16.53 |
% |
|
|
13.40 |
% |
|
|
19.89 |
% |
|
|
14.34 |
% |
|
Serious delinquencies as a % of collateral balance (1)
|
|
|
11.69 |
% |
|
|
14.03 |
% |
|
|
19.02 |
% |
|
|
13.71 |
% |
| |
|
|
|
|
|
|
|
|
|
|
|
|
|
|
|
|
|
Fair value of non-prime senior securities - trading
|
|
$ |
1 |
|
|
$ |
19 |
|
|
$ |
- |
|
|
$ |
20 |
|
| |
|
|
|
|
|
|
|
|
|
|
|
|
|
|
|
|
|
Fair value of non-prime senior securities
|
|
$ |
117 |
|
|
$ |
220 |
|
|
$ |
9 |
|
|
$ |
346 |
|
(1) Overall credit support and serious delinquency rates are weighted by securitization balances. Credit support and delinquencies may vary significantly by securitization. Serious delinquencies include loans over 90-days past due, in foreclosure, and REO.
|
u
|
Serious delinquencies in our non-prime senior portfolio are significantly higher than in our prime senior portfolio. However, the levels of credit and structural support are also significantly higher and, as a result, our non-prime senior portfolio is better able to withstand the higher levels of credit losses we expect to incur on these pools. In the fourth quarter, our senior non-prime securities incurred no credit losses compared to $1 million in the third quarter. Please refer to the first two bullets under the table on page 34 and the first bullet on the top of page 35 for further discussion on the characteristics and limitations of the table on page 34, which discussion is also applicable to the table
above.
|
|
36
|
THE REDWOOD REVIEW 4TH QUARTER 2010
|
|
|
|
RESIDENTIAL REAL ESTATE SECURITIES
|
Residential Non-Prime Senior Securities Portfolio (continued)
Quarterly Update (continued)
|
u
|
The fair value of our non-prime senior securities AFS was equal to 78% of the face value of the portfolio (compared to 77% in the prior quarter), while our amortized cost was equal to 71% of the face value at December 31, 2010.
|
|
u
|
The non-prime AFS senior securities portfolio generated $19 million of cash from principal and interest in the fourth quarter, compared to $15 million in the third quarter. The annualized yield in the fourth quarter for our non-prime AFS senior securities was 11.2%.
|
|
u
|
We also own non-prime senior securities that are accounted for as trading securities, which are carried at their fair value of $20 million and therefore do not have GAAP credit reserves or purchase discounts. The non-prime trading senior securities portfolio generated $2 million of cash from principal and interest in the fourth and third quarters. The annualized yield in the fourth quarter for our non-prime trading senior securities was 42.1%.
|
|
THE REDWOOD REVIEW 4TH QUARTER 2010
|
37
|
|
|
RESIDENTIAL REAL ESTATE SECURITIES
|
Residential Non-Senior Securities Portfolio
What is this?
Non-senior securities include subordinate and re-REMIC securities. We have combined them in this section because together they currently represent a small portion of our investments. Subordinate securities are those interests in a securitization that have the last right to cash flows and are first in line to absorb losses and are backed by prime and non-prime residential loans. A re-REMIC is a resecuritization of asset-backed securities where the re-REMIC, the cash flows from, and any credit losses absorbed by the underlying asset-backed securities are allocated among the securities issued in the resecuritization transaction in a variety of ways. Information on our non-senior securities is set
forth in Tables 5 through 8B in the Financial Tables in this Review.
Quarterly Update
|
|
The following table presents information on residential non-senior securities at Redwood at December 31, 2010. We account for all of these securities as available-for-sale.
|
| |
|
|
Residential Non-Senior Securities at Redwood
|
|
|
December 31, 2010
|
|
|
($ in millions)
|
|
| |
|
| |
|
Subordinate
|
|
|
Re-REMIC
|
|
|
Total
|
|
|
Current face
|
|
$ |
305 |
|
|
$ |
139 |
|
|
$ |
444 |
|
|
Credit reserve
|
|
|
(209 |
) |
|
|
(44 |
) |
|
|
(253 |
) |
|
Net unamortized discount
|
|
|
(34 |
) |
|
|
(62 |
) |
|
|
(96 |
) |
|
Amortized cost
|
|
|
62 |
|
|
|
33 |
|
|
|
95 |
|
| |
|
|
|
|
|
|
|
|
|
|
|
|
|
Unrealized gains
|
|
|
11 |
|
|
|
52 |
|
|
|
63 |
|
|
Unrealized losses
|
|
|
(5 |
) |
|
|
- |
|
|
|
(5 |
) |
| |
|
|
|
|
|
|
|
|
|
|
|
|
|
Fair value of non-senior securities
|
|
$ |
68 |
|
|
$ |
85 |
|
|
$ |
153 |
|
|
|
Credit losses totaled $23 million in our residential subordinate portfolio in the fourth quarter, compared to $28 million of credit losses in the third quarter of 2010. We expect future losses to extinguish the majority of these securities as reflected by the $209 million of credit reserves we have provided for the $305 million face value of those securities. Until the losses occur, we will continue to earn interest on the face value of those securities.
|
|
|
The fair value of our subordinate securities was equal to 22% of the face value (compared to 14% in the prior quarter), while our amortized cost was equal to 20% of the face value of the portfolio at December 31, 2010. The increase in the fair value as a percentage of face value reflects acquisitions during the quarter of subordinate securities that were higher up in the capital structure.
|
|
|
Cash generated from subordinate securities totaled $8 million in the fourth quarter compared to $9 million in the third quarter. The annualized yield for our subordinate securities portfolio was 33.7%.
|
|
38
|
THE REDWOOD REVIEW 4TH QUARTER 2010
|
|
|
|
RESIDENTIAL REAL ESTATE SECURITIES
|
Residential Non-Senior Securities Portfolio
Quarterly Update (continued)
|
|
Our re-REMIC securities portfolio consists of prime residential senior securities that were pooled and resecuritized in 2009 to create two-tranche structures and we own the support (or junior) securities within those structures.
|
|
|
The fair value of our re-REMIC securities was equal to 61% of the face value of the portfolio (compared to 54% in the prior quarter), while our amortized cost was equal to 24% of the face value at December 31, 2010. These securities generated $2 million of cash exclusively from interest in both the fourth and third quarters of 2010. The annualized yield in the third quarter for our re-REMIC securities portfolio was 17.5%.
|
|
|
There were no credit losses in our re-REMIC portfolio in the fourth quarter. We anticipate losses, which were included in our acquisition assumptions, and have allocated $44 million of the purchase discount to credit reserves.
|
|
THE REDWOOD REVIEW 4TH QUARTER 2010
|
39
|
Summary
Redwood invests in commercial real estate loans and securities. Our commercial investments at Redwood consist of commercial mortgage loans originated in 2010 and later periods, and subordinate securities that were acquired prior to 2008. This discussion is exclusive of commercial securities and loans owned by Acacia entities.
Market Conditions
|
|
Fundamentals are showing varying signs of improvement depending on property type, geographic location, and asset quality. In many metropolitan markets, rental rates and property occupancy rates seem to be at least stabilizing and are increasing in some areas. The level of sales and financing activity has risen as liquidity continues to return to the market.
|
|
|
The commercial mortgage backed securities (CMBS) market has re-emerged as a viable supplier of liquidity for borrowers for their stabilized properties. The demand for new-issuance CMBS bonds is healthy and growing. Spreads have tightened appreciably in recent months as institutional investors search for fixed income products offering relative value and yield. CMBS conduit (non-agency) issuance totaled approximately $10 billion in 2010 and market participants widely expect volume to increase to $40 to $50 billion in 2011.
|
|
|
Commercial mortgage borrowers seeking full leverage loans are still faced with a funding gap between what senior lenders are willing to provide and what they need. Increasingly, senior lenders are willing to provide or place mezzanine investments in connection with these financings.
|
|
|
We continue to collaborate with leading financial institutions — banks, life insurance companies, and CMBS lenders — to source attractive high quality mezzanine and other subordinate debt investments.
|
Quarterly Update
|
|
At December 31, 2010, our commercial loan portfolio totaled $30 million, which primarily consisted of three mezzanine loans we originated in the fourth quarter. Each loan was made on a stabilized property in a major metropolitan area. On average, these three loans had a duration of five years, a loan to value ratio of 70%, and a weighted average coupon of 10.3%
|
|
|
Thus far in 2011, we have originated one additional loan totaling $6 million on a multifamily property in a major Northeast market.
|
|
|
At December 31, 2010, our investments in CMBS had a fair value of $8 million and consisted of predominantly 2004 and 2005 vintage subordinate securities. These securities have a face value of $89 million and credit reserves of $77 million.
|
|
|
As reflected by the large credit reserve relative to face value, we continue to expect to incur significant credit losses on these securities. However, the timing of these credit losses is difficult to forecast and credit losses will likely vary significantly every quarter. This volatility was experienced over the last two quarters as credit losses in the fourth quarter totaled $20 million compared to credit losses of $31 million in the third quarter.
|
|
40
|
THE REDWOOD REVIEW 4TH QUARTER 2010
|
Quarterly Update (continued)
|
|
We received $1 million of cash from our legacy CMBS investments in both the fourth and third quarters. Many of these securities are not receiving periodic principal or interest due to the level of delinquencies in the underlying pool of loans. However, as specially serviced loans are resolved, there may be lump sum payments. The timing and amount of cash distributed from these resolutions is difficult to anticipate and while we expect that the cash flow received from commercial subordinate securities will generally decrease over time, there could be some quarterly volatility in the amounts.
|
|
THE REDWOOD REVIEW 4TH QUARTER 2010
|
41
|
 |
|
LEGACY INVESTMENTS IN OTHER CONSOLIDATED ENTITIES
|
Summary
What is this?
Prior to 2010, we sponsored Sequoia and Acacia securitization entities that acquired mortgage loans and securities and created and issued ABS backed by these loans and securities. References to Sequoia’s activities prior to 2010 are referred to as “legacy Sequoia.” Also included in this discussion is the Opportunity Fund. Our Sequoia program is active and issued ABS in 2010, which is discussed in the Investments in New Sequoia module.
Quarterly Update
|
|
In the fourth quarter, we reported a combined loss of $2 million from legacy Sequoia and Acacia entities and the Fund, compared to net income of $6 million in the third quarter. The decrease was primarily due to a $6 million increase in loan loss provision expense at legacy Sequoia entities as a result of rising delinquencies, along with a $2 million reduction in interest income at Acacia entities related to coupon reset timing differences between the entities’ assets and liabilities.
|
|
|
Cash flow generated from our investments in legacy Sequoia, Acacia, and the Fund totaled $8 million in the fourth quarter, compared to $9 million in the third quarter. The primary difference between the $2 million GAAP loss and the $8 million in cash flow relates to non-cash charges for loan loss provision at legacy Sequoia entities and market valuation adjustments at legacy Sequoia and Acacia entities.
|
|
|
Cumulative losses for all 53 legacy Sequoia residential mortgage securitizations (totaling $35 billion at issuance) totaled 0.41% of the original face amount of the securities through December 31, 2010.
|
|
|
The consolidation of the assets and liabilities of securitization entities may lead to potentially volatile reported earnings for a variety of reasons, including the amortization of premium on the loans and liabilities of Sequoia entities, changes in credit loss provisions for loans held by Sequoia entities, fair value adjustments for the assets and liabilities of the Acacia entities, and deconsolidation events.
|
|
42
|
THE REDWOOD REVIEW 4TH QUARTER 2010
|
 |
|
|
ACCOUNTING DISCUSSION
|
Mark-to-Market Valuation Process
|
►
|
Market values reflect an “exit price,” or the amount we believe we would realize if we sold an asset or would pay if we repurchased a liability in an orderly transaction, even though we generally have no intention — nor would we be required — to sell assets or repurchase liabilities. Establishing market values is inherently subjective and requires us to make a number of assumptions, including the future of interest rates, prepayment rates, discount rates, credit loss rates, and the timing of credit losses. The assumptions we apply are specific to each asset or liability.
|
|
►
|
We rely on our internal calculations to compute the fair value of our securities and we request and consider indications of value (marks) from third-party dealers to assist us in our mark-to-market valuation process. For December 31, 2010, we received dealer marks on 83% of our securities and 97% of our ABS issued. In the aggregate, our internal valuations of the securities on which we received dealer marks were 1% lower (i.e., more conservative) than the dealer marks and our internal valuations of our ABS issued on which we received dealer marks were 7% higher (i.e., more conservative) than the aggregate dealer marks.
|
Determining Other-Than-Temporary Impairments
|
►
|
The multi-step process for determining whether an investment security has other-than-temporary impairment is presented below.
|
|
44
|
THE REDWOOD REVIEW 4TH QUARTER 2010
|
|
|
 |
|
GLOSSORY
|
ACACIA
Acacia is the brand name for the collateralized debt obligation (CDO) securitizations Redwood sponsored.
ADJUSTABLE-RATE MORTGAGES (ARMs)
Adjustable-rate mortgages are loans that have coupons that adjust at least once per year. We make a distinction between ARMs (loans with a rate adjustment at least annually) and hybrids (loans that have a fixed-rate period of 2 -10 years and then become adjustable-rate).
AGENCY
Agency refers to government-sponsored enterprises (GSEs), including Federal National Mortgage Association (Fannie Mae), Federal Home Loan Mortgage Corporation (Freddie Mac), and Government National Mortgage Association (Ginnie Mae).
ALT-A SECURITIES and ALT-A LOANS
Alt-A securities are residential mortgage-backed securities backed by loans that have higher credit quality than subprime and lower credit quality than prime. Alt-A originally represented loans with alternative documentation, but the definition has shifted over time to include loans with additional risk characteristics and in some cases investor loans. In an Alt-A loan, the borrower’s income may not be verified, and in some cases, may not be disclosed on the loan application. Alt-A loans may also have expanded criteria that allow for higher debt-to-income ratios with higher accompanying loan-to-value ratios than would otherwise be permissible for prime loans.
AMORTIZED COST
Amortized cost is the initial acquisition cost of an available-for-sale (AFS) security, minus principal repayments or principal reductions through credit losses, plus or minus premium or discount amortization. At the point in time an AFS security is deemed other-than-temporarily impaired, the amortized cost is adjusted (by changing the amount of unamortized premium or discount) by the amount of other-than-temporary impairment taken through the income statement.
ASSET-BACKED SECURITIES (ABS)
Asset-backed securities (ABS) are securities backed by financial assets that generate cash flows. Each ABS issued from a securitization entity has a unique priority with respect to receiving principal and interest cash flows and absorbing any credit losses from the assets owned by the entity.
AVAILABLE-FOR-SALE (AFS)
An accounting method for debt and equity securities in which the securities are reported at their fair value on the balance sheet. Positive changes in the fair value are accounted for as increases to stockholders’ equity and do not flow through the income statement. Negative changes in fair value may be recognized through the income statement or balance sheet, as further detailed in the Accounting Discussion module.
BOOK VALUE (GAAP)
Book value is the value of our common equity in accordance with GAAP.
COLLATERALIZED DEBT OBLIGATION (CDO) SECURITIZATIONS
The securitization of a diverse pool of assets.
COMMERCIAL MORTGAGE-BACKED SECURITIES (CMBS)
A type of mortgage-backed security that is secured by one or more loans on commercial properties.
|
THE REDWOOD REVIEW 4TH QUARTER 2010
|
45
|
|
|
|
GLOSSORY
|
CONSTANT (or CONDITIONAL) PREPAYMENT RATE (CPR)
Constant (or conditional) prepayment rate (CPR) is an industry-standard measure of the speed at which mortgage loans prepay. It approximates the annual percentage rate at which a pool of loans is paying down due to unscheduled principal prepayments.
CORE EQUITY
Core equity is not a measure calculated in accordance with GAAP. GAAP equity includes mark-to-market adjustments for some of our assets and interest rate agreements in “accumulated other comprehensive income (loss).” Core equity excludes accumulated other comprehensive income (loss). Core equity in some ways approximates what our equity value would be if we used historical amortized cost accounting exclusively. A reconciliation of core equity to GAAP appears in the Table 3 in the Financial Tables in this Review.
CREDIT SUPPORT
Credit support is the face amount of securities subordinate (or junior) to the applicable security that protects the security from credit losses and is generally expressed as a percentage of the securitization’s underlying pool balance.
DEBT
Debt is an obligation of Redwood. See Long-term debt and Short-term debt.
ECONOMIC VALUE (MANAGEMENT’S ESTIMATE OF ECONOMIC VALUE)
Economic value closely relates to liquidation value and is calculated using the bid-side marks (or estimated bid-side values) for all of our financial assets, and offered-side marks (or estimated offered-side values) for all of our financial liabilities. We calculate management’s estimate of economic value as a supplemental measure to book value calculated under GAAP. Our economic value estimates on a per-share basis are reconciled to GAAP book values per share in Table 3 in the Financial Tables of this Review.
FASB
Financial Accounting Standards Board.
THE FUND
The Fund refers to the Redwood Opportunity Fund, L.P., which is managed by Redwood Asset Management, Inc., a wholly-owned subsidiary of Redwood.
GAAP
Generally Accepted Accounting Principles in the United States.
GOVERNMENT SPONSORED ENTERPRISE (GSE)
A government sponsored enterprise is a financial services corporation created by the United States Congress to enhance the flow of credit to targeted sectors of the economy. Among the GSEs charted by Congress are Fannie Mae, Freddie Mac, and Ginnie Mae.
INTEREST-ONLY SECURITIES (IOs)
Interest-only securities (IOs) are specialized securities created by securitization entities where the projected cash flows generated by the underlying assets exceed the cash flows projected to be paid to the securities that are issued with principal balances. Typically, IOs do not have a principal balance and they will not receive principal payments. Interest payments to IOs usually equal an interest rate formula multiplied by a “notional” principal balance. The notional principal balances for IOs are typically reduced over time as the actual principal balance of the underlying pool of assets pays down, thus reducing the cash flows to the IOs over time. Cash flows on IOs are typically reduced more quickly when
asset prepayments increase.
|
46
|
THE REDWOOD REVIEW 4TH QUARTER 2010
|
|
|
|
|
GLOSSORY
|
INVESTMENT CAPACITY
The amount of capacity we have to invest in new assets. It is equal to the amount of capital we have that exceeds our risk-adjusted capital guidelines, less pending investment settlements, margin requirements, near-term operating expenses, and other miscellaneous capital allocations.
JUMBO LOAN
A jumbo loan is a mortgage loan that generally conforms to the underwriting standards of Fannie Mae and Freddie Mac except that the dollar amount of the loan exceeds the maximum limit set by the two GSEs for loans salable to the two companies.
LEVERAGE RATIOS
When determining Redwood’s financial leverage, traditional leverage ratios may be misleading in some respects if consolidated ABS issued from securitization entities are included as part of Redwood’s obligations when calculating this or similar ratios. Because of the requirement to consolidate the independent securitization entities for GAAP accounting purposes, it appears that Redwood is highly leveraged, with total consolidated liabilities significantly greater than equity. The obligations of these securitization entities are not obligations of Redwood.
LONG-TERM DEBT
Long-term debt is debt that is an obligation of Redwood that is not payable within a year and includes junior subordinated notes and trust preferred securities. We generally treat long-term debt as part of our capital base when it is not payable in the near future.
MARK-TO-MARKET (MTM) ACCOUNTING
Mark-to-market accounting uses estimated fair values of assets, liabilities, and hedges. Many assets on our consolidated balance sheet are carried at their fair value rather than amortized cost. Taxable income is generally not affected by market valuation adjustments.
MARKET VALUATION ADJUSTMENTS (MVAs)
Market valuation adjustments (MVAs) are changes in market values for certain assets and liabilities that are reported through our GAAP income statement. They include all changes in market values for assets and liabilities accounted for at fair value, such as trading securities and derivatives. They also include the credit portion of other-than-temporary impairments on securities available-for-sale, as well as impairments of loans held-for-sale and REO properties.
NON-GAAP METRICS
Not all companies and analysts calculate non-GAAP metrics in the same manner. As a result, certain metrics as calculated by Redwood may not be comparable to similarly titled metrics reported by other companies. Redwood uses non-GAAP metrics such as management’s estimate of economic value and core equity to provide greater transparency for investors. Our non-GAAP metrics are reconciled to GAAP in the Financial Tables in this Review.
NON-PRIME SECURITIES
Non-prime securities are Alt-A, option ARM, and subprime securities. See definitions of Alt-A, option ARM, and subprime securities.
|
THE REDWOOD REVIEW 4TH QUARTER 2010
|
47
|
|
|
|
GLOSSORY
|
OPTION ARM LOAN
An option ARM loan is a residential mortgage loan that generally offers a borrower monthly payment options such as: 1) a minimum payment that results in negative amortization; 2) an interest-only payment; 3) a payment that would fully amortize the loan over an original 31-year amortization schedule; and, 4) a payment that would fully amortize the loan over a 15-year amortization schedule. To the extent the borrower has chosen an option that is not fully amortizing the loan (or negatively amortizing the loan), after a period — usually five years or once the negatively amortized loan balance reaches a certain level (generally 15% to 25% higher than the original balance) — the loan payments are recast. This recast
provision resets the payment at a level that fully amortizes the loan over its remaining life and the new payment may be materially different than under the borrowers’ previous option.
PRIME RESIDENTIAL REAL ESTATE LOANS
Prime loans are residential loans with higher quality credit characteristics, such as borrowers with higher FICO credit scores, lower loan-to-value ratios, lower debt-to-income ratios, greater levels of other assets, and more documentation.
PRIME SECURITIES
Prime securities are residential mortgage-backed securities backed by prime loans, generally with balances greater than conforming loan limits. Prime securities are typically backed by loans that have relatively high weighted average FICO scores (700 or higher), low weighted average LTVs (75% or less), limited concentrations of investor properties, and a low percentages of loans with low FICO scores or high loan-to-value ratios.
PROFITABILITY RATIOS
Many financial institution analysts use asset-based profitability ratios such as interest rate spread and interest rate margin when analyzing financial institutions. These are asset-based measures. Since we consolidate the assets and liabilities of securitization entities for GAAP purposes, our total GAAP assets and liabilities may vary over time, and may not be comparable to assets typically used in profitability calculations for other financial institutions. As a result, we believe equity-based profitability ratios may be more appropriate than asset-based measures for analyzing Redwood’s operations and results. We believe, for example, that net interest income as a percentage of equity is a useful measure of
profitability. For operating expenses, we believe useful measures are operating efficiency ratio (operating expenses as a percentage of net interest income) and operating expenses as a percentage of equity. We provide various profitability ratios in Table 4 in the Financial Tables in this Review.
REAL ESTATE INVESTMENT TRUST (REIT)
A real estate investment trust (REIT) is an entity that makes a tax election to be taxed as a REIT, invests in real estate assets, and meets other REIT qualifications, including the distribution as dividends of at least 90% of REIT taxable income. A REIT’s profits are not taxed at the corporate level to the extent that these profits are distributed as dividends to stockholders, providing an operating cost savings. On the other hand, the requirement to pay out as dividends most of the REIT’s taxable profits means it can be harder for a REIT to grow using only internally-generated funds (as opposed to raising new capital).
REAL ESTATE OWNED (REO)
Real estate owned (REO) refers to real property owned by the lender or loan owner that has been acquired through foreclosure.
|
48
|
THE REDWOOD REVIEW 4TH QUARTER 2010
|
|
|
|
|
GLOSSORY
|
REIT SUBSIDIARY
A REIT subsidiary is a subsidiary of a REIT that is taxed as a REIT.
REIT TAXABLE INCOME
REIT taxable income is not a measure calculated in accordance with GAAP. REIT taxable income is pre-tax income calculated for tax purposes at Redwood including only its qualifying REIT subsidiaries (i.e., excluding its taxable subsidiaries). REIT taxable income is an important measure as it is the basis of our dividend distribution requirements. We must distribute at least 90% of REIT taxable income as dividends to shareholders over time. As a REIT, we are not subject to corporate income taxes on the REIT taxable income we distribute. We pay income tax on the REIT taxable income we retain, if any, (and we are permitted to retain up to 10% of total REIT taxable income). A reconciliation of REIT taxable income to GAAP income
appears in Table 2 in the Financial Tables in this Review.
REMIC
A real estate mortgage investment conduit (REMIC) is a special purpose vehicle used to pool real estate mortgages and issue mortgage-backed securities. REMICs are typically exempt from tax at the entity level. REMICs may invest only in qualified mortgages and permitted investments, including single family or multifamily mortgages, commercial mortgages, second mortgages, mortgage participations, and federal agency pass-through securities.
RE-REMIC SECURITY
A re-REMIC is a resecuritization of asset-backed securities. The cash flows from and any credit losses absorbed by the underlying assets can be redirected to the resulting re-REMIC securities in a variety of ways.
RESIDENTIAL MORTGAGE-BACKED SECURITIES (RMBS)
A type of mortgage-backed security that is backed by a pool of mortgages on residential properties.
RETURN ON EQUITY (ROE) and ADJUSTED RETURN ON EQUITY
ROE is the amount of profit we generate each year per dollar of equity capital and equals GAAP income divided by GAAP equity. Adjusted ROE is not a measure calculated in accordance with GAAP — it is GAAP income divided by core equity.
SENIOR SECURITIES
Generally, senior securities have the least credit risk in a securitization transaction because they are generally the last securities to absorb credit losses. In addition, the senior securities have the highest claim on the principal and interest payments (after the fees to servicers and trustees are paid.) To further reduce credit risk, most if not all, principal collected from the underlying asset pool is used to pay down the senior securities until certain performance tests are satisfied. If certain performance tests are satisfied, principal payments are shared between the senior securities and the
subordinate securities, generally on a pro rata basis. At issuance, senior securities are generally triple A-rated.
SEQUOIA
Sequoia is the brand name for securitizations of residential real estate loans Redwood sponsors. Sequoia entities are independent securitization entities that acquire residential mortgage loans and create and issue asset-backed securities (ABS) backed by these loans. Most of the loans that Sequoia entities acquire are prime-quality loans. Most of the senior ABS created by Sequoia are sold to third-party investors. Redwood usually acquires most of the subordinated ABS and occasionally acquires the interest-only securities (IOs).
|
THE REDWOOD REVIEW 4TH QUARTER 2010
|
49
|
|
|
|
GLOSSORY
|
SHORT-TERM DEBT
Short-term debt is debt that is an obligation of Redwood and payable within a year. We may obtain this debt from a variety of Wall Street firms, banks, and other institutions. In the past, as another form of short-term debt, we have issued collateralized commercial paper. We may issue these or other forms of short-term debt in the future. We may use short-term debt to finance the accumulation of assets prior to sale to a securitization entity and to finance investments in high-quality loans and securities.
SUBORDINATE SECURITIES (JUNIOR SECURITIES or NON-SENIOR SECURITIES)
Subordinate securities absorb the initial credit losses from a securitization structure, thus protecting the senior securities. Subordinate securities have a lower priority to receive principal and interest payments than the senior securities. Subordinate securities receive little, if any, principal payments until certain performance tests are satisfied. If certain performance tests are satisfied, principal payments are shared between the senior securities and the subordinate securities, generally on a pro rata basis. Subordinate securities generally receive interest payments even if they do not receive principal payments. At issuance, subordinate securities are generally rated double-A or below.
SUBPRIME SECURITIES
Subprime securities are residential mortgage-backed securities backed by loans to borrowers who typically have lower credit scores and/or other credit deficiencies that prevent them from qualifying for prime or Alt-A mortgages and may have experienced credit problems in the past, such as late payments or bankruptcies. To compensate for the greater risks and higher costs to service the loans, subprime borrowers pay higher interest rates, points, and origination fees.
TAXABLE INCOME
Taxable income is not a measure calculated in accordance with GAAP. Taxable income is pre-tax income for Redwood and all its subsidiaries as calculated for tax purposes. Taxable income calculations differ significantly from GAAP income calculations. A reconciliation of taxable income to GAAP income appears in Table 2 in the Financial Tables in this Review.
TAXABLE SUBSIDIARY
A taxable subsidiary is a subsidiary of a REIT that is not taxed as a REIT and thus pays taxes on its income. A taxable subsidiary is not limited to investing in real estate and it can choose to retain all of its after-tax profits.
|
50
|
THE REDWOOD REVIEW 4TH QUARTER 2010
|

| |
|
|
|
|
|
|
|
|
|
|
|
|
|
|
|
|
|
|
|
|
|
|
|
|
|
|
|
|
Twelve
|
|
|
Twelve
|
|
| |
|
2010
|
|
|
2010
|
|
|
2010
|
|
|
2010
|
|
|
2009
|
|
|
2009
|
|
|
2009
|
|
|
2009
|
|
|
2008
|
|
|
Months
|
|
|
Months
|
|
| |
|
Q4
|
|
|
Q3
|
|
|
Q2
|
|
|
Q1
|
|
|
Q4
|
|
|
Q3
|
|
|
Q2
|
|
|
Q1
|
|
|
Q4
|
|
|
2010
|
|
|
2009
|
|
| |
|
|
|
|
|
|
|
|
|
|
|
|
|
|
|
|
|
|
|
|
|
|
|
|
|
|
|
|
|
|
|
|
|
|
Interest income
|
|
$ |
44,956 |
|
|
$ |
49,249 |
|
|
$ |
47,730 |
|
|
$ |
50,449 |
|
|
$ |
57,717 |
|
|
$ |
64,425 |
|
|
$ |
74,332 |
|
|
$ |
83,903 |
|
|
$ |
124,452 |
|
|
$ |
192,384 |
|
|
$ |
280,377 |
|
|
Discount amortization on securities, net
|
|
|
12,671 |
|
|
|
10,991 |
|
|
|
10,821 |
|
|
|
10,629 |
|
|
|
7,432 |
|
|
|
9,575 |
|
|
|
3,864 |
|
|
|
4,917 |
|
|
|
(1,189 |
) |
|
|
45,112 |
|
|
|
25,788 |
|
|
Other investment interest income
|
|
|
- |
|
|
|
2 |
|
|
|
4 |
|
|
|
9 |
|
|
|
12 |
|
|
|
25 |
|
|
|
53 |
|
|
|
76 |
|
|
|
572 |
|
|
|
15 |
|
|
|
166 |
|
|
Premium amortization expense on loans
|
|
|
(1,874 |
) |
|
|
(1,227 |
) |
|
|
(1,985 |
) |
|
|
(2,371 |
) |
|
|
(3,365 |
) |
|
|
(3,642 |
) |
|
|
(3,988 |
) |
|
|
(7,459 |
) |
|
|
(548 |
) |
|
|
(7,457 |
) |
|
|
(18,454 |
) |
|
Total interest income
|
|
|
55,753 |
|
|
|
59,015 |
|
|
|
56,570 |
|
|
|
58,716 |
|
|
|
61,796 |
|
|
|
70,383 |
|
|
|
74,261 |
|
|
|
81,437 |
|
|
|
123,287 |
|
|
|
230,054 |
|
|
|
287,877 |
|
| |
|
|
|
|
|
|
|
|
|
|
|
|
|
|
|
|
|
|
|
|
|
|
|
|
|
|
|
|
|
|
|
|
|
|
|
|
|
|
|
|
|
|
|
|
|
Interest expense on short-term debt
|
|
|
(43 |
) |
|
|
(2 |
) |
|
|
(36 |
) |
|
|
- |
|
|
|
- |
|
|
|
- |
|
|
|
- |
|
|
|
- |
|
|
|
(2 |
) |
|
|
(81 |
) |
|
|
- |
|
| |
|
|
|
|
|
|
|
|
|
|
|
|
|
|
|
|
|
|
|
|
|
|
|
|
|
|
|
|
|
|
|
|
|
|
|
|
|
|
|
|
|
|
|
|
|
Interest expense on ABS
|
|
|
(17,800 |
) |
|
|
(19,582 |
) |
|
|
(17,582 |
) |
|
|
(16,145 |
) |
|
|
(17,881 |
) |
|
|
(22,071 |
) |
|
|
(36,115 |
) |
|
|
(44,517 |
) |
|
|
(94,431 |
) |
|
|
(71,109 |
) |
|
|
(120,584 |
) |
|
ABS issuance expense amortization
|
|
|
(370 |
) |
|
|
(575 |
) |
|
|
(475 |
) |
|
|
(634 |
) |
|
|
(575 |
) |
|
|
(570 |
) |
|
|
(586 |
) |
|
|
(553 |
) |
|
|
(1,470 |
) |
|
|
(2,054 |
) |
|
|
(2,284 |
) |
|
ABS interest rate agreement expense
|
|
|
(1,189 |
) |
|
|
(1,104 |
) |
|
|
(1,127 |
) |
|
|
(495 |
) |
|
|
(1,123 |
) |
|
|
(1,123 |
) |
|
|
(1,111 |
) |
|
|
(1,098 |
) |
|
|
(1,934 |
) |
|
|
(3,915 |
) |
|
|
(4,455 |
) |
|
ABS issuance premium amortization income
|
|
|
168 |
|
|
|
187 |
|
|
|
196 |
|
|
|
208 |
|
|
|
223 |
|
|
|
234 |
|
|
|
313 |
|
|
|
335 |
|
|
|
476 |
|
|
|
759 |
|
|
|
1,105 |
|
|
Total ABS expense consolidated from trusts
|
|
|
(19,191 |
) |
|
|
(21,074 |
) |
|
|
(18,988 |
) |
|
|
(17,066 |
) |
|
|
(19,356 |
) |
|
|
(23,530 |
) |
|
|
(37,499 |
) |
|
|
(45,833 |
) |
|
|
(97,359 |
) |
|
|
(76,319 |
) |
|
|
(126,218 |
) |
| |
|
|
|
|
|
|
|
|
|
|
|
|
|
|
|
|
|
|
|
|
|
|
|
|
|
|
|
|
|
|
|
|
|
|
|
|
|
|
|
|
|
|
|
|
|
Interest expense on long-term debt
|
|
|
(2,390 |
) |
|
|
(2,619 |
) |
|
|
(2,140 |
) |
|
|
(1,115 |
) |
|
|
(1,168 |
) |
|
|
(1,307 |
) |
|
|
(1,502 |
) |
|
|
(1,808 |
) |
|
|
(2,345 |
) |
|
|
(8,264 |
) |
|
|
(5,785 |
) |
| |
|
|
|
|
|
|
|
|
|
|
|
|
|
|
|
|
|
|
|
|
|
|
|
|
|
|
|
|
|
|
|
|
|
|
|
|
|
|
|
|
|
|
|
|
|
Net interest income
|
|
|
34,129 |
|
|
|
35,320 |
|
|
|
35,406 |
|
|
|
40,535 |
|
|
|
41,272 |
|
|
|
45,546 |
|
|
|
35,260 |
|
|
|
33,796 |
|
|
|
23,581 |
|
|
|
145,390 |
|
|
|
155,874 |
|
|
Provision for loan losses
|
|
|
(7,902 |
) |
|
|
(2,436 |
) |
|
|
(4,321 |
) |
|
|
(9,476 |
) |
|
|
(8,997 |
) |
|
|
(9,998 |
) |
|
|
(14,545 |
) |
|
|
(16,033 |
) |
|
|
(18,659 |
) |
|
|
(24,135 |
) |
|
|
(49,573 |
) |
|
Market valuation adjustments, net
|
|
|
380 |
|
|
|
(1,573 |
) |
|
|
(7,125 |
) |
|
|
(11,236 |
) |
|
|
(4,191 |
) |
|
|
(11,058 |
) |
|
|
(29,135 |
) |
|
|
(43,244 |
) |
|
|
(111,331 |
) |
|
|
(19,554 |
) |
|
|
(87,628 |
) |
|
Net interest income (loss) after provision and market valuation adjustments
|
|
|
26,607 |
|
|
|
31,311 |
|
|
|
23,960 |
|
|
|
19,823 |
|
|
|
28,084 |
|
|
|
24,490 |
|
|
|
(8,420 |
) |
|
|
(25,481 |
) |
|
|
(106,409 |
) |
|
|
101,701 |
|
|
|
18,673 |
|
| |
|
|
|
|
|
|
|
|
|
|
|
|
|
|
|
|
|
|
|
|
|
|
|
|
|
|
|
|
|
|
|
|
|
|
|
|
|
|
|
|
|
|
|
|
|
Fixed compensation expense
|
|
|
(3,402 |
) |
|
|
(3,314 |
) |
|
|
(3,661 |
) |
|
|
(4,109 |
) |
|
|
(3,262 |
) |
|
|
(3,726 |
) |
|
|
(3,572 |
) |
|
|
(4,029 |
) |
|
|
(3,575 |
) |
|
|
(14,486 |
) |
|
|
(14,589 |
) |
|
Variable compensation expense
|
|
|
(2,152 |
) |
|
|
(2,206 |
) |
|
|
(1,303 |
) |
|
|
(1,880 |
) |
|
|
(566 |
) |
|
|
(5,216 |
) |
|
|
(1,132 |
) |
|
|
(556 |
) |
|
|
418 |
|
|
|
(7,541 |
) |
|
|
(7,470 |
) |
|
Equity compensation expense
|
|
|
(1,710 |
) |
|
|
(1,507 |
) |
|
|
(2,077 |
) |
|
|
(6,059 |
) |
|
|
(1,554 |
) |
|
|
(420 |
) |
|
|
(2,337 |
) |
|
|
(1,795 |
) |
|
|
(2,378 |
) |
|
|
(11,353 |
) |
|
|
(6,106 |
) |
|
Severance expense
|
|
|
- |
|
|
|
(48 |
) |
|
|
(229 |
) |
|
|
(81 |
) |
|
|
- |
|
|
|
(398 |
) |
|
|
- |
|
|
|
(28 |
) |
|
|
(1,814 |
) |
|
|
(358 |
) |
|
|
(426 |
) |
|
Other operating expense
|
|
|
(5,673 |
) |
|
|
(5,170 |
) |
|
|
(3,957 |
) |
|
|
(5,177 |
) |
|
|
(5,498 |
) |
|
|
(5,046 |
) |
|
|
(3,728 |
) |
|
|
(4,132 |
) |
|
|
(6,104 |
) |
|
|
(19,977 |
) |
|
|
(18,404 |
) |
|
Total operating expenses
|
|
|
(12,937 |
) |
|
|
(12,245 |
) |
|
|
(11,227 |
) |
|
|
(17,306 |
) |
|
|
(10,880 |
) |
|
|
(14,806 |
) |
|
|
(10,769 |
) |
|
|
(10,540 |
) |
|
|
(13,453 |
) |
|
|
(53,715 |
) |
|
|
(46,995 |
) |
| |
|
|
|
|
|
|
|
|
|
|
|
|
|
|
|
|
|
|
|
|
|
|
|
|
|
|
|
|
|
|
|
|
|
|
|
|
|
|
|
|
|
|
|
|
|
Realized gains on sales, net
|
|
|
786 |
|
|
|
72 |
|
|
|
16,080 |
|
|
|
44,338 |
|
|
|
19,618 |
|
|
|
17,561 |
|
|
|
25,525 |
|
|
|
462 |
|
|
|
5,823 |
|
|
|
61,276 |
|
|
|
63,166 |
|
|
Realized gains on calls, net
|
|
|
726 |
|
|
|
1,494 |
|
|
|
- |
|
|
|
- |
|
|
|
- |
|
|
|
- |
|
|
|
- |
|
|
|
- |
|
|
|
- |
|
|
|
2,220 |
|
|
|
- |
|
|
Realized gains on sales and calls, net
|
|
|
1,512 |
|
|
|
1,566 |
|
|
|
16,080 |
|
|
|
44,338 |
|
|
|
19,618 |
|
|
|
17,561 |
|
|
|
25,525 |
|
|
|
462 |
|
|
|
5,823 |
|
|
|
63,496 |
|
|
|
63,166 |
|
| |
|
|
|
|
|
|
|
|
|
|
|
|
|
|
|
|
|
|
|
|
|
|
|
|
|
|
|
|
|
|
|
|
|
|
|
|
|
|
|
|
|
|
|
|
|
Noncontrolling interest
|
|
|
(447 |
) |
|
|
(532 |
) |
|
|
(186 |
) |
|
|
15 |
|
|
|
(143 |
) |
|
|
(363 |
) |
|
|
(127 |
) |
|
|
716 |
|
|
|
2,366 |
|
|
|
(1,150 |
) |
|
|
83 |
|
|
(Provision for) benefit from income taxes
|
|
|
(26 |
) |
|
|
(202 |
) |
|
|
(26 |
) |
|
|
(26 |
) |
|
|
3,613 |
|
|
|
247 |
|
|
|
513 |
|
|
|
(105 |
) |
|
|
(3,913 |
) |
|
|
(280 |
) |
|
|
4,268 |
|
|
Net income (loss)
|
|
$ |
14,709 |
|
|
$ |
19,898 |
|
|
$ |
28,601 |
|
|
$ |
46,844 |
|
|
$ |
40,292 |
|
|
$ |
27,129 |
|
|
$ |
6,722 |
|
|
$ |
(34,948 |
) |
|
$ |
(115,586 |
) |
|
$ |
110,052 |
|
|
$ |
39,195 |
|
| |
|
|
|
|
|
|
|
|
|
|
|
|
|
|
|
|
|
|
|
|
|
|
|
|
|
|
|
|
|
|
|
|
|
|
|
|
|
|
|
|
|
|
|
|
|
Diluted average shares
|
|
|
78,944 |
|
|
|
78,961 |
|
|
|
78,852 |
|
|
|
78,542 |
|
|
|
78,101 |
|
|
|
78,223 |
|
|
|
66,446 |
|
|
|
53,632 |
|
|
|
33,366 |
|
|
|
78,811 |
|
|
|
68,991 |
|
|
Net income (loss) per share
|
|
$ |
0.18 |
|
|
$ |
0.25 |
|
|
$ |
0.35 |
|
|
$ |
0.58 |
|
|
$ |
0.51 |
|
|
$ |
0.34 |
|
|
$ |
0.10 |
|
|
$ |
(0.65 |
) |
|
$ |
(3.46 |
) |
|
$ |
1.36 |
|
|
$ |
0.55 |
|
| THE REDWOOD REVIEW 4TH QUARTER 2010 |
Table 1: GAAP Earnings
|
|
| |
|
Estimated 2010 Q4 (2)
|
|
|
Estimated Twelve Months 2010
|
|
|
Actual Twelve Months 2009
|
|
| |
|
Taxable
|
|
GAAP
|
|
|
|
|
|
Taxable
|
|
GAAP
|
|
|
|
|
|
Taxable
|
|
GAAP
|
|
|
|
|
| |
|
Income (Loss)
|
|
Income
|
|
|
Differences
|
|
|
Income (Loss)
|
|
Income
|
|
|
Differences
|
|
|
Income (Loss)
|
|
Income
|
|
|
Differences
|
|
| |
|
|
|
|
|
|
|
|
|
|
|
|
|
|
|
|
|
|
|
|
|
|
|
|
|
|
|
|
Taxable and GAAP Income (Loss) Differences
|
|
|
|
|
|
|
|
|
|
|
|
|
|
|
|
|
|
|
|
|
|
|
|
|
|
|
|
|
Interest income
|
|
$ |
28,417 |
|
|
$ |
55,753 |
|
|
$ |
(27,336 |
) |
|
$ |
136,878 |
|
|
$ |
230,054 |
|
|
$ |
(93,176 |
) |
|
$ |
192,922 |
|
|
$ |
287,877 |
|
|
$ |
(94,955 |
) |
|
Interest expense
|
|
|
(2,166 |
) |
|
|
(21,624 |
) |
|
|
19,458 |
|
|
|
(8,545 |
) |
|
|
(84,664 |
) |
|
|
76,119 |
|
|
|
(4,955 |
) |
|
|
(132,003 |
) |
|
|
127,048 |
|
|
Net interest income
|
|
|
26,251 |
|
|
|
34,129 |
|
|
|
(7,878 |
) |
|
|
128,333 |
|
|
|
145,390 |
|
|
|
(17,057 |
) |
|
|
187,967 |
|
|
|
155,874 |
|
|
|
32,093 |
|
|
Provision for loan losses
|
|
|
- |
|
|
|
(7,902 |
) |
|
|
7,902 |
|
|
|
- |
|
|
|
(24,135 |
) |
|
|
24,135 |
|
|
|
- |
|
|
|
(49,573 |
) |
|
|
49,573 |
|
|
Realized credit losses
|
|
|
(19,680 |
) |
|
|
- |
|
|
|
(19,680 |
) |
|
|
(99,589 |
) |
|
|
- |
|
|
|
(99,589 |
) |
|
|
(223,903 |
) |
|
|
- |
|
|
|
(223,903 |
) |
|
Market valuation adjustments, net
|
|
|
- |
|
|
|
380 |
|
|
|
(380 |
) |
|
|
- |
|
|
|
(19,554 |
) |
|
|
19,554 |
|
|
|
- |
|
|
|
(87,628 |
) |
|
|
87,628 |
|
|
Operating expenses
|
|
|
(12,539 |
) |
|
|
(12,937 |
) |
|
|
398 |
|
|
|
(44,687 |
) |
|
|
(53,715 |
) |
|
|
9,028 |
|
|
|
(54,234 |
) |
|
|
(46,995 |
) |
|
|
(7,239 |
) |
|
Realized gains on sales and calls, net
|
|
|
230 |
|
|
|
1,512 |
|
|
|
(1,282 |
) |
|
|
230 |
|
|
|
63,496 |
|
|
|
(63,266 |
) |
|
|
6,625 |
|
|
|
63,166 |
|
|
|
(56,541 |
) |
|
(Provision for) benefit from income taxes
|
|
|
(8 |
) |
|
|
(26 |
) |
|
|
18 |
|
|
|
(8 |
) |
|
|
(280 |
) |
|
|
272 |
|
|
|
(13 |
) |
|
|
4,268 |
|
|
|
(4,281 |
) |
|
Less: Net income (loss) attributable to noncontrolling interest
|
|
|
- |
|
|
|
447 |
|
|
|
(447 |
) |
|
|
- |
|
|
|
1,150 |
|
|
|
(1,150 |
) |
|
|
- |
|
|
|
(83 |
) |
|
|
83 |
|
| |
|
|
|
|
|
|
|
|
|
|
|
|
|
|
|
|
|
|
|
|
|
|
|
|
|
|
|
|
|
|
|
|
|
|
|
|
|
Taxable (loss) income
|
|
$ |
(5,746 |
) |
|
$ |
14,709 |
|
|
$ |
(20,455 |
) |
|
$ |
(15,721 |
) |
|
$ |
110,052 |
|
|
$ |
(125,773 |
) |
|
$ |
(83,558 |
) |
|
$ |
39,195 |
|
|
$ |
(122,753 |
) |
| |
|
|
|
|
|
|
|
|
|
|
|
|
|
|
|
|
|
|
|
|
|
|
|
|
|
|
|
|
|
|
|
|
|
|
|
|
|
REIT taxable income (loss)
|
|
$ |
47 |
|
|
|
|
|
|
|
|
|
|
$ |
3,998 |
|
|
|
|
|
|
|
|
|
|
$ |
(69,819 |
) |
|
|
|
|
|
|
|
|
|
Taxable (loss) income at taxable subsidiaries
|
|
|
(5,793 |
) |
|
|
|
|
|
|
|
|
|
|
(19,719 |
) |
|
|
|
|
|
|
|
|
|
|
(13,739 |
) |
|
|
|
|
|
|
|
|
|
Taxable (loss) income
|
|
$ |
(5,746 |
) |
|
|
|
|
|
|
|
|
|
$ |
(15,721 |
) |
|
|
|
|
|
|
|
|
|
$ |
(83,558 |
) |
|
|
|
|
|
|
|
|
| |
|
|
|
|
|
|
|
|
|
|
|
|
|
|
|
|
|
|
|
|
|
|
|
|
|
|
|
|
|
|
|
|
|
|
|
|
|
Shares used for taxable EPS calculation
|
|
|
78,125 |
|
|
|
|
|
|
|
|
|
|
|
78,041 |
|
|
|
|
|
|
|
|
|
|
|
74,605 |
|
|
|
|
|
|
|
|
|
|
REIT taxable income (loss) per share (3)
|
|
$ |
0.00 |
|
|
|
|
|
|
|
|
|
|
$ |
0.05 |
|
|
|
|
|
|
|
|
|
|
$ |
(0.92 |
) |
|
|
|
|
|
|
|
|
|
Taxable (loss) income at taxable subsidiaries per share
|
|
$ |
(0.07 |
) |
|
|
|
|
|
|
|
|
|
$ |
(0.25 |
) |
|
|
|
|
|
|
|
|
|
$ |
(0.20 |
) |
|
|
|
|
|
|
|
|
|
Taxable (loss) income per share (3)
|
|
$ |
(0.07 |
) |
|
|
|
|
|
|
|
|
|
$ |
(0.20 |
) |
|
|
|
|
|
|
|
|
|
$ |
(1.12 |
) |
|
|
|
|
|
|
|
|
| |
|
|
|
|
|
|
|
|
|
|
|
|
|
|
|
|
|
|
|
|
|
|
|
|
|
|
|
|
|
|
|
|
|
|
|
|
|
Dividends
|
|
|
|
|
|
|
|
|
|
|
|
|
|
|
|
|
|
|
|
|
|
|
|
|
|
|
|
|
|
|
|
|
|
|
|
|
|
Dividends declared
|
|
$ |
19,531 |
|
|
|
|
|
|
|
|
|
|
$ |
77,942 |
|
|
|
|
|
|
|
|
|
|
$ |
73,284 |
|
|
|
|
|
|
|
|
|
|
Regular dividend per share (4)
|
|
$ |
0.25 |
|
|
|
|
|
|
|
|
|
|
$ |
1.00 |
|
|
|
|
|
|
|
|
|
|
$ |
1.00 |
|
|
|
|
|
|
|
|
|
(1) Taxable income (loss) for 2010 is an estimate until we file tax returns for that year.
(2) Reconciliation of GAAP income to taxable income for prior quarters is provided in the respective Redwood Reviews for those quarters.
(3) REIT taxable income (loss) per share and taxable income (loss) per share are based on the number of shares outstanding at the end of each quarter. The annual REIT taxable income (loss) per share and taxable income (loss) per share are the sum of the four quarterly per share estimates.
(4) Dividends in 2010 are expected to be characterized as 62% ordinary income, or $48 million, and 38% return of capital, or $30 million. The 2009 dividends were characterized as a return of capital. The portion of Redwood's dividends characterized as a return of capital is not taxable to a shareholder and reduces a shareholder's basis for shares held at each quarterly distribution date.
| THE REDWOOD REVIEW 4TH QUARTER 2010 |
Table 2: Taxable and GAAP Income (Loss)
Differences and Dividends
|
53 |
| |
|
|
|
|
|
|
|
|
|
|
|
|
|
|
|
|
|
|
|
|
|
|
|
|
|
|
|
| |
|
2010
|
|
|
2010
|
|
|
2010
|
|
|
2010
|
|
|
2009
|
|
|
2009
|
|
|
2009
|
|
|
2009
|
|
|
2008
|
|
| |
|
Q4 |
|
|
Q3 |
|
|
Q2 |
|
|
Q1 |
|
|
Q4 |
|
|
Q3 |
|
|
Q2 |
|
|
Q1 |
|
|
Q4 |
|
|
Short-term debt
|
|
$ |
44 |
|
|
$ |
- |
|
|
$ |
- |
|
|
$ |
- |
|
|
$ |
- |
|
|
$ |
- |
|
|
$ |
- |
|
|
$ |
- |
|
|
$ |
- |
|
|
Long-term debt
|
|
|
140 |
|
|
|
140 |
|
|
|
140 |
|
|
|
140 |
|
|
|
140 |
|
|
|
140 |
|
|
|
150 |
|
|
|
150 |
|
|
|
150 |
|
|
Redwood debt (1)
|
|
$ |
184 |
|
|
$ |
140 |
|
|
$ |
140 |
|
|
$ |
140 |
|
|
$ |
140 |
|
|
$ |
140 |
|
|
$ |
150 |
|
|
$ |
150 |
|
|
$ |
150 |
|
| |
|
|
|
|
|
|
|
|
|
|
|
|
|
|
|
|
|
|
|
|
|
|
|
|
|
|
|
|
|
|
|
|
|
|
|
|
|
GAAP stockholders' equity
|
|
$ |
1,065 |
|
|
$ |
1,016 |
|
|
$ |
991 |
|
|
$ |
998 |
|
|
$ |
972 |
|
|
$ |
907 |
|
|
$ |
802 |
|
|
$ |
506 |
|
|
$ |
302 |
|
| |
|
|
|
|
|
|
|
|
|
|
|
|
|
|
|
|
|
|
|
|
|
|
|
|
|
|
|
|
|
|
|
|
|
|
|
|
|
Redwood debt to equity
|
|
|
0.2 |
x |
|
|
0.1 |
x |
|
|
0.1 |
x |
|
|
0.1 |
x |
|
|
0.1 |
x |
|
|
0.2 |
x |
|
|
0.2 |
x |
|
|
0.3 |
x |
|
|
0.5 |
x |
|
Redwood debt to (equity + debt)
|
|
|
15 |
% |
|
|
12 |
% |
|
|
12 |
% |
|
|
12 |
% |
|
|
13 |
% |
|
|
13 |
% |
|
|
16 |
% |
|
|
23 |
% |
|
|
33 |
% |
| |
|
|
|
|
|
|
|
|
|
|
|
|
|
|
|
|
|
|
|
|
|
|
|
|
|
|
|
|
|
|
|
|
|
|
|
|
|
Redwood debt
|
|
$ |
184 |
|
|
$ |
140 |
|
|
$ |
140 |
|
|
$ |
140 |
|
|
$ |
140 |
|
|
$ |
140 |
|
|
$ |
150 |
|
|
$ |
150 |
|
|
$ |
150 |
|
|
ABS obligations of consolidated securitization entities
|
|
|
3,761 |
|
|
|
3,832 |
|
|
|
3,961 |
|
|
|
3,837 |
|
|
|
3,943 |
|
|
|
4,016 |
|
|
|
4,185 |
|
|
|
4,709 |
|
|
|
4,855 |
|
|
GAAP obligation
|
|
$ |
3,945 |
|
|
$ |
3,972 |
|
|
$ |
4,101 |
|
|
$ |
3,977 |
|
|
$ |
4,083 |
|
|
$ |
4,156 |
|
|
$ |
4,335 |
|
|
$ |
4,859 |
|
|
$ |
5,005 |
|
| |
|
|
|
|
|
|
|
|
|
|
|
|
|
|
|
|
|
|
|
|
|
|
|
|
|
|
|
|
|
|
|
|
|
|
|
|
|
GAAP obligation to equity
|
|
|
3.7 |
x |
|
|
3.9 |
x |
|
|
4.0 |
x |
|
|
4.0 |
x |
|
|
4.2 |
x |
|
|
4.6 |
x |
|
|
5.4 |
x |
|
|
9.6 |
x |
|
|
16.6 |
x |
|
GAAP obligation to (equity + GAAP debt)
|
|
|
79 |
% |
|
|
80 |
% |
|
|
81 |
% |
|
|
80 |
% |
|
|
81 |
% |
|
|
82 |
% |
|
|
84 |
% |
|
|
91 |
% |
|
|
94 |
% |
| |
|
|
|
|
|
|
|
|
|
|
|
|
|
|
|
|
|
|
|
|
|
|
|
|
|
|
|
|
|
|
|
|
|
|
|
|
|
GAAP stockholders' equity
|
|
$ |
1,065 |
|
|
$ |
1,016 |
|
|
$ |
991 |
|
|
$ |
998 |
|
|
$ |
972 |
|
|
$ |
907 |
|
|
$ |
802 |
|
|
$ |
506 |
|
|
$ |
302 |
|
|
Balance sheet mark-to-market adjustments
|
|
|
112 |
|
|
|
61 |
|
|
|
38 |
|
|
|
58 |
|
|
|
65 |
|
|
|
23 |
|
|
|
(77 |
) |
|
|
(85 |
) |
|
|
(57 |
) |
|
Core equity (non-GAAP)
|
|
$ |
953 |
|
|
$ |
955 |
|
|
$ |
953 |
|
|
$ |
940 |
|
|
$ |
907 |
|
|
$ |
884 |
|
|
$ |
879 |
|
|
$ |
591 |
|
|
$ |
359 |
|
| |
|
|
|
|
|
|
|
|
|
|
|
|
|
|
|
|
|
|
|
|
|
|
|
|
|
|
|
|
|
|
|
|
|
|
|
|
|
Shares outstanding at period end
|
|
|
78,125 |
|
|
|
77,984 |
|
|
|
77,908 |
|
|
|
77,751 |
|
|
|
77,737 |
|
|
|
77,669 |
|
|
|
77,503 |
|
|
|
60,228 |
|
|
|
33,471 |
|
| |
|
|
|
|
|
|
|
|
|
|
|
|
|
|
|
|
|
|
|
|
|
|
|
|
|
|
|
|
|
|
|
|
|
|
|
|
|
GAAP equity per share
|
|
$ |
13.63 |
|
|
$ |
13.02 |
|
|
$ |
12.71 |
|
|
$ |
12.84 |
|
|
$ |
12.50 |
|
|
$ |
11.68 |
|
|
$ |
10.35 |
|
|
$ |
8.40 |
|
|
$ |
9.02 |
|
|
Adjustments: GAAP equity to economic value (2)
|
|
|
|
|
|
|
|
|
|
|
|
|
|
|
|
|
|
|
|
|
|
|
|
|
|
|
|
|
|
|
|
|
|
|
|
|
|
Investments in Sequoia
|
|
$ |
(0.12 |
) |
|
$ |
(0.24 |
) |
|
$ |
(0.31 |
) |
|
$ |
(0.37 |
) |
|
$ |
(0.37 |
) |
|
$ |
(0.37 |
) |
|
$ |
(0.35 |
) |
|
$ |
(0.15 |
) |
|
$ |
(0.95 |
) |
|
Investments in Acacia
|
|
|
(0.04 |
) |
|
|
(0.04 |
) |
|
|
(0.03 |
) |
|
|
- |
|
|
|
- |
|
|
|
- |
|
|
|
0.01 |
|
|
|
(0.03 |
) |
|
|
(0.21 |
) |
|
Long-term debt
|
|
|
0.84 |
|
|
|
0.99 |
|
|
|
1.00 |
|
|
|
0.85 |
|
|
|
0.90 |
|
|
|
0.97 |
|
|
|
1.29 |
|
|
|
1.79 |
|
|
|
3.24 |
|
|
Estimate of economic value per share (non-GAAP)
|
|
$ |
14.31 |
|
|
$ |
13.73 |
|
|
$ |
13.37 |
|
|
$ |
13.32 |
|
|
$ |
13.03 |
|
|
$ |
12.28 |
|
|
$ |
11.30 |
|
|
$ |
10.01 |
|
|
$ |
11.10 |
|
(1) Excludes obligations of consolidated securitization entities.
(2) Differences between GAAP and economic value per share reflect our estimate of the economic value of investments in Sequoia and Acacia and our long-term debt.
| THE REDWOOD REVIEW 4TH QUARTER 2010 |
Table 3: Book Value and Financial Ratios
|
|
| |
|
|
|
|
|
|
|
|
|
|
|
|
|
|
|
|
|
|
|
|
|
|
|
|
|
|
|
|
Twelve
|
|
|
Twelve
|
|
| |
|
2010
|
|
|
2010
|
|
|
2010
|
|
|
2010
|
|
|
2009
|
|
|
2009
|
|
|
2009
|
|
|
2009
|
|
|
2008
|
|
|
Months
|
|
|
Months
|
|
| |
|
Q4 |
|
|
Q3 |
|
|
Q2 |
|
|
Q1 |
|
|
Q4 |
|
|
Q3 |
|
|
Q2 |
|
|
Q1 |
|
|
Q4 |
|
|
2010 |
|
|
2009 |
|
| |
|
|
|
|
|
|
|
|
|
|
|
|
|
|
|
|
|
|
|
|
|
|
|
|
|
|
|
|
|
|
|
|
|
|
|
|
|
|
|
|
|
|
|
Interest income
|
|
$ |
55,753 |
|
|
$ |
59,015 |
|
|
$ |
56,570 |
|
|
$ |
58,716 |
|
|
$ |
61,796 |
|
|
$ |
70,383 |
|
|
$ |
74,261 |
|
|
$ |
81,437 |
|
|
$ |
123,287 |
|
|
$ |
230,054 |
|
|
$ |
287,877 |
|
|
Average consolidated earning assets
|
|
$ |
4,980,935 |
|
|
$ |
5,030,680 |
|
|
$ |
5,139,945 |
|
|
$ |
5,070,987 |
|
|
$ |
5,175,337 |
|
|
$ |
5,128,893 |
|
|
$ |
5,325,322 |
|
|
$ |
5,553,470 |
|
|
$ |
7,006,592 |
|
|
$ |
5,055,322 |
|
|
$ |
5,294,037 |
|
|
Asset yield
|
|
|
4.48 |
% |
|
|
4.69 |
% |
|
|
4.40 |
% |
|
|
4.63 |
% |
|
|
4.78 |
% |
|
|
5.49 |
% |
|
|
5.58 |
% |
|
|
5.87 |
% |
|
|
7.04 |
% |
|
|
4.55 |
% |
|
|
5.44 |
% |
| |
|
|
|
|
|
|
|
|
|
|
|
|
|
|
|
|
|
|
|
|
|
|
|
|
|
|
|
|
|
|
|
|
|
|
|
|
|
|
|
|
|
|
|
|
|
Interest expense
|
|
$ |
(21,624 |
) |
|
$ |
(23,695 |
) |
|
$ |
(21,164 |
) |
|
$ |
(18,181 |
) |
|
$ |
(20,524 |
) |
|
$ |
(24,837 |
) |
|
$ |
(39,001 |
) |
|
$ |
(47,641 |
) |
|
$ |
(99,706 |
) |
|
$ |
(84,664 |
) |
|
$ |
(132,003 |
) |
|
Average consolidated interest-bearing liabilities
|
|
$ |
3,937,895 |
|
|
$ |
4,016,680 |
|
|
$ |
4,077,992 |
|
|
$ |
4,015,655 |
|
|
$ |
4,096,928 |
|
|
$ |
4,193,650 |
|
|
$ |
4,651,125 |
|
|
$ |
4,940,304 |
|
|
$ |
6,613,677 |
|
|
$ |
4,011,855 |
|
|
$ |
4,461,744 |
|
|
Cost of funds
|
|
|
2.20 |
% |
|
|
2.36 |
% |
|
|
2.08 |
% |
|
|
1.81 |
% |
|
|
2.00 |
% |
|
|
2.37 |
% |
|
|
3.35 |
% |
|
|
3.86 |
% |
|
|
6.03 |
% |
|
|
2.11 |
% |
|
|
2.96 |
% |
| |
|
|
|
|
|
|
|
|
|
|
|
|
|
|
|
|
|
|
|
|
|
|
|
|
|
|
|
|
|
|
|
|
|
|
|
|
|
|
|
|
|
|
|
|
|
Asset yield
|
|
|
4.48 |
% |
|
|
4.69 |
% |
|
|
4.40 |
% |
|
|
4.63 |
% |
|
|
4.78 |
% |
|
|
5.49 |
% |
|
|
5.58 |
% |
|
|
5.87 |
% |
|
|
7.04 |
% |
|
|
4.55 |
% |
|
|
5.44 |
% |
|
Cost of funds
|
|
|
(2.20 |
%) |
|
|
(2.36 |
%) |
|
|
(2.08 |
%) |
|
|
(1.81 |
%) |
|
|
(2.00 |
%) |
|
|
(2.37 |
%) |
|
|
(3.35 |
%) |
|
|
(3.86 |
%) |
|
|
(6.03 |
%) |
|
|
(2.11 |
%) |
|
|
(2.96 |
%) |
|
Interest rate spread
|
|
|
2.28 |
% |
|
|
2.33 |
% |
|
|
2.33 |
% |
|
|
2.82 |
% |
|
|
2.77 |
% |
|
|
3.12 |
% |
|
|
2.22 |
% |
|
|
2.01 |
% |
|
|
1.01 |
% |
|
|
2.44 |
% |
|
|
2.48 |
% |
| |
|
|
|
|
|
|
|
|
|
|
|
|
|
|
|
|
|
|
|
|
|
|
|
|
|
|
|
|
|
|
|
|
|
|
|
|
|
|
|
|
|
|
|
|
|
Net interest income
|
|
$ |
34,129 |
|
|
$ |
35,320 |
|
|
$ |
35,406 |
|
|
$ |
40,535 |
|
|
$ |
41,272 |
|
|
$ |
45,546 |
|
|
$ |
35,260 |
|
|
$ |
33,796 |
|
|
$ |
23,581 |
|
|
$ |
145,390 |
|
|
$ |
155,874 |
|
|
Average consolidated earning assets
|
|
$ |
4,980,935 |
|
|
$ |
5,030,680 |
|
|
$ |
5,139,945 |
|
|
$ |
5,070,987 |
|
|
$ |
5,175,337 |
|
|
$ |
5,128,893 |
|
|
$ |
5,325,322 |
|
|
$ |
5,553,470 |
|
|
$ |
7,006,592 |
|
|
$ |
5,055,322 |
|
|
$ |
5,294,037 |
|
|
Net interest margin
|
|
|
2.74 |
% |
|
|
2.81 |
% |
|
|
2.76 |
% |
|
|
3.20 |
% |
|
|
3.19 |
% |
|
|
3.55 |
% |
|
|
2.65 |
% |
|
|
2.43 |
% |
|
|
1.35 |
% |
|
|
2.88 |
% |
|
|
2.94 |
% |
| |
|
|
|
|
|
|
|
|
|
|
|
|
|
|
|
|
|
|
|
|
|
|
|
|
|
|
|
|
|
|
|
|
|
|
|
|
|
|
|
|
|
|
|
|
|
Operating expenses
|
|
$ |
(12,937 |
) |
|
$ |
(12,245 |
) |
|
$ |
(11,227 |
) |
|
$ |
(17,306 |
) |
|
$ |
(10,880 |
) |
|
$ |
(14,806 |
) |
|
$ |
(10,769 |
) |
|
$ |
(10,540 |
) |
|
$ |
(13,453 |
) |
|
$ |
(53,715 |
) |
|
$ |
(46,995 |
) |
| |
|
|
|
|
|
|
|
|
|
|
|
|
|
|
|
|
|
|
|
|
|
|
|
|
|
|
|
|
|
|
|
|
|
|
|
|
|
|
|
|
|
|
|
|
|
Average total assets
|
|
$ |
5,141,550 |
|
|
$ |
5,161,498 |
|
|
$ |
5,263,730 |
|
|
$ |
5,219,636 |
|
|
$ |
5,293,887 |
|
|
$ |
5,138,793 |
|
|
$ |
5,315,643 |
|
|
$ |
5,575,619 |
|
|
$ |
7,040,306 |
|
|
$ |
5,196,294 |
|
|
$ |
5,329,461 |
|
|
Average total equity
|
|
$ |
1,038,045 |
|
|
$ |
1,003,372 |
|
|
$ |
1,005,212 |
|
|
$ |
985,350 |
|
|
$ |
945,862 |
|
|
$ |
833,227 |
|
|
$ |
575,661 |
|
|
$ |
556,861 |
|
|
$ |
371,503 |
|
|
$ |
1,008,127 |
|
|
$ |
729,033 |
|
| |
|
|
|
|
|
|
|
|
|
|
|
|
|
|
|
|
|
|
|
|
|
|
|
|
|
|
|
|
|
|
|
|
|
|
|
|
|
|
|
|
|
|
|
|
|
Operating expenses / net interest income
|
|
|
37.91 |
% |
|
|
34.67 |
% |
|
|
31.71 |
% |
|
|
42.69 |
% |
|
|
26.36 |
% |
|
|
32.51 |
% |
|
|
30.54 |
% |
|
|
31.19 |
% |
|
|
57.05 |
% |
|
|
36.95 |
% |
|
|
30.15 |
% |
|
Operating expenses / average total assets
|
|
|
1.01 |
% |
|
|
0.95 |
% |
|
|
0.85 |
% |
|
|
1.33 |
% |
|
|
0.82 |
% |
|
|
1.15 |
% |
|
|
0.81 |
% |
|
|
0.76 |
% |
|
|
0.76 |
% |
|
|
1.03 |
% |
|
|
0.88 |
% |
|
Operating expenses / average total equity
|
|
|
4.99 |
% |
|
|
4.88 |
% |
|
|
4.47 |
% |
|
|
7.03 |
% |
|
|
4.60 |
% |
|
|
7.11 |
% |
|
|
7.48 |
% |
|
|
7.57 |
% |
|
|
14.49 |
% |
|
|
5.33 |
% |
|
|
6.45 |
% |
| |
|
|
|
|
|
|
|
|
|
|
|
|
|
|
|
|
|
|
|
|
|
|
|
|
|
|
|
|
|
|
|
|
|
|
|
|
|
|
|
|
|
|
|
|
|
GAAP net income (loss)
|
|
$ |
14,709 |
|
|
$ |
19,898 |
|
|
$ |
28,601 |
|
|
$ |
46,844 |
|
|
$ |
40,292 |
|
|
$ |
27,129 |
|
|
$ |
6,722 |
|
|
$ |
(34,948 |
) |
|
$ |
(115,586 |
) |
|
$ |
110,052 |
|
|
$ |
39,195 |
|
|
GAAP net income (loss) / average total assets
|
|
|
1.14 |
% |
|
|
1.54 |
% |
|
|
2.17 |
% |
|
|
3.59 |
% |
|
|
3.04 |
% |
|
|
2.11 |
% |
|
|
0.51 |
% |
|
|
(2.51 |
%) |
|
|
(6.57 |
%) |
|
|
2.12 |
% |
|
|
0.74 |
% |
|
GAAP net income (loss) / average equity (GAAP ROE)
|
|
|
5.67 |
% |
|
|
7.93 |
% |
|
|
11.38 |
% |
|
|
19.02 |
% |
|
|
17.04 |
% |
|
|
13.02 |
% |
|
|
4.67 |
% |
|
|
(25.10 |
%) |
|
|
(124.45 |
%) |
|
|
10.92 |
% |
|
|
5.38 |
% |
|
GAAP net income (loss) / average core equity (adjusted ROE) (2)
|
|
|
6.14 |
% |
|
|
8.25 |
% |
|
|
12.00 |
% |
|
|
20.09 |
% |
|
|
17.99 |
% |
|
|
12.22 |
% |
|
|
4.10 |
% |
|
|
(22.64 |
%) |
|
|
(103.09 |
%) |
|
|
11.56 |
% |
|
|
5.12 |
% |
| |
|
|
|
|
|
|
|
|
|
|
|
|
|
|
|
|
|
|
|
|
|
|
|
|
|
|
|
|
|
|
|
|
|
|
|
|
|
|
|
|
|
|
|
|
|
Average core equity (2)
|
|
$ |
958,194 |
|
|
$ |
964,249 |
|
|
$ |
953,720 |
|
|
$ |
932,721 |
|
|
$ |
896,034 |
|
|
$ |
888,107 |
|
|
$ |
655,695 |
|
|
$ |
617,325 |
|
|
$ |
448,484 |
|
|
$ |
952,324 |
|
|
$ |
765,393 |
|
(1) All percentages in this table are shown on an annualized basis.
(2) Core equity is a non-GAAP metric and is equal to GAAP equity excluding accumulated other comprehensive income (loss).
| THE REDWOOD REVIEW 4TH QUARTER 2010 |
Table 4: Yields and Profitability Ratios
|
55 |
| |
|
|
|
|
|
|
|
|
|
|
|
|
|
|
|
|
|
|
|
|
|
|
|
|
|
|
|
|
Twelve
|
|
|
Twelve
|
|
| |
|
2010
|
|
|
2010
|
|
|
2010
|
|
|
2010
|
|
|
2009
|
|
|
2009
|
|
|
2009
|
|
|
2009
|
|
|
2008
|
|
|
Months
|
|
|
Months
|
|
| |
|
Q4
|
|
|
Q3
|
|
|
Q2 |
|
|
Q1 |
|
|
Q4 |
|
|
Q3 |
|
|
Q2 |
|
|
Q1 |
|
|
Q4 |
|
|
2010 |
|
|
2009 |
|
| |
|
|
|
|
|
|
|
|
|
|
|
|
|
|
|
|
|
|
|
|
|
|
|
|
|
|
|
|
|
|
|
|
|
|
|
|
|
|
|
|
|
|
|
Real estate assets at Redwood
|
|
|
|
|
|
|
|
|
|
|
|
|
|
|
|
|
|
|
|
|
|
|
|
|
|
|
|
|
|
|
|
|
|
|
|
|
|
|
|
|
|
|
| |
|
|
|
|
|
|
|
|
|
|
|
|
|
|
|
|
|
|
|
|
|
|
|
|
|
|
|
|
|
|
|
|
|
|
|
|
|
|
|
|
|
|
|
Senior Residential Securities
|
|
|
|
|
|
|
|
|
|
|
|
|
|
|
|
|
|
|
|
|
|
|
|
|
|
|
|
|
|
|
|
|
|
|
|
|
|
|
|
|
|
|
|
Prime
|
|
$ |
262,048 |
|
|
$ |
270,286 |
|
|
$ |
278,472 |
|
|
$ |
283,477 |
|
|
$ |
280,101 |
|
|
$ |
264,773 |
|
|
$ |
164,386 |
|
|
$ |
77,651 |
|
|
$ |
37,746 |
|
|
$ |
273,503 |
|
|
$ |
197,469 |
|
|
Non-prime
|
|
|
321,655 |
|
|
|
316,089 |
|
|
|
302,461 |
|
|
|
310,948 |
|
|
|
263,022 |
|
|
|
270,353 |
|
|
|
168,383 |
|
|
|
87,464 |
|
|
|
63,050 |
|
|
|
312,827 |
|
|
|
197,987 |
|
|
Total Senior Residential Securities
|
|
|
583,703 |
|
|
|
586,375 |
|
|
|
580,933 |
|
|
|
594,426 |
|
|
|
543,124 |
|
|
|
535,126 |
|
|
|
332,769 |
|
|
|
165,114 |
|
|
|
100,796 |
|
|
|
586,330 |
|
|
|
395,456 |
|
| |
|
|
|
|
|
|
|
|
|
|
|
|
|
|
|
|
|
|
|
|
|
|
|
|
|
|
|
|
|
|
|
|
|
|
|
|
|
|
|
|
|
|
|
|
|
Residential Re-REMIC Securities
|
|
|
32,917 |
|
|
|
33,250 |
|
|
|
34,385 |
|
|
|
45,852 |
|
|
|
73,938 |
|
|
|
69,980 |
|
|
|
26,419 |
|
|
|
- |
|
|
|
- |
|
|
|
36,556 |
|
|
|
42,862 |
|
| |
|
|
|
|
|
|
|
|
|
|
|
|
|
|
|
|
|
|
|
|
|
|
|
|
|
|
|
|
|
|
|
|
|
|
|
|
|
|
|
|
|
|
|
|
|
Subordinate Residential Securities
|
|
|
|
|
|
|
|
|
|
|
|
|
|
|
|
|
|
|
|
|
|
|
|
|
|
|
|
|
|
|
|
|
|
|
|
|
|
|
|
|
|
|
|
|
|
Prime
|
|
|
45,914 |
|
|
|
35,794 |
|
|
|
38,079 |
|
|
|
41,701 |
|
|
|
47,083 |
|
|
|
58,637 |
|
|
|
43,020 |
|
|
|
47,070 |
|
|
|
88,943 |
|
|
|
40,371 |
|
|
|
48,979 |
|
|
Non-prime
|
|
|
11,890 |
|
|
|
9,181 |
|
|
|
7,708 |
|
|
|
4,253 |
|
|
|
1,377 |
|
|
|
2,218 |
|
|
|
2,767 |
|
|
|
3,450 |
|
|
|
4,105 |
|
|
|
8,282 |
|
|
|
2,446 |
|
|
Total Subordinate Residential Securities
|
|
|
57,804 |
|
|
|
44,975 |
|
|
|
45,787 |
|
|
|
45,954 |
|
|
|
48,460 |
|
|
|
60,855 |
|
|
|
45,787 |
|
|
|
50,519 |
|
|
|
93,048 |
|
|
|
48,653 |
|
|
|
51,425 |
|
| |
|
|
|
|
|
|
|
|
|
|
|
|
|
|
|
|
|
|
|
|
|
|
|
|
|
|
|
|
|
|
|
|
|
|
|
|
|
|
|
|
|
|
|
|
|
Commercial subordinate securities
|
|
|
6,948 |
|
|
|
7,274 |
|
|
|
7,417 |
|
|
|
7,670 |
|
|
|
8,090 |
|
|
|
13,504 |
|
|
|
25,006 |
|
|
|
46,382 |
|
|
|
63,969 |
|
|
|
7,325 |
|
|
|
23,114 |
|
|
Commercial loans
|
|
|
14,095 |
|
|
|
242 |
|
|
|
243 |
|
|
|
244 |
|
|
|
245 |
|
|
|
246 |
|
|
|
247 |
|
|
|
248 |
|
|
|
249 |
|
|
|
3,734 |
|
|
|
247 |
|
|
Residential loans
|
|
|
169,691 |
|
|
|
16,463 |
|
|
|
2,299 |
|
|
|
2,313 |
|
|
|
2,314 |
|
|
|
2,315 |
|
|
|
2,435 |
|
|
|
2,600 |
|
|
|
2,960 |
|
|
|
48,064 |
|
|
|
2,415 |
|
|
CDO
|
|
|
973 |
|
|
|
1,103 |
|
|
|
1,207 |
|
|
|
1,222 |
|
|
|
1,962 |
|
|
|
2,255 |
|
|
|
2,595 |
|
|
|
3,429 |
|
|
|
3,856 |
|
|
|
1,126 |
|
|
|
2,555 |
|
|
Other real estate investments
|
|
|
- |
|
|
|
- |
|
|
|
- |
|
|
|
- |
|
|
|
- |
|
|
|
- |
|
|
|
- |
|
|
|
- |
|
|
|
50 |
|
|
|
- |
|
|
|
- |
|
|
Total real estate assets at Redwood
|
|
|
866,131 |
|
|
|
689,682 |
|
|
|
672,270 |
|
|
|
697,681 |
|
|
|
678,133 |
|
|
|
684,281 |
|
|
|
435,258 |
|
|
|
268,293 |
|
|
|
264,927 |
|
|
|
731,788 |
|
|
|
518,074 |
|
| |
|
|
|
|
|
|
|
|
|
|
|
|
|
|
|
|
|
|
|
|
|
|
|
|
|
|
|
|
|
|
|
|
|
|
|
|
|
|
|
|
|
|
|
|
|
Earning assets at Acacia
|
|
|
311,949 |
|
|
|
292,468 |
|
|
|
290,060 |
|
|
|
299,843 |
|
|
|
304,436 |
|
|
|
298,615 |
|
|
|
321,206 |
|
|
|
404,596 |
|
|
|
575,709 |
|
|
|
298,597 |
|
|
|
331,847 |
|
|
Earning assets at legacy Sequoia
|
|
|
3,425,633 |
|
|
|
3,505,497 |
|
|
|
3,589,882 |
|
|
|
3,666,884 |
|
|
|
3,767,112 |
|
|
|
3,864,796 |
|
|
|
4,305,159 |
|
|
|
4,568,212 |
|
|
|
5,966,898 |
|
|
|
3,546,199 |
|
|
|
4,123,409 |
|
|
Earning assets at New Sequoia
|
|
|
162,271 |
|
|
|
204,504 |
|
|
|
161,502 |
|
|
|
- |
|
|
|
- |
|
|
|
- |
|
|
|
- |
|
|
|
- |
|
|
|
- |
|
|
|
132,712 |
|
|
|
- |
|
|
Earning assets at the Fund
|
|
|
33,001 |
|
|
|
34,334 |
|
|
|
35,526 |
|
|
|
42,134 |
|
|
|
53,990 |
|
|
|
57,070 |
|
|
|
58,054 |
|
|
|
62,319 |
|
|
|
71,792 |
|
|
|
36,219 |
|
|
|
57,833 |
|
| |
|
|
|
|
|
|
|
|
|
|
|
|
|
|
|
|
|
|
|
|
|
|
|
|
|
|
|
|
|
|
|
|
|
|
|
|
|
|
|
|
|
|
|
|
|
Cash and cash equivalents
|
|
|
102,099 |
|
|
|
265,071 |
|
|
|
339,212 |
|
|
|
311,816 |
|
|
|
321,838 |
|
|
|
279,011 |
|
|
|
285,680 |
|
|
|
310,514 |
|
|
|
204,246 |
|
|
|
254,004 |
|
|
|
299,236 |
|
|
Earning assets
|
|
|
4,901,084 |
|
|
|
4,991,557 |
|
|
|
5,088,452 |
|
|
|
5,018,358 |
|
|
|
5,125,509 |
|
|
|
5,183,773 |
|
|
|
5,405,357 |
|
|
|
5,613,934 |
|
|
|
7,083,573 |
|
|
|
4,999,519 |
|
|
|
5,330,399 |
|
|
Balance sheet mark-to-market adjustments
|
|
|
79,851 |
|
|
|
39,123 |
|
|
|
51,493 |
|
|
|
52,629 |
|
|
|
49,828 |
|
|
|
(54,880 |
) |
|
|
(80,035 |
) |
|
|
(60,464 |
) |
|
|
(76,981 |
) |
|
|
55,803 |
|
|
|
(36,362 |
) |
|
Earning assets - reported value
|
|
|
4,980,935 |
|
|
|
5,030,680 |
|
|
|
5,139,945 |
|
|
|
5,070,987 |
|
|
|
5,175,337 |
|
|
|
5,128,893 |
|
|
|
5,325,322 |
|
|
|
5,553,470 |
|
|
|
7,006,592 |
|
|
|
5,055,322 |
|
|
|
5,294,037 |
|
|
Other assets
|
|
|
160,615 |
|
|
|
130,818 |
|
|
|
123,785 |
|
|
|
148,649 |
|
|
|
118,550 |
|
|
|
9,900 |
|
|
|
(9,680 |
) |
|
|
22,148 |
|
|
|
33,714 |
|
|
|
140,972 |
|
|
|
35,424 |
|
|
Total assets
|
|
$ |
5,141,550 |
|
|
$ |
5,161,498 |
|
|
$ |
5,263,730 |
|
|
$ |
5,219,636 |
|
|
$ |
5,293,887 |
|
|
$ |
5,138,793 |
|
|
$ |
5,315,643 |
|
|
$ |
5,575,619 |
|
|
$ |
7,040,306 |
|
|
$ |
5,196,294 |
|
|
$ |
5,329,461 |
|
| |
|
|
|
|
|
|
|
|
|
|
|
|
|
|
|
|
|
|
|
|
|
|
|
|
|
|
|
|
|
|
|
|
|
|
|
|
|
|
|
|
|
|
|
|
|
Short-term debt
|
|
$ |
11,265 |
|
|
$ |
- |
|
|
$ |
7,920 |
|
|
$ |
- |
|
|
$ |
- |
|
|
$ |
- |
|
|
$ |
- |
|
|
$ |
- |
|
|
$ |
975 |
|
|
$ |
4,814 |
|
|
$ |
- |
|
|
Legacy Sequoia ABS issued
|
|
|
3,365,929 |
|
|
|
3,439,201 |
|
|
|
3,518,773 |
|
|
|
3,589,269 |
|
|
|
3,666,201 |
|
|
|
3,765,292 |
|
|
|
4,211,937 |
|
|
|
4,460,951 |
|
|
|
5,804,702 |
|
|
|
3,477,574 |
|
|
|
4,023,203 |
|
|
New Sequoia ABS issued
|
|
|
147,364 |
|
|
|
184,615 |
|
|
|
144,201 |
|
|
|
- |
|
|
|
- |
|
|
|
- |
|
|
|
- |
|
|
|
- |
|
|
|
- |
|
|
|
119,628 |
|
|
|
- |
|
|
Acacia ABS issued
|
|
|
274,630 |
|
|
|
254,244 |
|
|
|
268,715 |
|
|
|
288,241 |
|
|
|
288,041 |
|
|
|
283,996 |
|
|
|
285,698 |
|
|
|
325,392 |
|
|
|
652,398 |
|
|
|
271,373 |
|
|
|
295,647 |
|
|
Other liabilities
|
|
|
151,332 |
|
|
|
126,428 |
|
|
|
164,764 |
|
|
|
200,096 |
|
|
|
231,553 |
|
|
|
91,027 |
|
|
|
66,588 |
|
|
|
55,487 |
|
|
|
32,533 |
|
|
|
160,427 |
|
|
|
111,590 |
|
|
Long-term debt
|
|
|
138,707 |
|
|
|
138,620 |
|
|
|
138,383 |
|
|
|
138,145 |
|
|
|
137,907 |
|
|
|
139,190 |
|
|
|
147,430 |
|
|
|
147,193 |
|
|
|
146,944 |
|
|
|
138,466 |
|
|
|
142,894 |
|
|
Total liabilities
|
|
|
4,089,227 |
|
|
|
4,143,108 |
|
|
|
4,242,755 |
|
|
|
4,215,751 |
|
|
|
4,323,702 |
|
|
|
4,279,505 |
|
|
|
4,711,653 |
|
|
|
4,989,023 |
|
|
|
6,637,552 |
|
|
|
4,172,283 |
|
|
|
4,573,334 |
|
| |
|
|
|
|
|
|
|
|
|
|
|
|
|
|
|
|
|
|
|
|
|
|
|
|
|
|
|
|
|
|
|
|
|
|
|
|
|
|
|
|
|
|
|
|
|
Noncontrolling interest
|
|
|
14,278 |
|
|
|
15,018 |
|
|
|
15,763 |
|
|
|
18,535 |
|
|
|
24,322 |
|
|
|
26,061 |
|
|
|
28,330 |
|
|
|
29,735 |
|
|
|
31,251 |
|
|
|
15,884 |
|
|
|
27,094 |
|
| |
|
|
|
|
|
|
|
|
|
|
|
|
|
|
|
|
|
|
|
|
|
|
|
|
|
|
|
|
|
|
|
|
|
|
|
|
|
|
|
|
|
|
|
|
|
Core equity (1)
|
|
|
958,194 |
|
|
|
964,249 |
|
|
|
953,720 |
|
|
|
932,721 |
|
|
|
896,034 |
|
|
|
888,107 |
|
|
|
655,695 |
|
|
|
617,325 |
|
|
|
448,484 |
|
|
|
952,324 |
|
|
|
765,393 |
|
|
Accumulated other comprehensive income (loss)
|
|
|
79,851 |
|
|
|
39,123 |
|
|
|
51,493 |
|
|
|
52,629 |
|
|
|
49,829 |
|
|
|
(54,880 |
) |
|
|
(80,035 |
) |
|
|
(60,464 |
) |
|
|
(76,981 |
) |
|
|
55,803 |
|
|
|
(36,360 |
) |
|
Total equity
|
|
|
1,038,045 |
|
|
|
1,003,372 |
|
|
|
1,005,212 |
|
|
|
985,350 |
|
|
|
945,863 |
|
|
|
833,227 |
|
|
|
575,661 |
|
|
|
556,861 |
|
|
|
371,503 |
|
|
|
1,008,127 |
|
|
|
729,033 |
|
| |
|
|
|
|
|
|
|
|
|
|
|
|
|
|
|
|
|
|
|
|
|
|
|
|
|
|
|
|
|
|
|
|
|
|
|
|
|
|
|
|
|
|
|
|
|
Total liabilities and equity
|
|
$ |
5,141,550 |
|
|
$ |
5,161,498 |
|
|
$ |
5,263,730 |
|
|
$ |
5,219,636 |
|
|
$ |
5,293,887 |
|
|
$ |
5,138,793 |
|
|
$ |
5,315,643 |
|
|
$ |
5,575,619 |
|
|
$ |
7,040,306 |
|
|
$ |
5,196,294 |
|
|
$ |
5,329,461 |
|
(1) Core equity is a non-GAAP metric and is equal to GAAP equity excluding accumulated other comprehensive income (loss).
| THE REDWOOD REVIEW 4TH QUARTER 2010 |
Table 5: Average Balance Sheet
|
|
| |
|
2010
|
|
|
2010
|
|
|
2010
|
|
|
2010
|
|
|
2009
|
|
|
2009
|
|
|
2009
|
|
|
|
|
2010
|
|
|
2010
|
|
|
2010
|
|
|
2010
|
|
|
2009
|
|
|
2009
|
|
|
2009
|
|
| |
|
Q4
|
|
|
Q3
|
|
|
Q2
|
|
|
Q1
|
|
|
Q4
|
|
|
Q3
|
|
|
Q2
|
|
|
|
|
Q4
|
|
|
Q3
|
|
|
Q2
|
|
|
Q1
|
|
|
Q4
|
|
|
Q3
|
|
|
Q2
|
|
|
Residential Prime Senior AFS
|
|
|
|
|
|
|
|
|
|
|
|
|
|
|
|
|
|
|
|
|
|
|
Residential Non-Prime Subordinate AFS
|
|
|
|
|
|
|
|
|
|
|
|
|
|
|
|
|
|
|
|
|
|
|
Current face
|
|
$ |
358,683 |
|
|
$ |
368,191 |
|
|
$ |
371,066 |
|
|
$ |
450,647 |
|
|
$ |
412,471 |
|
|
$ |
431,289 |
|
|
$ |
276,444 |
|
|
Current face
|
|
$ |
31,556 |
|
|
$ |
27,461 |
|
|
$ |
32,443 |
|
|
$ |
56,128 |
|
|
$ |
71,963 |
|
|
$ |
143,357 |
|
|
$ |
210,475 |
|
|
Unamortized discount
|
|
|
(83,465 |
) |
|
|
(88,978 |
) |
|
|
(93,502 |
) |
|
|
(113,757 |
) |
|
|
(116,801 |
) |
|
|
(124,295 |
) |
|
|
(91,221 |
) |
|
Unamortized (discount) premium
|
|
|
(10,123 |
) |
|
|
(7,279 |
) |
|
|
(7,558 |
) |
|
|
(2,742 |
) |
|
|
(242 |
) |
|
|
(1,524 |
) |
|
|
852 |
|
|
Credit reserve
|
|
|
(15,667 |
) |
|
|
(12,822 |
) |
|
|
(10,084 |
) |
|
|
(14,637 |
) |
|
|
(9,898 |
) |
|
|
(11,069 |
) |
|
|
(3,486 |
) |
|
Credit reserve
|
|
|
(9,229 |
) |
|
|
(11,323 |
) |
|
|
(15,775 |
) |
|
|
(47,805 |
) |
|
|
(70,806 |
) |
|
|
(140,046 |
) |
|
|
(208,839 |
) |
|
Unrealized gains, net
|
|
|
56,340 |
|
|
|
49,543 |
|
|
|
42,222 |
|
|
|
49,887 |
|
|
|
43,436 |
|
|
|
40,734 |
|
|
|
1,729 |
|
|
Unrealized gains (losses) , net
|
|
|
984 |
|
|
|
953 |
|
|
|
732 |
|
|
|
772 |
|
|
|
162 |
|
|
|
(806 |
) |
|
|
473 |
|
|
Fair value
|
|
$ |
315,891 |
|
|
$ |
315,934 |
|
|
$ |
309,702 |
|
|
$ |
372,140 |
|
|
$ |
329,208 |
|
|
$ |
336,659 |
|
|
$ |
183,466 |
|
|
Fair value
|
|
$ |
13,188 |
|
|
$ |
9,812 |
|
|
$ |
9,842 |
|
|
$ |
6,353 |
|
|
$ |
1,077 |
|
|
$ |
981 |
|
|
$ |
2,961 |
|
| |
|
|
|
|
|
|
|
|
|
|
|
|
|
|
|
|
|
|
|
|
|
|
|
|
|
|
|
|
|
|
|
|
|
|
|
|
|
|
|
|
|
|
|
|
|
|
|
|
|
|
|
|
|
|
|
|
|
|
|
Average amortized cost
|
|
$ |
262,048 |
|
|
$ |
270,286 |
|
|
$ |
278,472 |
|
|
$ |
283,477 |
|
|
$ |
280,101 |
|
|
$ |
264,773 |
|
|
$ |
164,386 |
|
|
Average amortized cost
|
|
$ |
11,670 |
|
|
$ |
8,988 |
|
|
$ |
7,519 |
|
|
$ |
4,047 |
|
|
$ |
1,156 |
|
|
$ |
1,994 |
|
|
$ |
2,503 |
|
|
Interest income
|
|
$ |
8,306 |
|
|
$ |
7,617 |
|
|
$ |
7,868 |
|
|
$ |
8,455 |
|
|
$ |
8,610 |
|
|
$ |
8,431 |
|
|
$ |
5,475 |
|
|
Interest income
|
|
$ |
619 |
|
|
$ |
545 |
|
|
$ |
603 |
|
|
$ |
129 |
|
|
$ |
8 |
|
|
$ |
392 |
|
|
$ |
1,615 |
|
|
Annualized yield
|
|
|
12.68 |
% |
|
|
11.27 |
% |
|
|
11.30 |
% |
|
|
11.93 |
% |
|
|
12.30 |
% |
|
|
12.74 |
% |
|
|
13.32 |
% |
|
Annualized yield
|
|
|
21.22 |
% |
|
|
24.25 |
% |
|
|
32.10 |
% |
|
|
12.75 |
% |
|
|
2.67 |
% |
|
|
78.65 |
% |
|
|
258.13 |
% |
| |
|
|
|
|
|
|
|
|
|
|
|
|
|
|
|
|
|
|
|
|
|
|
|
|
|
|
|
|
|
|
|
|
|
|
|
|
|
|
|
|
|
|
|
|
|
|
|
|
|
|
|
|
|
|
|
|
|
|
|
Residential Non-Prime Senior AFS
|
|
|
|
|
|
|
|
|
|
|
|
|
|
|
|
|
|
|
|
|
|
|
|
|
|
|
|
|
|
Commercial Subordinate AFS
|
|
|
|
|
|
|
|
|
|
|
|
|
|
|
|
|
|
|
|
|
|
|
|
|
|
|
|
|
|
Current face
|
|
$ |
416,169 |
|
|
$ |
431,143 |
|
|
$ |
399,988 |
|
|
$ |
471,894 |
|
|
$ |
423,961 |
|
|
$ |
395,311 |
|
|
$ |
387,431 |
|
|
Current face
|
|
$ |
89,103 |
|
|
$ |
109,275 |
|
|
$ |
140,547 |
|
|
$ |
152,408 |
|
|
$ |
158,997 |
|
|
$ |
486,245 |
|
|
$ |
506,746 |
|
|
Unamortized discount
|
|
|
(104,517 |
) |
|
|
(111,709 |
) |
|
|
(110,018 |
) |
|
|
(133,479 |
) |
|
|
(133,995 |
) |
|
|
(132,036 |
) |
|
|
(133,753 |
) |
|
Unamortized discount
|
|
|
(5,591 |
) |
|
|
(5,610 |
) |
|
|
(5,534 |
) |
|
|
(5,660 |
) |
|
|
(5,130 |
) |
|
|
(1,624 |
) |
|
|
(120 |
) |
|
Credit reserve
|
|
|
(15,928 |
) |
|
|
(14,193 |
) |
|
|
(10,894 |
) |
|
|
(13,830 |
) |
|
|
(13,468 |
) |
|
|
(10,098 |
) |
|
|
(16,009 |
) |
|
Credit reserve
|
|
|
(76,979 |
) |
|
|
(96,657 |
) |
|
|
(127,627 |
) |
|
|
(139,320 |
) |
|
|
(146,018 |
) |
|
|
(471,957 |
) |
|
|
(492,459 |
) |
|
Unrealized gains (losses), net
|
|
|
30,641 |
|
|
|
27,588 |
|
|
|
24,559 |
|
|
|
24,556 |
|
|
|
32,371 |
|
|
|
23,322 |
|
|
|
(7,410 |
) |
|
Unrealized gains, net
|
|
|
963 |
|
|
|
904 |
|
|
|
224 |
|
|
|
1,448 |
|
|
|
1,351 |
|
|
|
4,169 |
|
|
|
1,502 |
|
|
Fair value
|
|
$ |
326,365 |
|
|
$ |
332,829 |
|
|
$ |
303,635 |
|
|
$ |
349,141 |
|
|
$ |
308,869 |
|
|
$ |
276,499 |
|
|
$ |
230,259 |
|
|
Fair value
|
|
$ |
7,496 |
|
|
$ |
7,912 |
|
|
$ |
7,610 |
|
|
$ |
8,876 |
|
|
$ |
9,200 |
|
|
$ |
16,833 |
|
|
$ |
15,669 |
|
| |
|
|
|
|
|
|
|
|
|
|
|
|
|
|
|
|
|
|
|
|
|
|
|
|
|
|
|
|
|
|
|
|
|
|
|
|
|
|
|
|
|
|
|
|
|
|
|
|
|
|
|
|
|
|
|
|
|
|
|
Average amortized cost
|
|
$ |
301,498 |
|
|
$ |
297,197 |
|
|
$ |
286,462 |
|
|
$ |
292,210 |
|
|
$ |
259,911 |
|
|
$ |
269,501 |
|
|
$ |
167,679 |
|
|
Average amortized cost
|
|
$ |
6,948 |
|
|
$ |
7,274 |
|
|
$ |
7,417 |
|
|
$ |
7,670 |
|
|
$ |
8,090 |
|
|
$ |
13,504 |
|
|
$ |
25,006 |
|
|
Interest income
|
|
$ |
8,415 |
|
|
$ |
8,583 |
|
|
$ |
9,007 |
|
|
$ |
10,208 |
|
|
$ |
7,907 |
|
|
$ |
10,374 |
|
|
$ |
6,607 |
|
|
Interest income
|
|
$ |
616 |
|
|
$ |
2,135 |
|
|
$ |
696 |
|
|
$ |
716 |
|
|
$ |
1,233 |
|
|
$ |
2,192 |
|
|
$ |
1,599 |
|
|
Annualized yield
|
|
|
11.16 |
% |
|
|
11.55 |
% |
|
|
12.58 |
% |
|
|
13.97 |
% |
|
|
12.17 |
% |
|
|
15.40 |
% |
|
|
15.76 |
% |
|
Annualized yield
|
|
|
35.46 |
% |
|
|
117.40 |
% |
|
|
37.55 |
% |
|
|
37.36 |
% |
|
|
60.97 |
% |
|
|
64.93 |
% |
|
|
25.58 |
% |
| |
|
|
|
|
|
|
|
|
|
|
|
|
|
|
|
|
|
|
|
|
|
|
|
|
|
|
|
|
|
|
|
|
|
|
|
|
|
|
|
|
|
|
|
|
|
|
|
|
|
|
|
|
|
|
|
|
|
|
|
Residential Re-REMIC AFS
|
|
|
|
|
|
|
|
|
|
|
|
|
|
|
|
|
|
|
|
|
|
|
|
|
|
|
|
|
|
CDO Subordinate AFS
|
|
|
|
|
|
|
|
|
|
|
|
|
|
|
|
|
|
|
|
|
|
|
|
|
|
|
|
|
|
Current face
|
|
$ |
139,426 |
|
|
$ |
139,426 |
|
|
$ |
139,426 |
|
|
$ |
146,964 |
|
|
$ |
255,975 |
|
|
$ |
318,703 |
|
|
$ |
236,070 |
|
|
Current face
|
|
$ |
14,815 |
|
|
$ |
14,786 |
|
|
$ |
14,761 |
|
|
$ |
14,736 |
|
|
$ |
14,710 |
|
|
$ |
14,683 |
|
|
$ |
14,650 |
|
|
Unamortized discount
|
|
|
(62,471 |
) |
|
|
(65,691 |
) |
|
|
(68,049 |
) |
|
|
(68,806 |
) |
|
|
(109,807 |
) |
|
|
(144,351 |
) |
|
|
(134,621 |
) |
|
Unamortized discount
|
|
|
(1,082 |
) |
|
|
(1,082 |
) |
|
|
(1,083 |
) |
|
|
(1,083 |
) |
|
|
(1,082 |
) |
|
|
(1,083 |
) |
|
|
(1,082 |
) |
|
Credit reserve
|
|
|
(44,182 |
) |
|
|
(40,656 |
) |
|
|
(37,962 |
) |
|
|
(42,299 |
) |
|
|
(81,726 |
) |
|
|
(94,626 |
) |
|
|
(45,874 |
) |
|
Credit reserve
|
|
|
(13,733 |
) |
|
|
(13,704 |
) |
|
|
(13,678 |
) |
|
|
(13,653 |
) |
|
|
(13,628 |
) |
|
|
(13,600 |
) |
|
|
(13,568 |
) |
|
Unrealized gains (losses), net
|
|
|
52,304 |
|
|
|
41,812 |
|
|
|
35,655 |
|
|
|
31,054 |
|
|
|
41,509 |
|
|
|
13,781 |
|
|
|
(434 |
) |
|
Unrealized gains, net
|
|
|
- |
|
|
|
- |
|
|
|
- |
|
|
|
- |
|
|
|
25 |
|
|
|
25 |
|
|
|
25 |
|
|
Fair value
|
|
$ |
85,077 |
|
|
$ |
74,891 |
|
|
$ |
69,070 |
|
|
$ |
66,913 |
|
|
$ |
105,951 |
|
|
$ |
93,507 |
|
|
$ |
55,141 |
|
|
Fair value
|
|
$ |
- |
|
|
$ |
- |
|
|
$ |
- |
|
|
$ |
- |
|
|
$ |
25 |
|
|
$ |
25 |
|
|
$ |
25 |
|
| |
|
|
|
|
|
|
|
|
|
|
|
|
|
|
|
|
|
|
|
|
|
|
|
|
|
|
|
|
|
|
|
|
|
|
|
|
|
|
|
|
|
|
|
|
|
|
|
|
|
|
|
|
|
|
|
|
|
|
|
Average amortized cost
|
|
$ |
32,917 |
|
|
$ |
33,250 |
|
|
$ |
34,385 |
|
|
$ |
45,852 |
|
|
$ |
73,938 |
|
|
$ |
69,980 |
|
|
$ |
26,419 |
|
|
Average amortized cost
|
|
$ |
- |
|
|
$ |
- |
|
|
$ |
- |
|
|
$ |
- |
|
|
$ |
- |
|
|
$ |
- |
|
|
$ |
21 |
|
|
Interest income
|
|
$ |
1,440 |
|
|
$ |
1,458 |
|
|
$ |
1,382 |
|
|
$ |
1,925 |
|
|
$ |
2,941 |
|
|
$ |
3,110 |
|
|
$ |
573 |
|
|
Interest income
|
|
$ |
- |
|
|
$ |
8 |
|
|
$ |
82 |
|
|
$ |
12 |
|
|
$ |
96 |
|
|
$ |
24 |
|
|
$ |
96 |
|
|
Annualized yield
|
|
|
17.50 |
% |
|
|
17.55 |
% |
|
|
16.08 |
% |
|
|
16.79 |
% |
|
|
15.91 |
% |
|
|
17.77 |
% |
|
|
8.67 |
% |
|
Annualized yield
|
|
|
N/A |
|
|
|
N/A |
|
|
|
N/A |
|
|
|
N/A |
|
|
|
N/A |
|
|
|
12.97 |
% |
|
|
25.09 |
% |
| |
|
|
|
|
|
|
|
|
|
|
|
|
|
|
|
|
|
|
|
|
|
|
|
|
|
|
|
|
|
|
|
|
|
|
|
|
|
|
|
|
|
|
|
|
|
|
|
|
|
|
|
|
|
|
|
|
|
|
|
Residential Prime Subordinate AFS
|
|
|
|
|
|
|
|
|
|
|
|
|
|
|
|
|
|
|
|
|
|
|
|
|
|
|
|
|
|
Fair Value Securities
|
|
|
|
|
|
|
|
|
|
|
|
|
|
|
|
|
|
|
|
|
|
|
|
|
|
|
|
|
|
Current face
|
|
$ |
273,042 |
|
|
$ |
278,171 |
|
|
$ |
297,932 |
|
|
$ |
324,226 |
|
|
$ |
347,848 |
|
|
$ |
378,417 |
|
|
$ |
411,166 |
|
|
|
|
|
|
|
|
|
|
|
|
|
|
|
|
|
|
|
|
|
|
|
|
|
|
|
|
|
|
|
|
Unamortized discount
|
|
|
(24,308 |
) |
|
|
(23,488 |
) |
|
|
(22,886 |
) |
|
|
(23,310 |
) |
|
|
(21,588 |
) |
|
|
(22,597 |
) |
|
|
(28,259 |
) |
|
|
|
|
|
|
|
|
|
|
|
|
|
|
|
|
|
|
|
|
|
|
|
|
|
|
|
|
|
|
|
Credit reserve
|
|
|
(199,754 |
) |
|
|
(217,996 |
) |
|
|
(240,357 |
) |
|
|
(261,854 |
) |
|
|
(282,813 |
) |
|
|
(306,728 |
) |
|
|
(319,653 |
) |
|
|
|
|
|
|
|
|
|
|
|
|
|
|
|
|
|
|
|
|
|
|
|
|
|
|
|
|
|
|
|
Unrealized gains (losses), net
|
|
|
4,866 |
|
|
|
(3,663 |
) |
|
|
(18,665 |
) |
|
|
(22,812 |
) |
|
|
(24,256 |
) |
|
|
(27,643 |
) |
|
|
(37,112 |
) |
|
|
|
|
|
|
|
|
|
|
|
|
|
|
|
|
|
|
|
|
|
|
|
|
|
|
|
|
|
|
|
Fair value
|
|
$ |
53,846 |
|
|
$ |
33,024 |
|
|
$ |
16,024 |
|
|
$ |
16,250 |
|
|
$ |
19,191 |
|
|
$ |
21,449 |
|
|
$ |
26,142 |
|
|
Fair value
|
|
$ |
21,354 |
|
|
$ |
22,826 |
|
|
$ |
18,464 |
|
|
$ |
19,990 |
|
|
$ |
7,842 |
|
|
$ |
5,314 |
|
|
$ |
3,810 |
|
| |
|
|
|
|
|
|
|
|
|
|
|
|
|
|
|
|
|
|
|
|
|
|
|
|
|
|
|
|
|
|
|
|
|
|
|
|
|
|
|
|
|
|
|
|
|
|
|
|
|
|
|
|
|
|
|
|
|
|
|
Average amortized cost
|
|
$ |
45,550 |
|
|
$ |
35,443 |
|
|
$ |
37,731 |
|
|
$ |
41,373 |
|
|
$ |
46,637 |
|
|
$ |
58,063 |
|
|
$ |
42,353 |
|
|
Average fair value
|
|
$ |
21,713 |
|
|
$ |
20,539 |
|
|
$ |
17,743 |
|
|
$ |
20,494 |
|
|
$ |
5,740 |
|
|
$ |
3,905 |
|
|
$ |
4,209 |
|
|
Interest income
|
|
$ |
4,170 |
|
|
$ |
3,328 |
|
|
$ |
3,219 |
|
|
$ |
2,847 |
|
|
$ |
3,406 |
|
|
$ |
4,135 |
|
|
$ |
3,703 |
|
|
Interest income
|
|
$ |
2,241 |
|
|
$ |
2,350 |
|
|
$ |
2,559 |
|
|
$ |
2,957 |
|
|
$ |
1,102 |
|
|
$ |
1,231 |
|
|
$ |
872 |
|
|
Annualized yield
|
|
|
36.61 |
% |
|
|
37.55 |
% |
|
|
34.13 |
% |
|
|
27.53 |
% |
|
|
29.21 |
% |
|
|
28.49 |
% |
|
|
34.97 |
% |
|
Annualized yield
|
|
|
41.29 |
% |
|
|
45.76 |
% |
|
|
57.68 |
% |
|
|
57.72 |
% |
|
|
76.79 |
% |
|
|
126.12 |
% |
|
|
82.86 |
% |
| |
|
|
|
|
|
|
|
|
|
|
|
|
|
|
|
|
|
|
|
|
|
|
|
|
|
|
|
|
|
|
|
|
|
|
|
|
|
|
|
|
|
|
|
|
|
|
|
|
|
|
|
|
|
|
|
|
|
|
|
(1) Annualized yields are based on average amortized cost. Cash flows from many of our subordinate securities can be volatile and in certain cases (e.g., when the fair value of certain securities are close to zero) any interest income earned can result in unusually high reported yields that are not sustainable and not necessarily meaningful.
|
| THE REDWOOD REVIEW 4TH QUARTER 2010 |
Table 6: Balances & Yields by Securities Portfolio at Redwood
|
57 |
 |
Table 7: Securities Portfolio Activity at Redwood ($ in thousands)
|
58 |
| |
|
2010
|
|
|
2010
|
|
|
2010
|
|
|
2010
|
|
|
2009
|
|
|
2009
|
|
|
2009
|
|
|
|
|
2010
|
|
|
2010
|
|
|
2010
|
|
|
2010
|
|
|
2009
|
|
|
2009
|
|
|
2009
|
|
| |
|
Q4
|
|
|
Q3
|
|
|
Q2
|
|
|
Q1
|
|
|
Q4
|
|
|
Q3
|
|
|
Q2
|
|
|
|
|
Q4
|
|
|
Q3
|
|
|
Q2
|
|
|
Q1
|
|
|
Q4
|
|
|
Q3
|
|
|
Q2
|
|
|
Residential Prime Senior
|
|
|
|
|
|
|
|
|
|
|
|
|
|
|
|
|
|
|
|
|
|
|
Residential Real Estate Loans
|
|
|
|
|
|
|
|
|
|
|
|
|
|
|
|
|
|
|
|
|
|
|
|
Beginning fair value
|
|
$ |
315,934 |
|
|
$ |
309,702 |
|
|
$ |
372,140 |
|
|
$ |
329,208 |
|
|
$ |
336,659 |
|
|
$ |
183,466 |
|
|
$ |
87,766 |
|
|
Beginning fair value
|
|
$ |
63,487 |
|
|
$ |
2,404 |
|
|
$ |
2,227 |
|
|
$ |
2,374 |
|
|
$ |
2,299 |
|
|
$ |
2,336 |
|
|
$ |
2,577 |
|
|
Acquisitions
|
|
|
6,043 |
|
|
|
9,954 |
|
|
|
1,055 |
|
|
|
56,010 |
|
|
|
27,607 |
|
|
|
134,738 |
|
|
|
120,982 |
|
|
Acquisitions
|
|
|
194,863 |
|
|
|
62,135 |
|
|
|
- |
|
|
|
- |
|
|
|
- |
|
|
|
- |
|
|
|
- |
|
|
Sales
|
|
|
- |
|
|
|
- |
|
|
|
(43,485 |
) |
|
|
(8,780 |
) |
|
|
(24,104 |
) |
|
|
(5,091 |
) |
|
|
(35,713 |
) |
|
Principal Payments
|
|
|
(3,517 |
) |
|
|
(601 |
) |
|
|
46 |
|
|
|
(27 |
) |
|
|
(30 |
) |
|
|
(28 |
) |
|
|
(185 |
) |
|
Effect of principal payments
|
|
|
(15,199 |
) |
|
|
(12,186 |
) |
|
|
(13,065 |
) |
|
|
(11,220 |
) |
|
|
(13,632 |
) |
|
|
(13,121 |
) |
|
|
(6,499 |
) |
|
Transfers to REO
|
|
|
- |
|
|
|
(63 |
) |
|
|
(165 |
) |
|
|
- |
|
|
|
- |
|
|
|
- |
|
|
|
- |
|
|
Change in fair value, net
|
|
|
9,113 |
|
|
|
8,464 |
|
|
|
(6,943 |
) |
|
|
6,922 |
|
|
|
2,678 |
|
|
|
36,667 |
|
|
|
16,930 |
|
|
Changes in fair value, net
|
|
|
103 |
|
|
|
(388 |
) |
|
|
296 |
|
|
|
(120 |
) |
|
|
105 |
|
|
|
(9 |
) |
|
|
(56 |
) |
|
Ending fair value
|
|
$ |
315,891 |
|
|
$ |
315,934 |
|
|
$ |
309,702 |
|
|
$ |
372,140 |
|
|
$ |
329,208 |
|
|
$ |
336,659 |
|
|
$ |
183,466 |
|
|
Ending fair value
|
|
$ |
254,936 |
|
|
$ |
63,487 |
|
|
$ |
2,404 |
|
|
$ |
2,227 |
|
|
$ |
2,374 |
|
|
$ |
2,299 |
|
|
$ |
2,336 |
|
| |
|
|
|
|
|
|
|
|
|
|
|
|
|
|
|
|
|
|
|
|
|
|
|
|
|
|
|
|
|
|
|
|
|
|
|
|
|
|
|
|
|
|
|
|
|
|
|
|
|
|
|
|
|
|
|
|
|
|
|
Residential Non-Prime Senior
|
|
|
|
|
|
|
|
|
|
|
|
|
|
|
|
|
|
|
|
|
|
|
|
|
|
|
|
|
|
Commercial Subordinate
|
|
|
|
|
|
|
|
|
|
|
|
|
|
|
|
|
|
|
|
|
|
|
|
|
|
|
|
|
|
Beginning fair value
|
|
$ |
354,106 |
|
|
$ |
320,397 |
|
|
$ |
367,372 |
|
|
$ |
314,952 |
|
|
$ |
279,000 |
|
|
$ |
230,955 |
|
|
$ |
74,383 |
|
|
Beginning fair value
|
|
$ |
7,912 |
|
|
$ |
7,610 |
|
|
$ |
8,876 |
|
|
$ |
9,200 |
|
|
$ |
16,833 |
|
|
$ |
15,669 |
|
|
$ |
22,915 |
|
|
Acquisitions
|
|
|
635 |
|
|
|
32,777 |
|
|
|
16,113 |
|
|
|
118,195 |
|
|
|
37,157 |
|
|
|
84,837 |
|
|
|
162,745 |
|
|
Acquisitions
|
|
|
- |
|
|
|
- |
|
|
|
- |
|
|
|
- |
|
|
|
- |
|
|
|
- |
|
|
|
- |
|
|
Sales
|
|
|
- |
|
|
|
- |
|
|
|
(54,285 |
) |
|
|
(49,361 |
) |
|
|
- |
|
|
|
(56,299 |
) |
|
|
(14,613 |
) |
|
Sales
|
|
|
- |
|
|
|
- |
|
|
|
- |
|
|
|
- |
|
|
|
(4,778 |
) |
|
|
- |
|
|
|
- |
|
|
Effect of principal payments
|
|
|
(12,298 |
) |
|
|
(9,657 |
) |
|
|
(12,582 |
) |
|
|
(10,242 |
) |
|
|
(10,214 |
) |
|
|
(11,083 |
) |
|
|
(5,128 |
) |
|
Effect of principal payments
|
|
|
- |
|
|
|
- |
|
|
|
- |
|
|
|
- |
|
|
|
- |
|
|
|
- |
|
|
|
- |
|
|
Change in fair value, net
|
|
|
3,664 |
|
|
|
10,589 |
|
|
|
3,779 |
|
|
|
(6,171 |
) |
|
|
9,009 |
|
|
|
30,590 |
|
|
|
13,568 |
|
|
Change in fair value, net
|
|
|
(416 |
) |
|
|
302 |
|
|
|
(1,266 |
) |
|
|
(324 |
) |
|
|
(2,855 |
) |
|
|
1,164 |
|
|
|
(7,246 |
) |
|
Ending fair value
|
|
$ |
346,107 |
|
|
$ |
354,106 |
|
|
$ |
320,397 |
|
|
$ |
367,372 |
|
|
$ |
314,952 |
|
|
$ |
279,000 |
|
|
$ |
230,955 |
|
|
Ending fair value
|
|
$ |
7,496 |
|
|
$ |
7,912 |
|
|
$ |
7,610 |
|
|
$ |
8,876 |
|
|
$ |
9,200 |
|
|
$ |
16,833 |
|
|
$ |
15,669 |
|
| |
|
|
|
|
|
|
|
|
|
|
|
|
|
|
|
|
|
|
|
|
|
|
|
|
|
|
|
|
|
|
|
|
|
|
|
|
|
|
|
|
|
|
|
|
|
|
|
|
|
|
|
|
|
|
|
|
|
|
|
Re-REMIC
|
|
|
|
|
|
|
|
|
|
|
|
|
|
|
|
|
|
|
|
|
|
|
|
|
|
|
|
|
|
Commercial Real Estate Loans
|
|
|
|
|
|
|
|
|
|
|
|
|
|
|
|
|
|
|
|
|
|
|
|
|
|
|
|
|
|
Beginning fair value
|
|
$ |
74,891 |
|
|
$ |
69,070 |
|
|
$ |
66,913 |
|
|
$ |
105,951 |
|
|
$ |
93,507 |
|
|
$ |
55,141 |
|
|
$ |
- |
|
|
Beginning fair value
|
|
$ |
242 |
|
|
$ |
243 |
|
|
$ |
244 |
|
|
$ |
245 |
|
|
$ |
246 |
|
|
$ |
247 |
|
|
$ |
248 |
|
|
Acquisitions
|
|
|
- |
|
|
|
- |
|
|
|
- |
|
|
|
- |
|
|
|
3,367 |
|
|
|
25,073 |
|
|
|
55,562 |
|
|
Originations
|
|
|
30,275 |
|
|
|
- |
|
|
|
- |
|
|
|
- |
|
|
|
- |
|
|
|
- |
|
|
|
- |
|
|
Sales
|
|
|
- |
|
|
|
- |
|
|
|
(1,960 |
) |
|
|
(27,932 |
) |
|
|
(17,368 |
) |
|
|
- |
|
|
|
- |
|
|
Principal payments
|
|
|
(2 |
) |
|
|
(2 |
) |
|
|
(2 |
) |
|
|
(2 |
) |
|
|
(2 |
) |
|
|
(2 |
) |
|
|
(2 |
) |
|
Effect of principal payments
|
|
|
- |
|
|
|
- |
|
|
|
- |
|
|
|
- |
|
|
|
- |
|
|
|
- |
|
|
|
- |
|
|
Discount/fee amortization
|
|
|
22 |
|
|
|
1 |
|
|
|
1 |
|
|
|
1 |
|
|
|
1 |
|
|
|
1 |
|
|
|
1 |
|
|
Change in fair value, net
|
|
|
10,186 |
|
|
|
5,821 |
|
|
|
4,117 |
|
|
|
(11,106 |
) |
|
|
26,445 |
|
|
|
13,293 |
|
|
|
(421 |
) |
|
Changes in fair value, net
|
|
|
- |
|
|
|
- |
|
|
|
- |
|
|
|
- |
|
|
|
- |
|
|
|
- |
|
|
|
- |
|
|
Ending fair value
|
|
$ |
85,077 |
|
|
$ |
74,891 |
|
|
$ |
69,070 |
|
|
$ |
66,913 |
|
|
$ |
105,951 |
|
|
$ |
93,507 |
|
|
$ |
55,141 |
|
|
Ending fair value
|
|
$ |
30,537 |
|
|
$ |
242 |
|
|
$ |
243 |
|
|
$ |
244 |
|
|
$ |
245 |
|
|
$ |
246 |
|
|
$ |
247 |
|
| |
|
|
|
|
|
|
|
|
|
|
|
|
|
|
|
|
|
|
|
|
|
|
|
|
|
|
|
|
|
|
|
|
|
|
|
|
|
|
|
|
|
|
|
|
|
|
|
|
|
|
|
|
|
|
|
|
|
|
|
Residential Prime Subordinate
|
|
|
|
|
|
|
|
|
|
|
|
|
|
|
|
|
|
|
|
|
|
|
|
|
|
|
|
|
|
CDO Subordinate
|
|
|
|
|
|
|
|
|
|
|
|
|
|
|
|
|
|
|
|
|
|
|
|
|
|
|
|
|
|
Beginning fair value
|
|
$ |
33,384 |
|
|
$ |
16,406 |
|
|
$ |
16,596 |
|
|
$ |
19,510 |
|
|
$ |
21,926 |
|
|
$ |
26,742 |
|
|
$ |
29,012 |
|
|
Beginning fair value
|
|
$ |
960 |
|
|
$ |
1,132 |
|
|
$ |
1,222 |
|
|
$ |
1,247 |
|
|
$ |
2,137 |
|
|
$ |
2,308 |
|
|
$ |
2,657 |
|
|
Acquisitions
|
|
|
15,283 |
|
|
|
7,088 |
|
|
|
2,223 |
|
|
|
- |
|
|
|
- |
|
|
|
1,390 |
|
|
|
1,829 |
|
|
Acquisitions
|
|
|
- |
|
|
|
- |
|
|
|
- |
|
|
|
- |
|
|
|
- |
|
|
|
- |
|
|
|
- |
|
|
Sales
|
|
|
- |
|
|
|
- |
|
|
|
- |
|
|
|
- |
|
|
|
- |
|
|
|
(1,409 |
) |
|
|
- |
|
|
Sales
|
|
|
- |
|
|
|
- |
|
|
|
- |
|
|
|
- |
|
|
|
- |
|
|
|
- |
|
|
|
- |
|
|
Effect of principal payments
|
|
|
(692 |
) |
|
|
883 |
|
|
|
(474 |
) |
|
|
(415 |
) |
|
|
(526 |
) |
|
|
(880 |
) |
|
|
(1,050 |
) |
|
Effect of principal payments
|
|
|
- |
|
|
|
- |
|
|
|
- |
|
|
|
- |
|
|
|
- |
|
|
|
- |
|
|
|
- |
|
|
Change in fair value, net
|
|
|
6,257 |
|
|
|
9,007 |
|
|
|
(1,939 |
) |
|
|
(2,499 |
) |
|
|
(1,890 |
) |
|
|
(3,917 |
) |
|
|
(3,049 |
) |
|
Change in fair value, net
|
|
|
78 |
|
|
|
(172 |
) |
|
|
(90 |
) |
|
|
(25 |
) |
|
|
(890 |
) |
|
|
(171 |
) |
|
|
(349 |
) |
|
Ending fair value
|
|
$ |
54,232 |
|
|
$ |
33,384 |
|
|
$ |
16,406 |
|
|
$ |
16,596 |
|
|
$ |
19,510 |
|
|
$ |
21,926 |
|
|
$ |
26,742 |
|
|
Ending fair value
|
|
$ |
1,038 |
|
|
$ |
960 |
|
|
$ |
1,132 |
|
|
$ |
1,222 |
|
|
$ |
1,247 |
|
|
$ |
2,137 |
|
|
$ |
2,308 |
|
| |
|
|
|
|
|
|
|
|
|
|
|
|
|
|
|
|
|
|
|
|
|
|
|
|
|
|
|
|
|
|
|
|
|
|
|
|
|
|
|
|
|
|
|
|
|
|
|
|
|
|
|
|
|
|
|
|
|
|
|
Residential Non-Prime Subordinate
|
|
|
|
|
|
|
|
|
|
|
|
|
|
|
|
|
|
|
|
|
|
|
|
|
|
|
|
|
|
|
|
|
|
|
|
|
|
|
|
|
|
|
|
|
|
|
|
|
|
|
|
|
|
|
|
|
|
|
|
Beginning fair value
|
|
$ |
10,041 |
|
|
$ |
10,030 |
|
|
$ |
6,544 |
|
|
$ |
1,295 |
|
|
$ |
1,205 |
|
|
$ |
3,192 |
|
|
$ |
4,537 |
|
|
|
|
|
|
|
|
|
|
|
|
|
|
|
|
|
|
|
|
|
|
|
|
|
|
|
|
|
|
|
|
Acquisitions
|
|
|
3,820 |
|
|
|
- |
|
|
|
3,894 |
|
|
|
5,472 |
|
|
|
- |
|
|
|
- |
|
|
|
- |
|
|
|
|
|
|
|
|
|
|
|
|
|
|
|
|
|
|
|
|
|
|
|
|
|
|
|
|
|
|
|
|
Sales
|
|
|
- |
|
|
|
- |
|
|
|
- |
|
|
|
- |
|
|
|
- |
|
|
|
- |
|
|
|
- |
|
|
|
|
|
|
|
|
|
|
|
|
|
|
|
|
|
|
|
|
|
|
|
|
|
|
|
|
|
|
|
|
Effect of principal payments
|
|
|
(542 |
) |
|
|
(320 |
) |
|
|
(352 |
) |
|
|
(111 |
) |
|
|
(25 |
) |
|
|
(38 |
) |
|
|
(67 |
) |
|
|
|
|
|
|
|
|
|
|
|
|
|
|
|
|
|
|
|
|
|
|
|
|
|
|
|
|
|
|
|
Change in fair value, net
|
|
|
57 |
|
|
|
331 |
|
|
|
(56 |
) |
|
|
(112 |
) |
|
|
115 |
|
|
|
(1,949 |
) |
|
|
(1,278 |
) |
|
|
|
|
|
|
|
|
|
|
|
|
|
|
|
|
|
|
|
|
|
|
|
|
|
|
|
|
|
|
|
Ending fair value
|
|
$ |
13,376 |
|
|
$ |
10,041 |
|
|
$ |
10,030 |
|
|
$ |
6,544 |
|
|
$ |
1,295 |
|
|
$ |
1,205 |
|
|
$ |
3,192 |
|
|
|
|
|
|
|
|
|
|
|
|
|
|
|
|
|
|
|
|
|
|
|
|
|
|
|
|
|
|
|
| THE REDWOOD REVIEW 4TH QUARTER 2010 |
Table 7: Securities Portfolio Activity at Redwood
|
|
| |
|
2010
|
|
|
2010
|
|
|
2010
|
|
|
2010
|
|
|
2009
|
|
|
2009
|
|
|
2009
|
|
| |
|
Q4
|
|
|
Q3
|
|
|
Q2
|
|
|
Q1
|
|
|
Q4
|
|
|
Q3
|
|
|
Q2
|
|
| |
|
|
|
|
|
|
|
|
|
|
|
|
|
|
|
|
|
|
|
|
|
|
|
|
|
|
|
|
|
Senior AFS
|
|
$ |
315,891 |
|
|
$ |
315,934 |
|
|
$ |
309,702 |
|
|
$ |
372,140 |
|
|
$ |
329,208 |
|
|
$ |
336,659 |
|
|
$ |
183,466 |
|
|
Subordinate AFS
|
|
|
53,846 |
|
|
|
33,024 |
|
|
|
16,024 |
|
|
|
16,250 |
|
|
|
19,191 |
|
|
|
21,449 |
|
|
|
26,142 |
|
|
Fair value
|
|
|
386 |
|
|
|
360 |
|
|
|
382 |
|
|
|
346 |
|
|
|
319 |
|
|
|
477 |
|
|
|
600 |
|
|
Total Residential Prime Securities
|
|
$ |
370,123 |
|
|
$ |
349,318 |
|
|
$ |
326,108 |
|
|
$ |
388,736 |
|
|
$ |
348,718 |
|
|
$ |
358,585 |
|
|
$ |
210,208 |
|
| |
|
|
|
|
|
|
|
|
|
|
|
|
|
|
|
|
|
|
|
|
|
|
|
|
|
|
|
|
|
Number of loans
|
|
|
121,173 |
|
|
|
124,536 |
|
|
|
140,951 |
|
|
|
156,375 |
|
|
|
168,449 |
|
|
|
184,849 |
|
|
|
201,789 |
|
|
Total loan face
|
|
$ |
49,071,513 |
|
|
$ |
52,490,472 |
|
|
$ |
59,814,476 |
|
|
$ |
71,413,439 |
|
|
$ |
76,332,218 |
|
|
$ |
84,519,707 |
|
|
$ |
92,121,182 |
|
|
Average loan size
|
|
$ |
405 |
|
|
$ |
421 |
|
|
$ |
424 |
|
|
$ |
457 |
|
|
$ |
453 |
|
|
$ |
457 |
|
|
$ |
457 |
|
| |
|
|
|
|
|
|
|
|
|
|
|
|
|
|
|
|
|
|
|
|
|
|
|
|
|
|
|
|
|
Year 2008 origination
|
|
|
0 |
% |
|
|
0 |
% |
|
|
0 |
% |
|
|
0 |
% |
|
|
1 |
% |
|
|
0 |
% |
|
|
0 |
% |
|
Year 2007 origination
|
|
|
9 |
% |
|
|
11 |
% |
|
|
7 |
% |
|
|
10 |
% |
|
|
10 |
% |
|
|
9 |
% |
|
|
9 |
% |
|
Year 2006 origination
|
|
|
11 |
% |
|
|
11 |
% |
|
|
14 |
% |
|
|
12 |
% |
|
|
12 |
% |
|
|
12 |
% |
|
|
12 |
% |
|
Year 2005 origination
|
|
|
17 |
% |
|
|
16 |
% |
|
|
20 |
% |
|
|
21 |
% |
|
|
19 |
% |
|
|
20 |
% |
|
|
19 |
% |
|
Year 2004 origination and earlier
|
|
|
63 |
% |
|
|
62 |
% |
|
|
59 |
% |
|
|
57 |
% |
|
|
58 |
% |
|
|
59 |
% |
|
|
60 |
% |
| |
|
|
|
|
|
|
|
|
|
|
|
|
|
|
|
|
|
|
|
|
|
|
|
|
|
|
|
|
|
Geographic concentration
|
|
|
|
|
|
|
|
|
|
|
|
|
|
|
|
|
|
|
|
|
|
|
|
|
|
|
|
|
|
Southern CA
|
|
|
24 |
% |
|
|
25 |
% |
|
|
25 |
% |
|
|
25 |
% |
|
|
25 |
% |
|
|
27 |
% |
|
|
24 |
% |
|
Northern CA
|
|
|
22 |
% |
|
|
22 |
% |
|
|
22 |
% |
|
|
22 |
% |
|
|
22 |
% |
|
|
20 |
% |
|
|
23 |
% |
|
New York
|
|
|
7 |
% |
|
|
7 |
% |
|
|
6 |
% |
|
|
7 |
% |
|
|
7 |
% |
|
|
6 |
% |
|
|
7 |
% |
|
Florida
|
|
|
6 |
% |
|
|
6 |
% |
|
|
6 |
% |
|
|
6 |
% |
|
|
6 |
% |
|
|
7 |
% |
|
|
5 |
% |
|
Virginia
|
|
|
4 |
% |
|
|
4 |
% |
|
|
4 |
% |
|
|
4 |
% |
|
|
4 |
% |
|
|
2 |
% |
|
|
4 |
% |
|
New Jersey
|
|
|
3 |
% |
|
|
3 |
% |
|
|
3 |
% |
|
|
3 |
% |
|
|
3 |
% |
|
|
3 |
% |
|
|
3 |
% |
|
Illinois
|
|
|
3 |
% |
|
|
3 |
% |
|
|
3 |
% |
|
|
3 |
% |
|
|
3 |
% |
|
|
2 |
% |
|
|
3 |
% |
|
Other states
|
|
|
31 |
% |
|
|
30 |
% |
|
|
31 |
% |
|
|
30 |
% |
|
|
30 |
% |
|
|
33 |
% |
|
|
31 |
% |
| |
|
|
|
|
|
|
|
|
|
|
|
|
|
|
|
|
|
|
|
|
|
|
|
|
|
|
|
|
|
Wtd Avg Original LTV
|
|
|
68 |
% |
|
|
68 |
% |
|
|
68 |
% |
|
|
68 |
% |
|
|
68 |
% |
|
|
68 |
% |
|
|
68 |
% |
|
Original LTV: 0 - 50
|
|
|
13 |
% |
|
|
13 |
% |
|
|
13 |
% |
|
|
13 |
% |
|
|
13 |
% |
|
|
13 |
% |
|
|
13 |
% |
|
Original LTV: 50.01 - 60
|
|
|
12 |
% |
|
|
11 |
% |
|
|
12 |
% |
|
|
11 |
% |
|
|
11 |
% |
|
|
12 |
% |
|
|
12 |
% |
|
Original LTV: 60.01 - 70
|
|
|
22 |
% |
|
|
22 |
% |
|
|
22 |
% |
|
|
22 |
% |
|
|
22 |
% |
|
|
22 |
% |
|
|
22 |
% |
|
Original LTV: 70.01 - 80
|
|
|
49 |
% |
|
|
49 |
% |
|
|
50 |
% |
|
|
51 |
% |
|
|
50 |
% |
|
|
50 |
% |
|
|
49 |
% |
|
Original LTV: 80.01 - 90
|
|
|
3 |
% |
|
|
3 |
% |
|
|
2 |
% |
|
|
2 |
% |
|
|
2 |
% |
|
|
2 |
% |
|
|
2 |
% |
|
Original LTV: 90.01 - 100
|
|
|
1 |
% |
|
|
2 |
% |
|
|
1 |
% |
|
|
1 |
% |
|
|
1 |
% |
|
|
1 |
% |
|
|
1 |
% |
|
Unknown
|
|
|
0 |
% |
|
|
0 |
% |
|
|
0 |
% |
|
|
0 |
% |
|
|
1 |
% |
|
|
0 |
% |
|
|
1 |
% |
| |
|
|
|
|
|
|
|
|
|
|
|
|
|
|
|
|
|
|
|
|
|
|
|
|
|
|
|
|
|
Wtd Avg FICO
|
|
|
737 |
|
|
|
738 |
|
|
|
739 |
|
|
|
740 |
|
|
|
740 |
|
|
|
740 |
|
|
|
741 |
|
|
FICO: <= 680
|
|
|
10 |
% |
|
|
8 |
% |
|
|
9 |
% |
|
|
8 |
% |
|
|
8 |
% |
|
|
8 |
% |
|
|
8 |
% |
|
FICO: 681 - 700
|
|
|
10 |
% |
|
|
10 |
% |
|
|
9 |
% |
|
|
9 |
% |
|
|
9 |
% |
|
|
9 |
% |
|
|
9 |
% |
|
FICO: 701 - 720
|
|
|
14 |
% |
|
|
14 |
% |
|
|
14 |
% |
|
|
14 |
% |
|
|
14 |
% |
|
|
14 |
% |
|
|
13 |
% |
|
FICO: 721 - 740
|
|
|
14 |
% |
|
|
15 |
% |
|
|
15 |
% |
|
|
14 |
% |
|
|
14 |
% |
|
|
14 |
% |
|
|
14 |
% |
|
FICO: 741 - 760
|
|
|
16 |
% |
|
|
16 |
% |
|
|
16 |
% |
|
|
16 |
% |
|
|
16 |
% |
|
|
16 |
% |
|
|
16 |
% |
|
FICO: 761 - 780
|
|
|
18 |
% |
|
|
19 |
% |
|
|
19 |
% |
|
|
19 |
% |
|
|
19 |
% |
|
|
19 |
% |
|
|
19 |
% |
|
FICO: 781 - 800
|
|
|
13 |
% |
|
|
13 |
% |
|
|
13 |
% |
|
|
14 |
% |
|
|
14 |
% |
|
|
14 |
% |
|
|
15 |
% |
|
FICO: >= 801
|
|
|
3 |
% |
|
|
3 |
% |
|
|
3 |
% |
|
|
4 |
% |
|
|
4 |
% |
|
|
4 |
% |
|
|
4 |
% |
|
Unknown
|
|
|
2 |
% |
|
|
2 |
% |
|
|
3 |
% |
|
|
2 |
% |
|
|
2 |
% |
|
|
2 |
% |
|
|
2 |
% |
| |
|
|
|
|
|
|
|
|
|
|
|
|
|
|
|
|
|
|
|
|
|
|
|
|
|
|
|
|
|
Conforming balance % (2)
|
|
|
59 |
% |
|
|
58 |
% |
|
|
58 |
% |
|
|
57 |
% |
|
|
58 |
% |
|
|
59 |
% |
|
|
59 |
% |
|
> $1 MM %
|
|
|
9 |
% |
|
|
9 |
% |
|
|
9 |
% |
|
|
9 |
% |
|
|
9 |
% |
|
|
8 |
% |
|
|
8 |
% |
| |
|
|
|
|
|
|
|
|
|
|
|
|
|
|
|
|
|
|
|
|
|
|
|
|
|
|
|
|
|
2nd Home %
|
|
|
7 |
% |
|
|
7 |
% |
|
|
7 |
% |
|
|
7 |
% |
|
|
7 |
% |
|
|
7 |
% |
|
|
7 |
% |
|
Investment Home %
|
|
|
2 |
% |
|
|
2 |
% |
|
|
2 |
% |
|
|
2 |
% |
|
|
2 |
% |
|
|
2 |
% |
|
|
2 |
% |
| |
|
|
|
|
|
|
|
|
|
|
|
|
|
|
|
|
|
|
|
|
|
|
|
|
|
|
|
|
|
Purchase
|
|
|
42 |
% |
|
|
43 |
% |
|
|
43 |
% |
|
|
45 |
% |
|
|
44 |
% |
|
|
44 |
% |
|
|
44 |
% |
|
Cash Out Refi
|
|
|
23 |
% |
|
|
22 |
% |
|
|
22 |
% |
|
|
22 |
% |
|
|
22 |
% |
|
|
22 |
% |
|
|
21 |
% |
|
Rate-Term Refi
|
|
|
34 |
% |
|
|
34 |
% |
|
|
34 |
% |
|
|
33 |
% |
|
|
33 |
% |
|
|
33 |
% |
|
|
34 |
% |
|
Other
|
|
|
1 |
% |
|
|
1 |
% |
|
|
1 |
% |
|
|
0 |
% |
|
|
1 |
% |
|
|
1 |
% |
|
|
1 |
% |
| |
|
|
|
|
|
|
|
|
|
|
|
|
|
|
|
|
|
|
|
|
|
|
|
|
|
|
|
|
|
Full Doc
|
|
|
50 |
% |
|
|
50 |
% |
|
|
55 |
% |
|
|
55 |
% |
|
|
55 |
% |
|
|
55 |
% |
|
|
56 |
% |
|
No Doc
|
|
|
6 |
% |
|
|
5 |
% |
|
|
5 |
% |
|
|
5 |
% |
|
|
5 |
% |
|
|
5 |
% |
|
|
4 |
% |
|
Other Doc (Lim, Red, Stated, etc)
|
|
|
41 |
% |
|
|
42 |
% |
|
|
38 |
% |
|
|
37 |
% |
|
|
37 |
% |
|
|
37 |
% |
|
|
37 |
% |
|
Unknown/Not Categorized
|
|
|
3 |
% |
|
|
3 |
% |
|
|
2 |
% |
|
|
3 |
% |
|
|
3 |
% |
|
|
3 |
% |
|
|
3 |
% |
| |
|
|
|
|
|
|
|
|
|
|
|
|
|
|
|
|
|
|
|
|
|
|
|
|
|
|
|
|
|
2-4 Family
|
|
|
2 |
% |
|
|
1 |
% |
|
|
1 |
% |
|
|
2 |
% |
|
|
2 |
% |
|
|
1 |
% |
|
|
1 |
% |
|
Condo
|
|
|
10 |
% |
|
|
10 |
% |
|
|
10 |
% |
|
|
10 |
% |
|
|
10 |
% |
|
|
10 |
% |
|
|
10 |
% |
|
Single Family
|
|
|
87 |
% |
|
|
88 |
% |
|
|
87 |
% |
|
|
87 |
% |
|
|
87 |
% |
|
|
88 |
% |
|
|
88 |
% |
|
Other
|
|
|
1 |
% |
|
|
1 |
% |
|
|
1 |
% |
|
|
1 |
% |
|
|
1 |
% |
|
|
1 |
% |
|
|
1 |
% |
| |
|
|
|
|
|
|
|
|
|
|
|
|
|
|
|
|
|
|
|
|
|
|
|
|
|
|
|
|
(1) Only the loan groups providing direct cash flow to securities we own are included.
(2) The definition of a conforming loan has significantly changed over time. For all periods shown in this table, the conforming balance definition available in December 2010 was used (which had a maximum loan balance of $729,750).
| THE REDWOOD REVIEW 4TH QUARTER 2010 |
Table 8A: Residential Prime Securities at Redwood and Underlying Loan Characteristics
|
59 |
| |
|
2010
|
|
|
2010
|
|
|
2010
|
|
|
2010
|
|
|
2009
|
|
|
2009
|
|
|
2009
|
|
| |
|
Q4
|
|
|
Q3 |
|
|
Q2 |
|
|
Q1 |
|
|
Q4 |
|
|
Q3 |
|
|
Q2
|
|
| |
|
|
|
|
|
|
|
|
|
|
|
|
|
|
|
|
|
|
|
|
|
|
|
|
|
|
|
|
|
Senior AFS
|
|
$ |
326,365 |
|
|
$ |
332,829 |
|
|
$ |
303,635 |
|
|
$ |
349,141 |
|
|
$ |
308,869 |
|
|
$ |
276,499 |
|
|
$ |
230,259 |
|
|
Subordinate AFS
|
|
|
13,188 |
|
|
|
9,812 |
|
|
|
9,842 |
|
|
|
6,353 |
|
|
|
1,077 |
|
|
|
981 |
|
|
|
2,961 |
|
|
Fair value
|
|
|
19,930 |
|
|
|
21,506 |
|
|
|
16,950 |
|
|
|
18,422 |
|
|
|
6,301 |
|
|
|
2,725 |
|
|
|
927 |
|
|
Total Residential Non-prime Securities
|
|
$ |
359,483 |
|
|
$ |
364,147 |
|
|
$ |
330,427 |
|
|
$ |
373,916 |
|
|
$ |
316,247 |
|
|
$ |
280,205 |
|
|
$ |
234,147 |
|
| |
|
|
|
|
|
|
|
|
|
|
|
|
|
|
|
|
|
|
|
|
|
|
|
|
|
|
|
|
|
Number of loans
|
|
|
65,949 |
|
|
|
67,713 |
|
|
|
72,621 |
|
|
|
79,448 |
|
|
|
73,102 |
|
|
|
73,970 |
|
|
|
71,041 |
|
|
Total loan face
|
|
$ |
14,615,940 |
|
|
$ |
15,181,465 |
|
|
$ |
16,931,963 |
|
|
$ |
19,644,742 |
|
|
$ |
20,445,051 |
|
|
$ |
21,588,255 |
|
|
$ |
22,498,418 |
|
|
Average loan size
|
|
$ |
222 |
|
|
$ |
224 |
|
|
$ |
233 |
|
|
$ |
247 |
|
|
$ |
280 |
|
|
$ |
292 |
|
|
$ |
317 |
|
| |
|
|
|
|
|
|
|
|
|
|
|
|
|
|
|
|
|
|
|
|
|
|
|
|
|
|
|
|
|
Year 2008 origination
|
|
|
0 |
% |
|
|
0 |
% |
|
|
0 |
% |
|
|
0 |
% |
|
|
0 |
% |
|
|
0 |
% |
|
|
0 |
% |
|
Year 2007 origination
|
|
|
0 |
% |
|
|
0 |
% |
|
|
7 |
% |
|
|
10 |
% |
|
|
11 |
% |
|
|
22 |
% |
|
|
23 |
% |
|
Year 2006 origination
|
|
|
18 |
% |
|
|
18 |
% |
|
|
18 |
% |
|
|
9 |
% |
|
|
5 |
% |
|
|
8 |
% |
|
|
8 |
% |
|
Year 2005 origination
|
|
|
49 |
% |
|
|
49 |
% |
|
|
45 |
% |
|
|
50 |
% |
|
|
47 |
% |
|
|
36 |
% |
|
|
34 |
% |
|
Year 2004 origination and earlier
|
|
|
33 |
% |
|
|
33 |
% |
|
|
30 |
% |
|
|
31 |
% |
|
|
37 |
% |
|
|
34 |
% |
|
|
35 |
% |
| |
|
|
|
|
|
|
|
|
|
|
|
|
|
|
|
|
|
|
|
|
|
|
|
|
|
|
|
|
|
Geographic concentration
|
|
|
|
|
|
|
|
|
|
|
|
|
|
|
|
|
|
|
|
|
|
|
|
|
|
|
|
|
|
Southern CA
|
|
|
20 |
% |
|
|
21 |
% |
|
|
22 |
% |
|
|
23 |
% |
|
|
25 |
% |
|
|
26 |
% |
|
|
25 |
% |
|
Northern CA
|
|
|
14 |
% |
|
|
14 |
% |
|
|
14 |
% |
|
|
17 |
% |
|
|
18 |
% |
|
|
16 |
% |
|
|
18 |
% |
|
New York
|
|
|
9 |
% |
|
|
9 |
% |
|
|
9 |
% |
|
|
8 |
% |
|
|
8 |
% |
|
|
9 |
% |
|
|
9 |
% |
|
Florida
|
|
|
5 |
% |
|
|
5 |
% |
|
|
5 |
% |
|
|
5 |
% |
|
|
5 |
% |
|
|
5 |
% |
|
|
5 |
% |
|
Virginia
|
|
|
4 |
% |
|
|
4 |
% |
|
|
4 |
% |
|
|
3 |
% |
|
|
3 |
% |
|
|
4 |
% |
|
|
3 |
% |
|
New Jersey
|
|
|
3 |
% |
|
|
3 |
% |
|
|
4 |
% |
|
|
3 |
% |
|
|
4 |
% |
|
|
2 |
% |
|
|
4 |
% |
|
Illinois
|
|
|
3 |
% |
|
|
3 |
% |
|
|
3 |
% |
|
|
3 |
% |
|
|
3 |
% |
|
|
2 |
% |
|
|
3 |
% |
|
Other states
|
|
|
42 |
% |
|
|
41 |
% |
|
|
40 |
% |
|
|
38 |
% |
|
|
34 |
% |
|
|
36 |
% |
|
|
33 |
% |
| |
|
|
|
|
|
|
|
|
|
|
|
|
|
|
|
|
|
|
|
|
|
|
|
|
|
|
|
|
|
Wtd Avg Original LTV
|
|
|
73 |
% |
|
|
73 |
% |
|
|
73 |
% |
|
|
73 |
% |
|
|
73 |
% |
|
|
74 |
% |
|
|
74 |
% |
|
Original LTV: 0 - 50
|
|
|
7 |
% |
|
|
7 |
% |
|
|
7 |
% |
|
|
6 |
% |
|
|
5 |
% |
|
|
5 |
% |
|
|
5 |
% |
|
Original LTV: 50.01 - 60
|
|
|
8 |
% |
|
|
8 |
% |
|
|
8 |
% |
|
|
8 |
% |
|
|
8 |
% |
|
|
7 |
% |
|
|
7 |
% |
|
Original LTV: 60.01 - 70
|
|
|
18 |
% |
|
|
18 |
% |
|
|
18 |
% |
|
|
18 |
% |
|
|
19 |
% |
|
|
17 |
% |
|
|
17 |
% |
|
Original LTV: 70.01 - 80
|
|
|
58 |
% |
|
|
58 |
% |
|
|
58 |
% |
|
|
58 |
% |
|
|
59 |
% |
|
|
59 |
% |
|
|
59 |
% |
|
Original LTV: 80.01 - 90
|
|
|
6 |
% |
|
|
6 |
% |
|
|
6 |
% |
|
|
7 |
% |
|
|
6 |
% |
|
|
8 |
% |
|
|
8 |
% |
|
Original LTV: 90.01 - 100
|
|
|
3 |
% |
|
|
3 |
% |
|
|
3 |
% |
|
|
3 |
% |
|
|
3 |
% |
|
|
4 |
% |
|
|
4 |
% |
|
Unknown
|
|
|
0 |
% |
|
|
0 |
% |
|
|
0 |
% |
|
|
0 |
% |
|
|
0 |
% |
|
|
0 |
% |
|
|
0 |
% |
| |
|
|
|
|
|
|
|
|
|
|
|
|
|
|
|
|
|
|
|
|
|
|
|
|
|
|
|
|
|
Wtd Avg FICO
|
|
|
711 |
|
|
|
711 |
|
|
|
711 |
|
|
|
712 |
|
|
|
712 |
|
|
|
707 |
|
|
|
705 |
|
|
FICO: <= 680
|
|
|
28 |
% |
|
|
27 |
% |
|
|
27 |
% |
|
|
26 |
% |
|
|
26 |
% |
|
|
30 |
% |
|
|
30 |
% |
|
FICO: 681 - 700
|
|
|
14 |
% |
|
|
14 |
% |
|
|
14 |
% |
|
|
14 |
% |
|
|
15 |
% |
|
|
15 |
% |
|
|
16 |
% |
|
FICO: 701 - 720
|
|
|
14 |
% |
|
|
14 |
% |
|
|
14 |
% |
|
|
15 |
% |
|
|
15 |
% |
|
|
14 |
% |
|
|
14 |
% |
|
FICO: 721 - 740
|
|
|
12 |
% |
|
|
12 |
% |
|
|
12 |
% |
|
|
13 |
% |
|
|
13 |
% |
|
|
12 |
% |
|
|
12 |
% |
|
FICO: 741 - 760
|
|
|
11 |
% |
|
|
12 |
% |
|
|
11 |
% |
|
|
12 |
% |
|
|
11 |
% |
|
|
11 |
% |
|
|
11 |
% |
|
FICO: 761 - 780
|
|
|
10 |
% |
|
|
10 |
% |
|
|
10 |
% |
|
|
10 |
% |
|
|
10 |
% |
|
|
9 |
% |
|
|
9 |
% |
|
FICO: 781 - 800
|
|
|
7 |
% |
|
|
7 |
% |
|
|
7 |
% |
|
|
7 |
% |
|
|
7 |
% |
|
|
6 |
% |
|
|
5 |
% |
|
FICO: >= 801
|
|
|
2 |
% |
|
|
2 |
% |
|
|
2 |
% |
|
|
2 |
% |
|
|
2 |
% |
|
|
2 |
% |
|
|
2 |
% |
|
Unknown
|
|
|
2 |
% |
|
|
2 |
% |
|
|
2 |
% |
|
|
1 |
% |
|
|
1 |
% |
|
|
1 |
% |
|
|
1 |
% |
| |
|
|
|
|
|
|
|
|
|
|
|
|
|
|
|
|
|
|
|
|
|
|
|
|
|
|
|
|
|
Conforming balance % (2)
|
|
|
86 |
% |
|
|
86 |
% |
|
|
85 |
% |
|
|
81 |
% |
|
|
76 |
% |
|
|
74 |
% |
|
|
71 |
% |
|
> $1 MM %
|
|
|
3 |
% |
|
|
3 |
% |
|
|
4 |
% |
|
|
6 |
% |
|
|
9 |
% |
|
|
9 |
% |
|
|
10 |
% |
| |
|
|
|
|
|
|
|
|
|
|
|
|
|
|
|
|
|
|
|
|
|
|
|
|
|
|
|
|
|
2nd Home %
|
|
|
4 |
% |
|
|
4 |
% |
|
|
4 |
% |
|
|
5 |
% |
|
|
5 |
% |
|
|
5 |
% |
|
|
5 |
% |
|
Investment Home %
|
|
|
13 |
% |
|
|
13 |
% |
|
|
13 |
% |
|
|
11 |
% |
|
|
9 |
% |
|
|
8 |
% |
|
|
8 |
% |
| |
|
|
|
|
|
|
|
|
|
|
|
|
|
|
|
|
|
|
|
|
|
|
|
|
|
|
|
|
|
Purchase
|
|
|
42 |
% |
|
|
42 |
% |
|
|
40 |
% |
|
|
39 |
% |
|
|
40 |
% |
|
|
40 |
% |
|
|
41 |
% |
|
Cash Out Refi
|
|
|
41 |
% |
|
|
41 |
% |
|
|
41 |
% |
|
|
42 |
% |
|
|
42 |
% |
|
|
42 |
% |
|
|
42 |
% |
|
Rate-Term Refi
|
|
|
16 |
% |
|
|
16 |
% |
|
|
18 |
% |
|
|
18 |
% |
|
|
17 |
% |
|
|
17 |
% |
|
|
16 |
% |
|
Other
|
|
|
1 |
% |
|
|
1 |
% |
|
|
1 |
% |
|
|
1 |
% |
|
|
1 |
% |
|
|
1 |
% |
|
|
1 |
% |
| |
|
|
|
|
|
|
|
|
|
|
|
|
|
|
|
|
|
|
|
|
|
|
|
|
|
|
|
|
|
Full Doc
|
|
|
38 |
% |
|
|
38 |
% |
|
|
36 |
% |
|
|
37 |
% |
|
|
34 |
% |
|
|
34 |
% |
|
|
32 |
% |
|
No Doc
|
|
|
3 |
% |
|
|
3 |
% |
|
|
3 |
% |
|
|
3 |
% |
|
|
2 |
% |
|
|
2 |
% |
|
|
2 |
% |
|
Other Doc (Lim, Red, Stated, etc)
|
|
|
57 |
% |
|
|
57 |
% |
|
|
59 |
% |
|
|
59 |
% |
|
|
62 |
% |
|
|
62 |
% |
|
|
64 |
% |
|
Unknown/Not Categorized
|
|
|
2 |
% |
|
|
2 |
% |
|
|
2 |
% |
|
|
1 |
% |
|
|
2 |
% |
|
|
2 |
% |
|
|
2 |
% |
| |
|
|
|
|
|
|
|
|
|
|
|
|
|
|
|
|
|
|
|
|
|
|
|
|
|
|
|
|
|
2-4 Family
|
|
|
8 |
% |
|
|
8 |
% |
|
|
8 |
% |
|
|
6 |
% |
|
|
5 |
% |
|
|
5 |
% |
|
|
5 |
% |
|
Condo
|
|
|
8 |
% |
|
|
8 |
% |
|
|
8 |
% |
|
|
8 |
% |
|
|
9 |
% |
|
|
9 |
% |
|
|
9 |
% |
|
Single Family
|
|
|
84 |
% |
|
|
84 |
% |
|
|
84 |
% |
|
|
86 |
% |
|
|
86 |
% |
|
|
86 |
% |
|
|
86 |
% |
|
Other
|
|
|
0 |
% |
|
|
0 |
% |
|
|
0 |
% |
|
|
0 |
% |
|
|
0 |
% |
|
|
0 |
% |
|
|
0 |
% |
| |
|
|
|
|
|
|
|
|
|
|
|
|
|
|
|
|
|
|
|
|
|
|
|
|
|
|
|
|
(1) Only the loan groups providing direct cash flow to securities we own are included.
(2) The definition of a conforming loan has significantly changed over time. For all periods shown in this table, the conforming balance definition available in December 2010 was used (which had a maximum loan balance of $729,750).
| THE REDWOOD REVIEW 4TH QUARTER 2010 |
Table 8B: Residential Non-Prime Securities at Redwood and Underlying Loan Characteristics
|
|
| |
|
2010
|
|
|
2010
|
|
|
2010
|
|
|
2010
|
|
|
2009
|
|
|
2009
|
|
|
2009
|
|
|
2009
|
|
|
2008
|
|
| |
|
Q4
|
|
|
Q3
|
|
|
Q2
|
|
|
Q1
|
|
|
Q4
|
|
|
Q3
|
|
|
Q2
|
|
|
Q1
|
|
|
Q4
|
|
| |
|
|
|
|
|
|
|
|
|
|
|
|
|
|
|
|
|
|
|
|
|
|
|
|
|
|
|
|
Residential loans
|
|
$ |
3,818,659 |
|
|
$ |
3,754,053 |
|
|
$ |
3,807,334 |
|
|
$ |
3,661,063 |
|
|
$ |
3,733,173 |
|
|
$ |
3,827,086 |
|
|
$ |
3,952,147 |
|
|
$ |
4,523,877 |
|
|
$ |
4,617,269 |
|
|
Number of loans
|
|
|
12,413 |
|
|
|
12,500 |
|
|
|
12,725 |
|
|
|
12,721 |
|
|
|
12,930 |
|
|
|
13,232 |
|
|
|
13,648 |
|
|
|
14,880 |
|
|
|
15,203 |
|
|
Average loan size
|
|
$ |
308 |
|
|
$ |
300 |
|
|
$ |
299 |
|
|
$ |
288 |
|
|
$ |
289 |
|
|
$ |
289 |
|
|
$ |
290 |
|
|
$ |
304 |
|
|
$ |
304 |
|
| |
|
|
|
|
|
|
|
|
|
|
|
|
|
|
|
|
|
|
|
|
|
|
|
|
|
|
|
|
|
|
|
|
|
|
|
|
|
Adjustable %
|
|
|
86 |
% |
|
|
90 |
% |
|
|
90 |
% |
|
|
96 |
% |
|
|
95 |
% |
|
|
95 |
% |
|
|
95 |
% |
|
|
85 |
% |
|
|
85 |
% |
|
Hybrid %
|
|
|
10 |
% |
|
|
10 |
% |
|
|
10 |
% |
|
|
4 |
% |
|
|
5 |
% |
|
|
5 |
% |
|
|
5 |
% |
|
|
15 |
% |
|
|
15 |
% |
|
Fixed %
|
|
|
4 |
% |
|
|
0 |
% |
|
|
0 |
% |
|
|
0 |
% |
|
|
0 |
% |
|
|
0 |
% |
|
|
0 |
% |
|
|
0 |
% |
|
|
0 |
% |
| |
|
|
|
|
|
|
|
|
|
|
|
|
|
|
|
|
|
|
|
|
|
|
|
|
|
|
|
|
|
|
|
|
|
|
|
|
|
Amortizing %
|
|
|
7 |
% |
|
|
5 |
% |
|
|
4 |
% |
|
|
3 |
% |
|
|
3 |
% |
|
|
3 |
% |
|
|
3 |
% |
|
|
4 |
% |
|
|
4 |
% |
|
Interest-only %
|
|
|
93 |
% |
|
|
95 |
% |
|
|
96 |
% |
|
|
97 |
% |
|
|
97 |
% |
|
|
97 |
% |
|
|
97 |
% |
|
|
96 |
% |
|
|
96 |
% |
| |
|
|
|
|
|
|
|
|
|
|
|
|
|
|
|
|
|
|
|
|
|
|
|
|
|
|
|
|
|
|
|
|
|
|
|
|
|
Florida
|
|
|
13 |
% |
|
|
13 |
% |
|
|
13 |
% |
|
|
14 |
% |
|
|
14 |
% |
|
|
14 |
% |
|
|
14 |
% |
|
|
13 |
% |
|
|
13 |
% |
|
Southern California
|
|
|
11 |
% |
|
|
11 |
% |
|
|
11 |
% |
|
|
11 |
% |
|
|
11 |
% |
|
|
11 |
% |
|
|
11 |
% |
|
|
12 |
% |
|
|
12 |
% |
|
Northern California
|
|
|
11 |
% |
|
|
10 |
% |
|
|
9 |
% |
|
|
8 |
% |
|
|
8 |
% |
|
|
8 |
% |
|
|
8 |
% |
|
|
9 |
% |
|
|
9 |
% |
|
New York
|
|
|
7 |
% |
|
|
8 |
% |
|
|
8 |
% |
|
|
7 |
% |
|
|
7 |
% |
|
|
7 |
% |
|
|
7 |
% |
|
|
6 |
% |
|
|
6 |
% |
|
Georgia
|
|
|
5 |
% |
|
|
5 |
% |
|
|
5 |
% |
|
|
5 |
% |
|
|
5 |
% |
|
|
5 |
% |
|
|
5 |
% |
|
|
5 |
% |
|
|
5 |
% |
|
New Jersey
|
|
|
4 |
% |
|
|
4 |
% |
|
|
4 |
% |
|
|
5 |
% |
|
|
5 |
% |
|
|
4 |
% |
|
|
4 |
% |
|
|
4 |
% |
|
|
4 |
% |
|
Texas
|
|
|
5 |
% |
|
|
5 |
% |
|
|
5 |
% |
|
|
5 |
% |
|
|
5 |
% |
|
|
5 |
% |
|
|
5 |
% |
|
|
5 |
% |
|
|
5 |
% |
|
Colorado
|
|
|
4 |
% |
|
|
4 |
% |
|
|
4 |
% |
|
|
4 |
% |
|
|
4 |
% |
|
|
4 |
% |
|
|
4 |
% |
|
|
4 |
% |
|
|
4 |
% |
|
Virginia
|
|
|
3 |
% |
|
|
3 |
% |
|
|
3 |
% |
|
|
3 |
% |
|
|
3 |
% |
|
|
3 |
% |
|
|
3 |
% |
|
|
3 |
% |
|
|
3 |
% |
|
Arizona
|
|
|
2 |
% |
|
|
2 |
% |
|
|
2 |
% |
|
|
2 |
% |
|
|
2 |
% |
|
|
3 |
% |
|
|
3 |
% |
|
|
3 |
% |
|
|
3 |
% |
|
Illinois
|
|
|
2 |
% |
|
|
2 |
% |
|
|
3 |
% |
|
|
2 |
% |
|
|
2 |
% |
|
|
2 |
% |
|
|
2 |
% |
|
|
3 |
% |
|
|
3 |
% |
|
Other states
|
|
|
33 |
% |
|
|
33 |
% |
|
|
33 |
% |
|
|
34 |
% |
|
|
34 |
% |
|
|
34 |
% |
|
|
34 |
% |
|
|
33 |
% |
|
|
33 |
% |
| |
|
|
|
|
|
|
|
|
|
|
|
|
|
|
|
|
|
|
|
|
|
|
|
|
|
|
|
|
|
|
|
|
|
|
|
|
|
Year 2010 origination
|
|
|
5 |
% |
|
|
2 |
% |
|
|
0 |
% |
|
|
0 |
% |
|
|
0 |
% |
|
|
0 |
% |
|
|
0 |
% |
|
|
0 |
% |
|
|
0 |
% |
|
Year 2009 origination
|
|
|
5 |
% |
|
|
5 |
% |
|
|
6 |
% |
|
|
0 |
% |
|
|
0 |
% |
|
|
0 |
% |
|
|
0 |
% |
|
|
0 |
% |
|
|
0 |
% |
|
Year 2008 origination
|
|
|
0 |
% |
|
|
0 |
% |
|
|
0 |
% |
|
|
0 |
% |
|
|
0 |
% |
|
|
0 |
% |
|
|
0 |
% |
|
|
0 |
% |
|
|
0 |
% |
|
Year 2007 origination
|
|
|
2 |
% |
|
|
2 |
% |
|
|
2 |
% |
|
|
2 |
% |
|
|
2 |
% |
|
|
2 |
% |
|
|
2 |
% |
|
|
2 |
% |
|
|
2 |
% |
|
Year 2006 origination
|
|
|
5 |
% |
|
|
5 |
% |
|
|
5 |
% |
|
|
6 |
% |
|
|
6 |
% |
|
|
5 |
% |
|
|
5 |
% |
|
|
15 |
% |
|
|
15 |
% |
|
Year 2005 origination
|
|
|
4 |
% |
|
|
4 |
% |
|
|
4 |
% |
|
|
4 |
% |
|
|
4 |
% |
|
|
4 |
% |
|
|
4 |
% |
|
|
4 |
% |
|
|
4 |
% |
|
Year 2004 origination or earlier
|
|
|
79 |
% |
|
|
82 |
% |
|
|
83 |
% |
|
|
88 |
% |
|
|
88 |
% |
|
|
89 |
% |
|
|
89 |
% |
|
|
79 |
% |
|
|
79 |
% |
| |
|
|
|
|
|
|
|
|
|
|
|
|
|
|
|
|
|
|
|
|
|
|
|
|
|
|
|
|
|
|
|
|
|
|
|
|
|
Wtd Avg Original LTV
|
|
|
66 |
% |
|
|
66 |
% |
|
|
66 |
% |
|
|
67 |
% |
|
|
67 |
% |
|
|
67 |
% |
|
|
67 |
% |
|
|
68 |
% |
|
|
68 |
% |
|
Original LTV: 0 - 50
|
|
|
19 |
% |
|
|
19 |
% |
|
|
19 |
% |
|
|
18 |
% |
|
|
18 |
% |
|
|
18 |
% |
|
|
18 |
% |
|
|
17 |
% |
|
|
17 |
% |
|
Original LTV: 50 - 60
|
|
|
12 |
% |
|
|
12 |
% |
|
|
12 |
% |
|
|
11 |
% |
|
|
11 |
% |
|
|
11 |
% |
|
|
11 |
% |
|
|
11 |
% |
|
|
11 |
% |
|
Original LTV: 60 - 70
|
|
|
21 |
% |
|
|
21 |
% |
|
|
20 |
% |
|
|
20 |
% |
|
|
20 |
% |
|
|
20 |
% |
|
|
20 |
% |
|
|
19 |
% |
|
|
19 |
% |
|
Original LTV: 70 - 80
|
|
|
41 |
% |
|
|
41 |
% |
|
|
42 |
% |
|
|
43 |
% |
|
|
43 |
% |
|
|
43 |
% |
|
|
43 |
% |
|
|
46 |
% |
|
|
46 |
% |
|
Original LTV: 80 - 90
|
|
|
2 |
% |
|
|
2 |
% |
|
|
2 |
% |
|
|
2 |
% |
|
|
2 |
% |
|
|
2 |
% |
|
|
2 |
% |
|
|
2 |
% |
|
|
2 |
% |
|
Original LTV: 90 - 100
|
|
|
5 |
% |
|
|
5 |
% |
|
|
5 |
% |
|
|
6 |
% |
|
|
6 |
% |
|
|
6 |
% |
|
|
6 |
% |
|
|
5 |
% |
|
|
5 |
% |
| |
|
|
|
|
|
|
|
|
|
|
|
|
|
|
|
|
|
|
|
|
|
|
|
|
|
|
|
|
|
|
|
|
|
|
|
|
|
Wtd Avg FICO
|
|
|
734 |
|
|
|
733 |
|
|
|
733 |
|
|
|
730 |
|
|
|
730 |
|
|
|
730 |
|
|
|
731 |
|
|
|
731 |
|
|
|
732 |
|
|
FICO: <= 600
|
|
|
1 |
% |
|
|
1 |
% |
|
|
1 |
% |
|
|
1 |
% |
|
|
1 |
% |
|
|
1 |
% |
|
|
1 |
% |
|
|
1 |
% |
|
|
1 |
% |
|
FICO: 601 -620
|
|
|
1 |
% |
|
|
1 |
% |
|
|
1 |
% |
|
|
1 |
% |
|
|
1 |
% |
|
|
1 |
% |
|
|
1 |
% |
|
|
1 |
% |
|
|
1 |
% |
|
FICO: 621 - 640
|
|
|
2 |
% |
|
|
2 |
% |
|
|
2 |
% |
|
|
2 |
% |
|
|
2 |
% |
|
|
2 |
% |
|
|
2 |
% |
|
|
2 |
% |
|
|
2 |
% |
|
FICO: 641 -660
|
|
|
3 |
% |
|
|
4 |
% |
|
|
4 |
% |
|
|
4 |
% |
|
|
4 |
% |
|
|
4 |
% |
|
|
4 |
% |
|
|
4 |
% |
|
|
4 |
% |
|
FICO: 661 - 680
|
|
|
7 |
% |
|
|
7 |
% |
|
|
7 |
% |
|
|
8 |
% |
|
|
8 |
% |
|
|
8 |
% |
|
|
8 |
% |
|
|
7 |
% |
|
|
7 |
% |
|
FICO: 681 - 700
|
|
|
11 |
% |
|
|
11 |
% |
|
|
11 |
% |
|
|
12 |
% |
|
|
12 |
% |
|
|
12 |
% |
|
|
12 |
% |
|
|
12 |
% |
|
|
12 |
% |
|
FICO: 701 - 720
|
|
|
13 |
% |
|
|
13 |
% |
|
|
13 |
% |
|
|
13 |
% |
|
|
13 |
% |
|
|
13 |
% |
|
|
14 |
% |
|
|
13 |
% |
|
|
13 |
% |
|
FICO: 721 - 740
|
|
|
13 |
% |
|
|
13 |
% |
|
|
13 |
% |
|
|
13 |
% |
|
|
13 |
% |
|
|
13 |
% |
|
|
13 |
% |
|
|
13 |
% |
|
|
13 |
% |
|
FICO: 741 - 760
|
|
|
14 |
% |
|
|
14 |
% |
|
|
14 |
% |
|
|
14 |
% |
|
|
14 |
% |
|
|
14 |
% |
|
|
14 |
% |
|
|
15 |
% |
|
|
15 |
% |
|
FICO: 761 - 780
|
|
|
17 |
% |
|
|
17 |
% |
|
|
17 |
% |
|
|
16 |
% |
|
|
16 |
% |
|
|
16 |
% |
|
|
16 |
% |
|
|
17 |
% |
|
|
17 |
% |
|
FICO: 781 - 800
|
|
|
14 |
% |
|
|
13 |
% |
|
|
13 |
% |
|
|
12 |
% |
|
|
12 |
% |
|
|
12 |
% |
|
|
12 |
% |
|
|
12 |
% |
|
|
12 |
% |
|
FICO: >= 801
|
|
|
4 |
% |
|
|
4 |
% |
|
|
4 |
% |
|
|
4 |
% |
|
|
4 |
% |
|
|
4 |
% |
|
|
3 |
% |
|
|
3 |
% |
|
|
3 |
% |
| |
|
|
|
|
|
|
|
|
|
|
|
|
|
|
|
|
|
|
|
|
|
|
|
|
|
|
|
|
|
|
|
|
|
|
|
|
|
Conforming balance % (2)
|
|
|
51 |
% |
|
|
53 |
% |
|
|
53 |
% |
|
|
56 |
% |
|
|
56 |
% |
|
|
56 |
% |
|
|
56 |
% |
|
|
55 |
% |
|
|
52 |
% |
|
% balance in loans > $1mm per loan
|
|
|
20 |
% |
|
|
18 |
% |
|
|
18 |
% |
|
|
16 |
% |
|
|
16 |
% |
|
|
16 |
% |
|
|
16 |
% |
|
|
14 |
% |
|
|
14 |
% |
| |
|
|
|
|
|
|
|
|
|
|
|
|
|
|
|
|
|
|
|
|
|
|
|
|
|
|
|
|
|
|
|
|
|
|
|
|
|
2nd home %
|
|
|
12 |
% |
|
|
12 |
% |
|
|
12 |
% |
|
|
12 |
% |
|
|
12 |
% |
|
|
12 |
% |
|
|
12 |
% |
|
|
11 |
% |
|
|
11 |
% |
|
Investment home %
|
|
|
4 |
% |
|
|
4 |
% |
|
|
4 |
% |
|
|
4 |
% |
|
|
4 |
% |
|
|
4 |
% |
|
|
4 |
% |
|
|
3 |
% |
|
|
3 |
% |
| |
|
|
|
|
|
|
|
|
|
|
|
|
|
|
|
|
|
|
|
|
|
|
|
|
|
|
|
|
|
|
|
|
|
|
|
|
|
Purchase
|
|
|
31 |
% |
|
|
31 |
% |
|
|
31 |
% |
|
|
31 |
% |
|
|
31 |
% |
|
|
31 |
% |
|
|
31 |
% |
|
|
34 |
% |
|
|
34 |
% |
|
Cash out refinance
|
|
|
33 |
% |
|
|
34 |
% |
|
|
34 |
% |
|
|
36 |
% |
|
|
36 |
% |
|
|
36 |
% |
|
|
35 |
% |
|
|
34 |
% |
|
|
34 |
% |
|
Rate-term refinance
|
|
|
35 |
% |
|
|
34 |
% |
|
|
34 |
% |
|
|
31 |
% |
|
|
31 |
% |
|
|
31 |
% |
|
|
32 |
% |
|
|
31 |
% |
|
|
31 |
% |
|
Other
|
|
|
1 |
% |
|
|
1 |
% |
|
|
1 |
% |
|
|
2 |
% |
|
|
2 |
% |
|
|
2 |
% |
|
|
2 |
% |
|
|
1 |
% |
|
|
1 |
% |
| |
|
|
|
|
|
|
|
|
|
|
|
|
|
|
|
|
|
|
|
|
|
|
|
|
|
|
|
|
|
|
|
|
|
|
|
|
(1) This table presents characteristics of residential real estate loans held by consolidated Sequoia entities and residential real estate loans held by Redwood and intended to be securitized by future Sequoia entities.
(2) The definition of a conforming loan has significantly changed over time. For all periods shown in this table, the conforming balance definition available in December 2010 was used (which had a maximum loan balance of $729,750).
| THE REDWOOD REVIEW 4TH QUARTER 2010 |
Table 9: Residential Real Estate Loan Characteristics
|
61 |
This Page Intentionally Left Blank
Redwood Trust Corporate Information
|
EXECUTIVE OFFICERS:
|
|
DIRECTORS:
|
| |
|
|
|
Martin S. Hughes
|
|
George E. Bull, III
|
|
President and Chief Executive Officer
|
|
Chairman of the Board
|
| |
|
|
|
Brett D. Nicholas
|
|
Richard D. Baum
|
|
Executive Vice President, Chief Investment Officer, and
|
|
Former Chief Deputy Insurance
|
|
Chief Operating Officer
|
|
Commissioner for the State of California
|
| |
|
|
|
Diane L. Merdian
|
|
Thomas C. Brown
|
|
Chief Financial Officer
|
|
CEO and Principal Shareholder,
|
| |
|
Urban Bay Properties, Inc.
|
|
Harold F. Zagunis
|
|
COO, McGuire Real Estate
|
|
Chief Risk Officer
|
|
|
| |
|
Mariann Byerwalter
|
|
Scott M. Chisholm
|
|
Chairman, JDN Corporate Advisory LLC
|
|
Head of Commercial Investments
|
|
|
| |
|
Douglas B. Hansen
|
|
John H. Isbrandtsen
|
|
Private Investor
|
|
Head of Residential Acquisitions and
|
|
|
|
Securitization
|
|
Martin H. Hughes
|
| |
|
President and Chief Executive Officer
|
|
Fred J. Matera
|
|
|
|
Head of Residential Investments
|
|
Greg H. Kubicek
|
| |
|
President, The Holt Group, Inc.
|
|
Andrew P. Stone
|
|
|
|
General Counsel
|
|
Jeffrey T. Pero
|
| |
|
Retired Partner, Latham & Watkins LLP
|
| |
|
|
|
STOCK LISTING:
|
|
Georganne C. Proctor
|
|
The Company’s common stock is traded
|
|
Former Chief Financial Officer, TIAA-CREF
|
|
on the New York Stock Exchange under
|
|
|
|
the symbol RWT
|
|
Charles J. Toeniskoetter
|
| |
|
Chairman, Toeniskoetter & Breeding, Inc. Development
|
|
CORPORATE HEADQUARTERS:
|
|
Chairman and CEO,
|
|
One Belvedere Place, Suite 300
|
|
Toeniskoetter Construction, Inc.
|
|
Mill Valley, California 94941
|
|
|
|
Telephone: (415) 389-7373
|
|
|
| |
|
INVESTOR RELATIONS:
|
|
NEW YORK OFFICE:
|
|
Mike McMahon
|
|
245 Park Avenue, 39th Floor
|
|
Managing Director
|
|
New York, New York 10167
|
|
|
| |
|
Paula Kwok
|
|
TRANSFER AGENT:
|
|
Assistant Vice President
|
|
Computershare Trust Company, N.A.
|
|
|
|
2 North LaSalle Street
|
|
|
|
Chicago, IL 60602
|
|
Investor Relations Hotline: (866) 269-4976
|
|
Telephone: (888) 472-1955
|
|
|
For more information about Redwood Trust, please visit our website at: www.redwoodtrust.com