|
|
 |
|
TABLE OF CONTENTS
|
|
Introduction
|
|
|
4 |
|
| |
|
|
|
|
|
Shareholder Letter
|
|
|
5 |
|
| |
|
|
|
|
|
Financial Insights
|
|
|
11 |
|
| |
|
|
|
|
|
|
|
|
11 |
|
| |
|
|
|
|
|
|
|
|
12 |
|
| |
|
|
|
|
|
|
|
|
17 |
|
| |
|
|
|
|
u Taxable Income and Dividends
|
|
|
21 |
|
| |
|
|
|
|
|
|
|
|
22 |
|
| |
|
|
|
|
|
Comments on Risk Retention and QRM
|
|
|
24 |
|
| |
|
|
|
|
|
Residential Mortgage Loan Business
|
|
|
25 |
|
| |
|
|
|
|
|
Investments in New Sequoia
|
|
|
26 |
|
| |
|
|
|
|
|
Residential Real Estate Securities
|
|
|
27 |
|
| |
|
|
|
|
|
Commercial Real Estate
|
|
|
31 |
|
| |
|
|
|
|
|
Legacy Investments in Other Consolidated Entities
|
|
|
32 |
|
| |
|
|
|
|
| |
|
|
|
|
|
Appendix
|
|
|
|
|
| |
|
|
|
|
|
Accounting Discussion
|
|
|
34 |
|
| |
|
|
|
|
|
Glossary
|
|
|
35 |
|
| |
|
|
|
|
|
Financial Tables
|
|
|
41 |
|
|
THE REDWOOD REVIEW 1ST QUARTER 2011
|
1
|
|
|
|
CAUTIONARY STATEMENT
|
Cautionary Statement
This Redwood Review contains forward-looking statements within the meaning of the safe harbor provisions of the Private Securities Litigation Reform Act of 1995. Forward-looking statements involve numerous risks and uncertainties. Our actual results may differ from our expectations, estimates, and projections and, consequently, you should not rely on these forward-looking statements as predictions of future events. Forward-looking statements are not historical in nature and can be identified by words such as “anticipate,” “estimate,” “will,” “should,” “expect,” “believe,” “intend,” “seek,” “plan,” and similar expressions or their negative forms, or by references to strategy, plans, or intentions. These forward-looking statements are subject to risks and uncertainties, including, among other things, those described in our most recent Annual Report on Form 10-K under the caption “Risk Factors.” Other risks, uncertainties, and factors that could cause actual results to differ materially from those projected are described below and may be described from time to time in reports we file with the Securities and Exchange Commission, including reports on Forms 10-K, 10-Q, and 8-K. We undertake no obligation to update or revise forward-looking statements, whether as a result of new information, future events, or otherwise.
Statements regarding the following subjects, among others, are forward-looking by their nature: (i) our competitive position and our ability to compete in the future, including our ability to effectively compete to acquire residential mortgage loans and our ability to compete to originate and acquire commercial real estate loans; (ii) our future investment strategy and our ability to find attractive investments and future trends relating to our pace of acquiring or selling assets, including, without limitation, statements relating to our efforts to acquire residential mortgage loans and make commercial real estate investments; (iii) our plan to acquire the $137 million of loans comprising the pipeline of residential mortgage loans that, as of the end of the first quarter of 2011, we planned to purchase through our conduit program and our plan to acquire additional loans that we have already added, or plan in the future to add, to our pipeline after the end of the first quarter of 2011; (iv) our statement that the systems and operational infrastructure we have in place for our loan conduit can be leveraged to handle a dramatic increase in the volume of securitization transactions we complete and our statement that if would could acquire a greater volume of loans to securitize it would likely lead to higher earnings from our loan conduit; (v) references to future securitization transactions, the timing of the completion of those future securitization transactions, and the number and size of such transactions we expect to complete in 2011 and future periods, which future securitizations may not be completed when planned or at all, and, more generally, statements regarding the likelihood and timing of, and our participation in, future securitization transactions and our ability to finance loan acquisitions through the execution of securitization transactions; (vi) our expectation that new Sequoia securitization entities will represent a larger portion of our balance sheet in the future; (vii) references to our expectations of future levels of our securities purchase and sale activity and our plan to invest much of our excess capital in 2011, including, without limitation, our statement that our biggest planned investment of capital in 2011 will be in commercial real estate loans; (viii) that we do not anticipate a need to issue equity in the near term, our estimates of our short-term borrowing capacity and our short-term investment capacity, our statements regarding our ability to access additional short-term borrowings and to access capital through re-securitization transactions or other forms of debt financing, and our statements regarding future balances of outstanding short-term debt; (ix) future market and economic conditions, including, without limitation, future conditions in the residential and commercial real estate markets and related financing markets, and the related potential opportunities for our residential and commercial businesses; (x) our statement that as we look ahead at the state of the residential mortgage markets we see positive trends, including, without limitation, residential mortgage products that are safer for borrowers, low loan loss rates for newly originated loans comparable to historic norms, and sources of private capital willingly funding residential mortgages through securitization and our statement that these trends could present a vast growth opportunity for us and offer us a competitive advantage; (xi) our beliefs about, and our outlook for, the future direction of housing market fundamentals, including, without limitation, home prices, demand for housing, delinquency rates, foreclosure rates, prepayment rates, inventory of homes for sale, and mortgage interest rates and their potential impact on our business and results of operations and our belief that the housing market is in the process of forming a bottom and our expectation that housing, in general, will not be a significantly appreciating asset class for years; (xii) our beliefs about the future direction of commercial real estate fundamentals and that those fundamentals continue to show signs of improvement, including, without limitation, statements regarding commercial real estate vacancy rates, rental rates, and default rates, and statements regarding the competitive landscape for and availability of financing for commercial real estate, the number of future opportunities for us to provide mezzanine financing to borrowers, the pipeline of possible loans we are competing to make in the near future, our estimate that our commercial real estate loan originations are likely to be in the range of $25 million to $50 million per quarter over the next several quarters, and statements regarding the future of the CMBS market; (xiii) statements relating to the impact of recent and future legislative and regulatory changes that affect our business, the regulation of securitization transactions, and the mortgage finance markets, the manner in which the reform of the GSEs, including Fannie Mae and Freddie Mac, may take place and the timeline for that reform, and our statements that GSE reform could result in a substantially larger portion of the mortgage market being available to us; (xiv) our expectations regarding credit reserves, credit losses, the adequacy of credit support, and impairments and their impact on our investments (including as compared to our original expectations and credit reserve levels) and the timing of losses and impairments, and statements that the amount of credit reserves we designate may require changes in the future; (xv) our statement that we expect to reverse an aggregate of $5 million of loan loss reserves that relate to ten Sequoia securitization entities in future periods upon the payoff or deconsolidation of those entities; (xvi) expectations regarding future interest income, future earnings, future earnings volatility, and future trends in operating expenses and the factors that may affect those trends, as well as statements regarding the impact of future changes in interest rates and how the value of, and cash-flow produced by, the mix of adjustable-rate and fixed-rate instruments in our portfolio of assets would respond to future changes in interest rates; (xvii) our board of directors’ intention to pay a regular dividend of $0.25 per share per quarter in 2011; and (xviii) our expectations relating to tax accounting, including our estimated taxable income for the first quarter of 2011, our expectation that we will realize a taxable loss for the full year 2011, and our anticipation of additional credit losses for tax purposes in 2011 and future periods and the level of those losses.
|
2
|
THE REDWOOD REVIEW 1ST QUARTER 2011
|
Cautionary Statement (continued)
Important factors, among others, that may affect our actual results include: general economic trends, the performance of the housing, commercial real estate, mortgage, credit, and broader financial markets, and their effects on the prices of earning assets and the credit status of borrowers; federal and state legislative and regulatory developments, and the actions of governmental authorities, including those affecting the mortgage industry or our business; our exposure to credit risk and the timing of credit losses within our portfolio; the concentration of the credit risks we are exposed to, including due to the structure of assets we hold and the geographical concentration of real estate underlying assets we own; our exposure to adjustable-rate and negative amortization mortgage loans; the efficacy and expense of our efforts to manage or hedge credit risk, interest rate risk, and other financial and operational risks; changes in credit ratings on assets we own and changes in the rating agencies’ credit rating methodologies; changes in interest rates; changes in mortgage prepayment rates; the availability of assets for purchase at attractive prices and our ability to reinvest cash we hold; changes in the values of assets we own; changes in liquidity in the market for real estate securities and loans; our ability to finance the acquisition of real estate-related assets with short-term debt; the ability of counterparties to satisfy their obligations to us; our involvement in securitization transactions and the risks we are exposed to in engaging in securitization transactions; exposure to litigation arising from our involvement in securitization transactions; whether we have sufficient liquid assets to meet short-term needs; our ability to successfully compete and retain or attract key personnel; our ability to adapt our business model and strategies to changing circumstances; changes in our investment, financing, and hedging strategies and new risks we may be exposed to if we expand our business activities; exposure to environmental liabilities and the effects of global climate change; failure to comply with applicable laws and regulations; our failure to maintain appropriate internal controls over financial reporting and disclosure controls and procedures; the impact on our reputation that could result from our actions or omissions or from those of others; changes in accounting principles and tax rules; our ability to maintain our status as a real estate investment trust (REIT) for tax purposes; limitations imposed on our business due to our REIT status and our status as exempt from registration under the Investment Company Act of 1940; decisions about raising, managing, and distributing capital; and other factors not presently identified.
This Redwood Review may contain statistics and other data that in some cases have been obtained from or compiled from information made available by servicers and other third-party service providers.
|
THE REDWOOD REVIEW 1ST QUARTER 2011
|
3
|
|
|
|
INTRODUCTION
|
Note to Readers:
We file annual reports (on Form 10-K) and quarterly reports (on Form 10-Q) with the Securities and Exchange Commission. These filings and our earnings press releases provide information about Redwood and our financial results in accordance with generally accepted accounting principles (GAAP). We urge you to review these documents, which are available through our web site, www.redwoodtrust.com.
This document, called The Redwood Review, is an additional format for providing information about Redwood through a discussion of many GAAP as well as non-GAAP metrics, such as taxable income and economic book value. Supplemental information is also provided in the Financial Tables in this Review to facilitate more detailed understanding and analysis of Redwood. When we use non-GAAP metrics it is because we believe that these figures provide additional insight into Redwood’s business. In each case in which we discuss a non-GAAP metric you will find an explanation of how it has been calculated, why we think the figure is important, and a reconciliation between the GAAP and non-GAAP figures.
References herein to “Redwood,” the “company,” “we,” “us,” and “our” include Redwood Trust, Inc. and its consolidated subsidiaries. References to “at Redwood” exclude all consolidated securitization entities in order to present our operations in the way management analyzes them.
Note that because we round numbers in the tables to millions, except per share amounts, some numbers may not foot due to rounding.
We hope you find this Review helpful to your understanding of our business. We thank you for your input and suggestions, which have resulted in our changing the form and content of The Redwood Review over time.
We welcome your continued interest and comments.
| |
|
|
|
|
|
|
|
Selected Financial Highlights
|
| |
|
|
|
|
|
|
|
Quarter:Year
|
GAAP Income (Loss)
per Share
|
Taxable
Income (Loss)
per Share(1)
|
Annualized
GAAP Return
on Equity
|
GAAP Book
Value per
Share
|
Non-GAAP Economic
Value per
Share (2)
|
Dividends
per Share
|
|
Q109
|
($0.65)
|
($0.22)
|
(25%)
|
$8.40
|
$10.01
|
$0.25
|
|
Q209
|
$0.10
|
($0.16)
|
5%
|
$10.35
|
$11.30
|
$0.25
|
|
Q309
|
$0.34
|
($0.30)
|
13%
|
$11.68
|
$12.28
|
$0.25
|
|
Q409
|
$0.51
|
($0.44)
|
17%
|
$12.50
|
$13.03
|
$0.25
|
|
Q110
|
$0.58
|
$0.01
|
19%
|
$12.84
|
$13.32
|
$0.25
|
|
Q210
|
$0.35
|
($0.03)
|
11%
|
$12.71
|
$13.37
|
$0.25
|
|
Q310
|
$0.25
|
($0.11)
|
8%
|
$13.02
|
$13.73
|
$0.25
|
|
Q410
|
$0.18
|
($0.07)
|
6%
|
$13.63
|
$14.31
|
$0.25
|
|
Q111
|
$0.22
|
$0.06
|
8%
|
$13.76
|
$14.45
|
$0.25
|
|
(1) Taxable income (loss) per share for 2010 and 2011 are estimates until we file tax returns for that year.
|
| |
|
(2) Non-GAAP economic value per share is calculated using estimated bid-side values (which take into account available bid-side marks) for our financial assets and estimated offer-side values (which take into account available offer-side marks) for our financial liabilities and we believe it more accurately reflects liquidation value than does GAAP book value per share. Non-GAAP economic value per share is reconciled to GAAP book value per share in Table 3 in the Financial Tables in this Review.
|
|
4
|
THE REDWOOD REVIEW 1ST QUARTER 2011
|
|
|
 |
|
SHAREHOLDER LETTER
|
Dear Fellow Shareholders:
Overview
All in all, we are off to a productive start to 2011. Our residential conduit continues to grind forward, we completed our second securitization, our commercial efforts are beginning to bear fruit, and our investment portfolio continues to perform well.
In an ongoing effort to keep this letter up-to-date and relevant to you, our shareholders, we will address the topics that we believe you are likely most curious about: Are our residential and commercial businesses headed in the right direction? What’s new on the regulatory front? How are we positioned for a change in interest rates, given the current interest rate debate? Before we address these questions, we will review our operating results and financial highlights for the first quarter of 2011.
First Quarter 2011
GAAP earnings for the first quarter of 2011 were $18 million or $0.22 per share, up from the $15 million or $0.18 per share we earned in the fourth quarter of 2010. The first quarter of 2011 was characterized by modestly lower net interest income and lower operating expenses ($1 million below the level in the fourth quarter of 2010). Negative market valuation adjustments amounted to $6 million, largely offset by net gains from securities sales of $4 million in the quarter. The loan loss provision was $3 million in the first quarter of 2011, well below the $8 million level in the fourth quarter of 2010.
Book value increased by $0.13 in the first quarter of 2011, to $13.76 per share from $13.63 per share. The increase reflected $10 million in unrealized gains on securities and derivatives, earnings of $18 million, plus $2 million in other items, less the $20 million dividend distribution. Our estimate of non-GAAP economic value is $14.45 per share at March 31, 2011, just $0.69 per share above our reported GAAP book value at the same time. The difference between GAAP book value and estimated non-GAAP economic book value has remained in a relatively narrow range for the last four quarters.
Investment Capacity
Our investment capacity, or the amount of capital we estimate that we have readily available to support long-term investments, was $249 million at March 31, 2011, up $25 million from $224 million at year-end 2010. Until recently, our cash balance was a pretty good proxy for our investment capacity. Now that we are funding loans acquired for future securitization with a combination of cash and short-term borrowings, our cash balance alone is no longer a good indicator of investment capacity. We estimate our investment capacity as (1) cash on hand, plus (2) cash we could raise by increasing short-term borrowings to finance all our residential mortgage loans held for securitization, less (3) cash needed to cover short-term operations, working capital, and a liquidity cushion.
Additionally, we believe we could raise incremental capital (in the range of $200 to $300 million) by permanently financing a portion of our residential securities portfolio, via re-securitization or other means. Similarly, over time, we believe we could raise additional investment capacity by permanently financing a portion of our commercial portfolio. We would most likely exhaust these or similar possibilities before seeking to raise equity, if we needed additional capital.
During the quarter we invested $40 million: $13 million in third-party issued residential mortgage-backed securities (RMBS), $15 million in securities issued by Sequoia 2011-1, and $12 million in commercial loan originations.
THE REDWOOD REVIEW 1ST QUARTER 2011
|
5
|
|
|
|
SHAREHOLDER LETTER
|
Residential Loan Business
It is easy to get caught up in the seemingly endless morass of the regulatory, political, social, and servicer-related issues that overhang today’s housing and residential mortgage markets. When we look ahead — and admittedly you need to jump pretty high — we see a number of things emerging that we like: safer mortgages that borrowers can afford, the return of low loan loss rates to historic norms for newly originated prime loans, private capital willingly funding residential mortgages via responsible securitizations, and a housing market that is on firmer ground.
If we are right, then there will be a vast growth opportunity for a residential credit investor like Redwood to act as a financial intermediary between borrowers, lenders, and triple-A investors. Our goal is to create “home-cooked” credit investments through this process. We are also positioned to acquire credit securities issued by major banks or other financial institutions if the securities meet our investment criteria.
We believe the business of buying and securitizing residential mortgage loans is and will continue to be fundamentally different than it was in 2006 and 2007. For starters, securitization sponsors will be required to adhere to new, stricter regulations. Furthermore, we believe lenders, triple-A investors, and rating agencies will be significantly more discerning and demanding.
In our opinion, lenders will demand more than just competitive pricing from their loan conduits. Lenders will want reliable and value-added relationships with fewer, trusted conduits — which will include competitiveness in products, consistency in pricing, timeliness in approvals, and efficiency in delivery. Triple-A investors will demand simpler, safer securitization structures that offer transparency, alignment of interests, and governance and representation and warranty mechanisms that deal effectively with loan collateral issues. And we can tell you firsthand that the ratings process is now far more complex and extensive.
The bottom line is that this business is going to be a lot harder to do. That is a good thing as it offers us a competitive advantage. We believe we have the right skill sets, relationships with lenders and triple-A investors, and the balance sheet structure to be successful.
The biggest obstacle we face today is volume. We are only able to source loans from the 5% to 10% of mortgage loans that are outside the government’s reach. At current levels, our loan conduit is operationally inefficient and is a drag on earnings. In a sense, our loan conduit is a start-up company. The good news is that the systems and operations in place can be leveraged, likely leading to higher earnings from our loan conduit as loan volume increases. For example, we believe we could handle a dramatic increase in our securitization volume, with some — but not a substantial — increase in operating expenses.
The other good news is we are gaining traction in terms of the number of active originators and those in the implementation stage. At the end of the first quarter of 2011, we held $53 million of residential loans for future securitization, plus we had a pipeline of an additional $137 million in residential mortgage loans we planned to purchase. We are targeting our next residential mortgage securitization for the third quarter of 2011, assuming market conditions permit. In fact, we believe we are likely to close three securitizations this year (given current market conditions) for an estimated total of $800 million to $1.0 billion in loans securitized. This is a significant increase from the one securitization of $238 million in loans we completed in 2010.
|
6
|
THE REDWOOD REVIEW 1ST QUARTER 2011
|
|
|
|
|
SHAREHOLDER LETTER
|
Residential Loan Business (continued)
Furthermore, there are hopeful, encouraging signs out of Washington, D.C., as both political parties now acknowledge the need to reduce the government’s outsized role in mortgage finance in favor of the private sector. The first step could come at the end of September, when the conforming loan limit is scheduled to come down from $729,750 to $625,000 in high cost areas.
We realize it could take until 2012 to get some traction. As a company, we are not just sitting around waiting for the world to change. We continue to actively look for residential portfolio opportunities and our biggest plan for capital deployment in 2011 is by our commercial group.
Commercial Real Estate Business
As we have commented previously, our balance sheet is especially well suited for retaining long-term credit risk. We provide reliability, flexibility, and other advantages to borrowers — including the advantage of permanent funding of longer-term assets. In our commercial group, we are currently focused on financing the gap that exists between the amount of equity a borrower will put into a property and the amount of financing a senior lender will provide.
The recovery in financing for select commercial real estate properties continues, with significant funding available for stabilized commercial assets in select, highly desirable markets. The change in sentiment and increased liquidity can be seen in the commercial mortgage-backed securities (CMBS) market. For example, non-agency CMBS issuance in 2010 amounted to roughly $9 billion. CMBS issuance is estimated to have been about $8 billion in the first quarter of 2011 alone, with strong prospects for remaining quarters of 2011, as reflected in the consensus estimate for 2011 issuance of around $40 billion.
This rapid return of capital to commercial real estate is accompanied by increased competition by lenders, tightening triple-A spreads, and easing underwriting standards. Borrowers are able to refinance at increasingly attractive rates with higher proceeds for high-quality properties in select markets. There are already signs of aggressive behavior returning to commercial mortgage securitization — i.e., lenders pushing proceeds and loan-to-value ratios higher. This suggests that the available supply of mezzanine lending opportunities could get squeezed.
We are an active originator and underwriter and continue to focus on good loans. We have worked hard to develop a network of relationships to source good opportunities and our pipeline of possible loans is growing. We closed three loans year-to-date through April 30, totaling $19 million with an average yield between 10% and 11%. At April 30, we had a $49 million portfolio of six mezzanine loans. We anticipate continued competitive pressure on rates on mezzanine loans. We estimate originations are likely to be in the range of $25 million to $50 million per quarter over the next several quarters, based on current conditions.
THE REDWOOD REVIEW 1ST QUARTER 2011
|
7
|
|
|
|
SHAREHOLDER LETTER
|
Proposed Rules Relating to Securitization
On March 21, 2011, long-awaited proposed implementation rules related to securitization were released, as required by the Dodd-Frank Act. The most impactful provisions relate to (1) the definition of a Qualified Residential Mortgage (QRM) — the type of loan that requires no risk retention and (2) the amount and acceptable methods of risk retention for sponsors of securitizations of non-QRM loans. As currently written, the proposed rules are open to differing interpretations and have left many market participants, including us, confused about how various calculations would work, and trying to figure out what the proposed rules really mean.
While it is too early to draw definitive conclusions since the final rules are likely to change, we offer these initial observations. In general, the rules were written more restrictively than market participants had anticipated. In our opinion, if the proposed rules are adopted as written, prime borrowers will face unnecessarily higher mortgage rates. To over-simplify, the primary problem is that regulators took a one-size-fits-all approach to rule-making even though there are significant differences between subprime and prime securitization structures. The proposed rules are effectively subprime-centric and do a good job of addressing and deterring abuses of subprime securitization structures. The rules apply to all securitizations, however, and are overly and unnecessarily harsh when applied to prime structures. Not surprisingly, Realtors, mortgage brokers, and bankers are “up in arms.” Additionally, since the rules, as written, will result in unnecessary upward pressure on prime borrowers’ mortgage rates, this is incongruous with the Obama Administration’s intention to reduce the government’s current outsized role in favor of a safe, robust, and competitively priced private credit market for residential mortgages.
We note that these same issues apply to commercial mortgage-backed securitizations. The proposed rules are overwhelmingly penal to commercial borrowers. In our opinion, the typical commercial mortgage-backed securitization will become uneconomic under the rules as currently written.
We think it is likely the proposed rules will be revised. In any case, we will adapt to whatever the final rules are and do not believe we will end up disadvantaged compared to other private market participants.
Residential Investment Portfolio
On balance, in the first quarter of 2011, securities prices did not change much over the course of the quarter, even though prices rose meaningfully in January and February for some types of securities. We observed weakness in securities prices in March as buyers pulled back and the bid-offer spread widened. By quarter-end, on average, we were just slightly ahead of where we began the quarter.
In April, prices moved back up. In our opinion, the catalyst for the improvement in prices was the orderly liquidation of portions of the Federal Reserve’s Maiden Lane II portfolio. This portfolio contained $16 billion in securities at market value, and primarily included subprime, Alt-A, and Option ARM assets from 2006-2007. Liquidation sales were met with broad-based investor demand. While it may seem counterintuitive, large portfolio liquidations trade well in the mortgage market, typically better than small portfolio sales. We expect the entire Maiden Lane II portfolio to be liquidated over time and believe this supply will help to narrow bid-offer spreads and better define pricing.
|
8
|
THE REDWOOD REVIEW 1ST QUARTER 2011
|
|
|
|
|
SHAREHOLDER LETTER
|
Residential Investment Portfolio (continued)
The pace of our RMBS acquisitions has slowed significantly as credit risk spreads have contracted dramatically since 2009. Nevertheless, we are still quite active in monitoring market activity and pricing. Gathering market intelligence is essential to managing our $780 million RMBS portfolio. While we are long-term investors at our core, we will selectively sell assets when we believe the market value is too optimistic relative to our assessment of future cash flows, including credit risk considerations. During the first quarter, we sold $33 million of RMBS (excluding sales from the Opportunity Fund and Acacia) and invested $28 million in our residential business — $13 million in seasoned, third-party securities and $15 million in newly issued Sequoia securities.
Interest Rates and Our Business
Our businesses have made money in both rising and falling interest rate environments. In light of the passionate debates currently swirling over the direction of interest rates, we thought it might be helpful to shareholders to do a high-level review of our investment philosophy and balance sheet sensitivity with respect to changing interest rates.
Both of the interest rate camps make compelling cases. The rising interest rate camp points to the ending of QE2, the Federal Reserve’s support of Treasuries, the inevitable consequences of the extraordinary monetary stimulus, and the inflationary pressures emanating from rising food, energy, and commodity prices. The flat-to-falling rate camp believes price inflation will be subdued due to worldwide de-leveraging, declining labor costs, rising productivity, and ongoing pressure on home values.
We don’t know which side will turn out to be right, even though with hindsight it will seem “obvious.” Importantly, we realize that we do not know the direction of interest rates and we do not believe our shareholders expect us to make investments with a strict interest rate view.
Our approach is to balance our business and portfolio investments to perform across a range of interest rates. What do we mean by a balanced approach? At the highest level, it means not being overly exposed to changes in any one of the variables that directly impact our returns, such as the level of interest rates and prepayment rates. Ideally, we would like to be agnostic in terms of interest rate moves. Any student of the RMBS market knows, however, that this is a tall order, given that mortgage values go down more when rates rise than they go up when rates fall.
If we look at the interest rate sensitivity of our assets, we have invested in a relatively balanced mix of adjustable-rate and fixed-rate instruments. Balance is important because if we have too many adjustable-rate securities, with short-term interest rates close to zero, we would not generate enough interest cash flow to fund our growth. If we had too many fixed-rate assets, we would satisfy our need for interest cash flow, but we would be subject to more book value risk if market rates moved higher.
Let’s look at the liability side at Redwood, which is principally funded with equity and long-term borrowings. The rate on our roughly $140 million in long-term borrowings is effectively fixed at 6.75% via long-term hedges. We will have some short-term borrowings outstanding, at a level that fluctuates, as we are at times borrowing to fund a portion of the loans we are accumulating for securitization. At Redwood (excluding consolidated entities), we typically have few to no liabilities that re-price when rates change — which is relatively unheard of at financial companies. We have generally avoided short-term recourse borrowing as a core element of managing our liquidity risk. Avoiding this leverage means that we have sacrificed some current return on equity, but we have taken less risk on behalf of shareholders.
THE REDWOOD REVIEW 1ST QUARTER 2011
|
9
|
|
|
|
SHAREHOLDER LETTER
|
Conclusion
We are in the throes of re-building two businesses (our residential conduit and our commercial loan business) from the ground up. Done correctly, we believe these businesses play to our strengths and offer the best growth opportunity to generate attractive, durable, long-term cash flows for shareholders.
We wish we could hit the fast-forward button, as the slow pace of tangible results is frustrating. We are working to get ahead of the crowd and lay tracks with lenders and senior investors. Getting it done right is far better than getting it done fast.
We never take your patience or support for granted. Thank you.
 |
 |
|
Martin S. Hughes
|
Brett D. Nicholas
|
|
President and
|
Executive Vice President,
|
|
Chief Executive Officer
|
Chief Investment Officer, and
|
| |
Chief Operating Officer
|
|
10
|
THE REDWOOD REVIEW 1ST QUARTER 2011
|
|
|
 |
|
FINANCIAL INSIGHTS
|
Book Value
Summary
|
u
|
The following table shows the components of our estimated GAAP book value and estimate of non-GAAP economic value at March 31, 2011.
|
| |
|
|
|
|
|
|
|
|
|
|
Components of Book Value(1)
|
|
|
March 31, 2011
|
|
|
($ in millions, except per share data)
|
|
| |
|
|
|
|
|
|
|
|
|
| |
Components of |
|
|
|
|
Estimate of |
|
| |
GAAP
|
|
|
|
|
Non-GAAP
|
|
| |
Book Value
|
|
Adj. |
|
Economic Value
|
|
|
Cash and cash equivalents
|
$
|
220
|
|
|
|
|
$
|
220
|
|
| |
|
|
|
|
|
|
|
|
|
|
Real estate loans at Redwood
|
|
|
|
|
|
|
|
|
|
|
Residential
|
|
55
|
|
|
|
|
|
55
|
|
|
Commercial
|
|
42
|
|
|
|
|
|
42
|
|
|
Total real estate loans at Redwood
|
$
|
97
|
|
|
|
|
$
|
97
|
|
| |
|
|
|
|
|
|
|
|
|
|
Real estate securities at Redwood
|
|
|
|
|
|
|
|
|
|
|
Residential
|
|
780
|
|
|
|
|
|
780
|
|
|
Commercial
|
|
7
|
|
|
|
|
|
7
|
|
|
CDO
|
|
1
|
|
|
|
|
|
1
|
|
|
Total real estate securities at Redwood
|
$
|
788
|
|
|
|
|
$
|
788
|
|
| |
|
|
|
|
|
|
|
|
|
|
Investments in Sequoia
|
|
97
|
|
|
(4)
|
|
|
93
|
|
|
Investments in Acacia
|
|
2
|
|
|
(1)
|
|
|
1
|
|
|
Investments in the Fund
|
|
11
|
|
|
|
|
|
11
|
|
|
Other assets
|
|
34
|
|
|
|
|
|
34
|
|
|
Total assets
|
$
|
1,249
|
|
|
|
|
$
|
1,244
|
|
| |
|
|
|
|
|
|
|
|
|
|
Short-term debt
|
|
-
|
|
|
|
|
|
-
|
|
|
Long-term debt
|
|
(140)
|
|
|
59
|
|
|
(81)
|
|
| |
|
|
|
|
|
|
|
|
|
|
Other liabilities
|
|
(34)
|
|
|
|
|
|
(34)
|
|
| |
|
|
|
|
|
|
|
|
|
|
Stockholders' equity
|
$
|
1,075
|
|
|
|
|
$
|
1,129
|
|
| |
|
|
|
|
|
|
|
|
|
|
Book value per share
|
$
|
13.76
|
|
|
|
|
$
|
14.45
|
|
|
u
|
During the first quarter of 2011, our GAAP book value increased by $0.13 per share to $13.76 per share. The increase resulted from $0.22 per share in reported earnings, $0.08 per share in net valuation increases on securities not reflected in earnings, $0.05 per share in increases in value of hedges related to long-term debt, and $0.03 per share in other items, less $0.25 per share in dividends paid to shareholders.
|
|
u
|
During the first quarter of 2011, our estimate of non-GAAP economic value increased by $0.14 per share to $14.45 per share. The increase resulted from $0.57 per share in cash flow and net positive market valuation adjustments on our securities and investments; plus $0.06 per share from changes in working capital and other items; less $0.01 per share from the valuation increases related to our long-term debt and associated hedges; $0.23 per share of cash operating and interest expense; and $0.25 per share of dividends paid to shareholders.
|
1This table presents our assets and liabilities as calculated and estimated under GAAP and as adjusted to reflect our estimate of economic value, a non-GAAP metric. We show our investments in the Redwood Opportunity Fund, L.P. (the Fund) and in Sequoia and Acacia securitization entities in separate line items, similar to the equity method of accounting, reflecting the reality that the underlying assets and liabilities owned by these entities are legally not ours even though we are required to consolidate them for financial reporting purposes. We own only the securities and interests that we have acquired from these entities. See pages 14 and 15 for an explanation of the adjustments set forth in this table.
THE REDWOOD REVIEW 1ST QUARTER 2011
|
11
|
|
|
|
FINANCIAL INSIGHTS
|
|
|
The following table shows the components of our balance sheet at March 31, 2011.
|
| |
|
|
|
|
|
|
|
|
|
|
|
|
|
|
|
|
Consolidating Balance Sheet
|
|
|
March 31, 2011
|
|
|
($ in millions)
|
|
| |
|
|
|
|
|
|
|
|
|
|
|
|
| |
|
At Redwood
|
|
|
New
Sequoia
|
|
|
Other Consolidated Entities
|
|
|
Intercompany
|
|
|
Redwood Consolidated
|
|
|
Residential real estate loans
|
|
$ |
55 |
|
|
$ |
408 |
|
|
$ |
3,333 |
|
|
$ |
- |
|
|
$ |
3,796 |
|
|
Commercial real estate loans
|
|
|
42 |
|
|
|
|
|
|
|
20 |
|
|
|
|
|
|
|
62 |
|
|
Real estate securities
|
|
|
788 |
|
|
|
- |
|
|
|
316 |
|
|
|
- |
|
|
|
1,104 |
|
|
Investments in New Sequoia
|
|
|
39 |
|
|
|
- |
|
|
|
- |
|
|
|
(39 |
) |
|
|
- |
|
|
Investment in Other Consolidated Entities
|
|
|
71 |
|
|
|
- |
|
|
|
- |
|
|
|
(71 |
) |
|
|
- |
|
|
Cash and cash equivalents
|
|
|
220 |
|
|
|
- |
|
|
|
- |
|
|
|
- |
|
|
|
220 |
|
|
Total earning assets
|
|
|
1,215 |
|
|
|
408 |
|
|
|
3,669 |
|
|
|
(110 |
) |
|
|
5,182 |
|
| |
|
|
|
|
|
|
|
|
|
|
|
|
|
|
|
|
|
|
|
|
|
Other assets
|
|
|
34 |
|
|
|
4 |
|
|
|
63 |
|
|
|
- |
|
|
|
101 |
|
| |
|
|
|
|
|
|
|
|
|
|
|
|
|
|
|
|
|
|
|
|
|
Total assets
|
|
$ |
1,249 |
|
|
$ |
412 |
|
|
$ |
3,732 |
|
|
$ |
(110 |
) |
|
$ |
5,283 |
|
|
Short-term debt
|
|
$ |
- |
|
|
$ |
- |
|
|
$ |
- |
|
|
$ |
- |
|
|
$ |
- |
|
|
Other liabilities
|
|
|
34 |
|
|
|
- |
|
|
|
70 |
|
|
|
- |
|
|
|
104 |
|
|
Asset-backed securities issued
|
|
|
- |
|
|
|
373 |
|
|
|
3,584 |
|
|
|
- |
|
|
|
3,957 |
|
|
Long-term debt
|
|
|
140 |
|
|
|
- |
|
|
|
- |
|
|
|
- |
|
|
|
140 |
|
|
Total liabilities
|
|
|
174 |
|
|
|
373 |
|
|
|
3,654 |
|
|
|
- |
|
|
|
4,201 |
|
| |
|
|
|
|
|
|
|
|
|
|
|
|
|
|
|
|
|
|
|
|
|
Stockholders’ equity
|
|
|
1,075 |
|
|
|
39 |
|
|
|
71 |
|
|
|
(110 |
) |
|
|
1,075 |
|
|
Noncontrolling interest
|
|
|
- |
|
|
|
- |
|
|
|
7 |
|
|
|
- |
|
|
|
7 |
|
|
Total equity
|
|
|
1,075 |
|
|
|
39 |
|
|
|
78 |
|
|
|
(110 |
) |
|
|
1,082 |
|
| |
|
|
|
|
|
|
|
|
|
|
|
|
|
|
|
|
|
|
|
|
|
Total liabilities and equity
|
|
$ |
1,249 |
|
|
$ |
412 |
|
|
$ |
3,732 |
|
|
$ |
(110 |
) |
|
$ |
5,283 |
|
|
|
We present this table to highlight the impact that consolidation has on our GAAP balance sheet. As shown, Redwood’s $110 million GAAP investment in the consolidated entities (including the consolidated entities we refer to as New Sequoia) increased our consolidated assets by $4.1 billion and liabilities by $4.0 billion.
|
|
|
We are required under GAAP to consolidate all of the assets and liabilities of the Fund (due to our significant general and limited partnership interests in the Fund and ongoing asset management responsibilities) and certain Sequoia and Acacia securitization entities that are treated as secured borrowing transactions. However, the securitized assets of these entities are not available to Redwood. Similarly, the liabilities of these entities are obligations payable only from the cash flow generated by their securitized assets and are not obligations of Redwood.
|
|
|
The consolidating balance sheet presents the New Sequoia securitization entities separately from Other Consolidated Entities to highlight our renewed focus on growing our core business of creating residential credit investments. As we complete additional securitizations, we expect New Sequoia securitization entities to represent a larger portion of our consolidated balance sheet as prior Sequoia securitization entities continue to pay down.
|
|
12
|
THE REDWOOD REVIEW 1ST QUARTER 2011
|
|
|
|
|
FINANCIAL INSIGHTS
|
Balance Sheet (continued)
Real Estate Loans
|
|
At March 31, 2011, we had $55 million of residential real estate loans, compared to $255 million at December 31, 2010. The decline reflects the $295 million residential loan securitization we completed in the first quarter. We intend to securitize most of the residential loans (and others we have identified for future acquisition), at which point they will be reflected in the “New Sequoia” column on the consolidating balance sheet shown on page 12.
|
|
|
At March 31, 2011, we had $42 million of commercial real estate loans held for investment, compared to $30 million at December 31, 2010. We started originating commercial loans in the fourth quarter of 2010 and we intend to hold these loans for investment. See the Commercial Real Estate module on page 31 for more information.
|
Real Estate Securities
|
|
The following table presents the fair value (which equals GAAP carrying value) of real estate securities at Redwood at March 31, 2011. We segment our securities portfolio by vintage (the year(s) the securities were issued), priority of cash flow (senior, re-REMIC, and subordinate), and by quality of underlying loans (prime and non-prime securities) for residential.
|
| |
|
|
|
|
|
|
|
|
|
|
|
|
|
|
|
|
Real Estate Securities at Redwood
|
|
|
March 31, 2011
|
|
|
($ in millions)
|
|
| |
|
|
|
|
|
|
|
|
|
|
|
|
|
% of Total
|
|
| |
|
<=2004
|
|
|
2005
|
|
|
|
2006-2008 |
|
|
Total
|
|
|
Securities
|
|
| |
|
|
|
|
|
|
|
|
|
|
|
|
|
|
|
|
|
Residential
|
|
|
|
|
|
|
|
|
|
|
|
|
|
|
|
|
|
Seniors
|
|
|
|
|
|
|
|
|
|
|
|
|
|
|
|
|
|
Prime
|
|
$ |
13 |
|
|
$ |
222 |
|
|
$ |
71 |
|
|
$ |
306 |
|
|
|
39 |
% |
|
Non-prime(1)
|
|
|
113 |
|
|
|
198 |
|
|
|
6 |
|
|
|
317 |
|
|
|
40 |
% |
|
Total Seniors
|
|
$ |
126 |
|
|
$ |
420 |
|
|
$ |
77 |
|
|
$ |
623 |
|
|
|
79 |
% |
| |
|
|
|
|
|
|
|
|
|
|
|
|
|
|
|
|
|
|
|
|
|
Re-REMIC
|
|
|
|
|
|
|
|
|
|
|
|
|
|
|
|
|
|
|
|
|
|
Prime
|
|
$ |
2 |
|
|
$ |
12 |
|
|
$ |
72 |
|
|
$ |
86 |
|
|
|
11 |
% |
|
Total Re-REMIC
|
|
$ |
2 |
|
|
$ |
12 |
|
|
$ |
72 |
|
|
$ |
86 |
|
|
|
11 |
% |
| |
|
|
|
|
|
|
|
|
|
|
|
|
|
|
|
|
|
|
|
|
|
Subordinates
|
|
|
|
|
|
|
|
|
|
|
|
|
|
|
|
|
|
|
|
|
|
Prime
|
|
$ |
47 |
|
|
$ |
7 |
|
|
$ |
5 |
|
|
$ |
59 |
|
|
|
7 |
% |
|
Non-prime(1)
|
|
|
12 |
|
|
|
- |
|
|
|
- |
|
|
|
12 |
|
|
|
2 |
% |
|
Total Subordinates
|
|
$ |
59 |
|
|
$ |
7 |
|
|
$ |
5 |
|
|
$ |
71 |
|
|
|
9 |
% |
| |
|
|
|
|
|
|
|
|
|
|
|
|
|
|
|
|
|
|
|
|
|
Total Residential
|
|
$ |
187 |
|
|
$ |
439 |
|
|
$ |
154 |
|
|
$ |
780 |
|
|
|
99 |
% |
| |
|
|
|
|
|
|
|
|
|
|
|
|
|
|
|
|
|
|
|
|
|
Commercial subordinates
|
|
$ |
6 |
|
|
$ |
1 |
|
|
$ |
- |
|
|
$ |
7 |
|
|
|
1 |
% |
|
CDO subordinates
|
|
$ |
- |
|
|
$ |
1 |
|
|
$ |
- |
|
|
$ |
1 |
|
|
|
0 |
% |
| |
|
|
|
|
|
|
|
|
|
|
|
|
|
|
|
|
|
|
|
|
|
Total real estate securities
|
|
$ |
193 |
|
|
$ |
441 |
|
|
$ |
154 |
|
|
$ |
788 |
|
|
|
100 |
% |
|
(1) Non-prime residential securities consist of $327 million of Alt-A senior and subordinate and $2 million of subprime subordinate securities.
|
THE REDWOOD REVIEW 1ST QUARTER 2011
|
13
|
|
|
|
FINANCIAL INSIGHTS
|
Balance Sheet (continued)
Real Estate Securities (continued)
|
|
The table below details the change in fair value of securities at Redwood during the first quarter of 2011 and fourth quarter of 2010. |
| |
|
|
|
|
|
|
|
Real Estate Securities at Redwood
|
|
|
($ in millions)
|
|
| |
|
|
|
|
|
|
| |
|
Three Months Ended
|
|
| |
|
3/31/2011
|
|
|
12/31/2010
|
|
|
Beginning fair value
|
|
$ |
823 |
|
|
$ |
797 |
|
| |
|
|
|
|
|
|
|
|
|
Acquisitions
|
|
|
13 |
|
|
|
26 |
|
|
Sales
|
|
|
(35 |
) |
|
|
- |
|
|
Effect of principal payments
|
|
|
(23 |
) |
|
|
(29 |
) |
|
Change in fair value, net
|
|
|
10 |
|
|
|
29 |
|
| |
|
|
|
|
|
|
|
|
|
Ending fair value
|
|
$ |
788 |
|
|
$ |
823 |
|
|
u
|
Our acquisitions in the first quarter included $3 million of prime senior securities and $10 million of prime subordinate securities and were all from 2005 and earlier vintages.
|
|
|
From the end of the first quarter of 2011 through April 30, we did not acquire or sell any securities at Redwood.
|
Investments in the Fund and the Securitization Entities
|
|
The estimated carrying value of our investments in the Sequoia and Acacia entities and the Fund totaled $110 million, or 10% of our equity at March 31, 2011.
|
|
|
The estimated carrying value and management’s estimate of non-GAAP economic value of our investment in the Fund was $11 million. The Fund is primarily invested in non-prime residential securities and is managed by a subsidiary of Redwood. Our investment represents a 52% interest in the Fund.
|
|
u
|
At March 31, 2011, the estimated carrying value of our investments in Sequoia entities was $97 million and management’s estimate of the non-GAAP economic value was $93 million. The $97 million estimate of carrying value represents the difference between the carrying costs of the assets ($3.8 billion at March 31,2011) and liabilities ($3.7 billion at March 31, 2011) owned at the consolidated Sequoia entities. The $93 million estimate of economic value consists of $52 million of interest-only securities (IOs) and $41 million of senior and subordinate securities and is calculated using the same valuation process that we follow to fair value our other real estate securities.
|
|
|
At March 31, 2011, the estimated carrying value of our investments in the Acacia entities was $2 million and management’s estimate of the non-GAAP economic value was $1 million. The economic value primarily reflects the present value of management fees we expect to receive from Acacia entities. The equity interests and securities we own in the Acacia entities have minimal value.
|
|
14
|
THE REDWOOD REVIEW 1ST QUARTER 2011
|
|
|
|
|
FINANCIAL INSIGHTS
|
Balance Sheet (continued)
|
u
|
At March 31, 2011, we did not have any short-term debt outstanding, compared to $44 million at December 31, 2010. We use short-term debt to finance the acquisition of residential mortgage loans prior to securitizing them through our Sequoia securitization platform. In early March 2011, we completed a securitization of $295 million of mortgage loans and repaid our short-term debt from the proceeds. Subsequent to March 2011, we have been using our excess cash to fund the residential mortgage loans we have been acquiring since our last securitization.
|
|
|
If we utilize short-term debt to finance the acquisition of loans for securitization in the near future, we currently plan to use short-term repurchase facilities collateralized by our securities because it is currently an efficient funding mechanism for us. This is the same type of short-term debt financing we recently used to finance the acquisition of some of the loans we securitized in March 2011. In the future, if warehousing facilities become a more efficient source of short-term financing, we may utilize such borrowing facilities.
|
|
|
At March 31, 2011, we had $140 million of long-term debt outstanding with a stated interest rate of three-month LIBOR plus 225 basis points due in 2037. In 2010, we effectively fixed the interest rate on this long-term debt at a rate of approximately 6.75% through interest rate swaps.
|
|
|
We calculated the $81 million estimate of non-GAAP economic value of this long-term debt based on its stated interest rate using the same valuation process used to fair value our other financial assets and liabilities.
|
THE REDWOOD REVIEW 1ST QUARTER 2011
|
15
|
|
|
|
FINANCIAL INSIGHTS
|
Balance Sheet (continued)
|
u
|
At March 31, 2011, our total capital was $1.2 billion, including $1.1 billion of shareholders’ equity and $140 million of long-term debt. We use our capital to invest in earning assets, meet lender capital requirements, and to fund our operations and working capital needs.
|
|
|
We manage our capital through our risk-adjusted capital policy, which has served us well since the company was founded. We have successfully managed through two tumultuous periods (1998 and 2008) and we remain thoughtful about managing funding risk when we use short-term debt.
|
|
|
Our cash balance was $220 million at March 31, 2011. We hold cash for two main reasons. First, we hold sufficient cash to comply with covenants, to meet potential margin calls, and to cover near-term cash operating expenses. Second, we hold cash in anticipation of having opportunities to invest at attractive yields.
|
|
|
Cash was a good barometer of our ability to invest when we used only cash to fund long-term investments. We are now using cash and short-term borrowings to fund the accumulation of loans on a temporary basis. Thus, the amount of reported cash alone tells us little about the capital we have available for long-term investments.
|
|
|
We estimate that our short-term investment capacity was $249 million at March 31, 2011, up from $224 million at December 31, 2010. This capacity to make long-term investments equals the amount of cash we have, plus the cash we estimate could be readily available to us by financing our residential loans held for securitization with short-term borrowings, less the amount of cash we set aside for operating expenses, pending trades, and potential margin requirements.
|
|
u
|
In the near term, we do not anticipate a need to raise equity. Although we plan to invest much of our excess capital in 2011, we are more likely to look to our residential securities portfolio as a source of liquidity through a possible re-securitization or sale or by applying term leverage to our commercial loans at an appropriate time. We always retain the flexibility to raise equity capital in the future, but we ask shareholders for new capital only when we believe we have accretive investment opportunities that exceed our longer-term investment capacity.
|
|
16
|
THE REDWOOD REVIEW 1ST QUARTER 2011
|
|
|
|
|
FINANCIAL INSIGHTS
|
GAAP Income
|
|
The following table provides a summary of our consolidated GAAP income for the first quarter of 2011 and fourth quarter of 2010.
|
| |
|
|
|
|
|
|
|
GAAP Income
|
|
|
($ in millions, except per share data)
|
|
| |
|
Three Months Ended
|
|
| |
|
3/31/2011
|
|
|
12/31/2010
|
|
|
Interest income
|
|
$ |
54 |
|
|
$ |
56 |
|
|
Interest expense
|
|
|
(22 |
) |
|
|
(22 |
) |
|
Net interest income
|
|
|
32 |
|
|
|
34 |
|
| |
|
|
|
|
|
|
|
|
|
Provision for loan losses
|
|
|
(3 |
) |
|
|
(8 |
) |
|
Market valuation adjustments, net
|
|
|
(6 |
) |
|
|
- |
|
|
Net interest income after provision and market valuation adjustments
|
|
|
24 |
|
|
|
26 |
|
| |
|
|
|
|
|
|
|
|
|
Operating expenses
|
|
|
(12 |
) |
|
|
(13 |
) |
|
Realized gains on sales and calls, net
|
|
|
4 |
|
|
|
2 |
|
|
Noncontrolling interest
|
|
|
2 |
|
|
|
- |
|
|
Provision for income taxes
|
|
|
(0 |
) |
|
|
- |
|
| |
|
|
|
|
|
|
|
|
|
GAAP income
|
|
$ |
18 |
|
|
$ |
15 |
|
| |
|
|
|
|
|
|
|
|
|
GAAP income per share
|
|
$ |
0.22 |
|
|
$ |
0.18 |
|
|
u
|
Our consolidated GAAP income for the first quarter was $18 million, or $0.22 per share, as compared to $15 million or $0.18 per share, for the previous quarter. The increase was primarily a result of lower provision for loan losses due to reduced borrower defaults on loans held at the Sequoia securitization entities, along with an increase in realized gains on sales of securities at Redwood. These increases were partially offset by lower net interest income at consolidated entities due to lower balances of loans and securities and higher negative market valuation adjustments on securities and derivatives.
|
|
|
Additional information related to GAAP income at Redwood, New Sequoia, and Other Consolidated Entities is discussed in the following pages.
|
THE REDWOOD REVIEW 1ST QUARTER 2011
|
17
|
|
|
|
FINANCIAL INSIGHTS
|
GAAP Income (continued)
Summary (continued)
|
|
The following tables show the estimated effect that Redwood, New Sequoia, and our Other Consolidated Entities had on GAAP income for the first quarter of 2011 and fourth quarter of 2010. These components of our income statement are not separate business segments.
|
| |
|
|
|
|
|
|
|
|
|
|
|
|
|
|
|
|
Consolidating Income Statement
|
|
|
Three Months Ended March 31, 2011
|
|
|
($ in millions)
|
|
| |
|
|
|
|
|
|
|
|
|
|
|
|
|
|
|
| |
|
At Redwood
|
|
|
New Sequoia
|
|
|
Other Consolidated Entities
|
|
|
Intercompany Adjustments
|
|
|
Redwood Consolidated
|
|
|
Interest income
|
|
$ |
16 |
|
|
$ |
3 |
|
|
$ |
25 |
|
|
$ |
- |
|
|
$ |
43 |
|
|
Net discount (premium) amortization
|
|
|
12 |
|
|
|
- |
|
|
|
(1 |
) |
|
|
- |
|
|
|
11 |
|
|
Total interest income
|
|
|
28 |
|
|
|
3 |
|
|
|
24 |
|
|
|
- |
|
|
|
54 |
|
| |
|
|
|
|
|
|
|
|
|
|
|
|
|
|
|
|
|
|
|
|
|
Interest expense
|
|
|
(3 |
) |
|
|
(2 |
) |
|
|
(17 |
) |
|
|
- |
|
|
|
(22 |
) |
|
Net interest income
|
|
|
26 |
|
|
|
0 |
|
|
|
6 |
|
|
|
- |
|
|
|
32 |
|
| |
|
|
|
|
|
|
|
|
|
|
|
|
|
|
|
|
|
|
|
|
|
Provision for loan losses
|
|
|
- |
|
|
|
(0 |
) |
|
|
(3 |
) |
|
|
- |
|
|
|
(3 |
) |
|
Market valuation adjustments, net
|
|
|
1 |
|
|
|
- |
|
|
|
(7 |
) |
|
|
- |
|
|
|
(6 |
) |
|
Net interest income (loss) after provision and market valuation adjustments
|
|
|
26 |
|
|
|
0 |
|
|
|
(3 |
) |
|
|
- |
|
|
|
24 |
|
| |
|
|
|
|
|
|
|
|
|
|
|
|
|
|
|
|
|
|
|
|
|
Operating expenses
|
|
|
(11 |
) |
|
|
- |
|
|
|
(0 |
) |
|
|
- |
|
|
|
(12 |
) |
|
Realized gains on sales and calls, net
|
|
|
7 |
|
|
|
- |
|
|
|
(3 |
) |
|
|
- |
|
|
|
4 |
|
|
Income from New Sequoia
|
|
|
0 |
|
|
|
- |
|
|
|
- |
|
|
|
(0 |
) |
|
|
- |
|
|
Loss from Other Consolidated Entities
|
|
|
(4 |
) |
|
|
- |
|
|
|
- |
|
|
|
4 |
|
|
|
- |
|
|
Noncontrolling interest
|
|
|
- |
|
|
|
- |
|
|
|
2 |
|
|
|
- |
|
|
|
2 |
|
|
Provision for income taxes
|
|
|
(0 |
) |
|
|
- |
|
|
|
- |
|
|
|
- |
|
|
|
(0 |
) |
| |
|
|
|
|
|
|
|
|
|
|
|
|
|
|
|
|
|
|
|
|
|
Net income (loss)
|
|
$ |
18 |
|
|
$ |
0 |
|
|
$ |
(4 |
) |
|
$ |
4 |
|
|
$ |
18 |
|
| |
|
|
|
|
|
|
|
|
|
|
|
|
|
|
|
|
Consolidating Income Statement
|
|
|
Three Months Ended December 31, 2010
|
|
|
($ in millions)
|
|
| |
|
|
|
|
|
|
|
|
|
|
|
|
|
|
|
| |
|
At Redwood
|
|
|
New Sequoia
|
|
|
Other Consolidated Entities
|
|
|
Intercompany Adjustments
|
|
|
Redwood Consolidated
|
|
|
Interest income
|
|
$ |
16 |
|
|
$ |
2 |
|
|
$ |
27 |
|
|
$ |
- |
|
|
$ |
45 |
|
|
Net discount (premium) amortization
|
|
|
12 |
|
|
|
- |
|
|
|
(1 |
) |
|
|
- |
|
|
|
11 |
|
|
Total interest income
|
|
|
28 |
|
|
|
2 |
|
|
|
26 |
|
|
|
- |
|
|
|
56 |
|
| |
|
|
|
|
|
|
|
|
|
|
|
|
|
|
|
|
|
|
|
|
|
Interest expense
|
|
|
(3 |
) |
|
|
(1 |
) |
|
|
(18 |
) |
|
|
- |
|
|
|
(22 |
) |
|
Net interest income
|
|
|
25 |
|
|
|
1 |
|
|
|
8 |
|
|
|
- |
|
|
|
34 |
|
| |
|
|
|
|
|
|
|
|
|
|
|
|
|
|
|
|
|
|
|
|
|
Provision for loan losses
|
|
|
- |
|
|
|
- |
|
|
|
(8 |
) |
|
|
- |
|
|
|
(8 |
) |
|
Market valuation adjustments, net
|
|
|
2 |
|
|
|
- |
|
|
|
(2 |
) |
|
|
- |
|
|
|
- |
|
|
Net interest income (loss) after provision and market valuation adjustments
|
|
|
27 |
|
|
|
1 |
|
|
|
(2 |
) |
|
|
- |
|
|
|
26 |
|
| |
|
|
|
|
|
|
|
|
|
|
|
|
|
|
|
|
|
|
|
|
|
Operating expenses
|
|
|
(13 |
) |
|
|
- |
|
|
|
- |
|
|
|
- |
|
|
|
(13 |
) |
|
Realized gains on sales and calls, net
|
|
|
1 |
|
|
|
- |
|
|
|
1 |
|
|
|
- |
|
|
|
2 |
|
|
Income from New Sequoia
|
|
|
1 |
|
|
|
- |
|
|
|
- |
|
|
|
(1 |
) |
|
|
- |
|
|
Loss from Other Consolidated Entities
|
|
|
(1 |
) |
|
|
- |
|
|
|
- |
|
|
|
1 |
|
|
|
- |
|
|
Noncontrolling interest
|
|
|
- |
|
|
|
- |
|
|
|
- |
|
|
|
- |
|
|
|
- |
|
|
Provision for income taxes
|
|
|
- |
|
|
|
- |
|
|
|
- |
|
|
|
- |
|
|
|
- |
|
| |
|
|
|
|
|
|
|
|
|
|
|
|
|
|
|
|
|
|
|
|
|
Net income (loss)
|
|
$ |
15 |
|
|
$ |
1 |
|
|
$ |
(1 |
) |
|
$ |
- |
|
|
$ |
15 |
|
|
18
|
THE REDWOOD REVIEW 1ST QUARTER 2011
|
GAAP Income (continued)
Redwood Parent
|
|
Net interest income at Redwood was $26 million in both the first quarter and previous quarter.
|
|
|
Total interest income from residential securities decreased $1 million to $24 million during the first quarter as a result of slightly lower prepayment speeds on various senior securities. The amount of income we recognize on senior securities is generally most sensitive to changes in prepayment rates, and to a lesser extent, changes in interest rates and credit performance.
|
|
|
In the near term, we expect interest income to be derived primarily from our residential securities. In future periods, we expect our expanding residential and commercial loan businesses to contribute more significantly to interest income.
|
|
|
During the first quarter, loans accumulated for securitization generated $2 million of interest income, similar to the amount generated in the previous quarter. The amount of interest income we earn in future periods from loans accumulated for securitization will vary with the amount of loans acquired, and the timing of the loan acquisitions and securitizations.
|
|
|
Interest expense totaled $3 million for the first quarter, primarily related to our long-term debt and corresponding hedges. To hedge the variability in our long-term debt interest expense, we entered into interest rate swaps with aggregate notional values totaling the face amount of our long-term borrowings during the first quarter of 2010, fixing our gross interest expense yield at 6.75%. These swaps are accounted for as cash flow hedges with all interest expense recorded as a component of net interest income, and other valuation changes recorded as a component of equity through the life of the hedge.
|
|
|
Net positive market valuation adjustments were $1 million for the first quarter. These were the result of a $3 million increase in the value of derivatives used to manage certain risks associated with our accumulation of residential loans. Partially offsetting this positive change were impairments of $1 million and a $1 million decline in the value of certain residential securities we mark-to-market through the income statement.
|
|
|
During the first quarter, we recognized $7 million of gains on sold and called securities, a $6 million increase from the previous quarter due to increased sale activity.
|
THE REDWOOD REVIEW 1ST QUARTER 2011
|
19
|
GAAP Income (continued)
Redwood Parent (continued)
|
|
The following table presents the components of operating expenses at Redwood for the first quarter of 2011 and fourth quarter of 2010.
|
| |
|
|
|
|
|
|
|
Operating Expenses at Redwood
|
|
|
($ in millions)
|
|
| |
|
Three Months Ended
|
|
| |
|
3/31/2011
|
|
|
12/31/2010
|
|
|
Fixed compensation expense
|
|
$ |
4 |
|
|
$ |
3 |
|
|
Variable compensation expense
|
|
|
1 |
|
|
|
2 |
|
|
Equity compensation expense
|
|
|
2 |
|
|
|
2 |
|
|
Total compensation expense
|
|
$ |
7 |
|
|
$ |
7 |
|
| |
|
|
|
|
|
|
|
|
|
Systems
|
|
|
2 |
|
|
|
2 |
|
|
Office costs
|
|
|
2 |
|
|
|
2 |
|
|
Accounting and legal
|
|
|
1 |
|
|
|
2 |
|
|
Total non-compensation expense
|
|
$ |
5 |
|
|
$ |
6 |
|
| |
|
|
|
|
|
|
|
|
|
Total operating expense
|
|
$ |
12 |
|
|
$ |
13 |
|
|
|
In the first quarter, operating expenses at Redwood were $12 million and remained in line with our expectations.
|
New Sequoia
|
|
Information about New Sequoia’s contribution to Redwood’s earnings and other related comments are in the Investments in New Sequoia module on page 26.
|
Other Consolidated Entities
|
|
We recognized a net loss of $4 million for the first quarter from our investments in the Fund, Legacy Sequoia and Acacia securitization entities, as compared to a net loss of $1 million for the previous quarter. Net income at other consolidated entities will vary from period to period and depend primarily on the net effect of changes in the market values trading securities, risk management and ABS issued at Acacia, changes in the levels of delinquencies and loss severities for loans held-for-investment, and changes in the rates of principal repayments or the investments held at these entities. The loss at other consolidated entities in the first quarter was primarily the result of lower net interest income at most consolidated entities, increased negative market valuation adjustments at the Acacia entities, and losses on the sales of certain securities at the Fund. This loss was partially offset by a lower provision for loan losses at Legacy Sequoia entities.
|
|
|
The allowance for loan losses as a percent of serious delinquencies decreased to 46% at the end of the first quarter from 47% at the end of the previous quarter. There are currently ten Sequoia entities for which we have aggregate loan loss reserves of $5 million in excess of the estimated carrying values of our investments in these entities, an amount we expect to recover in future periods upon the payoff or deconsolidation of those entities. We did not deconsolidate any Sequoia entities in the first quarter.
|
|
20
|
THE REDWOOD REVIEW 1ST QUARTER 2011
|
Taxable Income and Dividends
Summary
As a REIT, Redwood is required to distribute to shareholders at least 90% of its REIT taxable income (and meet certain other requirements), although Redwood’s board of directors can declare dividends in excess of this minimum requirement. REIT taxable income is defined as income as calculated for tax that is earned at Redwood and its qualified REIT subsidiaries. Redwood also earns taxable income at its taxable subsidiaries, which it is not required to distribute. To the extent Redwood retains taxable income that is not distributed to shareholders, it is taxed at corporate tax rates. A reconciliation of GAAP and taxable income is set forth in Table 2 in the Financial Tables in this Review.
Overview
|
|
Redwood’s estimated taxable income for the first quarter of 2011 was $5 million, or $0.06 per share, as compared to an estimated taxable loss of $6 million, or $0.07 per share, for the fourth quarter of 2010.
|
|
|
Credit losses declined in the first quarter and continue to be a significant driver of our taxable results and account for the majority of the difference between GAAP and taxable income. In the first quarter of 2011, credit losses as calculated for tax purposes totaled $15 million, compared to $20 million in the fourth quarter, and were charged directly to taxable earnings since the tax code does not allow for the establishment of credit reserves.
|
|
|
We believe it is likely that we will report a taxable loss for the full year in 2011 since we anticipate an additional $169 million of credit losses on securities in future periods for tax purposes. However, the timing of credit losses on securities we own has a large impact on our taxable income. As long as losses continue to be delayed as a result of loan modifications, mortgage servicing related issues, or for other reasons, the realization of these anticipated losses will take longer than if the pace of foreclosure activity increases. In the interim, we will continue to earn interest on the majority of these securities.
|
|
|
On March 10, 2011, our board of directors declared a regular dividend of $0.25 per share for the first quarter, which was paid on April 21, 2011 to shareholders of record on March 31, 2011. In November 2010, the board of directors announced its intention to continue to pay a regular dividend of $0.25 per share per quarter in 2011.
|
|
|
The characterization of our 2011 dividend for tax purposes as either ordinary income, capital gains, or return of capital will depend upon numerous factors, including the amount of earnings and any net capital gains (for tax purposes) we generate during the year. At this time, it is too early to characterize the potential tax status of our 2011 dividends.
|
THE REDWOOD REVIEW 1ST QUARTER 2011
|
21
|
|
|
|
FINANCIAL INSIGHTS
|
Cash Flow
|
|
In the first quarter, our cash flow was in line with our expectations.
|
|
|
The sources and uses of cash in the table below are derived from our GAAP Consolidated Statements of Cash Flow for the first quarter of 2011 and fourth quarter of 2010 by aggregating and netting all items in a manner consistent with the way management analyzes them. This table excludes the gross cash flow generated by our Sequoia and Acacia securitization entities and the Fund (cash flow that is not available to Redwood), but does include the cash flow distributed to Redwood as a result of our investments in these entities. The beginning and ending cash balances presented in the table below are GAAP amounts.
|
| |
|
|
|
|
|
|
|
Redwood
|
|
|
Sources and Uses of Cash
|
|
|
($ in millions)
|
|
| |
|
Three Months Ended
|
|
| |
|
3/31/2011
|
|
|
12/31/2010 |
|
| |
|
|
|
|
|
|
|
Beginning cash balance
|
|
$ |
47 |
|
|
$ |
189 |
|
|
Sources of cash(1)
|
|
|
|
|
|
|
|
|
|
Loans at Redwood
|
|
|
6 |
|
|
|
6 |
|
|
Proceeds from securitization
|
|
|
296 |
|
|
|
- |
|
|
Securities at Redwood - principal and interest
|
|
|
|
|
|
|
Residential senior
|
|
|
33 |
|
|
|
42 |
|
|
Residential re-REMIC
|
|
|
2 |
|
|
|
2 |
|
|
Residential subordinate
|
|
|
9 |
|
|
|
8 |
|
|
Commercial and CDO
|
|
|
- |
|
|
|
1 |
|
|
Sales of securities (2)
|
|
|
30 |
|
|
|
- |
|
|
Investments in Consolidated Entities
|
|
|
15 |
|
|
|
11 |
|
|
Short-term debt financing
|
|
|
- |
|
|
|
44 |
|
|
Derivative margin returned, net
|
|
|
3 |
|
|
|
26 |
|
|
Changes in working capital
|
|
|
3 |
|
|
|
3 |
|
|
Total sources of cash
|
|
|
397 |
|
|
|
143 |
|
| |
|
|
|
|
|
|
|
|
|
Uses of cash
|
|
|
|
|
|
|
|
|
|
Acquisitions of residential loans
|
|
|
(101 |
) |
|
|
(195 |
) |
|
Originations of commercial loans
|
|
|
(12 |
) |
|
|
(30 |
) |
|
Acquisitions of securities(3)
|
|
|
(13 |
) |
|
|
(29 |
) |
|
Investment in New Sequoia
|
|
|
(15 |
) |
|
|
- |
|
|
Short-term debt repayment
|
|
|
(44 |
) |
|
|
- |
|
|
Cash operating expenses
|
|
|
(17 |
) |
|
|
(9 |
) |
|
Interest expense on long-term debt
|
|
|
(2 |
) |
|
|
(2 |
) |
|
Dividends
|
|
|
(20 |
) |
|
|
(20 |
) |
|
Total uses of cash
|
|
|
(224 |
) |
|
|
(285 |
) |
| |
|
|
|
|
|
|
|
|
|
Net sources (uses) of cash
|
|
$ |
173 |
|
|
$ |
(142 |
) |
|
Ending cash balance
|
|
$ |
220 |
|
|
$ |
47 |
|
|
(1) Cash flow from securities and investments can be volatile from quarter to quarter depending on the level of invested capital, the timing of credit losses, acquisitions, sales, and changes in prepayments and interest rates. Therefore, (i) cash flow generated by these investments is not necessarily reflective of the long-term economic yield we will earn on the investments in a given period; and, (ii) it is difficult to determine what portion of the cash received from an investment is a return “of” principal and what portion is a return “on” principal in a given period.
|
| |
|
(2) Total sales of securities in the first quarter of 2011 were $35 million. Securities sales of $5 million made in the first quarter that did not settle until early April are not reflected in this table.
|
| |
|
(3) Total acquisitions of securities in the fourth quarter of 2010 were $26 million. Securities acquisitions of $3 million made in the third quarter that settled in October are also reflected in this table.
|
|
22
|
THE REDWOOD REVIEW 1ST QUARTER 2011
|
|
|
Total sources of cash in the first quarter amounted to $397 million, compared to $143 million in the fourth quarter. The primary cause of the increase in the first quarter was our most recent residential mortgage securitization, which generated $296 million of proceeds.
|
|
|
Cash generated in the first quarter from our loans and securities at Redwood and our investments in consolidated entities totaled $65 million, compared to $70 million in the fourth quarter. This cash flow from investment continued to comfortably exceed our cash operating expenses of $17 million, interest expense on long-term debt of $2 million, and dividends of $20 million.
|
|
|
Significant uses of cash in the first quarter were $101 million for the acquisition of residential loans, $12 million for the origination of commercial mezzanine loans, $13 million for the acquisition of seasoned RMBS previously issued by third parties, and $15 million for the acquisition of newly issued Sequoia mortgage-backed securities. We also paid off $44 million of short-term debt from the proceeds of the securitization.
|
|
|
Cash flow from securities and investments can be volatile from quarter to quarter depending on the level of invested capital, the timing of credit losses, acquisitions, sales, and changes in prepayments and interest rates.
|
THE REDWOOD REVIEW 1ST QUARTER 2011
|
23
|
 |
|
|
COMMENTS ON RISK RETENTION AND QRM
|
|
|
At the end of the first quarter, a consortium of federal regulators (as required by the Dodd-Frank Act) released a joint Notice of Proposed Rulemaking (NPR) related to securitization. The proposed rule will require securitization sponsors to retain an economic interest in the assets they securitize incentivizing sponsors to control the quality of the assets being securitized and aligning the interests of sponsors with those of investors. In summary, five risk retention methods were proposed along with potential exemptions. The comment period ends on June 10, 2011, with the final rules to be issued perhaps later in the summer. We currently expect that the new mandatory rules for residential mortgage securitizations will go into effect one year after the rules are published in the Federal Register.
|
|
|
It is too early to determine exactly how the NPR will affect Redwood since, not only are the final rules unknown, there is substantial confusion over how to interpret some of the proposed rules. Still, we have some initial thoughts. As we have previously commented, these “rules of the road” are part of what is necessary to restart private residential mortgage securitization, which, we believe, will benefit Redwood in the long-term.
|
|
|
The proposal offers much flexibility in the form of risk retention through five options: 1) vertical slice; 2) horizontal slice; 3) horizontal cash reserve fund; 4) “L” shaped option; and 5) representative sample. Redwood has historically retained a horizontal interest in the securitizations of its Sequoia securitization entity and believes horizontal risk retention is the method that most directly aligns a sponsors’ interests with the investors’ interests. We note the “L” shaped option, which combines the vertical and horizontal options, appears potentially attractive to us.
|
|
|
There are exemptions from required risk retention for both residential and commercial mortgage-backed securitizations. Residential securitizations consisting solely of qualified residential mortgages (QRMs) do not require risk retention. In summary, the NPR defines a QRM as a loan in which the borrower has a minimum 20% cash down payment, good credit, and a manageable debt burden. These standards seem reasonable to us and were common for numerous years before the mortgage and housing-related meltdown. We note there is nothing in the NPR that prohibits lenders from making loans that do not meet the QRM standards.
|
|
|
For commercial mortgage-backed securitizations, to qualify for a risk retention exemption, the underlying mortgage loans also have to meet stringent underwriting conditions that will likely preclude the majority of loans from qualifying. Unlike residential securitizations, sponsors of commercial securitizations do not have to retain risk if it is passed on to a third-party “B-piece” buyer. There are a number of obligations required of the B-piece buyer, such as the requirement to hold the bottom 5% of the securities issued, which would tend to limit the number of B-piece buyers to only those with permanent sources of capital.
|
|
|
For both residential and commercial securitizations, the issue of premium recapture has generated substantial confusion. In summary, the proposed rules attempt to prevent a sponsor from selling Interest-Only (IO) strips (a common by-product of a securitization), which could in certain circumstances enable the sponsor to cash out of the investment despite retaining a 5% risk position. This issue is far more complex than the scope of this module, but has important implications not only for the pricing of both residential and commercial mortgages, but also for the economics of securitization.
|
|
|
Not until clarity around such details emerges and final language is drafted will we be able to determine exactly how the rules will impact our business. Redwood will be submitting a detailed comment letter to the regulatory agencies and will make it publicly available.
|
|
24
|
THE REDWOOD REVIEW 1ST QUARTER 2011
|
|
|
|
RESIDENTIAL MORTGAGE LOAN BUSINESS
|
Summary
We purchase newly originated loans (primarily prime jumbo loans) that meet our collateral criteria from approved lenders on a flow or bulk basis. Loans acquired through this process (our “conduit”) are expected to be securitized through new Sequoia securitization entities. Our conduit allows lenders to reduce their exposure to interest and credit risk associated with residential mortgage loans, free up capital for additional lending, and potentially reduce hedging costs as a result of our price commitments.
Quarterly Update
|
|
At March 31, 2011, residential loans purchased and held on our balance sheet for future securitization decreased to $53 million from $253 million at December 31, 2010 as a result of our first quarter securitization of $295 million of loans. At March 31, 2011, the pipeline of rate-locked residential mortgage loans we plan to purchase through our conduit totaled $137 million. At April 30, 2011, loans purchased and held on our balance sheet for future securitization totaled $87 million and the pipeline totaled $200 million.
|
|
|
The biggest hurdle we are currently facing is our ability to buy loans, which is a result of banks being able to sell 90-95% of their originations to the GSEs and holding onto their non-agency eligible mortgage loan originations to offset weak non-mortgage loan demand. At the end of 2010, the aggregate loan-to-deposit ratio for all FDIC-insured institutions was 78%, down from 94% at the end of 2005 and an average of 89% for the last decade. Banks are also unusually flush with liquidity due to government policy actions. At the end of 2010, excess reserves (that banks have on deposit with the Federal Reserve) totaled $1 trillion compared to only $2 billion at the end of 2005. As of the Fed’s latest report dated April 20, 2011, excess reserves increased to $1.5 trillion. With significant excess liquidity combined with a very steep yield curve, it is easy to understand why many banks are holding onto non-agency mortgage loans that they would typically sell.
|
|
|
We are making good progress signing up lenders, and we have several in various stages of implementation. The process is time consuming and requires substantial efforts on both our part and the lender’s part. We are generally buying longer term 10-year hybrids and 15- and 30-year fixed rate mortgages that are difficult for banks to match fund.
|
|
|
Our goal is to establish our conduit as a leading source of liquidity for the prime jumbo mortgage market, where originators are able to obtain timely and reliable purchase commitment decisions and price protection. Another goal is to establish the Sequoia platform’s reputation among institutional investors as the leading issuer of high-quality private label RMBS, such that investors will know that if they are looking at a Sequoia deal, they will know that Redwood will be standing in front of them in the first loss position, the securitization structure is investor friendly and free of sponsor-servicer conflicts, and there is an alignment of interests.
|
|
|
The size of the jumbo market is potentially vast — suggesting an opportunity that well exceeds our current capital available to invest. For example, if annual residential mortgage originations return to $1.5 trillion and jumbo loans account for 20% (the median from 1993 through 2010), annual jumbo loan originations would amount to $300 billion. With GSE reform, the portion of the mortgage market that could potentially be available to Redwood could be substantially larger if the conforming loan limits are reduced (as the Obama Administration has indicated it intended to do) during the reform transition period, and perhaps still larger if, as part of GSE reform, the concept of conforming limits is eliminated.
|
THE REDWOOD REVIEW 1ST QUARTER 2011
|
25
|
 |
|
| INVESTMENTS IN NEW SEQUOIA |
Summary
This module reflects our investment in Sequoia securitization entities created in 2010 and subsequent periods. Sequoia securitization entities are entities that acquire residential mortgage loans through our conduit and issue asset-backed securities (ABS) backed by these loans. Generally, the loans that New Sequoia entities have acquired are prime-quality loans originated in 2009 and later periods. Most of the senior or investment-grade rated ABS issued by New Sequoia entities are sold to third-party investors; Redwood generally acquires the subordinate or non-investment grade securities and has acquired senior securities and interest-only strips from the New Sequoia entities.
Quarterly Update
|
|
In the first quarter of 2011, we reported GAAP income of less than $1 million from interest on our New Sequoia investments, and these investments generated cash of $2 million, compared to GAAP income of $1 million and cash generated of $3 million in the fourth quarter of 2010.
|
|
|
We completed a $295 million securitization on March 1, 2011. This latest securitization marked our second securitization in the New Sequoia program following our $238 million securitization in April 2010.
|
|
|
At March 31, 2011, our investment in our New Sequoia securitizations totaled $39 million, which includes $15 million we invested in the March 2011 securitization. Our investment consists of senior and subordinate securities and IOs.
|
|
|
For GAAP purposes, we account for Sequoia securitizations in which we have an investment as financings; with the assets and liabilities carried on our balance sheet at their amortized cost. As a result, our $39 million investment in New Sequoia does not appear on our GAAP consolidated balance sheet as an investment; rather, it is reflected as the difference, at March 31, 2011, between the $412 million of consolidated assets of New Sequoia and the $373 million of consolidated ABS issued to third parties. (See Redwood’s consolidating balance sheet on page 12.)
|
|
|
There were no delinquencies in the loans underlying either of our 2010 or 2011 Sequoia securitizations at March 31, 2011.
|
|
26
|
THE REDWOOD REVIEW 1ST QUARTER 2011
|
|
|
|
RESIDENTIAL REAL ESTATE SECURITIES
|
Summary
Redwood invests in securities that are backed by pools of real estate loans. Some of these investments in residential securities consist of senior prime and non-prime securities, and non-senior securities. Residential prime securities are mortgage-backed securities backed by prime residential mortgage loans. Residential non-prime securities are mortgage-backed securities backed by non-prime (Alt-A, Option ARM, and Subprime) residential mortgage loans. Non-senior securities include subordinate and re-REMIC securities.
Senior securities are those interests in a securitization that have the first right to cash flows and are generally last in line to absorb losses. Subordinate securities are those interests in a securitization that have the last right to cash flows and are first in line to absorb losses. A re-REMIC is a resecuritization of asset-backed securities where the cash flow from and any credit losses absorbed by the underlying asset-backed securities are allocated among the securities issued in the resecuritization transaction in a variety of ways.
The following discussion refers only to the residential securities owned by Redwood, exclusive of the securities owned by the Fund, Sequoia entities, and Acacia entities, and exclusive of Redwood’s investments in these entities.
In the Financial Tables in the back of this Review, information on the residential securities we own and underlying loan characteristics are set forth in Tables 5 through 8B.
Quarterly Update
|
|
Interest income generated by our residential AFS securities was $22 million in the first quarter of 2011, resulting in an annualized yield of 13.7% on the amortized cost of these securities.
|
|
|
At March 31, 2011, the fair value of residential securities we own totaled $780 million, consisting of $306 million in prime senior securities, $317 million in non-prime senior securities, $86 million in re-REMIC securities, and $71 million in subordinate securities. Each of these categories is further discussed on the following pages.
|
|
|
At March 31, 2011, 40% of the securities we held were fixed-rate assets, 11% were adjustable-rate assets, 30% were hybrid assets that reset within the next year, 5% were hybrid assets that reset between 12 and 36 months, and 14% were hybrid assets that reset after 36 months.
|
THE REDWOOD REVIEW 1ST QUARTER 2011
|
27
|
 |
|
RESIDENTIAL REAL ESTATE SECURITIES
|
Quarterly Update (continued)
|
|
The following table presents information on residential securities at Redwood at March 31, 2011. For GAAP, we account for the large majority of these securities as available-for-sale (AFS) and others as trading securities, and in both cases the securities are reported at their fair value as of the report date.
|
| |
|
|
|
|
|
|
|
|
|
|
|
|
|
|
|
|
Residential Securities at Redwood
|
|
|
March 31, 2011
|
|
|
($ in millions)
|
|
| |
|
| |
|
Senior
|
|
|
|
|
|
|
|
|
|
|
| |
|
Prime
|
|
|
Non-prime
|
|
|
Re-REMIC
|
|
|
Subordinate
|
|
|
Total
|
|
|
Available-for-sale securities
|
|
|
|
|
|
|
|
|
|
|
|
|
|
|
|
|
Current face
|
|
$ |
346 |
|
|
$ |
373 |
|
|
$ |
132 |
|
|
$ |
288 |
|
|
$ |
1,139 |
|
|
Credit reserve
|
|
|
(17 |
) |
|
|
(17 |
) |
|
|
(46 |
) |
|
|
(189 |
) |
|
|
(269 |
) |
|
Net unamortized discount
|
|
|
(78 |
) |
|
|
(88 |
) |
|
|
(55 |
) |
|
|
(33 |
) |
|
|
(254 |
) |
|
Amortized cost
|
|
|
251 |
|
|
|
268 |
|
|
|
31 |
|
|
|
66 |
|
|
|
616 |
|
| |
|
|
|
|
|
|
|
|
|
|
|
|
|
|
|
|
|
|
|
|
|
Unrealized gains
|
|
|
55 |
|
|
|
31 |
|
|
|
55 |
|
|
|
10 |
|
|
|
151 |
|
|
Unrealized losses
|
|
|
- |
|
|
|
(1 |
) |
|
|
- |
|
|
|
(6 |
) |
|
|
(7 |
) |
| |
|
|
|
|
|
|
|
|
|
|
|
|
|
|
|
|
|
|
|
|
|
Overall credit support to prime senior securities (1)
|
|
|
7.16 |
% |
|
|
14.97 |
% |
|
|
|
|
|
|
|
|
|
|
|
|
|
Serious delinquencies as a % of collateral balance (1)
|
|
|
8.61 |
% |
|
|
13.68 |
% |
|
|
|
|
|
|
|
|
|
|
|
|
| |
|
|
|
|
|
|
|
|
|
|
|
|
|
|
|
|
|
|
|
|
|
Trading securities
|
|
|
- |
|
|
|
19 |
|
|
|
- |
|
|
|
1 |
|
|
|
20 |
|
| |
|
|
|
|
|
|
|
|
|
|
|
|
|
|
|
|
|
|
|
|
|
Fair value of residential securities
|
|
$ |
306 |
|
|
$ |
317 |
|
|
$ |
86 |
|
|
$ |
71 |
|
|
$ |
780 |
|
| |
|
|
|
|
|
|
|
|
|
|
|
|
|
|
|
|
|
|
|
|
|
Fair value as a % of face value(2)
|
|
|
88 |
% |
|
|
80 |
% |
|
|
66 |
% |
|
|
24 |
% |
|
|
67 |
% |
|
Amortized cost as a % of face value(2)
|
|
|
73 |
% |
|
|
72 |
% |
|
|
24 |
% |
|
|
23 |
% |
|
|
54 |
% |
|
(1) Overall credit support and serious delinquency rates are weighted by securitization balances. Credit support and delinquencies may vary significantly by securitization. Serious delinquencies include loans over 90-days past due, in foreclosure, and REO.
|
| |
|
(2) AFS securities only.
|
|
|
The overall credit support data presented in the table above represent the level of support for prime and non-prime senior securities owned at Redwood, weighted by the securitization, or underlying collateral balance rather than the book value or market value of the securities.
|
|
|
At March 31, 2011, the average overall level of credit support for the prime senior securities was 7.16% and for the non-prime senior securities was 14.97% as shown in the table above. For an individual security with these levels of credit support, this would mean that losses experienced on the collateral would have to exceed credit support levels before the security would suffer losses. Comparing the level of credit support available to seriously delinquent loans provides one measure of the level of credit sensitivity that exists within our senior securities portfolio. For example, assuming an individual senior security has the average characteristics of the portfolio, 7.16% of credit support and serious delinquencies of 8.61%, all of the seriously delinquent loans could be liquidated with a 50% severity, generating losses of 4.31%. This hypothetical security would then have 2.85% credit support remaining to absorb future losses, before the senior securities would start to absorb losses.
|
|
|
We emphasize that no individual security has the average characteristics of the portfolio. Individual securities may have more or less credit support than the average, or more or less seriously delinquent loans than the average. As such, certain securities have a more positive credit enhancement to serious delinquency ratio while others have a less positive or negative ratio. As a result, it is possible for some individual securities to incur losses without aggregate portfolio losses exceeding the overall portfolio credit support.
|
|
28
|
THE REDWOOD REVIEW 1ST QUARTER 2011
|
|
|
|
RESIDENTIAL REAL ESTATE SECURITIES
|
Quarterly Update (continued)
|
|
Serious delinquencies in our non-prime senior portfolio are significantly higher than in our prime senior portfolio as shown in the table above. However, the levels of credit and structural support are also significantly higher and, as a result, we believe our non-prime senior portfolio is generally able to withstand the higher levels of credit losses we expect for these pools.
|
|
|
Securities are acquired assuming a range of outcomes based on modeling of expected performance at the individual loan level for both delinquent and current loans. Over time, the performance of these securities may require a change in the amount of credit reserves we designate.
|
|
|
In the first quarter, credit losses totaled $22 million, all of which came from our subordinate securities. In the fourth quarter, credit losses on residential securities totaled $23 million. We expect future losses to extinguish the majority of the subordinate securities as reflected by the $189 million of credit reserves we have provided for the $288 million face value of those securities. Until the losses occur, we will continue to earn interest on the face value of those securities.
|
|
|
Additional information on interest income and yields for our securities portfolio is reported in the Financial Tables in the back.
|
Market Conditions
|
|
Prices for non-agency RMBS rallied higher through February but declined somewhat in March to end the quarter slightly higher overall. In January and February prices were well supported by trading desks looking to add assets to relatively low inventory positions. By early March it appeared evident that the opinions of trading desks and end investors were beginning to diverge as the bid-ask spread widened significantly despite a general decrease in rates during the same period as bad news from both international (Japan, Europe) and domestic (Housing, Budget, Debt Ceiling) sources weighed on the non-agency market. By the end of the quarter, the Federal Reserve Bank of New York announced that it would begin to sell about $16 billion of assets (at market value) out of the Maiden Lane II portfolio and the market rallied into the supply. Prices in mid-April were higher than they were at quarter end.
|
Housing Prices
|
|
Our outlook for housing prices is unchanged from three months ago. Affordability looks better than it has in several years, when considering income and home prices. There is a significant overhang of supply, however, especially when considering “shadow” inventory that is not yet on the market. In addition, tighter underwriting of residential mortgage loans will continue to limit buyers’ ability to obtain desired financing. Nationwide, we believe that home prices have an additional risk of 5% to 10% price declines, with actual declines likely to vary by market and product type. We believe we are in the process of forming a bottom, but do not expect housing, in general, to be a significantly appreciating asset class for several years.
|
THE REDWOOD REVIEW 1ST QUARTER 2011
|
29
|
|
|
RESIDENTIAL REAL ESTATE SECURITIES
|
Delinquencies
|
|
Delinquencies were up slightly in the first quarter, and remain at historically elevated levels. According to LoanPerformance data, serious (60+ day) delinquencies rose by 0.4% quarter over quarter to 11.6% for prime loans and 0.05% quarter over quarter to 33.2% for Alt-A loans. The delinquencies on loans underlying Redwood’s portfolio are modestly lower than the industry as a whole.
|
|
|
Early-stage roll rates (from loans always current to 30 days delinquent) ticked up in the first quarter. Of previously “always current” prime loans, 0.7% missed their first payment in March 2011, up from 0.6% in December 2010, while the same metric for Alt-A loans held steady at 1.4%. Despite this minor increase, these roll rates have improved substantially over the last year, which should eventually cause overall delinquencies to fall. For now, the slowdown in new defaults is being balanced by an extension in liquidation timelines.
|
|
|
Prepayments slowed markedly in the first quarter for all collateral types. Prime borrowers with loan-to-value (LTV) ratios below 100% prepaid at 20% CPR in March (down from 27% in December), while Alt-A borrowers with equity prepaid at only 8% CPR (down from 10%). This decrease was likely due to rising interest rates — according to Freddie Mac, the monthly average rate for new loans rose from 4.41% in the fourth quarter of 2010 to 4.85% in the first quarter of 2011. Borrowers without equity prepaid very slowly regardless of credit quality, with prime and Alt-A loans with LTV ratios above 100% prepaying at only 6% and 1% CPR respectively, in line with the prior quarter.
|
|
30
|
THE REDWOOD REVIEW 1ST QUARTER 2011
|
Summary
Redwood invests in commercial real estate loans and securities. Our commercial investments at Redwood consist of commercial mezzanine loans originated in 2010 and 2011, and subordinate commercial mortgage-backed securities (CMBS) and loans acquired prior to 2008. This discussion is exclusive of commercial securities and loans owned by Acacia entities.
Market Conditions
|
|
Early in 2011, we continue to see some of the same improvements in selected commercial real estate markets and properties we witnessed in 2010. That is, the underlying fundamentals continue to show signs of improvement, especially for certain property types and geographic locations. In many markets, rental rates and property occupancy rates are stabilizing and seem to be increasing in some areas. In addition, there has been an increase in transaction volume for commercial real estate. According to Real Capital Analytics, property sales totaled $31 billion in the first quarter of 2011, up 69% over the same period a year ago.
|
|
|
The commercial mortgage backed securities (CMBS) market continues to see activity, with $8 billion in new deals in the first quarter and a similar amount is forecast by many market participants for the second quarter. As discussed previously, the proposals regarding securitization structures, including risk retention and other factors, may have an impact on this market, but it is too early to know the extent of the impact. Given the demand for newly issued securitizations backed by high-quality collateral, we believe the CMBS market will continue to be a viable and growing method to attract private capital into commercial real estate.
|
|
|
We continue to collaborate with leading financial institutions — banks, life insurance companies, and CMBS lenders — to source attractive high-quality mezzanine and other subordinate debt investments. We are finding that both the amount senior lenders are willing to provide and the yield at which others are willing to provide mezzanine debt are resulting in an increase in competition for the types of loans and risks we are willing to put on our balance sheet. We continue to maintain our disciplined approach to underwriting while looking at an increasing number of opportunities as commercial acquisition and refinance markets see an uptick in activity.
|
Quarterly Update
|
|
At March 31, 2011, our commercial mezzanine portfolio totaled $42 million, consisting of five loans originated in the past six months. On average, these loans have a duration of five years, a loan-to-value ratio of 78%, and a weighted average coupon of 10.4%.
|
|
|
At March 31, 2011, our legacy CMBS investments in commercial had a fair value of $7 million (primarily consisting of 2004 and 2005 vintage subordinate CMBS) and had a face value of $75 million and credit reserves of $65 million. As evidenced by the amount of credit reserves and market value relative to the face value, we expect to incur significant credit losses on these securities and little in future cash flow, but the timing of the cash flow and losses is difficult to forecast and may vary every quarter. We received $1 million of cash from these investments in both the first and fourth quarters. In the first quarter of 2011, losses totaled $9 million compared to $20 million in the prior quarter. During the first quarter we sold one commercial security and realized a gain of $1 million.
|
THE REDWOOD REVIEW 1ST QUARTER 2011
|
31
|
 |
|
LEGACY INVESTMENTS IN OTHER CONSOLIDATED ENTITIES
|
Summary
Prior to 2010, we sponsored Sequoia and Acacia securitization entities that acquired mortgage loans and securities and created and issued ABS backed by these loans and securities. References to Sequoia’s activities prior to 2010 are referred to as “Legacy Sequoia.” Also included in this discussion is the Opportunity Fund. Our Sequoia program is active and issued ABS in 2010 and 2011, which is discussed in the Investments in New Sequoia module.
Quarterly Update
|
|
In the first quarter of 2011, we reported a combined loss of $4 million from Legacy Sequoia and Acacia entities and the Fund, compared to a net loss of $1 million in the fourth quarter of 2010. The increased loss was due to a combination of: 1) a $3 million loss on the sale of assets at the Fund in the first quarter, compared to a $1 million gain in the fourth quarter; 2) $7 million of negative market valuation adjustments in the first quarter, compared to $2 million in the fourth quarter; and 3) a $2 million reduction in net interest income. These amounts were only partially offset by a $5 million reduction in loan loss provision at Sequoia due to better performance.
|
|
|
Cash flow generated from our investments in Legacy Sequoia, Acacia, and the Fund totaled $13 million in the first quarter, compared to $8 million in the fourth quarter. The primary difference between the $4 million GAAP loss and the $13 million in positive cash flow relates to non-cash charges for loan loss provision at Legacy Sequoia entities and market valuation adjustments at Legacy Sequoia and Acacia entities and the Fund.
|
|
|
Cumulative losses for all 52 Legacy Sequoia residential mortgage securitizations sponsored by us (totaling $35 billion at issuance) totaled 0.46% of the original face amount of the securities through March 31, 2011.
|
|
|
The consolidation of the assets and liabilities of securitization entities may lead to potentially volatile reported earnings for a variety of reasons, including the amortization of premium on the loans and liabilities of Sequoia entities, changes in credit loss provisions for loans held by Sequoia entities, fair value adjustments for the assets and liabilities of the Acacia entities, and deconsolidation events.
|
|
32
|
THE REDWOOD REVIEW 1ST QUARTER 2011
|
 |
|
|
ACCOUNTING DISCUSSION
|
Mark-to-Market Valuation Process
|
|
Market values reflect an “exit price,” or the amount we believe we would realize if we sold an asset or would pay if we repurchased a liability in an orderly transaction, even though we generally have no intention — nor would we be required — to sell assets or repurchase liabilities. Establishing market values is inherently subjective and requires us to make a number of assumptions, including the future of interest rates, prepayment rates, discount rates, credit loss rates, and the timing of credit losses. The assumptions we apply are specific to each asset or liability.
|
|
|
We rely on our internal calculations to compute the fair value of our securities and we request and consider indications of value (marks) from third-party dealers to assist us in our mark-to-market valuation process. For March 31, 2011, we received dealer marks on 80% of our securities and 86% of our ABS issued. In the aggregate, our internal valuations of the securities on which we received dealer marks were 2% lower (i.e., more conservative) than the dealer marks and our internal valuations of our ABS issued on which we received dealer marks were 7% higher (i.e., more conservative) than the aggregate dealer marks.
|
Determining Other-Than-Temporary Impairments
|
|
The multi-step process for determining whether an investment security has other-than-temporary impairment is presented below.
|
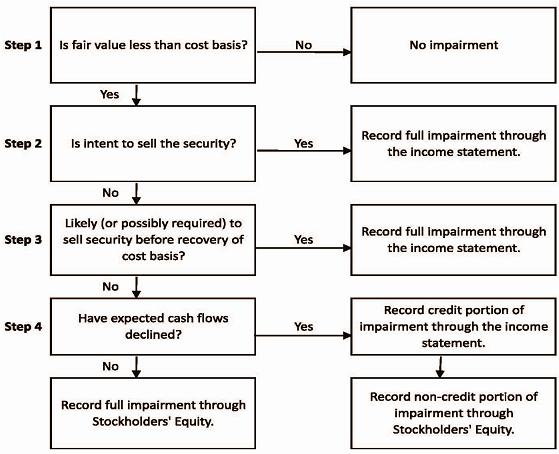
|
34
|
THE REDWOOD REVIEW 1ST QUARTER 2011
|
|
|
 |
|
GLOSSARY
|
ACACIA
Acacia is the brand name for the collateralized debt obligation (CDO) securitizations Redwood sponsored.
ADJUSTABLE-RATE MORTGAGES (ARMs)
Adjustable-rate mortgages are loans that have coupons that adjust at least once per year. We make a distinction between ARMs (loans with a rate adjustment at least annually) and hybrids (loans that have a fixed-rate period of 2 -10 years and then become adjustable-rate).
AGENCY
Agency refers to government-sponsored enterprises (GSEs), including Federal National Mortgage Association (Fannie Mae), Federal Home Loan Mortgage Corporation (Freddie Mac), and Government National Mortgage Association (Ginnie Mae).
ALT-A SECURITIES and ALT-A LOANS
Alt-A securities are residential mortgage-backed securities backed by loans that have higher credit quality than subprime and lower credit quality than prime. Alt-A originally represented loans with alternative documentation, but the definition has shifted over time to include loans with additional risk characteristics and in some cases investor loans. In an Alt-A loan, the borrower’s income may not be verified, and in some cases, may not be disclosed on the loan application. Alt-A loans may also have expanded criteria that allow for higher debt-to-income ratios with higher accompanying loan-to-value ratios than would otherwise be permissible for prime loans.
AMORTIZED COST
Amortized cost is the initial acquisition cost of an available-for-sale (AFS) security, minus principal repayments or principal reductions through credit losses, plus or minus premium or discount amortization. At the point in time an AFS security is deemed other-than-temporarily impaired, the amortized cost is adjusted (by changing the amount of unamortized premium or discount) by the amount of other-than-temporary impairment taken through the income statement.
ASSET-BACKED SECURITIES (ABS)
Asset-backed securities (ABS) are securities backed by financial assets that generate cash flows. Each ABS issued from a securitization entity has a unique priority with respect to receiving principal and interest cash flows and absorbing any credit losses from the assets owned by the entity.
AVAILABLE-FOR-SALE (AFS)
An accounting method for debt and equity securities in which the securities are reported at their fair value on the balance sheet. Positive changes in the fair value are accounted for as increases to stockholders’ equity and do not flow through the income statement. Negative changes in fair value may be recognized through the income statement or balance sheet, as further detailed in the Accounting Discussion module.
BOOK VALUE (GAAP)
Book value is the value of our common equity in accordance with GAAP.
COLLATERALIZED DEBT OBLIGATION (CDO) SECURITIZATIONS
The securitization of a diverse pool of assets.
COMMERCIAL MORTGAGE-BACKED SECURITIES (CMBS)
A type of mortgage-backed security that is secured by one or more loans on commercial properties.
THE REDWOOD REVIEW 1ST QUARTER 2011
|
35
|
|
|
|
GLOSSARY
|
CONSTANT (or CONDITIONAL) PREPAYMENT RATE (CPR)
Constant (or conditional) prepayment rate (CPR) is an industry-standard measure of the speed at which mortgage loans prepay. It approximates the annual percentage rate at which a pool of loans is paying down due to unscheduled principal prepayments.
CORE EQUITY
Core equity is not a measure calculated in accordance with GAAP. GAAP equity includes mark-to-market adjustments for some of our assets and interest rate agreements in “accumulated other comprehensive income (loss).” Core equity excludes accumulated other comprehensive income (loss). Core equity in some ways approximates what our equity value would be if we used historical amortized cost accounting exclusively. A reconciliation of core equity to GAAP appears in the Table 3 in the Financial Tables in this Review.
CREDIT SUPPORT
Credit support is the face amount of securities subordinate (or junior) to the applicable security that protects the security from credit losses and is generally expressed as a percentage of the securitization’s underlying pool balance.
DEBT
Debt is an obligation of Redwood. See Long-term debt and Short-term debt.
ECONOMIC VALUE (MANAGEMENT’S ESTIMATE OF ECONOMIC VALUE)
Economic value closely relates to liquidation value and is calculated using the bid-side marks (or estimated bid-side values) for all of our financial assets, and offered-side marks (or estimated offered-side values) for all of our financial liabilities. We calculate management’s estimate of economic value as a supplemental measure to book value calculated under GAAP. Our economic value estimates on a per-share basis are reconciled to GAAP book values per share in Table 3 in the Financial Tables of this Review.
FASB
Financial Accounting Standards Board.
THE FUND
The Fund refers to the Redwood Opportunity Fund, L.P., which is managed by Redwood Asset Management, Inc., a wholly-owned subsidiary of Redwood.
GAAP
Generally Accepted Accounting Principles in the United States.
GOVERNMENT SPONSORED ENTERPRISE (GSE)
A government sponsored enterprise is a financial services corporation created by the United States Congress to enhance the flow of credit to targeted sectors of the economy. Among the GSEs charted by Congress are Fannie Mae, Freddie Mac, and Ginnie Mae.
INTEREST-ONLY SECURITIES (IOs)
Interest-only securities (IOs) are specialized securities created by securitization entities where the projected cash flows generated by the underlying assets exceed the cash flows projected to be paid to the securities that are issued with principal balances. Typically, IOs do not have a principal balance and they will not receive principal payments. Interest payments to IOs usually equal an interest rate formula multiplied by a “notional” principal balance. The notional principal balances for IOs are typically reduced over time as the actual principal balance of the underlying pool of assets pays down, thus reducing the cash flows to the IOs over time. Cash flows on IOs are typically reduced more quickly when asset prepayments increase.
|
36
|
THE REDWOOD REVIEW 1ST QUARTER 2011
|
|
|
|
|
GLOSSARY
|
INVESTMENT CAPACITY
The amount of capacity we estimate that we have to invest in new assets. It is equal to our (1) cash on hand, plus (2) cash we could raise by increasing short-term borrowings to finance all our residential mortgage loans held for securitization, less (3) cash needed to cover short-term operations, working capital, and a liquidity cushion.
JUMBO LOAN
A jumbo loan is a mortgage loan that generally conforms to the underwriting standards of Fannie Mae and Freddie Mac except that the dollar amount of the loan exceeds the maximum limit set by the two GSEs for loans salable to the two companies.
LEVERAGE RATIOS
When determining Redwood’s financial leverage, traditional leverage ratios may be misleading in some respects if consolidated ABS issued from securitization entities are included as part of Redwood’s obligations when calculating this or similar ratios. Because of the requirement to consolidate the independent securitization entities for GAAP accounting purposes, it appears that Redwood is highly leveraged, with total consolidated liabilities significantly greater than equity. The obligations of these securitization entities are not obligations of Redwood.
LONG-TERM DEBT
Long-term debt is debt that is an obligation of Redwood that is not payable within a year and includes junior subordinated notes and trust preferred securities. We generally treat long-term debt as part of our capital base when it is not payable in the near future.
MARK-TO-MARKET (MTM) ACCOUNTING
Mark-to-market accounting uses estimated fair values of assets, liabilities, and hedges. Many assets on our consolidated balance sheet are carried at their fair value rather than amortized cost. Taxable income is generally not affected by market valuation adjustments.
MARKET VALUATION ADJUSTMENTS (MVAs)
Market valuation adjustments (MVAs) are changes in market values for certain assets and liabilities that are reported through our GAAP income statement. They include all changes in market values for assets and liabilities accounted for at fair value, such as trading securities and derivatives. They also include the credit portion of other-than-temporary impairments on securities available-for-sale, as well as impairments of loans held-for-sale and REO properties.
NON-GAAP METRICS
Not all companies and analysts calculate non-GAAP metrics in the same manner. As a result, certain metrics as calculated by Redwood may not be comparable to similarly titled metrics reported by other companies. Redwood uses non-GAAP metrics such as management’s estimate of economic value and core equity to provide greater transparency for investors. Our non-GAAP metrics are reconciled to GAAP in the Financial Tables in this Review.
NON-PRIME SECURITIES
Non-prime securities are Alt-A, option ARM, and subprime securities. See definitions of Alt-A, option ARM, and subprime securities.
THE REDWOOD REVIEW 1ST QUARTER 2011
|
37
|
|
|
|
GLOSSARY
|
OPTION ARM LOAN
An option ARM loan is a residential mortgage loan that generally offers a borrower monthly payment options such as: 1) a minimum payment that results in negative amortization; 2) an interest-only payment; 3) a payment that would fully amortize the loan over an original 31-year amortization schedule; and, 4) a payment that would fully amortize the loan over a 15-year amortization schedule. To the extent the borrower has chosen an option that is not fully amortizing the loan (or negatively amortizing the loan), after a period — usually five years or once the negatively amortized loan balance reaches a certain level (generally 15% to 25% higher than the original balance) — the loan payments are recast. This recast provision resets the payment at a level that fully amortizes the loan over its remaining life and the new payment may be materially different than under the borrowers’ previous option.
PRIME RESIDENTIAL REAL ESTATE LOANS
Prime loans are residential loans with higher quality credit characteristics, such as borrowers with higher FICO credit scores, lower loan-to-value ratios, lower debt-to-income ratios, greater levels of other assets, and more documentation.
PRIME SECURITIES
Prime securities are residential mortgage-backed securities backed by prime loans, generally with balances greater than conforming loan limits. Prime securities are typically backed by loans that have relatively high weighted average FICO scores (700 or higher), low weighted average LTVs (75% or less), limited concentrations of investor properties, and a low percentages of loans with low FICO scores or high loan-to-value ratios.
PROFITABILITY RATIOS
Many financial institution analysts use asset-based profitability ratios such as interest rate spread and interest rate margin when analyzing financial institutions. These are asset-based measures. Since we consolidate the assets and liabilities of securitization entities for GAAP purposes, our total GAAP assets and liabilities may vary over time, and may not be comparable to assets typically used in profitability calculations for other financial institutions. As a result, we believe equity-based profitability ratios may be more appropriate than asset-based measures for analyzing Redwood’s operations and results. We believe, for example, that net interest income as a percentage of equity is a useful measure of profitability. For operating expenses, we believe useful measures are operating efficiency ratio (operating expenses as a percentage of net interest income) and operating expenses as a percentage of equity. We provide various profitability ratios in Table 4 in the Financial Tables in this Review.
REAL ESTATE INVESTMENT TRUST (REIT)
A real estate investment trust (REIT) is an entity that makes a tax election to be taxed as a REIT, invests in real estate assets, and meets other REIT qualifications, including the distribution as dividends of at least 90% of REIT taxable income. A REIT’s profits are not taxed at the corporate level to the extent that these profits are distributed as dividends to stockholders, providing an operating cost savings. On the other hand, the requirement to pay out as dividends most of the REIT’s taxable profits means it can be harder for a REIT to grow using only internally-generated funds (as opposed to raising new capital).
REAL ESTATE OWNED (REO)
Real estate owned (REO) refers to real property owned by the lender or loan owner that has been acquired through foreclosure.
|
38
|
THE REDWOOD REVIEW 1ST QUARTER 2011
|
|
|
|
|
GLOSSARY
|
REIT SUBSIDIARY
A REIT subsidiary is a subsidiary of a REIT that is taxed as a REIT.
REIT TAXABLE INCOME
REIT taxable income is not a measure calculated in accordance with GAAP. REIT taxable income is pre-tax income calculated for tax purposes at Redwood including only its qualifying REIT subsidiaries (i.e., excluding its taxable subsidiaries). REIT taxable income is an important measure as it is the basis of our dividend distribution requirements. We must distribute at least 90% of REIT taxable income as dividends to shareholders over time. As a REIT, we are not subject to corporate income taxes on the REIT taxable income we distribute. We pay income tax on the REIT taxable income we retain, if any, (and we are permitted to retain up to 10% of total REIT taxable income). A reconciliation of REIT taxable income to GAAP income appears in Table 2 in the Financial Tables in this Review.
REMIC
A real estate mortgage investment conduit (REMIC) is a special purpose vehicle used to pool real estate mortgages and issue mortgage-backed securities. REMICs are typically exempt from tax at the entity level. REMICs may invest only in qualified mortgages and permitted investments, including single family or multifamily mortgages, commercial mortgages, second mortgages, mortgage participations, and federal agency pass-through securities.
RE-REMIC SECURITY
A re-REMIC is a resecuritization of asset-backed securities. The cash flows from and any credit losses absorbed by the underlying assets can be redirected to the resulting re-REMIC securities in a variety of ways.
RESIDENTIAL MORTGAGE-BACKED SECURITIES (RMBS)
A type of mortgage-backed security that is backed by a pool of mortgages on residential properties.
RETURN ON EQUITY (ROE) and ADJUSTED RETURN ON EQUITY
ROE is the amount of profit we generate each year per dollar of equity capital and equals GAAP income divided by GAAP equity. Adjusted ROE is not a measure calculated in accordance with GAAP — it is GAAP income divided by core equity.
SENIOR SECURITIES
Senior securities have the least credit risk in a securitization transaction because they are generally the last securities to absorb credit losses. In addition, the senior securities have the highest claim on the principal and interest payments (after the fees to servicers and trustees are paid.) To further reduce credit risk, most if not all, principal collected from the underlying asset pool is used to pay down the senior securities until certain performance tests are satisfied. If certain performance tests are satisfied, principal payments are shared between the senior securities and the subordinate securities, generally on a pro rata basis. At issuance, senior securities are generally triple A-rated.
SEQUOIA
Sequoia is the brand name for securitizations of residential real estate loans Redwood sponsors. Sequoia entities are independent securitization entities that acquire residential mortgage loans and create and issue asset-backed securities (ABS) backed by these loans. Most of the loans that Sequoia entities acquire are prime-quality loans. Most of the senior ABS created by Sequoia are sold to third-party investors. Redwood usually acquires most of the subordinated ABS and occasionally acquires the interest-only securities (IOs).
THE REDWOOD REVIEW 1ST QUARTER 2011
|
39
|
|
|
|
GLOSSARY
|
SHORT-TERM DEBT
Short-term debt is debt that is an obligation of Redwood and payable within a year. We may obtain this debt from a variety of Wall Street firms, banks, and other institutions. In the past, as another form of short-term debt, we have issued collateralized commercial paper. We may issue these or other forms of short-term debt in the future. We may use short-term debt to finance the accumulation of assets prior to sale to a securitization entity and to finance investments in high-quality loans and securities.
SUBORDINATE SECURITIES (JUNIOR SECURITIES or NON-SENIOR SECURITIES)
Subordinate securities absorb the initial credit losses from a securitization structure, thus protecting the senior securities. Subordinate securities have a lower priority to receive principal and interest payments than the senior securities. Subordinate securities receive little, if any, principal payments until certain performance tests are satisfied. If certain performance tests are satisfied, principal payments are shared between the senior securities and the subordinate securities, generally on a pro rata basis. Subordinate securities generally receive interest payments even if they do not receive principal payments. At issuance, subordinate securities are generally rated double-A or below.
SUBPRIME SECURITIES
Subprime securities are residential mortgage-backed securities backed by loans to borrowers who typically have lower credit scores and/or other credit deficiencies that prevent them from qualifying for prime or Alt-A mortgages and may have experienced credit problems in the past, such as late payments or bankruptcies. To compensate for the greater risks and higher costs to service the loans, subprime borrowers pay higher interest rates, points, and origination fees.
TAXABLE INCOME
Taxable income is not a measure calculated in accordance with GAAP. Taxable income is pre-tax income for Redwood and all its subsidiaries as calculated for tax purposes. Taxable income calculations differ significantly from GAAP income calculations. A reconciliation of taxable income to GAAP income appears in Table 2 in the Financial Tables in this Review.
TAXABLE SUBSIDIARY
A taxable subsidiary is a subsidiary of a REIT that is not taxed as a REIT and thus pays taxes on its income. A taxable subsidiary is not limited to investing in real estate and it can choose to retain all of its after-tax profits.
|
40
|
THE REDWOOD REVIEW 1ST QUARTER 2011
|

| |
|
|
|
|
|
|
|
|
|
|
|
|
|
|
|
|
|
|
|
|
|
|
|
|
|
|
|
|
|
|
|
|
|
| |
|
|
|
|
|
|
|
|
|
|
|
|
|
|
|
|
|
|
|
|
|
|
|
|
|
|
|
|
Twelve
|
|
|
Twelve
|
|
| |
|
2011
|
|
|
2010
|
|
|
2010
|
|
|
2010
|
|
|
2010
|
|
|
2009
|
|
|
2009
|
|
|
2009
|
|
|
2009
|
|
|
Months
|
|
|
Months
|
|
| |
|
Q1
|
|
|
Q4
|
|
|
Q3
|
|
|
Q2
|
|
|
Q1
|
|
|
Q4
|
|
|
Q3
|
|
|
Q2
|
|
|
Q1
|
|
|
2010
|
|
|
2009
|
|
| |
|
|
|
|
|
|
|
|
|
|
|
|
|
|
|
|
|
|
|
|
|
|
|
|
|
|
|
|
|
|
|
|
|
|
Interest income
|
|
$ |
44,025 |
|
|
$ |
44,956 |
|
|
$ |
49,249 |
|
|
$ |
47,730 |
|
|
$ |
50,449 |
|
|
$ |
57,717 |
|
|
$ |
64,425 |
|
|
$ |
74,332 |
|
|
$ |
83,903 |
|
|
$ |
192,384 |
|
|
$ |
280,377 |
|
|
Discount amortization on securities, net
|
|
|
12,104 |
|
|
|
12,671 |
|
|
|
10,991 |
|
|
|
10,821 |
|
|
|
10,629 |
|
|
|
7,432 |
|
|
|
9,575 |
|
|
|
3,864 |
|
|
|
4,917 |
|
|
|
45,112 |
|
|
|
25,788 |
|
|
Other investment interest income
|
|
|
- |
|
|
|
- |
|
|
|
2 |
|
|
|
4 |
|
|
|
9 |
|
|
|
12 |
|
|
|
25 |
|
|
|
53 |
|
|
|
76 |
|
|
|
15 |
|
|
|
166 |
|
|
Premium amortization expense on loans
|
|
|
(1,796 |
) |
|
|
(1,874 |
) |
|
|
(1,227 |
) |
|
|
(1,985 |
) |
|
|
(2,371 |
) |
|
|
(3,365 |
) |
|
|
(3,642 |
) |
|
|
(3,988 |
) |
|
|
(7,459 |
) |
|
|
(7,457 |
) |
|
|
(18,454 |
) |
|
Total interest income
|
|
|
54,333 |
|
|
|
55,753 |
|
|
|
59,015 |
|
|
|
56,570 |
|
|
|
58,716 |
|
|
|
61,796 |
|
|
|
70,383 |
|
|
|
74,261 |
|
|
|
81,437 |
|
|
|
230,054 |
|
|
|
287,877 |
|
| |
|
|
|
|
|
|
|
|
|
|
|
|
|
|
|
|
|
|
|
|
|
|
|
|
|
|
|
|
|
|
|
|
|
|
|
|
|
|
|
|
|
|
|
|
|
Interest expense on short-term debt
|
|
|
(182 |
) |
|
|
(43 |
) |
|
|
(2 |
) |
|
|
(36 |
) |
|
|
- |
|
|
|
- |
|
|
|
- |
|
|
|
- |
|
|
|
- |
|
|
|
(81 |
) |
|
|
- |
|
| |
|
|
|
|
|
|
|
|
|
|
|
|
|
|
|
|
|
|
|
|
|
|
|
|
|
|
|
|
|
|
|
|
|
|
|
|
|
|
|
|
|
|
|
|
|
Interest expense on ABS
|
|
|
(17,820 |
) |
|
|
(17,800 |
) |
|
|
(19,582 |
) |
|
|
(17,582 |
) |
|
|
(16,145 |
) |
|
|
(17,881 |
) |
|
|
(22,071 |
) |
|
|
(36,115 |
) |
|
|
(44,517 |
) |
|
|
(71,109 |
) |
|
|
(120,584 |
) |
|
ABS issuance expense amortization
|
|
|
(559 |
) |
|
|
(370 |
) |
|
|
(575 |
) |
|
|
(475 |
) |
|
|
(634 |
) |
|
|
(575 |
) |
|
|
(570 |
) |
|
|
(586 |
) |
|
|
(553 |
) |
|
|
(2,054 |
) |
|
|
(2,284 |
) |
|
ABS interest rate agreement expense
|
|
|
(1,140 |
) |
|
|
(1,189 |
) |
|
|
(1,104 |
) |
|
|
(1,127 |
) |
|
|
(495 |
) |
|
|
(1,123 |
) |
|
|
(1,123 |
) |
|
|
(1,111 |
) |
|
|
(1,098 |
) |
|
|
(3,915 |
) |
|
|
(4,455 |
) |
|
ABS issuance premium amortization income
|
|
|
96 |
|
|
|
168 |
|
|
|
187 |
|
|
|
196 |
|
|
|
208 |
|
|
|
223 |
|
|
|
234 |
|
|
|
313 |
|
|
|
335 |
|
|
|
759 |
|
|
|
1,105 |
|
|
Total ABS expense consolidated from trusts
|
|
|
(19,423 |
) |
|
|
(19,191 |
) |
|
|
(21,074 |
) |
|
|
(18,988 |
) |
|
|
(17,066 |
) |
|
|
(19,356 |
) |
|
|
(23,530 |
) |
|
|
(37,499 |
) |
|
|
(45,833 |
) |
|
|
(76,319 |
) |
|
|
(126,218 |
) |
| |
|
|
|
|
|
|
|
|
|
|
|
|
|
|
|
|
|
|
|
|
|
|
|
|
|
|
|
|
|
|
|
|
|
|
|
|
|
|
|
|
|
|
|
|
|
Interest expense on long-term debt
|
|
|
(2,367 |
) |
|
|
(2,390 |
) |
|
|
(2,619 |
) |
|
|
(2,140 |
) |
|
|
(1,115 |
) |
|
|
(1,168 |
) |
|
|
(1,307 |
) |
|
|
(1,502 |
) |
|
|
(1,808 |
) |
|
|
(8,264 |
) |
|
|
(5,785 |
) |
| |
|
|
|
|
|
|
|
|
|
|
|
|
|
|
|
|
|
|
|
|
|
|
|
|
|
|
|
|
|
|
|
|
|
|
|
|
|
|
|
|
|
|
|
|
|
Net interest income
|
|
|
32,361 |
|
|
|
34,129 |
|
|
|
35,320 |
|
|
|
35,406 |
|
|
|
40,535 |
|
|
|
41,272 |
|
|
|
45,546 |
|
|
|
35,260 |
|
|
|
33,796 |
|
|
|
145,390 |
|
|
|
155,874 |
|
|
Provision for loan losses
|
|
|
(2,807 |
) |
|
|
(7,902 |
) |
|
|
(2,436 |
) |
|
|
(4,321 |
) |
|
|
(9,476 |
) |
|
|
(8,997 |
) |
|
|
(9,998 |
) |
|
|
(14,545 |
) |
|
|
(16,033 |
) |
|
|
(24,135 |
) |
|
|
(49,573 |
) |
|
Market valuation adjustments, net
|
|
|
(5,740 |
) |
|
|
380 |
|
|
|
(1,573 |
) |
|
|
(7,125 |
) |
|
|
(11,236 |
) |
|
|
(4,191 |
) |
|
|
(11,058 |
) |
|
|
(29,135 |
) |
|
|
(43,244 |
) |
|
|
(19,554 |
) |
|
|
(87,628 |
) |
|
Net interest income (loss) after provision and market valuation adjustments
|
|
|
23,814 |
|
|
|
26,607 |
|
|
|
31,311 |
|
|
|
23,960 |
|
|
|
19,823 |
|
|
|
28,084 |
|
|
|
24,490 |
|
|
|
(8,420 |
) |
|
|
(25,481 |
) |
|
|
101,701 |
|
|
|
18,673 |
|
| |
|
|
|
|
|
|
|
|
|
|
|
|
|
|
|
|
|
|
|
|
|
|
|
|
|
|
|
|
|
|
|
|
|
|
|
|
|
|
|
|
|
|
|
|
|
Fixed compensation expense
|
|
|
(4,144 |
) |
|
|
(3,402 |
) |
|
|
(3,314 |
) |
|
|
(3,661 |
) |
|
|
(4,109 |
) |
|
|
(3,262 |
) |
|
|
(3,726 |
) |
|
|
(3,572 |
) |
|
|
(4,029 |
) |
|
|
(14,486 |
) |
|
|
(14,589 |
) |
|
Variable compensation expense
|
|
|
(599 |
) |
|
|
(2,152 |
) |
|
|
(2,206 |
) |
|
|
(1,303 |
) |
|
|
(1,880 |
) |
|
|
(566 |
) |
|
|
(5,216 |
) |
|
|
(1,132 |
) |
|
|
(556 |
) |
|
|
(7,541 |
) |
|
|
(7,470 |
) |
|
Equity compensation expense
|
|
|
(2,060 |
) |
|
|
(1,710 |
) |
|
|
(1,507 |
) |
|
|
(2,077 |
) |
|
|
(6,059 |
) |
|
|
(1,554 |
) |
|
|
(420 |
) |
|
|
(2,337 |
) |
|
|
(1,795 |
) |
|
|
(11,353 |
) |
|
|
(6,106 |
) |
|
Severance expense
|
|
|
- |
|
|
|
- |
|
|
|
(48 |
) |
|
|
(229 |
) |
|
|
(81 |
) |
|
|
- |
|
|
|
(398 |
) |
|
|
- |
|
|
|
(28 |
) |
|
|
(358 |
) |
|
|
(426 |
) |
|
Other operating expense
|
|
|
(4,711 |
) |
|
|
(5,673 |
) |
|
|
(5,170 |
) |
|
|
(3,957 |
) |
|
|
(5,177 |
) |
|
|
(5,498 |
) |
|
|
(5,046 |
) |
|
|
(3,728 |
) |
|
|
(4,132 |
) |
|
|
(19,977 |
) |
|
|
(18,404 |
) |
|
Total operating expenses
|
|
|
(11,514 |
) |
|
|
(12,937 |
) |
|
|
(12,245 |
) |
|
|
(11,227 |
) |
|
|
(17,306 |
) |
|
|
(10,880 |
) |
|
|
(14,806 |
) |
|
|
(10,769 |
) |
|
|
(10,540 |
) |
|
|
(53,715 |
) |
|
|
(46,995 |
) |
| |
|
|
|
|
|
|
|
|
|
|
|
|
|
|
|
|
|
|
|
|
|
|
|
|
|
|
|
|
|
|
|
|
|
|
|
|
|
|
|
|
|
|
|
|
|
Realized gains on sales, net
|
|
|
3,955 |
|
|
|
786 |
|
|
|
72 |
|
|
|
16,080 |
|
|
|
44,338 |
|
|
|
19,618 |
|
|
|
17,561 |
|
|
|
25,525 |
|
|
|
462 |
|
|
|
61,276 |
|
|
|
63,166 |
|
|
Realized (losses) gains on calls, net
|
|
|
(91 |
) |
|
|
726 |
|
|
|
1,494 |
|
|
|
- |
|
|
|
- |
|
|
|
- |
|
|
|
- |
|
|
|
- |
|
|
|
- |
|
|
|
2,220 |
|
|
|
- |
|
|
Realized gains on sales and calls, net
|
|
|
3,864 |
|
|
|
1,512 |
|
|
|
1,566 |
|
|
|
16,080 |
|
|
|
44,338 |
|
|
|
19,618 |
|
|
|
17,561 |
|
|
|
25,525 |
|
|
|
462 |
|
|
|
63,496 |
|
|
|
63,166 |
|
| |
|
|
|
|
|
|
|
|
|
|
|
|
|
|
|
|
|
|
|
|
|
|
|
|
|
|
|
|
|
|
|
|
|
|
|
|
|
|
|
|
|
|
|
|
|
Noncontrolling interest
|
|
|
2,015 |
|
|
|
(447 |
) |
|
|
(532 |
) |
|
|
(186 |
) |
|
|
15 |
|
|
|
(143 |
) |
|
|
(363 |
) |
|
|
(127 |
) |
|
|
716 |
|
|
|
(1,150 |
) |
|
|
83 |
|
|
(Provision for) benefit from income taxes
|
|
|
(14 |
) |
|
|
(26 |
) |
|
|
(202 |
) |
|
|
(26 |
) |
|
|
(26 |
) |
|
|
3,613 |
|
|
|
247 |
|
|
|
513 |
|
|
|
(105 |
) |
|
|
(280 |
) |
|
|
4,268 |
|
|
Net income (loss)
|
|
$ |
18,165 |
|
|
$ |
14,709 |
|
|
$ |
19,898 |
|
|
$ |
28,601 |
|
|
$ |
46,844 |
|
|
$ |
40,292 |
|
|
$ |
27,129 |
|
|
$ |
6,722 |
|
|
$ |
(34,948 |
) |
|
$ |
110,052 |
|
|
$ |
39,195 |
|
| |
|
|
|
|
|
|
|
|
|
|
|
|
|
|
|
|
|
|
|
|
|
|
|
|
|
|
|
|
|
|
|
|
|
|
|
|
|
|
|
|
|
|
|
|
|
Diluted average shares
|
|
|
79,372 |
|
|
|
78,944 |
|
|
|
78,961 |
|
|
|
78,852 |
|
|
|
78,542 |
|
|
|
78,101 |
|
|
|
78,223 |
|
|
|
66,446 |
|
|
|
53,632 |
|
|
|
78,811 |
|
|
|
68,991 |
|
|
Net income (loss) per share
|
|
$ |
0.22 |
|
|
$ |
0.18 |
|
|
$ |
0.25 |
|
|
$ |
0.35 |
|
|
$ |
0.58 |
|
|
$ |
0.51 |
|
|
$ |
0.34 |
|
|
$ |
0.10 |
|
|
$ |
(0.65 |
) |
|
$ |
1.36 |
|
|
$ |
0.55 |
|
| THE REDWOOD REVIEW 1ST QUARTER 2011 |
Table 1: GAAP Earnings
|
|
| |
|
|
|
|
|
|
|
|
|
|
|
|
|
|
|
|
|
|
|
|
|
|
|
|
|
|
|
| |
|
Estimated 2011 Q1 (2)
|
|
|
|
|
|
Estimated Twelve Months 2010
|
|
|
|
|
|
Actual Twelve Months 2009
|
|
|
|
|
| |
|
Taxable
|
|
|
GAAP
|
|
|
|
|
|
Taxable
|
|
|
GAAP
|
|
|
|
|
|
Taxable
|
|
|
GAAP
|
|
|
|
|
| |
|
Income (Loss)
|
|
|
Income
|
|
|
Differences
|
|
|
Income (Loss)
|
|
|
Income
|
|
|
Differences
|
|
|
Income (Loss)
|
|
|
Income
|
|
|
Differences
|
|
| |
|
|
|
|
|
|
|
|
|
|
|
|
|
|
|
|
|
|
|
|
|
|
|
|
|
|
|
|
Taxable and GAAP Income (Loss) Differences
|
|
|
|
|
|
|
|
|
|
|
|
|
|
|
|
|
|
|
|
|
|
|
|
|
|
|
|
|
Interest income
|
|
$ |
33,702 |
|
|
$ |
54,333 |
|
|
$ |
(20,631 |
) |
|
$ |
136,878 |
|
|
$ |
230,054 |
|
|
$ |
(93,176 |
) |
|
$ |
192,922 |
|
|
$ |
287,877 |
|
|
$ |
(94,955 |
) |
|
Interest expense
|
|
|
(2,810 |
) |
|
|
(21,972 |
) |
|
|
19,162 |
|
|
|
(8,545 |
) |
|
|
(84,664 |
) |
|
|
76,119 |
|
|
|
(4,955 |
) |
|
|
(132,003 |
) |
|
|
127,048 |
|
|
Net interest income
|
|
|
30,892 |
|
|
|
32,361 |
|
|
|
(1,469 |
) |
|
|
128,333 |
|
|
|
145,390 |
|
|
|
(17,057 |
) |
|
|
187,967 |
|
|
|
155,874 |
|
|
|
32,093 |
|
|
Provision for loan losses
|
|
|
- |
|
|
|
(2,807 |
) |
|
|
2,807 |
|
|
|
- |
|
|
|
(24,135 |
) |
|
|
24,135 |
|
|
|
- |
|
|
|
(49,573 |
) |
|
|
49,573 |
|
|
Realized credit losses
|
|
|
(14,632 |
) |
|
|
- |
|
|
|
(14,632 |
) |
|
|
(99,589 |
) |
|
|
- |
|
|
|
(99,589 |
) |
|
|
(223,903 |
) |
|
|
- |
|
|
|
(223,903 |
) |
|
Market valuation adjustments, net
|
|
|
- |
|
|
|
(5,740 |
) |
|
|
5,740 |
|
|
|
- |
|
|
|
(19,554 |
) |
|
|
19,554 |
|
|
|
- |
|
|
|
(87,628 |
) |
|
|
87,628 |
|
|
Operating expenses
|
|
|
(11,317 |
) |
|
|
(11,514 |
) |
|
|
197 |
|
|
|
(44,687 |
) |
|
|
(53,715 |
) |
|
|
9,028 |
|
|
|
(54,234 |
) |
|
|
(46,995 |
) |
|
|
(7,239 |
) |
|
Realized gains on sales and calls, net
|
|
|
- |
|
|
|
3,864 |
|
|
|
(3,864 |
) |
|
|
230 |
|
|
|
63,496 |
|
|
|
(63,266 |
) |
|
|
6,625 |
|
|
|
63,166 |
|
|
|
(56,541 |
) |
|
Provision for income taxes
|
|
|
(14 |
) |
|
|
(14 |
) |
|
|
- |
|
|
|
(8 |
) |
|
|
(280 |
) |
|
|
272 |
|
|
|
(13 |
) |
|
|
4,268 |
|
|
|
(4,281 |
) |
|
Less: Net (loss) income attributable to noncontrolling interest
|
|
|
- |
|
|
|
(2,015 |
) |
|
|
2,015 |
|
|
|
- |
|
|
|
1,150 |
|
|
|
(1,150 |
) |
|
|
- |
|
|
|
(83 |
) |
|
|
83 |
|
| |
|
|
|
|
|
|
|
|
|
|
|
|
|
|
|
|
|
|
|
|
|
|
|
|
|
|
|
|
|
|
|
|
|
|
|
|
|
Income (loss)
|
|
$ |
4,929 |
|
|
$ |
18,165 |
|
|
$ |
(13,236 |
) |
|
$ |
(15,721 |
) |
|
$ |
110,052 |
|
|
$ |
(125,773 |
) |
|
$ |
(83,558 |
) |
|
$ |
39,195 |
|
|
$ |
(122,753 |
) |
| |
|
|
|
|
|
|
|
|
|
|
|
|
|
|
|
|
|
|
|
|
|
|
|
|
|
|
|
|
|
|
|
|
|
|
|
|
|
REIT taxable income (loss)
|
|
$ |
7,489 |
|
|
|
|
|
|
|
|
|
|
$ |
3,998 |
|
|
|
|
|
|
|
|
|
|
$ |
(69,819 |
) |
|
|
|
|
|
|
|
|
|
Taxable loss at taxable subsidiaries
|
|
|
(2,560 |
) |
|
|
|
|
|
|
|
|
|
|
(19,719 |
) |
|
|
|
|
|
|
|
|
|
|
(13,739 |
) |
|
|
|
|
|
|
|
|
|
Taxable income (loss)
|
|
$ |
4,929 |
|
|
|
|
|
|
|
|
|
|
$ |
(15,721 |
) |
|
|
|
|
|
|
|
|
|
$ |
(83,558 |
) |
|
|
|
|
|
|
|
|
| |
|
|
|
|
|
|
|
|
|
|
|
|
|
|
|
|
|
|
|
|
|
|
|
|
|
|
|
|
|
|
|
|
|
|
|
|
|
Shares used for taxable EPS calculation
|
|
|
78,139 |
|
|
|
|
|
|
|
|
|
|
|
78,041 |
|
|
|
|
|
|
|
|
|
|
|
74,605 |
|
|
|
|
|
|
|
|
|
|
REIT taxable income (loss) per share (3)
|
|
$ |
0.09 |
|
|
|
|
|
|
|
|
|
|
$ |
0.05 |
|
|
|
|
|
|
|
|
|
|
$ |
(0.92 |
) |
|
|
|
|
|
|
|
|
|
Taxable loss at taxable subsidiaries per share
|
|
$ |
(0.03 |
) |
|
|
|
|
|
|
|
|
|
$ |
(0.25 |
) |
|
|
|
|
|
|
|
|
|
$ |
(0.20 |
) |
|
|
|
|
|
|
|
|
|
Taxable income (loss) per share (3)
|
|
$ |
0.06 |
|
|
|
|
|
|
|
|
|
|
$ |
(0.20 |
) |
|
|
|
|
|
|
|
|
|
$ |
(1.12 |
) |
|
|
|
|
|
|
|
|
| |
|
|
|
|
|
|
|
|
|
|
|
|
|
|
|
|
|
|
|
|
|
|
|
|
|
|
|
|
|
|
|
|
|
|
|
|
|
Dividends
|
|
|
|
|
|
|
|
|
|
|
|
|
|
|
|
|
|
|
|
|
|
|
|
|
|
|
|
|
|
|
|
|
|
|
|
|
|
Dividends declared
|
|
$ |
19,535 |
|
|
|
|
|
|
|
|
|
|
$ |
77,942 |
|
|
|
|
|
|
|
|
|
|
$ |
73,284 |
|
|
|
|
|
|
|
|
|
|
Regular dividend per share (4)
|
|
$ |
0.25 |
|
|
|
|
|
|
|
|
|
|
$ |
1.00 |
|
|
|
|
|
|
|
|
|
|
$ |
1.00 |
|
|
|
|
|
|
|
|
|
|
(1) Taxable income (loss) for 2011 and 2010 are estimates until we file tax returns for these years.
|
|
(2) Reconciliation of GAAP income to taxable income for prior quarters is provided in the respective Redwood Reviews for those quarters.
|
|
(3) REIT taxable income (loss) per share and taxable income (loss) per share are based on the number of shares outstanding at the end of each quarter. The annual REIT taxable income (loss) per share and taxable income (loss) per share are the sum of the four quarterly per share estimates.
|
|
(4) The characteristics of our 2011 dividend will be determined at the end of 2011. To the extent the REIT has taxable income or net capital gains in 2011, these amounts will be characterized as ordinary income. Dividends in 2010 were characterized as 62% ordinary income, or $48 million, and 38% return of capital, or $30 million. The 2009 dividends were characterized as a return of capital. The portion of Redwood's dividends characterized as a return of capital is not taxable to a shareholder and reduces a shareholder's basis for shares held at each quarterly distribution date.
|
| THE REDWOOD REVIEW 1ST QUARTER 2011 |
Table 2: Taxable and GAAP Income (Loss)
Differences and Dividends
|
43 |
| |
|
|
|
|
|
|
|
|
|
|
|
|
|
|
|
|
|
|
|
|
|
|
|
|
|
|
|
| |
|
|
|
|
|
|
|
|
|
|
|
|
|
|
|
|
|
|
|
|
|
|
|
|
|
|
|
| |
|
2011
|
|
|
2010
|
|
|
2010
|
|
|
2010
|
|
|
2010
|
|
|
2009
|
|
|
2009
|
|
|
2009
|
|
|
2009
|
|
| |
|
Q1
|
|
|
Q4
|
|
|
Q3
|
|
|
Q2
|
|
|
Q1
|
|
|
Q4
|
|
|
Q3
|
|
|
Q2
|
|
|
Q1
|
|
|
Short-term debt
|
|
$ |
- |
|
|
$ |
44 |
|
|
$ |
- |
|
|
$ |
- |
|
|
$ |
- |
|
|
$ |
- |
|
|
$ |
- |
|
|
$ |
- |
|
|
$ |
- |
|
|
Long-term debt
|
|
|
140 |
|
|
|
140 |
|
|
|
140 |
|
|
|
140 |
|
|
|
140 |
|
|
|
140 |
|
|
|
140 |
|
|
|
150 |
|
|
|
150 |
|
|
Redwood debt (1)
|
|
$ |
140 |
|
|
$ |
184 |
|
|
$ |
140 |
|
|
$ |
140 |
|
|
$ |
140 |
|
|
$ |
140 |
|
|
$ |
140 |
|
|
$ |
150 |
|
|
$ |
150 |
|
| |
|
|
|
|
|
|
|
|
|
|
|
|
|
|
|
|
|
|
|
|
|
|
|
|
|
|
|
|
|
|
|
|
|
|
|
|
|
GAAP stockholders' equity
|
|
$ |
1,075 |
|
|
$ |
1,065 |
|
|
$ |
1,016 |
|
|
$ |
991 |
|
|
$ |
998 |
|
|
$ |
972 |
|
|
$ |
907 |
|
|
$ |
802 |
|
|
$ |
506 |
|
| |
|
|
|
|
|
|
|
|
|
|
|
|
|
|
|
|
|
|
|
|
|
|
|
|
|
|
|
|
|
|
|
|
|
|
|
|
|
Redwood debt to equity
|
|
|
0.1 |
x |
|
|
0.2 |
x |
|
|
0.1 |
x |
|
|
0.1 |
x |
|
|
0.1 |
x |
|
|
0.1 |
x |
|
|
0.2 |
x |
|
|
0.2 |
x |
|
|
0.3 |
x |
|
Redwood debt to (equity + debt)
|
|
|
12 |
% |
|
|
15 |
% |
|
|
12 |
% |
|
|
12 |
% |
|
|
12 |
% |
|
|
13 |
% |
|
|
13 |
% |
|
|
16 |
% |
|
|
23 |
% |
| |
|
|
|
|
|
|
|
|
|
|
|
|
|
|
|
|
|
|
|
|
|
|
|
|
|
|
|
|
|
|
|
|
|
|
|
|
|
Redwood debt
|
|
$ |
140 |
|
|
$ |
184 |
|
|
$ |
140 |
|
|
$ |
140 |
|
|
$ |
140 |
|
|
$ |
140 |
|
|
$ |
140 |
|
|
$ |
150 |
|
|
$ |
150 |
|
|
ABS obligations of consolidated securitization entities
|
|
|
3,957 |
|
|
|
3,943 |
|
|
|
3,832 |
|
|
|
3,961 |
|
|
|
3,837 |
|
|
|
3,943 |
|
|
|
4,016 |
|
|
|
4,185 |
|
|
|
4,709 |
|
|
GAAP obligation
|
|
$ |
4,097 |
|
|
$ |
4,127 |
|
|
$ |
3,972 |
|
|
$ |
4,101 |
|
|
$ |
3,977 |
|
|
$ |
4,083 |
|
|
$ |
4,156 |
|
|
$ |
4,335 |
|
|
$ |
4,859 |
|
| |
|
|
|
|
|
|
|
|
|
|
|
|
|
|
|
|
|
|
|
|
|
|
|
|
|
|
|
|
|
|
|
|
|
|
|
|
|
GAAP obligation to equity
|
|
|
3.8 |
x |
|
|
3.7 |
x |
|
|
3.9 |
x |
|
|
4.0 |
x |
|
|
4.0 |
x |
|
|
4.2 |
x |
|
|
4.6 |
x |
|
|
5.4 |
x |
|
|
9.6 |
x |
|
GAAP obligation to (equity + GAAP debt)
|
|
|
79 |
% |
|
|
79 |
% |
|
|
80 |
% |
|
|
81 |
% |
|
|
80 |
% |
|
|
81 |
% |
|
|
82 |
% |
|
|
84 |
% |
|
|
91 |
% |
| |
|
|
|
|
|
|
|
|
|
|
|
|
|
|
|
|
|
|
|
|
|
|
|
|
|
|
|
|
|
|
|
|
|
|
|
|
|
GAAP stockholders' equity
|
|
$ |
1,075 |
|
|
$ |
1,065 |
|
|
$ |
1,016 |
|
|
$ |
991 |
|
|
$ |
998 |
|
|
$ |
972 |
|
|
$ |
907 |
|
|
$ |
802 |
|
|
$ |
506 |
|
|
Balance sheet mark-to-market adjustments
|
|
|
122 |
|
|
|
112 |
|
|
|
61 |
|
|
|
38 |
|
|
|
58 |
|
|
|
65 |
|
|
|
23 |
|
|
|
(77 |
) |
|
|
(85 |
) |
|
Core equity (non-GAAP)
|
|
$ |
953 |
|
|
$ |
953 |
|
|
$ |
955 |
|
|
$ |
953 |
|
|
$ |
940 |
|
|
$ |
907 |
|
|
$ |
884 |
|
|
$ |
879 |
|
|
$ |
591 |
|
| |
|
|
|
|
|
|
|
|
|
|
|
|
|
|
|
|
|
|
|
|
|
|
|
|
|
|
|
|
|
|
|
|
|
|
|
|
|
Shares outstanding at period end
|
|
|
78,139 |
|
|
|
78,125 |
|
|
|
77,984 |
|
|
|
77,908 |
|
|
|
77,751 |
|
|
|
77,737 |
|
|
|
77,669 |
|
|
|
77,503 |
|
|
|
60,228 |
|
| |
|
|
|
|
|
|
|
|
|
|
|
|
|
|
|
|
|
|
|
|
|
|
|
|
|
|
|
|
|
|
|
|
|
|
|
|
|
GAAP equity per share
|
|
$ |
13.76 |
|
|
$ |
13.63 |
|
|
$ |
13.02 |
|
|
$ |
12.71 |
|
|
$ |
12.84 |
|
|
$ |
12.50 |
|
|
$ |
11.68 |
|
|
$ |
10.35 |
|
|
$ |
8.40 |
|
|
Adjustments: GAAP equity to estimated economic value (2)
|
|
|
|
|
|
|
|
|
|
|
|
|
|
|
|
|
|
|
|
|
|
|
|
|
|
|
|
|
|
|
|
|
|
|
|
|
|
Investments in Sequoia
|
|
$ |
(0.05 |
) |
|
$ |
(0.12 |
) |
|
$ |
(0.24 |
) |
|
$ |
(0.31 |
) |
|
$ |
(0.37 |
) |
|
$ |
(0.37 |
) |
|
$ |
(0.37 |
) |
|
$ |
(0.35 |
) |
|
$ |
(0.15 |
) |
|
Investments in Acacia
|
|
|
(0.01 |
) |
|
|
(0.04 |
) |
|
|
(0.04 |
) |
|
|
(0.03 |
) |
|
|
- |
|
|
|
- |
|
|
|
- |
|
|
|
0.01 |
|
|
|
(0.03 |
) |
|
Long-term debt
|
|
|
0.75 |
|
|
|
0.84 |
|
|
|
0.99 |
|
|
|
1.00 |
|
|
|
0.85 |
|
|
|
0.90 |
|
|
|
0.97 |
|
|
|
1.29 |
|
|
|
1.79 |
|
|
Estimate of economic value per share (non-GAAP)
|
|
$ |
14.45 |
|
|
$ |
14.31 |
|
|
$ |
13.73 |
|
|
$ |
13.37 |
|
|
$ |
13.32 |
|
|
$ |
13.03 |
|
|
$ |
12.28 |
|
|
$ |
11.30 |
|
|
$ |
10.01 |
|
|
(1) Excludes obligations of consolidated securitization entities.
|
|
(2) Differences between GAAP and economic value per share reflect our estimate of the economic value of investments in Sequoia and Acacia and our long-term debt.
|
| THE REDWOOD REVIEW 1ST QUARTER 2011 |
Table 3: Book Value and Financial Ratios
|
|
| |
|
|
|
|
|
|
|
|
|
|
|
|
|
|
|
|
|
|
|
|
|
|
|
|
|
|
|
|
|
|
|
|
|
| |
|
|
|
|
|
|
|
|
|
|
|
|
|
|
|
|
|
|
|
|
|
|
|
|
|
|
|
|
Twelve
|
|
|
Twelve
|
|
| |
|
2011
|
|
|
2010
|
|
|
2010
|
|
|
2010
|
|
|
2010
|
|
|
2009
|
|
|
2009
|
|
|
2009
|
|
|
2009
|
|
|
Months
|
|
|
Months
|
|
| |
|
Q1
|
|
|
Q4
|
|
|
Q3
|
|
|
Q2
|
|
|
Q1
|
|
|
Q4
|
|
|
Q3
|
|
|
Q2
|
|
|
Q1
|
|
|
2010
|
|
|
2009
|
|
| |
|
|
|
|
|
|
|
|
|
|
|
|
|
|
|
|
|
|
|
|
|
|
|
|
|
|
|
|
|
|
|
|
|
|
Interest income
|
|
$ |
54,333 |
|
|
$ |
55,753 |
|
|
$ |
59,015 |
|
|
$ |
56,570 |
|
|
$ |
58,716 |
|
|
$ |
61,796 |
|
|
$ |
70,383 |
|
|
$ |
74,261 |
|
|
$ |
81,437 |
|
|
$ |
230,054 |
|
|
$ |
287,877 |
|
|
Average consolidated earning assets
|
|
$ |
5,107,979 |
|
|
$ |
4,980,935 |
|
|
$ |
5,030,680 |
|
|
$ |
5,139,945 |
|
|
$ |
5,070,987 |
|
|
$ |
5,175,337 |
|
|
$ |
5,128,893 |
|
|
$ |
5,325,322 |
|
|
$ |
5,553,470 |
|
|
$ |
5,055,322 |
|
|
$ |
5,294,037 |
|
|
Asset yield
|
|
|
4.25 |
% |
|
|
4.48 |
% |
|
|
4.69 |
% |
|
|
4.40 |
% |
|
|
4.63 |
% |
|
|
4.78 |
% |
|
|
5.49 |
% |
|
|
5.58 |
% |
|
|
5.87 |
% |
|
|
4.55 |
% |
|
|
5.44 |
% |
| |
|
|
|
|
|
|
|
|
|
|
|
|
|
|
|
|
|
|
|
|
|
|
|
|
|
|
|
|
|
|
|
|
|
|
|
|
|
|
|
|
|
|
|
|
|
Interest expense
|
|
$ |
(21,972 |
) |
|
$ |
(21,624 |
) |
|
$ |
(23,695 |
) |
|
$ |
(21,164 |
) |
|
$ |
(18,181 |
) |
|
$ |
(20,524 |
) |
|
$ |
(24,837 |
) |
|
$ |
(39,001 |
) |
|
$ |
(47,641 |
) |
|
$ |
(84,664 |
) |
|
$ |
(132,003 |
) |
|
Average consolidated interest-bearing liabilities
|
|
$ |
3,977,010 |
|
|
$ |
3,937,895 |
|
|
$ |
4,016,680 |
|
|
$ |
4,077,992 |
|
|
$ |
4,015,655 |
|
|
$ |
4,096,928 |
|
|
$ |
4,193,650 |
|
|
$ |
4,651,125 |
|
|
$ |
4,940,304 |
|
|
$ |
4,011,855 |
|
|
$ |
4,461,744 |
|
|
Cost of funds
|
|
|
2.21 |
% |
|
|
2.20 |
% |
|
|
2.36 |
% |
|
|
2.08 |
% |
|
|
1.81 |
% |
|
|
2.00 |
% |
|
|
2.37 |
% |
|
|
3.35 |
% |
|
|
3.86 |
% |
|
|
2.11 |
% |
|
|
2.96 |
% |
| |
|
|
|
|
|
|
|
|
|
|
|
|
|
|
|
|
|
|
|
|
|
|
|
|
|
|
|
|
|
|
|
|
|
|
|
|
|
|
|
|
|
|
|
|
|
Asset yield
|
|
|
4.25 |
% |
|
|
4.48 |
% |
|
|
4.69 |
% |
|
|
4.40 |
% |
|
|
4.63 |
% |
|
|
4.78 |
% |
|
|
5.49 |
% |
|
|
5.58 |
% |
|
|
5.87 |
% |
|
|
4.55 |
% |
|
|
5.44 |
% |
|
Cost of funds
|
|
|
(2.21 |
%) |
|
|
(2.20 |
%) |
|
|
(2.36 |
%) |
|
|
(2.08 |
%) |
|
|
(1.81 |
%) |
|
|
(2.00 |
%) |
|
|
(2.37 |
%) |
|
|
(3.35 |
%) |
|
|
(3.86 |
%) |
|
|
(2.11 |
%) |
|
|
(2.96 |
%) |
|
Interest rate spread
|
|
|
2.04 |
% |
|
|
2.28 |
% |
|
|
2.33 |
% |
|
|
2.33 |
% |
|
|
2.82 |
% |
|
|
2.77 |
% |
|
|
3.12 |
% |
|
|
2.22 |
% |
|
|
2.01 |
% |
|
|
2.44 |
% |
|
|
2.48 |
% |
| |
|
|
|
|
|
|
|
|
|
|
|
|
|
|
|
|
|
|
|
|
|
|
|
|
|
|
|
|
|
|
|
|
|
|
|
|
|
|
|
|
|
|
|
|
|
Net interest income
|
|
$ |
32,361 |
|
|
$ |
34,129 |
|
|
$ |
35,320 |
|
|
$ |
35,406 |
|
|
$ |
40,535 |
|
|
$ |
41,272 |
|
|
$ |
45,546 |
|
|
$ |
35,260 |
|
|
$ |
33,796 |
|
|
$ |
145,390 |
|
|
$ |
155,874 |
|
|
Average consolidated earning assets
|
|
$ |
5,107,979 |
|
|
$ |
4,980,935 |
|
|
$ |
5,030,680 |
|
|
$ |
5,139,945 |
|
|
$ |
5,070,987 |
|
|
$ |
5,175,337 |
|
|
$ |
5,128,893 |
|
|
$ |
5,325,322 |
|
|
$ |
5,553,470 |
|
|
$ |
5,055,322 |
|
|
$ |
5,294,037 |
|
|
Net interest margin
|
|
|
2.53 |
% |
|
|
2.74 |
% |
|
|
2.81 |
% |
|
|
2.76 |
% |
|
|
3.20 |
% |
|
|
3.19 |
% |
|
|
3.55 |
% |
|
|
2.65 |
% |
|
|
2.43 |
% |
|
|
2.88 |
% |
|
|
2.94 |
% |
| |
|
|
|
|
|
|
|
|
|
|
|
|
|
|
|
|
|
|
|
|
|
|
|
|
|
|
|
|
|
|
|
|
|
|
|
|
|
|
|
|
|
|
|
|
|
Operating expenses
|
|
$ |
(11,514 |
) |
|
$ |
(12,937 |
) |
|
$ |
(12,245 |
) |
|
$ |
(11,227 |
) |
|
$ |
(17,306 |
) |
|
$ |
(10,880 |
) |
|
$ |
(14,806 |
) |
|
$ |
(10,769 |
) |
|
$ |
(10,540 |
) |
|
$ |
(53,715 |
) |
|
$ |
(46,995 |
) |
| |
|
|
|
|
|
|
|
|
|
|
|
|
|
|
|
|
|
|
|
|
|
|
|
|
|
|
|
|
|
|
|
|
|
|
|
|
|
|
|
|
|
|
|
|
|
Average total assets
|
|
$ |
5,310,376 |
|
|
$ |
5,141,550 |
|
|
$ |
5,161,498 |
|
|
$ |
5,263,730 |
|
|
$ |
5,219,636 |
|
|
$ |
5,293,887 |
|
|
$ |
5,138,793 |
|
|
$ |
5,315,643 |
|
|
$ |
5,575,619 |
|
|
$ |
5,196,294 |
|
|
$ |
5,329,461 |
|
|
Average total equity
|
|
$ |
1,092,580 |
|
|
$ |
1,038,045 |
|
|
$ |
1,003,372 |
|
|
$ |
1,005,212 |
|
|
$ |
985,350 |
|
|
$ |
945,862 |
|
|
$ |
833,227 |
|
|
$ |
575,661 |
|
|
$ |
556,861 |
|
|
$ |
1,008,127 |
|
|
$ |
729,033 |
|
| |
|
|
|
|
|
|
|
|
|
|
|
|
|
|
|
|
|
|
|
|
|
|
|
|
|
|
|
|
|
|
|
|
|
|
|
|
|
|
|
|
|
|
|
|
|
Operating expenses / net interest income
|
|
|
35.58 |
% |
|
|
37.91 |
% |
|
|
34.67 |
% |
|
|
31.71 |
% |
|
|
42.69 |
% |
|
|
26.36 |
% |
|
|
32.51 |
% |
|
|
30.54 |
% |
|
|
31.19 |
% |
|
|
36.95 |
% |
|
|
30.15 |
% |
|
Operating expenses / average total assets
|
|
|
0.87 |
% |
|
|
1.01 |
% |
|
|
0.95 |
% |
|
|
0.85 |
% |
|
|
1.33 |
% |
|
|
0.82 |
% |
|
|
1.15 |
% |
|
|
0.81 |
% |
|
|
0.76 |
% |
|
|
1.03 |
% |
|
|
0.88 |
% |
|
Operating expenses / average total equity
|
|
|
4.22 |
% |
|
|
4.99 |
% |
|
|
4.88 |
% |
|
|
4.47 |
% |
|
|
7.03 |
% |
|
|
4.60 |
% |
|
|
7.11 |
% |
|
|
7.48 |
% |
|
|
7.57 |
% |
|
|
5.33 |
% |
|
|
6.45 |
% |
| |
|
|
|
|
|
|
|
|
|
|
|
|
|
|
|
|
|
|
|
|
|
|
|
|
|
|
|
|
|
|
|
|
|
|
|
|
|
|
|
|
|
|
|
|
|
GAAP net income (loss)
|
|
$ |
18,165 |
|
|
$ |
14,709 |
|
|
$ |
19,898 |
|
|
$ |
28,601 |
|
|
$ |
46,844 |
|
|
$ |
40,292 |
|
|
$ |
27,129 |
|
|
$ |
6,722 |
|
|
$ |
(34,948 |
) |
|
$ |
110,052 |
|
|
$ |
39,195 |
|
|
GAAP net income (loss) / average total assets
|
|
|
1.37 |
% |
|
|
1.14 |
% |
|
|
1.54 |
% |
|
|
2.17 |
% |
|
|
3.59 |
% |
|
|
3.04 |
% |
|
|
2.11 |
% |
|
|
0.51 |
% |
|
|
(2.51 |
%) |
|
|
2.12 |
% |
|
|
0.74 |
% |
|
GAAP net income (loss) / average equity (GAAP ROE)
|
|
|
6.65 |
% |
|
|
5.67 |
% |
|
|
7.93 |
% |
|
|
11.38 |
% |
|
|
19.02 |
% |
|
|
17.04 |
% |
|
|
13.02 |
% |
|
|
4.67 |
% |
|
|
(25.10 |
%) |
|
|
10.92 |
% |
|
|
5.38 |
% |
|
GAAP net income (loss) / average core equity (adjusted ROE) (2)
|
|
|
7.53 |
% |
|
|
6.14 |
% |
|
|
8.25 |
% |
|
|
12.00 |
% |
|
|
20.09 |
% |
|
|
17.99 |
% |
|
|
12.22 |
% |
|
|
4.10 |
% |
|
|
(22.64 |
%) |
|
|
11.56 |
% |
|
|
5.12 |
% |
| |
|
|
|
|
|
|
|
|
|
|
|
|
|
|
|
|
|
|
|
|
|
|
|
|
|
|
|
|
|
|
|
|
|
|
|
|
|
|
|
|
|
|
|
|
|
Average core equity (2)
|
|
$ |
964,554 |
|
|
$ |
958,194 |
|
|
$ |
964,249 |
|
|
$ |
953,720 |
|
|
$ |
932,721 |
|
|
$ |
896,034 |
|
|
$ |
888,107 |
|
|
$ |
655,695 |
|
|
$ |
617,325 |
|
|
$ |
952,324 |
|
|
$ |
765,393 |
|
|
(1) All percentages in this table are shown on an annualized basis.
|
|
(2) Core equity is a non-GAAP metric and is equal to GAAP equity excluding accumulated other comprehensive income (loss).
|
| THE REDWOOD REVIEW 1ST QUARTER 2011 |
Table 4: Yields and Profitability Ratios
|
45 |
| |
|
|
|
|
|
|
|
|
|
|
|
|
|
|
|
|
|
|
|
|
|
|
|
|
|
|
|
|
|
|
|
|
|
| |
|
|
|
|
|
|
|
|
|
|
|
|
|
|
|
|
|
|
|
|
|
|
|
|
|
|
|
|
Twelve
|
|
|
Twelve
|
|
| |
|
2011
|
|
|
2010
|
|
|
2010
|
|
|
2010
|
|
|
2010
|
|
|
2009
|
|
|
2009
|
|
|
2009
|
|
|
2009
|
|
|
Months
|
|
|
Months
|
|
| |
|
Q1
|
|
|
Q4
|
|
|
Q3
|
|
|
Q2
|
|
|
Q1
|
|
|
Q4
|
|
|
Q3
|
|
|
Q2
|
|
|
Q1
|
|
|
2010
|
|
|
2009
|
|
| |
|
|
|
|
|
|
|
|
|
|
|
|
|
|
|
|
|
|
|
|
|
|
|
|
|
|
|
|
|
|
|
|
|
|
Real estate assets at Redwood
|
|
|
|
|
|
|
|
|
|
|
|
|
|
|
|
|
|
|
|
|
|
|
|
|
|
|
|
|
|
|
|
|
|
| |
|
|
|
|
|
|
|
|
|
|
|
|
|
|
|
|
|
|
|
|
|
|
|
|
|
|
|
|
|
|
|
|
|
|
Senior residential securities
|
|
|
|
|
|
|
|
|
|
|
|
|
|
|
|
|
|
|
|
|
|
|
|
|
|
|
|
|
|
|
|
|
|
|
Prime
|
|
$ |
255,884 |
|
|
$ |
262,048 |
|
|
$ |
270,286 |
|
|
$ |
278,472 |
|
|
$ |
283,477 |
|
|
$ |
280,101 |
|
|
$ |
264,773 |
|
|
$ |
164,386 |
|
|
$ |
77,651 |
|
|
$ |
273,503 |
|
|
$ |
197,469 |
|
|
Non-prime
|
|
|
307,253 |
|
|
|
321,655 |
|
|
|
316,089 |
|
|
|
302,461 |
|
|
|
310,948 |
|
|
|
263,022 |
|
|
|
270,353 |
|
|
|
168,383 |
|
|
|
87,464 |
|
|
|
312,827 |
|
|
|
197,987 |
|
|
Total senior residential securities
|
|
|
563,137 |
|
|
|
583,703 |
|
|
|
586,375 |
|
|
|
580,933 |
|
|
|
594,426 |
|
|
|
543,124 |
|
|
|
535,126 |
|
|
|
332,769 |
|
|
|
165,114 |
|
|
|
586,330 |
|
|
|
395,456 |
|
| |
|
|
|
|
|
|
|
|
|
|
|
|
|
|
|
|
|
|
|
|
|
|
|
|
|
|
|
|
|
|
|
|
|
|
|
|
|
|
|
|
|
|
|
|
|
Residential Re-REMIC securities
|
|
|
32,648 |
|
|
|
32,917 |
|
|
|
33,250 |
|
|
|
34,385 |
|
|
|
45,852 |
|
|
|
73,938 |
|
|
|
69,980 |
|
|
|
26,419 |
|
|
|
- |
|
|
|
36,556 |
|
|
|
42,862 |
|
| |
|
|
|
|
|
|
|
|
|
|
|
|
|
|
|
|
|
|
|
|
|
|
|
|
|
|
|
|
|
|
|
|
|
|
|
|
|
|
|
|
|
|
|
|
|
Subordinate residential securities
|
|
|
|
|
|
|
|
|
|
|
|
|
|
|
|
|
|
|
|
|
|
|
|
|
|
|
|
|
|
|
|
|
|
|
|
|
|
|
|
|
|
|
|
|
|
Prime
|
|
|
53,046 |
|
|
|
45,914 |
|
|
|
35,794 |
|
|
|
38,079 |
|
|
|
41,701 |
|
|
|
47,083 |
|
|
|
58,637 |
|
|
|
43,020 |
|
|
|
47,070 |
|
|
|
40,371 |
|
|
|
48,979 |
|
|
Non-prime
|
|
|
12,140 |
|
|
|
11,890 |
|
|
|
9,181 |
|
|
|
7,708 |
|
|
|
4,253 |
|
|
|
1,377 |
|
|
|
2,218 |
|
|
|
2,767 |
|
|
|
3,450 |
|
|
|
8,282 |
|
|
|
2,446 |
|
|
Total subordinate residential securities
|
|
|
65,186 |
|
|
|
57,804 |
|
|
|
44,975 |
|
|
|
45,787 |
|
|
|
45,954 |
|
|
|
48,460 |
|
|
|
60,855 |
|
|
|
45,787 |
|
|
|
50,519 |
|
|
|
48,653 |
|
|
|
51,425 |
|
| |
|
|
|
|
|
|
|
|
|
|
|
|
|
|
|
|
|
|
|
|
|
|
|
|
|
|
|
|
|
|
|
|
|
|
|
|
|
|
|
|
|
|
|
|
|
Commercial subordinate securities
|
|
|
6,288 |
|
|
|
6,948 |
|
|
|
7,274 |
|
|
|
7,417 |
|
|
|
7,670 |
|
|
|
8,090 |
|
|
|
13,504 |
|
|
|
25,006 |
|
|
|
46,382 |
|
|
|
7,325 |
|
|
|
23,114 |
|
|
Commercial loans
|
|
|
36,434 |
|
|
|
14,095 |
|
|
|
242 |
|
|
|
243 |
|
|
|
244 |
|
|
|
245 |
|
|
|
246 |
|
|
|
247 |
|
|
|
248 |
|
|
|
3,734 |
|
|
|
247 |
|
|
Residential loans
|
|
|
204,847 |
|
|
|
169,691 |
|
|
|
16,463 |
|
|
|
2,299 |
|
|
|
2,313 |
|
|
|
2,314 |
|
|
|
2,315 |
|
|
|
2,435 |
|
|
|
2,600 |
|
|
|
48,064 |
|
|
|
2,415 |
|
|
CDO
|
|
|
1,252 |
|
|
|
973 |
|
|
|
1,103 |
|
|
|
1,207 |
|
|
|
1,222 |
|
|
|
1,962 |
|
|
|
2,255 |
|
|
|
2,595 |
|
|
|
3,429 |
|
|
|
1,126 |
|
|
|
2,555 |
|
|
Total real estate assets at Redwood
|
|
|
909,792 |
|
|
|
866,131 |
|
|
|
689,682 |
|
|
|
672,270 |
|
|
|
697,681 |
|
|
|
678,133 |
|
|
|
684,281 |
|
|
|
435,258 |
|
|
|
268,293 |
|
|
|
731,788 |
|
|
|
518,074 |
|
| |
|
|
|
|
|
|
|
|
|
|
|
|
|
|
|
|
|
|
|
|
|
|
|
|
|
|
|
|
|
|
|
|
|
|
|
|
|
|
|
|
|
|
|
|
|
Earning assets at Acacia
|
|
|
347,786 |
|
|
|
311,949 |
|
|
|
292,468 |
|
|
|
290,060 |
|
|
|
299,843 |
|
|
|
304,436 |
|
|
|
298,615 |
|
|
|
321,206 |
|
|
|
404,596 |
|
|
|
298,597 |
|
|
|
331,847 |
|
|
Earning assets at Legacy Sequoia
|
|
|
3,351,214 |
|
|
|
3,425,633 |
|
|
|
3,505,497 |
|
|
|
3,589,882 |
|
|
|
3,666,884 |
|
|
|
3,767,112 |
|
|
|
3,864,796 |
|
|
|
4,305,159 |
|
|
|
4,568,212 |
|
|
|
3,546,199 |
|
|
|
4,123,409 |
|
|
Earning assets at New Sequoia
|
|
|
225,564 |
|
|
|
162,271 |
|
|
|
204,504 |
|
|
|
161,502 |
|
|
|
- |
|
|
|
- |
|
|
|
- |
|
|
|
- |
|
|
|
- |
|
|
|
132,712 |
|
|
|
- |
|
|
Earning assets at the Fund
|
|
|
22,280 |
|
|
|
33,001 |
|
|
|
34,334 |
|
|
|
35,526 |
|
|
|
42,134 |
|
|
|
53,990 |
|
|
|
57,070 |
|
|
|
58,054 |
|
|
|
62,319 |
|
|
|
36,219 |
|
|
|
57,833 |
|
| |
|
|
|
|
|
|
|
|
|
|
|
|
|
|
|
|
|
|
|
|
|
|
|
|
|
|
|
|
|
|
|
|
|
|
|
|
|
|
|
|
|
|
|
|
|
Cash and cash equivalents
|
|
|
123,317 |
|
|
|
102,099 |
|
|
|
265,071 |
|
|
|
339,212 |
|
|
|
311,816 |
|
|
|
321,838 |
|
|
|
279,011 |
|
|
|
285,680 |
|
|
|
310,514 |
|
|
|
254,004 |
|
|
|
299,236 |
|
|
Earning assets
|
|
|
4,979,953 |
|
|
|
4,901,084 |
|
|
|
4,991,557 |
|
|
|
5,088,452 |
|
|
|
5,018,358 |
|
|
|
5,125,509 |
|
|
|
5,183,773 |
|
|
|
5,405,357 |
|
|
|
5,613,934 |
|
|
|
4,999,519 |
|
|
|
5,330,399 |
|
|
Balance sheet mark-to-market adjustments
|
|
|
128,026 |
|
|
|
79,851 |
|
|
|
39,123 |
|
|
|
51,493 |
|
|
|
52,629 |
|
|
|
49,828 |
|
|
|
(54,880 |
) |
|
|
(80,035 |
) |
|
|
(60,464 |
) |
|
|
55,803 |
|
|
|
(36,362 |
) |
|
Earning assets - reported value
|
|
|
5,107,979 |
|
|
|
4,980,935 |
|
|
|
5,030,680 |
|
|
|
5,139,945 |
|
|
|
5,070,987 |
|
|
|
5,175,337 |
|
|
|
5,128,893 |
|
|
|
5,325,322 |
|
|
|
5,553,470 |
|
|
|
5,055,322 |
|
|
|
5,294,037 |
|
|
Other assets
|
|
|
202,397 |
|
|
|
160,615 |
|
|
|
130,818 |
|
|
|
123,785 |
|
|
|
148,649 |
|
|
|
118,550 |
|
|
|
9,900 |
|
|
|
(9,680 |
) |
|
|
22,148 |
|
|
|
140,972 |
|
|
|
35,424 |
|
|
Total assets
|
|
$ |
5,310,376 |
|
|
$ |
5,141,550 |
|
|
$ |
5,161,498 |
|
|
$ |
5,263,730 |
|
|
$ |
5,219,636 |
|
|
$ |
5,293,887 |
|
|
$ |
5,138,793 |
|
|
$ |
5,315,643 |
|
|
$ |
5,575,619 |
|
|
$ |
5,196,294 |
|
|
$ |
5,329,461 |
|
| |
|
|
|
|
|
|
|
|
|
|
|
|
|
|
|
|
|
|
|
|
|
|
|
|
|
|
|
|
|
|
|
|
|
|
|
|
|
|
|
|
|
|
|
|
|
Short-term debt
|
|
$ |
47,976 |
|
|
$ |
11,265 |
|
|
$ |
- |
|
|
$ |
7,920 |
|
|
$ |
- |
|
|
$ |
- |
|
|
$ |
- |
|
|
$ |
- |
|
|
$ |
- |
|
|
$ |
4,814 |
|
|
$ |
- |
|
|
Legacy Sequoia ABS issued
|
|
|
3,289,456 |
|
|
|
3,365,929 |
|
|
|
3,439,201 |
|
|
|
3,518,773 |
|
|
|
3,589,269 |
|
|
|
3,666,201 |
|
|
|
3,765,292 |
|
|
|
4,211,937 |
|
|
|
4,460,951 |
|
|
|
3,477,574 |
|
|
|
4,023,203 |
|
|
New Sequoia ABS issued
|
|
|
197,758 |
|
|
|
147,364 |
|
|
|
184,615 |
|
|
|
144,201 |
|
|
|
- |
|
|
|
- |
|
|
|
- |
|
|
|
- |
|
|
|
- |
|
|
|
119,628 |
|
|
|
- |
|
|
Acacia ABS issued
|
|
|
303,601 |
|
|
|
274,630 |
|
|
|
254,244 |
|
|
|
268,715 |
|
|
|
288,241 |
|
|
|
288,041 |
|
|
|
283,996 |
|
|
|
285,698 |
|
|
|
325,392 |
|
|
|
271,373 |
|
|
|
295,647 |
|
|
Other liabilities
|
|
|
232,062 |
|
|
|
151,332 |
|
|
|
126,428 |
|
|
|
164,764 |
|
|
|
200,096 |
|
|
|
231,553 |
|
|
|
91,027 |
|
|
|
66,588 |
|
|
|
55,487 |
|
|
|
160,427 |
|
|
|
111,590 |
|
|
Long-term debt
|
|
|
138,219 |
|
|
|
138,707 |
|
|
|
138,620 |
|
|
|
138,383 |
|
|
|
138,145 |
|
|
|
137,907 |
|
|
|
139,190 |
|
|
|
147,430 |
|
|
|
147,193 |
|
|
|
138,466 |
|
|
|
142,894 |
|
|
Total liabilities
|
|
|
4,209,072 |
|
|
|
4,089,227 |
|
|
|
4,143,108 |
|
|
|
4,242,755 |
|
|
|
4,215,751 |
|
|
|
4,323,702 |
|
|
|
4,279,505 |
|
|
|
4,711,653 |
|
|
|
4,989,023 |
|
|
|
4,172,283 |
|
|
|
4,573,334 |
|
| |
|
|
|
|
|
|
|
|
|
|
|
|
|
|
|
|
|
|
|
|
|
|
|
|
|
|
|
|
|
|
|
|
|
|
|
|
|
|
|
|
|
|
|
|
|
Noncontrolling interest
|
|
|
8,724 |
|
|
|
14,278 |
|
|
|
15,018 |
|
|
|
15,763 |
|
|
|
18,535 |
|
|
|
24,322 |
|
|
|
26,061 |
|
|
|
28,330 |
|
|
|
29,735 |
|
|
|
15,884 |
|
|
|
27,094 |
|
| |
|
|
|
|
|
|
|
|
|
|
|
|
|
|
|
|
|
|
|
|
|
|
|
|
|
|
|
|
|
|
|
|
|
|
|
|
|
|
|
|
|
|
|
|
|
Core equity (1)
|
|
|
964,554 |
|
|
|
958,194 |
|
|
|
964,249 |
|
|
|
953,720 |
|
|
|
932,721 |
|
|
|
896,034 |
|
|
|
888,107 |
|
|
|
655,695 |
|
|
|
617,325 |
|
|
|
952,324 |
|
|
|
765,393 |
|
|
Accumulated other comprehensive income (loss)
|
|
|
128,026 |
|
|
|
79,851 |
|
|
|
39,123 |
|
|
|
51,493 |
|
|
|
52,629 |
|
|
|
49,829 |
|
|
|
(54,880 |
) |
|
|
(80,035 |
) |
|
|
(60,464 |
) |
|
|
55,803 |
|
|
|
(36,360 |
) |
|
Total equity
|
|
|
1,092,580 |
|
|
|
1,038,045 |
|
|
|
1,003,372 |
|
|
|
1,005,212 |
|
|
|
985,350 |
|
|
|
945,863 |
|
|
|
833,227 |
|
|
|
575,661 |
|
|
|
556,861 |
|
|
|
1,008,127 |
|
|
|
729,033 |
|
| |
|
|
|
|
|
|
|
|
|
|
|
|
|
|
|
|
|
|
|
|
|
|
|
|
|
|
|
|
|
|
|
|
|
|
|
|
|
|
|
|
|
|
|
|
|
Total liabilities and equity
|
|
$ |
5,310,376 |
|
|
$ |
5,141,550 |
|
|
$ |
5,161,498 |
|
|
$ |
5,263,730 |
|
|
$ |
5,219,636 |
|
|
$ |
5,293,887 |
|
|
$ |
5,138,793 |
|
|
$ |
5,315,643 |
|
|
$ |
5,575,619 |
|
|
$ |
5,196,294 |
|
|
$ |
5,329,461 |
|
(1) Core equity is a non-GAAP metric and is equal to GAAP equity excluding accumulated other comprehensive income (loss).
| THE REDWOOD REVIEW 1ST QUARTER 2011 |
Table 5: Average Balance Sheet
|
|
| |
|
2011
|
|
|
2010
|
|
|
2010
|
|
|
2010
|
|
|
2010
|
|
|
2009
|
|
|
2009
|
|
|
2009
|
|
|
|
|
2011
|
|
|
2010
|
|
|
2010
|
|
|
2010
|
|
|
2010
|
|
|
2009
|
|
|
2009
|
|
|
2009
|
|
| |
|
Q1 |
|
|
Q4 |
|
|
Q3 |
|
|
Q2 |
|
|
Q1 |
|
|
Q4 |
|
|
Q3 |
|
|
Q2 |
|
|
|
|
Q1 |
|
|
Q4 |
|
|
Q3 |
|
|
Q2 |
|
|
Q1 |
|
|
Q4 |
|
|
Q3 |
|
|
Q2 |
|
|
Residential Prime Senior AFS
|
|
|
|
|
|
|
|
|
|
|
|
|
|
|
|
|
|
|
|
|
|
|
|
|
|
|
|
|
|
|
|
|
|
Residential Non-Prime Subordinate AFS
|
|
|
|
|
|
|
|
|
|
|
|
|
|
|
|
|
|
|
|
|
|
|
|
|
|
|
|
|
|
|
|
|
|
Current face
|
|
$ |
346,317 |
|
|
$ |
358,683 |
|
|
$ |
368,191 |
|
|
$ |
371,066 |
|
|
$ |
450,647 |
|
|
$ |
412,471 |
|
|
$ |
431,289 |
|
|
$ |
276,444 |
|
|
Current face
|
|
$ |
29,095 |
|
|
$ |
31,556 |
|
|
$ |
27,461 |
|
|
$ |
32,443 |
|
|
$ |
56,128 |
|
|
$ |
71,963 |
|
|
$ |
143,357 |
|
|
$ |
210,475 |
|
|
Unamortized discount
|
|
|
(78,306 |
) |
|
|
(83,465 |
) |
|
|
(88,978 |
) |
|
|
(93,502 |
) |
|
|
(113,757 |
) |
|
|
(116,801 |
) |
|
|
(124,295 |
) |
|
|
(91,221 |
) |
|
Unamortized (discount) premium
|
|
|
(8,466 |
) |
|
|
(10,123 |
) |
|
|
(7,279 |
) |
|
|
(7,558 |
) |
|
|
(2,742 |
) |
|
|
(242 |
) |
|
|
(1,524 |
) |
|
|
852 |
|
|
Credit reserve
|
|
|
(16,679 |
) |
|
|
(15,667 |
) |
|
|
(12,822 |
) |
|
|
(10,084 |
) |
|
|
(14,637 |
) |
|
|
(9,898 |
) |
|
|
(11,069 |
) |
|
|
(3,486 |
) |
|
Credit reserve
|
|
|
(9,469 |
) |
|
|
(9,229 |
) |
|
|
(11,323 |
) |
|
|
(15,775 |
) |
|
|
(47,805 |
) |
|
|
(70,806 |
) |
|
|
(140,046 |
) |
|
|
(208,839 |
) |
|
Unrealized gains, net
|
|
|
54,860 |
|
|
|
56,340 |
|
|
|
49,543 |
|
|
|
42,222 |
|
|
|
49,887 |
|
|
|
43,436 |
|
|
|
40,734 |
|
|
|
1,729 |
|
|
Unrealized gains (losses) , net
|
|
|
868 |
|
|
|
984 |
|
|
|
953 |
|
|
|
732 |
|
|
|
772 |
|
|
|
162 |
|
|
|
(806 |
) |
|
|
473 |
|
|
Fair value
|
|
$ |
306,192 |
|
|
$ |
315,891 |
|
|
$ |
315,934 |
|
|
$ |
309,702 |
|
|
$ |
372,140 |
|
|
$ |
329,208 |
|
|
$ |
336,659 |
|
|
$ |
183,466 |
|
|
Fair value
|
|
$ |
12,028 |
|
|
$ |
13,188 |
|
|
$ |
9,812 |
|
|
$ |
9,842 |
|
|
$ |
6,353 |
|
|
$ |
1,077 |
|
|
$ |
981 |
|
|
$ |
2,961 |
|
| |
|
|
|
|
|
|
|
|
|
|
|
|
|
|
|
|
|
|
|
|
|
|
|
|
|
|
|
|
|
|
|
|
|
|
|
|
|
|
|
|
|
|
|
|
|
|
|
|
|
|
|
|
|
|
|
|
|
|
|
|
|
|
|
|
|
|
|
Average amortized cost
|
|
$ |
255,884 |
|
|
$ |
262,048 |
|
|
$ |
270,286 |
|
|
$ |
278,472 |
|
|
$ |
283,477 |
|
|
$ |
280,101 |
|
|
$ |
264,773 |
|
|
$ |
164,386 |
|
|
Average amortized cost
|
|
$ |
11,957 |
|
|
$ |
11,670 |
|
|
$ |
8,988 |
|
|
$ |
7,519 |
|
|
$ |
4,047 |
|
|
$ |
1,156 |
|
|
$ |
1,994 |
|
|
$ |
2,503 |
|
|
Interest income
|
|
$ |
7,479 |
|
|
$ |
8,306 |
|
|
$ |
7,617 |
|
|
$ |
7,868 |
|
|
$ |
8,455 |
|
|
$ |
8,610 |
|
|
$ |
8,431 |
|
|
$ |
5,475 |
|
|
Interest income
|
|
$ |
598 |
|
|
$ |
619 |
|
|
$ |
545 |
|
|
$ |
603 |
|
|
$ |
129 |
|
|
$ |
8 |
|
|
$ |
392 |
|
|
$ |
1,615 |
|
|
Annualized yield
|
|
|
11.69 |
% |
|
|
12.68 |
% |
|
|
11.27 |
% |
|
|
11.30 |
% |
|
|
11.93 |
% |
|
|
12.30 |
% |
|
|
12.74 |
% |
|
|
13.32 |
% |
|
Annualized yield
|
|
|
20.01 |
% |
|
|
21.22 |
% |
|
|
24.25 |
% |
|
|
32.10 |
% |
|
|
12.75 |
% |
|
|
2.67 |
% |
|
|
78.65 |
% |
|
|
258.13 |
% |
| |
|
|
|
|
|
|
|
|
|
|
|
|
|
|
|
|
|
|
|
|
|
|
|
|
|
|
|
|
|
|
|
|
|
|
|
|
|
|
|
|
|
|
|
|
|
|
|
|
|
|
|
|
|
|
|
|
|
|
|
|
|
|
|
|
|
|
|
Residential Non-Prime Senior AFS
|
|
|
|
|
|
|
|
|
|
|
|
|
|
|
|
|
|
|
|
|
|
|
|
|
|
|
|
|
|
|
|
|
|
Commercial Subordinate AFS
|
|
|
|
|
|
|
|
|
|
|
|
|
|
|
|
|
|
|
|
|
|
|
|
|
|
|
|
|
|
|
|
|
|
Current face
|
|
$ |
372,394 |
|
|
$ |
416,169 |
|
|
$ |
431,143 |
|
|
$ |
399,988 |
|
|
$ |
471,894 |
|
|
$ |
423,961 |
|
|
$ |
395,311 |
|
|
$ |
387,431 |
|
|
Current face
|
|
$ |
74,782 |
|
|
$ |
89,103 |
|
|
$ |
109,275 |
|
|
$ |
140,547 |
|
|
$ |
152,408 |
|
|
$ |
158,997 |
|
|
$ |
486,245 |
|
|
$ |
506,746 |
|
|
Unamortized discount
|
|
|
(87,569 |
) |
|
|
(104,517 |
) |
|
|
(111,709 |
) |
|
|
(110,018 |
) |
|
|
(133,479 |
) |
|
|
(133,995 |
) |
|
|
(132,036 |
) |
|
|
(133,753 |
) |
|
Unamortized discount
|
|
|
(4,784 |
) |
|
|
(5,591 |
) |
|
|
(5,610 |
) |
|
|
(5,534 |
) |
|
|
(5,660 |
) |
|
|
(5,130 |
) |
|
|
(1,624 |
) |
|
|
(120 |
) |
|
Credit reserve
|
|
|
(17,292 |
) |
|
|
(15,928 |
) |
|
|
(14,193 |
) |
|
|
(10,894 |
) |
|
|
(13,830 |
) |
|
|
(13,468 |
) |
|
|
(10,098 |
) |
|
|
(16,009 |
) |
|
Credit reserve
|
|
|
(64,717 |
) |
|
|
(76,979 |
) |
|
|
(96,657 |
) |
|
|
(127,627 |
) |
|
|
(139,320 |
) |
|
|
(146,018 |
) |
|
|
(471,957 |
) |
|
|
(492,459 |
) |
|
Unrealized gains (losses), net
|
|
|
30,225 |
|
|
|
30,641 |
|
|
|
27,588 |
|
|
|
24,559 |
|
|
|
24,556 |
|
|
|
32,371 |
|
|
|
23,322 |
|
|
|
(7,410 |
) |
|
Unrealized gains, net
|
|
|
1,081 |
|
|
|
963 |
|
|
|
904 |
|
|
|
224 |
|
|
|
1,448 |
|
|
|
1,351 |
|
|
|
4,169 |
|
|
|
1,502 |
|
|
Fair value
|
|
$ |
297,758 |
|
|
$ |
326,365 |
|
|
$ |
332,829 |
|
|
$ |
303,635 |
|
|
$ |
349,141 |
|
|
$ |
308,869 |
|
|
$ |
276,499 |
|
|
$ |
230,259 |
|
|
Fair value
|
|
$ |
6,362 |
|
|
$ |
7,496 |
|
|
$ |
7,912 |
|
|
$ |
7,610 |
|
|
$ |
8,876 |
|
|
$ |
9,200 |
|
|
$ |
16,833 |
|
|
$ |
15,669 |
|
| |
|
|
|
|
|
|
|
|
|
|
|
|
|
|
|
|
|
|
|
|
|
|
|
|
|
|
|
|
|
|
|
|
|
|
|
|
|
|
|
|
|
|
|
|
|
|
|
|
|
|
|
|
|
|
|
|
|
|
|
|
|
|
|
|
|
|
|
Average amortized cost
|
|
$ |
287,991 |
|
|
$ |
301,498 |
|
|
$ |
297,197 |
|
|
$ |
286,462 |
|
|
$ |
292,210 |
|
|
$ |
259,911 |
|
|
$ |
269,501 |
|
|
$ |
167,679 |
|
|
Average amortized cost
|
|
$ |
6,288 |
|
|
$ |
6,948 |
|
|
$ |
7,274 |
|
|
$ |
7,417 |
|
|
$ |
7,670 |
|
|
$ |
8,090 |
|
|
$ |
13,504 |
|
|
$ |
25,006 |
|
|
Interest income
|
|
$ |
8,338 |
|
|
$ |
8,415 |
|
|
$ |
8,583 |
|
|
$ |
9,007 |
|
|
$ |
10,208 |
|
|
$ |
7,907 |
|
|
$ |
10,374 |
|
|
$ |
6,607 |
|
|
Interest income
|
|
$ |
492 |
|
|
$ |
616 |
|
|
$ |
2,135 |
|
|
$ |
696 |
|
|
$ |
716 |
|
|
$ |
1,233 |
|
|
$ |
2,192 |
|
|
$ |
1,599 |
|
|
Annualized yield
|
|
|
11.58 |
% |
|
|
11.16 |
% |
|
|
11.55 |
% |
|
|
12.58 |
% |
|
|
13.97 |
% |
|
|
12.17 |
% |
|
|
15.40 |
% |
|
|
15.76 |
% |
|
Annualized yield
|
|
|
31.30 |
% |
|
|
35.46 |
% |
|
|
117.40 |
% |
|
|
37.55 |
% |
|
|
37.36 |
% |
|
|
60.97 |
% |
|
|
64.93 |
% |
|
|
25.58 |
% |
| |
|
|
|
|
|
|
|
|
|
|
|
|
|
|
|
|
|
|
|
|
|
|
|
|
|
|
|
|
|
|
|
|
|
|
|
|
|
|
|
|
|
|
|
|
|
|
|
|
|
|
|
|
|
|
|
|
|
|
|
|
|
|
|
|
|
|
|
Residential Re-REMIC AFS
|
|
|
|
|
|
|
|
|
|
|
|
|
|
|
|
|
|
|
|
|
|
|
|
|
|
|
|
|
|
|
|
|
|
CDO Subordinate AFS
|
|
|
|
|
|
|
|
|
|
|
|
|
|
|
|
|
|
|
|
|
|
|
|
|
|
|
|
|
|
|
|
|
|
Current face
|
|
$ |
131,860 |
|
|
$ |
139,426 |
|
|
$ |
139,426 |
|
|
$ |
139,426 |
|
|
$ |
146,964 |
|
|
$ |
255,975 |
|
|
$ |
318,703 |
|
|
$ |
236,070 |
|
|
Current face
|
|
$ |
11,837 |
|
|
$ |
14,815 |
|
|
$ |
14,786 |
|
|
$ |
14,761 |
|
|
$ |
14,736 |
|
|
$ |
14,710 |
|
|
$ |
14,683 |
|
|
$ |
14,650 |
|
|
Unamortized discount
|
|
|
(54,855 |
) |
|
|
(62,471 |
) |
|
|
(65,691 |
) |
|
|
(68,049 |
) |
|
|
(68,806 |
) |
|
|
(109,807 |
) |
|
|
(144,351 |
) |
|
|
(134,621 |
) |
|
Unamortized discount
|
|
|
(1,082 |
) |
|
|
(1,082 |
) |
|
|
(1,082 |
) |
|
|
(1,083 |
) |
|
|
(1,083 |
) |
|
|
(1,082 |
) |
|
|
(1,083 |
) |
|
|
(1,082 |
) |
|
Credit reserve
|
|
|
(46,546 |
) |
|
|
(44,182 |
) |
|
|
(40,656 |
) |
|
|
(37,962 |
) |
|
|
(42,299 |
) |
|
|
(81,726 |
) |
|
|
(94,626 |
) |
|
|
(45,874 |
) |
|
Credit reserve
|
|
|
(10,755 |
) |
|
|
(13,733 |
) |
|
|
(13,704 |
) |
|
|
(13,678 |
) |
|
|
(13,653 |
) |
|
|
(13,628 |
) |
|
|
(13,600 |
) |
|
|
(13,568 |
) |
|
Unrealized gains (losses), net
|
|
|
55,038 |
|
|
|
52,304 |
|
|
|
41,812 |
|
|
|
35,655 |
|
|
|
31,054 |
|
|
|
41,509 |
|
|
|
13,781 |
|
|
|
(434 |
) |
|
Unrealized gains, net
|
|
|
- |
|
|
|
- |
|
|
|
- |
|
|
|
- |
|
|
|
- |
|
|
|
25 |
|
|
|
25 |
|
|
|
25 |
|
|
Fair value
|
|
$ |
85,497 |
|
|
$ |
85,077 |
|
|
$ |
74,891 |
|
|
$ |
69,070 |
|
|
$ |
66,913 |
|
|
$ |
105,951 |
|
|
$ |
93,507 |
|
|
$ |
55,141 |
|
|
Fair value
|
|
$ |
- |
|
|
$ |
- |
|
|
$ |
- |
|
|
$ |
- |
|
|
$ |
- |
|
|
$ |
25 |
|
|
$ |
25 |
|
|
$ |
25 |
|
| |
|
|
|
|
|
|
|
|
|
|
|
|
|
|
|
|
|
|
|
|
|
|
|
|
|
|
|
|
|
|
|
|
|
|
|
|
|
|
|
|
|
|
|
|
|
|
|
|
|
|
|
|
|
|
|
|
|
|
|
|
|
|
|
|
|
|
|
Average amortized cost
|
|
$ |
32,648 |
|
|
$ |
32,917 |
|
|
$ |
33,250 |
|
|
$ |
34,385 |
|
|
$ |
45,852 |
|
|
$ |
73,938 |
|
|
$ |
69,980 |
|
|
$ |
26,419 |
|
|
Average amortized cost
|
|
$ |
- |
|
|
$ |
- |
|
|
$ |
- |
|
|
$ |
- |
|
|
$ |
- |
|
|
$ |
- |
|
|
$ |
- |
|
|
$ |
21 |
|
|
Interest income
|
|
$ |
1,480 |
|
|
$ |
1,440 |
|
|
$ |
1,458 |
|
|
$ |
1,382 |
|
|
$ |
1,925 |
|
|
$ |
2,941 |
|
|
$ |
3,110 |
|
|
$ |
573 |
|
|
Interest income
|
|
$ |
34 |
|
|
$ |
- |
|
|
$ |
8 |
|
|
$ |
82 |
|
|
$ |
12 |
|
|
$ |
96 |
|
|
$ |
24 |
|
|
$ |
96 |
|
|
Annualized yield
|
|
|
18.13 |
% |
|
|
17.50 |
% |
|
|
17.55 |
% |
|
|
16.08 |
% |
|
|
16.79 |
% |
|
|
15.91 |
% |
|
|
17.77 |
% |
|
|
8.67 |
% |
|
Annualized yield
|
|
|
N/A |
|
|
|
N/A |
|
|
|
N/A |
|
|
|
N/A |
|
|
|
N/A |
|
|
|
N/A |
|
|
|
12.97 |
% |
|
|
25.09 |
% |
| |
|
|
|
|
|
|
|
|
|
|
|
|
|
|
|
|
|
|
|
|
|
|
|
|
|
|
|
|
|
|
|
|
|
|
|
|
|
|
|
|
|
|
|
|
|
|
|
|
|
|
|
|
|
|
|
|
|
|
|
|
|
|
|
|
|
|
|
Residential Prime Subordinate AFS
|
|
|
|
|
|
|
|
|
|
|
|
|
|
|
|
|
|
|
|
|
|
|
|
|
|
|
|
|
|
|
|
|
|
Fair Value Securities
|
|
|
|
|
|
|
|
|
|
|
|
|
|
|
|
|
|
|
|
|
|
|
|
|
|
|
|
|
|
|
|
|
|
Current face
|
|
$ |
258,615 |
|
|
$ |
273,042 |
|
|
$ |
278,171 |
|
|
$ |
297,932 |
|
|
$ |
324,226 |
|
|
$ |
347,848 |
|
|
$ |
378,417 |
|
|
$ |
411,166 |
|
|
|
|
|
|
|
|
|
|
|
|
|
|
|
|
|
|
|
|
|
|
|
|
|
|
|
|
|
|
|
|
|
|
|
|
Unamortized discount
|
|
|
(24,016 |
) |
|
|
(24,308 |
) |
|
|
(23,488 |
) |
|
|
(22,886 |
) |
|
|
(23,310 |
) |
|
|
(21,588 |
) |
|
|
(22,597 |
) |
|
|
(28,259 |
) |
|
|
|
|
|
|
|
|
|
|
|
|
|
|
|
|
|
|
|
|
|
|
|
|
|
|
|
|
|
|
|
|
|
|
|
Credit reserve
|
|
|
(179,587 |
) |
|
|
(199,754 |
) |
|
|
(217,996 |
) |
|
|
(240,357 |
) |
|
|
(261,854 |
) |
|
|
(282,813 |
) |
|
|
(306,728 |
) |
|
|
(319,653 |
) |
|
|
|
|
|
|
|
|
|
|
|
|
|
|
|
|
|
|
|
|
|
|
|
|
|
|
|
|
|
|
|
|
|
|
|
Unrealized gains (losses), net
|
|
|
3,858 |
|
|
|
4,866 |
|
|
|
(3,663 |
) |
|
|
(18,665 |
) |
|
|
(22,812 |
) |
|
|
(24,256 |
) |
|
|
(27,643 |
) |
|
|
(37,112 |
) |
|
|
|
|
|
|
|
|
|
|
|
|
|
|
|
|
|
|
|
|
|
|
|
|
|
|
|
|
|
|
|
|
|
|
|
Fair value
|
|
$ |
58,870 |
|
|
$ |
53,846 |
|
|
$ |
33,024 |
|
|
$ |
16,024 |
|
|
$ |
16,250 |
|
|
$ |
19,191 |
|
|
$ |
21,449 |
|
|
$ |
26,142 |
|
|
Fair value
|
|
$ |
20,701 |
|
|
$ |
21,354 |
|
|
$ |
22,826 |
|
|
$ |
18,464 |
|
|
$ |
19,990 |
|
|
$ |
7,842 |
|
|
$ |
5,314 |
|
|
$ |
3,810 |
|
| |
|
|
|
|
|
|
|
|
|
|
|
|
|
|
|
|
|
|
|
|
|
|
|
|
|
|
|
|
|
|
|
|
|
|
|
|
|
|
|
|
|
|
|
|
|
|
|
|
|
|
|
|
|
|
|
|
|
|
|
|
|
|
|
|
|
|
|
Average amortized cost
|
|
$ |
52,642 |
|
|
$ |
45,550 |
|
|
$ |
35,443 |
|
|
$ |
37,731 |
|
|
$ |
41,373 |
|
|
$ |
46,637 |
|
|
$ |
58,063 |
|
|
$ |
42,353 |
|
|
Average fair value
|
|
$ |
21,101 |
|
|
$ |
21,713 |
|
|
$ |
20,539 |
|
|
$ |
17,743 |
|
|
$ |
20,494 |
|
|
$ |
5,740 |
|
|
$ |
3,905 |
|
|
$ |
4,209 |
|
|
Interest income
|
|
$ |
4,110 |
|
|
$ |
4,170 |
|
|
$ |
3,328 |
|
|
$ |
3,219 |
|
|
$ |
2,847 |
|
|
$ |
3,406 |
|
|
$ |
4,135 |
|
|
$ |
3,703 |
|
|
Interest income
|
|
$ |
2,124 |
|
|
$ |
2,241 |
|
|
$ |
2,350 |
|
|
$ |
2,559 |
|
|
$ |
2,957 |
|
|
$ |
1,102 |
|
|
$ |
1,231 |
|
|
$ |
872 |
|
|
Annualized yield
|
|
|
31.23 |
% |
|
|
36.61 |
% |
|
|
37.55 |
% |
|
|
34.13 |
% |
|
|
27.53 |
% |
|
|
29.21 |
% |
|
|
28.49 |
% |
|
|
34.97 |
% |
|
Annualized yield
|
|
|
40.27 |
% |
|
|
41.29 |
% |
|
|
45.76 |
% |
|
|
57.68 |
% |
|
|
57.72 |
% |
|
|
76.79 |
% |
|
|
126.12 |
% |
|
|
82.86 |
% |
(1) Annualized yields are based on average amortized cost. Cash flows from many of our subordinate securities can be volatile and in certain cases (e.g., when the fair value of certain securities are close to zero) any interest income earned can result in unusually high reported yields that are not sustainable and not necessarily meaningful.
| THE REDWOOD REVIEW 1ST QUARTER 2011 |
Table 6: Balances & Yields by Securities Portfolio at Redwood
|
47 |
 |
Table 7: Securities Portfolio Activity at Redwood ($ in thousands)
|
48 |
| |
|
|
|
|
|
|
|
|
|
|
|
|
|
|
|
|
|
|
|
|
|
|
|
|
|
|
|
|
|
|
|
|
| |
|
2011
|
|
|
2010
|
|
|
2010
|
|
|
2010
|
|
|
2010
|
|
|
|
|
2011
|
|
|
2010
|
|
|
2010
|
|
|
2010
|
|
|
2010
|
|
| |
|
Q1 |
|
|
Q4 |
|
|
Q3 |
|
|
Q2 |
|
|
Q1 |
|
|
|
|
Q1 |
|
|
Q4 |
|
|
Q3 |
|
|
Q2 |
|
|
Q1 |
|
|
Residential Prime Senior
|
|
|
|
|
|
|
|
|
|
|
|
|
|
|
|
|
|
|
|
|
|
Residential Real Estate Loans
|
|
|
|
|
|
|
|
|
|
|
|
|
|
|
|
|
|
|
|
|
|
Beginning fair value
|
|
$ |
315,891 |
|
|
$ |
315,934 |
|
|
$ |
309,702 |
|
|
$ |
372,140 |
|
|
$ |
329,208 |
|
|
Beginning fair value
|
|
$ |
254,936 |
|
|
$ |
63,487 |
|
|
$ |
2,404 |
|
|
$ |
2,227 |
|
|
$ |
2,374 |
|
|
Acquisitions
|
|
|
3,317 |
|
|
|
6,043 |
|
|
|
9,954 |
|
|
|
1,055 |
|
|
|
56,010 |
|
|
Acquisitions
|
|
|
98,960 |
|
|
|
194,863 |
|
|
|
62,135 |
|
|
|
- |
|
|
|
- |
|
|
Sales
|
|
|
(2,825 |
) |
|
|
- |
|
|
|
- |
|
|
|
(43,485 |
) |
|
|
(8,780 |
) |
|
Transfers to Securitization Entities
|
|
|
(295,103 |
) |
|
|
- |
|
|
|
- |
|
|
|
- |
|
|
|
- |
|
|
Effect of principal payments
|
|
|
(11,655 |
) |
|
|
(15,199 |
) |
|
|
(12,186 |
) |
|
|
(13,065 |
) |
|
|
(11,220 |
) |
|
Principal Payments
|
|
|
(3,922 |
) |
|
|
(3,517 |
) |
|
|
(601 |
) |
|
|
46 |
|
|
|
(27 |
) |
|
Change in fair value, net
|
|
|
1,464 |
|
|
|
9,113 |
|
|
|
8,464 |
|
|
|
(6,943 |
) |
|
|
6,922 |
|
|
Transfers to REO
|
|
|
- |
|
|
|
- |
|
|
|
(63 |
) |
|
|
(165 |
) |
|
|
- |
|
|
Ending fair value
|
|
$ |
306,192 |
|
|
$ |
315,891 |
|
|
$ |
315,934 |
|
|
$ |
309,702 |
|
|
$ |
372,140 |
|
|
Changes in fair value, net
|
|
|
(1 |
) |
|
|
103 |
|
|
|
(388 |
) |
|
|
296 |
|
|
|
(120 |
) |
| |
|
|
|
|
|
|
|
|
|
|
|
|
|
|
|
|
|
|
|
|
|
Ending fair value
|
|
$ |
54,870 |
|
|
$ |
254,936 |
|
|
$ |
63,487 |
|
|
$ |
2,404 |
|
|
$ |
2,227 |
|
|
Residential Non-Prime Senior
|
|
|
|
|
|
|
|
|
|
|
|
|
|
|
|
|
|
|
|
|
|
|
|
|
|
|
|
|
|
|
|
|
|
|
|
|
|
|
|
|
|
|
|
Beginning fair value
|
|
$ |
346,107 |
|
|
$ |
354,106 |
|
|
$ |
320,397 |
|
|
$ |
367,372 |
|
|
$ |
314,952 |
|
|
Commercial Subordinate
|
|
|
|
|
|
|
|
|
|
|
|
|
|
|
|
|
|
|
|
|
|
Acquisitions
|
|
|
- |
|
|
|
635 |
|
|
|
32,777 |
|
|
|
16,113 |
|
|
|
118,195 |
|
|
Beginning fair value
|
|
$ |
7,496 |
|
|
$ |
7,912 |
|
|
$ |
7,610 |
|
|
$ |
8,876 |
|
|
$ |
9,200 |
|
|
Sales
|
|
|
(24,486 |
) |
|
|
- |
|
|
|
- |
|
|
|
(54,285 |
) |
|
|
(49,361 |
) |
|
Acquisitions
|
|
|
- |
|
|
|
- |
|
|
|
- |
|
|
|
- |
|
|
|
- |
|
|
Effect of principal payments
|
|
|
(9,033 |
) |
|
|
(12,298 |
) |
|
|
(9,657 |
) |
|
|
(12,582 |
) |
|
|
(10,242 |
) |
|
Sales
|
|
|
(2,116 |
) |
|
|
- |
|
|
|
- |
|
|
|
- |
|
|
|
- |
|
|
Change in fair value, net
|
|
|
4,038 |
|
|
|
3,664 |
|
|
|
10,589 |
|
|
|
3,779 |
|
|
|
(6,171 |
) |
|
Effect of principal payments
|
|
|
- |
|
|
|
- |
|
|
|
- |
|
|
|
- |
|
|
|
- |
|
|
Ending fair value
|
|
$ |
316,626 |
|
|
$ |
346,107 |
|
|
$ |
354,106 |
|
|
$ |
320,397 |
|
|
$ |
367,372 |
|
|
Change in fair value, net
|
|
|
982 |
|
|
|
(416 |
) |
|
|
302 |
|
|
|
(1,266 |
) |
|
|
(324 |
) |
| |
|
|
|
|
|
|
|
|
|
|
|
|
|
|
|
|
|
|
|
|
|
Ending fair value
|
|
$ |
6,362 |
|
|
$ |
7,496 |
|
|
$ |
7,912 |
|
|
$ |
7,610 |
|
|
$ |
8,876 |
|
|
Re-REMIC
|
|
|
|
|
|
|
|
|
|
|
|
|
|
|
|
|
|
|
|
|
|
|
|
|
|
|
|
|
|
|
|
|
|
|
|
|
|
|
|
|
|
|
|
Beginning fair value
|
|
$ |
85,077 |
|
|
$ |
74,891 |
|
|
$ |
69,070 |
|
|
$ |
66,913 |
|
|
$ |
105,951 |
|
|
Commercial Real Estate Loans
|
|
|
|
|
|
|
|
|
|
|
|
|
|
|
|
|
|
|
|
|
|
Acquisitions
|
|
|
- |
|
|
|
- |
|
|
|
- |
|
|
|
- |
|
|
|
- |
|
|
Beginning fair value
|
|
$ |
30,537 |
|
|
$ |
242 |
|
|
$ |
243 |
|
|
$ |
244 |
|
|
$ |
245 |
|
|
Sales
|
|
|
(5,230 |
) |
|
|
- |
|
|
|
- |
|
|
|
(1,960 |
) |
|
|
(27,932 |
) |
|
Originations
|
|
|
11,925 |
|
|
|
30,275 |
|
|
|
- |
|
|
|
- |
|
|
|
- |
|
|
Effect of principal payments
|
|
|
- |
|
|
|
- |
|
|
|
- |
|
|
|
- |
|
|
|
- |
|
|
Principal payments
|
|
|
(2 |
) |
|
|
(2 |
) |
|
|
(2 |
) |
|
|
(2 |
) |
|
|
(2 |
) |
|
Change in fair value, net
|
|
|
5,650 |
|
|
|
10,186 |
|
|
|
5,821 |
|
|
|
4,117 |
|
|
|
(11,106 |
) |
|
Discount/fee amortization
|
|
|
23 |
|
|
|
22 |
|
|
|
1 |
|
|
|
1 |
|
|
|
1 |
|
|
Ending fair value
|
|
$ |
85,497 |
|
|
$ |
85,077 |
|
|
$ |
74,891 |
|
|
$ |
69,070 |
|
|
$ |
66,913 |
|
|
Changes in fair value, net
|
|
|
- |
|
|
|
- |
|
|
|
- |
|
|
|
- |
|
|
|
- |
|
| |
|
|
|
|
|
|
|
|
|
|
|
|
|
|
|
|
|
|
|
|
|
Ending fair value
|
|
$ |
42,483 |
|
|
$ |
30,537 |
|
|
$ |
242 |
|
|
$ |
243 |
|
|
$ |
244 |
|
|
Residential Prime Subordinate
|
|
|
|
|
|
|
|
|
|
|
|
|
|
|
|
|
|
|
|
|
|
|
|
|
|
|
|
|
|
|
|
|
|
|
|
|
|
|
|
|
|
|
|
Beginning fair value
|
|
$ |
54,232 |
|
|
$ |
33,384 |
|
|
$ |
16,406 |
|
|
$ |
16,596 |
|
|
$ |
19,510 |
|
|
CDO Subordinate
|
|
|
|
|
|
|
|
|
|
|
|
|
|
|
|
|
|
|
|
|
|
Acquisitions
|
|
|
9,906 |
|
|
|
15,283 |
|
|
|
7,088 |
|
|
|
2,223 |
|
|
|
- |
|
|
Beginning fair value
|
|
$ |
1,038 |
|
|
$ |
960 |
|
|
$ |
1,132 |
|
|
$ |
1,222 |
|
|
$ |
1,247 |
|
|
Sales
|
|
|
- |
|
|
|
- |
|
|
|
- |
|
|
|
- |
|
|
|
- |
|
|
Acquisitions
|
|
|
- |
|
|
|
- |
|
|
|
- |
|
|
|
- |
|
|
|
- |
|
|
Effect of principal payments
|
|
|
(2,073 |
) |
|
|
(692 |
) |
|
|
883 |
|
|
|
(474 |
) |
|
|
(415 |
) |
|
Sales
|
|
|
- |
|
|
|
- |
|
|
|
- |
|
|
|
- |
|
|
|
- |
|
|
Change in fair value, net
|
|
|
(2,826 |
) |
|
|
6,257 |
|
|
|
9,007 |
|
|
|
(1,939 |
) |
|
|
(2,499 |
) |
|
Effect of principal payments
|
|
|
- |
|
|
|
- |
|
|
|
- |
|
|
|
- |
|
|
|
- |
|
|
Ending fair value
|
|
$ |
59,239 |
|
|
$ |
54,232 |
|
|
$ |
33,384 |
|
|
$ |
16,406 |
|
|
$ |
16,596 |
|
|
Change in fair value, net
|
|
|
258 |
|
|
|
78 |
|
|
|
(172 |
) |
|
|
(90 |
) |
|
|
(25 |
) |
| |
|
|
|
|
|
|
|
|
|
|
|
|
|
|
|
|
|
|
|
|
|
Ending fair value
|
|
$ |
1,296 |
|
|
$ |
1,038 |
|
|
$ |
960 |
|
|
$ |
1,132 |
|
|
$ |
1,222 |
|
|
Residential Non-Prime Subordinate
|
|
|
|
|
|
|
|
|
|
|
|
|
|
|
|
|
|
|
|
|
|
|
|
|
|
|
|
|
|
|
|
|
|
|
|
|
|
|
|
|
|
|
|
Beginning fair value
|
|
$ |
13,376 |
|
|
$ |
10,041 |
|
|
$ |
10,030 |
|
|
$ |
6,544 |
|
|
$ |
1,295 |
|
|
|
|
|
|
|
|
|
|
|
|
|
|
|
|
|
|
|
|
|
|
|
|
Acquisitions
|
|
|
- |
|
|
|
3,820 |
|
|
|
- |
|
|
|
3,894 |
|
|
|
5,472 |
|
|
|
|
|
|
|
|
|
|
|
|
|
|
|
|
|
|
|
|
|
|
|
|
Sales
|
|
|
(703 |
) |
|
|
- |
|
|
|
- |
|
|
|
- |
|
|
|
- |
|
|
|
|
|
|
|
|
|
|
|
|
|
|
|
|
|
|
|
|
|
|
|
|
Effect of principal payments
|
|
|
(354 |
) |
|
|
(542 |
) |
|
|
(320 |
) |
|
|
(352 |
) |
|
|
(111 |
) |
|
|
|
|
|
|
|
|
|
|
|
|
|
|
|
|
|
|
|
|
|
|
|
Change in fair value, net
|
|
|
(123 |
) |
|
|
57 |
|
|
|
331 |
|
|
|
(56 |
) |
|
|
(112 |
) |
|
|
|
|
|
|
|
|
|
|
|
|
|
|
|
|
|
|
|
|
|
|
|
Ending fair value
|
|
$ |
12,196 |
|
|
$ |
13,376 |
|
|
$ |
10,041 |
|
|
$ |
10,030 |
|
|
$ |
6,544 |
|
|
|
|
|
|
|
|
|
|
|
|
|
|
|
|
|
|
|
|
|
|
|
| THE REDWOOD REVIEW 1ST QUARTER 2011 |
Table 7: Securities Portfolio Activity at Redwood
|
|
| |
Table 8A: Residential Prime Securities at Redwood and Underlying Loan Characteristics(1) ($ in thousands)
|
|
| |
|
|
|
|
|
|
|
|
|
|
|
|
|
|
|
|
|
|
|
|
|
|
|
|
| |
|
2011
|
|
|
2010
|
|
|
2010
|
|
|
2010
|
|
|
2010
|
|
|
2009
|
|
|
2009
|
|
|
2009
|
|
| |
|
Q1
|
|
|
Q4
|
|
|
Q3
|
|
|
Q2
|
|
|
Q1
|
|
|
Q4
|
|
|
Q3
|
|
|
Q2
|
|
| |
|
|
|
|
|
|
|
|
|
|
|
|
|
|
|
|
|
|
|
|
|
|
|
|
|
Senior AFS
|
|
$ |
306,192 |
|
|
$ |
315,891 |
|
|
$ |
315,934 |
|
|
$ |
309,702 |
|
|
$ |
372,140 |
|
|
$ |
329,208 |
|
|
$ |
336,659 |
|
|
$ |
183,466 |
|
|
Subordinate AFS
|
|
|
58,870 |
|
|
|
53,846 |
|
|
|
33,024 |
|
|
|
16,024 |
|
|
|
16,250 |
|
|
|
19,191 |
|
|
|
21,449 |
|
|
|
26,142 |
|
|
Fair value
|
|
|
369 |
|
|
|
386 |
|
|
|
360 |
|
|
|
382 |
|
|
|
346 |
|
|
|
319 |
|
|
|
477 |
|
|
|
600 |
|
|
Total Residential Prime Securities
|
|
$ |
365,431 |
|
|
$ |
370,123 |
|
|
$ |
349,318 |
|
|
$ |
326,108 |
|
|
$ |
388,736 |
|
|
$ |
348,718 |
|
|
$ |
358,585 |
|
|
$ |
210,208 |
|
| |
|
|
|
|
|
|
|
|
|
|
|
|
|
|
|
|
|
|
|
|
|
|
|
|
|
|
|
|
|
|
|
|
|
Number of loans
|
|
|
109,221 |
|
|
|
121,173 |
|
|
|
124,536 |
|
|
|
140,951 |
|
|
|
156,375 |
|
|
|
168,449 |
|
|
|
184,849 |
|
|
|
201,789 |
|
|
Total loan face
|
|
$ |
43,242,656 |
|
|
$ |
49,071,513 |
|
|
$ |
52,490,472 |
|
|
$ |
59,814,476 |
|
|
$ |
71,413,439 |
|
|
$ |
76,332,218 |
|
|
$ |
84,519,707 |
|
|
$ |
92,121,182 |
|
|
Average loan size
|
|
$ |
396 |
|
|
$ |
405 |
|
|
$ |
421 |
|
|
$ |
424 |
|
|
$ |
457 |
|
|
$ |
453 |
|
|
$ |
457 |
|
|
$ |
457 |
|
| |
|
|
|
|
|
|
|
|
|
|
|
|
|
|
|
|
|
|
|
|
|
|
|
|
|
|
|
|
|
|
|
|
|
Year 2008 origination
|
|
|
0 |
% |
|
|
0 |
% |
|
|
0 |
% |
|
|
0 |
% |
|
|
0 |
% |
|
|
1 |
% |
|
|
0 |
% |
|
|
0 |
% |
|
Year 2007 origination
|
|
|
10 |
% |
|
|
9 |
% |
|
|
11 |
% |
|
|
7 |
% |
|
|
10 |
% |
|
|
10 |
% |
|
|
9 |
% |
|
|
9 |
% |
|
Year 2006 origination
|
|
|
11 |
% |
|
|
11 |
% |
|
|
11 |
% |
|
|
14 |
% |
|
|
12 |
% |
|
|
12 |
% |
|
|
12 |
% |
|
|
12 |
% |
|
Year 2005 origination
|
|
|
17 |
% |
|
|
17 |
% |
|
|
16 |
% |
|
|
20 |
% |
|
|
21 |
% |
|
|
19 |
% |
|
|
20 |
% |
|
|
19 |
% |
|
Year 2004 origination and earlier
|
|
|
62 |
% |
|
|
63 |
% |
|
|
62 |
% |
|
|
59 |
% |
|
|
57 |
% |
|
|
58 |
% |
|
|
59 |
% |
|
|
60 |
% |
| |
|
|
|
|
|
|
|
|
|
|
|
|
|
|
|
|
|
|
|
|
|
|
|
|
|
|
|
|
|
|
|
|
|
Geographic concentration
|
|
|
|
|
|
|
|
|
|
|
|
|
|
|
|
|
|
|
|
|
|
|
|
|
|
|
|
|
|
|
|
|
|
Southern CA
|
|
|
24 |
% |
|
|
24 |
% |
|
|
25 |
% |
|
|
25 |
% |
|
|
25 |
% |
|
|
25 |
% |
|
|
27 |
% |
|
|
24 |
% |
|
Northern CA
|
|
|
22 |
% |
|
|
22 |
% |
|
|
22 |
% |
|
|
22 |
% |
|
|
22 |
% |
|
|
22 |
% |
|
|
20 |
% |
|
|
23 |
% |
|
New York
|
|
|
6 |
% |
|
|
7 |
% |
|
|
7 |
% |
|
|
6 |
% |
|
|
7 |
% |
|
|
7 |
% |
|
|
6 |
% |
|
|
7 |
% |
|
Florida
|
|
|
6 |
% |
|
|
6 |
% |
|
|
6 |
% |
|
|
6 |
% |
|
|
6 |
% |
|
|
6 |
% |
|
|
7 |
% |
|
|
5 |
% |
|
Virginia
|
|
|
4 |
% |
|
|
4 |
% |
|
|
4 |
% |
|
|
4 |
% |
|
|
4 |
% |
|
|
4 |
% |
|
|
2 |
% |
|
|
4 |
% |
|
New Jersey
|
|
|
3 |
% |
|
|
3 |
% |
|
|
3 |
% |
|
|
3 |
% |
|
|
3 |
% |
|
|
3 |
% |
|
|
3 |
% |
|
|
3 |
% |
|
Illinois
|
|
|
3 |
% |
|
|
3 |
% |
|
|
3 |
% |
|
|
3 |
% |
|
|
3 |
% |
|
|
3 |
% |
|
|
2 |
% |
|
|
3 |
% |
|
Other states
|
|
|
32 |
% |
|
|
31 |
% |
|
|
30 |
% |
|
|
31 |
% |
|
|
30 |
% |
|
|
30 |
% |
|
|
33 |
% |
|
|
31 |
% |
| |
|
|
|
|
|
|
|
|
|
|
|
|
|
|
|
|
|
|
|
|
|
|
|
|
|
|
|
|
|
|
|
|
|
Wtd Avg Original LTV
|
|
|
68 |
% |
|
|
68 |
% |
|
|
68 |
% |
|
|
68 |
% |
|
|
68 |
% |
|
|
68 |
% |
|
|
68 |
% |
|
|
68 |
% |
|
Original LTV: 0 - 50
|
|
|
12 |
% |
|
|
13 |
% |
|
|
13 |
% |
|
|
13 |
% |
|
|
13 |
% |
|
|
13 |
% |
|
|
13 |
% |
|
|
13 |
% |
|
Original LTV: 50.01 - 60
|
|
|
11 |
% |
|
|
12 |
% |
|
|
11 |
% |
|
|
12 |
% |
|
|
11 |
% |
|
|
11 |
% |
|
|
12 |
% |
|
|
12 |
% |
|
Original LTV: 60.01 - 70
|
|
|
22 |
% |
|
|
22 |
% |
|
|
22 |
% |
|
|
22 |
% |
|
|
22 |
% |
|
|
22 |
% |
|
|
22 |
% |
|
|
22 |
% |
|
Original LTV: 70.01 - 80
|
|
|
50 |
% |
|
|
49 |
% |
|
|
49 |
% |
|
|
50 |
% |
|
|
51 |
% |
|
|
50 |
% |
|
|
50 |
% |
|
|
49 |
% |
|
Original LTV: 80.01 - 90
|
|
|
3 |
% |
|
|
3 |
% |
|
|
3 |
% |
|
|
2 |
% |
|
|
2 |
% |
|
|
2 |
% |
|
|
2 |
% |
|
|
2 |
% |
|
Original LTV: 90.01 - 100
|
|
|
2 |
% |
|
|
1 |
% |
|
|
2 |
% |
|
|
1 |
% |
|
|
1 |
% |
|
|
1 |
% |
|
|
1 |
% |
|
|
1 |
% |
|
Unknown
|
|
|
0 |
% |
|
|
0 |
% |
|
|
0 |
% |
|
|
0 |
% |
|
|
0 |
% |
|
|
1 |
% |
|
|
0 |
% |
|
|
1 |
% |
| |
|
|
|
|
|
|
|
|
|
|
|
|
|
|
|
|
|
|
|
|
|
|
|
|
|
|
|
|
|
|
|
|
|
Wtd Avg FICO
|
|
|
736 |
|
|
|
737 |
|
|
|
738 |
|
|
|
739 |
|
|
|
740 |
|
|
|
740 |
|
|
|
740 |
|
|
|
741 |
|
|
FICO: <= 680
|
|
|
10 |
% |
|
|
10 |
% |
|
|
8 |
% |
|
|
9 |
% |
|
|
8 |
% |
|
|
8 |
% |
|
|
8 |
% |
|
|
8 |
% |
|
FICO: 681 - 700
|
|
|
10 |
% |
|
|
10 |
% |
|
|
10 |
% |
|
|
9 |
% |
|
|
9 |
% |
|
|
9 |
% |
|
|
9 |
% |
|
|
9 |
% |
|
FICO: 701 - 720
|
|
|
14 |
% |
|
|
14 |
% |
|
|
14 |
% |
|
|
14 |
% |
|
|
14 |
% |
|
|
14 |
% |
|
|
14 |
% |
|
|
13 |
% |
|
FICO: 721 - 740
|
|
|
14 |
% |
|
|
14 |
% |
|
|
15 |
% |
|
|
15 |
% |
|
|
14 |
% |
|
|
14 |
% |
|
|
14 |
% |
|
|
14 |
% |
|
FICO: 741 - 760
|
|
|
16 |
% |
|
|
16 |
% |
|
|
16 |
% |
|
|
16 |
% |
|
|
16 |
% |
|
|
16 |
% |
|
|
16 |
% |
|
|
16 |
% |
|
FICO: 761 - 780
|
|
|
18 |
% |
|
|
18 |
% |
|
|
19 |
% |
|
|
19 |
% |
|
|
19 |
% |
|
|
19 |
% |
|
|
19 |
% |
|
|
19 |
% |
|
FICO: 781 - 800
|
|
|
13 |
% |
|
|
13 |
% |
|
|
13 |
% |
|
|
13 |
% |
|
|
14 |
% |
|
|
14 |
% |
|
|
14 |
% |
|
|
15 |
% |
|
FICO: >= 801
|
|
|
3 |
% |
|
|
3 |
% |
|
|
3 |
% |
|
|
3 |
% |
|
|
4 |
% |
|
|
4 |
% |
|
|
4 |
% |
|
|
4 |
% |
|
Unknown
|
|
|
2 |
% |
|
|
2 |
% |
|
|
2 |
% |
|
|
3 |
% |
|
|
2 |
% |
|
|
2 |
% |
|
|
2 |
% |
|
|
2 |
% |
| |
|
|
|
|
|
|
|
|
|
|
|
|
|
|
|
|
|
|
|
|
|
|
|
|
|
|
|
|
|
|
|
|
|
Conforming balance % (2)
|
|
|
59 |
% |
|
|
59 |
% |
|
|
58 |
% |
|
|
58 |
% |
|
|
57 |
% |
|
|
58 |
% |
|
|
59 |
% |
|
|
59 |
% |
|
> $1 MM %
|
|
|
8 |
% |
|
|
9 |
% |
|
|
9 |
% |
|
|
9 |
% |
|
|
9 |
% |
|
|
9 |
% |
|
|
8 |
% |
|
|
8 |
% |
| |
|
|
|
|
|
|
|
|
|
|
|
|
|
|
|
|
|
|
|
|
|
|
|
|
|
|
|
|
|
|
|
|
|
2nd Home %
|
|
|
7 |
% |
|
|
7 |
% |
|
|
7 |
% |
|
|
7 |
% |
|
|
7 |
% |
|
|
7 |
% |
|
|
7 |
% |
|
|
7 |
% |
|
Investment Home %
|
|
|
2 |
% |
|
|
2 |
% |
|
|
2 |
% |
|
|
2 |
% |
|
|
2 |
% |
|
|
2 |
% |
|
|
2 |
% |
|
|
2 |
% |
| |
|
|
|
|
|
|
|
|
|
|
|
|
|
|
|
|
|
|
|
|
|
|
|
|
|
|
|
|
|
|
|
|
|
Purchase
|
|
|
42 |
% |
|
|
42 |
% |
|
|
43 |
% |
|
|
43 |
% |
|
|
45 |
% |
|
|
44 |
% |
|
|
44 |
% |
|
|
44 |
% |
|
Cash Out Refi
|
|
|
23 |
% |
|
|
23 |
% |
|
|
22 |
% |
|
|
22 |
% |
|
|
22 |
% |
|
|
22 |
% |
|
|
22 |
% |
|
|
21 |
% |
|
Rate-Term Refi
|
|
|
34 |
% |
|
|
34 |
% |
|
|
34 |
% |
|
|
34 |
% |
|
|
33 |
% |
|
|
33 |
% |
|
|
33 |
% |
|
|
34 |
% |
|
Other
|
|
|
1 |
% |
|
|
1 |
% |
|
|
1 |
% |
|
|
1 |
% |
|
|
0 |
% |
|
|
1 |
% |
|
|
1 |
% |
|
|
1 |
% |
| |
|
|
|
|
|
|
|
|
|
|
|
|
|
|
|
|
|
|
|
|
|
|
|
|
|
|
|
|
|
|
|
|
|
Full Doc
|
|
|
50 |
% |
|
|
50 |
% |
|
|
50 |
% |
|
|
55 |
% |
|
|
55 |
% |
|
|
55 |
% |
|
|
55 |
% |
|
|
56 |
% |
|
No Doc
|
|
|
5 |
% |
|
|
6 |
% |
|
|
5 |
% |
|
|
5 |
% |
|
|
5 |
% |
|
|
5 |
% |
|
|
5 |
% |
|
|
4 |
% |
|
Other Doc (Lim, Red, Stated, etc)
|
|
|
42 |
% |
|
|
41 |
% |
|
|
42 |
% |
|
|
38 |
% |
|
|
37 |
% |
|
|
37 |
% |
|
|
37 |
% |
|
|
37 |
% |
|
Unknown/Not Categorized
|
|
|
3 |
% |
|
|
3 |
% |
|
|
3 |
% |
|
|
2 |
% |
|
|
3 |
% |
|
|
3 |
% |
|
|
3 |
% |
|
|
3 |
% |
| |
|
|
|
|
|
|
|
|
|
|
|
|
|
|
|
|
|
|
|
|
|
|
|
|
|
|
|
|
|
|
|
|
|
2-4 Family
|
|
|
1 |
% |
|
|
2 |
% |
|
|
1 |
% |
|
|
1 |
% |
|
|
2 |
% |
|
|
2 |
% |
|
|
1 |
% |
|
|
1 |
% |
|
Condo
|
|
|
10 |
% |
|
|
10 |
% |
|
|
10 |
% |
|
|
10 |
% |
|
|
10 |
% |
|
|
10 |
% |
|
|
10 |
% |
|
|
10 |
% |
|
Single Family
|
|
|
88 |
% |
|
|
87 |
% |
|
|
88 |
% |
|
|
87 |
% |
|
|
87 |
% |
|
|
87 |
% |
|
|
88 |
% |
|
|
88 |
% |
|
Other
|
|
|
1 |
% |
|
|
1 |
% |
|
|
1 |
% |
|
|
1 |
% |
|
|
1 |
% |
|
|
1 |
% |
|
|
1 |
% |
|
|
1 |
% |
| |
|
|
|
|
|
|
|
|
|
|
|
|
|
|
|
|
|
|
|
|
|
|
|
|
|
|
|
|
|
|
|
|
| |
|
|
|
|
|
|
|
|
|
|
|
|
|
|
|
|
|
|
|
|
|
|
|
|
|
|
|
|
|
|
|
|
| |
|
|
|
|
|
|
|
|
|
|
|
|
|
|
|
|
|
|
|
|
|
|
|
|
|
|
|
|
|
|
|
|
|
(1) Only the loan groups providing direct cash flow to securities we own are included.
|
|
(2) The definition of a conforming loan has significantly changed over time. For all periods shown in this table, the conforming balance definition available in March 2011 was used (which had a maximum loan balance of $729,750).
|
| THE REDWOOD REVIEW 1ST QUARTER 2011 |
Table 8A: Residential Prime Securities at Redwood and Underlying Loan Characteristics
|
49 |
| |
Table 8B: Residential Non-Prime Securities at Redwood and Underlying Loan Characteristics(1) ($ in thousands)
|
50 |
|
|
|
|
|
|
|
|
|
|
|
|
|
|
|
|
|
|
|
|
|
|
|
|
|
|
| |
|
2011
|
|
|
2010
|
|
|
2010
|
|
|
2010
|
|
|
2010
|
|
|
2009
|
|
|
2009
|
|
|
2009
|
|
| |
|
Q1
|
|
|
Q4
|
|
|
Q3
|
|
|
Q2
|
|
|
Q1
|
|
|
Q4
|
|
|
Q3
|
|
|
Q2
|
|
| |
|
|
|
|
|
|
|
|
|
|
|
|
|
|
|
|
|
|
|
|
|
|
|
|
|
Senior AFS
|
|
$ |
297,758 |
|
|
$ |
326,365 |
|
|
$ |
332,829 |
|
|
$ |
303,635 |
|
|
$ |
349,141 |
|
|
$ |
308,869 |
|
|
$ |
276,499 |
|
|
$ |
230,259 |
|
|
Subordinate AFS
|
|
|
12,028 |
|
|
|
13,188 |
|
|
|
9,812 |
|
|
|
9,842 |
|
|
|
6,353 |
|
|
|
1,077 |
|
|
|
981 |
|
|
|
2,961 |
|
|
Fair value
|
|
|
19,036 |
|
|
|
19,930 |
|
|
|
21,506 |
|
|
|
16,950 |
|
|
|
18,422 |
|
|
|
6,301 |
|
|
|
2,725 |
|
|
|
927 |
|
|
Total Residential Non-prime Securities
|
|
$ |
328,822 |
|
|
$ |
359,483 |
|
|
$ |
364,147 |
|
|
$ |
330,427 |
|
|
$ |
373,916 |
|
|
$ |
316,247 |
|
|
$ |
280,205 |
|
|
$ |
234,147 |
|
| |
|
|
|
|
|
|
|
|
|
|
|
|
|
|
|
|
|
|
|
|
|
|
|
|
|
|
|
|
|
|
|
|
|
Number of loans
|
|
|
57,542 |
|
|
|
65,949 |
|
|
|
67,713 |
|
|
|
72,621 |
|
|
|
79,448 |
|
|
|
73,102 |
|
|
|
73,970 |
|
|
|
71,041 |
|
|
Total loan face
|
|
$ |
12,723,531 |
|
|
$ |
14,615,940 |
|
|
$ |
15,181,465 |
|
|
$ |
16,931,963 |
|
|
$ |
19,644,742 |
|
|
$ |
20,445,051 |
|
|
$ |
21,588,255 |
|
|
$ |
22,498,418 |
|
|
Average loan size
|
|
$ |
221 |
|
|
$ |
222 |
|
|
$ |
224 |
|
|
$ |
233 |
|
|
$ |
247 |
|
|
$ |
280 |
|
|
$ |
292 |
|
|
$ |
317 |
|
| |
|
|
|
|
|
|
|
|
|
|
|
|
|
|
|
|
|
|
|
|
|
|
|
|
|
|
|
|
|
|
|
|
|
Year 2008 origination
|
|
|
0 |
% |
|
|
0 |
% |
|
|
0 |
% |
|
|
0 |
% |
|
|
0 |
% |
|
|
0 |
% |
|
|
0 |
% |
|
|
0 |
% |
|
Year 2007 origination
|
|
|
0 |
% |
|
|
0 |
% |
|
|
0 |
% |
|
|
7 |
% |
|
|
10 |
% |
|
|
11 |
% |
|
|
22 |
% |
|
|
23 |
% |
|
Year 2006 origination
|
|
|
15 |
% |
|
|
18 |
% |
|
|
18 |
% |
|
|
18 |
% |
|
|
9 |
% |
|
|
5 |
% |
|
|
8 |
% |
|
|
8 |
% |
|
Year 2005 origination
|
|
|
50 |
% |
|
|
49 |
% |
|
|
49 |
% |
|
|
45 |
% |
|
|
50 |
% |
|
|
47 |
% |
|
|
36 |
% |
|
|
34 |
% |
|
Year 2004 origination and earlier
|
|
|
35 |
% |
|
|
33 |
% |
|
|
33 |
% |
|
|
30 |
% |
|
|
31 |
% |
|
|
37 |
% |
|
|
34 |
% |
|
|
35 |
% |
| |
|
|
|
|
|
|
|
|
|
|
|
|
|
|
|
|
|
|
|
|
|
|
|
|
|
|
|
|
|
|
|
|
|
Geographic concentration
|
|
|
|
|
|
|
|
|
|
|
|
|
|
|
|
|
|
|
|
|
|
|
|
|
|
|
|
|
|
|
|
|
|
Southern CA
|
|
|
21 |
% |
|
|
20 |
% |
|
|
21 |
% |
|
|
22 |
% |
|
|
23 |
% |
|
|
25 |
% |
|
|
26 |
% |
|
|
25 |
% |
|
Northern CA
|
|
|
14 |
% |
|
|
14 |
% |
|
|
14 |
% |
|
|
14 |
% |
|
|
17 |
% |
|
|
18 |
% |
|
|
16 |
% |
|
|
18 |
% |
|
Florida
|
|
|
9 |
% |
|
|
9 |
% |
|
|
9 |
% |
|
|
9 |
% |
|
|
8 |
% |
|
|
8 |
% |
|
|
9 |
% |
|
|
9 |
% |
|
New York
|
|
|
5 |
% |
|
|
5 |
% |
|
|
5 |
% |
|
|
5 |
% |
|
|
5 |
% |
|
|
5 |
% |
|
|
5 |
% |
|
|
5 |
% |
|
Virginia
|
|
|
3 |
% |
|
|
4 |
% |
|
|
4 |
% |
|
|
4 |
% |
|
|
3 |
% |
|
|
3 |
% |
|
|
4 |
% |
|
|
3 |
% |
|
New Jersey
|
|
|
3 |
% |
|
|
3 |
% |
|
|
3 |
% |
|
|
4 |
% |
|
|
3 |
% |
|
|
4 |
% |
|
|
2 |
% |
|
|
4 |
% |
|
Illinois
|
|
|
3 |
% |
|
|
3 |
% |
|
|
3 |
% |
|
|
3 |
% |
|
|
3 |
% |
|
|
3 |
% |
|
|
2 |
% |
|
|
3 |
% |
|
Other states
|
|
|
42 |
% |
|
|
42 |
% |
|
|
41 |
% |
|
|
40 |
% |
|
|
38 |
% |
|
|
34 |
% |
|
|
36 |
% |
|
|
33 |
% |
| |
|
|
|
|
|
|
|
|
|
|
|
|
|
|
|
|
|
|
|
|
|
|
|
|
|
|
|
|
|
|
|
|
|
Wtd Avg Original LTV
|
|
|
73 |
% |
|
|
73 |
% |
|
|
73 |
% |
|
|
73 |
% |
|
|
73 |
% |
|
|
73 |
% |
|
|
74 |
% |
|
|
74 |
% |
|
Original LTV: 0 - 50
|
|
|
6 |
% |
|
|
7 |
% |
|
|
7 |
% |
|
|
7 |
% |
|
|
6 |
% |
|
|
5 |
% |
|
|
5 |
% |
|
|
5 |
% |
|
Original LTV: 50.01 - 60
|
|
|
8 |
% |
|
|
8 |
% |
|
|
8 |
% |
|
|
8 |
% |
|
|
8 |
% |
|
|
8 |
% |
|
|
7 |
% |
|
|
7 |
% |
|
Original LTV: 60.01 - 70
|
|
|
18 |
% |
|
|
18 |
% |
|
|
18 |
% |
|
|
18 |
% |
|
|
18 |
% |
|
|
19 |
% |
|
|
17 |
% |
|
|
17 |
% |
|
Original LTV: 70.01 - 80
|
|
|
58 |
% |
|
|
58 |
% |
|
|
58 |
% |
|
|
58 |
% |
|
|
58 |
% |
|
|
59 |
% |
|
|
59 |
% |
|
|
59 |
% |
|
Original LTV: 80.01 - 90
|
|
|
7 |
% |
|
|
6 |
% |
|
|
6 |
% |
|
|
6 |
% |
|
|
7 |
% |
|
|
6 |
% |
|
|
8 |
% |
|
|
8 |
% |
|
Original LTV: 90.01 - 100
|
|
|
3 |
% |
|
|
3 |
% |
|
|
3 |
% |
|
|
3 |
% |
|
|
3 |
% |
|
|
3 |
% |
|
|
4 |
% |
|
|
4 |
% |
|
Unknown
|
|
|
0 |
% |
|
|
0 |
% |
|
|
0 |
% |
|
|
0 |
% |
|
|
0 |
% |
|
|
0 |
% |
|
|
0 |
% |
|
|
0 |
% |
| |
|
|
|
|
|
|
|
|
|
|
|
|
|
|
|
|
|
|
|
|
|
|
|
|
|
|
|
|
|
|
|
|
|
Wtd Avg FICO
|
|
|
711 |
|
|
|
711 |
|
|
|
711 |
|
|
|
711 |
|
|
|
712 |
|
|
|
712 |
|
|
|
707 |
|
|
|
705 |
|
|
FICO: <= 680
|
|
|
27 |
% |
|
|
28 |
% |
|
|
27 |
% |
|
|
27 |
% |
|
|
26 |
% |
|
|
26 |
% |
|
|
30 |
% |
|
|
30 |
% |
|
FICO: 681 - 700
|
|
|
14 |
% |
|
|
14 |
% |
|
|
14 |
% |
|
|
14 |
% |
|
|
14 |
% |
|
|
15 |
% |
|
|
15 |
% |
|
|
16 |
% |
|
FICO: 701 - 720
|
|
|
14 |
% |
|
|
14 |
% |
|
|
14 |
% |
|
|
14 |
% |
|
|
15 |
% |
|
|
15 |
% |
|
|
14 |
% |
|
|
14 |
% |
|
FICO: 721 - 740
|
|
|
12 |
% |
|
|
12 |
% |
|
|
12 |
% |
|
|
12 |
% |
|
|
13 |
% |
|
|
13 |
% |
|
|
12 |
% |
|
|
12 |
% |
|
FICO: 741 - 760
|
|
|
12 |
% |
|
|
11 |
% |
|
|
12 |
% |
|
|
11 |
% |
|
|
12 |
% |
|
|
11 |
% |
|
|
11 |
% |
|
|
11 |
% |
|
FICO: 761 - 780
|
|
|
10 |
% |
|
|
10 |
% |
|
|
10 |
% |
|
|
10 |
% |
|
|
10 |
% |
|
|
10 |
% |
|
|
9 |
% |
|
|
9 |
% |
|
FICO: 781 - 800
|
|
|
7 |
% |
|
|
7 |
% |
|
|
7 |
% |
|
|
7 |
% |
|
|
7 |
% |
|
|
7 |
% |
|
|
6 |
% |
|
|
5 |
% |
|
FICO: >= 801
|
|
|
2 |
% |
|
|
2 |
% |
|
|
2 |
% |
|
|
2 |
% |
|
|
2 |
% |
|
|
2 |
% |
|
|
2 |
% |
|
|
2 |
% |
|
Unknown
|
|
|
2 |
% |
|
|
2 |
% |
|
|
2 |
% |
|
|
2 |
% |
|
|
1 |
% |
|
|
1 |
% |
|
|
1 |
% |
|
|
1 |
% |
| |
|
|
|
|
|
|
|
|
|
|
|
|
|
|
|
|
|
|
|
|
|
|
|
|
|
|
|
|
|
|
|
|
|
Conforming balance % (2)
|
|
|
86 |
% |
|
|
86 |
% |
|
|
86 |
% |
|
|
85 |
% |
|
|
81 |
% |
|
|
76 |
% |
|
|
74 |
% |
|
|
71 |
% |
|
> $1 MM %
|
|
|
3 |
% |
|
|
3 |
% |
|
|
3 |
% |
|
|
4 |
% |
|
|
6 |
% |
|
|
9 |
% |
|
|
9 |
% |
|
|
10 |
% |
| |
|
|
|
|
|
|
|
|
|
|
|
|
|
|
|
|
|
|
|
|
|
|
|
|
|
|
|
|
|
|
|
|
|
2nd Home %
|
|
|
4 |
% |
|
|
4 |
% |
|
|
4 |
% |
|
|
4 |
% |
|
|
5 |
% |
|
|
5 |
% |
|
|
5 |
% |
|
|
5 |
% |
|
Investment Home %
|
|
|
13 |
% |
|
|
13 |
% |
|
|
13 |
% |
|
|
13 |
% |
|
|
11 |
% |
|
|
9 |
% |
|
|
8 |
% |
|
|
8 |
% |
| |
|
|
|
|
|
|
|
|
|
|
|
|
|
|
|
|
|
|
|
|
|
|
|
|
|
|
|
|
|
|
|
|
|
Purchase
|
|
|
42 |
% |
|
|
42 |
% |
|
|
42 |
% |
|
|
40 |
% |
|
|
39 |
% |
|
|
40 |
% |
|
|
40 |
% |
|
|
41 |
% |
|
Cash Out Refi
|
|
|
41 |
% |
|
|
41 |
% |
|
|
41 |
% |
|
|
41 |
% |
|
|
42 |
% |
|
|
42 |
% |
|
|
42 |
% |
|
|
42 |
% |
|
Rate-Term Refi
|
|
|
16 |
% |
|
|
16 |
% |
|
|
16 |
% |
|
|
18 |
% |
|
|
18 |
% |
|
|
17 |
% |
|
|
17 |
% |
|
|
16 |
% |
|
Other
|
|
|
1 |
% |
|
|
1 |
% |
|
|
1 |
% |
|
|
1 |
% |
|
|
1 |
% |
|
|
1 |
% |
|
|
1 |
% |
|
|
1 |
% |
| |
|
|
|
|
|
|
|
|
|
|
|
|
|
|
|
|
|
|
|
|
|
|
|
|
|
|
|
|
|
|
|
|
|
Full Doc
|
|
|
39 |
% |
|
|
38 |
% |
|
|
38 |
% |
|
|
36 |
% |
|
|
37 |
% |
|
|
34 |
% |
|
|
34 |
% |
|
|
32 |
% |
|
No Doc
|
|
|
4 |
% |
|
|
3 |
% |
|
|
3 |
% |
|
|
3 |
% |
|
|
3 |
% |
|
|
2 |
% |
|
|
2 |
% |
|
|
2 |
% |
|
Other Doc (Lim, Red, Stated, etc)
|
|
|
56 |
% |
|
|
57 |
% |
|
|
57 |
% |
|
|
59 |
% |
|
|
59 |
% |
|
|
62 |
% |
|
|
62 |
% |
|
|
64 |
% |
|
Unknown/Not Categorized
|
|
|
1 |
% |
|
|
2 |
% |
|
|
2 |
% |
|
|
2 |
% |
|
|
1 |
% |
|
|
2 |
% |
|
|
2 |
% |
|
|
2 |
% |
| |
|
|
|
|
|
|
|
|
|
|
|
|
|
|
|
|
|
|
|
|
|
|
|
|
|
|
|
|
|
|
|
|
|
2-4 Family
|
|
|
8 |
% |
|
|
8 |
% |
|
|
8 |
% |
|
|
8 |
% |
|
|
6 |
% |
|
|
5 |
% |
|
|
5 |
% |
|
|
5 |
% |
|
Condo
|
|
|
8 |
% |
|
|
8 |
% |
|
|
8 |
% |
|
|
8 |
% |
|
|
8 |
% |
|
|
9 |
% |
|
|
9 |
% |
|
|
9 |
% |
|
Single Family
|
|
|
84 |
% |
|
|
84 |
% |
|
|
84 |
% |
|
|
84 |
% |
|
|
86 |
% |
|
|
86 |
% |
|
|
86 |
% |
|
|
86 |
% |
|
Other
|
|
|
0 |
% |
|
|
0 |
% |
|
|
0 |
% |
|
|
0 |
% |
|
|
0 |
% |
|
|
0 |
% |
|
|
0 |
% |
|
|
0 |
% |
| |
|
|
|
|
|
|
|
|
|
|
|
|
|
|
|
|
|
|
|
|
|
|
|
|
|
|
|
|
|
|
|
|
(1) Only the loan groups providing direct cash flow to securities we own are included.
(2) The definition of a conforming loan has significantly changed over time. For all periods shown in this table, the conforming balance definition available in March 2011 was used (which had a maximum loan balance of $729,750).
| THE REDWOOD REVIEW 1ST QUARTER 2011 |
Table 8B: Residential Non-Prime Securities at Redwood and Underlying Loan Characteristics
|
|
| |
Table 9: Residential Real Estate Loan Characteristics ($ in thousands)(1)
|
|
| |
|
|
|
|
|
|
|
|
|
|
|
|
|
|
|
|
|
|
|
|
|
|
|
|
|
|
|
|
|
|
| |
|
2011
|
|
|
2010
|
|
|
2010
|
|
|
2010
|
|
|
2010
|
|
|
2009
|
|
|
2009
|
|
|
2009
|
|
|
2009
|
|
|
2008
|
|
| |
|
Q1
|
|
|
Q4
|
|
|
Q3
|
|
|
Q2
|
|
|
Q1
|
|
|
Q4
|
|
|
Q3
|
|
|
Q2
|
|
|
Q1
|
|
|
Q4
|
|
| |
|
|
|
|
|
|
|
|
|
|
|
|
|
|
|
|
|
|
|
|
|
|
|
|
|
|
|
|
|
|
|
Residential loans
|
|
$ |
3,819,692 |
|
|
$ |
3,818,659 |
|
|
$ |
3,754,053 |
|
|
$ |
3,807,334 |
|
|
$ |
3,661,063 |
|
|
$ |
3,733,173 |
|
|
$ |
3,827,086 |
|
|
$ |
3,952,147 |
|
|
$ |
4,523,877 |
|
|
$ |
4,617,269 |
|
|
Number of loans
|
|
|
12,301 |
|
|
|
12,413 |
|
|
|
12,500 |
|
|
|
12,725 |
|
|
|
12,721 |
|
|
|
12,930 |
|
|
|
13,232 |
|
|
|
13,648 |
|
|
|
14,880 |
|
|
|
15,203 |
|
|
Average loan size
|
|
$ |
311 |
|
|
$ |
308 |
|
|
$ |
300 |
|
|
$ |
299 |
|
|
$ |
288 |
|
|
$ |
289 |
|
|
$ |
289 |
|
|
$ |
290 |
|
|
$ |
304 |
|
|
$ |
304 |
|
| |
|
|
|
|
|
|
|
|
|
|
|
|
|
|
|
|
|
|
|
|
|
|
|
|
|
|
|
|
|
|
|
|
|
|
|
|
|
|
|
|
|
Adjustable %
|
|
|
84 |
% |
|
|
86 |
% |
|
|
90 |
% |
|
|
90 |
% |
|
|
96 |
% |
|
|
95 |
% |
|
|
95 |
% |
|
|
95 |
% |
|
|
85 |
% |
|
|
85 |
% |
|
Hybrid %
|
|
|
11 |
% |
|
|
10 |
% |
|
|
10 |
% |
|
|
10 |
% |
|
|
4 |
% |
|
|
5 |
% |
|
|
5 |
% |
|
|
5 |
% |
|
|
15 |
% |
|
|
15 |
% |
|
Fixed %
|
|
|
5 |
% |
|
|
4 |
% |
|
|
0 |
% |
|
|
0 |
% |
|
|
0 |
% |
|
|
0 |
% |
|
|
0 |
% |
|
|
0 |
% |
|
|
0 |
% |
|
|
0 |
% |
| |
|
|
|
|
|
|
|
|
|
|
|
|
|
|
|
|
|
|
|
|
|
|
|
|
|
|
|
|
|
|
|
|
|
|
|
|
|
|
|
|
|
Amortizing %
|
|
|
8 |
% |
|
|
7 |
% |
|
|
5 |
% |
|
|
4 |
% |
|
|
3 |
% |
|
|
3 |
% |
|
|
3 |
% |
|
|
3 |
% |
|
|
4 |
% |
|
|
4 |
% |
|
Interest-only %
|
|
|
92 |
% |
|
|
93 |
% |
|
|
95 |
% |
|
|
96 |
% |
|
|
97 |
% |
|
|
97 |
% |
|
|
97 |
% |
|
|
97 |
% |
|
|
96 |
% |
|
|
96 |
% |
| |
|
|
|
|
|
|
|
|
|
|
|
|
|
|
|
|
|
|
|
|
|
|
|
|
|
|
|
|
|
|
|
|
|
|
|
|
|
|
|
|
|
Florida
|
|
|
13 |
% |
|
|
13 |
% |
|
|
13 |
% |
|
|
13 |
% |
|
|
14 |
% |
|
|
14 |
% |
|
|
14 |
% |
|
|
14 |
% |
|
|
13 |
% |
|
|
13 |
% |
|
Southern California
|
|
|
11 |
% |
|
|
11 |
% |
|
|
11 |
% |
|
|
11 |
% |
|
|
11 |
% |
|
|
11 |
% |
|
|
11 |
% |
|
|
11 |
% |
|
|
12 |
% |
|
|
12 |
% |
|
Northern California
|
|
|
11 |
% |
|
|
11 |
% |
|
|
10 |
% |
|
|
9 |
% |
|
|
8 |
% |
|
|
8 |
% |
|
|
8 |
% |
|
|
8 |
% |
|
|
9 |
% |
|
|
9 |
% |
|
New York
|
|
|
8 |
% |
|
|
7 |
% |
|
|
8 |
% |
|
|
8 |
% |
|
|
7 |
% |
|
|
7 |
% |
|
|
7 |
% |
|
|
7 |
% |
|
|
6 |
% |
|
|
6 |
% |
|
Georgia
|
|
|
5 |
% |
|
|
5 |
% |
|
|
5 |
% |
|
|
5 |
% |
|
|
5 |
% |
|
|
5 |
% |
|
|
5 |
% |
|
|
5 |
% |
|
|
5 |
% |
|
|
5 |
% |
|
New Jersey
|
|
|
4 |
% |
|
|
4 |
% |
|
|
4 |
% |
|
|
4 |
% |
|
|
5 |
% |
|
|
5 |
% |
|
|
4 |
% |
|
|
4 |
% |
|
|
4 |
% |
|
|
4 |
% |
|
Texas
|
|
|
5 |
% |
|
|
5 |
% |
|
|
5 |
% |
|
|
5 |
% |
|
|
5 |
% |
|
|
5 |
% |
|
|
5 |
% |
|
|
5 |
% |
|
|
5 |
% |
|
|
5 |
% |
|
Colorado
|
|
|
4 |
% |
|
|
4 |
% |
|
|
4 |
% |
|
|
4 |
% |
|
|
4 |
% |
|
|
4 |
% |
|
|
4 |
% |
|
|
4 |
% |
|
|
4 |
% |
|
|
4 |
% |
|
Virginia
|
|
|
3 |
% |
|
|
3 |
% |
|
|
3 |
% |
|
|
3 |
% |
|
|
3 |
% |
|
|
3 |
% |
|
|
3 |
% |
|
|
3 |
% |
|
|
3 |
% |
|
|
3 |
% |
|
Arizona
|
|
|
2 |
% |
|
|
2 |
% |
|
|
2 |
% |
|
|
2 |
% |
|
|
2 |
% |
|
|
2 |
% |
|
|
3 |
% |
|
|
3 |
% |
|
|
3 |
% |
|
|
3 |
% |
|
Illinois
|
|
|
2 |
% |
|
|
2 |
% |
|
|
2 |
% |
|
|
3 |
% |
|
|
2 |
% |
|
|
2 |
% |
|
|
2 |
% |
|
|
2 |
% |
|
|
3 |
% |
|
|
3 |
% |
|
Other states
|
|
|
32 |
% |
|
|
33 |
% |
|
|
33 |
% |
|
|
33 |
% |
|
|
34 |
% |
|
|
34 |
% |
|
|
34 |
% |
|
|
34 |
% |
|
|
33 |
% |
|
|
33 |
% |
| |
|
|
|
|
|
|
|
|
|
|
|
|
|
|
|
|
|
|
|
|
|
|
|
|
|
|
|
|
|
|
|
|
|
|
|
|
|
|
|
|
|
Year 2010 origination
|
|
|
7 |
% |
|
|
5 |
% |
|
|
2 |
% |
|
|
0 |
% |
|
|
0 |
% |
|
|
0 |
% |
|
|
0 |
% |
|
|
0 |
% |
|
|
0 |
% |
|
|
0 |
% |
|
Year 2009 origination
|
|
|
5 |
% |
|
|
5 |
% |
|
|
5 |
% |
|
|
6 |
% |
|
|
0 |
% |
|
|
0 |
% |
|
|
0 |
% |
|
|
0 |
% |
|
|
0 |
% |
|
|
0 |
% |
|
Year 2008 origination
|
|
|
0 |
% |
|
|
0 |
% |
|
|
0 |
% |
|
|
0 |
% |
|
|
0 |
% |
|
|
0 |
% |
|
|
0 |
% |
|
|
0 |
% |
|
|
0 |
% |
|
|
0 |
% |
|
Year 2007 origination
|
|
|
2 |
% |
|
|
2 |
% |
|
|
2 |
% |
|
|
2 |
% |
|
|
2 |
% |
|
|
2 |
% |
|
|
2 |
% |
|
|
2 |
% |
|
|
2 |
% |
|
|
2 |
% |
|
Year 2006 origination
|
|
|
5 |
% |
|
|
5 |
% |
|
|
5 |
% |
|
|
5 |
% |
|
|
6 |
% |
|
|
6 |
% |
|
|
5 |
% |
|
|
5 |
% |
|
|
15 |
% |
|
|
15 |
% |
|
Year 2005 origination
|
|
|
4 |
% |
|
|
4 |
% |
|
|
4 |
% |
|
|
4 |
% |
|
|
4 |
% |
|
|
4 |
% |
|
|
4 |
% |
|
|
4 |
% |
|
|
4 |
% |
|
|
4 |
% |
|
Year 2004 origination or earlier
|
|
|
77 |
% |
|
|
79 |
% |
|
|
82 |
% |
|
|
83 |
% |
|
|
88 |
% |
|
|
88 |
% |
|
|
89 |
% |
|
|
89 |
% |
|
|
79 |
% |
|
|
79 |
% |
| |
|
|
|
|
|
|
|
|
|
|
|
|
|
|
|
|
|
|
|
|
|
|
|
|
|
|
|
|
|
|
|
|
|
|
|
|
|
|
|
|
|
Wtd Avg Original LTV
|
|
|
66 |
% |
|
|
66 |
% |
|
|
66 |
% |
|
|
66 |
% |
|
|
67 |
% |
|
|
67 |
% |
|
|
67 |
% |
|
|
67 |
% |
|
|
68 |
% |
|
|
68 |
% |
|
Original LTV: 0 - 50
|
|
|
19 |
% |
|
|
19 |
% |
|
|
19 |
% |
|
|
19 |
% |
|
|
18 |
% |
|
|
18 |
% |
|
|
18 |
% |
|
|
18 |
% |
|
|
17 |
% |
|
|
17 |
% |
|
Original LTV: 50 - 60
|
|
|
13 |
% |
|
|
12 |
% |
|
|
12 |
% |
|
|
12 |
% |
|
|
11 |
% |
|
|
11 |
% |
|
|
11 |
% |
|
|
11 |
% |
|
|
11 |
% |
|
|
11 |
% |
|
Original LTV: 60 - 70
|
|
|
21 |
% |
|
|
21 |
% |
|
|
21 |
% |
|
|
20 |
% |
|
|
20 |
% |
|
|
20 |
% |
|
|
20 |
% |
|
|
20 |
% |
|
|
19 |
% |
|
|
19 |
% |
|
Original LTV: 70 - 80
|
|
|
40 |
% |
|
|
41 |
% |
|
|
41 |
% |
|
|
42 |
% |
|
|
43 |
% |
|
|
43 |
% |
|
|
43 |
% |
|
|
43 |
% |
|
|
46 |
% |
|
|
46 |
% |
|
Original LTV: 80 - 90
|
|
|
2 |
% |
|
|
2 |
% |
|
|
2 |
% |
|
|
2 |
% |
|
|
2 |
% |
|
|
2 |
% |
|
|
2 |
% |
|
|
2 |
% |
|
|
2 |
% |
|
|
2 |
% |
|
Original LTV: 90 - 100
|
|
|
5 |
% |
|
|
5 |
% |
|
|
5 |
% |
|
|
5 |
% |
|
|
6 |
% |
|
|
6 |
% |
|
|
6 |
% |
|
|
6 |
% |
|
|
5 |
% |
|
|
5 |
% |
| |
|
|
|
|
|
|
|
|
|
|
|
|
|
|
|
|
|
|
|
|
|
|
|
|
|
|
|
|
|
|
|
|
|
|
|
|
|
|
|
|
|
Wtd Avg FICO
|
|
|
735 |
|
|
|
734 |
|
|
|
733 |
|
|
|
733 |
|
|
|
730 |
|
|
|
730 |
|
|
|
730 |
|
|
|
731 |
|
|
|
731 |
|
|
|
732 |
|
|
FICO: <= 600
|
|
|
1 |
% |
|
|
1 |
% |
|
|
1 |
% |
|
|
1 |
% |
|
|
1 |
% |
|
|
1 |
% |
|
|
1 |
% |
|
|
1 |
% |
|
|
1 |
% |
|
|
1 |
% |
|
FICO: 601 -620
|
|
|
1 |
% |
|
|
1 |
% |
|
|
1 |
% |
|
|
1 |
% |
|
|
1 |
% |
|
|
1 |
% |
|
|
1 |
% |
|
|
1 |
% |
|
|
1 |
% |
|
|
1 |
% |
|
FICO: 621 - 640
|
|
|
2 |
% |
|
|
2 |
% |
|
|
2 |
% |
|
|
2 |
% |
|
|
2 |
% |
|
|
2 |
% |
|
|
2 |
% |
|
|
2 |
% |
|
|
2 |
% |
|
|
2 |
% |
|
FICO: 641 -660
|
|
|
3 |
% |
|
|
3 |
% |
|
|
4 |
% |
|
|
4 |
% |
|
|
4 |
% |
|
|
4 |
% |
|
|
4 |
% |
|
|
4 |
% |
|
|
4 |
% |
|
|
4 |
% |
|
FICO: 661 - 680
|
|
|
7 |
% |
|
|
7 |
% |
|
|
7 |
% |
|
|
7 |
% |
|
|
8 |
% |
|
|
8 |
% |
|
|
8 |
% |
|
|
8 |
% |
|
|
7 |
% |
|
|
7 |
% |
|
FICO: 681 - 700
|
|
|
10 |
% |
|
|
11 |
% |
|
|
11 |
% |
|
|
11 |
% |
|
|
12 |
% |
|
|
12 |
% |
|
|
12 |
% |
|
|
12 |
% |
|
|
12 |
% |
|
|
12 |
% |
|
FICO: 701 - 720
|
|
|
13 |
% |
|
|
13 |
% |
|
|
13 |
% |
|
|
13 |
% |
|
|
13 |
% |
|
|
13 |
% |
|
|
13 |
% |
|
|
14 |
% |
|
|
13 |
% |
|
|
13 |
% |
|
FICO: 721 - 740
|
|
|
13 |
% |
|
|
13 |
% |
|
|
13 |
% |
|
|
13 |
% |
|
|
13 |
% |
|
|
13 |
% |
|
|
13 |
% |
|
|
13 |
% |
|
|
13 |
% |
|
|
13 |
% |
|
FICO: 741 - 760
|
|
|
14 |
% |
|
|
14 |
% |
|
|
14 |
% |
|
|
14 |
% |
|
|
14 |
% |
|
|
14 |
% |
|
|
14 |
% |
|
|
14 |
% |
|
|
15 |
% |
|
|
15 |
% |
|
FICO: 761 - 780
|
|
|
17 |
% |
|
|
17 |
% |
|
|
17 |
% |
|
|
17 |
% |
|
|
16 |
% |
|
|
16 |
% |
|
|
16 |
% |
|
|
16 |
% |
|
|
17 |
% |
|
|
17 |
% |
|
FICO: 781 - 800
|
|
|
15 |
% |
|
|
14 |
% |
|
|
13 |
% |
|
|
13 |
% |
|
|
12 |
% |
|
|
12 |
% |
|
|
12 |
% |
|
|
12 |
% |
|
|
12 |
% |
|
|
12 |
% |
|
FICO: >= 801
|
|
|
4 |
% |
|
|
4 |
% |
|
|
4 |
% |
|
|
4 |
% |
|
|
4 |
% |
|
|
4 |
% |
|
|
4 |
% |
|
|
3 |
% |
|
|
3 |
% |
|
|
3 |
% |
| |
|
|
|
|
|
|
|
|
|
|
|
|
|
|
|
|
|
|
|
|
|
|
|
|
|
|
|
|
|
|
|
|
|
|
|
|
|
|
|
|
|
Conforming balance % (2)
|
|
|
50 |
% |
|
|
51 |
% |
|
|
53 |
% |
|
|
53 |
% |
|
|
56 |
% |
|
|
56 |
% |
|
|
56 |
% |
|
|
56 |
% |
|
|
55 |
% |
|
|
52 |
% |
|
% balance in loans > $1mm per loan
|
|
|
20 |
% |
|
|
20 |
% |
|
|
18 |
% |
|
|
18 |
% |
|
|
16 |
% |
|
|
16 |
% |
|
|
16 |
% |
|
|
16 |
% |
|
|
14 |
% |
|
|
14 |
% |
| |
|
|
|
|
|
|
|
|
|
|
|
|
|
|
|
|
|
|
|
|
|
|
|
|
|
|
|
|
|
|
|
|
|
|
|
|
|
|
|
|
|
2nd home %
|
|
|
11 |
% |
|
|
12 |
% |
|
|
12 |
% |
|
|
12 |
% |
|
|
12 |
% |
|
|
12 |
% |
|
|
12 |
% |
|
|
12 |
% |
|
|
11 |
% |
|
|
11 |
% |
|
Investment home %
|
|
|
3 |
% |
|
|
4 |
% |
|
|
4 |
% |
|
|
4 |
% |
|
|
4 |
% |
|
|
4 |
% |
|
|
4 |
% |
|
|
4 |
% |
|
|
3 |
% |
|
|
3 |
% |
| |
|
|
|
|
|
|
|
|
|
|
|
|
|
|
|
|
|
|
|
|
|
|
|
|
|
|
|
|
|
|
|
|
|
|
|
|
|
|
|
|
|
Purchase
|
|
|
31 |
% |
|
|
31 |
% |
|
|
31 |
% |
|
|
31 |
% |
|
|
31 |
% |
|
|
31 |
% |
|
|
31 |
% |
|
|
31 |
% |
|
|
34 |
% |
|
|
34 |
% |
|
Cash out refinance
|
|
|
33 |
% |
|
|
33 |
% |
|
|
34 |
% |
|
|
34 |
% |
|
|
36 |
% |
|
|
36 |
% |
|
|
36 |
% |
|
|
35 |
% |
|
|
34 |
% |
|
|
34 |
% |
|
Rate-term refinance
|
|
|
35 |
% |
|
|
35 |
% |
|
|
34 |
% |
|
|
34 |
% |
|
|
31 |
% |
|
|
31 |
% |
|
|
31 |
% |
|
|
32 |
% |
|
|
31 |
% |
|
|
31 |
% |
|
Other
|
|
|
1 |
% |
|
|
1 |
% |
|
|
1 |
% |
|
|
1 |
% |
|
|
2 |
% |
|
|
2 |
% |
|
|
2 |
% |
|
|
2 |
% |
|
|
1 |
% |
|
|
1 |
% |
|
(1) This table presents characteristics of residential real estate loans held by consolidated Sequoia entities and residential real estate loans held by Redwood and intended to be securitized by future Sequoia entities.
|
| |
|
(2) The definition of a conforming loan has significantly changed over time. For all periods shown in this table, the conforming balance definition available in March 2011 was used (which had a maximum loan balance of $729,750).
|
| THE REDWOOD REVIEW 1ST QUARTER 2011 |
Table 9: Residential Real Estate Loan Characteristics
|
51 |
This Page Intentionally Left Blank
Redwood Trust Corporate Information
|
EXECUTIVE OFFICERS:
|
|
DIRECTORS:
|
| |
|
|
|
Martin S. Hughes
|
|
George E. Bull, III
|
|
President and Chief Executive Officer
|
|
Chairman of the Board
|
| |
|
|
|
Brett D. Nicholas
|
|
Richard D. Baum
|
|
Executive Vice President, Chief Investment Officer, and
|
|
Former Chief Deputy Insurance
|
|
Chief Operating Officer
|
|
Commissioner for the State of California
|
| |
|
|
|
Diane L. Merdian
|
|
Thomas C. Brown
|
|
Chief Financial Officer
|
|
CEO and Principal Shareholder,
|
| |
|
Urban Bay Properties, Inc.
|
|
Harold F. Zagunis
|
|
COO, McGuire Real Estate
|
|
Chief Risk Officer
|
|
|
| |
|
Mariann Byerwalter
|
|
Scott M. Chisholm
|
|
Chairman, JDN Corporate Advisory LLC
|
|
Managing Director
|
|
|
| |
|
Douglas B. Hansen
|
|
John H. Isbrandtsen
|
|
Private Investor
|
|
Managing Director
|
|
|
|
|
|
Martin H. Hughes
|
|
Fred J. Matera
|
|
President and Chief Executive Officer
|
|
Managing Director
|
|
|
|
|
|
Greg H. Kubicek
|
|
Andrew P. Stone
|
|
President, The Holt Group, Inc.
|
|
General Counsel
|
|
|
|
|
|
Jeffrey T. Pero
|
| |
|
Retired Partner, Latham & Watkins LLP
|
| |
|
|
|
STOCK LISTING:
|
|
Georganne C. Proctor
|
|
The Company’s common stock is traded
|
|
Former Chief Financial Officer, TIAA-CREF
|
|
on the New York Stock Exchange under
|
|
|
|
the symbol RWT
|
|
Charles J. Toeniskoetter
|
| |
|
Chairman, Toeniskoetter & Breeding, Inc. Development
|
|
CORPORATE HEADQUARTERS:
|
|
Chairman and CEO,
|
|
One Belvedere Place, Suite 300
|
|
Toeniskoetter Construction, Inc.
|
|
Mill Valley, California 94941
|
|
|
|
Telephone: (415) 389-7373
|
|
|
| |
|
INVESTOR RELATIONS:
|
|
NEW YORK OFFICE:
|
|
Mike McMahon
|
|
245 Park Avenue, 39th Floor
|
|
Managing Director
|
|
New York, New York 10167
|
|
|
| |
|
Paula Kwok
|
|
TRANSFER AGENT:
|
|
Assistant Vice President
|
|
Computershare Trust Company, N.A.
|
|
|
|
2 North LaSalle Street
|
|
|
|
Chicago, IL 60602
|
|
Investor Relations Hotline: (866) 269-4976
|
|
Telephone: (888) 472-1955
|
|
|
For more information about Redwood Trust, please visit our website at: www.redwoodtrust.com