|
|
 |
|
TABLE OF CONTENTS
|
|
Introduction
|
4
|
| |
|
|
Shareholder Letter
|
5
|
| |
|
|
Quarterly Overview
|
7
|
| |
|
|
Financial Insights
|
11
|
| |
|
|
u Book Value
|
11
|
| |
|
|
u Balance Sheet
|
12
|
| |
|
|
u GAAP Income
|
17
|
| |
|
|
u Taxable Income and Dividends
|
21
|
| |
|
|
u Cash Flow
|
22
|
| |
|
|
Residential Mortgage Loan Business
|
24
|
| |
|
|
Investments in New Sequoia
|
25
|
| |
|
|
Residential Real Estate Securities
|
26
|
| |
|
|
Commercial Real Estate
|
30
|
| |
|
|
Legacy Investments in Other Consolidated Entities
|
31
|
| |
|
| |
|
|
Appendix
|
|
| |
|
|
Accounting Discussion
|
34
|
| |
|
|
Glossary
|
35
|
| |
|
|
Financial Tables
|
41
|
|
THE REDWOOD REVIEW 2ND QUARTER 2011
|
1
|
|
|
|
CAUTIONARY STATEMENT
|
Cautionary Statement
This Redwood Review contains forward-looking statements within the meaning of the safe harbor provisions of the Private Securities Litigation Reform Act of 1995. Forward-looking statements involve numerous risks and uncertainties. Our actual results may differ from our expectations, estimates, and projections and, consequently, you should not rely on these forward-looking statements as predictions of future events. Forward-looking statements are not historical in nature and can be identified by words such as "anticipate," "estimate," "will," "should," "expect," "believe," "intend," "seek," "plan," and similar expressions or their negative forms, or by references to strategy, plans, or intentions. These forward-looking statements are subject to risks and uncertainties, including, among other things, those described in our most recent Annual Report on Form 10-K under the caption "Risk Factors." Other risks, uncertainties, and factors that could cause actual results to differ materially from those projected are described below and may be described from time to time in reports we file with the Securities and Exchange Commission, including reports on Forms 10-K, 10-Q, and 8-K. We undertake no obligation to update or revise forward-looking statements, whether as a result of new information, future events, or otherwise.
Statements regarding the following subjects, among others, are forward-looking by their nature: (i) our belief that rebuilding our core residential and commercial businesses of managing, facilitating, and investing in mortgage credit offers the best long-term opportunity to increase earnings and dividends and to build franchise value for our shareholders; (ii) our competitive position and our ability to compete in the future, including our ability to effectively compete to acquire residential mortgage loans and our statement that we are making steady progress in building relationships with loans sellers and our ability to compete to originate and acquire commercial real estate loans; (iii) our future investment strategy and our ability to find attractive investments and future trends relating to our pace of acquiring or selling assets, including, without limitation, statements relating to our efforts to acquire residential mortgage loans, make commercial real estate investments, and potentially leverage the capital we have invested in commercial real estate investments without taking funding risk; (iv) our plan to acquire the $201 million of loans comprising the pipeline of residential mortgage loans that, as of the end of the second quarter of 2011, we planned to purchase through our conduit program and our plan to acquire additional loans that we have already added, or plan in the future to add, to our pipeline after the end of the second quarter of 2011, including the $198 million of loans comprising the pipeline of residential mortgage loans as of July 29, 2011; (v) our belief that our hedging strategy relating to loans acquired through our conduit has worked well in the face of significant interest rate volatility and that, if we use effective hedging strategies, a loss on hedges that relate to mortgage loans we are holding for future securitization will be roughly matched by an increase in the value of those loans; (vi) our belief that our loan conduit business and the systems and operational infrastructure we have in place for our loan conduit business can handle a substantially higher volume of business without a significant increase in our cost base and our statement that we believe the scale of the operational infrastructure we have in place will ultimately pay off; (vii) future securitization transactions, the timing of the completion of those future securitization transactions, and the number and size of such transactions we expect to complete in 2011 and future periods, which future securitizations may not be completed when planned or at all, and, more generally, statements regarding the likelihood and timing of, and our participation in, future securitization transactions and our ability to finance loan acquisitions through the execution of securitization transactions; (viii) our expectation that new Sequoia securitization entities will represent a larger portion of our balance sheet in the future; (ix) our statement that we expect to recover an aggregate of $6 million of loan loss reserves that relate to eleven Sequoia securitization entities in future periods upon the payoff or deconsolidation of those entities; (x) our expectations of future levels of our securities purchase and sale activity and our plans to invest our excess capital and our statements relating to the cash flows we expect to receive from our investments in securities; (xi) that we do not anticipate considering raising equity capital financing before 2012, that we do not plan to raise equity capital unless we believe we have attractive investment opportunities that exceed our investment capacity, our estimates of our short-term borrowing capacity, our investment capacity, and our excess capital, our statements regarding our ability to access additional short-term borrowings and to access capital through re-securitization transactions or other forms of debt financing, and our expectation that we will have established a warehouse borrowing facility to finance the acquisition of residential mortgage loans in the next several months; (xii) future market and economic conditions, including, without limitation, future conditions in the residential and commercial real estate markets and related financing markets, and the related potential opportunities for our residential and commercial businesses; (xiii) that the size of the jumbo residential mortgage market is potentially vast and could represent an opportunity that exceeds the current capital we have to invest and the potential that regulatory reforms could increase the size of the jumbo mortgage market, our statement that these trends could present a growth opportunity for us and our statements regarding our beliefs about our competitive advantages; (xiv) our beliefs about, and our outlook for, the future direction of housing market fundamentals, including, without limitation, home prices, demand for housing, delinquency rates, foreclosure rates, prepayment rates, inventory of homes for sale, and mortgage interest rates and their potential impact on our business and results of operations and our belief that the housing market is in the process of forming a bottom and our expectation that housing, in general, will not be a significantly appreciating asset class for several years; (xv) our beliefs about the future direction of commercial real estate fundamentals and statements regarding the competitive landscape for and availability of financing for commercial real estate; (xvi) our estimate that our commercial real estate loan originations are likely to be in the range of $25 million to $50 million per quarter over the next several quarters, and statements regarding the future of the CMBS market; (xvii) statements relating to the impact of recent and future legislative and regulatory changes that affect our business, the regulation of securitization transactions, and the mortgage finance markets, the manner in which the reform of the GSEs, including Fannie Mae and Freddie Mac, may take place and the timeline for that reform, and our statements that GSE reform and bank regulatory capital reforms could result in a larger portion of the mortgage market being available to us; (xviii) our expectations regarding credit reserves, credit losses, the adequacy of credit support, and impairments and their impact on our investments (including as compared to our original expectations and credit reserve levels) and the timing of losses and impairments, and statements that the amount of credit reserves we designate may require changes in the future; (ixx) that we continue to expect interest income to be derived primarily from our senior residential securities and that in future periods we expect our residential and commercial loan businesses to expand and contribute more significantly to interest income; (xx) expectations regarding future interest income, future earnings, future earnings volatility, and future trends in operating expenses and the factors that may affect those trends; (xxi) our board of directors' intention to pay a regular dividend of $0.25 per share per quarter in 2011; and (xxii) our expectations relating to tax accounting, including our expectation that we will realize a taxable loss for the full year 2011, and our anticipation of additional credit losses for tax purposes in 2011 and future periods and the level of those losses.
|
2
|
THE REDWOOD REVIEW 2ND QUARTER 2011
|
Cautionary Statement (continued)
Important factors, among others, that may affect our actual results include: general economic trends, the performance of the housing, commercial real estate, mortgage, credit, and broader financial markets, and their effects on the prices of earning assets and the credit status of borrowers; federal and state legislative and regulatory developments, and the actions of governmental authorities, including those affecting the mortgage industry or our business; our exposure to credit risk and the timing of credit losses within our portfolio; the concentration of the credit risks we are exposed to, including due to the structure of assets we hold and the geographical concentration of real estate underlying assets we own; our exposure to adjustable-rate and negative amortization mortgage loans; the efficacy and expense of our efforts to manage or hedge credit risk, interest rate risk, and other financial and operational risks; changes in credit ratings on assets we own and changes in the rating agencies' credit rating methodologies; changes in interest rates; changes in mortgage prepayment rates; the availability of assets for purchase at attractive prices and our ability to reinvest cash we hold; changes in the values of assets we own; changes in liquidity in the market for real estate securities and loans; our ability to finance the acquisition of real estate-related assets with short-term debt; the ability of counterparties to satisfy their obligations to us; our involvement in securitization transactions and the risks we are exposed to in engaging in securitization transactions; exposure to litigation arising from our involvement in securitization transactions; whether we have sufficient liquid assets to meet short-term needs; our ability to successfully compete and retain or attract key personnel; our ability to adapt our business model and strategies to changing circumstances; changes in our investment, financing, and hedging strategies and new risks we may be exposed to if we expand our business activities; exposure to environmental liabilities and the effects of global climate change; failure to comply with applicable laws and regulations; our failure to maintain appropriate internal controls over financial reporting and disclosure controls and procedures; the impact on our reputation that could result from our actions or omissions or from those of others; changes in accounting principles and tax rules; our ability to maintain our status as a real estate investment trust (REIT) for tax purposes; limitations imposed on our business due to our REIT status and our status as exempt from registration under the Investment Company Act of 1940; decisions about raising, managing, and distributing capital; and other factors not presently identified.
This Redwood Review may contain statistics and other data that in some cases have been obtained from or compiled from information made available by servicers and other third-party service providers.
|
THE REDWOOD REVIEW 2ND QUARTER 2011
|
3
|
|
|
|
INTRODUCTION
|
Note to Readers:
We file annual reports (on Form 10-K) and quarterly reports (on Form 10-Q) with the Securities and Exchange Commission. These filings and our earnings press releases provide information about Redwood and our financial results in accordance with generally accepted accounting principles (GAAP). We urge you to review these documents, which are available through our website, www.redwoodtrust.com.
This document, called The Redwood Review, is an additional format for providing information about Redwood through a discussion of many GAAP as well as non-GAAP metrics, such as taxable income and economic book value. Supplemental information is also provided in the Financial Tables in this Review to facilitate more detailed understanding and analysis of Redwood. When we use non-GAAP metrics it is because we believe that these figures provide additional insight into Redwood’s business. In each case in which we discuss a non-GAAP metric you will find an explanation of how it has been calculated, why we think the figure is important, and a reconciliation between the GAAP and non-GAAP figures.
References herein to “Redwood,” the “company,” “we,” “us,” and “our” include Redwood Trust, Inc. and its consolidated subsidiaries. References to “at Redwood” and “Redwood Parent” exclude all consolidated securitization entities in order to present our operations in the way management analyzes them.
Note that because we round numbers in the tables to millions, except per share amounts, some numbers may not foot due to rounding.
We hope you find this Review helpful to your understanding of our business. We thank you for your input and suggestions, which have resulted in our changing the form and content of The Redwood Review over time.
We welcome your continued interest and comments.
| |
|
|
|
|
|
|
|
Selected Financial Highlights
|
| |
|
|
|
|
|
|
|
Quarter:Year
|
GAAP Income (Loss)
per Share
|
Taxable
Income (Loss)
per Share(1)
|
Annualized
GAAP Return
on Equity
|
GAAP Book
Value per
Share
|
Non-GAAP
Economic
Value per
Share (2)
|
Dividends
per Share
|
|
Q209
|
$0.10
|
($0.16)
|
5%
|
$10.35
|
$11.30
|
$0.25
|
|
Q309
|
$0.34
|
($0.30)
|
13%
|
$11.68
|
$12.28
|
$0.25
|
|
Q409
|
$0.51
|
($0.44)
|
17%
|
$12.50
|
$13.03
|
$0.25
|
|
Q110
|
$0.58
|
$0.01
|
19%
|
$12.84
|
$13.32
|
$0.25
|
|
Q210
|
$0.35
|
($0.03)
|
11%
|
$12.71
|
$13.37
|
$0.25
|
|
Q310
|
$0.25
|
($0.11)
|
8%
|
$13.02
|
$13.73
|
$0.25
|
|
Q410
|
$0.18
|
($0.07)
|
6%
|
$13.63
|
$14.31
|
$0.25
|
|
Q111
|
$0.22
|
$0.06
|
8%
|
$13.76
|
$14.45
|
$0.25
|
|
Q211
|
$0.11
|
($0.00)
|
4%
|
$13.04
|
$13.82
|
$0.25
|
|
(1) Taxable income (loss) per share for 2010 and 2011 are estimates until we file tax returns for that year.
|
| |
|
(2) Non-GAAP economic value per share is calculated using estimated bid-side values (which take into account available bid-side marks) for our financial assets and estimated offer-side values (which take into account available offer-side marks) for our financial liabilities and we believe it more accurately reflects liquidation value than does GAAP book value per share. Non-GAAP economic value per share is reconciled to GAAP book value per share in Table 3 in the Financial Tables in this Review.
|
|
4
|
THE REDWOOD REVIEW 2ND QUARTER 2011
|
|
|
 |
|
SHAREHOLDER LETTER
|
Dear Fellow Shareholders:
We often tinker with the format of and discussion topics in the Redwood Review in an attempt to provide relevant and fresh insights into management’s thinking. Most times the tinkering helps, but every so often, we realize we should have left well enough alone.
In one such example, about a year ago we combined the shareholder letter in the Redwood Review, which traditionally focused on the big picture, with the quarterly overview, which focused on current operating and financial results. Upon re-reading many past Redwood Reviews, we believe that move was a mistake. In combining the two discussions, we lost the clarity of measuring our short-term progress and the bumps in the road against a clear long-term strategic backdrop — i.e., where we are heading and why. So starting with this issue of the Review, it’s back to the future and you’ll find a quarterly overview after this letter. We hope you like the change.
We continue to believe that rebuilding our core residential and commercial businesses of managing, facilitating, and investing in mortgage credit offers the best long-term opportunity to increase earnings and dividends and to build franchise value for our shareholders. Why? It plays to our competitive strengths and the potential market opportunity is huge. The big question is how long it will take to realize that “potential,” especially on the residential mortgage front.
The government now subsidizes over 90% of all new residential mortgage originations and large banks can easily portfolio the remainder. As long as these conditions persist, big opportunities for traditional triple-A institutional investors and credit investors like Redwood to provide mortgage financing through private securitization are blocked.
Many real estate agents, home builders, and banks are screaming and lobbying to keep the status quo. In the short-term, they may get their way. Our strategic bet is that, over time, the current outsized role of government supporting a $9.6 trillion residential mortgage market is simply not sustainable, especially in light of the painfully heated debates over raising the $14.3 trillion federal debt ceiling. As the government eventually and gradually withdraws support for mortgage financing, we believe private capital (outside of banks) will be called on to step in and fill the void.
Although the pace of reform is glacial, there are encouraging steps by policymakers and regulators to pave the way for the return of private mortgage financing. The Obama Administration Mortgage Reform Plan calls for the “wind down” of Fannie Mae and Freddie Mac on a responsible timeline. The first step toward this goal could happen on October 1, when the high-cost government conforming loan limit is scheduled by law to drop from $729,750 to $625,500. If we were to hazard a guess, the odds of the loan limit reduction going through seem pretty good. However, you can count on an all-out, two-month assault by pro-status quo forces. So who knows?
Attracting triple-A investors back to buying senior mortgage-backed securities is essential to bringing private mortgage financing back. There are several regulatory and industry reform efforts underway to meet the demands of triple-A investors. These include initiatives around establishing new servicing standards and practices, strengthening structural investor protection mechanisms (in particular, around representations and warranties), improving alignment of interests, and increasing transparency. As part of this process, Redwood has been actively engaged with policymakers, regulators, and industry representatives.
THE REDWOOD REVIEW 2ND QUARTER 2011
|
5
|
|
|
|
SHAREHOLDER LETTER
|
If banks decide to be more active sellers of non-conforming residential mortgage loans, that would also add to the size of Redwood’s opportunity. The good news is that with major banks facing a stricter regulatory environment and higher capital requirements (as proposed under Basel III), they are likely to rethink how they participate in the mortgage market. There are already anecdotes of major banks expressing a willingness to shrink mortgage assets.
Our residential loan conduit and credit investment businesses work together “hand in glove.” The goal is to source high-quality loans on an ongoing basis that we can securitize, thereby creating a flow of attractive credit investments for Redwood and senior investments for triple-A investors. To achieve this goal, we took the approach: “if you build it, they will come.” We believed Redwood needed to demonstrate our ability to bring the highest value to borrowers, lenders, and triple-A investors. In addition, we needed to be recognized as a real and reliable counterparty by loan sellers.
As a result, we invested upfront in sales and back-office personnel, operational infrastructure, and technology. The good news is that, even in this market dominated by government financing, we are making steady progress in building sticky relationships with loan sellers and investors. Furthermore, we believe our loan conduit business can handle substantially higher volume without a significant increase in our cost base. The bad news is that until we put more capital to work in residential credit investments, our conduit cost basis will be a drag on earnings.
Switching gears to the Commercial Group, our opportunity in commercial is very different than that in residential. We are not waiting for a highly government-dominated market to allow the private sector back in. In fact, the commercial market is largely unregulated, with private capital driving the trends in all sectors, with the exception of multi-family finance (dominated by Fannie Mae and Freddie Mac). Our opportunities will not be driven by expected seismic shifts in the market.
Rather, our effort to expand our commercial business is centered on building a team and a franchise, by focusing on getting the underwriting right, starting slow, and learning to walk before we run. We are originating mezzanine loans alongside senior loans extended by banks and insurance companies. We can create opportunities to invest permanent capital and earn good returns, potentially leveraging capital without taking funding risk. We have good relationships with borrowers, senior lenders, and brokers who appreciate our flexibility, responsiveness, and reliability.
In closing, we continue to work hard at building our franchises and growing the businesses where we can create value. We are doing what we have said, recognizing that the pace of progress is, at times, frustratingly slow, but we are confident we are moving in the right direction.
We appreciate your continued interest and support.
 |
 |
|
Martin S. Hughes
|
Brett D. Nicholas
|
|
President and
|
Executive Vice President,
|
|
Chief Executive Officer
|
Chief Investment Officer, and
|
| |
Chief Operating Officer
|
|
6
|
THE REDWOOD REVIEW 2ND QUARTER 2011
|
|
|
 |
|
QUARTERLY OVERVIEW
|
QUARTERLY OVERVIEW
In this summary, we will begin with a review of market activity and the overall environment, followed by a brief discussion of our hedging and changes in derivatives values. Next, we will review financial results for the quarter, followed by the fundamentals in and key developments that pertain to our businesses. Finally, we will share our thoughts on our capital position. More details follow this overview in the rest of this Redwood Review.
Second Quarter 2011 Market Environment
What a difference a quarter makes. We began the second quarter with a continuation of the trend that had essentially been in place since early 2009: rising prices, improving liquidity, and tightening bid-ask spreads. In fact, the Federal Reserve’s Maiden Lane portfolio sales were heralded by most market participants (including us) as a welcome source of supply which would help tighten bid-ask spreads. Our prognostication turned out to be wrong.
As the quarter unfolded, a steady stream of bad news — domestic economic trends, the end of the Fed’s QE 2 program, the looming debt ceiling problem in the U.S., and the debt crisis in Europe — contributed to an abrupt turn in market dynamics. Investors pulled back from higher risk securities and bid-ask spreads widened. The trend of consistently higher prices was interrupted in the second quarter of 2011, with residential mortgage-backed securities (RMBS) prices falling across the board — with the sharpest declines for the riskiest securities.
Late in the second quarter and into July, increasingly risk-averse investors in commercial mortgage-backed securities (CMBS) transactions have demanded higher yields and better terms. In a recently marketed new issue CMBS transaction, in fact, investors insisted on increased subordination levels, ignoring what had been set by the rating agencies involved. These developments could help reinforce discipline in the marketplace, which would be constructive for commercial property financings over time.
Accounting for Pipeline Hedging
Interest rate volatility affects the financial results of our conduit business. We hedge our pipeline of loans awaiting securitization, since the value of our loans changes with the level of interest rates. When we incur a loss on our hedges due to an interest rate move, the loss on our hedges is roughly matched by an increase in the value of the loans, assuming we have hedged well. Similarly, a gain on our hedges due to an interest rate move is roughly matched by a decrease in the value of the loans. From a GAAP perspective, the gain or loss on hedging is taken into earnings right away while the loss or gain on the value of the loans is taken through lower or higher interest income over time. Thus, while hedging protects economic values, the accounting treatment results in unavoidable lumpiness in reported results.
THE REDWOOD REVIEW 2ND QUARTER 2011
|
7
|
|
|
|
QUARTERLY REPORT
|
Second Quarter 2011 Results
We are not satisfied with our second quarter results. Fully investing our excess capital alone is not the answer. We have built our origination businesses for more volume than is currently available on the right terms. We believe our scale will ultimately pay off. For now, however, our operating costs are high relative to the net revenues we can earn off our invested capital without taking undue risk. Over time, we plan to invest more capital, leverage our cost structure, and continue to manage risk.
GAAP earnings for the second quarter of 2011 were $9 million or $0.11 per share, down from $18 million or $0.22 per share reported for the first quarter of 2011. The second quarter was affected by lower interest rates, which resulted in a $5 million negative mark-to-market adjustment realized on derivatives used to hedge our residential pipeline, which was an $8 million negative swing from the prior quarter. Said another way, this cost us $0.10 per share relative to first quarter EPS. These derivatives marks are included in market valuation adjustments.
In addition, net interest income declined to $29 million in the second quarter of 2011 from $32 million in the first quarter of 2011. This decline reflects lower average balances of securities (partly reflecting greater sales and paydowns than acquisitions in the first quarter) as well as modestly lower yields (slower prepayments reduced the pace at which we accreted discount into income). Loan loss provisions declined to $2 million in the second quarter, from $3 million in the first quarter of 2011, reflecting better than expected performance trends in previously modified Sequoia loans. Operating expenses remained relatively flat with the first quarter, at $12 million for the quarter.
Book value declined by $0.72 per share in the second quarter of 2011, to $13.04 compared with $13.76. The $50 million decline in book value during the quarter reflected a $37 million decline in the value of securities (which reduced unrealized gains), a $4 million unrealized loss on derivatives, $20 million in dividends, only partially offset by $9 million in net income and $2 million in net other items. We estimate that non-GAAP economic value is $13.81 per share at June 30, 2011. This compares with $14.45 per share estimated as of March 31, 2011.
Residential Loan Business
We continued to sign up more sellers and locked loans throughout the quarter. We deployed $152 million in capital to purchase residential loans in the second quarter. By June 30, 2011, we had a total pipeline of $404 million of residential mortgage loans, comprised of $203 million on our balance sheet (for future securitization) and $201 million of locked loans we planned to purchase. As of July 29, our total pipeline had grown to $500 million. We continue to target two additional securitizations in 2011, even as this goal seems a bit more challenging than it did a few months ago.
We see signs that things are slowly moving in the right direction for private market financing of residential mortgages. Still, we are not idly waiting for external factors to change. We are focused on buying loans from jumbo mortgage originators, realizing that it will likely take until 2012 to start to gain real traction.
|
8
|
THE REDWOOD REVIEW 2ND QUARTER 2011
|
|
|
|
|
QUARTERLY OVERVIEW
|
Residential Portfolio
We welcomed the change that took place in the market — in which higher quality securities outperformed riskier securities in the second quarter. We were fortunate to have made some select credit risk sales prior to the market turn and to have found selected opportunities to reinvest at more attractive levels as the second quarter unfolded. Specifically, we put $33 million in capital to work adding new securities to our portfolio, while we sold $9 million in securities at Redwood. We continue to feel good about the expected cash flow from the securities we own.
Early in the second quarter, we completed our sales of the remaining Opportunity Fund positions. We expect to finish our accounting for the Fund and distribute final cash sometime in the third quarter. The Fund did not deliver returns in the range we initially expected, as it was difficult to overcome the decision to launch the Opportunity Fund in late 2007, which clearly turned out to be poor timing. We feel good that our patience and price discipline in liquidating positions helped us to get nearly 100 cents on the dollar back for the investors in the Fund.
Commercial Real Estate
Transaction volumes have increased in 2011 for CMBS lenders, portfolio lenders, and agencies. Most prognosticators continue to expect volumes to expand and CMBS aggregators in particular are staffing up, even as there are some signs of stress in the market. Meanwhile, portfolio lenders — including life insurance companies and banks — are posting strong new origination results for targeted assets. The Government-Sponsored Entities (GSEs) continue to dominate multi-family lending, though life insurance companies, banks, and now CMBS lenders are making inroads.
During the second quarter, we put $29 million of capital to work in three separate loans. Our portfolio consists of $71 million in loans on stabilized multi-family properties, central business district office buildings in major markets, necessity/grocery-anchored retail centers, and hotels with strong brands and operators. We continue to expect to originate in the range of $25 million to $50 million per quarter. Our portfolio has a weighted average maturity of over five years and an average unlevered yield of approximately 10.5%. We plan to provide information on new loans on our website as they are funded.
When Will We Need More Capital?
This is a question on many investors’ minds. With mortgage REITs of all types raising equity, we are often asked if we plan to raise equity as well. Our message is unchanged. We would consider raising equity or another form of long-term capital when investment opportunities make raising capital attractive, providing we have exhausted our ability to raise financing internally. For example, we can (and recently did) look to our residential mortgage-backed securities (RMBS) or commercial loans to raise financing. We always look for ways to leverage our capital without taking undue funding risk.
We estimate that our investment capacity — or the amount of capital we have readily available to support long-term investments — was $210 million as of June 30. We estimate our investment capacity as (1) cash on hand, plus (2) cash we could raise by increasing short-term borrowings to finance all our residential mortgage loans held for securitization, less (3) cash needed to cover short-term operations, working capital, and a liquidity cushion.
THE REDWOOD REVIEW 2ND QUARTER 2011
|
9
|
|
|
|
QUARTERLY REPORT
|
When Will We Need More Capital? (continued)
In July, we resecuritized $365 million (market value) of senior RMBS, freeing up $243 million in capital for us to invest in long-term assets. This capital will increase our investment capacity to over $400 million, once we have established warehouse funding for our pipeline (which we expect to do in the next several months). We expect this amount of capital to allow us to make all the investments we have planned through 2011. Thus, we would not anticipate considering raising equity before 2012.
|
10
|
THE REDWOOD REVIEW 2ND QUARTER 2011
|
|
|
 |
|
FINANCIAL INSIGHTS
|
|
„
|
The following table shows the components of our GAAP book value at June 30 and March 31, 2011.
|
| |
|
|
|
|
|
|
|
Components of GAAP Book Value(1)
|
|
|
($ in millions, except per share data)
|
|
| |
|
|
|
|
|
|
| |
|
|
|
|
|
|
| |
|
|
|
|
|
|
| |
|
As of
|
|
| |
|
6/30/2011
|
|
|
3/31/2011
|
|
| |
|
|
|
|
|
|
|
|
|
Cash and cash equivalents
|
|
$ |
80 |
|
|
$ |
220 |
|
| |
|
|
|
|
|
|
|
|
|
Real estate loans at Redwood
|
|
|
|
|
|
|
|
|
|
Residential
|
|
|
205 |
|
|
|
55 |
|
|
Commercial
|
|
|
71 |
|
|
|
42 |
|
|
Total real estate loans at Redwood
|
|
$ |
276 |
|
|
$ |
97 |
|
| |
|
|
|
|
|
|
|
|
|
Real estate securities at Redwood
|
|
|
|
|
|
|
|
|
|
Residential
|
|
|
754 |
|
|
|
780 |
|
|
Commercial
|
|
|
6 |
|
|
|
7 |
|
|
CDO
|
|
|
1 |
|
|
|
1 |
|
|
Total real estate securities at Redwood
|
|
$ |
761 |
|
|
$ |
788 |
|
| |
|
|
|
|
|
|
|
|
|
Investments in Sequoia
|
|
|
90 |
|
|
|
97 |
|
|
Investments in Acacia
|
|
|
1 |
|
|
|
2 |
|
|
Investments in the Fund
|
|
|
3 |
|
|
|
11 |
|
|
Other assets
|
|
|
39 |
|
|
|
34 |
|
|
Total assets
|
|
$ |
1,250 |
|
|
$ |
1,249 |
|
| |
|
|
|
|
|
|
|
|
|
Short-term debt
|
|
|
(41 |
) |
|
|
- |
|
|
Long-term debt
|
|
|
(140 |
) |
|
|
(140 |
) |
| |
|
|
|
|
|
|
|
|
|
Other liabilities
|
|
|
(44 |
) |
|
|
(34 |
) |
| |
|
|
|
|
|
|
|
|
|
Stockholders' equity
|
|
$ |
1,025 |
|
|
$ |
1,075 |
|
| |
|
|
|
|
|
|
|
|
|
Book value per share
|
|
$ |
13.04 |
|
|
$ |
13.76 |
|
|
„
|
During the second quarter of 2011, our GAAP book value decreased by $0.72 per share to $13.04 per share. The decrease resulted from $0.11 per share in reported earnings, which was offset by $0.47 per share in net valuation decreases on securities not reflected in earnings, $0.06 per share in decreases in value of hedges related to long-term debt not reflected in earnings, $0.05 per share in other net negative items, and $0.25 per share in dividends paid to shareholders.
|
|
„
|
At June 30, 2011, our estimate of non-GAAP economic value was $13.81 per share, or $0.77 per share higher than our reported GAAP book value. Approximately $0.78 of this difference relates to an economic valuation of our long-term debt of $78 million, which is $62 million below the unamortized cost basis used to determine GAAP book value. The difference of negative $0.01 relates to an economic valuation of our net investment in Sequoia of $89 million, which is $1 million below the estimated cost basis used to determine GAAP book value. For all other components of book value, the GAAP values equal our estimated economic values. A further reconciliation of our estimate of non-GAAP economic value to GAAP book value is set forth in Table 3 of the Appendix.
|
1 This table presents our assets and liabilities as calculated and reported under GAAP and as adjusted to reflect our investments in the Redwood Opportunity Fund, L.P. (the Fund) and in Sequoia and Acacia securitization entities in separate line items, similar to the equity method of accounting, reflecting the reality that the underlying assets and liabilities of these entities are legally not ours. We own only the securities and interests that we have acquired from these entities.
THE REDWOOD REVIEW 2ND QUARTER 2011
|
11
|
|
|
|
FINANCIAL INSIGHTS
|
Balance Sheet
|
„
|
The following table shows the components of our balance sheet at June 30, 2011.
|
| |
|
|
|
|
|
|
|
|
|
|
|
|
|
|
|
|
Consolidating Balance Sheet
|
|
|
June 30, 2011
|
|
|
($ in millions)
|
|
| |
|
|
|
|
|
|
|
|
|
|
|
|
| |
|
At Redwood
|
|
|
New Sequoia
|
|
|
Other Consolidated Entities
|
|
|
Intercompany
|
|
|
Redwood Consolidated
|
|
| |
|
|
|
|
|
|
|
|
|
|
|
|
|
|
|
|
|
|
|
|
|
Residential real estate loans
|
|
$ |
205 |
|
|
$ |
392 |
|
|
$ |
3,263 |
|
|
$ |
- |
|
|
$ |
3,860 |
|
|
Commercial real estate loans
|
|
|
71 |
|
|
|
- |
|
|
|
13 |
|
|
|
- |
|
|
|
84 |
|
|
Real estate securities
|
|
|
761 |
|
|
|
- |
|
|
|
277 |
|
|
|
- |
|
|
|
1,038 |
|
|
Investments in New Sequoia
|
|
|
37 |
|
|
|
- |
|
|
|
- |
|
|
|
(37 |
) |
|
|
- |
|
|
Investment in Other Consolidated Entities
|
|
|
57 |
|
|
|
- |
|
|
|
- |
|
|
|
(57 |
) |
|
|
- |
|
|
Cash and cash equivalents
|
|
|
80 |
|
|
|
- |
|
|
|
- |
|
|
|
- |
|
|
|
80 |
|
|
Total earning assets
|
|
|
1,211 |
|
|
|
392 |
|
|
|
3,552 |
|
|
|
(93 |
) |
|
|
5,062 |
|
| |
|
|
|
|
|
|
|
|
|
|
|
|
|
|
|
|
|
|
|
|
|
Other assets
|
|
|
39 |
|
|
|
4 |
|
|
|
60 |
|
|
|
- |
|
|
|
103 |
|
| |
|
|
|
|
|
|
|
|
|
|
|
|
|
|
|
|
|
|
|
|
|
Total assets
|
|
$ |
1,250 |
|
|
$ |
396 |
|
|
$ |
3,613 |
|
|
$ |
(93 |
) |
|
$ |
5,165 |
|
|
Short-term debt
|
|
$ |
41 |
|
|
$ |
- |
|
|
$ |
- |
|
|
$ |
- |
|
|
$ |
41 |
|
|
Other liabilities
|
|
|
44 |
|
|
|
1 |
|
|
|
72 |
|
|
|
- |
|
|
|
119 |
|
|
Asset-backed securities issued
|
|
|
- |
|
|
|
358 |
|
|
|
3,481 |
|
|
|
- |
|
|
|
3,839 |
|
|
Long-term debt
|
|
|
140 |
|
|
|
- |
|
|
|
- |
|
|
|
- |
|
|
|
140 |
|
|
Total liabilities
|
|
|
225 |
|
|
|
359 |
|
|
|
3,554 |
|
|
|
- |
|
|
|
4,138 |
|
| |
|
|
|
|
|
|
|
|
|
|
|
|
|
|
|
|
|
|
|
|
|
Stockholders’ equity
|
|
|
1,025 |
|
|
|
37 |
|
|
|
57 |
|
|
|
(93 |
) |
|
|
1,025 |
|
|
Noncontrolling interest
|
|
|
- |
|
|
|
- |
|
|
|
2 |
|
|
|
- |
|
|
|
2 |
|
|
Total equity
|
|
|
1,025 |
|
|
|
37 |
|
|
|
59 |
|
|
|
(93 |
) |
|
|
1,027 |
|
| |
|
|
|
|
|
|
|
|
|
|
|
|
|
|
|
|
|
|
|
|
|
Total liabilities and equity
|
|
$ |
1,250 |
|
|
$ |
396 |
|
|
$ |
3,613 |
|
|
$ |
(93 |
) |
|
$ |
5,165 |
|
|
„
|
We present this table to highlight the impact that consolidation has on our GAAP balance sheet. As shown, Redwood’s $94 million GAAP investment in the consolidated entities (including the consolidated entities we refer to as New Sequoia) increased our consolidated assets by $4.0 billion and liabilities by $3.9 billion.
|
|
„
|
We are required under GAAP to consolidate all of the assets and liabilities of the Fund (due to our significant general and limited partnership interests in the Fund and asset management responsibilities) and certain Sequoia and Acacia securitization entities that are treated as secured borrowing transactions. However, the securitized assets of these entities are not available to Redwood. Similarly, the liabilities of these entities are obligations payable only from the cash flow generated by their securitized assets and are not obligations of Redwood.
|
|
„
|
The consolidating balance sheet presents the New Sequoia securitization entities separately from Other Consolidated Entities to highlight our renewed focus on growing our core business of creating residential credit investments. As we complete additional securitizations, we expect New Sequoia securitization entities to represent a larger portion of our consolidated balance sheet as prior Sequoia securitization entities continue to pay down.
|
|
12
|
THE REDWOOD REVIEW 2ND QUARTER 2011
|
|
|
|
|
FINANCIAL INSIGHTS
|
Balance Sheet (continued)
|
„
|
At June 30, 2011, we had $205 million of residential real estate loans, compared to $55 million at March 31, 2011. The increase reflects the $152 million of residential loan acquisitions (net of $2 million in paydowns) in the second quarter. We intend to securitize most of these residential loans (and others we have identified for future acquisition), at which point they will be reflected in the “New Sequoia” column on the consolidating balance sheet shown on page 12.
|
|
„
|
At June 30, 2011, we had $71 million of commercial real estate loans held for investment, compared to $42 million at March 31, 2011. The increase reflects the origination of three loans totaling $29 million in the second quarter. We started originating commercial loans in the fourth quarter of 2010 and we intend to hold these loans for investment. See the Commercial Real Estate module on page 30 for more information.
|
|
„
|
The following table presents the fair value (which equals GAAP carrying value) of real estate securities at Redwood at June 30, 2011. We segment our securities portfolio by vintage (the year(s) the securities were issued), priority of cash flow (senior, re-REMIC, and subordinate), and by quality of underlying residential loans (prime and non-prime).
|
| |
|
|
|
|
|
|
|
|
|
|
|
|
|
|
|
|
Real Estate Securities at Redwood
|
|
|
June 30, 2011
|
|
|
($ in millions)
|
|
| |
|
|
|
|
|
|
|
|
|
|
|
|
|
% of Total
|
|
| |
|
<=2004
|
|
|
2005
|
|
|
|
2006-2008 |
|
|
Total
|
|
|
Securities
|
|
| |
|
|
|
|
|
|
|
|
|
|
|
|
|
|
|
|
|
Residential
|
|
|
|
|
|
|
|
|
|
|
|
|
|
|
|
|
|
Seniors
|
|
|
|
|
|
|
|
|
|
|
|
|
|
|
|
|
|
Prime
|
|
$ |
12 |
|
|
$ |
208 |
|
|
$ |
66 |
|
|
$ |
286 |
|
|
|
38 |
% |
|
Non-prime(1)
|
|
|
108 |
|
|
|
193 |
|
|
|
6 |
|
|
|
307 |
|
|
|
40 |
% |
|
Total Seniors
|
|
$ |
120 |
|
|
$ |
401 |
|
|
$ |
72 |
|
|
$ |
593 |
|
|
|
78 |
% |
| |
|
|
|
|
|
|
|
|
|
|
|
|
|
|
|
|
|
|
|
|
|
Re-REMIC
|
|
|
|
|
|
|
|
|
|
|
|
|
|
|
|
|
|
|
|
|
|
Prime
|
|
$ |
2 |
|
|
$ |
11 |
|
|
$ |
65 |
|
|
$ |
78 |
|
|
|
10 |
% |
|
Total Re-REMIC
|
|
$ |
2 |
|
|
$ |
11 |
|
|
$ |
65 |
|
|
$ |
78 |
|
|
|
10 |
% |
| |
|
|
|
|
|
|
|
|
|
|
|
|
|
|
|
|
|
|
|
|
|
Subordinates
|
|
|
|
|
|
|
|
|
|
|
|
|
|
|
|
|
|
|
|
|
|
Prime
|
|
$ |
62 |
|
|
$ |
6 |
|
|
$ |
4 |
|
|
$ |
72 |
|
|
|
9 |
% |
|
Non-prime(1)
|
|
|
11 |
|
|
|
- |
|
|
|
- |
|
|
|
11 |
|
|
|
2 |
% |
|
Total Subordinates
|
|
$ |
73 |
|
|
$ |
6 |
|
|
$ |
4 |
|
|
$ |
83 |
|
|
|
11 |
% |
| |
|
|
|
|
|
|
|
|
|
|
|
|
|
|
|
|
|
|
|
|
|
Total Residential
|
|
$ |
195 |
|
|
$ |
418 |
|
|
$ |
141 |
|
|
$ |
754 |
|
|
|
99 |
% |
| |
|
|
|
|
|
|
|
|
|
|
|
|
|
|
|
|
|
|
|
|
|
Commercial subordinates
|
|
$ |
5 |
|
|
$ |
1 |
|
|
$ |
- |
|
|
$ |
6 |
|
|
|
1 |
% |
|
CDO subordinates
|
|
$ |
- |
|
|
$ |
1 |
|
|
$ |
- |
|
|
$ |
1 |
|
|
|
0 |
% |
| |
|
|
|
|
|
|
|
|
|
|
|
|
|
|
|
|
|
|
|
|
|
Total real estate securities
|
|
$ |
200 |
|
|
$ |
420 |
|
|
$ |
141 |
|
|
$ |
761 |
|
|
|
100 |
% |
|
(1) Non-prime residential securities consist of $316 million of Alt-A senior and subordinate and $2 million of subprime subordinate securities.
|
THE REDWOOD REVIEW 2ND QUARTER 2011
|
13
|
|
|
|
FINANCIAL INSIGHTS
|
Balance Sheet (continued)
|
Real Estate Securities (continued)
|
|
„
|
The table below details the change in fair value of securities at Redwood during the second and first quarters of 2011.
|
| |
|
|
|
|
|
|
|
Real Estate Securities at Redwood
|
|
|
($ in millions)
|
|
| |
|
|
|
|
|
|
| |
|
Three Months Ended
|
|
| |
|
6/30/2011
|
|
|
3/31/2011
|
|
|
Beginning fair value
|
|
$ |
788 |
|
|
$ |
823 |
|
| |
|
|
|
|
|
|
|
|
|
Acquisitions
|
|
|
33 |
|
|
|
13 |
|
|
Sales
|
|
|
(9 |
) |
|
|
(35 |
) |
|
Effect of principal payments
|
|
|
(21 |
) |
|
|
(23 |
) |
|
Change in fair value, net
|
|
|
(30 |
) |
|
|
10 |
|
| |
|
|
|
|
|
|
|
|
|
Ending fair value
|
|
$ |
761 |
|
|
$ |
788 |
|
|
„
|
Our acquisitions in the second quarter included $9 million of prime senior securities, $21 million of prime subordinate securities, and $3 million of non-prime senior securities, all from 2005 and earlier vintages. We sold $9 million of prime senior securities in the second quarter.
|
|
„
|
From the end of the second quarter of 2011 through July 29, 2011, we acquired $14 million of securities at Redwood, and there were no sales.
|
|
Investments in the Fund and the Securitization Entities
|
|
„
|
Our investments in the Fund, Sequoia, and Acacia securitization entities, as reported for GAAP, totaled $94 million at June 30, 2011.
|
|
„
|
At June 30, 2011, the GAAP carrying value and the fair value of our investment in the Fund was $3 million, consisting of cash that we expect will be distributed in the third quarter.
|
|
„
|
At June 30, 2011, the GAAP carrying value of our investments in Sequoia (new and legacy) was $90 million and management’s estimate of the non-GAAP economic value of those investments was $89 million. We estimate the non-GAAP economic value for these investments, consisting of $53 million of IOs and $36 million of senior and subordinate securities, using the same valuation process that we follow to fair value our other real estate securities. For GAAP, we account for these assets and liabilities at historical cost, and the net $90 million carrying value represents the difference between the carrying costs of the assets ($3.7 billion) and liabilities ($3.6 billion) of the Sequoia entities.
|
|
„
|
At June 30, 2011, the GAAP carrying value of our investments in Acacia entities was $1 million.
|
|
14
|
THE REDWOOD REVIEW 2ND QUARTER 2011
|
|
|
|
|
FINANCIAL INSIGHTS
|
Balance Sheet (continued)
|
„
|
At June 30, 2011, we had $41 million of short-term debt outstanding, compared to no short-term debt outstanding at March 31, 2011. We use short-term debt, in addition to our excess cash, to finance the acquisition of residential mortgage loans prior to securitizing them through our Sequoia securitization platform. In mid-July, our short-term debt was repaid from the proceeds of a resecuritization of a portion of our senior securities. As of July 29, 2011, we had no short-term debt outstanding.
|
|
„
|
At June 30, 2011, we had $140 million of long-term debt outstanding with a stated interest rate of three-month LIBOR plus 225 basis points due in 2037. In 2010, we effectively fixed the interest rate on this long-term debt through interest rate swaps at a rate of approximately 6.75%.
|
|
„
|
Although we report our long-term debt based on its $140 million historical cost, we estimate the non-GAAP economic value of this debt at $78 million based on its stated interest rate using the same valuation process used to fair value our other financial assets and liabilities.
|
THE REDWOOD REVIEW 2ND QUARTER 2011
|
15
|
|
|
|
FINANCIAL INSIGHTS
|
Balance Sheet (continued)
|
„
|
At June 30, 2011, our total capital was $1.2 billion, including $1.0 billion of shareholders’ equity and $140 million of long-term debt. We use our capital to invest in earning assets, meet lender capital requirements, and to fund our operations and working capital needs.
|
|
„
|
We manage our capital through our risk-adjusted capital policy, which has served us well since the company was founded. We have successfully managed through two tumultuous periods (1998 and 2008) and we remain thoughtful about managing funding risk when we use short-term debt.
|
|
„
|
Our cash balance was $80 million at June 30, 2011. We hold cash for two main reasons. First, we hold sufficient cash to comply with covenants, to meet potential margin calls, and to cover near-term cash operating expenses. Second, we hold cash in anticipation of having opportunities to invest in long-term assets at attractive yields.
|
|
„
|
Cash was a good barometer of our ability to invest when we used only cash to fund long-term investments. We are now using cash and short-term borrowings to fund the accumulation of loans on a temporary basis. Thus, the amount of reported cash alone tells us little about the capital we have available for long-term investments.
|
|
„
|
We estimate that our immediately available investment capacity was $210 million at June 30, 2011, down from $249 million at March 31, 2011. This capacity to make long-term investments equals the amount of cash we have, plus the cash we estimate could be readily available to us by financing our residential loans held for securitization with short-term borrowings, less the amount of cash we set aside for operating expenses, pending trades, and potential margin requirements. The decrease in our investment capacity reflects our investments in commercial loans and residential securities during the second quarter.
|
|
„
|
In mid-July 2011, we completed a resecuritization of $365 million (market value) of senior securities and generated net cash proceeds of $243 million. Although the resecuritization will be accounted for as a financing for GAAP and for tax purposes, the resecuritized assets were transfered to a bankruptcy-remote securitization trust and we retained only the subordinate tranche of securities issued by that trust. This transaction provided permanent financing for those senior securities included in the resecuritization and generated additional investment capital.
|
|
„
|
In the near term, we do not anticipate a need to raise equity. Although we plan to invest much of our excess capital in 2011, we are more likely to look to our investments, including our commercial real estate loans, as a source of liquidity by applying permanent financing to them at the appropriate time. We always retain the flexibility to raise equity or other forms of capital in the future, but our practice is to ask shareholders for new equity only when we believe we have attractive investment opportunities that exceed our longer-term investment capacity.
|
|
16
|
THE REDWOOD REVIEW 2ND QUARTER 2011
|
|
|
|
|
FINANCIAL INSIGHTS
|
|
„
|
The following table provides a summary of our consolidated GAAP income for the second and first quarters of 2011.
|
| |
|
|
|
|
|
|
|
GAAP Income
|
|
|
($ in millions, except per share data)
|
|
| |
|
Three Months Ended
|
|
| |
|
6/30/2011
|
|
|
3/31/2011
|
|
|
Interest income
|
|
$ |
53 |
|
|
$ |
54 |
|
|
Interest expense
|
|
|
(24 |
) |
|
|
(22 |
) |
|
Net interest income
|
|
|
29 |
|
|
|
32 |
|
| |
|
|
|
|
|
|
|
|
|
Provision for loan losses
|
|
|
(2 |
) |
|
|
(3 |
) |
|
Market valuation adjustments, net
|
|
|
(11 |
) |
|
|
(6 |
) |
|
Net interest income after provision and market valuation adjustments
|
|
|
17 |
|
|
|
24 |
|
| |
|
|
|
|
|
|
|
|
|
Operating expenses
|
|
|
(12 |
) |
|
|
(12 |
) |
|
Realized gains on sales and calls, net
|
|
|
6 |
|
|
|
4 |
|
|
Noncontrolling interest
|
|
|
(1 |
) |
|
|
2 |
|
|
Provision for income taxes
|
|
|
(0 |
) |
|
|
(0 |
) |
| |
|
|
|
|
|
|
|
|
|
GAAP income
|
|
$ |
9 |
|
|
$ |
18 |
|
| |
|
|
|
|
|
|
|
|
|
GAAP income per share
|
|
$ |
0.11 |
|
|
$ |
0.22 |
|
|
„
|
Our consolidated GAAP income for the second quarter was $9 million, or $0.11 per share, as compared to $18 million, or $0.22 per share, for the previous quarter. The decrease was primarily a result of lower net interest income from securities as sales and principal paydowns outpaced acquisitions and originations, as they affected second quarter average balances. In addition, due to declining interest rates during the quarter, we recorded higher negative market valuation adjustments on derivatives used to hedge our residential loans pipeline.
|
|
„
|
Additional information related to GAAP income at Redwood, New Sequoia, and Other Consolidated Entities is discussed in the following pages.
|
THE REDWOOD REVIEW 2ND QUARTER 2011
|
17
|
|
|
|
FINANCIAL INSIGHTS
|
GAAP Income (continued)
Summary (continued)
|
„
|
The following tables show the estimated effect that Redwood, New Sequoia, and our Other Consolidated Entities had on GAAP income for the second and first quarters of 2011.
|
| |
|
|
|
|
|
|
|
|
|
|
|
|
|
|
|
|
Consolidating Income Statement
|
|
|
Three Months Ended June 30, 2011
|
|
|
($ in millions)
|
|
| |
|
|
|
|
|
|
|
|
|
| |
At Redwood
|
|
|
New Sequoia
|
|
|
Other Consolidated Entities
|
|
|
Intercompany Adjustments
|
|
|
Redwood Consolidated
|
|
| |
|
|
|
|
|
|
|
|
|
|
|
|
|
|
|
|
Interest income
|
|
$ |
16 |
|
|
$ |
5 |
|
|
$ |
25 |
|
|
$ |
- |
|
|
$ |
45 |
|
|
Net discount (premium) amortization
|
|
|
10 |
|
|
|
- |
|
|
|
(2 |
) |
|
|
- |
|
|
|
8 |
|
|
Total interest income
|
|
|
26 |
|
|
|
5 |
|
|
|
23 |
|
|
|
- |
|
|
|
53 |
|
| |
|
|
|
|
|
|
|
|
|
|
|
|
|
|
|
|
|
|
|
|
|
Interest expense
|
|
|
(2 |
) |
|
|
(4 |
) |
|
|
(17 |
) |
|
|
- |
|
|
|
(24 |
) |
|
Net interest income
|
|
|
23 |
|
|
|
1 |
|
|
|
5 |
|
|
|
- |
|
|
|
29 |
|
| |
|
|
|
|
|
|
|
|
|
|
|
|
|
|
|
|
|
|
|
|
|
Provision for loan losses
|
|
|
- |
|
|
|
(0 |
) |
|
|
(2 |
) |
|
|
- |
|
|
|
(2 |
) |
|
Market valuation adjustments, net
|
|
|
(7 |
) |
|
|
- |
|
|
|
(4 |
) |
|
|
- |
|
|
|
(11 |
) |
|
Net interest income (loss) after provision and market valuation adjustments
|
|
|
16 |
|
|
|
1 |
|
|
|
(0 |
) |
|
|
- |
|
|
|
17 |
|
| |
|
|
|
|
|
|
|
|
|
|
|
|
|
|
|
|
|
|
|
|
|
Operating expenses
|
|
|
(12 |
) |
|
|
(0 |
) |
|
|
(0 |
) |
|
|
- |
|
|
|
(12 |
) |
|
Realized gains on sales and calls, net
|
|
|
4 |
|
|
|
- |
|
|
|
2 |
|
|
|
- |
|
|
|
6 |
|
|
Income from New Sequoia
|
|
|
1 |
|
|
|
- |
|
|
|
- |
|
|
|
(1 |
) |
|
|
- |
|
|
Income from Other Consolidated Entities
|
|
|
0 |
|
|
|
- |
|
|
|
- |
|
|
|
(0 |
) |
|
|
- |
|
|
Noncontrolling interest
|
|
|
- |
|
|
|
- |
|
|
|
(1 |
) |
|
|
- |
|
|
|
(1 |
) |
|
Provision for income taxes
|
|
|
(0 |
) |
|
|
- |
|
|
|
- |
|
|
|
- |
|
|
|
(0 |
) |
| |
|
|
|
|
|
|
|
|
|
|
|
|
|
|
|
|
|
|
|
|
|
Net income
|
|
$ |
9 |
|
|
$ |
1 |
|
|
$ |
0 |
|
|
$ |
(1 |
) |
|
$ |
9 |
|
| |
|
|
|
|
|
|
|
|
|
|
|
|
|
|
|
|
Consolidating Income Statement
|
|
|
Three Months Ended March 31, 2011
|
|
|
($ in millions)
|
|
| |
|
|
|
|
|
|
|
|
|
| |
At Redwood
|
|
|
New Sequoia
|
|
|
Other Consolidated Entities
|
|
|
Intercompany Adjustments
|
|
|
Redwood Consolidated
|
|
| |
|
|
|
|
|
|
|
|
|
|
|
|
|
|
|
|
Interest income
|
|
$ |
16 |
|
|
$ |
3 |
|
|
$ |
25 |
|
|
$ |
- |
|
|
$ |
43 |
|
|
Net discount (premium) amortization
|
|
|
12 |
|
|
|
- |
|
|
|
(1 |
) |
|
|
- |
|
|
|
11 |
|
|
Total interest income
|
|
|
28 |
|
|
|
3 |
|
|
|
24 |
|
|
|
- |
|
|
|
54 |
|
| |
|
|
|
|
|
|
|
|
|
|
|
|
|
|
|
|
|
|
|
|
|
Interest expense
|
|
|
(3 |
) |
|
|
(2 |
) |
|
|
(17 |
) |
|
|
- |
|
|
|
(22 |
) |
|
Net interest income
|
|
|
26 |
|
|
|
0 |
|
|
|
6 |
|
|
|
- |
|
|
|
32 |
|
| |
|
|
|
|
|
|
|
|
|
|
|
|
|
|
|
|
|
|
|
|
|
Provision for loan losses
|
|
|
- |
|
|
|
(0 |
) |
|
|
(3 |
) |
|
|
- |
|
|
|
(3 |
) |
|
Market valuation adjustments, net
|
|
|
1 |
|
|
|
- |
|
|
|
(7 |
) |
|
|
- |
|
|
|
(6 |
) |
|
Net interest income (loss) after provision and market valuation adjustments
|
|
|
26 |
|
|
|
0 |
|
|
|
(3 |
) |
|
|
- |
|
|
|
24 |
|
| |
|
|
|
|
|
|
|
|
|
|
|
|
|
|
|
|
|
|
|
|
|
Operating expenses
|
|
|
(11 |
) |
|
|
- |
|
|
|
(0 |
) |
|
|
- |
|
|
|
(12 |
) |
|
Realized gains (losse) on sales and calls, net
|
|
|
7 |
|
|
|
- |
|
|
|
(3 |
) |
|
|
- |
|
|
|
4 |
|
|
Income from New Sequoia
|
|
|
0 |
|
|
|
- |
|
|
|
- |
|
|
|
(0 |
) |
|
|
- |
|
|
Loss from Other Consolidated Entities
|
|
|
(4 |
) |
|
|
- |
|
|
|
- |
|
|
|
4 |
|
|
|
- |
|
|
Noncontrolling interest
|
|
|
- |
|
|
|
- |
|
|
|
2 |
|
|
|
- |
|
|
|
2 |
|
|
Provision for income taxes
|
|
|
(0 |
) |
|
|
- |
|
|
|
- |
|
|
|
- |
|
|
|
(0 |
) |
| |
|
|
|
|
|
|
|
|
|
|
|
|
|
|
|
|
|
|
|
|
|
Net income (loss)
|
|
$ |
18 |
|
|
$ |
0 |
|
|
$ |
(4 |
) |
|
$ |
4 |
|
|
$ |
18 |
|
|
18
|
THE REDWOOD REVIEW 2ND QUARTER 2011
|
GAAP Income (continued)
|
„
|
Total interest income at Redwood Parent decreased to $26 million in the second quarter from $28 million in the first quarter. This decline is attributable to the combined net effect of the sales and principal paydowns of securities which outpaced acquisitions during the first quarter and the securitization of loans which were transferred to New Sequoia at the end of the first quarter. These declines were partially offset by an increase in our commercial loan balances as we had $29 million of originations during the quarter. Note that we also acquired $33 million of securities, most of which were acquired late in the quarter, which outpaced our sales of $9 million in the quarter, which should benefit interest income in future quarters.
|
|
„
|
Our investments in securities generated $23 million of interest income, a decline of $2 million from the previous quarter. This decline reflects lower average balances of securities (partly reflecting greater sales than acquisitions in the first quarter) as well as modestly lower yields (slower prepayments reduced the pace at which we accrete discount into income).
|
|
„
|
Our investments in commercial loans generated $2 million of interest income, an increase of $1 million from the previous quarter. The increased income resulted from a higher average commercial loan balance in the second quarter as a result of $29 million in second quarter originations, which increased the portfolio to $71 million by the end of the quarter.
|
|
„
|
In the near term, we continue to expect interest income to be derived primarily from our senior residential securities. The amount of income we recognize on these securities will remain sensitive to changes in prepayment rates. In future periods, we expect our expanding residential and commercial loan businesses to contribute more significantly to interest income.
|
|
„
|
Interest expense at Redwood Parent totaled $2 million for the second quarter, primarily related to our long-term debt and corresponding hedges. During July 2011, we also completed a resecuritization of $365 million (market value) of our senior residential securities, resulting in the issuance of $245 million of consolidated asset-backed securities at a cost of LIBOR plus 2%.
|
|
„
|
From an economic standpoint, we believe that our hedging strategy for conduit loans has worked well in the face of significant interest rate volatility. Unfortunately, economics and accounting practices are not in sync, which will likely contribute to ongoing earnings volatility as our conduit business expands. For example, net negative market valuation adjustments were $7 million for the second quarter, largely the result of a $5 million decrease in the value of derivatives used to manage certain risks associated with our accumulation of residential and commercial loans. For GAAP purposes, changes in values of certain of our risk management derivatives are generally recorded through earnings during the period the values change, while any corresponding changes in value of the mortgage instruments being hedged will not necessarily be recorded through earnings during the same period. If the hedged values do not change through the securitization date, we would expect over time to recover all or a portion of our second quarter conduit-related hedging loss through higher interest income on the retained securities from the next securitization. There is no assurance that hedging losses or gains will be fully offset by future higher interest income on retained securities.
|
|
„
|
During the second quarter, we recognized $4 million of gains on sold and called securities, a $3 million decrease from the previous quarter due to decreased sale activity.
|
THE REDWOOD REVIEW 2ND QUARTER 2011
|
19
|
GAAP Income (continued)
Redwood Parent (continued)
|
„
|
The following table presents the components of operating expenses at Redwood for the second and first quarters of 2011.
|
| |
|
|
|
|
|
|
|
Operating Expenses at Redwood
|
|
|
($ in millions)
|
|
| |
Three Months Ended
|
|
| |
|
6/30/2011
|
|
|
3/31/2011
|
|
|
Fixed compensation expense
|
|
$ |
4 |
|
|
$ |
4 |
|
|
Variable compensation expense
|
|
|
1 |
|
|
|
1 |
|
|
Equity compensation expense
|
|
|
2 |
|
|
|
2 |
|
|
Total compensation expense
|
|
|
7 |
|
|
|
7 |
|
| |
|
|
|
|
|
|
|
|
|
Systems
|
|
|
2 |
|
|
|
2 |
|
|
Office costs
|
|
|
2 |
|
|
|
2 |
|
|
Accounting and legal
|
|
|
1 |
|
|
|
1 |
|
|
Total non-compensation expense
|
|
|
5 |
|
|
|
5 |
|
| |
|
|
|
|
|
|
|
|
|
Total operating expense
|
|
$ |
12 |
|
|
$ |
12 |
|
|
„
|
In the second quarter, operating expenses at Redwood were $12 million and remained in line with our expectations.
|
|
„
|
Information about New Sequoia’s contribution to Redwood’s earnings and other related comments are in the Investments in New Sequoia module on page 25.
|
|
Other Consolidated Entities
|
|
„
|
We recognized net income of less than $1 million for the second quarter from our investments in the Fund, Legacy Sequoia, and Acacia securitization entities, as compared to a net loss of $4 million for the previous quarter. This increase is primarily a result of lower negative market valuation adjustments and the absence of losses on the sale of certain securities at the Fund that occurred in the first quarter.
|
|
„
|
During the second quarter we sold the remaining securities from the Fund. We anticipate making a final distribution to partners during the third quarter and then dissolving the Fund.
|
|
„
|
The allowance for loan losses at Legacy Sequoia entities increased as a percent of serious delinquencies to 47% at the end of the second quarter from 46% at the end of the previous quarter. There are currently eleven Sequoia entities for which we have aggregate loan loss reserves of $6 million in excess of our reported investment for GAAP purposes, an amount we expect to recover in future periods upon the payoff or deconsolidation of those entities. We did not deconsolidate any Sequoia entities in the second quarter.
|
|
20
|
THE REDWOOD REVIEW 2ND QUARTER 2011
|
|
Taxable Income and Dividends
|
As a REIT, Redwood is required to distribute to shareholders at least 90% of its REIT taxable income (and meet certain other requirements), although Redwood’s board of directors can declare dividends in excess of this minimum requirement. REIT taxable income is defined as income as calculated for tax that is earned at Redwood and its qualified REIT subsidiaries. Redwood also earns taxable income at its taxable subsidiaries, which it is not required to distribute. To the extent Redwood retains taxable income that is not distributed to shareholders, it is taxed at corporate tax rates. A reconciliation of GAAP and taxable income is set forth in Table 2 in the Financial Tables in this Review.
|
„
|
Redwood’s estimated taxable loss for the second quarter of 2011 was less than $1 million, or less than $0.01 per share, as compared to estimated taxable income of $5 million, or $0.06 per share, for the first quarter of 2011.
|
|
„
|
Credit losses increased modestly in the second quarter and continue to be a significant driver of our taxable results and account for the majority of the difference between GAAP and taxable income. In the second quarter of 2011, credit losses as calculated for tax purposes totaled $16 million, compared to $15 million in the first quarter of 2011, and were charged directly to taxable earnings since the tax code does not allow for the establishment of credit reserves.
|
|
„
|
We believe it is likely that we will report a taxable loss for the full year 2011 as we expect an additional $138 million of credit losses on securities will be realized in future periods for tax purposes. However, the timing of credit losses on securities we own will have a significant impact on our taxable income. Presently, the realization of credit losses has been delayed as a result of loan modifications, mortgage servicing related issues, and for other reasons. In the interim, we expect to continue earning interest on the majority of these securities.
|
|
„
|
On May 17, 2011, our board of directors declared a regular dividend of $0.25 per share for the second quarter, which was paid on July 21, 2011 to shareholders of record on June 30, 2011. In November 2010, the board of directors announced its intention to continue to pay a regular dividend of $0.25 per share per quarter in 2011.
|
|
„
|
The characterization of our 2011 dividend for tax purposes as either ordinary income, capital gains, or return of capital will depend upon numerous factors, including the amount of earnings and any net capital gains (for tax purposes) we generate during the year. At this time, it is too early to characterize the potential tax status of our 2011 dividends.
|
|
„
|
In the second quarter, our cash flow was in line with our expectations.
|
THE REDWOOD REVIEW 2ND QUARTER 2011
|
21
|
|
|
|
FINANCIAL INSIGHTS
|
|
„
|
The sources and uses of cash in the table below are derived from our GAAP Consolidated Statements of Cash Flow for the second and first quarters of 2011 aggregating and netting all items in a manner consistent with the way management analyzes them. This table excludes the gross cash flow generated by our Sequoia and Acacia securitization entities and the Fund (cash flow that is not available to Redwood), but does include the cash flow distributed to Redwood as a result of our investments in these entities. The beginning and ending cash balances presented in the table below are GAAP amounts.
|
| |
|
|
|
|
|
|
|
Redwood
|
|
|
Sources and Uses of Cash
|
|
|
($ in millions)
|
|
| |
|
Three Months Ended
|
|
| |
|
6/30/2011
|
|
|
3/31/2011
|
|
| |
|
|
|
|
|
|
|
Beginning cash balance
|
|
$ |
220 |
|
|
$ |
47 |
|
|
Sources of cash(1)
|
|
|
|
|
|
|
|
|
|
Loans at Redwood
|
|
|
5 |
|
|
|
6 |
|
|
Proceeds from securitization
|
|
|
- |
|
|
|
296 |
|
|
Securities at Redwood - principal and interest
|
|
|
|
|
|
|
|
|
|
Residential senior
|
|
|
30 |
|
|
|
33 |
|
|
Residential re-REMIC
|
|
|
1 |
|
|
|
2 |
|
|
Residential subordinate
|
|
|
8 |
|
|
|
9 |
|
|
Commercial and CDO
|
|
|
1 |
|
|
|
- |
|
|
Sales of securities (2)
|
|
|
14 |
|
|
|
30 |
|
|
Investments in Consolidated Entities
|
|
|
16 |
|
|
|
15 |
|
|
Short-term debt financing
|
|
|
41 |
|
|
|
- |
|
|
Derivative margin returned, net
|
|
|
- |
|
|
|
3 |
|
|
Changes in working capital
|
|
|
- |
|
|
|
3 |
|
|
Total sources of cash
|
|
|
116 |
|
|
|
397 |
|
| |
|
|
|
|
|
|
|
|
|
Uses of cash
|
|
|
|
|
|
|
|
|
|
Acquisitions of residential loans
|
|
|
(152 |
) |
|
|
(101 |
) |
|
Originations of commercial loans
|
|
|
(29 |
) |
|
|
(12 |
) |
|
Acquisitions of securities(3)
|
|
|
(29 |
) |
|
|
(13 |
) |
|
Investment in New Sequoia
|
|
|
- |
|
|
|
(15 |
) |
|
Short-term debt repayment
|
|
|
- |
|
|
|
(44 |
) |
|
Cash operating expenses
|
|
|
(12 |
) |
|
|
(17 |
) |
|
Derivative margin posted, net
|
|
|
(11 |
) |
|
|
- |
|
|
Interest expense on long-term debt
|
|
|
(2 |
) |
|
|
(2 |
) |
|
Dividends
|
|
|
(20 |
) |
|
|
(20 |
) |
|
Changes in working capital
|
|
|
(1 |
) |
|
|
- |
|
|
Total uses of cash
|
|
|
(256 |
) |
|
|
(224 |
) |
|
Net (uses) sources of cash
|
|
$ |
(140 |
) |
|
$ |
173 |
|
|
Ending cash balance
|
|
$ |
80 |
|
|
$ |
220 |
|
|
(1) Cash flow from securities and investments can be volatile from quarter to quarter depending on the level of invested capital, the timing of credit losses, acquisitions, sales, and changes in prepayments and interest rates. Therefore, (i) cash flow generated by these investments is not necessarily reflective of the long-term economic yield we will earn on the investments in a given period; and, (ii) it is difficult to determine what portion of the cash received from an investment is a return “of” principal and what portion is a return “on” principal in a given period.
|
| |
|
(2) Total sales in the second quarter of 2011 were $9 million, all of which settled during the quarter. Total sales of securities in the first quarter of 2011 were $35 million. Securities sales of $5 million made in the first quarter that did not settle until early April are reflected in the second quarter.
|
| |
|
(3) Total acquisitions of securities in the second quarter of 2011 were $33 million. Securities acquisitions of $4 million made in the second quarter that settled in July are not reflected in this table.
|
|
22
|
THE REDWOOD REVIEW 2ND QUARTER 2011
|
Cash Flow (continued)
|
„
|
Total sources of cash in the second quarter amounted to $116 million, compared to $397 million in the first quarter. The large difference primarily reflects the first quarter securitization of residential loans, which generated $296 million of cash proceeds. Cash sources in the second quarter included $41 million of short-term borrowings for the acquisition of residential loans that we currently intend to securitize in the third quarter.
|
|
„
|
Cash generated in the second quarter from our loans and securities at Redwood and our investments in consolidated entities totaled $61 million, compared to $65 million in the first quarter. This cash flow from our investments continued to comfortably exceed our cash operating expenses of $12 million, interest expense on long-term debt of $2 million, and dividends of $20 million.
|
|
„
|
Significant uses of cash in the second quarter were $152 million for the acquisition of residential loans, $29 million for the origination of commercial mezzanine loans, and $29 million for the acquisition of seasoned RMBS previously issued by third parties.
|
|
„
|
Cash flow from securities and investments can be volatile from quarter to quarter depending on the level of invested capital, the timing of credit losses, acquisitions, sales, and changes in prepayments and interest rates.
|
THE REDWOOD REVIEW 2ND QUARTER 2011
|
23
|
 |
|
|
RESIDENTIAL MORTGAGE LOAN BUSINESS
|
Summary
We purchase newly originated loans (primarily prime jumbo loans) that meet our collateral criteria from approved lenders on a flow or bulk basis. Loans acquired through this process (our “conduit”) are expected to be securitized through new Sequoia securitization entities. Our conduit allows lenders to reduce their exposure to interest and credit risk associated with residential mortgage loans, free up capital for additional lending, and potentially reduce hedging costs.
Quarterly Update
|
„
|
At June 30, 2011, residential loans purchased and held on our balance sheet for future securitization totaled $203 million, up from $53 million at March 31, 2011. At June 30, 2011, the pipeline of rate-locked residential mortgage loans we plan to purchase through our conduit totaled $201 million. At July 29, 2011, loans purchased and held on our balance sheet for future securitization totaled $302 million and the pipeline of rate-locked residential mortgage loans we plan to purchase through our conduit totaled $198 million.
|
|
„
|
The biggest hurdle we are facing in our residential mortgage loan business continues to be our ability to buy loans. As we discussed last quarter, the large bank originators are able to sell approximately 90% of their originations to the GSEs and they are holding onto their non-agency eligible mortgage loan originations to offset weak non-mortgage loan demand. However, we continue to make progress toward signing up regional originators to achieve our near term goal of having approximately 25 to 50 high quality correspondent relationships. We are generally buying longer term 10-year hybrids and 15- and 30-year fixed rate mortgages that are difficult for banks to match fund.
|
|
„
|
Our goal is to establish our conduit as a leading source of liquidity for the prime jumbo mortgage market, where originators are able to obtain timely and reliable purchase commitments, and investors are able to rely upon us as a leading issuer of private label RMBS.
|
|
„
|
The size of the jumbo market is potentially vast — suggesting an opportunity that well exceeds our current capital available to invest. For example, if annual residential mortgage originations return to $1.5 trillion and jumbo loans account for 20% (the median from 1993 through 2010), jumbo loan originations would amount to $300 billion. With GSE reform, the portion of the mortgage market that could potentially be available to Redwood could be substantially larger if the conforming loan limits are reduced (as the Obama Administration has indicated it intends to do) during the reform transition period, and perhaps still larger if, as part of GSE reform, the concept of conforming limits is eliminated.
|
|
24
|
THE REDWOOD REVIEW 2ND QUARTER 2011
|
|
|
|
INVESTMENTS IN NEW SEQUOIA
|
Summary
This module reflects our investment in Sequoia securitization entities created in 2010 and later periods. Sequoia securitization entities acquire residential mortgage loans through our conduit and issue residential mortgage-backed securities (RMBS) backed by these loans. Generally, the loans that New Sequoia entities have acquired are prime-quality loans originated in 2009 and later periods. Most of the senior or investment-grade rated RMBS issued by New Sequoia entities are sold to third-party investors; Redwood generally acquires the subordinate or non-investment grade securities and has acquired senior securities and interest-only securities from the New Sequoia entities.
Quarterly Update
|
„
|
In the second quarter of 2011, we reported GAAP income of $1 million from interest on our New Sequoia investments, and these investments generated $3 million of cash, compared to GAAP income of less than $1 million and cash of $2 million in the first quarter of 2011.
|
|
„
|
At June 30, 2011, our investment in our New Sequoia securitizations totaled $37 million. Our investment consists of senior and subordinate securities and IOs.
|
|
„
|
We did not complete a securitization in the second quarter of 2011. It is our intention to complete a securitization in the third quarter and we are targeting another in the fourth quarter.
|
|
„
|
For GAAP purposes, we account for Sequoia securitizations in which we have an investment as financings, with the assets and liabilities carried on our balance sheet at their amortized cost. As a result, our $37 million investment in New Sequoia does not appear on our GAAP consolidated balance sheet as an investment; rather, it is reflected as the difference, at June 30, 2011, between the $396 million of consolidated assets of New Sequoia and the $359 million of consolidated RMBS issued to third parties. (See Redwood’s consolidating balance sheet on page 12.)
|
|
„
|
There were no delinquencies in the loans underlying either of our 2010 or 2011 Sequoia securitizations at June 30, 2011.
|
THE REDWOOD REVIEW 2ND QUARTER 2011
|
25
|
|
|
|
|
RESIDENTIAL REAL ESTATE SECURITIES
|
Summary
Redwood invests in securities that are backed by pools of real estate loans. Some of these investments in residential securities consist of senior prime and non-prime securities, and non-senior securities. Residential prime securities are mortgage-backed securities backed by prime residential mortgage loans. Residential non-prime securities are mortgage-backed securities backed by non-prime (Alt-A, Option ARM, and Subprime) residential mortgage loans. Non-senior securities include subordinate and re-REMIC securities.
Senior securities are those interests in a securitization that have the first right to cash flows and are last in line to absorb losses. Subordinate securities are those interests in a securitization that have the last right to cash flows and are first in line to absorb losses. A re-REMIC is a resecuritization of mortgage-backed securities where the cash flow from and any credit losses absorbed by the underlying mortgage-backed securities are allocated among the securities issued in the resecuritization transaction in a variety of ways.
The following discussion refers only to the residential securities owned by Redwood, exclusive of the securities owned by the Fund, Sequoia entities, and Acacia entities, and exclusive of Redwood’s investments in these entities.
In the Financial Tables in the back of this Review, information on the residential securities we own and underlying loan characteristics are set forth in Tables 5 through 8B.
Quarterly Update
|
„
|
Interest income generated by our residential AFS securities was $21 million in the second quarter of 2011, resulting in an annualized yield of 13.3% on the amortized cost of these securities.
|
|
„
|
At June 30, 2011, the fair value of residential securities we own totaled $754 million, consisting of $286 million in prime senior securities, $307 million in non-prime senior securities, $78 million in re-REMIC securities, and $83 million in subordinate securities.
|
|
„
|
At June 30, 2011, 36% of the securities we held were fixed-rate assets, 12% were adjustable-rate assets, 33% were hybrid assets that reset within the next year, 5% were hybrid assets that reset between 12 and 36 months, and 14% were hybrid assets that reset after 36 months.
|
|
26
|
THE REDWOOD REVIEW 2ND QUARTER 2011
|
|
|
 |
RESIDENTIAL REAL ESTATE SECURITIES
|
|
Quarterly Update (continued)
|
|
„
|
The following table presents information on residential securities at Redwood at June 30, 2011. For GAAP, we account for the large majority of these securities as available-for-sale (AFS) and others as trading securities and, in both cases, the securities are reported at their fair value as of the report date.
|
| |
|
|
|
|
|
|
|
|
|
|
|
|
|
|
|
|
Residential Securities at Redwood
|
|
|
June 30, 2011
|
|
|
($ in millions)
|
|
| |
|
| |
|
Senior
|
|
|
|
|
|
|
|
|
|
|
| |
|
Prime
|
|
|
Non-prime
|
|
|
Re-REMIC
|
|
|
Subordinate
|
|
|
Total
|
|
|
Available-for-sale securities
|
|
|
|
|
|
|
|
|
|
|
|
|
|
|
|
|
Current face
|
|
$ |
337 |
|
|
$ |
367 |
|
|
$ |
132 |
|
|
$ |
275 |
|
|
$ |
1,111 |
|
|
Credit reserve
|
|
|
(19 |
) |
|
|
(19 |
) |
|
|
(49 |
) |
|
|
(154 |
) |
|
|
(241 |
) |
|
Net unamortized discount
|
|
|
(72 |
) |
|
|
(82 |
) |
|
|
(52 |
) |
|
|
(38 |
) |
|
|
(244 |
) |
|
Amortized cost
|
|
|
246 |
|
|
|
266 |
|
|
|
31 |
|
|
|
83 |
|
|
|
626 |
|
| |
|
|
|
|
|
|
|
|
|
|
|
|
|
|
|
|
|
|
|
|
|
Unrealized gains
|
|
|
42 |
|
|
|
24 |
|
|
|
47 |
|
|
|
8 |
|
|
|
121 |
|
|
Unrealized losses
|
|
|
(2 |
) |
|
|
(2 |
) |
|
|
- |
|
|
|
(9 |
) |
|
|
(13 |
) |
| |
|
|
|
|
|
|
|
|
|
|
|
|
|
|
|
|
|
|
|
|
|
Overall credit support to prime senior securities (1)
|
|
|
7.19 |
% |
|
|
14.58 |
% |
|
|
|
|
|
|
|
|
|
|
|
|
|
Serious delinquencies as a % of collateral balance (1)
|
|
|
8.39 |
% |
|
|
13.31 |
% |
|
|
|
|
|
|
|
|
|
|
|
|
| |
|
|
|
|
|
|
|
|
|
|
|
|
|
|
|
|
|
|
|
|
|
Trading securities
|
|
|
- |
|
|
|
19 |
|
|
|
- |
|
|
|
1 |
|
|
|
20 |
|
| |
|
|
|
|
|
|
|
|
|
|
|
|
|
|
|
|
|
|
|
|
|
Fair value of residential securities
|
|
$ |
286 |
|
|
$ |
307 |
|
|
$ |
78 |
|
|
$ |
83 |
|
|
$ |
754 |
|
| |
|
|
|
|
|
|
|
|
|
|
|
|
|
|
|
|
|
|
|
|
|
Fair value as a % of face value(2)
|
|
|
85 |
% |
|
|
78 |
% |
|
|
59 |
% |
|
|
30 |
% |
|
|
66 |
% |
|
Amortized cost as a % of face value(2)
|
|
|
73 |
% |
|
|
72 |
% |
|
|
23 |
% |
|
|
30 |
% |
|
|
56 |
% |
| |
|
|
|
|
|
|
|
|
|
|
|
|
|
|
|
|
|
|
|
|
|
(1) Overall credit support and serious delinquency rates are weighted by securitization balances. Credit support and delinquencies may vary significantly by securitization. Serious delinquencies include loans over 90-days past due, in foreclosure, and REO.
|
| |
|
(2) AFS securities only.
|
|
„
|
The overall credit support data presented in the table above represents the level of support for prime and non-prime senior securities owned at Redwood, weighted by the securitization or underlying collateral balance, rather than the book value or market value of the securities.
|
|
„
|
At June 30, 2011, the average overall level of credit support for the prime senior securities was 7.19% and for the non-prime senior securities was 14.58% as shown in the table above. For an individual security with these levels of credit support, this would mean that losses experienced on the collateral would have to exceed credit support levels before the security would suffer losses. Comparing the level of credit support available to seriously delinquent loans provides one measure of the level of credit sensitivity that exists within our senior securities portfolio. For example, assuming an individual senior security has the average characteristics of the portfolio, 7.19% of credit support and serious delinquencies of 8.39%, all of the seriously delinquent loans could be liquidated with a 50% severity, generating losses of 4.20%. This hypothetical security would then have 3.00% of credit support remaining to absorb future losses before the senior securities would start to absorb losses.
|
|
„
|
We emphasize that no individual security has the average characteristics of the portfolio. Individual securities may have more or less credit support than the average, or more or less seriously delinquent loans than the average. As such, certain securities have a more positive credit enhancement to serious delinquency ratio while others have a less positive or negative ratio. As a result, it is possible for some individual securities to incur losses without aggregate portfolio losses exceeding the overall portfolio credit support.
|
THE REDWOOD REVIEW 2ND QUARTER 2011
|
27
|
|
|
|
RESIDENTIAL REAL ESTATE SECURITIES
|
Quarterly Update (continued)
|
„
|
Serious delinquencies in our non-prime senior portfolio are significantly higher than in our prime senior portfolio as shown in the table on page 27. However, the levels of credit and structural support are also significantly higher and, as a result, we believe our non-prime senior portfolio is generally able to withstand the higher levels of credit losses we expect to incur on these pools.
|
|
„
|
Securities are acquired assuming a range of outcomes based on modeling of expected performance at the individual loan level for both delinquent and current loans. Over time, the performance of these securities may require a change in the amount of credit reserves we designate.
|
|
„
|
In the second quarter, credit losses on our residential securities at Redwood totaled $34 million, all of which came from our subordinate securities. In the first quarter, credit losses on residential securities totaled $22 million. We expect future losses to extinguish the majority of the subordinate securities as reflected by the $154 million of credit reserves we have provided for the $275 million face value of those securities. Until the losses occur, we will continue to earn interest on the face value of those securities.
|
|
„
|
Additional information on interest income and yields for our securities portfolio is reported in the Financial Tables in the back.
|
Housing Prices
|
„
|
Our outlook for housing prices is unchanged from three months ago. Affordability looks better than it has in many years, when considering income and home prices. However, there is a significant overhang of supply, especially when considering “shadow” inventory that is not yet on the market. In addition, tight underwriting of residential mortgage loans will continue to limit buyers’ ability to obtain desired financing. Nationwide, we believe that home prices have an additional risk of 5% to 10% price declines, with actual declines likely to vary by market and product type. We believe we are in the process of forming a bottom, but do not expect housing, in general, to be a significantly appreciating asset class for several years.
|
Delinquencies
|
„
|
Delinquencies were stable in the second quarter, but remain at historically elevated levels. According to LoanPerformance data, serious (60+ day) delinquencies rose by 0.02% quarter over quarter to 11.61% for prime loans and fell 0.73% quarter over quarter to 32.42% for Alt-A loans. The delinquencies on loans underlying Redwood’s portfolio are modestly lower than the industry as a whole.
|
|
„
|
Early-stage roll rates (from loans always current to 30 days delinquent) improved markedly in the second quarter. Of previously “always current” prime loans, 0.5% missed their first payment in June 2011, down from 0.7% in March 2011, while the same metric for Alt-A loans fell to 1.1% from 1.4%. Overall, these “always current” borrowers performed better than in any quarter since the second quarter of 2007, and this trend should eventually cause total delinquencies to fall. For now, the slowdown in new defaults at the front of the delinquency pipeline is being offset by an extension in liquidation timelines from loans at the back end of the pipeline.
|
|
28
|
THE REDWOOD REVIEW 2ND QUARTER 2011
|
|
|
|
RESIDENTIAL REAL ESTATE SECURITIES
|
Quarterly Update (continued)
Prepayments
|
„
|
Prepayments continued to slow during the second quarter. Prime borrowers with loan-to-value (LTV) ratios below 100% prepaid at 16% CPR in June (down from 20% in March), while Alt-A borrowers with equity paid at 8% CPR, in line with March. This decrease came despite falling interest rates — according to Freddie Mac, the monthly average rate for new loans fell from 4.84% in March to 4.51% in June 2011. Borrowers without equity prepaid very slowly regardless of credit quality, with prime and Alt-A loans with LTV ratios above 100% prepaying at only 5% and 1% CPR respectively, in line with the prior quarter.
|
THE REDWOOD REVIEW 2ND QUARTER 2011
|
29
|
Summary
Redwood invests in commercial real estate loans and securities. Our commercial investments at Redwood consist of commercial mezzanine loans originated in 2010 and 2011, and subordinate commercial mortgage-backed securities (CMBS) and loans acquired prior to 2008. This discussion is exclusive of commercial securities and loans owned by Acacia entities.
Market Conditions
|
„
|
With respect to rents and vacancies, many commercial real estate markets can be characterized as stabilized to slightly improved. In particular, the better quality assets located in certain “24/7” markets, such as New York City, Washington D.C., and San Francisco, have experienced strong demand from investors, as many industry participants are forecasting additional improvement in the fundamentals for commercial real estate assets. The result is a bifurcated market where prices and competition are increasing for better quality assets in healthier markets.
|
|
„
|
Notwithstanding a recent pricing decline for CMBS and other fixed income products, the commercial mortgage market continues towards recovery and stabilization. Thus far in 2011, CMBS aggregators, portfolio lenders, and the GSEs have all experienced a significant increase in transaction volume. CMBS aggregators in particular are staffing up and adding resources in anticipation of much higher issuance in the near term, while portfolio lenders including both life companies and banks are posting very strong new origination results for their targeted assets. The GSEs continue to dominate multi-family lending activity; however, significant inroads are being made by life companies, banks, and CMBS lenders.
|
Quarterly Update
|
„
|
We have built a commercial origination and investment franchise that is recognized in the market for providing medium-term debt solutions for our target borrowers. We are collaborating with portfolio and CMBS lending institutions to create attractive, high quality subordinate debt investments, primarily mezzanine loans.
|
|
„
|
Our growing commercial portfolio consists of investments in stabilized multi-family properties, central business district office buildings in major markets, necessity/grocery-anchored retail centers, and hospitality with strong brands and operators. At June 30, 2011, our commercial mezzanine portfolio totaled $71 million, consisting of eight loans originated in the past nine months. On average, these loans have a weighted average maturity of 5.4 years and a coupon of 10.5%. In the near term, our anticipated investment pace for commercial originations is in line with our previously stated forecast of $25 million to $50 million per quarter.
|
|
„
|
Our legacy CMBS portfolio continues to decline as the credit losses on the underlying loans decrease the remaining principal balance of these investments. We will continue to receive some cash from this portfolio (currently about $1 million per quarter) and the market value of our CMBS portfolio will continue to decline from its current level of $6 million as these anticipated losses occur.
|
|
„
|
In the commercial section of the Redwood Trust website, we disclose information about our origination or acquisition of new commercial real estate loans, generally within five business days of originating or acquiring them. We believe that this information may be of interest to investors in Redwood, although we may not always disclose on our website each new commercial loan we originate or acquire (or we may not disclose them on our website within the five business day period described above) due to, among other reasons, confidentiality obligations to the borrowers.
|
|
30
|
THE REDWOOD REVIEW 2ND QUARTER 2011
|
|
|
|
LEGACY INVESTMENTS IN OTHER CONSOLIDATED ENTITIES
|
|
Prior to 2010, we sponsored Sequoia and Acacia securitization entities that acquired mortgage loans and securities and created and issued ABS backed by these loans and securities. References to Sequoia’s activities prior to 2010 are referred to as “Legacy Sequoia.” Also included in this discussion is the Opportunity Fund. Our Sequoia program is active and issued ABS in 2010 and 2011, which is discussed in the Investments in New Sequoia module.
|
|
„
|
In the second quarter of 2011, we reported a combined income of $0.5 million from Legacy Sequoia and Acacia entities and the Fund, compared to a net loss of $4 million in the first quarter of 2011. The improvement was due to a combination of: 1) a $2 million gain on the sale of assets at the Fund in the second quarter compared to a loss of $3 million on the sale of assets at the Fund in the first quarter; 2) a $3 million reduction to $4 million in the negative market value adjustments; and 3) a $1 million reduction to $2 million in the loan loss provision at Sequoia in the second quarter due to better credit performance. These improvements were partially offset by a $1 million decrease in net interest income due to the continuing runoff of legacy assets, and from a $3 million negative change in non-controlling interest.
|
|
„
|
Cash flow generated from our investments in Legacy Sequoia and Acacia entities, and the Fund totaled $13 million in both the second and first quarters. The primary difference between the $0.5 million GAAP income and the $13 million in positive cash flow relates to non-cash charges for loan loss provision at Legacy Sequoia entities, market valuation adjustments at Legacy Sequoia and Acacia entities and the Fund, and principal payments.
|
|
„
|
Cumulative losses for all 52 Legacy Sequoia residential mortgage securitizations sponsored by us (totaling $35 billion at issuance) totaled 0.51% of the original face amount of the securities through June 30, 2011.
|
|
„
|
The consolidation of the assets and liabilities of securitization entities may lead to potentially volatile reported earnings for a variety of reasons, including the amortization of premium on the loans and liabilities of Sequoia entities, changes in credit loss provisions for loans held by Sequoia entities, fair value adjustments for the assets and liabilities of the Acacia entities, and deconsolidation events.
|
THE REDWOOD REVIEW 2ND QUARTER 2011
|
31
|
This Page Intentionally Left Blank
 |
|
|
ACCOUNTING DISCUSSION
|
Mark-to-Market Valuation Process
|
„
|
Market values reflect an “exit price,” or the amount we believe we would realize if we sold an asset or would pay if we repurchased a liability in an orderly transaction, even though we generally have no intention — nor would we be required — to sell assets or repurchase liabilities. Establishing market values is inherently subjective and requires us to make a number of assumptions, including the future of interest rates, prepayment rates, discount rates, credit loss rates, and the timing of credit losses. The assumptions we apply are specific to each asset or liability.
|
|
„
|
We rely on our internal calculations to compute the fair value of our securities and we request and consider indications of value (marks) from third-party dealers to assist us in our mark-to-market valuation process. For June 30, 2011, we received dealer marks on 83% of our securities and 95% of our ABS issued. In the aggregate, our internal valuations of the securities on which we received dealer marks were 3% lower (i.e., more conservative) than the dealer marks and our internal valuations of our ABS issued on which we received dealer marks were 7% higher (i.e., more conservative) than the aggregate dealer marks.
|
Determining Other-Than-Temporary Impairments
|
„
|
The multi-step process for determining whether an investment security has other-than-temporary impairment is presented below.
|
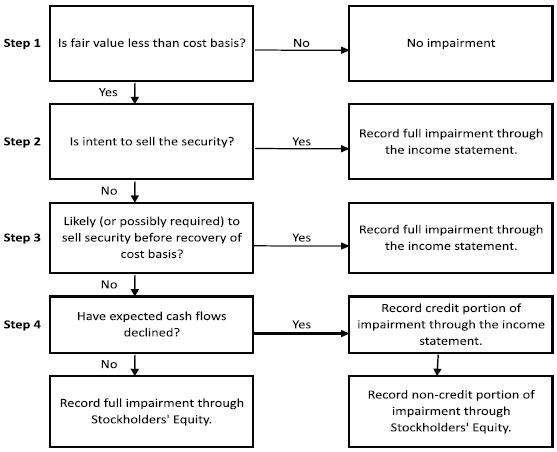
|
34
|
THE REDWOOD REVIEW 2ND QUARTER 2011
|
|
|
 |
|
GLOSSARY
|
ACACIA
Acacia is the brand name for the collateralized debt obligation (CDO) securitizations Redwood sponsored.
ADJUSTABLE-RATE MORTGAGES (ARMs)
Adjustable-rate mortgages are loans that have coupons that adjust at least once per year. We make a distinction between ARMs (loans with a rate adjustment at least annually) and hybrids (loans that have a fixed-rate period of 2 -10 years and then become adjustable-rate).
AGENCY
Agency refers to government-sponsored enterprises (GSEs), including Federal National Mortgage Association (Fannie Mae), Federal Home Loan Mortgage Corporation (Freddie Mac), and Government National Mortgage Association (Ginnie Mae).
ALT-A SECURITIES and ALT-A LOANS
Alt-A securities are residential mortgage-backed securities backed by loans that have higher credit quality than subprime and lower credit quality than prime. Alt-A originally represented loans with alternative documentation, but the definition has shifted over time to include loans with additional risk characteristics and in some cases investor loans. In an Alt-A loan, the borrower’s income may not be verified, and in some cases, may not be disclosed on the loan application. Alt-A loans may also have expanded criteria that allow for higher debt-to-income ratios with higher accompanying loan-to-value ratios than would otherwise be permissible for prime loans.
AMORTIZED COST
Amortized cost is the initial acquisition cost of an available-for-sale (AFS) security, minus principal repayments or principal reductions through credit losses, plus or minus premium or discount amortization. At the point in time an AFS security is deemed other-than-temporarily impaired, the amortized cost is adjusted (by changing the amount of unamortized premium or discount) by the amount of other-than-temporary impairment taken through the income statement.
ASSET-BACKED SECURITIES (ABS)
Asset-backed securities (ABS) are securities backed by financial assets that generate cash flows. Each ABS issued from a securitization entity has a unique priority with respect to receiving principal and interest cash flows and absorbing any credit losses from the assets owned by the entity.
AVAILABLE-FOR-SALE (AFS)
An accounting method for debt and equity securities in which the securities are reported at their fair value on the balance sheet. Positive changes in the fair value are accounted for as increases to stockholders’ equity and do not flow through the income statement. Negative changes in fair value may be recognized through the income statement or balance sheet, as further detailed in the Accounting Discussion module.
BOOK VALUE (GAAP)
Book value is the value of our common equity in accordance with GAAP.
COLLATERALIZED DEBT OBLIGATION (CDO) SECURITIZATIONS
The securitization of a diverse pool of assets.
THE REDWOOD REVIEW 2ND QUARTER 2011
|
35
|
|
|
|
GLOSSARY
|
COMMERCIAL MORTGAGE-BACKED SECURITIES (CMBS)
A type of mortgage-backed security that is secured by one or more loans on commercial properties.
CONSTANT (or CONDITIONAL) PREPAYMENT RATE (CPR)
Constant (or conditional) prepayment rate (CPR) is an industry-standard measure of the speed at which mortgage loans prepay. It approximates the annual percentage rate at which a pool of loans is paying down due to unscheduled principal prepayments.
CORE EQUITY
Core equity is not a measure calculated in accordance with GAAP. GAAP equity includes mark-to-market adjustments for some of our assets and interest rate agreements in “accumulated other comprehensive income (loss).” Core equity excludes accumulated other comprehensive income (loss). Core equity in some ways approximates what our equity value would be if we used historical amortized cost accounting exclusively. A reconciliation of core equity to GAAP appears in the Table 3 in the Financial Tables in this Review.
CREDIT SUPPORT
Credit support is the face amount of securities subordinate (or junior) to the applicable security that protects the security from credit losses and is generally expressed as a percentage of the securitization’s underlying pool balance.
DEBT
Debt is an obligation of Redwood. See Long-term debt and Short-term debt.
ECONOMIC VALUE (MANAGEMENT’S ESTIMATE OF ECONOMIC VALUE)
Economic value closely relates to liquidation value and is calculated using the bid-side marks (or estimated bid-side values) for all of our financial assets, and offered-side marks (or estimated offered-side values) for all of our financial liabilities. We calculate management’s estimate of economic value as a supplemental measure to book value calculated under GAAP. Our economic value estimates on a per-share basis are reconciled to GAAP book values per share in Table 3 in the Financial Tables of this Review.
FASB
Financial Accounting Standards Board.
THE FUND
The Fund refers to the Redwood Opportunity Fund, L.P., which is managed by Redwood Asset Management, Inc., a wholly-owned subsidiary of Redwood.
GAAP
Generally Accepted Accounting Principles in the United States.
GOVERNMENT SPONSORED ENTERPRISE (GSE)
A government sponsored enterprise is a financial services corporation created by the United States Congress to enhance the flow of credit to targeted sectors of the economy. Among the GSEs charted by Congress are Fannie Mae, Freddie Mac, and Ginnie Mae.
|
36
|
THE REDWOOD REVIEW 2ND QUARTER 2011
|
|
|
|
|
GLOSSARY
|
INTEREST-ONLY SECURITIES (IOs)
Interest-only securities (IOs) are specialized securities created by securitization entities where the projected cash flows generated by the underlying assets exceed the cash flows projected to be paid to the securities that are issued with principal balances. Typically, IOs do not have a principal balance and they will not receive principal payments. Interest payments to IOs usually equal an interest rate formula multiplied by a “notional” principal balance. The notional principal balances for IOs are typically reduced over time as the actual principal balance of the underlying pool of assets pays down, thus reducing the cash flows to the IOs over time. Cash flows on IOs are typically reduced more quickly when asset prepayments increase.
INVESTMENT CAPACITY
The amount of capacity we estimate that we have to invest in new assets. It is equal to our (1) cash on hand, plus (2) cash we could raise by increasing short-term borrowings to finance all our residential mortgage loans held for securitization, less (3) cash needed to cover short-term operations, working capital, and a liquidity cushion.
JUMBO LOAN
A jumbo loan is a mortgage loan that generally conforms to the underwriting standards of Fannie Mae and Freddie Mac except that the dollar amount of the loan exceeds the maximum limit set by the two GSEs for loans salable to the two companies.
LEVERAGE RATIOS
When determining Redwood’s financial leverage, traditional leverage ratios may be misleading in some respects if consolidated ABS issued from securitization entities are included as part of Redwood’s obligations when calculating this or similar ratios. Because of the requirement to consolidate the independent securitization entities for GAAP accounting purposes, it appears that Redwood is highly leveraged, with total consolidated liabilities significantly greater than equity. The obligations of these securitization entities are not obligations of Redwood.
LONG-TERM DEBT
Long-term debt is debt that is an obligation of Redwood that is not payable within a year and includes junior subordinated notes and trust preferred securities. We generally treat long-term debt as part of our capital base when it is not payable in the near future.
MARK-TO-MARKET (MTM) ACCOUNTING
Mark-to-market accounting uses estimated fair values of assets, liabilities, and hedges. Many assets on our consolidated balance sheet are carried at their fair value rather than amortized cost. Taxable income is generally not affected by market valuation adjustments.
MARKET VALUATION ADJUSTMENTS (MVAs)
Market valuation adjustments (MVAs) are changes in market values for certain assets and liabilities that are reported through our GAAP income statement. They include all changes in market values for assets and liabilities accounted for at fair value, such as trading securities and derivatives. They also include the credit portion of other-than-temporary impairments on securities available-for-sale, as well as impairments of loans held-for-sale and REO properties.
THE REDWOOD REVIEW 2ND QUARTER 2011
|
37
|
|
|
|
GLOSSARY
|
NON-GAAP METRICS
Not all companies and analysts calculate non-GAAP metrics in the same manner. As a result, certain metrics as calculated by Redwood may not be comparable to similarly titled metrics reported by other companies. Redwood uses non-GAAP metrics such as management’s estimate of economic value and core equity to provide greater transparency for investors. Our non-GAAP metrics are reconciled to GAAP in the Financial Tables in this Review.
NON-PRIME SECURITIES
Non-prime securities are Alt-A, option ARM, and subprime securities. See definitions of Alt-A, option ARM, and subprime securities.
OPTION ARM LOAN
An option ARM loan is a residential mortgage loan that generally offers a borrower monthly payment options such as: 1) a minimum payment that results in negative amortization; 2) an interest-only payment; 3) a payment that would fully amortize the loan over an original 31-year amortization schedule; and, 4) a payment that would fully amortize the loan over a 15-year amortization schedule. To the extent the borrower has chosen an option that is not fully amortizing the loan (or negatively amortizing the loan), after a period — usually five years or once the negatively amortized loan balance reaches a certain level (generally 15% to 25% higher than the original balance) — the loan payments are recast. This recast provision resets the payment at a level that fully amortizes the loan over its remaining life and the new payment may be materially different than under the borrowers’ previous option.
PRIME RESIDENTIAL REAL ESTATE LOANS
Prime loans are residential loans with higher quality credit characteristics, such as borrowers with higher FICO credit scores, lower loan-to-value ratios, lower debt-to-income ratios, greater levels of other assets, and more documentation.
PRIME SECURITIES
Prime securities are residential mortgage-backed securities backed by prime loans, generally with balances greater than conforming loan limits. Prime securities are typically backed by loans that have relatively high weighted average FICO scores (700 or higher), low weighted average LTVs (75% or less), limited concentrations of investor properties, and low percentages of loans with low FICO scores or high loan-to-value ratios.
PROFITABILITY RATIOS
Many financial institution analysts use asset-based profitability ratios such as interest rate spread and interest rate margin when analyzing financial institutions. These are asset-based measures. Since we consolidate the assets and liabilities of securitization entities for GAAP purposes, our total GAAP assets and liabilities may vary over time, and may not be comparable to assets typically used in profitability calculations for other financial institutions. As a result, we believe equity-based profitability ratios may be more appropriate than asset-based measures for analyzing Redwood’s operations and results. We believe, for example, that net interest income as a percentage of equity is a useful measure of profitability. For operating expenses, we believe useful measures are operating efficiency ratio (operating expenses as a percentage of net interest income) and operating expenses as a percentage of equity. We provide various profitability ratios in Table 4 in the Financial Tables in this Review.
|
38
|
THE REDWOOD REVIEW 2ND QUARTER 2011
|
|
|
|
|
GLOSSARY
|
REAL ESTATE INVESTMENT TRUST (REIT)
A real estate investment trust (REIT) is an entity that makes a tax election to be taxed as a REIT, invests in real estate assets, and meets other REIT qualifications, including the distribution as dividends of at least 90% of REIT taxable income. A REIT’s profits are not taxed at the corporate level to the extent that these profits are distributed as dividends to stockholders, providing an operating cost savings. On the other hand, the requirement to pay out as dividends most of the REIT’s taxable profits means it can be harder for a REIT to grow using only internally-generated funds (as opposed to raising new capital).
REAL ESTATE OWNED (REO)
Real estate owned (REO) refers to real property owned by the lender or loan owner that has been acquired through foreclosure.
REIT SUBSIDIARY
A REIT subsidiary is a subsidiary of a REIT that is taxed as a REIT.
REIT TAXABLE INCOME
REIT taxable income is not a measure calculated in accordance with GAAP. REIT taxable income is pre-tax income calculated for tax purposes at Redwood including only its qualifying REIT subsidiaries (i.e., excluding its taxable subsidiaries). REIT taxable income is an important measure as it is the basis of our dividend distribution requirements. We must distribute at least 90% of REIT taxable income as dividends to shareholders over time. As a REIT, we are not subject to corporate income taxes on the REIT taxable income we distribute. We pay income tax on the REIT taxable income we retain, if any (and we are permitted to retain up to 10% of total REIT taxable income). A reconciliation of REIT taxable income to GAAP income appears in Table 2 in the Financial Tables in this Review.
REMIC
A real estate mortgage investment conduit (REMIC) is a special purpose vehicle used to pool real estate mortgages and issue mortgage-backed securities. REMICs are typically exempt from tax at the entity level. REMICs may invest only in qualified mortgages and permitted investments, including single family or multi-family mortgages, commercial mortgages, second mortgages, mortgage participations, and federal agency pass-through securities.
RE-REMIC SECURITY
A re-REMIC is a resecuritization of asset-backed securities. The cash flows from and any credit losses absorbed by the underlying assets can be redirected to the resulting re-REMIC securities in a variety of ways.
RESIDENTIAL MORTGAGE-BACKED SECURITIES (RMBS)
A type of mortgage-backed security that is backed by a pool of mortgages on residential properties.
RETURN ON EQUITY (ROE) and ADJUSTED RETURN ON EQUITY (AROE)
ROE is the amount of profit we generate each year per dollar of equity capital and equals GAAP income divided by GAAP equity. Adjusted ROE is not a measure calculated in accordance with GAAP — it is GAAP income divided by core equity.
THE REDWOOD REVIEW 2ND QUARTER 2011
|
39
|
|
|
|
GLOSSARY
|
SENIOR SECURITIES
Generally, senior securities have the least credit risk in a securitization transaction because they are generally the last securities to absorb credit losses. In addition, the senior securities have the highest claim on the principal and interest payments (after the fees to servicers and trustees are paid.) To further reduce credit risk, most if not all, principal collected from the underlying asset pool is used to pay down the senior securities until certain performance tests are satisfied. If certain performance tests are satisfied, principal payments are shared between the senior securities and the subordinate securities, generally on a pro rata basis. At issuance, senior securities are generally triple A-rated.
SEQUOIA
Sequoia is the brand name for securitizations of residential real estate loans Redwood sponsors. Sequoia entities are independent securitization entities that acquire residential mortgage loans and create and issue asset-backed securities (ABS) backed by these loans. Most of the loans that Sequoia entities acquire are prime-quality loans. Most of the senior ABS created by Sequoia are sold to third-party investors. Redwood usually acquires most of the subordinated ABS and occasionally acquires the interest-only securities (IOs).
SHORT-TERM DEBT
Short-term debt is debt that is an obligation of Redwood and payable within a year. We may obtain this debt from a variety of Wall Street firms, banks, and other institutions. In the past, as another form of short-term debt, we have issued collateralized commercial paper. We may issue these or other forms of short-term debt in the future. We may use short-term debt to finance the accumulation of assets prior to sale to a securitization entity and to finance investments in high-quality loans and securities.
SUBORDINATE SECURITIES (JUNIOR SECURITIES or NON-SENIOR SECURITIES)
Subordinate securities absorb the initial credit losses from a securitization structure, thus protecting the senior securities. Subordinate securities have a lower priority to receive principal and interest payments than the senior securities. Subordinate securities receive little, if any, principal payments until certain performance tests are satisfied. If certain performance tests are satisfied, principal payments are shared between the senior securities and the subordinate securities, generally on a pro rata basis. Subordinate securities generally receive interest payments even if they do not receive principal payments. At issuance, subordinate securities are generally rated double-A or below.
SUBPRIME SECURITIES
Subprime securities are residential mortgage-backed securities backed by loans to borrowers who typically have lower credit scores and/or other credit deficiencies that prevent them from qualifying for prime or Alt-A mortgages and may have experienced credit problems in the past, such as late payments or bankruptcies. To compensate for the greater risks and higher costs to service the loans, subprime borrowers pay higher interest rates, points, and origination fees.
TAXABLE INCOME
Taxable income is not a measure calculated in accordance with GAAP. Taxable income is pre-tax income for Redwood and all its subsidiaries as calculated for tax purposes. Taxable income calculations differ significantly from GAAP income calculations. A reconciliation of taxable income to GAAP income appears in Table 2 in the Financial Tables in this Review.
TAXABLE SUBSIDIARY
A taxable subsidiary is a subsidiary of a REIT that is not taxed as a REIT and thus pays taxes on its income. A taxable subsidiary is not limited to investing in real estate and it can choose to retain all of its after-tax profits.
|
40
|
THE REDWOOD REVIEW 2ND QUARTER 2011
|

|
|
|
|
|
|
|
|
|
|
|
|
|
|
|
|
|
|
|
|
|
|
|
|
|
|
|
|
|
|
Six
|
|
|
Six
|
|
| |
|
2011
|
|
|
2011
|
|
|
2010
|
|
|
2010
|
|
|
2010
|
|
|
2010
|
|
|
2009
|
|
|
2009
|
|
|
2009
|
|
|
Months
|
|
|
Months
|
|
| |
|
Q2 |
|
|
Q1 |
|
|
Q4 |
|
|
Q3 |
|
|
Q2 |
|
|
Q1 |
|
|
Q4 |
|
|
Q3 |
|
|
Q2 |
|
|
2011 |
|
|
2010 |
|
| |
|
|
|
|
|
|
|
|
|
|
|
|
|
|
|
|
|
|
|
|
|
|
|
|
|
|
|
|
|
|
|
|
|
|
|
|
|
|
|
|
|
|
|
|
|
Interest income
|
|
$ |
44,126 |
|
|
$ |
44,025 |
|
|
$ |
44,956 |
|
|
$ |
49,249 |
|
|
$ |
47,730 |
|
|
$ |
50,451 |
|
|
$ |
57,717 |
|
|
$ |
64,425 |
|
|
$ |
74,332 |
|
|
$ |
88,151 |
|
|
$ |
98,181 |
|
|
Discount amortization on securities, net
|
|
|
10,513 |
|
|
|
12,104 |
|
|
|
12,671 |
|
|
|
10,991 |
|
|
|
10,821 |
|
|
|
10,629 |
|
|
|
7,432 |
|
|
|
9,575 |
|
|
|
3,864 |
|
|
|
22,617 |
|
|
|
21,450 |
|
|
Other investment interest income
|
|
|
- |
|
|
|
- |
|
|
|
- |
|
|
|
2 |
|
|
|
4 |
|
|
|
9 |
|
|
|
12 |
|
|
|
25 |
|
|
|
53 |
|
|
|
- |
|
|
|
13 |
|
|
Premium amortization expense on loans
|
|
|
(1,684 |
) |
|
|
(1,796 |
) |
|
|
(1,874 |
) |
|
|
(1,227 |
) |
|
|
(1,985 |
) |
|
|
(2,371 |
) |
|
|
(3,365 |
) |
|
|
(3,642 |
) |
|
|
(3,988 |
) |
|
|
(3,480 |
) |
|
|
(4,356 |
) |
|
Total interest income
|
|
|
52,955 |
|
|
|
54,333 |
|
|
|
55,753 |
|
|
|
59,015 |
|
|
|
56,570 |
|
|
|
58,718 |
|
|
|
61,796 |
|
|
|
70,383 |
|
|
|
74,261 |
|
|
|
107,288 |
|
|
|
115,288 |
|
| |
|
|
|
|
|
|
|
|
|
|
|
|
|
|
|
|
|
|
|
|
|
|
|
|
|
|
|
|
|
|
|
|
|
|
|
|
|
|
|
|
|
|
|
|
|
Interest expense on short-term debt
|
|
|
(7 |
) |
|
|
(182 |
) |
|
|
(43 |
) |
|
|
(2 |
) |
|
|
(36 |
) |
|
|
- |
|
|
|
- |
|
|
|
- |
|
|
|
- |
|
|
|
(189 |
) |
|
|
(36 |
) |
| |
|
|
|
|
|
|
|
|
|
|
|
|
|
|
|
|
|
|
|
|
|
|
|
|
|
|
|
|
|
|
|
|
|
|
|
|
|
|
|
|
|
|
|
|
|
Interest expense on ABS
|
|
|
(19,509 |
) |
|
|
(17,821 |
) |
|
|
(17,800 |
) |
|
|
(19,582 |
) |
|
|
(17,582 |
) |
|
|
(16,145 |
) |
|
|
(17,881 |
) |
|
|
(22,071 |
) |
|
|
(36,115 |
) |
|
|
(37,330 |
) |
|
|
(33,727 |
) |
|
ABS issuance expense amortization
|
|
|
(568 |
) |
|
|
(559 |
) |
|
|
(370 |
) |
|
|
(575 |
) |
|
|
(475 |
) |
|
|
(634 |
) |
|
|
(575 |
) |
|
|
(570 |
) |
|
|
(586 |
) |
|
|
(1,127 |
) |
|
|
(1,109 |
) |
|
ABS interest rate agreement expense
|
|
|
(1,252 |
) |
|
|
(1,140 |
) |
|
|
(1,189 |
) |
|
|
(1,104 |
) |
|
|
(1,127 |
) |
|
|
(495 |
) |
|
|
(1,123 |
) |
|
|
(1,123 |
) |
|
|
(1,111 |
) |
|
|
(2,392 |
) |
|
|
(1,622 |
) |
|
ABS issuance premium amortization income
|
|
|
78 |
|
|
|
96 |
|
|
|
168 |
|
|
|
187 |
|
|
|
196 |
|
|
|
208 |
|
|
|
223 |
|
|
|
234 |
|
|
|
313 |
|
|
|
174 |
|
|
|
404 |
|
|
Total ABS expense consolidated from trusts
|
|
|
(21,251 |
) |
|
|
(19,424 |
) |
|
|
(19,191 |
) |
|
|
(21,074 |
) |
|
|
(18,988 |
) |
|
|
(17,066 |
) |
|
|
(19,356 |
) |
|
|
(23,530 |
) |
|
|
(37,499 |
) |
|
|
(40,675 |
) |
|
|
(36,054 |
) |
| |
|
|
|
|
|
|
|
|
|
|
|
|
|
|
|
|
|
|
|
|
|
|
|
|
|
|
|
|
|
|
|
|
|
|
|
|
|
|
|
|
|
|
|
|
|
Interest expense on long-term debt
|
|
|
(2,375 |
) |
|
|
(2,367 |
) |
|
|
(2,390 |
) |
|
|
(2,619 |
) |
|
|
(2,140 |
) |
|
|
(1,116 |
) |
|
|
(1,168 |
) |
|
|
(1,307 |
) |
|
|
(1,502 |
) |
|
|
(4,742 |
) |
|
|
(3,256 |
) |
| |
|
|
|
|
|
|
|
|
|
|
|
|
|
|
|
|
|
|
|
|
|
|
|
|
|
|
|
|
|
|
|
|
|
|
|
|
|
|
|
|
|
|
|
|
|
Net interest income
|
|
|
29,322 |
|
|
|
32,360 |
|
|
|
34,129 |
|
|
|
35,320 |
|
|
|
35,406 |
|
|
|
40,536 |
|
|
|
41,272 |
|
|
|
45,546 |
|
|
|
35,260 |
|
|
|
61,682 |
|
|
|
75,942 |
|
|
Provision for loan losses
|
|
|
(1,581 |
) |
|
|
(2,808 |
) |
|
|
(7,902 |
) |
|
|
(2,436 |
) |
|
|
(4,321 |
) |
|
|
(9,476 |
) |
|
|
(8,997 |
) |
|
|
(9,998 |
) |
|
|
(14,545 |
) |
|
|
(4,389 |
) |
|
|
(13,797 |
) |
|
Market valuation adjustments, net
|
|
|
(11,147 |
) |
|
|
(5,740 |
) |
|
|
380 |
|
|
|
(1,573 |
) |
|
|
(7,125 |
) |
|
|
(11,237 |
) |
|
|
(4,191 |
) |
|
|
(11,058 |
) |
|
|
(29,135 |
) |
|
|
(16,887 |
) |
|
|
(18,362 |
) |
|
Net interest income (loss) after provision and market valuation adjustments
|
|
|
16,594 |
|
|
|
23,812 |
|
|
|
26,607 |
|
|
|
31,311 |
|
|
|
23,960 |
|
|
|
19,823 |
|
|
|
28,084 |
|
|
|
24,490 |
|
|
|
(8,420 |
) |
|
|
40,406 |
|
|
|
43,783 |
|
| |
|
|
|
|
|
|
|
|
|
|
|
|
|
|
|
|
|
|
|
|
|
|
|
|
|
|
|
|
|
|
|
|
|
|
|
|
|
|
|
|
|
|
|
|
|
Fixed compensation expense
|
|
|
(3,797 |
) |
|
|
(4,144 |
) |
|
|
(3,402 |
) |
|
|
(3,314 |
) |
|
|
(3,661 |
) |
|
|
(4,109 |
) |
|
|
(3,262 |
) |
|
|
(3,726 |
) |
|
|
(3,572 |
) |
|
|
(7,941 |
) |
|
|
(7,770 |
) |
|
Variable compensation expense
|
|
|
(646 |
) |
|
|
(599 |
) |
|
|
(2,152 |
) |
|
|
(2,206 |
) |
|
|
(1,303 |
) |
|
|
(1,880 |
) |
|
|
(566 |
) |
|
|
(5,216 |
) |
|
|
(1,132 |
) |
|
|
(1,245 |
) |
|
|
(3,183 |
) |
|
Equity compensation expense
|
|
|
(2,707 |
) |
|
|
(2,060 |
) |
|
|
(1,710 |
) |
|
|
(1,507 |
) |
|
|
(2,077 |
) |
|
|
(6,059 |
) |
|
|
(1,554 |
) |
|
|
(420 |
) |
|
|
(2,337 |
) |
|
|
(4,767 |
) |
|
|
(8,136 |
) |
|
Severance expense
|
|
|
- |
|
|
|
- |
|
|
|
- |
|
|
|
(48 |
) |
|
|
(229 |
) |
|
|
(81 |
) |
|
|
- |
|
|
|
(398 |
) |
|
|
- |
|
|
|
- |
|
|
|
(310 |
) |
|
Other operating expense
|
|
|
(4,937 |
) |
|
|
(4,710 |
) |
|
|
(5,673 |
) |
|
|
(5,170 |
) |
|
|
(3,957 |
) |
|
|
(5,177 |
) |
|
|
(5,498 |
) |
|
|
(5,046 |
) |
|
|
(3,728 |
) |
|
|
(9,647 |
) |
|
|
(9,134 |
) |
|
Total operating expenses
|
|
|
(12,087 |
) |
|
|
(11,513 |
) |
|
|
(12,937 |
) |
|
|
(12,245 |
) |
|
|
(11,227 |
) |
|
|
(17,306 |
) |
|
|
(10,880 |
) |
|
|
(14,806 |
) |
|
|
(10,769 |
) |
|
|
(23,600 |
) |
|
|
(28,533 |
) |
| |
|
|
|
|
|
|
|
|
|
|
|
|
|
|
|
|
|
|
|
|
|
|
|
|
|
|
|
|
|
|
|
|
|
|
|
|
|
|
|
|
|
|
|
|
|
Realized gains on sales, net
|
|
|
5,433 |
|
|
|
3,956 |
|
|
|
786 |
|
|
|
72 |
|
|
|
16,080 |
|
|
|
44,337 |
|
|
|
19,618 |
|
|
|
17,561 |
|
|
|
25,525 |
|
|
|
9,389 |
|
|
|
60,417 |
|
|
Realized gains (losses) on calls, net
|
|
|
401 |
|
|
|
(91 |
) |
|
|
726 |
|
|
|
1,494 |
|
|
|
- |
|
|
|
- |
|
|
|
- |
|
|
|
- |
|
|
|
- |
|
|
|
310 |
|
|
|
- |
|
|
Realized gains on sales and calls, net
|
|
|
5,834 |
|
|
|
3,865 |
|
|
|
1,512 |
|
|
|
1,566 |
|
|
|
16,080 |
|
|
|
44,337 |
|
|
|
19,618 |
|
|
|
17,561 |
|
|
|
25,525 |
|
|
|
9,699 |
|
|
|
60,417 |
|
| |
|
|
|
|
|
|
|
|
|
|
|
|
|
|
|
|
|
|
|
|
|
|
|
|
|
|
|
|
|
|
|
|
|
|
|
|
|
|
|
|
|
|
|
|
|
Noncontrolling interest
|
|
|
(888 |
) |
|
|
2,015 |
|
|
|
(447 |
) |
|
|
(532 |
) |
|
|
(186 |
) |
|
|
15 |
|
|
|
(143 |
) |
|
|
(363 |
) |
|
|
(127 |
) |
|
|
1,127 |
|
|
|
(171 |
) |
|
(Provision for) benefit from income taxes
|
|
|
(14 |
) |
|
|
(14 |
) |
|
|
(26 |
) |
|
|
(202 |
) |
|
|
(26 |
) |
|
|
(26 |
) |
|
|
3,613 |
|
|
|
247 |
|
|
|
513 |
|
|
|
(28 |
) |
|
|
(52 |
) |
|
Net income
|
|
$ |
9,439 |
|
|
$ |
18,165 |
|
|
$ |
14,709 |
|
|
$ |
19,898 |
|
|
$ |
28,601 |
|
|
$ |
46,843 |
|
|
$ |
40,292 |
|
|
$ |
27,129 |
|
|
$ |
6,722 |
|
|
$ |
27,604 |
|
|
$ |
75,444 |
|
| |
|
|
|
|
|
|
|
|
|
|
|
|
|
|
|
|
|
|
|
|
|
|
|
|
|
|
|
|
|
|
|
|
|
|
|
|
|
|
|
|
|
|
|
|
|
Diluted average shares
|
|
|
79,478 |
|
|
|
79,372 |
|
|
|
78,944 |
|
|
|
78,961 |
|
|
|
78,852 |
|
|
|
78,542 |
|
|
|
78,101 |
|
|
|
78,223 |
|
|
|
66,446 |
|
|
|
|
|
|
|
78,662 |
|
|
Net income per share
|
|
$ |
0.11 |
|
|
$ |
0.22 |
|
|
$ |
0.18 |
|
|
$ |
0.25 |
|
|
$ |
0.35 |
|
|
$ |
0.58 |
|
|
$ |
0.51 |
|
|
$ |
0.34 |
|
|
$ |
0.10 |
|
|
$ |
0.34 |
|
|
$ |
0.94 |
|
| THE REDWOOD REVIEW 2ND QUARTER 2011 |
Table 1: GAAP Earnings
|
|
 |
($ in thousands, except per share data)
|
|
|
|
Estimated 2011 Q2 (2)
|
|
|
Estimated Twelve Months 2010
|
|
|
Actual Twelve Months 2009
|
|
| |
Taxable
|
|
|
GAAP
|
|
|
|
|
|
Taxable
|
|
|
GAAP
|
|
|
|
|
|
Taxable
|
|
|
GAAP
|
|
|
|
|
| |
(Loss) Income
|
|
|
Income
|
|
|
Differences
|
|
|
(Loss) Income
|
|
|
Income
|
|
|
Differences
|
|
|
(Loss) Income
|
|
|
Income
|
|
|
Differences
|
|
| |
|
|
|
|
|
|
|
|
|
|
|
|
|
|
|
|
|
|
|
|
|
|
|
|
|
|
|
|
Taxable and GAAP Income (Loss) Differences
|
|
|
|
|
|
|
|
|
|
|
|
|
|
|
|
|
|
|
|
|
|
|
|
|
|
|
|
|
Interest income
|
|
$ |
29,905 |
|
|
$ |
52,955 |
|
|
$ |
(23,050 |
) |
|
$ |
136,878 |
|
|
$ |
230,054 |
|
|
$ |
(93,176 |
) |
|
$ |
192,922 |
|
|
$ |
287,877 |
|
|
$ |
(94,955 |
) |
|
Interest expense
|
|
|
(2,817 |
) |
|
|
(23,633 |
) |
|
|
20,816 |
|
|
|
(8,545 |
) |
|
|
(84,664 |
) |
|
|
76,119 |
|
|
|
(4,955 |
) |
|
|
(132,003 |
) |
|
|
127,048 |
|
|
Net interest income
|
|
|
27,088 |
|
|
|
29,322 |
|
|
|
(2,234 |
) |
|
|
128,333 |
|
|
|
145,390 |
|
|
|
(17,057 |
) |
|
|
187,967 |
|
|
|
155,874 |
|
|
|
32,093 |
|
|
Provision for loan losses
|
|
|
- |
|
|
|
(1,581 |
) |
|
|
1,581 |
|
|
|
- |
|
|
|
(24,135 |
) |
|
|
24,135 |
|
|
|
- |
|
|
|
(49,573 |
) |
|
|
49,573 |
|
|
Realized credit losses
|
|
|
(16,258 |
) |
|
|
- |
|
|
|
(16,258 |
) |
|
|
(99,589 |
) |
|
|
- |
|
|
|
(99,589 |
) |
|
|
(223,903 |
) |
|
|
- |
|
|
|
(223,903 |
) |
|
Market valuation adjustments, net
|
|
|
- |
|
|
|
(11,147 |
) |
|
|
11,147 |
|
|
|
- |
|
|
|
(19,554 |
) |
|
|
19,554 |
|
|
|
- |
|
|
|
(87,628 |
) |
|
|
87,628 |
|
|
Operating expenses
|
|
|
(11,305 |
) |
|
|
(12,087 |
) |
|
|
782 |
|
|
|
(44,687 |
) |
|
|
(53,715 |
) |
|
|
9,028 |
|
|
|
(54,234 |
) |
|
|
(46,995 |
) |
|
|
(7,239 |
) |
|
Realized gains on sales and calls, net
|
|
|
- |
|
|
|
5,834 |
|
|
|
(5,834 |
) |
|
|
230 |
|
|
|
63,496 |
|
|
|
(63,266 |
) |
|
|
6,625 |
|
|
|
63,166 |
|
|
|
(56,541 |
) |
|
(Provision for) benefit from income taxes
|
|
|
(14 |
) |
|
|
(14 |
) |
|
|
- |
|
|
|
(8 |
) |
|
|
(280 |
) |
|
|
272 |
|
|
|
(13 |
) |
|
|
4,268 |
|
|
|
(4,281 |
) |
|
Less: Net income (loss) attributable to noncontrolling interest
|
|
|
- |
|
|
|
888 |
|
|
|
(888 |
) |
|
|
- |
|
|
|
1,150 |
|
|
|
(1,150 |
) |
|
|
- |
|
|
|
(83 |
) |
|
|
83 |
|
| |
|
|
|
|
|
|
|
|
|
|
|
|
|
|
|
|
|
|
|
|
|
|
|
|
|
|
|
|
|
|
|
|
|
|
|
|
|
(Loss) income
|
|
$ |
(489 |
) |
|
$ |
9,439 |
|
|
$ |
(9,928 |
) |
|
$ |
(15,721 |
) |
|
$ |
110,052 |
|
|
$ |
(125,773 |
) |
|
$ |
(83,558 |
) |
|
$ |
39,195 |
|
|
$ |
(122,753 |
) |
| |
|
|
|
|
|
|
|
|
|
|
|
|
|
|
|
|
|
|
|
|
|
|
|
|
|
|
|
|
|
|
|
|
|
|
|
|
| |
|
|
|
|
|
|
|
|
|
|
|
|
|
|
|
|
|
|
|
|
|
|
|
|
|
|
|
|
|
|
|
|
|
|
|
|
|
REIT taxable income (loss)
|
|
$ |
1,352 |
|
|
|
|
|
|
|
|
|
|
$ |
3,998 |
|
|
|
|
|
|
|
|
|
|
$ |
(69,819 |
) |
|
|
|
|
|
|
|
|
|
Taxable (loss) income at taxable subsidiaries
|
|
|
(1,841 |
) |
|
|
|
|
|
|
|
|
|
|
(19,719 |
) |
|
|
|
|
|
|
|
|
|
|
(13,739 |
) |
|
|
|
|
|
|
|
|
|
Taxable (loss) income
|
|
$ |
(489 |
) |
|
|
|
|
|
|
|
|
|
$ |
(15,721 |
) |
|
|
|
|
|
|
|
|
|
$ |
(83,558 |
) |
|
|
|
|
|
|
|
|
| |
|
|
|
|
|
|
|
|
|
|
|
|
|
|
|
|
|
|
|
|
|
|
|
|
|
|
|
|
|
|
|
|
|
|
|
|
| |
|
|
|
|
|
|
|
|
|
|
|
|
|
|
|
|
|
|
|
|
|
|
|
|
|
|
|
|
|
|
|
|
|
|
|
|
|
Shares used for taxable EPS calculation
|
|
|
78,555 |
|
|
|
|
|
|
|
|
|
|
|
78,041 |
|
|
|
|
|
|
|
|
|
|
|
74,605 |
|
|
|
|
|
|
|
|
|
|
REIT taxable income (loss) per share (3)
|
|
$ |
0.02 |
|
|
|
|
|
|
|
|
|
|
$ |
0.05 |
|
|
|
|
|
|
|
|
|
|
$ |
(0.92 |
) |
|
|
|
|
|
|
|
|
|
Taxable (loss) income at taxable subsidiaries per share
|
|
$ |
(0.02 |
) |
|
|
|
|
|
|
|
|
|
$ |
(0.25 |
) |
|
|
|
|
|
|
|
|
|
$ |
(0.20 |
) |
|
|
|
|
|
|
|
|
|
Taxable (loss) income per share (3)
|
|
$ |
- |
|
|
|
|
|
|
|
|
|
|
$ |
(0.20 |
) |
|
|
|
|
|
|
|
|
|
$ |
(1.12 |
) |
|
|
|
|
|
|
|
|
| |
|
|
|
|
|
|
|
|
|
|
|
|
|
|
|
|
|
|
|
|
|
|
|
|
|
|
|
|
|
|
|
|
|
|
|
|
|
Dividends
|
|
|
|
|
|
|
|
|
|
|
|
|
|
|
|
|
|
|
|
|
|
|
|
|
|
|
|
|
|
|
|
|
|
|
|
|
|
Dividends declared
|
|
$ |
19,640 |
|
|
|
|
|
|
|
|
|
|
$ |
77,942 |
|
|
|
|
|
|
|
|
|
|
$ |
73,284 |
|
|
|
|
|
|
|
|
|
|
Regular dividend per share (4)
|
|
$ |
0.25 |
|
|
|
|
|
|
|
|
|
|
$ |
1.00 |
|
|
|
|
|
|
|
|
|
|
$ |
1.00 |
|
|
|
|
|
|
|
|
|
| |
|
|
|
|
|
|
|
|
|
|
|
|
|
|
|
|
|
|
|
|
|
|
|
|
|
|
|
|
|
|
|
|
|
|
|
|
(1) Taxable (loss) income for 2011 and 2010 are estimates until we file tax returns for these years.
(2) Reconciliation of GAAP income to taxable (loss) income for prior quarters is provided in the respective Redwood Reviews for those quarters.
(3) REIT taxable income (loss) per share and taxable income (loss) per share are based on the number of shares outstanding at the end of each quarter. The annual REIT taxable income (loss) per share and taxable income (loss) per share are the sum of the four quarterly per share estimates.
(4) The characteristics of our 2011 dividend will be determined at the end of 2011. To the extent the REIT has taxable income or net capital gains in 2011, these amounts will be characterized as ordinary income. Dividends in 2010 were characterized as 62% ordinary income, or $48 million, and 38% return of capital, or $30 million. The 2009 dividends were characterized as a return of capital. The portion of Redwood's dividends characterized as a return of capital is not taxable to a shareholder and reduces a shareholder's basis for shares held at each quarterly distribution date.
| THE REDWOOD REVIEW 2ND QUARTER 2011 |
Table 2: Taxable and GAAP Income (Loss)
Differences and Dividends
|
43 |
|
|
|
|
|
|
|
|
|
|
|
|
|
|
|
|
|
|
|
|
|
|
|
|
|
|
|
|
|
| |
|
2011
|
|
|
2011
|
|
|
2010
|
|
|
2010
|
|
|
2010
|
|
|
2010
|
|
|
2009
|
|
|
2009
|
|
|
2009
|
|
| |
|
Q2 |
|
|
Q1 |
|
|
Q4 |
|
|
Q3 |
|
|
Q2 |
|
|
Q1 |
|
|
Q4 |
|
|
Q3 |
|
|
Q2 |
|
|
Short-term debt
|
|
$ |
41 |
|
|
$ |
- |
|
|
$ |
44.00 |
|
|
$ |
- |
|
|
$ |
- |
|
|
$ |
- |
|
|
$ |
- |
|
|
$ |
- |
|
|
$ |
- |
|
|
Long-term debt
|
|
|
140 |
|
|
|
140 |
|
|
|
140 |
|
|
|
140 |
|
|
|
140 |
|
|
|
140 |
|
|
|
140 |
|
|
|
140 |
|
|
|
150 |
|
|
Redwood debt (1)
|
|
$ |
181 |
|
|
$ |
140 |
|
|
$ |
184 |
|
|
$ |
140 |
|
|
$ |
140 |
|
|
$ |
140 |
|
|
$ |
140 |
|
|
$ |
140 |
|
|
$ |
150 |
|
| |
|
|
|
|
|
|
|
|
|
|
|
|
|
|
|
|
|
|
|
|
|
|
|
|
|
|
|
|
|
|
|
|
|
|
|
|
|
GAAP stockholders' equity
|
|
$ |
1,024 |
|
|
$ |
1,075 |
|
|
$ |
1,065 |
|
|
$ |
1,016 |
|
|
$ |
991 |
|
|
$ |
998 |
|
|
$ |
972 |
|
|
$ |
907 |
|
|
$ |
802 |
|
| |
|
|
|
|
|
|
|
|
|
|
|
|
|
|
|
|
|
|
|
|
|
|
|
|
|
|
|
|
|
|
|
|
|
|
|
|
|
Redwood debt to equity
|
|
|
0.2 |
x |
|
|
0.1 |
x |
|
|
0.2 |
x |
|
|
0.1 |
x |
|
|
0.1 |
x |
|
|
0.1 |
x |
|
|
0.1 |
x |
|
|
0.2 |
x |
|
|
0.2 |
x |
|
Redwood debt to (equity + debt)
|
|
|
15 |
% |
|
|
12 |
% |
|
|
15 |
% |
|
|
12 |
% |
|
|
12 |
% |
|
|
12 |
% |
|
|
13 |
% |
|
|
13 |
% |
|
|
16 |
% |
| |
|
|
|
|
|
|
|
|
|
|
|
|
|
|
|
|
|
|
|
|
|
|
|
|
|
|
|
|
|
|
|
|
|
|
|
|
|
Redwood debt
|
|
$ |
181 |
|
|
$ |
140 |
|
|
$ |
184 |
|
|
$ |
140 |
|
|
$ |
140 |
|
|
$ |
140 |
|
|
$ |
140 |
|
|
$ |
140 |
|
|
$ |
150 |
|
|
ABS obligations of consolidated securitization entities
|
|
|
3,839 |
|
|
|
3,957 |
|
|
|
3,943 |
|
|
|
3,832 |
|
|
|
3,961 |
|
|
|
3,837 |
|
|
|
3,943 |
|
|
|
4,016 |
|
|
|
4,185 |
|
|
GAAP obligation
|
|
$ |
4,020 |
|
|
$ |
4,097 |
|
|
$ |
4,127 |
|
|
$ |
3,972 |
|
|
$ |
4,101 |
|
|
$ |
3,977 |
|
|
$ |
4,083 |
|
|
$ |
4,156 |
|
|
$ |
4,335 |
|
| |
|
|
|
|
|
|
|
|
|
|
|
|
|
|
|
|
|
|
|
|
|
|
|
|
|
|
|
|
|
|
|
|
|
|
|
|
|
GAAP obligation to equity
|
|
|
3.9 |
x |
|
|
3.8 |
x |
|
|
3.7 |
x |
|
|
3.9 |
x |
|
|
4.0 |
x |
|
|
4.0 |
x |
|
|
4.2 |
x |
|
|
4.6 |
x |
|
|
5.4 |
x |
|
GAAP obligation to (equity + GAAP debt)
|
|
|
80 |
% |
|
|
79 |
% |
|
|
79 |
% |
|
|
80 |
% |
|
|
81 |
% |
|
|
80 |
% |
|
|
81 |
% |
|
|
82 |
% |
|
|
84 |
% |
| |
|
|
|
|
|
|
|
|
|
|
|
|
|
|
|
|
|
|
|
|
|
|
|
|
|
|
|
|
|
|
|
|
|
|
|
|
|
GAAP stockholders' equity
|
|
$ |
1,024 |
|
|
$ |
1,075 |
|
|
$ |
1,065 |
|
|
$ |
1,016 |
|
|
$ |
991 |
|
|
$ |
998 |
|
|
$ |
972 |
|
|
$ |
907 |
|
|
$ |
802 |
|
|
Balance sheet mark-to-market adjustments
|
|
|
81 |
|
|
|
122 |
|
|
|
112 |
|
|
|
61 |
|
|
|
38 |
|
|
|
58 |
|
|
|
65 |
|
|
|
23 |
|
|
|
(77 |
) |
|
Core equity (non-GAAP)
|
|
$ |
943 |
|
|
$ |
953 |
|
|
$ |
953 |
|
|
$ |
955 |
|
|
$ |
953 |
|
|
$ |
940 |
|
|
$ |
907 |
|
|
$ |
884 |
|
|
$ |
879 |
|
| |
|
|
|
|
|
|
|
|
|
|
|
|
|
|
|
|
|
|
|
|
|
|
|
|
|
|
|
|
|
|
|
|
|
|
|
|
|
Shares outstanding at period end
|
|
|
78,555 |
|
|
|
78,139 |
|
|
|
78,125 |
|
|
|
77,984 |
|
|
|
77,908 |
|
|
|
77,751 |
|
|
|
77,737 |
|
|
|
77,669 |
|
|
|
77,503 |
|
| |
|
|
|
|
|
|
|
|
|
|
|
|
|
|
|
|
|
|
|
|
|
|
|
|
|
|
|
|
|
|
|
|
|
|
|
|
|
GAAP equity per share
|
|
$ |
13.04 |
|
|
$ |
13.76 |
|
|
$ |
13.63 |
|
|
$ |
13.02 |
|
|
$ |
12.71 |
|
|
$ |
12.84 |
|
|
$ |
12.50 |
|
|
$ |
11.68 |
|
|
$ |
10.35 |
|
|
Adjustments: GAAP equity to estimated economic value (2)
|
|
|
|
|
|
|
|
|
|
|
|
|
|
|
|
|
|
|
|
|
|
|
|
|
|
|
|
|
|
|
|
|
|
|
|
|
|
Investments in Sequoia
|
|
$ |
(0.01 |
) |
|
$ |
(0.05 |
) |
|
$ |
(0.12 |
) |
|
$ |
(0.24 |
) |
|
$ |
(0.31 |
) |
|
$ |
(0.37 |
) |
|
$ |
(0.37 |
) |
|
$ |
(0.37 |
) |
|
$ |
(0.35 |
) |
|
Investments in Acacia
|
|
|
- |
|
|
|
(0.01 |
) |
|
|
(0.04 |
) |
|
|
(0.04 |
) |
|
|
(0.03 |
) |
|
|
- |
|
|
|
- |
|
|
|
- |
|
|
|
0.01 |
|
|
Long-term debt
|
|
|
0.78 |
|
|
|
0.75 |
|
|
|
0.84 |
|
|
|
0.99 |
|
|
|
1.00 |
|
|
|
0.85 |
|
|
|
0.90 |
|
|
|
0.97 |
|
|
|
1.29 |
|
|
Estimate of economic value per share (non-GAAP)
|
|
$ |
13.81 |
|
|
$ |
14.45 |
|
|
$ |
14.31 |
|
|
$ |
13.73 |
|
|
$ |
13.37 |
|
|
$ |
13.32 |
|
|
$ |
13.03 |
|
|
$ |
12.28 |
|
|
$ |
11.30 |
|
(1) Excludes obligations of consolidated securitization entities.
(2) Differences between GAAP and economic value per share reflect our estimate of the economic value of investments in Sequoia and Acacia and our long-term debt. See pages 14 and 15 for an explanation of these adjustments. In reviewing the components of book value and economic value, there are a number of important factors and limitations to consider. Book value and economic value are calculated as of particular points in time based on our existing assets and liabilities and do not incorporate other factors that may have a significant impact on that value, most notably the impact of future business activities. As a result, these values do not necessarily represent an estimate of our net realizable value, liquidation value, or our market value as a whole. Amounts we ultimately realize from the disposition of assets or settlement of liabilities may vary significantly from these values. Because temporary changes in market conditions can substantially affect value, we do not believe that short-term fluctuations in the value of our assets and liabilities are necessarily representative of the effectiveness of our investment strategy or the long-term underlying value of our business. When quoted market prices or observable market data are not available to estimate fair value, we rely on unobservable inputs, which are generally more subjective and involve a high degree of management judgment and assumptions. These assumptions may have a significant effect on our estimates of value, and the use of different assumptions as well as changes in market conditions could have a material effect on our results of operations or financial condition.
| THE REDWOOD REVIEW 2ND QUARTER 2011 |
Table 3: Book Value and Financial Ratios
|
|
|
|
|
|
|
|
|
|
|
|
|
|
|
|
|
|
|
|
|
|
|
|
|
|
|
|
|
|
|
|
Six
|
|
|
Six
|
|
| |
|
2011
|
|
|
2011
|
|
|
2010
|
|
|
2010
|
|
|
2010
|
|
|
2010
|
|
|
2009
|
|
|
2009
|
|
|
2009
|
|
|
Months
|
|
|
Months
|
|
| |
|
Q2 |
|
|
Q1 |
|
|
Q4 |
|
|
Q3 |
|
|
Q2 |
|
|
Q1 |
|
|
Q4 |
|
|
Q3 |
|
|
Q2 |
|
|
2011 |
|
|
2010 |
|
| |
|
|
|
|
|
|
|
|
|
|
|
|
|
|
|
|
|
|
|
|
|
|
|
|
|
|
|
|
|
|
|
|
|
|
|
|
|
|
|
|
|
|
|
|
|
Interest income
|
|
$ |
52,955 |
|
|
$ |
54,333 |
|
|
$ |
55,753 |
|
|
$ |
59,015 |
|
|
$ |
56,570 |
|
|
$ |
58,718 |
|
|
$ |
61,796 |
|
|
$ |
70,383 |
|
|
$ |
74,261 |
|
|
$ |
107,288 |
|
|
$ |
115,288 |
|
|
Average consolidated earning assets
|
|
$ |
5,080,343 |
|
|
$ |
5,107,979 |
|
|
$ |
4,980,935 |
|
|
$ |
5,030,680 |
|
|
$ |
5,139,945 |
|
|
$ |
5,070,987 |
|
|
$ |
5,175,337 |
|
|
$ |
5,128,893 |
|
|
$ |
5,325,322 |
|
|
$ |
5,094,229 |
|
|
$ |
5,105,656 |
|
|
Asset yield
|
|
|
4.17 |
% |
|
|
4.25 |
% |
|
|
4.48 |
% |
|
|
4.69 |
% |
|
|
4.40 |
% |
|
|
4.63 |
% |
|
|
4.78 |
% |
|
|
5.49 |
% |
|
|
5.58 |
% |
|
|
4.21 |
% |
|
|
4.52 |
% |
| |
|
|
|
|
|
|
|
|
|
|
|
|
|
|
|
|
|
|
|
|
|
|
|
|
|
|
|
|
|
|
|
|
|
|
|
|
|
|
|
|
|
|
|
|
|
Interest expense
|
|
$ |
(23,633 |
) |
|
$ |
(21,973 |
) |
|
$ |
(21,624 |
) |
|
$ |
(23,695 |
) |
|
$ |
(21,164 |
) |
|
$ |
(18,182 |
) |
|
$ |
(20,524 |
) |
|
$ |
(24,837 |
) |
|
$ |
(39,001 |
) |
|
$ |
(45,606 |
) |
|
$ |
(39,346 |
) |
|
Average consolidated interest-bearing liabilities
|
|
$ |
4,025,216 |
|
|
$ |
3,977,010 |
|
|
$ |
3,937,895 |
|
|
$ |
4,016,680 |
|
|
$ |
4,077,992 |
|
|
$ |
4,015,655 |
|
|
$ |
4,096,928 |
|
|
$ |
4,193,650 |
|
|
$ |
4,651,125 |
|
|
$ |
4,001,247 |
|
|
$ |
4,046,996 |
|
|
Cost of funds
|
|
|
2.35 |
% |
|
|
2.21 |
% |
|
|
2.20 |
% |
|
|
2.36 |
% |
|
|
2.08 |
% |
|
|
1.81 |
% |
|
|
2.00 |
% |
|
|
2.37 |
% |
|
|
3.35 |
% |
|
|
2.28 |
% |
|
|
1.94 |
% |
| |
|
|
|
|
|
|
|
|
|
|
|
|
|
|
|
|
|
|
|
|
|
|
|
|
|
|
|
|
|
|
|
|
|
|
|
|
|
|
|
|
|
|
|
|
|
Asset yield
|
|
|
4.17 |
% |
|
|
4.25 |
% |
|
|
4.48 |
% |
|
|
4.69 |
% |
|
|
4.40 |
% |
|
|
4.63 |
% |
|
|
4.78 |
% |
|
|
5.49 |
% |
|
|
5.58 |
% |
|
|
4.21 |
% |
|
|
4.52 |
% |
|
Cost of funds
|
|
|
(2.35 |
%) |
|
|
(2.21 |
%) |
|
|
(2.20 |
%) |
|
|
(2.36 |
%) |
|
|
(2.08 |
%) |
|
|
(1.81 |
%) |
|
|
(2.00 |
%) |
|
|
(2.37 |
%) |
|
|
(3.35 |
%) |
|
|
(2.28 |
%) |
|
|
(1.94 |
%) |
|
Interest rate spread
|
|
|
1.82 |
% |
|
|
2.04 |
% |
|
|
2.28 |
% |
|
|
2.33 |
% |
|
|
2.33 |
% |
|
|
2.82 |
% |
|
|
2.77 |
% |
|
|
3.12 |
% |
|
|
2.22 |
% |
|
|
1.93 |
% |
|
|
2.57 |
% |
| |
|
|
|
|
|
|
|
|
|
|
|
|
|
|
|
|
|
|
|
|
|
|
|
|
|
|
|
|
|
|
|
|
|
|
|
|
|
|
|
|
|
|
|
|
|
Net interest income
|
|
$ |
29,322 |
|
|
$ |
32,360 |
|
|
$ |
34,129 |
|
|
$ |
35,320 |
|
|
$ |
35,406 |
|
|
$ |
40,536 |
|
|
$ |
41,272 |
|
|
$ |
45,546 |
|
|
$ |
35,260 |
|
|
$ |
61,682 |
|
|
$ |
75,942 |
|
|
Average consolidated earning assets
|
|
$ |
5,080,343 |
|
|
$ |
5,107,979 |
|
|
$ |
4,980,935 |
|
|
$ |
5,030,680 |
|
|
$ |
5,139,945 |
|
|
$ |
5,070,987 |
|
|
$ |
5,175,337 |
|
|
$ |
5,128,893 |
|
|
$ |
5,325,322 |
|
|
$ |
5,094,229 |
|
|
$ |
5,105,656 |
|
|
Net interest margin
|
|
|
2.31 |
% |
|
|
2.53 |
% |
|
|
2.74 |
% |
|
|
2.81 |
% |
|
|
2.76 |
% |
|
|
3.20 |
% |
|
|
3.19 |
% |
|
|
3.55 |
% |
|
|
2.65 |
% |
|
|
2.42 |
% |
|
|
2.97 |
% |
| |
|
|
|
|
|
|
|
|
|
|
|
|
|
|
|
|
|
|
|
|
|
|
|
|
|
|
|
|
|
|
|
|
|
|
|
|
|
|
|
|
|
|
|
|
|
Operating expenses
|
|
$ |
(12,087 |
) |
|
$ |
(11,513 |
) |
|
$ |
(12,937 |
) |
|
$ |
(12,245 |
) |
|
$ |
(11,227 |
) |
|
$ |
(17,306 |
) |
|
$ |
(10,880 |
) |
|
$ |
(14,806 |
) |
|
$ |
(10,769 |
) |
|
$ |
(23,600 |
) |
|
$ |
(28,533 |
) |
| |
|
|
|
|
|
|
|
|
|
|
|
|
|
|
|
|
|
|
|
|
|
|
|
|
|
|
|
|
|
|
|
|
|
|
|
|
|
|
|
|
|
|
|
|
|
Average total assets
|
|
$ |
5,263,529 |
|
|
$ |
5,310,376 |
|
|
$ |
5,141,550 |
|
|
$ |
5,161,498 |
|
|
$ |
5,263,730 |
|
|
$ |
5,219,636 |
|
|
$ |
5,293,887 |
|
|
$ |
5,138,793 |
|
|
$ |
5,315,643 |
|
|
$ |
5,286,967 |
|
|
$ |
5,241,805 |
|
|
Average total equity
|
|
$ |
1,035,063 |
|
|
$ |
1,092,580 |
|
|
$ |
1,038,045 |
|
|
$ |
1,003,372 |
|
|
$ |
1,005,212 |
|
|
$ |
985,350 |
|
|
$ |
945,862 |
|
|
$ |
833,227 |
|
|
$ |
575,661 |
|
|
$ |
1,063,663 |
|
|
$ |
995,336 |
|
| |
|
|
|
|
|
|
|
|
|
|
|
|
|
|
|
|
|
|
|
|
|
|
|
|
|
|
|
|
|
|
|
|
|
|
|
|
|
|
|
|
|
|
|
|
|
Operating expenses / net interest income
|
|
|
41.22 |
% |
|
|
35.58 |
% |
|
|
37.91 |
% |
|
|
34.67 |
% |
|
|
31.71 |
% |
|
|
42.69 |
% |
|
|
26.36 |
% |
|
|
32.51 |
% |
|
|
30.54 |
% |
|
|
38.26 |
% |
|
|
37.57 |
% |
|
Operating expenses / average total assets
|
|
|
0.92 |
% |
|
|
0.87 |
% |
|
|
1.01 |
% |
|
|
0.95 |
% |
|
|
0.85 |
% |
|
|
1.33 |
% |
|
|
0.82 |
% |
|
|
1.15 |
% |
|
|
0.81 |
% |
|
|
0.89 |
% |
|
|
1.09 |
% |
|
Operating expenses / average total equity
|
|
|
4.67 |
% |
|
|
4.21 |
% |
|
|
4.99 |
% |
|
|
4.88 |
% |
|
|
4.47 |
% |
|
|
7.03 |
% |
|
|
4.60 |
% |
|
|
7.11 |
% |
|
|
7.48 |
% |
|
|
4.44 |
% |
|
|
5.73 |
% |
| |
|
|
|
|
|
|
|
|
|
|
|
|
|
|
|
|
|
|
|
|
|
|
|
|
|
|
|
|
|
|
|
|
|
|
|
|
|
|
|
|
|
|
|
|
|
GAAP net income
|
|
$ |
9,439 |
|
|
$ |
18,165 |
|
|
$ |
14,709 |
|
|
$ |
19,898 |
|
|
$ |
28,601 |
|
|
$ |
46,843 |
|
|
$ |
40,292 |
|
|
$ |
27,129 |
|
|
$ |
6,722 |
|
|
$ |
27,604 |
|
|
$ |
75,444 |
|
|
GAAP net income / average total assets
|
|
|
0.72 |
% |
|
|
1.37 |
% |
|
|
1.14 |
% |
|
|
1.54 |
% |
|
|
2.17 |
% |
|
|
3.59 |
% |
|
|
3.04 |
% |
|
|
2.11 |
% |
|
|
0.51 |
% |
|
|
1.04 |
% |
|
|
2.88 |
% |
|
GAAP net income / average equity (GAAP ROE)
|
|
|
3.65 |
% |
|
|
6.65 |
% |
|
|
5.67 |
% |
|
|
7.93 |
% |
|
|
11.38 |
% |
|
|
19.02 |
% |
|
|
17.04 |
% |
|
|
13.02 |
% |
|
|
4.67 |
% |
|
|
5.19 |
% |
|
|
15.16 |
% |
|
GAAP net income / average core equity (adjusted ROE) (2)
|
|
|
4.04 |
% |
|
|
7.53 |
% |
|
|
6.14 |
% |
|
|
8.25 |
% |
|
|
12.00 |
% |
|
|
20.09 |
% |
|
|
17.99 |
% |
|
|
12.22 |
% |
|
|
4.10 |
% |
|
|
5.82 |
% |
|
|
16.00 |
% |
| |
|
|
|
|
|
|
|
|
|
|
|
|
|
|
|
|
|
|
|
|
|
|
|
|
|
|
|
|
|
|
|
|
|
|
|
|
|
|
|
|
|
|
|
|
|
Average core equity (2)
|
|
$ |
934,205 |
|
|
$ |
964,554 |
|
|
$ |
958,194 |
|
|
$ |
964,249 |
|
|
$ |
953,720 |
|
|
$ |
932,721 |
|
|
$ |
896,034 |
|
|
$ |
888,107 |
|
|
$ |
655,695 |
|
|
$ |
949,296 |
|
|
$ |
943,278 |
|
| |
|
|
|
|
|
|
|
|
|
|
|
|
|
|
|
|
|
|
|
|
|
|
|
|
|
|
|
|
|
|
|
|
|
|
|
|
|
|
|
|
|
|
|
|
(1) All percentages in this table are shown on an annualized basis.
(2) Core equity is a non-GAAP metric and is equal to GAAP equity excluding accumulated other comprehensive income (loss).
| THE REDWOOD REVIEW 2ND QUARTER 2011 |
Table 4: Yields and Profitability Ratios
|
45 |
|
|
|
|
|
|
|
|
|
|
|
|
|
|
|
|
|
|
|
|
|
|
|
|
|
|
|
|
|
|
Six
|
|
|
Six
|
|
| |
|
2011
|
|
|
2011
|
|
|
2010
|
|
|
2010
|
|
|
2010
|
|
|
2010
|
|
|
2009
|
|
|
2009
|
|
|
2009
|
|
|
Months
|
|
|
Months
|
|
| |
|
Q2
|
|
|
Q1
|
|
|
Q4
|
|
|
Q3
|
|
|
Q2
|
|
|
cQ1
|
|
|
Q4
|
|
|
Q3
|
|
|
Q2
|
|
|
2011
|
|
|
2010
|
|
| |
|
|
|
|
|
|
|
|
|
|
|
|
|
|
|
|
|
|
|
|
|
|
|
|
|
|
|
|
|
|
|
|
|
|
Real estate assets at Redwood
|
|
|
|
|
|
|
|
|
|
|
|
|
|
|
|
|
|
|
|
|
|
|
|
|
|
|
|
|
|
|
|
|
|
| |
|
|
|
|
|
|
|
|
|
|
|
|
|
|
|
|
|
|
|
|
|
|
|
|
|
|
|
|
|
|
|
|
|
|
Senior residential securities
|
|
|
|
|
|
|
|
|
|
|
|
|
|
|
|
|
|
|
|
|
|
|
|
|
|
|
|
|
|
|
|
|
|
|
Prime
|
|
$ |
246,957 |
|
|
$ |
255,884 |
|
|
$ |
262,048 |
|
|
$ |
270,286 |
|
|
$ |
278,472 |
|
|
$ |
283,477 |
|
|
$ |
280,101 |
|
|
$ |
264,773 |
|
|
$ |
164,386 |
|
|
$ |
251,396 |
|
|
$ |
280,961 |
|
|
Non-prime
|
|
|
283,784 |
|
|
|
307,253 |
|
|
|
321,655 |
|
|
|
316,089 |
|
|
|
302,461 |
|
|
|
310,948 |
|
|
|
263,022 |
|
|
|
270,353 |
|
|
|
168,383 |
|
|
|
295,454 |
|
|
|
306,681 |
|
|
Total senior residential securities
|
|
|
530,741 |
|
|
|
563,137 |
|
|
|
583,703 |
|
|
|
586,375 |
|
|
|
580,933 |
|
|
|
594,426 |
|
|
|
543,124 |
|
|
|
535,126 |
|
|
|
332,769 |
|
|
|
546,850 |
|
|
|
587,642 |
|
| |
|
|
|
|
|
|
|
|
|
|
|
|
|
|
|
|
|
|
|
|
|
|
|
|
|
|
|
|
|
|
|
|
|
|
|
|
|
|
|
|
|
|
|
|
|
Residential Re-REMIC securities
|
|
|
30,447 |
|
|
|
32,648 |
|
|
|
32,917 |
|
|
|
33,250 |
|
|
|
34,385 |
|
|
|
45,852 |
|
|
|
73,938 |
|
|
|
69,980 |
|
|
|
26,419 |
|
|
|
31,541 |
|
|
|
40,087 |
|
| |
|
|
|
|
|
|
|
|
|
|
|
|
|
|
|
|
|
|
|
|
|
|
|
|
|
|
|
|
|
|
|
|
|
|
|
|
|
|
|
|
|
|
|
|
|
Subordinate residential securities
|
|
|
|
|
|
|
|
|
|
|
|
|
|
|
|
|
|
|
|
|
|
|
|
|
|
|
|
|
|
|
|
|
|
|
|
|
|
|
|
|
|
|
|
|
|
Prime
|
|
|
63,141 |
|
|
|
53,046 |
|
|
|
45,914 |
|
|
|
35,794 |
|
|
|
38,079 |
|
|
|
41,701 |
|
|
|
47,083 |
|
|
|
58,637 |
|
|
|
43,020 |
|
|
|
58,121 |
|
|
|
39,880 |
|
|
Non-prime
|
|
|
11,183 |
|
|
|
12,140 |
|
|
|
11,890 |
|
|
|
9,181 |
|
|
|
7,708 |
|
|
|
4,253 |
|
|
|
1,377 |
|
|
|
2,218 |
|
|
|
2,767 |
|
|
|
11,659 |
|
|
|
5,990 |
|
|
Total subordinate residential securities
|
|
|
74,324 |
|
|
|
65,186 |
|
|
|
57,804 |
|
|
|
44,975 |
|
|
|
45,787 |
|
|
|
45,954 |
|
|
|
48,460 |
|
|
|
60,855 |
|
|
|
45,787 |
|
|
|
69,780 |
|
|
|
45,870 |
|
| |
|
|
|
|
|
|
|
|
|
|
|
|
|
|
|
|
|
|
|
|
|
|
|
|
|
|
|
|
|
|
|
|
|
|
|
|
|
|
|
|
|
|
|
|
|
Commercial subordinate securities
|
|
|
5,200 |
|
|
|
6,288 |
|
|
|
6,948 |
|
|
|
7,274 |
|
|
|
7,417 |
|
|
|
7,670 |
|
|
|
8,090 |
|
|
|
13,504 |
|
|
|
25,006 |
|
|
|
5,741 |
|
|
|
7,542 |
|
|
Commercial loans
|
|
|
59,545 |
|
|
|
36,434 |
|
|
|
14,095 |
|
|
|
242 |
|
|
|
243 |
|
|
|
244 |
|
|
|
245 |
|
|
|
246 |
|
|
|
247 |
|
|
|
48,053 |
|
|
|
243 |
|
|
Residential loans
|
|
|
123,914 |
|
|
|
204,847 |
|
|
|
169,691 |
|
|
|
16,463 |
|
|
|
2,299 |
|
|
|
2,313 |
|
|
|
2,314 |
|
|
|
2,315 |
|
|
|
2,435 |
|
|
|
164,157 |
|
|
|
2,306 |
|
|
CDO
|
|
|
1,297 |
|
|
|
1,252 |
|
|
|
973 |
|
|
|
1,103 |
|
|
|
1,207 |
|
|
|
1,222 |
|
|
|
1,962 |
|
|
|
2,255 |
|
|
|
2,595 |
|
|
|
1,275 |
|
|
|
1,215 |
|
|
Total real estate assets at Redwood
|
|
|
825,468 |
|
|
|
909,792 |
|
|
|
866,131 |
|
|
|
689,682 |
|
|
|
672,270 |
|
|
|
697,681 |
|
|
|
678,133 |
|
|
|
684,281 |
|
|
|
435,258 |
|
|
|
867,397 |
|
|
|
684,905 |
|
| |
|
|
|
|
|
|
|
|
|
|
|
|
|
|
|
|
|
|
|
|
|
|
|
|
|
|
|
|
|
|
|
|
|
|
|
|
|
|
|
|
|
|
|
|
|
Earning assets at Acacia
|
|
|
315,039 |
|
|
|
347,786 |
|
|
|
311,949 |
|
|
|
292,468 |
|
|
|
290,060 |
|
|
|
299,843 |
|
|
|
304,436 |
|
|
|
298,615 |
|
|
|
321,206 |
|
|
|
331,467 |
|
|
|
294,924 |
|
|
Earning assets at Legacy Sequoia
|
|
|
3,287,938 |
|
|
|
3,351,214 |
|
|
|
3,425,633 |
|
|
|
3,505,497 |
|
|
|
3,589,882 |
|
|
|
3,666,884 |
|
|
|
3,767,112 |
|
|
|
3,864,796 |
|
|
|
4,305,159 |
|
|
|
3,319,401 |
|
|
|
3,628,170 |
|
|
Earning assets at New Sequoia
|
|
|
396,742 |
|
|
|
225,564 |
|
|
|
162,271 |
|
|
|
204,504 |
|
|
|
161,502 |
|
|
|
- |
|
|
|
- |
|
|
|
- |
|
|
|
- |
|
|
|
311,626 |
|
|
|
81,197 |
|
|
Earning assets at the Fund
|
|
|
4,948 |
|
|
|
22,280 |
|
|
|
33,001 |
|
|
|
34,334 |
|
|
|
35,526 |
|
|
|
42,134 |
|
|
|
53,990 |
|
|
|
57,070 |
|
|
|
58,054 |
|
|
|
13,566 |
|
|
|
38,812 |
|
| |
|
|
|
|
|
|
|
|
|
|
|
|
|
|
|
|
|
|
|
|
|
|
|
|
|
|
|
|
|
|
|
|
|
|
|
|
|
|
|
|
|
|
|
|
|
Cash and cash equivalents
|
|
|
149,350 |
|
|
|
123,317 |
|
|
|
102,099 |
|
|
|
265,071 |
|
|
|
339,212 |
|
|
|
311,816 |
|
|
|
321,838 |
|
|
|
279,011 |
|
|
|
285,680 |
|
|
|
136,405 |
|
|
|
325,590 |
|
|
Earning assets
|
|
|
4,979,485 |
|
|
|
4,979,953 |
|
|
|
4,901,084 |
|
|
|
4,991,557 |
|
|
|
5,088,452 |
|
|
|
5,018,358 |
|
|
|
5,125,509 |
|
|
|
5,183,773 |
|
|
|
5,405,357 |
|
|
|
4,979,862 |
|
|
|
5,053,598 |
|
|
Balance sheet mark-to-market adjustments
|
|
|
100,858 |
|
|
|
128,026 |
|
|
|
79,851 |
|
|
|
39,123 |
|
|
|
51,493 |
|
|
|
52,629 |
|
|
|
49,828 |
|
|
|
(54,880 |
) |
|
|
(80,035 |
) |
|
|
114,367 |
|
|
|
52,058 |
|
|
Earning assets - reported value
|
|
|
5,080,343 |
|
|
|
5,107,979 |
|
|
|
4,980,935 |
|
|
|
5,030,680 |
|
|
|
5,139,945 |
|
|
|
5,070,987 |
|
|
|
5,175,337 |
|
|
|
5,128,893 |
|
|
|
5,325,322 |
|
|
|
5,094,229 |
|
|
|
5,105,656 |
|
|
Other assets
|
|
|
183,186 |
|
|
|
202,397 |
|
|
|
160,615 |
|
|
|
130,818 |
|
|
|
123,785 |
|
|
|
148,649 |
|
|
|
118,550 |
|
|
|
9,900 |
|
|
|
(9,680 |
) |
|
|
192,738 |
|
|
|
136,149 |
|
|
Total assets
|
|
$ |
5,263,529 |
|
|
$ |
5,310,376 |
|
|
$ |
5,141,550 |
|
|
$ |
5,161,498 |
|
|
$ |
5,263,730 |
|
|
$ |
5,219,636 |
|
|
$ |
5,293,887 |
|
|
$ |
5,138,793 |
|
|
$ |
5,315,643 |
|
|
$ |
5,286,967 |
|
|
$ |
5,241,805 |
|
| |
|
|
|
|
|
|
|
|
|
|
|
|
|
|
|
|
|
|
|
|
|
|
|
|
|
|
|
|
|
|
|
|
|
|
|
|
|
|
|
|
|
|
|
|
|
Short-term debt
|
|
$ |
1,797 |
|
|
$ |
47,976 |
|
|
$ |
11,265 |
|
|
$ |
- |
|
|
$ |
7,920 |
|
|
$ |
- |
|
|
$ |
- |
|
|
$ |
- |
|
|
$ |
- |
|
|
$ |
24,759 |
|
|
$ |
3,982 |
|
|
Legacy Sequoia ABS issued
|
|
|
3,229,493 |
|
|
|
3,289,456 |
|
|
|
3,365,929 |
|
|
|
3,439,201 |
|
|
|
3,518,773 |
|
|
|
3,589,269 |
|
|
|
3,666,201 |
|
|
|
3,765,292 |
|
|
|
4,211,937 |
|
|
|
3,259,309 |
|
|
|
3,553,827 |
|
|
New Sequoia ABS issued
|
|
|
359,793 |
|
|
|
197,758 |
|
|
|
147,364 |
|
|
|
184,615 |
|
|
|
144,201 |
|
|
|
- |
|
|
|
- |
|
|
|
- |
|
|
|
- |
|
|
|
279,223 |
|
|
|
72,499 |
|
|
Acacia ABS issued
|
|
|
295,902 |
|
|
|
303,601 |
|
|
|
274,630 |
|
|
|
254,244 |
|
|
|
268,715 |
|
|
|
288,241 |
|
|
|
288,041 |
|
|
|
283,996 |
|
|
|
285,698 |
|
|
|
299,730 |
|
|
|
278,424 |
|
|
Other liabilities
|
|
|
200,708 |
|
|
|
232,062 |
|
|
|
151,332 |
|
|
|
126,428 |
|
|
|
164,764 |
|
|
|
200,096 |
|
|
|
231,553 |
|
|
|
91,027 |
|
|
|
66,588 |
|
|
|
216,443 |
|
|
|
182,332 |
|
|
Long-term debt
|
|
|
138,231 |
|
|
|
138,219 |
|
|
|
138,707 |
|
|
|
138,620 |
|
|
|
138,383 |
|
|
|
138,145 |
|
|
|
137,907 |
|
|
|
139,190 |
|
|
|
147,430 |
|
|
|
138,225 |
|
|
|
138,264 |
|
|
Total liabilities
|
|
|
4,225,924 |
|
|
|
4,209,072 |
|
|
|
4,089,227 |
|
|
|
4,143,108 |
|
|
|
4,242,755 |
|
|
|
4,215,751 |
|
|
|
4,323,702 |
|
|
|
4,279,505 |
|
|
|
4,711,653 |
|
|
|
4,217,689 |
|
|
|
4,229,328 |
|
| |
|
|
|
|
|
|
|
|
|
|
|
|
|
|
|
|
|
|
|
|
|
|
|
|
|
|
|
|
|
|
|
|
|
|
|
|
|
|
|
|
|
|
|
|
| |
|
|
|
|
|
|
|
|
|
|
|
|
|
|
|
|
|
|
|
|
|
|
|
|
|
|
|
|
|
|
|
|
|
|
|
|
|
|
|
|
|
|
|
|
|
Noncontrolling interest
|
|
|
2,542 |
|
|
|
8,724 |
|
|
|
14,278 |
|
|
|
15,018 |
|
|
|
15,763 |
|
|
|
18,535 |
|
|
|
24,322 |
|
|
|
26,061 |
|
|
|
28,330 |
|
|
|
5,615 |
|
|
|
17,141 |
|
| |
|
|
|
|
|
|
|
|
|
|
|
|
|
|
|
|
|
|
|
|
|
|
|
|
|
|
|
|
|
|
|
|
|
|
|
|
|
|
|
|
|
|
|
|
|
Core equity (1)
|
|
|
934,205 |
|
|
|
964,554 |
|
|
|
958,194 |
|
|
|
964,249 |
|
|
|
953,720 |
|
|
|
932,721 |
|
|
|
896,034 |
|
|
|
888,107 |
|
|
|
655,695 |
|
|
|
949,296 |
|
|
|
943,278 |
|
|
Accumulated other comprehensive income (loss)
|
|
|
100,858 |
|
|
|
128,026 |
|
|
|
79,851 |
|
|
|
39,123 |
|
|
|
51,493 |
|
|
|
52,629 |
|
|
|
49,829 |
|
|
|
(54,880 |
) |
|
|
(80,035 |
) |
|
|
114,367 |
|
|
|
52,058 |
|
|
Total equity
|
|
|
1,035,063 |
|
|
|
1,092,580 |
|
|
|
1,038,045 |
|
|
|
1,003,372 |
|
|
|
1,005,212 |
|
|
|
985,350 |
|
|
|
945,863 |
|
|
|
833,227 |
|
|
|
575,661 |
|
|
|
1,063,663 |
|
|
|
995,336 |
|
| |
|
|
|
|
|
|
|
|
|
|
|
|
|
|
|
|
|
|
|
|
|
|
|
|
|
|
|
|
|
|
|
|
|
|
|
|
|
|
|
|
|
|
|
|
|
Total liabilities and equity
|
|
$ |
5,263,529 |
|
|
$ |
5,310,376 |
|
|
$ |
5,141,550 |
|
|
$ |
5,161,498 |
|
|
$ |
5,263,730 |
|
|
$ |
5,219,636 |
|
|
$ |
5,293,887 |
|
|
$ |
5,138,793 |
|
|
$ |
5,315,643 |
|
|
$ |
5,286,967 |
|
|
$ |
5,241,805 |
|
(1) Core equity is a non-GAAP metric and is equal to GAAP equity excluding accumulated other comprehensive income (loss).
| THE REDWOOD REVIEW 2ND QUARTER 2011 |
Table 5: Average Balance Sheet
|
|
| |
|
2011
|
|
|
2011
|
|
|
2010
|
|
|
2010
|
|
|
2010
|
|
|
2010
|
|
|
2009
|
|
|
2009
|
|
|
|
|
2011
|
|
|
2011
|
|
|
2010
|
|
|
2010
|
|
|
2010
|
|
|
2010
|
|
|
2009
|
|
|
2009
|
|
| |
|
Q2
|
|
|
Q1
|
|
|
Q4
|
|
|
Q3
|
|
|
Q2
|
|
|
Q1
|
|
|
Q4
|
|
|
Q3
|
|
|
|
|
Q2
|
|
|
Q1
|
|
|
Q4
|
|
|
Q3
|
|
|
Q2
|
|
|
Q1
|
|
|
Q4
|
|
|
Q3
|
|
|
Residential Prime Senior AFS
|
|
|
|
|
|
|
|
|
|
|
|
|
|
|
|
|
|
|
|
|
|
|
|
Residential Non-Prime Subordinate AFS
|
|
|
|
|
|
|
|
|
|
|
|
|
|
|
|
|
|
|
|
|
Current face
|
|
$ |
336,876 |
|
|
$ |
346,317 |
|
|
$ |
358,683 |
|
|
$ |
368,191 |
|
|
$ |
371,066 |
|
|
$ |
450,647 |
|
|
$ |
412,471 |
|
|
$ |
431,289 |
|
|
Current face
|
|
$ |
26,940 |
|
|
$ |
29,095 |
|
|
$ |
31,556 |
|
|
$ |
27,461 |
|
|
$ |
32,443 |
|
|
$ |
56,128 |
|
|
$ |
71,963 |
|
|
$ |
143,357 |
|
|
Unamortized discount
|
|
|
(71,985 |
) |
|
|
(78,306 |
) |
|
|
(83,465 |
) |
|
|
(88,978 |
) |
|
|
(93,502 |
) |
|
|
(113,757 |
) |
|
|
(116,801 |
) |
|
|
(124,295 |
) |
|
Unamortized (discount) premium
|
|
|
(8,196 |
) |
|
|
(8,466 |
) |
|
|
(10,123 |
) |
|
|
(7,279 |
) |
|
|
(7,558 |
) |
|
|
(2,742 |
) |
|
|
(242 |
) |
|
|
(1,524 |
) |
|
Credit reserve
|
|
|
(18,433 |
) |
|
|
(16,679 |
) |
|
|
(15,667 |
) |
|
|
(12,822 |
) |
|
|
(10,084 |
) |
|
|
(14,637 |
) |
|
|
(9,898 |
) |
|
|
(11,069 |
) |
|
Credit reserve
|
|
|
(7,913 |
) |
|
|
(9,469 |
) |
|
|
(9,229 |
) |
|
|
(11,323 |
) |
|
|
(15,775 |
) |
|
|
(47,805 |
) |
|
|
(70,806 |
) |
|
|
(140,046 |
) |
|
Unrealized gains, net
|
|
|
39,488 |
|
|
|
54,860 |
|
|
|
56,340 |
|
|
|
49,543 |
|
|
|
42,222 |
|
|
|
49,887 |
|
|
|
43,436 |
|
|
|
40,734 |
|
|
Unrealized gains (losses) , net
|
|
|
46 |
|
|
|
868 |
|
|
|
984 |
|
|
|
953 |
|
|
|
732 |
|
|
|
772 |
|
|
|
162 |
|
|
|
(806 |
) |
|
Fair value
|
|
$ |
285,946 |
|
|
$ |
306,192 |
|
|
$ |
315,891 |
|
|
$ |
315,934 |
|
|
$ |
309,702 |
|
|
$ |
372,140 |
|
|
$ |
329,208 |
|
|
$ |
336,659 |
|
|
Fair value
|
|
$ |
10,877 |
|
|
$ |
12,028 |
|
|
$ |
13,188 |
|
|
$ |
9,812 |
|
|
$ |
9,842 |
|
|
$ |
6,353 |
|
|
$ |
1,077 |
|
|
$ |
981 |
|
| |
|
|
|
|
|
|
|
|
|
|
|
|
|
|
|
|
|
|
|
|
|
|
|
|
|
|
|
|
|
|
|
|
|
|
|
|
|
|
|
|
|
|
|
|
|
|
|
|
|
|
|
|
|
|
|
|
|
|
|
|
|
|
|
|
|
|
|
Average amortized cost
|
|
$ |
246,957 |
|
|
$ |
255,884 |
|
|
$ |
262,048 |
|
|
$ |
270,286 |
|
|
$ |
278,472 |
|
|
$ |
283,477 |
|
|
$ |
280,101 |
|
|
$ |
264,773 |
|
|
Average amortized cost
|
|
$ |
11,017 |
|
|
$ |
11,957 |
|
|
$ |
11,670 |
|
|
$ |
8,988 |
|
|
$ |
7,519 |
|
|
$ |
4,047 |
|
|
$ |
1,156 |
|
|
$ |
1,994 |
|
|
Interest income
|
|
$ |
7,099 |
|
|
$ |
7,479 |
|
|
$ |
8,306 |
|
|
$ |
7,617 |
|
|
$ |
7,868 |
|
|
$ |
8,455 |
|
|
$ |
8,610 |
|
|
$ |
8,431 |
|
|
Interest income
|
|
$ |
531 |
|
|
$ |
598 |
|
|
$ |
619 |
|
|
$ |
545 |
|
|
$ |
603 |
|
|
$ |
129 |
|
|
$ |
8 |
|
|
$ |
392 |
|
|
Annualized yield
|
|
|
11.50 |
% |
|
|
11.69 |
% |
|
|
12.68 |
% |
|
|
11.27 |
% |
|
|
11.30 |
% |
|
|
11.93 |
% |
|
|
12.30 |
% |
|
|
12.74 |
% |
|
Annualized yield
|
|
|
19.27 |
% |
|
|
20.01 |
% |
|
|
21.22 |
% |
|
|
24.25 |
% |
|
|
32.10 |
% |
|
|
12.75 |
% |
|
|
2.67 |
% |
|
|
78.65 |
% |
| |
|
|
|
|
|
|
|
|
|
|
|
|
|
|
|
|
|
|
|
|
|
|
|
|
|
|
|
|
|
|
|
|
|
|
|
|
|
|
|
|
|
|
|
|
|
|
|
|
|
|
|
|
|
|
|
|
|
|
|
|
|
|
|
|
|
|
|
Residential Non-Prime Senior AFS
|
|
|
|
|
|
|
|
|
|
|
|
|
|
|
|
|
|
|
|
|
|
|
|
|
|
|
|
|
|
Commercial Subordinate AFS
|
|
|
|
|
|
|
|
|
|
|
|
|
|
|
|
|
|
|
|
|
|
|
|
|
|
|
|
|
|
|
Current face
|
|
$ |
367,209 |
|
|
$ |
372,394 |
|
|
$ |
416,169 |
|
|
$ |
431,143 |
|
|
$ |
399,988 |
|
|
$ |
471,894 |
|
|
$ |
423,961 |
|
|
$ |
395,311 |
|
|
Current face
|
|
$ |
58,127 |
|
|
$ |
74,782 |
|
|
$ |
89,103 |
|
|
$ |
109,275 |
|
|
$ |
140,547 |
|
|
$ |
152,408 |
|
|
$ |
158,997 |
|
|
$ |
486,245 |
|
|
Unamortized discount
|
|
|
(81,672 |
) |
|
|
(87,569 |
) |
|
|
(104,517 |
) |
|
|
(111,709 |
) |
|
|
(110,018 |
) |
|
|
(133,479 |
) |
|
|
(133,995 |
) |
|
|
(132,036 |
) |
|
Unamortized discount
|
|
|
(4,361 |
) |
|
|
(4,784 |
) |
|
|
(5,591 |
) |
|
|
(5,610 |
) |
|
|
(5,534 |
) |
|
|
(5,660 |
) |
|
|
(5,130 |
) |
|
|
(1,624 |
) |
|
Credit reserve
|
|
|
(19,129 |
) |
|
|
(17,292 |
) |
|
|
(15,928 |
) |
|
|
(14,193 |
) |
|
|
(10,894 |
) |
|
|
(13,830 |
) |
|
|
(13,468 |
) |
|
|
(10,098 |
) |
|
Credit reserve
|
|
|
(48,987 |
) |
|
|
(64,717 |
) |
|
|
(76,979 |
) |
|
|
(96,657 |
) |
|
|
(127,627 |
) |
|
|
(139,320 |
) |
|
|
(146,018 |
) |
|
|
(471,957 |
) |
|
Unrealized gains (losses), net
|
|
|
22,310 |
|
|
|
30,225 |
|
|
|
30,641 |
|
|
|
27,588 |
|
|
|
24,559 |
|
|
|
24,556 |
|
|
|
32,371 |
|
|
|
23,322 |
|
|
Unrealized gains, net
|
|
|
1,086 |
|
|
|
1,081 |
|
|
|
963 |
|
|
|
904 |
|
|
|
224 |
|
|
|
1,448 |
|
|
|
1,351 |
|
|
|
4,169 |
|
|
Fair value
|
|
$ |
288,718 |
|
|
$ |
297,758 |
|
|
$ |
326,365 |
|
|
$ |
332,829 |
|
|
$ |
303,635 |
|
|
$ |
349,141 |
|
|
$ |
308,869 |
|
|
$ |
276,499 |
|
|
Fair value
|
|
$ |
5,865 |
|
|
$ |
6,362 |
|
|
$ |
7,496 |
|
|
$ |
7,912 |
|
|
$ |
7,610 |
|
|
$ |
8,876 |
|
|
$ |
9,200 |
|
|
$ |
16,833 |
|
| |
|
|
|
|
|
|
|
|
|
|
|
|
|
|
|
|
|
|
|
|
|
|
|
|
|
|
|
|
|
|
|
|
|
|
|
|
|
|
|
|
|
|
|
|
|
|
|
|
|
|
|
|
|
|
|
|
|
|
|
|
|
|
|
|
|
|
|
Average amortized cost
|
|
$ |
265,130 |
|
|
$ |
287,991 |
|
|
$ |
301,498 |
|
|
$ |
297,197 |
|
|
$ |
286,462 |
|
|
$ |
292,210 |
|
|
$ |
259,911 |
|
|
$ |
269,501 |
|
|
Average amortized cost
|
|
$ |
5,199 |
|
|
$ |
6,288 |
|
|
$ |
6,948 |
|
|
$ |
7,274 |
|
|
$ |
7,417 |
|
|
$ |
7,670 |
|
|
$ |
8,090 |
|
|
$ |
13,504 |
|
|
Interest income
|
|
$ |
7,418 |
|
|
$ |
8,338 |
|
|
$ |
8,415 |
|
|
$ |
8,583 |
|
|
$ |
9,007 |
|
|
$ |
10,208 |
|
|
$ |
7,907 |
|
|
$ |
10,374 |
|
|
Interest income
|
|
$ |
558 |
|
|
$ |
492 |
|
|
$ |
616 |
|
|
$ |
2,135 |
|
|
$ |
696 |
|
|
$ |
716 |
|
|
$ |
1,233 |
|
|
$ |
2,192 |
|
|
Annualized yield
|
|
|
11.19 |
% |
|
|
11.58 |
% |
|
|
11.16 |
% |
|
|
11.55 |
% |
|
|
12.58 |
% |
|
|
13.97 |
% |
|
|
12.17 |
% |
|
|
15.40 |
% |
|
Annualized yield
|
|
|
42.95 |
% |
|
|
31.30 |
% |
|
|
35.46 |
% |
|
|
117.40 |
% |
|
|
37.55 |
% |
|
|
37.36 |
% |
|
|
60.97 |
% |
|
|
64.93 |
% |
| |
|
|
|
|
|
|
|
|
|
|
|
|
|
|
|
|
|
|
|
|
|
|
|
|
|
|
|
|
|
|
|
|
|
|
|
|
|
|
|
|
|
|
|
|
|
|
|
|
|
|
|
|
|
|
|
|
|
|
|
|
|
|
|
|
|
|
|
Residential Re-REMIC AFS
|
|
|
|
|
|
|
|
|
|
|
|
|
|
|
|
|
|
|
|
|
|
|
|
|
|
|
|
|
|
|
CDO Subordinate AFS
|
|
|
|
|
|
|
|
|
|
|
|
|
|
|
|
|
|
|
|
|
|
|
|
|
|
|
|
|
|
|
|
|
|
Current face
|
|
$ |
131,860 |
|
|
$ |
131,860 |
|
|
$ |
139,426 |
|
|
$ |
139,426 |
|
|
$ |
139,426 |
|
|
$ |
146,964 |
|
|
$ |
255,975 |
|
|
$ |
318,703 |
|
|
Current face
|
|
$ |
11,863 |
|
|
$ |
11,837 |
|
|
$ |
14,815 |
|
|
$ |
14,786 |
|
|
$ |
14,761 |
|
|
$ |
14,736 |
|
|
$ |
14,710 |
|
|
$ |
14,683 |
|
|
Unamortized discount
|
|
|
(52,375 |
) |
|
|
(54,855 |
) |
|
|
(62,471 |
) |
|
|
(65,691 |
) |
|
|
(68,049 |
) |
|
|
(68,806 |
) |
|
|
(109,807 |
) |
|
|
(144,351 |
) |
|
Unamortized discount
|
|
|
(1,083 |
) |
|
|
(1,082 |
) |
|
|
(1,082 |
) |
|
|
(1,082 |
) |
|
|
(1,083 |
) |
|
|
(1,083 |
) |
|
|
(1,082 |
) |
|
|
(1,083 |
) |
|
Credit reserve
|
|
|
(49,033 |
) |
|
|
(46,546 |
) |
|
|
(44,182 |
) |
|
|
(40,656 |
) |
|
|
(37,962 |
) |
|
|
(42,299 |
) |
|
|
(81,726 |
) |
|
|
(94,626 |
) |
|
Credit reserve
|
|
|
(10,780 |
) |
|
|
(10,755 |
) |
|
|
(13,733 |
) |
|
|
(13,704 |
) |
|
|
(13,678 |
) |
|
|
(13,653 |
) |
|
|
(13,628 |
) |
|
|
(13,600 |
) |
|
Unrealized gains (losses), net
|
|
|
47,123 |
|
|
|
55,038 |
|
|
|
52,304 |
|
|
|
41,812 |
|
|
|
35,655 |
|
|
|
31,054 |
|
|
|
41,509 |
|
|
|
13,781 |
|
|
Unrealized gains, net
|
|
|
100 |
|
|
|
- |
|
|
|
- |
|
|
|
- |
|
|
|
- |
|
|
|
- |
|
|
|
25 |
|
|
|
25 |
|
|
Fair value
|
|
$ |
77,575 |
|
|
$ |
85,497 |
|
|
$ |
85,077 |
|
|
$ |
74,891 |
|
|
$ |
69,070 |
|
|
$ |
66,913 |
|
|
$ |
105,951 |
|
|
$ |
93,507 |
|
|
Fair value
|
|
$ |
100 |
|
|
$ |
- |
|
|
$ |
- |
|
|
$ |
- |
|
|
$ |
- |
|
|
$ |
- |
|
|
$ |
25 |
|
|
$ |
25 |
|
| |
|
|
|
|
|
|
|
|
|
|
|
|
|
|
|
|
|
|
|
|
|
|
|
|
|
|
|
|
|
|
|
|
|
|
|
|
|
|
|
|
|
|
|
|
|
|
|
|
|
|
|
|
|
|
|
|
|
|
|
|
|
|
|
|
|
|
|
Average amortized cost
|
|
$ |
30,447 |
|
|
$ |
32,648 |
|
|
$ |
32,917 |
|
|
$ |
33,250 |
|
|
$ |
34,385 |
|
|
$ |
45,852 |
|
|
$ |
73,938 |
|
|
$ |
69,980 |
|
|
Average amortized cost
|
|
$ |
- |
|
|
$ |
- |
|
|
$ |
- |
|
|
$ |
- |
|
|
$ |
- |
|
|
$ |
- |
|
|
$ |
- |
|
|
$ |
- |
|
|
Interest income
|
|
$ |
1,437 |
|
|
$ |
1,480 |
|
|
$ |
1,440 |
|
|
$ |
1,458 |
|
|
$ |
1,382 |
|
|
$ |
1,925 |
|
|
$ |
2,941 |
|
|
$ |
3,110 |
|
|
Interest income
|
|
$ |
- |
|
|
$ |
34 |
|
|
$ |
- |
|
|
$ |
8 |
|
|
$ |
82 |
|
|
$ |
12 |
|
|
$ |
96 |
|
|
$ |
24 |
|
|
Annualized yield
|
|
|
18.87 |
% |
|
|
18.13 |
% |
|
|
17.50 |
% |
|
|
17.55 |
% |
|
|
16.08 |
% |
|
|
16.79 |
% |
|
|
15.91 |
% |
|
|
17.77 |
% |
|
Annualized yield
|
|
|
N/A |
|
|
|
N/A |
|
|
|
N/A |
|
|
|
N/A |
|
|
|
N/A |
|
|
|
N/A |
|
|
|
N/A |
|
|
|
12.97 |
% |
| |
|
|
|
|
|
|
|
|
|
|
|
|
|
|
|
|
|
|
|
|
|
|
|
|
|
|
|
|
|
|
|
|
|
|
|
|
|
|
|
|
|
|
|
|
|
|
|
|
|
|
|
|
|
|
|
|
|
|
|
|
|
|
|
|
|
|
|
Residential Prime Subordinate AFS
|
|
|
|
|
|
|
|
|
|
|
|
|
|
|
|
|
|
|
|
|
|
|
|
|
|
|
Fair Value Securities
|
|
|
|
|
|
|
|
|
|
|
|
|
|
|
|
|
|
|
|
|
|
|
|
|
|
|
|
|
|
|
|
|
|
Current face
|
|
$ |
248,331 |
|
|
$ |
258,615 |
|
|
$ |
273,042 |
|
|
$ |
278,171 |
|
|
$ |
297,932 |
|
|
$ |
324,226 |
|
|
$ |
347,848 |
|
|
$ |
378,417 |
|
|
|
|
|
|
|
|
|
|
|
|
|
|
|
|
|
|
|
|
|
|
|
|
|
|
|
|
|
|
|
|
|
|
|
|
Unamortized discount
|
|
|
(29,434 |
) |
|
|
(24,016 |
) |
|
|
(24,308 |
) |
|
|
(23,488 |
) |
|
|
(22,886 |
) |
|
|
(23,310 |
) |
|
|
(21,588 |
) |
|
|
(22,597 |
) |
|
|
|
|
|
|
|
|
|
|
|
|
|
|
|
|
|
|
|
|
|
|
|
|
|
|
|
|
|
|
|
|
|
|
|
Credit reserve
|
|
|
(146,391 |
) |
|
|
(179,587 |
) |
|
|
(199,754 |
) |
|
|
(217,996 |
) |
|
|
(240,357 |
) |
|
|
(261,854 |
) |
|
|
(282,813 |
) |
|
|
(306,728 |
) |
|
|
|
|
|
|
|
|
|
|
|
|
|
|
|
|
|
|
|
|
|
|
|
|
|
|
|
|
|
|
|
|
|
|
|
Unrealized gains (losses), net
|
|
|
(963 |
) |
|
|
3,858 |
|
|
|
4,866 |
|
|
|
(3,663 |
) |
|
|
(18,665 |
) |
|
|
(22,812 |
) |
|
|
(24,256 |
) |
|
|
(27,643 |
) |
|
|
|
|
|
|
|
|
|
|
|
|
|
|
|
|
|
|
|
|
|
|
|
|
|
|
|
|
|
|
|
|
|
|
|
Fair value
|
|
$ |
71,543 |
|
|
$ |
58,870 |
|
|
$ |
53,846 |
|
|
$ |
33,024 |
|
|
$ |
16,024 |
|
|
$ |
16,250 |
|
|
$ |
19,191 |
|
|
$ |
21,449 |
|
|
Fair value
|
|
$ |
20,451 |
|
|
$ |
20,701 |
|
|
$ |
21,354 |
|
|
$ |
22,826 |
|
|
$ |
18,464 |
|
|
$ |
19,990 |
|
|
$ |
7,842 |
|
|
$ |
5,314 |
|
| |
|
|
|
|
|
|
|
|
|
|
|
|
|
|
|
|
|
|
|
|
|
|
|
|
|
|
|
|
|
|
|
|
|
|
|
|
|
|
|
|
|
|
|
|
|
|
|
|
|
|
|
|
|
|
|
|
|
|
|
|
|
|
|
|
|
|
|
Average amortized cost
|
|
$ |
62,786 |
|
|
$ |
52,642 |
|
|
$ |
45,550 |
|
|
$ |
35,443 |
|
|
$ |
37,731 |
|
|
$ |
41,373 |
|
|
$ |
46,637 |
|
|
$ |
58,063 |
|
|
Average fair value
|
|
$ |
20,472 |
|
|
$ |
21,101 |
|
|
$ |
21,713 |
|
|
$ |
20,539 |
|
|
$ |
17,743 |
|
|
$ |
20,494 |
|
|
$ |
5,740 |
|
|
$ |
3,905 |
|
|
Interest income
|
|
$ |
3,582 |
|
|
$ |
4,110 |
|
|
$ |
4,170 |
|
|
$ |
3,328 |
|
|
$ |
3,219 |
|
|
$ |
2,847 |
|
|
$ |
3,406 |
|
|
$ |
4,135 |
|
|
Interest income
|
|
$ |
2,008 |
|
|
$ |
2,124 |
|
|
$ |
2,241 |
|
|
$ |
2,350 |
|
|
$ |
2,559 |
|
|
$ |
2,957 |
|
|
$ |
1,102 |
|
|
$ |
1,231 |
|
|
Annualized yield
|
|
|
22.82 |
% |
|
|
31.23 |
% |
|
|
36.61 |
% |
|
|
37.55 |
% |
|
|
34.13 |
% |
|
|
27.53 |
% |
|
|
29.21 |
% |
|
|
28.49 |
% |
|
Annualized yield
|
|
|
39.24 |
% |
|
|
40.27 |
% |
|
|
41.29 |
% |
|
|
45.76 |
% |
|
|
57.68 |
% |
|
|
57.72 |
% |
|
|
76.79 |
% |
|
|
126.12 |
% |
(1) Annualized yields are based on average amortized cost. Cash flows from many of our subordinate securities can be volatile and in certain cases (e.g., when the fair value of certain securities are close to zero) any interest income earned can result in unusually high reported yields that are not sustainable and not necessarily meaningful.
| THE REDWOOD REVIEW 2ND QUARTER 2011 |
Table 6: Balances & Yields by Securities Portfolio at Redwood
|
47 |
| |
Table 7: Securities Portfolio Activity at Redwood ($ in thousands)
|
48 |
|
|
|
2011
|
|
|
2011
|
|
|
2010
|
|
|
2010
|
|
|
2010
|
|
|
|
|
2011
|
|
|
2011
|
|
|
2010
|
|
|
2010
|
|
|
2010
|
|
| |
|
Q2 |
|
|
Q1 |
|
|
Q4 |
|
|
Q3 |
|
|
Q2 |
|
|
|
|
Q2 |
|
|
Q1 |
|
|
Q4 |
|
|
Q3 |
|
|
Q2 |
|
|
Residential Prime Senior
|
|
|
|
|
|
|
|
|
|
|
|
|
|
|
|
|
|
|
|
|
|
Commercial Subordinate
|
|
|
|
|
|
|
|
|
|
|
|
|
|
|
|
|
|
|
|
|
|
Beginning fair value
|
|
$ |
306,192 |
|
|
$ |
315,891 |
|
|
$ |
315,934 |
|
|
$ |
309,702 |
|
|
$ |
372,140 |
|
|
Beginning fair value
|
|
$ |
6,362 |
|
|
$ |
7,496 |
|
|
$ |
7,912 |
|
|
$ |
7,610 |
|
|
$ |
8,876 |
|
|
Acquisitions
|
|
|
8,844 |
|
|
|
3,317 |
|
|
|
6,043 |
|
|
|
9,954 |
|
|
|
1,055 |
|
|
Acquisitions
|
|
|
- |
|
|
|
- |
|
|
|
- |
|
|
|
- |
|
|
|
- |
|
|
Sales
|
|
|
(8,554 |
) |
|
|
(2,825 |
) |
|
|
- |
|
|
|
- |
|
|
|
(43,485 |
) |
|
Sales
|
|
|
- |
|
|
|
(2,116 |
) |
|
|
- |
|
|
|
- |
|
|
|
- |
|
|
Effect of principal payments
|
|
|
(11,019 |
) |
|
|
(11,655 |
) |
|
|
(15,199 |
) |
|
|
(12,186 |
) |
|
|
(13,065 |
) |
|
Effect of principal payments
|
|
|
- |
|
|
|
- |
|
|
|
- |
|
|
|
- |
|
|
|
- |
|
|
Change in fair value, net
|
|
|
(9,517 |
) |
|
|
1,464 |
|
|
|
9,113 |
|
|
|
8,464 |
|
|
|
(6,943 |
) |
|
Change in fair value, net
|
|
|
(497 |
) |
|
|
982 |
|
|
|
(416 |
) |
|
|
302 |
|
|
|
(1,266 |
) |
|
Ending fair value
|
|
$ |
285,946 |
|
|
$ |
306,192 |
|
|
$ |
315,891 |
|
|
$ |
315,934 |
|
|
$ |
309,702 |
|
|
Ending fair value
|
|
$ |
5,865 |
|
|
$ |
6,362 |
|
|
$ |
7,496 |
|
|
$ |
7,912 |
|
|
$ |
7,610 |
|
| |
|
|
|
|
|
|
|
|
|
|
|
|
|
|
|
|
|
|
|
|
|
|
|
|
|
|
|
|
|
|
|
|
|
|
|
|
|
|
|
|
|
|
|
Residential Non-Prime Senior
|
|
|
|
|
|
|
|
|
|
|
|
|
|
|
|
|
|
|
|
|
|
CDO Subordinate
|
|
|
|
|
|
|
|
|
|
|
|
|
|
|
|
|
|
|
|
|
|
Beginning fair value
|
|
$ |
316,626 |
|
|
$ |
346,107 |
|
|
$ |
354,106 |
|
|
$ |
320,397 |
|
|
$ |
367,372 |
|
|
Beginning fair value
|
|
$ |
1,296 |
|
|
$ |
1,038 |
|
|
$ |
960 |
|
|
$ |
1,132 |
|
|
$ |
1,222 |
|
|
Acquisitions
|
|
|
3,154 |
|
|
|
- |
|
|
|
635 |
|
|
|
32,777 |
|
|
|
16,113 |
|
|
Acquisitions
|
|
|
- |
|
|
|
- |
|
|
|
- |
|
|
|
- |
|
|
|
- |
|
|
Sales
|
|
|
- |
|
|
|
(24,486 |
) |
|
|
- |
|
|
|
- |
|
|
|
(54,285 |
) |
|
Sales
|
|
|
- |
|
|
|
- |
|
|
|
- |
|
|
|
- |
|
|
|
- |
|
|
Effect of principal payments
|
|
|
(7,613 |
) |
|
|
(9,033 |
) |
|
|
(12,298 |
) |
|
|
(9,657 |
) |
|
|
(12,582 |
) |
|
Effect of principal payments
|
|
|
- |
|
|
|
- |
|
|
|
- |
|
|
|
- |
|
|
|
- |
|
|
Change in fair value, net
|
|
|
(4,763 |
) |
|
|
4,038 |
|
|
|
3,664 |
|
|
|
10,589 |
|
|
|
3,779 |
|
|
Change in fair value, net
|
|
|
107 |
|
|
|
258 |
|
|
|
78 |
|
|
|
(172 |
) |
|
|
(90 |
) |
|
Ending fair value
|
|
$ |
307,404 |
|
|
$ |
316,626 |
|
|
$ |
346,107 |
|
|
$ |
354,106 |
|
|
$ |
320,397 |
|
|
Ending fair value
|
|
$ |
1,403 |
|
|
$ |
1,296 |
|
|
$ |
1,038 |
|
|
$ |
960 |
|
|
$ |
1,132 |
|
| |
|
|
|
|
|
|
|
|
|
|
|
|
|
|
|
|
|
|
|
|
|
|
|
|
|
|
|
|
|
|
|
|
|
|
|
|
|
|
|
|
|
|
|
Re-REMIC
|
|
|
|
|
|
|
|
|
|
|
|
|
|
|
|
|
|
|
|
|
|
Residential Real Estate Loans
|
|
|
|
|
|
|
|
|
|
|
|
|
|
|
|
|
|
|
|
|
|
Beginning fair value
|
|
$ |
85,497 |
|
|
$ |
85,077 |
|
|
$ |
74,891 |
|
|
$ |
69,070 |
|
|
$ |
66,913 |
|
|
Beginning carrying value
|
|
$ |
54,870 |
|
|
$ |
254,936 |
|
|
$ |
63,487 |
|
|
$ |
2,404 |
|
|
$ |
2,227 |
|
|
Acquisitions
|
|
|
- |
|
|
|
- |
|
|
|
- |
|
|
|
- |
|
|
|
- |
|
|
Acquisitions
|
|
|
152,042 |
|
|
|
98,960 |
|
|
|
194,863 |
|
|
|
62,135 |
|
|
|
- |
|
|
Sales
|
|
|
- |
|
|
|
(5,230 |
) |
|
|
- |
|
|
|
- |
|
|
|
(1,960 |
) |
|
Transfers to Securitization Entities
|
|
|
- |
|
|
|
(295,103 |
) |
|
|
- |
|
|
|
- |
|
|
|
- |
|
|
Effect of principal payments
|
|
|
- |
|
|
|
- |
|
|
|
- |
|
|
|
- |
|
|
|
- |
|
|
Principal Payments
|
|
|
(1,616 |
) |
|
|
(3,922 |
) |
|
|
(3,517 |
) |
|
|
(601 |
) |
|
|
46 |
|
|
Change in fair value, net
|
|
|
(7,922 |
) |
|
|
5,650 |
|
|
|
10,186 |
|
|
|
5,821 |
|
|
|
4,117 |
|
|
Transfers to REO
|
|
|
- |
|
|
|
- |
|
|
|
- |
|
|
|
(63 |
) |
|
|
(165 |
) |
|
Ending fair value
|
|
$ |
77,575 |
|
|
$ |
85,497 |
|
|
$ |
85,077 |
|
|
$ |
74,891 |
|
|
$ |
69,070 |
|
|
Changes in fair value, net
|
|
|
5 |
|
|
|
(1 |
) |
|
|
103 |
|
|
|
(388 |
) |
|
|
296 |
|
| |
|
|
|
|
|
|
|
|
|
|
|
|
|
|
|
|
|
|
|
|
|
Ending carrying value
|
|
$ |
205,301 |
|
|
$ |
54,870 |
|
|
$ |
254,936 |
|
|
$ |
63,487 |
|
|
$ |
2,404 |
|
|
Residential Prime Subordinate
|
|
|
|
|
|
|
|
|
|
|
|
|
|
|
|
|
|
|
|
|
|
|
|
|
|
|
|
|
|
|
|
|
|
|
|
|
|
|
|
|
|
|
|
Beginning fair value
|
|
$ |
59,239 |
|
|
$ |
54,232 |
|
|
$ |
33,384 |
|
|
$ |
16,406 |
|
|
$ |
16,596 |
|
|
Commercial Real Estate Loans
|
|
|
|
|
|
|
|
|
|
|
|
|
|
|
|
|
|
|
|
|
|
Acquisitions
|
|
|
21,277 |
|
|
|
9,906 |
|
|
|
15,283 |
|
|
|
7,088 |
|
|
|
2,223 |
|
|
Beginning carrying value
|
|
$ |
42,483 |
|
|
$ |
30,537 |
|
|
$ |
242 |
|
|
$ |
243 |
|
|
$ |
244 |
|
|
Sales
|
|
|
- |
|
|
|
- |
|
|
|
- |
|
|
|
- |
|
|
|
- |
|
|
Originations
|
|
|
28,660 |
|
|
|
11,925 |
|
|
|
30,275 |
|
|
|
- |
|
|
|
- |
|
|
Effect of principal payments
|
|
|
(1,743 |
) |
|
|
(2,073 |
) |
|
|
(692 |
) |
|
|
883 |
|
|
|
(474 |
) |
|
Principal payments
|
|
|
(2 |
) |
|
|
(2 |
) |
|
|
(2 |
) |
|
|
(2 |
) |
|
|
(2 |
) |
|
Change in fair value, net
|
|
|
(6,928 |
) |
|
|
(2,826 |
) |
|
|
6,257 |
|
|
|
9,007 |
|
|
|
(1,939 |
) |
|
Discount/fee amortization
|
|
|
27 |
|
|
|
23 |
|
|
|
22 |
|
|
|
1 |
|
|
|
1 |
|
|
Ending fair value
|
|
$ |
71,845 |
|
|
$ |
59,239 |
|
|
$ |
54,232 |
|
|
$ |
33,384 |
|
|
$ |
16,406 |
|
|
Ending carrying value
|
|
$ |
71,168 |
|
|
$ |
42,483 |
|
|
$ |
30,537 |
|
|
$ |
242 |
|
|
$ |
243 |
|
| |
|
|
|
|
|
|
|
|
|
|
|
|
|
|
|
|
|
|
|
|
|
|
|
|
|
|
|
|
|
|
|
|
|
|
|
|
|
|
|
|
|
|
|
Residential Non-Prime Subordinate
|
|
|
|
|
|
|
|
|
|
|
|
|
|
|
|
|
|
|
|
|
|
|
|
|
|
|
|
|
|
|
|
|
|
|
|
|
|
|
|
|
|
|
|
Beginning fair value
|
|
$ |
12,196 |
|
|
$ |
13,376 |
|
|
$ |
10,041 |
|
|
$ |
10,030 |
|
|
$ |
6,544 |
|
|
|
|
|
|
|
|
|
|
|
|
|
|
|
|
|
|
|
|
|
|
|
|
Acquisitions
|
|
|
- |
|
|
|
- |
|
|
|
3,820 |
|
|
|
- |
|
|
|
3,894 |
|
|
|
|
|
|
|
|
|
|
|
|
|
|
|
|
|
|
|
|
|
|
|
|
Sales
|
|
|
- |
|
|
|
(703 |
) |
|
|
- |
|
|
|
- |
|
|
|
- |
|
|
|
|
|
|
|
|
|
|
|
|
|
|
|
|
|
|
|
|
|
|
|
|
Effect of principal payments
|
|
|
(336 |
) |
|
|
(354 |
) |
|
|
(542 |
) |
|
|
(320 |
) |
|
|
(352 |
) |
|
|
|
|
|
|
|
|
|
|
|
|
|
|
|
|
|
|
|
|
|
|
|
Change in fair value, net
|
|
|
(824 |
) |
|
|
(123 |
) |
|
|
57 |
|
|
|
331 |
|
|
|
(56 |
) |
|
|
|
|
|
|
|
|
|
|
|
|
|
|
|
|
|
|
|
|
|
|
|
Ending fair value
|
|
$ |
11,036 |
|
|
$ |
12,196 |
|
|
$ |
13,376 |
|
|
$ |
10,041 |
|
|
$ |
10,030 |
|
|
|
|
|
|
|
|
|
|
|
|
|
|
|
|
|
|
|
|
|
|
|
| |
|
|
|
|
|
|
|
|
|
|
|
|
|
|
|
|
|
|
|
|
|
|
|
|
|
|
|
|
|
|
|
|
|
|
|
|
|
|
|
|
|
|
| THE REDWOOD REVIEW 2ND QUARTER 2011 |
Table 7: Securities Portfolio Activity at Redwood
|
|
| |
Table 8A: Residential Prime Securities at Redwood and Underlying Loan Characteristics1
($ in thousands)
|
|
|
|
|
2011
|
|
|
2011
|
|
|
2010
|
|
|
2010
|
|
|
2010
|
|
|
2010
|
|
|
2009
|
|
|
2009
|
|
| |
|
Q2
|
|
|
Q1
|
|
|
Q4
|
|
|
Q3
|
|
|
Q2
|
|
|
cQ1
|
|
|
Q4
|
|
|
Q3
|
|
| |
|
|
|
|
|
|
|
|
|
|
|
|
|
|
|
|
|
|
|
|
|
|
|
|
|
Senior AFS
|
|
$ |
285,946 |
|
|
$ |
306,192 |
|
|
$ |
315,891 |
|
|
$ |
315,934 |
|
|
$ |
309,702 |
|
|
$ |
372,140 |
|
|
$ |
329,208 |
|
|
$ |
336,659 |
|
|
Subordinate AFS
|
|
|
71,543 |
|
|
|
58,870 |
|
|
|
53,846 |
|
|
|
33,024 |
|
|
|
16,024 |
|
|
|
16,250 |
|
|
|
19,191 |
|
|
|
21,449 |
|
|
Fair value
|
|
|
302 |
|
|
|
369 |
|
|
|
386 |
|
|
|
360 |
|
|
|
382 |
|
|
|
346 |
|
|
|
319 |
|
|
|
477 |
|
|
Total Residential Prime Securities
|
|
$ |
357,791 |
|
|
$ |
365,431 |
|
|
$ |
370,123 |
|
|
$ |
349,318 |
|
|
$ |
326,108 |
|
|
$ |
388,736 |
|
|
$ |
348,718 |
|
|
$ |
358,585 |
|
| |
|
|
|
|
|
|
|
|
|
|
|
|
|
|
|
|
|
|
|
|
|
|
|
|
|
|
|
|
|
|
|
|
|
Number of loans
|
|
|
101,149 |
|
|
|
109,221 |
|
|
|
121,173 |
|
|
|
124,536 |
|
|
|
140,951 |
|
|
|
156,375 |
|
|
|
168,449 |
|
|
|
184,849 |
|
|
Total loan face
|
|
$ |
39,160,316 |
|
|
$ |
43,242,656 |
|
|
$ |
49,071,513 |
|
|
$ |
52,490,472 |
|
|
$ |
59,814,476 |
|
|
$ |
71,413,439 |
|
|
$ |
76,332,218 |
|
|
$ |
84,519,707 |
|
|
Average loan size
|
|
$ |
387 |
|
|
$ |
396 |
|
|
$ |
405 |
|
|
$ |
421 |
|
|
$ |
424 |
|
|
$ |
457 |
|
|
$ |
453 |
|
|
$ |
457 |
|
| |
|
|
|
|
|
|
|
|
|
|
|
|
|
|
|
|
|
|
|
|
|
|
|
|
|
|
|
|
|
|
|
|
|
Year 2008 origination
|
|
|
0 |
% |
|
|
0 |
% |
|
|
0 |
% |
|
|
0 |
% |
|
|
0 |
% |
|
|
0 |
% |
|
|
1 |
% |
|
|
0 |
% |
|
Year 2007 origination
|
|
|
9 |
% |
|
|
10 |
% |
|
|
9 |
% |
|
|
11 |
% |
|
|
7 |
% |
|
|
10 |
% |
|
|
10 |
% |
|
|
9 |
% |
|
Year 2006 origination
|
|
|
1 |
% |
|
|
11 |
% |
|
|
11 |
% |
|
|
11 |
% |
|
|
14 |
% |
|
|
12 |
% |
|
|
12 |
% |
|
|
12 |
% |
|
Year 2005 origination
|
|
|
18 |
% |
|
|
17 |
% |
|
|
17 |
% |
|
|
16 |
% |
|
|
20 |
% |
|
|
21 |
% |
|
|
19 |
% |
|
|
20 |
% |
|
Year 2004 origination and earlier
|
|
|
72 |
% |
|
|
62 |
% |
|
|
63 |
% |
|
|
62 |
% |
|
|
59 |
% |
|
|
57 |
% |
|
|
58 |
% |
|
|
59 |
% |
| |
|
|
|
|
|
|
|
|
|
|
|
|
|
|
|
|
|
|
|
|
|
|
|
|
|
|
|
|
|
|
|
|
|
Geographic concentration
|
|
|
|
|
|
|
|
|
|
|
|
|
|
|
|
|
|
|
|
|
|
|
|
|
|
|
|
|
|
|
|
|
|
Southern CA
|
|
|
24 |
% |
|
|
24 |
% |
|
|
24 |
% |
|
|
25 |
% |
|
|
25 |
% |
|
|
25 |
% |
|
|
25 |
% |
|
|
27 |
% |
|
Northern CA
|
|
|
21 |
% |
|
|
22 |
% |
|
|
22 |
% |
|
|
22 |
% |
|
|
22 |
% |
|
|
22 |
% |
|
|
22 |
% |
|
|
20 |
% |
|
New York
|
|
|
6 |
% |
|
|
6 |
% |
|
|
7 |
% |
|
|
7 |
% |
|
|
6 |
% |
|
|
7 |
% |
|
|
7 |
% |
|
|
6 |
% |
|
Florida
|
|
|
6 |
% |
|
|
6 |
% |
|
|
6 |
% |
|
|
6 |
% |
|
|
6 |
% |
|
|
6 |
% |
|
|
6 |
% |
|
|
7 |
% |
|
Virginia
|
|
|
4 |
% |
|
|
4 |
% |
|
|
4 |
% |
|
|
4 |
% |
|
|
4 |
% |
|
|
4 |
% |
|
|
4 |
% |
|
|
2 |
% |
|
New Jersey
|
|
|
3 |
% |
|
|
3 |
% |
|
|
3 |
% |
|
|
3 |
% |
|
|
3 |
% |
|
|
3 |
% |
|
|
3 |
% |
|
|
3 |
% |
|
Illinois
|
|
|
3 |
% |
|
|
3 |
% |
|
|
3 |
% |
|
|
3 |
% |
|
|
3 |
% |
|
|
3 |
% |
|
|
3 |
% |
|
|
2 |
% |
|
Other states
|
|
|
33 |
% |
|
|
32 |
% |
|
|
31 |
% |
|
|
30 |
% |
|
|
31 |
% |
|
|
30 |
% |
|
|
30 |
% |
|
|
33 |
% |
| |
|
|
|
|
|
|
|
|
|
|
|
|
|
|
|
|
|
|
|
|
|
|
|
|
|
|
|
|
|
|
|
|
|
Wtd Avg Original LTV
|
|
|
68 |
% |
|
|
68 |
% |
|
|
68 |
% |
|
|
68 |
% |
|
|
68 |
% |
|
|
68 |
% |
|
|
68 |
% |
|
|
68 |
% |
|
Original LTV: 0 - 50
|
|
|
13 |
% |
|
|
12 |
% |
|
|
13 |
% |
|
|
13 |
% |
|
|
13 |
% |
|
|
13 |
% |
|
|
13 |
% |
|
|
13 |
% |
|
Original LTV: 50.01 - 60
|
|
|
12 |
% |
|
|
11 |
% |
|
|
12 |
% |
|
|
11 |
% |
|
|
12 |
% |
|
|
11 |
% |
|
|
11 |
% |
|
|
12 |
% |
|
Original LTV: 60.01 - 70
|
|
|
23 |
% |
|
|
22 |
% |
|
|
22 |
% |
|
|
22 |
% |
|
|
22 |
% |
|
|
22 |
% |
|
|
22 |
% |
|
|
22 |
% |
|
Original LTV: 70.01 - 80
|
|
|
48 |
% |
|
|
50 |
% |
|
|
49 |
% |
|
|
49 |
% |
|
|
50 |
% |
|
|
51 |
% |
|
|
50 |
% |
|
|
50 |
% |
|
Original LTV: 80.01 - 90
|
|
|
3 |
% |
|
|
3 |
% |
|
|
3 |
% |
|
|
3 |
% |
|
|
2 |
% |
|
|
2 |
% |
|
|
2 |
% |
|
|
2 |
% |
|
Original LTV: 90.01 - 100
|
|
|
1 |
% |
|
|
2 |
% |
|
|
1 |
% |
|
|
2 |
% |
|
|
1 |
% |
|
|
1 |
% |
|
|
1 |
% |
|
|
1 |
% |
|
Unknown
|
|
|
0 |
% |
|
|
0 |
% |
|
|
0 |
% |
|
|
0 |
% |
|
|
0 |
% |
|
|
0 |
% |
|
|
1 |
% |
|
|
0 |
% |
| |
|
|
|
|
|
|
|
|
|
|
|
|
|
|
|
|
|
|
|
|
|
|
|
|
|
|
|
|
|
|
|
|
|
Wtd Avg FICO
|
|
|
735 |
|
|
|
736 |
|
|
|
737 |
|
|
|
738 |
|
|
|
739 |
|
|
|
740 |
|
|
|
740 |
|
|
|
740 |
|
|
FICO: <= 680
|
|
|
11 |
% |
|
|
10 |
% |
|
|
10 |
% |
|
|
8 |
% |
|
|
9 |
% |
|
|
8 |
% |
|
|
8 |
% |
|
|
8 |
% |
|
FICO: 681 - 700
|
|
|
10 |
% |
|
|
10 |
% |
|
|
10 |
% |
|
|
10 |
% |
|
|
9 |
% |
|
|
9 |
% |
|
|
9 |
% |
|
|
9 |
% |
|
FICO: 701 - 720
|
|
|
14 |
% |
|
|
14 |
% |
|
|
14 |
% |
|
|
14 |
% |
|
|
14 |
% |
|
|
14 |
% |
|
|
14 |
% |
|
|
14 |
% |
|
FICO: 721 - 740
|
|
|
15 |
% |
|
|
14 |
% |
|
|
14 |
% |
|
|
15 |
% |
|
|
15 |
% |
|
|
14 |
% |
|
|
14 |
% |
|
|
14 |
% |
|
FICO: 741 - 760
|
|
|
16 |
% |
|
|
16 |
% |
|
|
16 |
% |
|
|
16 |
% |
|
|
16 |
% |
|
|
16 |
% |
|
|
16 |
% |
|
|
16 |
% |
|
FICO: 761 - 780
|
|
|
17 |
% |
|
|
18 |
% |
|
|
18 |
% |
|
|
19 |
% |
|
|
19 |
% |
|
|
19 |
% |
|
|
19 |
% |
|
|
19 |
% |
|
FICO: 781 - 800
|
|
|
12 |
% |
|
|
13 |
% |
|
|
13 |
% |
|
|
13 |
% |
|
|
13 |
% |
|
|
14 |
% |
|
|
14 |
% |
|
|
14 |
% |
|
FICO: >= 801
|
|
|
3 |
% |
|
|
3 |
% |
|
|
3 |
% |
|
|
3 |
% |
|
|
3 |
% |
|
|
4 |
% |
|
|
4 |
% |
|
|
4 |
% |
|
Unknown
|
|
|
2 |
% |
|
|
2 |
% |
|
|
2 |
% |
|
|
2 |
% |
|
|
3 |
% |
|
|
2 |
% |
|
|
2 |
% |
|
|
2 |
% |
| |
|
|
|
|
|
|
|
|
|
|
|
|
|
|
|
|
|
|
|
|
|
|
|
|
|
|
|
|
|
|
|
|
|
Conforming balance % (2)
|
|
|
60 |
% |
|
|
59 |
% |
|
|
59 |
% |
|
|
58 |
% |
|
|
58 |
% |
|
|
57 |
% |
|
|
58 |
% |
|
|
59 |
% |
|
> $1 MM %
|
|
|
8 |
% |
|
|
8 |
% |
|
|
9 |
% |
|
|
9 |
% |
|
|
9 |
% |
|
|
9 |
% |
|
|
9 |
% |
|
|
8 |
% |
| |
|
|
|
|
|
|
|
|
|
|
|
|
|
|
|
|
|
|
|
|
|
|
|
|
|
|
|
|
|
|
|
|
|
2nd Home %
|
|
|
7 |
% |
|
|
7 |
% |
|
|
7 |
% |
|
|
7 |
% |
|
|
7 |
% |
|
|
7 |
% |
|
|
7 |
% |
|
|
7 |
% |
|
Investment Home %
|
|
|
2 |
% |
|
|
2 |
% |
|
|
2 |
% |
|
|
2 |
% |
|
|
2 |
% |
|
|
2 |
% |
|
|
2 |
% |
|
|
2 |
% |
| |
|
|
|
|
|
|
|
|
|
|
|
|
|
|
|
|
|
|
|
|
|
|
|
|
|
|
|
|
|
|
|
|
|
Purchase
|
|
|
39 |
% |
|
|
42 |
% |
|
|
42 |
% |
|
|
43 |
% |
|
|
43 |
% |
|
|
45 |
% |
|
|
44 |
% |
|
|
44 |
% |
|
Cash Out Refi
|
|
|
23 |
% |
|
|
23 |
% |
|
|
23 |
% |
|
|
22 |
% |
|
|
22 |
% |
|
|
22 |
% |
|
|
22 |
% |
|
|
22 |
% |
|
Rate-Term Refi
|
|
|
37 |
% |
|
|
34 |
% |
|
|
34 |
% |
|
|
34 |
% |
|
|
34 |
% |
|
|
33 |
% |
|
|
33 |
% |
|
|
33 |
% |
|
Other
|
|
|
1 |
% |
|
|
1 |
% |
|
|
1 |
% |
|
|
1 |
% |
|
|
1 |
% |
|
|
0 |
% |
|
|
1 |
% |
|
|
1 |
% |
| |
|
|
|
|
|
|
|
|
|
|
|
|
|
|
|
|
|
|
|
|
|
|
|
|
|
|
|
|
|
|
|
|
|
Full Doc
|
|
|
51 |
% |
|
|
50 |
% |
|
|
50 |
% |
|
|
50 |
% |
|
|
55 |
% |
|
|
55 |
% |
|
|
55 |
% |
|
|
55 |
% |
|
No Doc
|
|
|
6 |
% |
|
|
5 |
% |
|
|
6 |
% |
|
|
5 |
% |
|
|
5 |
% |
|
|
5 |
% |
|
|
5 |
% |
|
|
5 |
% |
|
Other Doc (Lim, Red, Stated, etc)
|
|
|
40 |
% |
|
|
42 |
% |
|
|
41 |
% |
|
|
42 |
% |
|
|
38 |
% |
|
|
37 |
% |
|
|
37 |
% |
|
|
37 |
% |
|
Unknown/Not Categorized
|
|
|
3 |
% |
|
|
3 |
% |
|
|
3 |
% |
|
|
3 |
% |
|
|
2 |
% |
|
|
3 |
% |
|
|
3 |
% |
|
|
3 |
% |
| |
|
|
|
|
|
|
|
|
|
|
|
|
|
|
|
|
|
|
|
|
|
|
|
|
|
|
|
|
|
|
|
|
|
2-4 Family
|
|
|
1 |
% |
|
|
1 |
% |
|
|
2 |
% |
|
|
1 |
% |
|
|
1 |
% |
|
|
2 |
% |
|
|
2 |
% |
|
|
1 |
% |
|
Condo
|
|
|
9 |
% |
|
|
10 |
% |
|
|
10 |
% |
|
|
10 |
% |
|
|
10 |
% |
|
|
10 |
% |
|
|
10 |
% |
|
|
10 |
% |
|
Single Family
|
|
|
89 |
% |
|
|
88 |
% |
|
|
87 |
% |
|
|
88 |
% |
|
|
87 |
% |
|
|
87 |
% |
|
|
87 |
% |
|
|
88 |
% |
|
Other
|
|
|
1 |
% |
|
|
1 |
% |
|
|
1 |
% |
|
|
1 |
% |
|
|
1 |
% |
|
|
1 |
% |
|
|
1 |
% |
|
|
1 |
% |
| |
|
|
|
|
|
|
|
|
|
|
|
|
|
|
|
|
|
|
|
|
|
|
|
|
|
|
|
|
|
|
|
|
(1) Only the loan groups providing direct cash flow to securities we own are included.
(2) The definition of a conforming loan has significantly changed over time. For all periods shown in this table, the conforming balance definition available in June 2011 was used (which had a maximum loan balance of $729,750).
| THE REDWOOD REVIEW 2ND QUARTER 2011 |
Table 8A: Residential Prime Securities at Redwood
and Underlying Loan Characteristics
|
49 |
| |
Table 8B: Residential Non-Prime Securities at Redwood and Underlying Loan Characteristics1
($ in thousands)
|
50 |
|
|
|
2011
|
|
|
2011
|
|
|
2010
|
|
|
2010
|
|
|
2010
|
|
|
2010
|
|
|
2009
|
|
|
2009
|
|
| |
|
Q2
|
|
|
Q1
|
|
|
Q4
|
|
|
Q3
|
|
|
Q2
|
|
|
Q1
|
|
|
Q4
|
|
|
Q3
|
|
| |
|
|
|
|
|
|
|
|
|
|
|
|
|
|
|
|
|
|
|
|
|
|
|
|
|
Senior AFS
|
|
$ |
288,718 |
|
|
$ |
297,758 |
|
|
$ |
326,365 |
|
|
$ |
332,829 |
|
|
$ |
303,635 |
|
|
$ |
349,141 |
|
|
$ |
308,869 |
|
|
$ |
276,499 |
|
|
Subordinate AFS
|
|
|
10,877 |
|
|
|
12,028 |
|
|
|
13,188 |
|
|
|
9,812 |
|
|
|
9,842 |
|
|
|
6,353 |
|
|
|
1,077 |
|
|
|
981 |
|
|
Fair value
|
|
|
18,845 |
|
|
|
19,036 |
|
|
|
19,930 |
|
|
|
21,506 |
|
|
|
16,950 |
|
|
|
18,422 |
|
|
|
6,301 |
|
|
|
2,725 |
|
|
Total Residential Non-prime Securities
|
|
$ |
318,440 |
|
|
$ |
328,822 |
|
|
$ |
359,483 |
|
|
$ |
364,147 |
|
|
$ |
330,427 |
|
|
$ |
373,916 |
|
|
$ |
316,247 |
|
|
$ |
280,205 |
|
| |
|
|
|
|
|
|
|
|
|
|
|
|
|
|
|
|
|
|
|
|
|
|
|
|
|
|
|
|
|
|
|
|
|
Number of loans
|
|
|
55,830 |
|
|
|
57,542 |
|
|
|
65,949 |
|
|
|
67,713 |
|
|
|
72,621 |
|
|
|
79,448 |
|
|
|
73,102 |
|
|
|
73,970 |
|
|
Total loan face
|
|
$ |
12,250,760 |
|
|
$ |
12,723,531 |
|
|
$ |
14,615,940 |
|
|
$ |
15,181,465 |
|
|
$ |
16,931,963 |
|
|
$ |
19,644,742 |
|
|
$ |
20,445,051 |
|
|
$ |
21,588,255 |
|
|
Average loan size
|
|
$ |
219 |
|
|
$ |
221 |
|
|
$ |
222 |
|
|
$ |
224 |
|
|
$ |
233 |
|
|
$ |
247 |
|
|
$ |
280 |
|
|
$ |
292 |
|
| |
|
|
|
|
|
|
|
|
|
|
|
|
|
|
|
|
|
|
|
|
|
|
|
|
|
|
|
|
|
|
|
|
|
Year 2008 origination
|
|
|
0 |
% |
|
|
0 |
% |
|
|
0 |
% |
|
|
0 |
% |
|
|
0 |
% |
|
|
0 |
% |
|
|
0 |
% |
|
|
0 |
% |
|
Year 2007 origination
|
|
|
0 |
% |
|
|
0 |
% |
|
|
0 |
% |
|
|
0 |
% |
|
|
7 |
% |
|
|
10 |
% |
|
|
11 |
% |
|
|
22 |
% |
|
Year 2006 origination
|
|
|
15 |
% |
|
|
15 |
% |
|
|
18 |
% |
|
|
18 |
% |
|
|
18 |
% |
|
|
9 |
% |
|
|
5 |
% |
|
|
8 |
% |
|
Year 2005 origination
|
|
|
50 |
% |
|
|
50 |
% |
|
|
49 |
% |
|
|
49 |
% |
|
|
45 |
% |
|
|
50 |
% |
|
|
47 |
% |
|
|
36 |
% |
|
Year 2004 origination and earlier
|
|
|
35 |
% |
|
|
35 |
% |
|
|
33 |
% |
|
|
33 |
% |
|
|
30 |
% |
|
|
31 |
% |
|
|
37 |
% |
|
|
34 |
% |
| |
|
|
|
|
|
|
|
|
|
|
|
|
|
|
|
|
|
|
|
|
|
|
|
|
|
|
|
|
|
|
|
|
|
Geographic concentration
|
|
|
|
|
|
|
|
|
|
|
|
|
|
|
|
|
|
|
|
|
|
|
|
|
|
|
|
|
|
|
Southern CA
|
|
|
21 |
% |
|
|
21 |
% |
|
|
20 |
% |
|
|
21 |
% |
|
|
22 |
% |
|
|
23 |
% |
|
|
25 |
% |
|
|
26 |
% |
|
Northern CA
|
|
|
15 |
% |
|
|
14 |
% |
|
|
14 |
% |
|
|
14 |
% |
|
|
14 |
% |
|
|
17 |
% |
|
|
18 |
% |
|
|
16 |
% |
|
Florida
|
|
|
9 |
% |
|
|
9 |
% |
|
|
9 |
% |
|
|
9 |
% |
|
|
9 |
% |
|
|
8 |
% |
|
|
8 |
% |
|
|
9 |
% |
|
New York
|
|
|
5 |
% |
|
|
5 |
% |
|
|
5 |
% |
|
|
5 |
% |
|
|
5 |
% |
|
|
5 |
% |
|
|
5 |
% |
|
|
5 |
% |
|
Virginia
|
|
|
3 |
% |
|
|
3 |
% |
|
|
4 |
% |
|
|
4 |
% |
|
|
4 |
% |
|
|
3 |
% |
|
|
3 |
% |
|
|
4 |
% |
|
New Jersey
|
|
|
3 |
% |
|
|
3 |
% |
|
|
3 |
% |
|
|
3 |
% |
|
|
4 |
% |
|
|
3 |
% |
|
|
4 |
% |
|
|
2 |
% |
|
Illinois
|
|
|
3 |
% |
|
|
3 |
% |
|
|
3 |
% |
|
|
3 |
% |
|
|
3 |
% |
|
|
3 |
% |
|
|
3 |
% |
|
|
2 |
% |
|
Other states
|
|
|
41 |
% |
|
|
42 |
% |
|
|
42 |
% |
|
|
41 |
% |
|
|
40 |
% |
|
|
38 |
% |
|
|
34 |
% |
|
|
36 |
% |
| |
|
|
|
|
|
|
|
|
|
|
|
|
|
|
|
|
|
|
|
|
|
|
|
|
|
|
|
|
|
|
|
|
|
Wtd Avg Original LTV
|
|
|
73 |
% |
|
|
73 |
% |
|
|
73 |
% |
|
|
73 |
% |
|
|
73 |
% |
|
|
73 |
% |
|
|
73 |
% |
|
|
74 |
% |
|
Original LTV: 0 - 50
|
|
|
7 |
% |
|
|
6 |
% |
|
|
7 |
% |
|
|
7 |
% |
|
|
7 |
% |
|
|
6 |
% |
|
|
5 |
% |
|
|
5 |
% |
|
Original LTV: 50.01 - 60
|
|
|
8 |
% |
|
|
8 |
% |
|
|
8 |
% |
|
|
8 |
% |
|
|
8 |
% |
|
|
8 |
% |
|
|
8 |
% |
|
|
7 |
% |
|
Original LTV: 60.01 - 70
|
|
|
18 |
% |
|
|
18 |
% |
|
|
18 |
% |
|
|
18 |
% |
|
|
18 |
% |
|
|
18 |
% |
|
|
19 |
% |
|
|
17 |
% |
|
Original LTV: 70.01 - 80
|
|
|
58 |
% |
|
|
58 |
% |
|
|
58 |
% |
|
|
58 |
% |
|
|
58 |
% |
|
|
58 |
% |
|
|
59 |
% |
|
|
59 |
% |
|
Original LTV: 80.01 - 90
|
|
|
6 |
% |
|
|
7 |
% |
|
|
6 |
% |
|
|
6 |
% |
|
|
6 |
% |
|
|
7 |
% |
|
|
6 |
% |
|
|
8 |
% |
|
Original LTV: 90.01 - 100
|
|
|
3 |
% |
|
|
3 |
% |
|
|
3 |
% |
|
|
3 |
% |
|
|
3 |
% |
|
|
3 |
% |
|
|
3 |
% |
|
|
4 |
% |
|
Unknown
|
|
|
0 |
% |
|
|
0 |
% |
|
|
0 |
% |
|
|
0 |
% |
|
|
0 |
% |
|
|
0 |
% |
|
|
0 |
% |
|
|
0 |
% |
| |
|
|
|
|
|
|
|
|
|
|
|
|
|
|
|
|
|
|
|
|
|
|
|
|
|
|
|
|
|
|
|
|
|
Wtd Avg FICO
|
|
|
710 |
|
|
|
711 |
|
|
|
711 |
|
|
|
711 |
|
|
|
711 |
|
|
|
712 |
|
|
|
712 |
|
|
|
707 |
|
|
FICO: <= 680
|
|
|
27 |
% |
|
|
27 |
% |
|
|
28 |
% |
|
|
27 |
% |
|
|
27 |
% |
|
|
26 |
% |
|
|
26 |
% |
|
|
30 |
% |
|
FICO: 681 - 700
|
|
|
14 |
% |
|
|
14 |
% |
|
|
14 |
% |
|
|
14 |
% |
|
|
14 |
% |
|
|
14 |
% |
|
|
15 |
% |
|
|
15 |
% |
|
FICO: 701 - 720
|
|
|
14 |
% |
|
|
14 |
% |
|
|
14 |
% |
|
|
14 |
% |
|
|
14 |
% |
|
|
15 |
% |
|
|
15 |
% |
|
|
14 |
% |
|
FICO: 721 - 740
|
|
|
12 |
% |
|
|
12 |
% |
|
|
12 |
% |
|
|
12 |
% |
|
|
12 |
% |
|
|
13 |
% |
|
|
13 |
% |
|
|
12 |
% |
|
FICO: 741 - 760
|
|
|
12 |
% |
|
|
12 |
% |
|
|
11 |
% |
|
|
12 |
% |
|
|
11 |
% |
|
|
12 |
% |
|
|
11 |
% |
|
|
11 |
% |
|
FICO: 761 - 780
|
|
|
10 |
% |
|
|
10 |
% |
|
|
10 |
% |
|
|
10 |
% |
|
|
10 |
% |
|
|
10 |
% |
|
|
10 |
% |
|
|
9 |
% |
|
FICO: 781 - 800
|
|
|
7 |
% |
|
|
7 |
% |
|
|
7 |
% |
|
|
7 |
% |
|
|
7 |
% |
|
|
7 |
% |
|
|
7 |
% |
|
|
6 |
% |
|
FICO: >= 801
|
|
|
2 |
% |
|
|
2 |
% |
|
|
2 |
% |
|
|
2 |
% |
|
|
2 |
% |
|
|
2 |
% |
|
|
2 |
% |
|
|
2 |
% |
|
Unknown
|
|
|
2 |
% |
|
|
2 |
% |
|
|
2 |
% |
|
|
2 |
% |
|
|
2 |
% |
|
|
1 |
% |
|
|
1 |
% |
|
|
1 |
% |
| |
|
|
|
|
|
|
|
|
|
|
|
|
|
|
|
|
|
|
|
|
|
|
|
|
|
|
|
|
|
|
|
|
|
Conforming balance % (2)
|
|
|
86 |
% |
|
|
86 |
% |
|
|
86 |
% |
|
|
86 |
% |
|
|
85 |
% |
|
|
81 |
% |
|
|
76 |
% |
|
|
74 |
% |
|
> $1 MM %
|
|
|
3 |
% |
|
|
3 |
% |
|
|
3 |
% |
|
|
3 |
% |
|
|
4 |
% |
|
|
6 |
% |
|
|
9 |
% |
|
|
9 |
% |
| |
|
|
|
|
|
|
|
|
|
|
|
|
|
|
|
|
|
|
|
|
|
|
|
|
|
|
|
|
|
|
|
|
|
2nd Home %
|
|
|
4 |
% |
|
|
4 |
% |
|
|
4 |
% |
|
|
4 |
% |
|
|
4 |
% |
|
|
5 |
% |
|
|
5 |
% |
|
|
5 |
% |
|
Investment Home %
|
|
|
13 |
% |
|
|
13 |
% |
|
|
13 |
% |
|
|
13 |
% |
|
|
13 |
% |
|
|
11 |
% |
|
|
9 |
% |
|
|
8 |
% |
| |
|
|
|
|
|
|
|
|
|
|
|
|
|
|
|
|
|
|
|
|
|
|
|
|
|
|
|
|
|
|
|
|
|
Purchase
|
|
|
41 |
% |
|
|
42 |
% |
|
|
42 |
% |
|
|
42 |
% |
|
|
40 |
% |
|
|
39 |
% |
|
|
40 |
% |
|
|
40 |
% |
|
Cash Out Refi
|
|
|
42 |
% |
|
|
41 |
% |
|
|
41 |
% |
|
|
41 |
% |
|
|
41 |
% |
|
|
42 |
% |
|
|
42 |
% |
|
|
42 |
% |
|
Rate-Term Refi
|
|
|
16 |
% |
|
|
16 |
% |
|
|
16 |
% |
|
|
16 |
% |
|
|
18 |
% |
|
|
18 |
% |
|
|
17 |
% |
|
|
17 |
% |
|
Other
|
|
|
1 |
% |
|
|
1 |
% |
|
|
1 |
% |
|
|
1 |
% |
|
|
1 |
% |
|
|
1 |
% |
|
|
1 |
% |
|
|
1 |
% |
| |
|
|
|
|
|
|
|
|
|
|
|
|
|
|
|
|
|
|
|
|
|
|
|
|
|
|
|
|
|
|
|
|
|
Full Doc
|
|
|
38 |
% |
|
|
39 |
% |
|
|
38 |
% |
|
|
38 |
% |
|
|
36 |
% |
|
|
37 |
% |
|
|
34 |
% |
|
|
34 |
% |
|
No Doc
|
|
|
4 |
% |
|
|
4 |
% |
|
|
3 |
% |
|
|
3 |
% |
|
|
3 |
% |
|
|
3 |
% |
|
|
2 |
% |
|
|
2 |
% |
|
Other Doc (Lim, Red, Stated, etc)
|
|
|
56 |
% |
|
|
56 |
% |
|
|
57 |
% |
|
|
57 |
% |
|
|
59 |
% |
|
|
59 |
% |
|
|
62 |
% |
|
|
62 |
% |
|
Unknown/Not Categorized
|
|
|
2 |
% |
|
|
1 |
% |
|
|
2 |
% |
|
|
2 |
% |
|
|
2 |
% |
|
|
1 |
% |
|
|
2 |
% |
|
|
2 |
% |
| |
|
|
|
|
|
|
|
|
|
|
|
|
|
|
|
|
|
|
|
|
|
|
|
|
|
|
|
|
|
|
|
|
|
2-4 Family
|
|
|
8 |
% |
|
|
8 |
% |
|
|
8 |
% |
|
|
8 |
% |
|
|
8 |
% |
|
|
6 |
% |
|
|
5 |
% |
|
|
5 |
% |
|
Condo
|
|
|
8 |
% |
|
|
8 |
% |
|
|
8 |
% |
|
|
8 |
% |
|
|
8 |
% |
|
|
8 |
% |
|
|
9 |
% |
|
|
9 |
% |
|
Single Family
|
|
|
84 |
% |
|
|
84 |
% |
|
|
84 |
% |
|
|
84 |
% |
|
|
84 |
% |
|
|
86 |
% |
|
|
86 |
% |
|
|
86 |
% |
|
Other
|
|
|
0 |
% |
|
|
0 |
% |
|
|
0 |
% |
|
|
0 |
% |
|
|
0 |
% |
|
|
0 |
% |
|
|
0 |
% |
|
|
0 |
% |
| |
|
|
|
|
|
|
|
|
|
|
|
|
|
|
|
|
|
|
|
|
|
|
|
|
|
|
|
|
|
|
|
|
(1) Only the loan groups providing direct cash flow to securities we own are included.
(2) The definition of a conforming loan has significantly changed over time. For all periods shown in this table, the conforming balance definition available in June 2011 was used (which had a maximum loan balance of $729,750).
| THE REDWOOD REVIEW 2ND QUARTER 2011 |
Table 8B: Residential Non-Prime Securities at Redwood
and Underlying Loan Characteristics
|
|
| |
Table 9: Residential Real Estate Loan Characteristics1 ($ in thousands)
|
|
|
|
|
2011
|
|
|
2011
|
|
|
2010
|
|
|
2010
|
|
|
2010
|
|
|
2010
|
|
|
2009
|
|
|
2009
|
|
| |
|
Q2
|
|
|
Q1
|
|
|
Q4
|
|
|
Q3
|
|
|
Q2
|
|
|
Q1
|
|
|
Q4
|
|
|
Q3
|
|
| |
|
|
|
|
|
|
|
|
|
|
|
|
|
|
|
|
|
|
|
|
|
|
|
|
|
Residential loans
|
|
$ |
3,892,161 |
|
|
$ |
3,819,692 |
|
|
$ |
3,818,659 |
|
|
$ |
3,754,053 |
|
|
$ |
3,807,334 |
|
|
$ |
3,661,063 |
|
|
$ |
3,733,173 |
|
|
$ |
3,827,086 |
|
|
Number of loans
|
|
|
12,258 |
|
|
|
12,301 |
|
|
|
12,413 |
|
|
|
12,500 |
|
|
|
12,725 |
|
|
|
12,721 |
|
|
|
12,930 |
|
|
|
13,232 |
|
|
Average loan size
|
|
$ |
318 |
|
|
$ |
311 |
|
|
$ |
308 |
|
|
$ |
300 |
|
|
$ |
299 |
|
|
$ |
288 |
|
|
$ |
289 |
|
|
$ |
289 |
|
| |
|
|
|
|
|
|
|
|
|
|
|
|
|
|
|
|
|
|
|
|
|
|
|
|
|
|
|
|
|
|
|
|
|
Adjustable %
|
|
|
81 |
% |
|
|
84 |
% |
|
|
86 |
% |
|
|
90 |
% |
|
|
90 |
% |
|
|
96 |
% |
|
|
95 |
% |
|
|
95 |
% |
|
Hybrid %
|
|
|
10 |
% |
|
|
11 |
% |
|
|
10 |
% |
|
|
10 |
% |
|
|
10 |
% |
|
|
4 |
% |
|
|
5 |
% |
|
|
5 |
% |
|
Fixed %
|
|
|
9 |
% |
|
|
5 |
% |
|
|
4 |
% |
|
|
0 |
% |
|
|
0 |
% |
|
|
0 |
% |
|
|
0 |
% |
|
|
0 |
% |
| |
|
|
|
|
|
|
|
|
|
|
|
|
|
|
|
|
|
|
|
|
|
|
|
|
|
|
|
|
|
|
|
|
|
Amortizing %
|
|
|
11 |
% |
|
|
8 |
% |
|
|
7 |
% |
|
|
5 |
% |
|
|
4 |
% |
|
|
3 |
% |
|
|
3 |
% |
|
|
3 |
% |
|
Interest-only %
|
|
|
89 |
% |
|
|
92 |
% |
|
|
93 |
% |
|
|
95 |
% |
|
|
96 |
% |
|
|
97 |
% |
|
|
97 |
% |
|
|
97 |
% |
| |
|
|
|
|
|
|
|
|
|
|
|
|
|
|
|
|
|
|
|
|
|
|
|
|
|
|
|
|
|
|
|
|
|
Florida
|
|
|
12 |
% |
|
|
13 |
% |
|
|
13 |
% |
|
|
13 |
% |
|
|
13 |
% |
|
|
14 |
% |
|
|
14 |
% |
|
|
14 |
% |
|
Southern California
|
|
|
12 |
% |
|
|
11 |
% |
|
|
11 |
% |
|
|
11 |
% |
|
|
11 |
% |
|
|
11 |
% |
|
|
11 |
% |
|
|
11 |
% |
|
Northern California
|
|
|
12 |
% |
|
|
11 |
% |
|
|
11 |
% |
|
|
10 |
% |
|
|
9 |
% |
|
|
8 |
% |
|
|
8 |
% |
|
|
8 |
% |
|
New York
|
|
|
8 |
% |
|
|
8 |
% |
|
|
7 |
% |
|
|
8 |
% |
|
|
8 |
% |
|
|
7 |
% |
|
|
7 |
% |
|
|
7 |
% |
|
Georgia
|
|
|
5 |
% |
|
|
5 |
% |
|
|
5 |
% |
|
|
5 |
% |
|
|
5 |
% |
|
|
5 |
% |
|
|
5 |
% |
|
|
5 |
% |
|
New Jersey
|
|
|
4 |
% |
|
|
4 |
% |
|
|
4 |
% |
|
|
4 |
% |
|
|
4 |
% |
|
|
5 |
% |
|
|
5 |
% |
|
|
4 |
% |
|
Texas
|
|
|
5 |
% |
|
|
5 |
% |
|
|
5 |
% |
|
|
5 |
% |
|
|
5 |
% |
|
|
5 |
% |
|
|
5 |
% |
|
|
5 |
% |
|
Colorado
|
|
|
3 |
% |
|
|
4 |
% |
|
|
4 |
% |
|
|
4 |
% |
|
|
4 |
% |
|
|
4 |
% |
|
|
4 |
% |
|
|
4 |
% |
|
Virginia
|
|
|
3 |
% |
|
|
3 |
% |
|
|
3 |
% |
|
|
3 |
% |
|
|
3 |
% |
|
|
3 |
% |
|
|
3 |
% |
|
|
3 |
% |
|
Arizona
|
|
|
2 |
% |
|
|
2 |
% |
|
|
2 |
% |
|
|
2 |
% |
|
|
2 |
% |
|
|
2 |
% |
|
|
2 |
% |
|
|
3 |
% |
|
Illinois
|
|
|
2 |
% |
|
|
2 |
% |
|
|
2 |
% |
|
|
2 |
% |
|
|
3 |
% |
|
|
2 |
% |
|
|
2 |
% |
|
|
2 |
% |
|
Other states
|
|
|
32 |
% |
|
|
32 |
% |
|
|
33 |
% |
|
|
33 |
% |
|
|
33 |
% |
|
|
34 |
% |
|
|
34 |
% |
|
|
34 |
% |
| |
|
|
|
|
|
|
|
|
|
|
|
|
|
|
|
|
|
|
|
|
|
|
|
|
|
|
|
|
|
|
|
|
|
Year 2011 origination
|
|
|
3 |
% |
|
|
0 |
% |
|
|
0 |
% |
|
|
0 |
% |
|
|
0 |
% |
|
|
0 |
% |
|
|
0 |
% |
|
|
0 |
% |
|
Year 2010 origination
|
|
|
8 |
% |
|
|
7 |
% |
|
|
5 |
% |
|
|
2 |
% |
|
|
0 |
% |
|
|
0 |
% |
|
|
0 |
% |
|
|
0 |
% |
|
Year 2009 origination
|
|
|
4 |
% |
|
|
5 |
% |
|
|
5 |
% |
|
|
5 |
% |
|
|
6 |
% |
|
|
0 |
% |
|
|
0 |
% |
|
|
0 |
% |
|
Year 2008 origination
|
|
|
0 |
% |
|
|
0 |
% |
|
|
0 |
% |
|
|
0 |
% |
|
|
0 |
% |
|
|
0 |
% |
|
|
0 |
% |
|
|
0 |
% |
|
Year 2007 origination
|
|
|
2 |
% |
|
|
2 |
% |
|
|
2 |
% |
|
|
2 |
% |
|
|
2 |
% |
|
|
2 |
% |
|
|
2 |
% |
|
|
2 |
% |
|
Year 2006 origination
|
|
|
5 |
% |
|
|
5 |
% |
|
|
5 |
% |
|
|
5 |
% |
|
|
5 |
% |
|
|
6 |
% |
|
|
6 |
% |
|
|
5 |
% |
|
Year 2005 origination
|
|
|
3 |
% |
|
|
4 |
% |
|
|
4 |
% |
|
|
4 |
% |
|
|
4 |
% |
|
|
4 |
% |
|
|
4 |
% |
|
|
4 |
% |
|
Year 2004 origination or earlier
|
|
|
75 |
% |
|
|
77 |
% |
|
|
79 |
% |
|
|
82 |
% |
|
|
83 |
% |
|
|
88 |
% |
|
|
88 |
% |
|
|
89 |
% |
| |
|
|
|
|
|
|
|
|
|
|
|
|
|
|
|
|
|
|
|
|
|
|
|
|
|
|
|
|
|
|
|
|
|
Wtd Avg Original LTV
|
|
|
66 |
% |
|
|
66 |
% |
|
|
66 |
% |
|
|
66 |
% |
|
|
66 |
% |
|
|
67 |
% |
|
|
67 |
% |
|
|
67 |
% |
|
Original LTV: 0 - 50
|
|
|
19 |
% |
|
|
19 |
% |
|
|
19 |
% |
|
|
19 |
% |
|
|
19 |
% |
|
|
18 |
% |
|
|
18 |
% |
|
|
18 |
% |
|
Original LTV: 50 - 60
|
|
|
13 |
% |
|
|
13 |
% |
|
|
12 |
% |
|
|
12 |
% |
|
|
12 |
% |
|
|
11 |
% |
|
|
11 |
% |
|
|
11 |
% |
|
Original LTV: 60 - 70
|
|
|
21 |
% |
|
|
21 |
% |
|
|
21 |
% |
|
|
21 |
% |
|
|
20 |
% |
|
|
20 |
% |
|
|
20 |
% |
|
|
20 |
% |
|
Original LTV: 70 - 80
|
|
|
40 |
% |
|
|
40 |
% |
|
|
41 |
% |
|
|
41 |
% |
|
|
42 |
% |
|
|
43 |
% |
|
|
43 |
% |
|
|
43 |
% |
|
Original LTV: 80 - 90
|
|
|
2 |
% |
|
|
2 |
% |
|
|
2 |
% |
|
|
2 |
% |
|
|
2 |
% |
|
|
2 |
% |
|
|
2 |
% |
|
|
2 |
% |
|
Original LTV: 90 - 100
|
|
|
5 |
% |
|
|
5 |
% |
|
|
5 |
% |
|
|
5 |
% |
|
|
5 |
% |
|
|
6 |
% |
|
|
6 |
% |
|
|
6 |
% |
| |
|
|
|
|
|
|
|
|
|
|
|
|
|
|
|
|
|
|
|
|
|
|
|
|
|
|
|
|
|
|
|
|
|
Wtd Avg FICO
|
|
|
736 |
|
|
|
735 |
|
|
|
734 |
|
|
|
733 |
|
|
|
733 |
|
|
|
730 |
|
|
|
730 |
|
|
|
730 |
|
|
FICO: <= 600
|
|
|
1 |
% |
|
|
1 |
% |
|
|
1 |
% |
|
|
1 |
% |
|
|
1 |
% |
|
|
1 |
% |
|
|
1 |
% |
|
|
1 |
% |
|
FICO: 601 -620
|
|
|
1 |
% |
|
|
1 |
% |
|
|
1 |
% |
|
|
1 |
% |
|
|
1 |
% |
|
|
1 |
% |
|
|
1 |
% |
|
|
1 |
% |
|
FICO: 621 - 640
|
|
|
2 |
% |
|
|
2 |
% |
|
|
2 |
% |
|
|
2 |
% |
|
|
2 |
% |
|
|
2 |
% |
|
|
2 |
% |
|
|
2 |
% |
|
FICO: 641 -660
|
|
|
3 |
% |
|
|
3 |
% |
|
|
3 |
% |
|
|
4 |
% |
|
|
4 |
% |
|
|
4 |
% |
|
|
4 |
% |
|
|
4 |
% |
|
FICO: 661 - 680
|
|
|
7 |
% |
|
|
7 |
% |
|
|
7 |
% |
|
|
7 |
% |
|
|
7 |
% |
|
|
8 |
% |
|
|
8 |
% |
|
|
8 |
% |
|
FICO: 681 - 700
|
|
|
10 |
% |
|
|
10 |
% |
|
|
11 |
% |
|
|
11 |
% |
|
|
11 |
% |
|
|
12 |
% |
|
|
12 |
% |
|
|
12 |
% |
|
FICO: 701 - 720
|
|
|
12 |
% |
|
|
13 |
% |
|
|
13 |
% |
|
|
13 |
% |
|
|
13 |
% |
|
|
13 |
% |
|
|
13 |
% |
|
|
13 |
% |
|
FICO: 721 - 740
|
|
|
13 |
% |
|
|
13 |
% |
|
|
13 |
% |
|
|
13 |
% |
|
|
13 |
% |
|
|
13 |
% |
|
|
13 |
% |
|
|
13 |
% |
|
FICO: 741 - 760
|
|
|
14 |
% |
|
|
14 |
% |
|
|
14 |
% |
|
|
14 |
% |
|
|
14 |
% |
|
|
14 |
% |
|
|
14 |
% |
|
|
14 |
% |
|
FICO: 761 - 780
|
|
|
18 |
% |
|
|
17 |
% |
|
|
17 |
% |
|
|
17 |
% |
|
|
17 |
% |
|
|
16 |
% |
|
|
16 |
% |
|
|
16 |
% |
|
FICO: 781 - 800
|
|
|
15 |
% |
|
|
15 |
% |
|
|
14 |
% |
|
|
13 |
% |
|
|
13 |
% |
|
|
12 |
% |
|
|
12 |
% |
|
|
12 |
% |
|
FICO: >= 801
|
|
|
4 |
% |
|
|
4 |
% |
|
|
4 |
% |
|
|
4 |
% |
|
|
4 |
% |
|
|
4 |
% |
|
|
4 |
% |
|
|
4 |
% |
| |
|
|
|
|
|
|
|
|
|
|
|
|
|
|
|
|
|
|
|
|
|
|
|
|
|
|
|
|
|
|
|
|
|
Conforming balance % (2)
|
|
|
49 |
% |
|
|
50 |
% |
|
|
51 |
% |
|
|
53 |
% |
|
|
53 |
% |
|
|
56 |
% |
|
|
56 |
% |
|
|
56 |
% |
|
% balance in loans > $1mm per loan
|
|
|
20 |
% |
|
|
20 |
% |
|
|
20 |
% |
|
|
18 |
% |
|
|
18 |
% |
|
|
16 |
% |
|
|
16 |
% |
|
|
16 |
% |
| |
|
|
|
|
|
|
|
|
|
|
|
|
|
|
|
|
|
|
|
|
|
|
|
|
|
|
|
|
|
|
|
|
|
2nd home %
|
|
|
11 |
% |
|
|
11 |
% |
|
|
12 |
% |
|
|
12 |
% |
|
|
12 |
% |
|
|
12 |
% |
|
|
12 |
% |
|
|
12 |
% |
|
Investment home %
|
|
|
3 |
% |
|
|
3 |
% |
|
|
4 |
% |
|
|
4 |
% |
|
|
4 |
% |
|
|
4 |
% |
|
|
4 |
% |
|
|
4 |
% |
| |
|
|
|
|
|
|
|
|
|
|
|
|
|
|
|
|
|
|
|
|
|
|
|
|
|
|
|
|
|
|
|
|
|
Purchase
|
|
|
32 |
% |
|
|
31 |
% |
|
|
31 |
% |
|
|
31 |
% |
|
|
31 |
% |
|
|
31 |
% |
|
|
31 |
% |
|
|
31 |
% |
|
Cash out refinance
|
|
|
31 |
% |
|
|
33 |
% |
|
|
33 |
% |
|
|
34 |
% |
|
|
34 |
% |
|
|
36 |
% |
|
|
36 |
% |
|
|
36 |
% |
|
Rate-term refinance
|
|
|
36 |
% |
|
|
35 |
% |
|
|
35 |
% |
|
|
34 |
% |
|
|
34 |
% |
|
|
31 |
% |
|
|
31 |
% |
|
|
31 |
% |
|
Other
|
|
|
1 |
% |
|
|
1 |
% |
|
|
1 |
% |
|
|
1 |
% |
|
|
1 |
% |
|
|
2 |
% |
|
|
2 |
% |
|
|
2 |
% |
| |
|
|
|
|
|
|
|
|
|
|
|
|
|
|
|
|
|
|
|
|
|
|
|
|
|
|
|
|
|
|
|
|
(1) This table presents characteristics of residential real estate loans held by consolidated Sequoia entities and residential real estate loans held by Redwood and intended to be securitized by future Sequoia entities.
(2) The definition of a conforming loan has significantly changed over time. For all periods shown in this table, the conforming balance definition available in June 2011 was used (which had a maximum loan balance of $729,750).
| THE REDWOOD REVIEW 2ND QUARTER 2011 |
Table 9: Residential Real Estate Loan Characteristics
|
51 |
This Page Intentionally Left Blank
Redwood Trust Corporate Information
|
EXECUTIVE OFFICERS:
|
|
DIRECTORS:
|
| |
|
|
|
Martin S. Hughes
|
|
George E. Bull, III
|
|
President and Chief Executive Officer
|
|
Chairman of the Board
|
| |
|
|
|
Brett D. Nicholas
|
|
Richard D. Baum
|
|
Executive Vice President, Chief Investment Officer, and
|
|
Former Chief Deputy Insurance
|
|
Chief Operating Officer
|
|
Commissioner for the State of California
|
| |
|
|
|
Diane L. Merdian
|
|
Thomas C. Brown
|
|
Chief Financial Officer
|
|
CEO and Principal Shareholder,
|
| |
|
Urban Bay Properties, Inc.
|
|
Harold F. Zagunis
|
|
COO, McGuire Real Estate
|
|
Chief Risk Officer
|
|
|
| |
|
Mariann Byerwalter
|
|
Scott M. Chisholm
|
|
Chairman, JDN Corporate Advisory LLC
|
|
Managing Director
|
|
|
| |
|
Douglas B. Hansen
|
|
John H. Isbrandtsen
|
|
Private Investor
|
|
Managing Director
|
|
|
|
|
|
Martin H. Hughes
|
|
Fred J. Matera
|
|
President and Chief Executive Officer
|
|
Managing Director
|
|
|
|
|
|
Greg H. Kubicek
|
|
Andrew P. Stone
|
|
President, The Holt Group, Inc.
|
|
General Counsel
|
|
|
|
|
|
Jeffrey T. Pero
|
| |
|
Retired Partner, Latham & Watkins LLP
|
| |
|
|
|
STOCK LISTING:
|
|
Georganne C. Proctor
|
|
The Company’s common stock is traded
|
|
Former Chief Financial Officer, TIAA-CREF
|
|
on the New York Stock Exchange under
|
|
|
|
the symbol RWT
|
|
Charles J. Toeniskoetter
|
| |
|
Chairman, Toeniskoetter & Breeding, Inc. Development
|
|
CORPORATE HEADQUARTERS:
|
|
Chairman and CEO,
|
|
One Belvedere Place, Suite 300
|
|
Toeniskoetter Construction, Inc.
|
|
Mill Valley, California 94941
|
|
|
|
Telephone: (415) 389-7373
|
|
|
| |
|
INVESTOR RELATIONS:
|
|
NEW YORK OFFICE:
|
|
Mike McMahon
|
|
245 Park Avenue, 39th Floor
|
|
Managing Director
|
|
New York, New York 10167
|
|
|
| |
|
Paula Kwok
|
|
TRANSFER AGENT:
|
|
Assistant Vice President
|
|
Computershare Trust Company, N.A.
|
|
|
|
2 North LaSalle Street
|
|
|
|
Chicago, IL 60602
|
|
Investor Relations Hotline: (866) 269-4976
|
|
Telephone: (888) 472-1955
|
|
|
For more information about Redwood Trust, please visit our website at: www.redwoodtrust.com