
 |
 |
|
TABLE OF CONTENTS
|
| Introduction | 4 |
| Shareholder Letter | 5 |
| Quarterly Overview | 9 |
| Financial Insights | 12 |
| ► Book Value | 12 |
| ► Balance Sheet | 14 |
| ► GAAP Income | 18 |
| ► Taxable Income and Dividends | 22 |
| ► Cash Flow | 23 |
| Commercial Real Estate Business | 25 |
| New Sequoia Residential Mortgage Loan Business | 28 |
| Residential Real Estate Securities | 29 |
| Legacy Investments in Other Consolidated Entities | 32 |
| Appendix | |
| Accounting Discussion | 34 |
| Glossary | 35 |
| Financial Tables | 44 |
|
THE REDWOOD REVIEW 4TH QUARTER 2011
|
1
|
|
|
|
CAUTIONARY STATEMENT
|
This Redwood Review contains forward-looking statements within the meaning of the safe harbor provisions of the Private Securities Litigation Reform Act of 1995. Forward-looking statements involve numerous risks and uncertainties. Our actual results may differ from our expectations, estimates, and projections and, consequently, you should not rely on these forward-looking statements as predictions of future events. Forward-looking statements are not historical in nature and can be identified by words such as “anticipate,” “estimate,” “will,” “should,” “expect,” “believe,” “intend,” “seek,” “plan,” and similar expressions or their negative forms, or by references to strategy, plans, or intentions. These forward-looking statements are subject to risks and uncertainties, including, among other things, those described in our Annual Report on Form 10-K for the year ended December 31, 2011 under the caption “Risk Factors.” Other risks, uncertainties, and factors that could cause actual results to differ materially from those projected are described below and may be described from time to time in reports we file with the Securities and Exchange Commission, including reports on Forms 10-K, 10-Q, and 8-K. We undertake no obligation to update or revise forward-looking statements, whether as a result of new information, future events, or otherwise.
Statements regarding the following subjects, among others, are forward-looking by their nature: (i) our statements relating to improving our capital efficiency in 2012, enhancing during 2012 the returns on our existing investments through warehouse line funding of residential loans, the use leverage against our residential securities (which leverage we believe will be a prudent (or modest) amount), obtaining debt financing for our commercial loans, and getting our excess capital fully invested at attractive yields; (ii) our statements relating to our goal of delivering a growing stream of dividends through our residential and commercial credit businesses and our statements that our businesses are scalable (and, therefore, should help us improve our returns as our business volume increases) and hard for competitors to replicate; (iii) our statements relating to our competitive position and our ability to compete in the future, including our ability to effectively compete to acquire residential mortgage-backed securities and residential mortgage loans and our ability to compete to originate and acquire commercial real estate loans and other commercial real estate investments, including our statements that we expect an increased pace of residential loan acquisitions in 2012, that we expect to execute an increased number of securitizations of residential loans relative to 2011, and that reduced governmental participation in the mortgage finance market and new bank regulations will continue to cause banks to scale back their participation in the residential mortgage market to the advantage of smaller non-bank competitors (including ourselves); (iv) our statements relating to our future investment strategy, and our ability to find investments with attractive risk return profiles, including, without limitation, statements relating to our efforts to acquire residential mortgage loans, make commercial real estate investments (including that commercial real estate lending will likely provide the best opportunity for us to invest capital in 2012), and make residential investments in the secondary market (including that our expectation for 2012 is that we will invest $100 million of capital in secondary market residential securities investments with net levered yields on this invested capital of 11% to 14%); (v) our statements that we expect, overall, to invest $375 to $500 million of capital in 2012 and that we can generate the capital needed for the vast majority of this overall 2012 investment activity and our intended 2012 dividends on existing shares of common stock through cash from operations, principal payments from our investments, asset sales, and obtaining debt financing on our commercial loan portfolio; (vi) our statements that we expect to benefit from increasing our investment activity and that expected increased investment activity, net of funding costs, would contribute to net interest income beginning in the second half of 2012 and improved profitability in 2012; (vii) our statement that one of our goals for 2012 is to acquire approximately $2.0 billion of residential mortgage loans, our statements relating to acquiring the residential mortgage loans included in our pipeline of residential mortgage loans that we plan to purchase through our residential conduit program, including that, as of December 31, 2011 and February 15, 2012, there were $460 million and $461 million, respectively, of loans in our pipeline of residential mortgage loans that we planned to purchase; (viii) statements relating to future residential loan securitization and sale transactions, the timing of the completion of those future transactions, and the number and size of those transactions we expect to complete in 2012 and future periods, which future transactions may not be completed when planned or at all, and, more generally, statements regarding the likelihood and timing of, and our participation in, future transactions of these types and our ability to finance residential loan acquisitions through the execution of these types of transactions, and the profitability of these transactions; (ix) our statement that we expect to recover an aggregate of $9 million of loan loss reserves that relate to fourteen Sequoia securitization entities in future periods upon the payoff or deconsolidation of those entities; (x) our statements relating to the cash flows we expect to receive from our investments; (xi) our statement that we do not currently believe we will need to access the capital markets to raise capital during the first half of 2012 and our statement that we may not need to access the capital markets to raise capital in a material way in the second half of 2012; (xii) our statements relating to our estimates of our investment capacity (including that we estimate our investment capacity was $214 million at December 31, 2011), our short-term borrowing capacity (including the statement that it is our intent to finance the majority of our inventory of residential mortgage loans held for future securitization or sale on through short-term warehouse debt facilities), our excess capital, and the amount of cash we need to cover short-term operations, working capital, and a liquidity cushion; (xiii) our statements relating to future market and economic conditions and the future volume of transactions in those markets, including, without limitation, future conditions in the residential and commercial real estate markets and related financing markets (e.g., the CMBS market), and the related potential opportunities for our residential and commercial businesses; (xiv) our beliefs about, and our outlook for, the future direction of housing market fundamentals, including, without limitation, home prices, demand for housing, delinquency rates, foreclosure rates, prepayment rates, inventory of homes for sale, and mortgage interest rates and their potential impact on our business and results of operations and our belief that the housing market is in the process of forming a bottom and our expectation that housing, in general, will not be a significantly appreciating asset class for several years; (xv) our beliefs about the future direction of commercial real estate fundamentals and statements regarding the competitive landscape for, and availability of, financing for commercial real estate and our beliefs about whether trends in these areas are positive for our business (including our statements that we believe that the valuation of commercial real estate assets that we target for financing may continue to improve and that we believe that our commercial business is well positioned to grow regardless of instability in the CMBS financing sector); (xvi) our statements that we expect the increased level of commercial loan maturities coming due in the next several years will allow us to expand and sustain our commercial origination franchise and that we intend to hold (rather than sell) our commercial loans and investments; (xvii) our statement relating to originating between $200 and $300 million in subordinate commercial real estate debt in 2012 and our statement that our origination volumes for these types of investments could be outside of this range in any given quarter; (xviii) our statement that we intend to obtain in 2012 debt financing for our portfolio of commercial real estate loans and investments and our statement that we believe any such financing we obtain will represent a prudent level of debt financing for those loans and assets; (ixx) our statements relating to the impact on our business of legislative and regulatory changes that affect our business, the regulation of securitization transactions, and any reform of the GSEs, including Fannie Mae and Freddie Mac; (xx) our expectations regarding credit reserves, credit losses, the adequacy of credit support, and impairments and their impact on our investments (including as compared to our original expectations and credit reserve levels) and the timing of losses and impairments, and statements that the amount of credit reserves we designate may require changes in the future; (xxi) our expectations regarding future interest income and net interest income, future earnings, future earnings volatility, and future trends in operating expenses and the factors that may affect those trends, including that we expect the level of operating expense in the first quarter of 2012 to be similar to the level of operating expense in the fourth quarter of 2011; (xxii) our Board of Directors’ intention to pay a regular dividend of $0.25 per share per quarter in 2012; and (xxiii) our expectations and estimates relating to the characterization for income tax purposes of our 2011 dividend distributions and our expectations and estimates relating to tax accounting and our anticipation of additional credit losses for tax purposes in future periods over an estimated two-to-five year period (and the level of those expected losses).
|
2
|
THE REDWOOD REVIEW 4TH QUARTER 2011
|
|
|
|
|
CAUTIONARY STATEMENT
|
Important factors, among others, that may affect our actual results include: general economic trends, the performance of the housing, commercial real estate, mortgage, credit, and broader financial markets, and their effects on the prices of earning assets and the credit status of borrowers; federal and state legislative and regulatory developments, and the actions of governmental authorities, including those affecting the mortgage industry or our business; our exposure to credit risk and the timing of credit losses within our portfolio; the concentration of the credit risks we are exposed to, including due to the structure of assets we hold and the geographical concentration of real estate underlying assets we own; our exposure to adjustable-rate and negative amortization mortgage loans; the efficacy and expense of our efforts to manage or hedge credit risk, interest rate risk, and other financial and operational risks; changes in credit ratings on assets we own and changes in the rating agencies’ credit rating methodologies; changes in interest rates; changes in mortgage prepayment rates; the availability of assets for purchase at attractive prices and our ability to reinvest cash we hold; changes in the values of assets we own; changes in liquidity in the market for real estate securities and loans; our ability to finance the acquisition of real estate-related assets with short-term debt; the ability of counterparties to satisfy their obligations to us; our involvement in securitization transactions, the profitability of those transactions, and the risks we are exposed to in engaging in securitization transactions; exposure to claims and litigation, including litigation arising from our involvement in securitization transactions; whether we have sufficient liquid assets to meet short-term needs; our ability to successfully compete and retain or attract key personnel; our ability to adapt our business model and strategies to changing circumstances; changes in our investment, financing, and hedging strategies and new risks we may be exposed to if we expand our business activities; exposure to environmental liabilities and the effects of global climate change; failure to comply with applicable laws and regulations; our failure to maintain appropriate internal controls over financial reporting and disclosure controls and procedures; the impact on our reputation that could result from our actions or omissions or from those of others; changes in accounting principles and tax rules; our ability to maintain our status as a real estate investment trust (REIT) for tax purposes; limitations imposed on our business due to our REIT status and our status as exempt from registration under the Investment Company Act of 1940; decisions about raising, managing, and distributing capital; and other factors not presently identified.
This Redwood Review may contain statistics and other data that in some cases have been obtained from or compiled from information made available by servicers and other third-party service providers.
|
THE REDWOOD REVIEW 4TH QUARTER 2011
|
3
|
|
|
|
INTRODUCTION
|
Note to Readers:
We file annual reports (on Form 10-K) and quarterly reports (on Form 10-Q) with the Securities and Exchange Commission. These filings and our earnings press releases provide information about Redwood and our financial results in accordance with generally accepted accounting principles (GAAP). We urge you to review these documents, which are available through our web site, www.redwoodtrust.com.
This document, called The Redwood Review, is an additional format for providing information about Redwood through a discussion of many GAAP as well as non-GAAP metrics, such as taxable income and economic book value. Supplemental information is also provided in the Financial Tables in this Review to facilitate more detailed understanding and analysis of Redwood. When we use non-GAAP metrics it is because we believe that these figures provide additional insight into Redwood’s business. In each case in which we discuss a non-GAAP metric you will find an explanation of how it has been calculated, why we think the figure is important, and a reconciliation between the GAAP and non-GAAP figures.
References herein to “Redwood,” the “company,” “we,” “us,” and “our” include Redwood Trust, Inc. and its consolidated subsidiaries. References to “at Redwood” exclude all consolidated securitization entities (with the exception of the resecuritization we completed in the third quarter of 2011) in order to present our operations in the way management analyzes them.
Note that because we round numbers in the tables to millions, except per share amounts, some numbers may not foot due to rounding.
We hope you find this Review helpful to your understanding of our business. We thank you for your input and suggestions, which have resulted in our changing the form and content of The Redwood Review over time.
We welcome your continued interest and comments.
| Selected Financial Highlights | ||||||
| Quarter:Year | GAAP
Income (Loss) per Share |
Taxable Income (Loss) per Share(1) | Annualized GAAP Return on Equity | GAAP Book Value per Share | Non-GAAP Economic Value per Share (2) | Dividends per Share |
| Q409 | $0.51 | ($0.44) | 17% | $12.50 | $13.03 | $0.25 |
| Q110 | $0.58 | $0.01 | 19% | $12.84 | $13.32 | $0.25 |
| Q210 | $0.35 | ($0.03) | 11% | $12.71 | $13.37 | $0.25 |
| Q310 | $0.25 | ($0.11) | 8% | $13.02 | $13.73 | $0.25 |
| Q410 | $0.18 | ($0.07) | 6% | $13.63 | $14.31 | $0.25 |
| Q111 | $0.22 | $0.06 | 8% | $13.76 | $14.45 | $0.25 |
| Q211 | $0.11 | ($0.00) | 4% | $13.04 | $13.81 | $0.25 |
| Q311 | $0.01 | $0.07 | 1% | $12.22 | $13.33 | $0.25 |
| Q411 | ($0.03) | ($0.02) | -1% | $11.36 | $12.45 | $0.25 |
| (1) Taxable income (loss) per share for 2011 is an estimate until we file tax returns for that year. |
| (2) Non-GAAP economic value per share is calculated using estimated bid-side values (which take into account available bid-side marks) for our financial assets and estimated offer-side values (which take into account available offer-side marks) for our financial liabilities and we believe it more accurately reflects liquidation value than does GAAP book value per share. Non-GAAP economic value per share is reconciled to GAAP book value per share in the Financial Insights section and in Table 3 in the Financial Tables in this Review. |
|
4
|
THE REDWOOD REVIEW 4TH QUARTER 2011
|
|
|
 |
|
SHAREHOLDER LETTER
|
Dear Fellow Shareholders:
As we close the books on 2011 and kick off 2012, it’s a good time to review our vision, our business strategies, and our outlook. While we normally take a “less is more” approach, we think a more in-depth letter is warranted at this time, since we are continuing to build our businesses in an uncertain economic environment that includes the government’s “uber” presence in the residential mortgage markets.
This letter provides a comprehensive roadmap, starting with the big picture and working our way down to the individual businesses and strategies that ultimately drive our earnings. But for those more interested in the punch line, the three big themes for 2012 are:
| ► | Improve our capital efficiency and enhance the returns on our existing investments by funding all residential loans through warehouse lines, using prudent leverage against our residential securities portfolio, and obtaining financing on our commercial loans. |
| ► | Get our excess capital fully invested at attractive yields. |
| ► | Continue to build the franchise value of our residential and commercial businesses. |
The Big Picture
Plain and simple, we want to get back to delivering a growing stream of dividends through our residential and commercial credit businesses. Our REIT structure, while valuable and efficient from a tax perspective, can present a hurdle to growth, as we are required to pay out 90% of our earnings as dividends. To fund growth and create shareholder value, we ultimately need to be able to issue equity at a level that is accretive to earnings. To achieve this we need to earn a franchise premium for the value of our businesses by delivering to shareholders sustainable, attractive returns. The formula is pretty straightforward. To generate “sustainable” returns, we need a large market opportunity and real competitive advantages, while the “attractive” part requires us to make smart risk-adjusted credit investments and wisely manage the liability and capital side of our balance sheet.
This all points us to the $13.5 trillion market for residential and commercial mortgages. Our core strength is a deep knowledge of residential and commercial credit and structuring. We have long-standing relationships with lenders and senior investors. We have an outstanding brand. We are patient, long-term investors willing to hold long-term illiquid investments that we expect will generate attractive returns on the permanent equity and long-term debt capital that supports the illiquid investments.
Our macro outlook for the broad investment landscape over the next few years shapes our operating strategies. On the investment supply side, we believe the current period of consumer and business de-leveraging will continue for some time. As a consequence, fewer new assets (outside those guaranteed by the government) will be originated by banks and other financial institutions and the supply of new assets created through financial structuring has been vastly diminished or eliminated, depending on the product. On the investment demand side, we are likely to be competing for investments against trillions of un-invested dollars sitting in banks, fixed income funds, and hedge funds, whose managers are desperately searching for attractive risk-adjusted yields.
|
THE REDWOOD REVIEW 4TH QUARTER 2011
|
5
|
|
|
|
SHAREHOLDER LETTER
|
The Big Picture (continued)
Throughout its history, Redwood has opportunistically sourced attractive secondary investments and new residential mortgage-backed security (RMBS) credit investments issued by banks and Wall Street firms through a competitive bidding process. In 2012, we expect to find some attractive secondary investments, but competition from other bidders is likely to be fierce while the overall supply of private RMBS and commercial mortgage-backed security (CMBS) investments continues to shrink. The outstanding level of private RMBS has declined from $2.2 trillion in 2007 to approximately $1.0 trillion today. We have issued the only four new private-sector residential securitizations backed by prime loans since the onset of the financial crisis in 2008. New CMBS issuance is also down dramatically from a peak of $230 billion in 2007 to a projected $25-50 billion for 2012. The supply/demand condition described above probably bodes well for supporting asset prices (barring idiosyncratic risks, of which there are many), but over time produces a headwind to sourcing attractive investments solely through a bid process.
Against this backdrop, we believe that the most effective way to grow our businesses and generate attractive returns for shareholders over the long-term, we must be willing to do the hard work of creating our own home-cooked investments. That means continuing to build our commercial and residential platforms by broadening our lender and senior investor relationships, building out systems and supporting operations, and effectively and efficiently financing, hedging, and structuring to create new investments. This “build it and they will come” approach is expensive and a drag on earnings. But the upside is that, from a competitive standpoint, our businesses are hard to replicate and they are scalable, which should help us improve our returns as we ramp up volume.
When we made the decision to build the conduit in late 2009, part of our thesis was that the government would reduce its participation in the residential mortgage market and that new bank regulations related to Dodd-Frank and Basel III would cause banks to scale back their participation to the advantage of smaller non-bank competitors. In the fourth quarter, we saw both assumptions begin to play out as the temporary increase in the conforming loan limit was allowed to expire on October 1, 2011, some of the largest banks shut down or scaled back their correspondent lending channels related to increased capital requirements under Basel III, and Freddie Mac began exploring a new risk-sharing program for its residential business. While it is still early, our thesis appears to be playing out.
Now, let’s dig into the numbers and details of our businesses.
Commercial
Our commercial efforts will likely provide the best opportunity to put capital to work over the next year. In commercial, we are not competing against the government and there is $1.4 trillion of commercial debt maturing over the next four years. In our opinion, it is unlikely that the commercial banking industry, life insurance companies, or the CMBS market will have the appetite or capacity to meet the refinancing demand. Additionally, the stabilized income-producing properties that we finance continue to experience a broad-based recovery in fundamentals. Liquidity has returned to this segment of the commercial real estate world and performance and values have improved.
|
6
|
THE REDWOOD REVIEW 4TH QUARTER 2011
|
|
|
|
|
SHAREHOLDER LETTER
|
Commercial (continued)
We have made excellent progress in our commercial business. We started to rebuild it in late 2009 and began investing again in the fourth quarter of 2010. In 2011, the first full year of operations for this approach to the commercial market, we originated $128 million of commercial mezzanine loans and ended the year with a $158 million portfolio. We worked closely with banks, insurance companies, and other originators, and we looked at over 700 lending opportunities in 2011. In 2012, we expect to originate $200 to $300 million of subordinate debt investments, while maintaining our highly selective and disciplined approach to credit.
We have established a strong origination platform that sources investment opportunities nationally from a formal correspondent mortgage banking system of 15 top firms in the industry. We now possess the in-house expertise to underwrite and structure commercial investments across multiple capital sources. To date, we have closed with 11 different senior lenders and we are a recognized leader in the industry as a reliable provider of mezzanine financing for high-quality, long-term, stabilized properties. As a result of the franchise and relationships we have built over the last two years in commercial, we are optimistic about our sustainable competitive advantages as the current cycle evolves.
Our commercial portfolio is currently funded entirely by equity and it had a fourth quarter unlevered gross yield in excess of 10%, before any potential credit costs. To enhance the yield and free up equity capital for further investment, we plan to obtain debt financing for the portfolio in 2012.
Residential Conduit
In the long run, we believe our loan conduit and securitization platform will deliver attractive value to shareholders - both as a potential profit center from its stand-alone activities and as a source of attractive investment securities for our portfolio.
The stand-alone activities could include the acquisition of residential whole loans from originators for sale to newly-created Sequoia securitization entities that create and sell securities backed by these loans. We may also sell these whole loans via bulk sales if pricing is more attractive than issuing a securitization.
We may also use our conduit sourcing relationships to acquire and sell loans for a fee under private label investor programs and potentially for sourcing loans for sale to the GSEs. Our conduit also opened lots of doors for us with policymakers, regulators, and other market participants, and has presented us with business opportunities that we may not have otherwise had the chance to consider.
Our goal for 2012 is to acquire approximately $2.0 billion of loans from 30-to-40 originators. We are now planning four to six securitization transactions (including the one already completed in January 2012) depending on whether we sell a portion of our whole loans on a bulk basis. Our business decision either to securitize or sell whole loans remains fluid and will be based on balancing our best value execution and the franchise value of building out our securitization platform.
|
THE REDWOOD REVIEW 4TH QUARTER 2011
|
7
|
|
|
|
SHAREHOLDER LETTER
|
Residential Securities Investment Portfolio
As part of our theme for 2012, we intend to free up capital held against our securities portfolio by using what we believe to be modest financial leverage.
Our expectation is that in 2012 we will invest $100 million of capital in secondary RMBS and $75 to $100 million of capital in new Sequoia securitizations. We expect the net levered yields on new capital invested to range from 11% to 14%. We would emphasize that these figures are rough estimates, as the markets and our investment opportunities remain fluid.
Capital
We estimate that our investment capacity at the end of the fourth quarter of 2011 was $214 million, roughly even with the $206 million of estimated capacity at the end of the third quarter of 2011. Despite investing $98 million in the fourth quarter, we were able to free up underutilized investment capital and increase our investment capacity by borrowing against a portion of our RMBS portfolio and by putting in place mortgage warehouse credit facilities to fund mortgage loans pending securitization.
We expect to invest $375 to $500 million of capital in 2012 and pay dividends on our existing shares of approximately $80 million. We believe we can generate the capital needed for the vast majority of these new investments and dividends through cash from operations, principal payments from our investments, asset sales, and obtaining debt financing on our commercial portfolio.
We currently do not believe we will need to access the capital markets during the first half of the year, and we may not need to access the market in a material way in the second half. If our actual investment opportunities exceed our current plans or if our anticipated funding plans generate less than our anticipated needs, we would raise our hand for capital for new investments if we felt we had bona fide opportunities at attractive yields that would be accretive to common shareholders.
In Closing
We appreciate your continued support and patience as we rebuild our businesses following the collapse of the mortgage market and its aftermath. While we still face many challenges including the government’s continued outsized participation in the residential market, we believe we are on the right path to building franchise value in our commercial and residential businesses. We greatly value your steadfast and ongoing support.
 |
 |
|
Martin S. Hughes
|
Brett D. Nicholas
|
|
CEO
|
President
|
|
|
|
8
|
THE REDWOOD REVIEW 4TH QUARTER 2011
|
|
|
 |
|
QUARTERLY OVERVIEW
|
Fourth Quarter 2011 Results
Overview
We continued to make good operational progress in the fourth quarter of 2011, as we will describe in the sections that follow in this Quarterly Overview. We added warehouse financing lines for the residential conduit and continued to add loan sellers. We originated more commercial loans in the fourth quarter than in any quarter since we began rebuilding our commercial platform in 2009. Still, progress is not apparent in our financial results, as detailed below in the Fourth Quarter 2011 Results section. We reported a net loss for the fourth quarter of 2011, which reflected impairments on securities and a higher loan loss provision, as well as continued (albeit lower) mark-to-market losses related to the cost of hedging the residential pipeline.
We expect the benefit from increased investment activity, net of additional funding costs at Redwood (excluding Legacy Sequoia and Acacia), would contribute to net interest income in the second half of 2012. We also expect an increased pace of residential loan acquisitions in our conduit in 2012 and an increased number of securitizations relative to 2011, even if we sell some of our loans to whole loan buyers rather than securitizing them. Still, it takes time to fully benefit from getting our capital deployed and, although we expect improvement in profitability in 2012, it will likely be slower than we would like, with real progress projected to be more apparent toward year end.
Market Conditions
Prices for RMBS generally trended downward from April 2011 through year-end 2011. Overall, it seems that a generally greater risk aversion during that period was the biggest driver to price declines, though there are some reports that reduced availability of short-term funding for RMBS acquisitions contributed to these declines later in the year. Over the period from April through December 2011, the steepest price declines in RMBS were in those backed by lower-quality subprime and Alt-A collateral.
Following year-end, RMBS pricing has firmed in early 2012 as it did early in early 2011.
Investment and Sales Activity
During the fourth quarter of 2011, we invested $98 million in long-term assets. Specifically, in the fourth quarter, we were able to acquire $38 million in secondary RMBS and we originated $60 million in commercial mezzanine loans. We did not acquire securities created through our residential conduit in the fourth quarter, as we did not sponsor a securitization in the fourth quarter of 2011. Investment activity remained brisk early in 2012. Through February 15, 2012, we made $117 million of long-term investments. Those investments included $66 million of secondary RMBS financed by equity and $39 million of short-term debt, $13 million of commercial debt investments financed by equity, and $38 million of securities from our most recent Sequoia securitization financed by equity and $15 million of short-term debt.
We did not sell assets in the fourth quarter of 2011. In the first quarter, through February 15, 2012, we sold $42 million in market value for an estimated gain of $5 million.
|
THE REDWOOD REVIEW 4TH QUARTER 2011
|
9
|
|
|
|
QUARTERLY REPORT
|
GAAP earnings for the fourth quarter of 2011 were a loss of $3 million, or $0.03 per share, compared with $1 million in net income, or $0.01 per share, reported in the third quarter. Two factors contributed to the loss during the quarter. Loan loss provisions came in at $8 million for the fourth quarter of 2011, principally reflecting higher loss severities at Legacy Sequoia loans, as compared with an average provision of $3 million for the first three quarters of 2011. Other-than-temporary impairments on securities (related to credit) came in at $4.3 million for the fourth quarter of 2011, compared with an average of $1.7 million for the first three quarters of 2011.
Net interest income for the fourth quarter of 2011 was $27 million, down $1.7 million from the $29 million reported for the prior quarter. The $1.7 million decline in net interest income can be attributed to the $1.6 million decline in net interest income from Legacy Sequoia and Acacia, combined. Redwood, exclusive of these legacy investments, posted a $0.1 million decrease in net interest income, as rising funding costs slightly more than offset expanding interest revenues.
Operating expenses for the fourth quarter totaled $12.6 million, about $1 million above the $11.5 million level in Q3 and just a bit above the average $12 million per quarter run rate in 2011. Market valuation adjustments for the fourth quarter of 2011 were negative $9.7 million, as compared with negative $13.5 million for the third quarter of 2011. This $3.8 million improvement came from a $2.5 million improvement at Legacy Sequoia and Acacia, combined, and a $1.3 million improvement at Redwood parent. The improvement at Redwood parent reflected the benefit from reduced negative marks on risk management derivatives that were only partially offset by increased impairments.
Book value declined by $0.86 per share in the fourth quarter to $11.36 at year-end 2011, compared with $12.22 at September 30, 2011. The $67 million decline in book value during the quarter was attributable to unrealized losses on securities ($44 million or roughly two-thirds of the decline) and the impact of paying out dividends in excess of earnings ($23 million or roughly one-third of the decline). Through mid-February 2012, we estimate that approximately $22 million of the unrealized losses on securities in the fourth quarter reversed due to the recent rally in RMBS prices.
Residential Loan Business
We continue to make steady operating progress in our conduit business — adding sellers, buying loans, and establishing warehousing / borrowing relationships. We currently have 20 active sellers. We acquired $175 million of loans in the fourth quarter as compared with $405 million in loans purchased in the third quarter. We ended the fourth quarter of 2011 with $393 million in held-for-sale residential loans on our balance sheet and another $460 million in locked loans we planned to purchase.
We did not sponsor a residential securitization in the fourth quarter of 2011. Rather, we prepared for the $416 million securitization we completed in January 2012.
Of the $428 million in short-term debt on our balance sheet at year-end, $307 million was related to warehouse facilities we are using to finance the accumulation of our residential loans for securitization. We plan to finance residential mortgage loans with warehouse facilities to free up capital to invest in higher-yielding residential securities and commercial loans.
|
10
|
THE REDWOOD REVIEW 4TH QUARTER 2011
|
|
|
|
|
QUARTERLY OVERVIEW
|
Commercial Real Estate Business
Our commercial origination platform continues to grow. We added $60 million of investments in the fourth quarter of 2011, ending the year with a portfolio of 14 loans totaling $158 million. Through February 15, 2012, we originated $13 million of additional investments, including two mezzanine loans and one preferred equity investment.
While there are headwinds in the economy and sectors of the commercial market that are struggling more than others, the fundamentals for the higher-quality, stabilized properties we pursue generally continue to improve. We expect that the increased level of loan maturities coming due in the next several years will allow us to expand and sustain our commercial origination franchise, given our relationships and our willingness to hold credit risk on our balance sheet.
We anticipate originating between $200 and $300 million of subordinated debt investments in 2012. Quarterly volume may be volatile due to the timing of opportunities. We will continue to maintain our disciplined approach to underwriting as we expand our platform. Information on new originations is available in the commercial section of our website.
|
THE REDWOOD REVIEW 4TH QUARTER 2011
|
11
|
 |
|
|
FINANCIAL INSIGHTS
|
Book Value
Summary
| ► | The following table shows the components of our GAAP book value at December 31, 2011 and September 30, 2011. |
| Components of GAAP Book Value(1) | ||||||||
| ($ in millions, except per share data) | ||||||||
| As of | ||||||||
| 12/31/2011 | 9/30/2011 | |||||||
| Cash and cash equivalents | $ | 267 | $ | 133 | ||||
| Real estate loans at Redwood | ||||||||
| Residential | 395 | 229 | ||||||
| Commercial | 158 | 98 | ||||||
| Total real estate loans at Redwood | $ | 553 | $ | 327 | ||||
| Real estate securities at Redwood (2) | ||||||||
| Residential | 744 | 770 | ||||||
| Commercial | 6 | 6 | ||||||
| CDO | 1 | 1 | ||||||
| Total real estate securities at Redwood | $ | 751 | $ | 777 | ||||
| Investments in New Sequoia Entities | 49 | 54 | ||||||
| Investments in Other Consolidated Entities | 42 | 48 | ||||||
| Other assets | 91 | 77 | ||||||
| Total assets | $ | 1,752 | $ | 1,416 | ||||
| Short-term debt | (428 | ) | - | |||||
| Long-term debt | (140 | ) | (140 | ) | ||||
| Asset-backed securities issued - Resecuritization (2) | (220 | ) | (232 | ) | ||||
| Other liabilities | (72 | ) | (85 | ) | ||||
| Stockholders' equity | $ | 893 | $ | 959 | ||||
| Book value per share | $ | 11.36 | $ | 12.22 | ||||
| 1 | This table presents our assets and liabilities as calculated and reported under GAAP and as adjusted to reflect our investments in New Sequoia Entities and Other Consolidated Entities in separate line items, similar to the equity method of accounting, reflecting that, as a legal matter, the underlying assets and liabilities owned by these entities are not ours and we own only the securities and interests that we have acquired from these entities. See page 16 for an explanation of these adjustments. |
| 2 | The assets and liabilities of the resecuritization we engaged in during the third quarter of 2011 are included in Real estate securities at Redwood - Residential and Asset-back securities issued - Resecuritization, respectively, although these assets and liabilities are owned by the resecuritization entity and are legally not ours and we own only the securities and interests that we acquired from the resecuritization entity. At December 31, 2011, the resecuritization accounted for $325 million of real estate securities and $220 million of asset-backed securities issued and our investment in this resecuritization is reflected in the difference between these assets and liabilities. |
|
12
|
THE REDWOOD REVIEW 4TH QUARTER 2011
|
|
|
|
|
FINANCIAL INSIGHTS
|
Book Value (continued)
Summary (continued)
| ► | During the fourth quarter of 2011, our GAAP book value decreased by $0.86 per share to $11.36 per share. The net decrease resulted from a net loss of $0.03 per share, $0.56 per share in net negative valuation adjustments on securities not reflected in earnings, $0.03 per share in decreases in the value of hedges related to long-term debt that were not reflected in earnings, $0.25 per share in dividends paid to shareholders, and $0.01 from other net positive items. |
| ► | Our estimate of non-GAAP economic value at December 31, 2011 was $12.45 per share, or $1.09 per share higher than our reported GAAP book value. Approximately $1.06 per share of this difference relates to the estimated economic value of our long-term debt of $57 million ($83 million below its GAAP basis) and $0.07 per share relates to the estimated economic value of our investments in New Sequoia Entities and Other Consolidated Entities of $96 million ($6 million above their estimated GAAP value). These amounts were offset by a $0.04 per share related to our estimated economic value of the asset-backed securities issued from the resecuritization we engaged in during the third quarter of 2011 of $220 million ($3 million above their GAAP basis). A further reconciliation of our estimate of non-GAAP economic value to GAAP book value is set forth in Table 3 of the Appendix. |
|
THE REDWOOD REVIEW 4TH QUARTER 2011
|
13
|
|
|
|
FINANCIAL INSIGHTS
|
Balance Sheet
| ► | The following table shows the components of our balance sheet at December 31, 2011. |
| Consolidating Balance Sheet | ||||||||||||||||||||
| December 31, 2011 | ||||||||||||||||||||
| ($ in millions) | ||||||||||||||||||||
| At Redwood | New Sequoia Entities | Other Consolidated Entities | Intercompany | Redwood Consolidated | ||||||||||||||||
| Residential real estate loans | $ | 395 | $ | 676 | $ | 3,124 | $ | - | $ | 4,195 | ||||||||||
| Commercial real estate loans | 158 | - | 12 | - | 170 | |||||||||||||||
| Real estate securities | 751 | - | 231 | - | 982 | |||||||||||||||
| Investments in New Sequoia Entities | 49 | - | - | (49 | ) | - | ||||||||||||||
| Investment in Other Consolidated Entities | 42 | - | - | (42 | ) | - | ||||||||||||||
| Cash and cash equivalents | 267 | - | - | - | 267 | |||||||||||||||
| Total earning assets | 1,661 | 676 | 3,367 | (90 | ) | 5,614 | ||||||||||||||
| Other assets | 91 | 6 | 33 | - | 130 | |||||||||||||||
| Total assets | $ | 1,752 | $ | 682 | $ | 3,400 | $ | (90 | ) | $ | 5,743 | |||||||||
| Short-term debt | $ | 428 | $ | - | $ | - | $ | - | $ | 428 | ||||||||||
| Other liabilities | 72 | 2 | 69 | - | 144 | |||||||||||||||
| Asset-backed securities issued | 220 | 631 | 3,289 | - | 4,139 | |||||||||||||||
| Long-term debt | 140 | - | - | - | 140 | |||||||||||||||
| Total liabilities | 859 | 633 | 3,358 | - | 4,851 | |||||||||||||||
| Stockholders’ equity | 893 | 49 | 42 | (90 | ) | 893 | ||||||||||||||
| Total liabilities and equity | $ | 1,752 | $ | 682 | $ | 3,400 | $ | (90 | ) | $ | 5,743 | |||||||||
| ► | We present this table to highlight the impact that Redwood, New Sequoia Entities, and our Other Consolidated Entities had on our GAAP balance sheet at December 31, 2011. As shown, Redwood’s $91 million GAAP investment in these consolidated entities (including the consolidated entities we refer to as New Sequoia Entities) increased our consolidated assets by $4.1 billion and liabilities by $4.0 billion. |
| ► | We are required under GAAP to consolidate the assets and liabilities of certain Sequoia and Acacia securitization entities that are treated as secured borrowing transactions. However, the securitized assets of these entities are not available to Redwood. Similarly, the liabilities of these entities are obligations payable only from the cash flow generated by their securitized assets and are not obligations of Redwood. |
| ► | The consolidating balance sheet presents the assets and liabilities of the resecuritization we engaged in during the third quarter of 2011 at Redwood, although these assets and liabilities are owned by the resecuritization entity and are legally not ours and we own only the securities and interests that we acquired from the resecuritization entity. At December 31, 2011, the resecuritization accounted for $325 million of available-for-sale securities and $220 million of asset-backed securities issued and our investment in this resecuritization equals the difference between these assets and liabilities. |
| ► | The consolidating balance sheet presents the New Sequoia Entities separately from Other Consolidated Entities to highlight our renewed focus on growing our core business of creating residential credit investments. To the extent we complete additional securitizations that are accounted for as secured borrowings, we expect New Sequoia Entities to represent a larger portion of our business as prior Sequoia securitization entities continue to pay down. To the extent we use sale accounting for future securitizations, only our investments in those securitizations will be shown under a new line item on our consolidating balance sheet. |
|
14
|
THE REDWOOD REVIEW 4TH QUARTER 2011
|
|
|
|
|
FINANCIAL INSIGHTS
|
Real Estate Loans
| ► | At December 31, 2011, we had $395 million of unsecuritized residential real estate loans, as compared to $229 million at September 30, 2011. The increase reflects $175 million of residential loan acquisitions and $9 million of principal payments. In late January 2012, we securitized $416 million of loans and had $240 million of loans on our consolidating balance sheet at February 15, 2012. The majority of the residential real estate loans (and others we have identified for future acquisition) is intended to be sold or securitized in future periods. See the New Sequoia Residential Mortgage Loan Business module on page 28 for more information. |
| ► | At December 31, 2011, we had $158 million of commercial real estate loans held for investment, as compared to $98 million at September 30, 2011. The increase reflects the origination of four loans totaling $60 million in the fourth quarter. We started originating commercial loans in the fourth quarter of 2010 and we intend to hold these loans for investment. See the Commercial Real Estate Business module beginning on page 25 for more information. |
Real Estate Securities
| ► | The following table presents the fair value (which equals GAAP carrying value) of real estate securities at Redwood at December 31, 2011. We segment our securities portfolio by vintage (the year(s) the securities were issued), priority of cash flow (senior, re-REMIC, and subordinate), and by the quality of underlying loans (prime and non-prime). |
| Real Estate Securities at Redwood (1) | ||||||||||||||||||||
| December 31, 2011 | ||||||||||||||||||||
| ($ in millions) | ||||||||||||||||||||
| % of Total | ||||||||||||||||||||
| <=2004 | 2005 | 2006-2008 | Total | Securities | ||||||||||||||||
| Residential | ||||||||||||||||||||
| Seniors | ||||||||||||||||||||
| Prime | $ | 31 | $ | 188 | $ | 59 | $ | 278 | 37 | % | ||||||||||
| Non-prime (2) | 97 | 174 | 6 | 277 | 37 | % | ||||||||||||||
| Total Seniors | $ | 128 | $ | 362 | $ | 65 | $ | 555 | 74 | % | ||||||||||
| Re-REMIC | ||||||||||||||||||||
| Prime | $ | 2 | $ | 29 | $ | 88 | $ | 119 | 16 | % | ||||||||||
| Total Re-REMIC | $ | 2 | $ | 29 | $ | 88 | $ | 119 | 16 | % | ||||||||||
| Subordinates | ||||||||||||||||||||
| Prime | $ | 51 | $ | 5 | $ | 3 | $ | 59 | 8 | % | ||||||||||
| Non-prime (2) | 11 | - | - | 11 | 1 | % | ||||||||||||||
| Total Subordinates | $ | 62 | $ | 5 | $ | 3 | $ | 70 | 9 | % | ||||||||||
| Total Residential | $ | 192 | $ | 396 | $ | 156 | $ | 744 | 99 | % | ||||||||||
| Commercial subordinates | $ | 6 | $ | - | $ | - | $ | 6 | 1 | % | ||||||||||
| CDO subordinates | $ | - | $ | 1 | $ | - | $ | 1 | 0 | % | ||||||||||
| Total real estate securities | $ | 198 | $ | 397 | $ | 156 | $ | 751 | 100 | % | ||||||||||
| (1) Included in the residential securities table above are $325 million of senior securities that are included in a resecuritization that we completed in July 2011. Under GAAP accounting, we account for the resecuritization as a financing even though these securities are owned by the resecuritization entity and are legally not ours. We own only the securities and interests that we acquired from the resecuritization entity, which amounted to $105 million at December 31, 2011. As a result, to adjust at December 31, 2011 for the legal and economic interests that resulted from the resecuritization, Total Residential Senior Securities would be decreased by $325 million to $230 million, Total Re-REMIC Residential Securities would be increased by $105 million to $223 million, and Total Residential Securities would be reduced by $220 million to $524 million. |
| (2) Non-prime residential securities consist of $286 million of Alt-A senior and subordinate and $2 million of subprime subordinate securities. |
|
THE REDWOOD REVIEW 4TH QUARTER 2011
|
15
|
|
|
|
FINANCIAL INSIGHTS
|
Balance Sheet (continued)
Real Estate Securities (continued)
| ► | The table below details the change in fair value of securities at Redwood during the fourth and third quarters of 2011. |
| Real Estate Securities at Redwood | ||||||||
| ($ in millions) | ||||||||
| Three Months Ended | ||||||||
| 12/31/2011 | 9/30/2011 | |||||||
| Beginning fair value | $ | 777 | $ | 761 | ||||
| Acquisitions | 38 | 44 | ||||||
| Sales | - | - | ||||||
| Effect of principal payments | (19 | ) | (20 | ) | ||||
| Change in fair value, net | (45 | ) | (8 | ) | ||||
| Ending fair value | $ | 751 | $ | 777 | ||||
| ► | Our acquisitions in the fourth quarter included $20 million of prime senior securities, $1 million of Alt-A senior securities, $15 million of re-REMIC securities, and $2 million of Alt-A subordinate securities. |
Investments in the Securitization Entities
| ► | Our investments in the Other Consolidated Entities, as estimated for GAAP, totaled $42 million at December 31, 2011. This amount reflects the estimated book value of our retained investments in these entities based on the difference between the consolidated assets and liabilities of the entities in the aggregate according to their GAAP carrying amounts. Management’s estimate of the non-GAAP economic value of our investments in Other Consolidated Entities was $57 million. Of this amount, $50 million consisted of IOs and $6 million of senior and subordinate securities we retained at Legacy Sequoia entities. The remaining $1 million consisted of anticipated management fee income at the Acacia entities. We used the same valuation process that we follow to fair value our other real estate securities as described in the Accounting Discussion in the Appendix. |
Debt
| ► | At December 31, 2011, we had short-term mortgage warehousing debt outstanding of $307 million, which was used to finance a portion of our $395 million inventory of residential mortgage loans held for future securitization. During the fourth quarter, we obtained two mortgage warehousing facilities providing us with a total of $400 million of uncommitted warehouse borrowing capacity. It is our intent to finance the majority of our residential mortgage loans held for future securitizations or sale on warehouse lines. |
| ► | At December 31, 2011, we had short-term repurchase debt of $121 million secured by $182 million of our residential mortgage-backed securities (RMBS) at market value resulting in a debt-to-equity leverage ratio for these RMBS of 1.3X (after taking into account our liquidity capital cushion related to these short-term borrowings). |
|
16
|
THE REDWOOD REVIEW 4TH QUARTER 2011
|
|
|
|
|
FINANCIAL INSIGHTS
|
Debt (continued)
| ► | At December 31, 2011, we had $220 million outstanding of asset-backed debt issued at a stated interest rate of 1-month LIBOR plus 200 basis points related to our resecuritization of senior securities with an outstanding balance of $325 million. Redwood’s investment in the resecuritized assets is the difference between the outstanding balance of the resecuritization and the balance of the asset-backed debt, or $105 million. At December 31, 2011, the face value of the underlying RMBS collateral was $412 million, the credit reserve amounted to $22 million, the discount was $79 million, and there was $14 million of unrealized gains. In addition to the credit reserve, Redwood’s investment has credit support from the securities (owned by third parties) that are subordinate to the senior securities that were resecuritized. |
| ► | At December 31, 2011, we had $140 million of long-term debt outstanding due in 2037 with a stated interest rate of three-month LIBOR plus 225 basis points. In 2010, we effectively fixed the interest rate on this long-term debt at a rate of approximately 6.75% (excluding deferred debt issuance costs) through interest rate swaps. |
| ► | Although we report our long-term debt in accordance with GAAP based on its $140 million historical cost, we estimate the non-GAAP economic value of this debt at $57 million based on its stated interest rate using the same valuation process used to fair value our other financial assets and liabilities. |
Capital and Cash
| ► | At December 31, 2011, our total capital was $1.0 billion, including $893 million of shareholders’ equity and $140 million of long-term debt. We use our capital to invest in earning assets, meet lender capital requirements, and to fund our operations and working capital needs. |
| ► | We manage our capital through our risk-adjusted capital policy, which has served us well since the company was founded. We have successfully managed through two tumultuous periods (1998 and 2008) and we remain thoughtful about managing funding risk when we use short-term debt. |
| ► | Our cash balance was $267 million at December 31, 2011. We hold cash for two main reasons. First, we hold cash in an amount we believe will be sufficient to comply with covenants, to fund haircuts (or the difference between the amounts advanced by our lenders and the value of the pledged loans and securities) on our warehouse and repo borrowing facilities, to meet potential margin calls, and to cover near-term cash operating expenses. Second, we hold cash in anticipation of having opportunities to invest at attractive yields. |
| ► | We estimate that our investment capacity was $214 million at December 31, 2011, as compared to $206 million at September 30, 2011. This capacity to make long-term investments equals the amount of cash we have, plus the cash we estimate that could be readily available to us by increasing short-term borrowings to finance all our residential loans held for securitization, less the amount of cash we set aside for operating expenses, pending trades, and potential margin requirements. |
|
THE REDWOOD REVIEW 4TH QUARTER 2011
|
17
|
|
|
|
FINANCIAL INSIGHTS
|
GAAP Income
Summary
| ► | The following table provides a summary of our consolidated GAAP income for the fourth and third quarters of 2011. It includes the interest income and interest expense related to the resecuritization we engaged in during the third quarter of 2011. |
| GAAP Income | ||||||||
| ($ in millions, except per share data) | ||||||||
| Three Months Ended | ||||||||
| 12/31/2011 | 9/30/2011 | |||||||
| Interest income | $ | 56 | $ | 53 | ||||
| Interest expense | (29 | ) | (24 | ) | ||||
| Net interest income | 27 | 29 | ||||||
| Provision for loan losses | (8 | ) | (4 | ) | ||||
| Market valuation adjustments, net | (10 | ) | (13 | ) | ||||
| Net interest income after provision and market valuation adjustments | 10 | 12 | ||||||
| Operating expenses | (13 | ) | (12 | ) | ||||
| Realized gains on sales and calls, net | 0 | 1 | ||||||
| Noncontrolling interest | - | 0 | ||||||
| Provision for income taxes | - | (0 | ) | |||||
| GAAP (loss) income | $ | (3 | ) | $ | 1 | |||
| GAAP (loss) income per share | $ | (0.03 | ) | $ | 0.01 | |||
| ► | Our consolidated GAAP loss for the fourth quarter was $3 million, or $0.03 per share, as compared to income of $1 million, or $0.01 per share, for the previous quarter. The $4 million decrease was primarily a result of higher net loss from Other Consolidated Entities. |
| ► | Additional information related to GAAP income at Redwood, New Sequoia Entities, and Other Consolidated Entities is provided on the following pages. |
|
18
|
THE REDWOOD REVIEW 4TH QUARTER 2011
|
|
|
|
|
FINANCIAL INSIGHTS
|
GAAP Income (continued)
Summary (continued)
| ► | The following tables show the estimated effect that Redwood, New Sequoia Entities, and our Other Consolidated Entities had on GAAP income for the fourth and third quarters of 2011. |
| Consolidating Income Statement | ||||||||||||||||||||
| Three Months Ended December 31, 2011 | ||||||||||||||||||||
| ($ in millions) | ||||||||||||||||||||
| At Redwood | New Sequoia Entities | Other Consolidated Entities | Intercompany Adjustments | Redwood Consolidated | ||||||||||||||||
| Interest income | $ | 20 | $ | 8 | $ | 21 | $ | - | $ | 49 | ||||||||||
| Net discount (premium) amortization | 9 | (0 | ) | (1 | ) | - | 8 | |||||||||||||
| Total interest income | 29 | 8 | 20 | - | 56 | |||||||||||||||
| Interest expense | (5 | ) | (7 | ) | (18 | ) | - | (29 | ) | |||||||||||
| Net interest income | 24 | 1 | 2 | - | 27 | |||||||||||||||
| Provision for loan losses | (1 | ) | (0 | ) | (7 | ) | - | (8 | ) | |||||||||||
| Market valuation adjustments, net | (11 | ) | - | 1 | - | (10 | ) | |||||||||||||
| Net interest income (loss) after provision and market valuation adjustments | 12 | 1 | (4 | ) | - | 10 | ||||||||||||||
| Operating expenses | (13 | ) | - | (0 | ) | - | (13 | ) | ||||||||||||
| Realized gains on sales and calls, net | - | - | 0 | - | 0 | |||||||||||||||
| Income from New Sequoia Entities | 1 | - | - | (1 | ) | - | ||||||||||||||
| Loss from Other Consolidated Entities | (3 | ) | - | - | 3 | - | ||||||||||||||
| Noncontrolling interest | - | - | - | - | - | |||||||||||||||
| Provision for income taxes | - | - | - | - | - | |||||||||||||||
| Net (loss) income | $ | (3 | ) | $ | 1 | $ | (3 | ) | $ | 2 | $ | (3 | ) | |||||||
| Consolidating Income Statement | ||||||||||||||||||||
| Three Months Ended September 30, 2011 | ||||||||||||||||||||
| ($ in millions) | ||||||||||||||||||||
| At Redwood | New Sequoia Entities | Other Consolidated Entities | Intercompany Adjustments | Redwood Consolidated | ||||||||||||||||
| Interest income | $ | 18 | $ | 5 | $ | 23 | $ | - | $ | 45 | ||||||||||
| Net discount (premium) amortization | 10 | 0 | (2 | ) | - | 8 | ||||||||||||||
| Total interest income | 28 | 5 | 21 | - | 53 | |||||||||||||||
| Interest expense | (4 | ) | (4 | ) | (17 | ) | - | (24 | ) | |||||||||||
| Net interest income | 25 | 1 | 4 | - | 29 | |||||||||||||||
| Provision for loan losses | - | (0 | ) | (4 | ) | - | (4 | ) | ||||||||||||
| Market valuation adjustments, net | (12 | ) | - | (1 | ) | - | (13 | ) | ||||||||||||
| Net interest income (loss) after provision and market valuation adjustments | 12 | 1 | (1 | ) | - | 12 | ||||||||||||||
| Operating expenses | (11 | ) | - | (0 | ) | - | (12 | ) | ||||||||||||
| Realized gains on sales and calls, net | 1 | - | 1 | - | 1 | |||||||||||||||
| Income from New Sequoia Entities | 1 | - | - | (1 | ) | - | ||||||||||||||
| Loss from Other Consolidated Entities | (1 | ) | - | - | 1 | - | ||||||||||||||
| Noncontrolling interest | - | - | 0 | - | 0 | |||||||||||||||
| Provision for income taxes | (0 | ) | - | - | - | (0 | ) | |||||||||||||
| Net income (loss) | $ | 1 | $ | 1 | $ | (1 | ) | $ | 0 | $ | 1 | |||||||||
|
THE REDWOOD REVIEW 4TH QUARTER 2011
|
19
|
|
|
|
FINANCIAL INSIGHTS
|
GAAP Income (continued)
Summary (continued)
Redwood Parent
| ► | Net interest income at Redwood was $24 million for the fourth quarter, as compared to $25 million for the third quarter, a decrease of $1 million. The decrease was the result of higher interest expense from short-term debt used to finance the acquisition of residential loans and a full quarter of interest expense related to the resecuritization financing of much of our senior residential securities portfolio. |
| ► | Total interest income from our securities portfolio was $22 million for the fourth quarter, essentially unchanged as compared to a rounded $23 million in the third quarter. Declining investment yields were offset in the fourth quarter by increasing average balances, as acquisitions of $38 million outpaced principal repayments. There were no sales during the quarter. |
| ► | Residential loans at Redwood generated $3 million of interest income during the fourth quarter, a modest decrease from the previous quarter, as the average balance of loans decreased slightly to $307 million. These loans are financed at Redwood prior to being pooled and securitized through our Sequoia program. The amount of interest earned at Redwood is dependent upon prevailing mortgage rates and the pace of our loan purchase and securitization activity. |
| ► | Commercial loans at Redwood generated $3 million of interest income, an increase of $1 million from the previous quarter, as the average balance of loans increased 55% to $123 million. We originated $60 million of commercial loans in the fourth quarter, as compared to $27 million in the third quarter, bringing the total portfolio to $158 million. |
| ► | Interest expense at Redwood increased to $5 million in the fourth quarter from $4 million in the third quarter. This interest expense was derived from $140 million of long-term debt at an effective cost of 6.89%, $224 million (average balance) of ABS issued debt (related to the resecuritization of certain of our senior residential securities) at a cost of LIBOR plus 2%, as well as interest paid on short-term repurchase and warehouse facilities utilized during the fourth quarter. The realized portion of deferred security issuance costs is reflected in interest expense. |
| ► | Net negative market valuation adjustments were $11 million for the fourth quarter. These adjustments primarily reflect decreases in the value of derivatives used to manage risks associated with our accumulation of residential and commercial loans. We could recover some of these amounts to the extent increases in the value of the loans are realized through earnings or sales over time. Impairments on securities of $4 million were also reflected in the total market valuation adjustment. |
| ► | We did not sell or call securities in the fourth quarter. We recognized a $1 million of gains on called securities in the third quarter. |
| ► | Operating expenses at Redwood were $13 million, in line with our expectations. We expect a similar level of quarterly operating expenses in the first quarter of 2012. |
|
20
|
THE REDWOOD REVIEW 4TH QUARTER 2011
|
|
|
|
|
FINANCIAL INSIGHTS
|
New Sequoia Entities
| ► | In the fourth and third quarters of 2011, we estimated a contribution to net income of $1 million per quarter from our investments in New Sequoia Entities. Information about New Sequoia Entities can be found in the New Sequoia Residential Loan Business module on page 28. |
Other Consolidated Entities
| ► | We recognized a net loss of $3 million for the fourth quarter from our investments in Legacy Sequoia and Acacia securitization entities, as compared to a net loss of $1 million for the previous quarter. The assets at Other Consolidated Entities continue to run off with no new reinvestment. |
| ► | The allowance for loan losses at Legacy Sequoia entities increased by $3 million to $7 million in the fourth quarter due to a gradual increase in loss severities, largely due to extending loan workout and foreclosure timelines. There are currently 14 Sequoia entities for which we have aggregate loan loss reserves of $9 million in excess of our reported investment for GAAP purposes, an amount we expect to recover in future periods upon the payoff or deconsolidation of those entities. We did not deconsolidate any Sequoia entities in the fourth quarter. |
|
THE REDWOOD REVIEW 4TH QUARTER 2011
|
21
|
|
|
|
FINANCIAL INSIGHTS
|
Taxable Income and Dividends
Summary
| As a REIT, Redwood is required to distribute to shareholders at least 90% of its REIT taxable income (and meet certain other requirements), although Redwood’s Board of Directors can declare dividends in excess of this minimum requirement. REIT taxable income is defined as income as calculated for tax that is earned at Redwood and its qualified REIT subsidiaries. Redwood also earns taxable income at its taxable subsidiaries, which it is not required to distribute. To the extent Redwood retains taxable income that is not distributed to shareholders, it is taxed at corporate tax rates. A reconciliation of GAAP and taxable income is set forth in Table 2 in the Financial Tables in this Review. |
Overview
| ► | Redwood’s estimated taxable loss for the fourth quarter of 2011 was $1.5 million, or $0.02 per share, as compared to an estimated taxable income of $6 million, or $0.07 per share, for the third quarter of 2011. |
| ► | Credit losses increased in the fourth quarter and continue to be a significant driver of our taxable income. In the fourth quarter of 2011, credit losses as calculated for tax purposes totaled $15 million, as compared to $12 million in the third quarter of 2011, and were charged directly to taxable income since the tax code does not allow for the establishment of credit reserves. |
| ► | Our taxable income will likely continue to vary from period to period due to the timing of realized credit losses. Based on the securities we currently own, we expect an additional $138 million of credit losses to be realized over an estimated two-to-five year period for tax purposes. |
| ► | On November 14, 2011, our Board of Directors declared a regular dividend of $0.25 per share for the fourth quarter, which was paid on December 27, 2011 to shareholders of record on December 15, 2011. On February 22, 2012 our Board of Directors declared a regular dividend of $0.25 per share for the first quarter, which will be paid on March 30, 2012 to shareholders of record on March 15, 2012. In November 2011, the Board of Directors announced its intention to pay a regular dividend of $0.25 per share per quarter in 2012. |
| ► | Under the federal income tax rules applicable to REITs, Redwood’s 2011 dividend distributions are expected to be characterized for income tax purposes as 25% ordinary income and 75% return of capital. None of Redwood’s 2011 dividend distributions is expected to be characterized for federal income tax purposes as long-term capital gain dividends. |
|
22
|
THE REDWOOD REVIEW 4TH QUARTER 2011
|
|
|
|
|
FINANCIAL INSIGHTS
|
Cash Flow
| ► | The sources and uses of cash in the table below are derived from our GAAP Consolidated Statements of Cash Flow for the fourth and third quarters of 2011, aggregating and netting all items in a manner consistent with the way management analyzes them. This table excludes the gross cash flow generated by our Sequoia and Acacia securitization entities (cash flow that is not available to Redwood), but does include the cash flow distributed to Redwood as a result of our investments in these entities. The beginning and ending cash balances presented in the table below are GAAP amounts. |
| Redwood | ||||||||
| Sources and Uses of Cash | ||||||||
| ($ in millions) | ||||||||
| Three Months Ended | ||||||||
| 12/31/2011 | 9/30/2011 | |||||||
| Beginning cash balance | $ | 133 | $ | 80 | ||||
| Business cash flow (1) | ||||||||
| Loans, securities, and investments (2) | 60 | 60 | ||||||
| Operating expenses | (10 | ) | (10 | ) | ||||
| Resecuritization interest expense | (14 | ) | (14 | ) | ||||
| Interest expense on other borrowed funds | (3 | ) | (2 | ) | ||||
| Dividends | (39 | ) | (20 | ) | ||||
| Net business cash flow | (6 | ) | 14 | |||||
| Investment-related cash flow | ||||||||
| Acquisition of residential loans | (175 | ) | (405 | ) | ||||
| Origination of commercial loans | (60 | ) | (27 | ) | ||||
| Sale (acquisition) of securities, net | (35 | ) | (48 | ) | ||||
| Investments in New Sequoia Entities | - | (19 | ) | |||||
| Total investment-related cash flow | (270 | ) | (499 | ) | ||||
| Financing and other cash flow | ||||||||
| Proceeds from New Sequoia securitization | - | 379 | ||||||
| Proceeds from resecuritization | - | 243 | ||||||
| Proceeds from (repayment of) repo debt, net | 121 | (41 | ) | |||||
| Proceeds from (repayment of) warehouse debt, net | 307 | - | ||||||
| Margin posted, net | (15 | ) | (33 | ) | ||||
| Derivative pair-off | (3 | ) | (9 | ) | ||||
| Share repurchase | (4 | ) | (3 | ) | ||||
| Changes in working capital | 4 | 2 | ||||||
| Net financing and other cash flow | 410 | 538 | ||||||
| Ending cash balance | $ | 267 | $ | 133 | ||||
| 1 | Cash flow from loans, securities, and investments can be volatile from quarter to quarter depending on the level of invested capital, the timing of credit losses, acquisitions, sales, and changes in prepayments and interest rates. Therefore, (i) cash flow generated by these investments in a given period is not necessarily reflective of the long-term economic return we will earn on the investments and (ii) it is difficult to determine what portion of the cash received from an investment is a return “of” principal and what portion is a return “on” principal in a given period. This table excludes cash flow generated by our investments in the Sequoia and Acacia entities and the Fund (cash flow that is not available to Redwood), but does include the cash flow distributed to Redwood as a result of our investments in these entities. |
| 2 | Sources of cash from loans, securities, and investments includes the gross cash flow received from the securities that were included in the resecuritization we engaged in during the third quarter of 2011, and resecuritization interest expense reflect payments in respect of ABS issued in that resecuritization. |
| ► | Business cash flow was negative $6 million in the fourth quarter, as compared to $14 million in the third quarter, as shown in the table above. We made two dividend payments in the fourth quarter due to our decision to change the payment date to coincide with the quarter in which dividends are declared. As a result, we paid our dividend that was declared in the third quarter in the fourth quarter, and we also paid our dividend that was declared in the fourth quarter in late December. Excluding the effect of this non-recurring change in dividend payment dates, business cash flow would have been essentially unchanged. |
|
THE REDWOOD REVIEW 4TH QUARTER 2011
|
23
|
|
|
|
FINANCIAL INSIGHTS
|
| ► | After excluding the $20 million non-recurring effect of the change in our dividend payment dates, the $60 million of cash flow from our loans, securities, and investments continued to exceed our cash operating expenses of $10 million, interest expense on borrowed funds of $3 million, resecuritization interest expense of $14 million, and the $20 million required for the current level of recurring quarterly dividends. |
| ► | Notable uses of cash in the fourth quarter included $175 million for the acquisition of residential loans, as compared to $405 million in the third quarter. The reduction in acquisitions reflects timing differences between when we identify loans we intend to purchase and the dates we acquire those loans, a reflection on our increased efforts to minimize the amount of our capital invested in inventory. Note that our pipeline of loans we intend to purchase increased to $460 million at December 31, 2011, from $295 million at September 30, 2011. |
| ► | We also funded $60 million of commercial mezzanine loans, and acquisitions of seasoned RMBS totaled $38 million. In the fourth quarter, our $98 million of long-term investments exceeded the $28 million received from principal payments and sales. In the third quarter, our $94 million of long-term investments exceeded the $27 million received from principal payments and sales. |
| ► | Notable sources of cash in the fourth quarter included $307 million from our mortgage warehouse credit facilities (which was used to finance a portion of our residential mortgage loan inventory), and $121 million from repo facilities used to finance a portion of our securities portfolio. |
| ► | Cash flow from securities and investments can be volatile from quarter to quarter depending on the level of invested capital, the timing of credit losses, acquisitions, sales, and changes in prepayments and interest rates. |
|
24
|
THE REDWOOD REVIEW 4TH QUARTER 2011
|
|
|
 |
|
COMMERCIAL REAL ESTATE BUSINESS
|
Summary
Redwood’s commercial origination platform provides long-term debt solutions for borrowers on higher quality properties. Redwood collaborates with other lending institutions (including major banks, life insurance companies, CMBS issuers, and the GSEs) to create attractive subordinate debt investments (typically mezzanine loans or other forms of subordinated financing such as preferred equity or B Notes), for its portfolio. Redwood may also originate loans (both senior and subordinate) on stabilized commercial properties, retaining the subordinate investments while selling the senior loans at origination. Redwood also owns a small balance of legacy commercial securities which were acquired prior to 2008. This discussion is exclusive of commercial securities and loans owned by Acacia entities.
Market Conditions
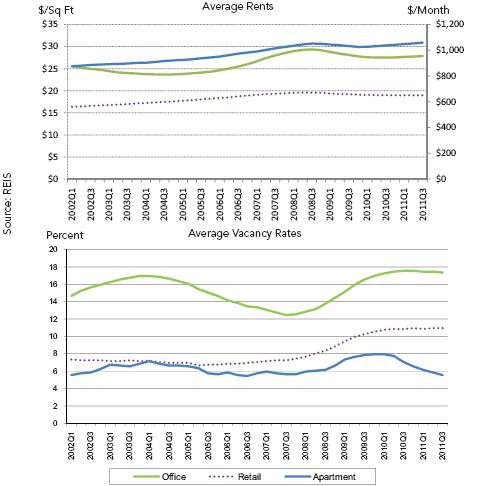
| ► | A broad-based but tepid recovery is underway in the commercial real estate market, and it has resulted in a dramatic increase in overall transactions and pricing transparency. These new levels of activity are still well below the benchmarks established pre-recession, but are important milestones. Against these more favorable conditions in the commercial real estate sector, some headwinds in overall capital markets persist due to uncertainty in Europe and potential slow employment growth in the U.S. As a result, commercial lenders of all types are quite active in seeking to finance conservatively leveraged properties, but have limited appetite to extend leverage to more historical norms. Generally speaking, we believe this is good news for investors like Redwood, who are willing to analyze and retain long-term commercial credit risk on better quality properties. |
|
THE REDWOOD REVIEW 4TH QUARTER 2011
|
25
|
|
|
COMMERCIAL
REAL
ESTATE
BUSINESS
|
Market Conditions (continued)
| ► | We believe the valuations on our target assets may continue to improve even as the commercial real estate market continues to address high levels of recapitalizations, delinquencies, extensions, and workouts. Fundamentals for stabilized commercial real estate across all major property types continue to improve, albeit at varying degrees depending on geographic location and quality. |
| ► | Lenders of all types that focus on stabilized commercial real estate anticipate greater capital deployment in 2012, while leverage expectations are expected to remain more conservative than historical norms. We have invested or are actively pursuing commercial investments alongside insurance companies, banks, CMBS lenders, and the GSEs. Our ability to originate and create attractive long-term investments is expected to increase in both volume and velocity, as the level of commercial mortgage maturities is expected to exceed $1.4 trillion over the next four years. |
| ► | Despite a volatile second half of 2011, the CMBS market also appears to be in a position to provide a similar level of capital to the commercial mortgage market as it did last year (approximately $30 billion in new issuance), albeit at a steadier pace. Spreads have returned to their early 2011 levels for AAA-rated CMBS and investors seem to be cautiously optimistic about this sector. We continue to believe that the securitization of commercial loans provides an important source of capital for financing the types of properties we target, and CMBS will continue to be a necessary engine for a healthy commercial mortgage market. By design, our commercial business is not reliant on the CMBS market, and thus, we believe we are well positioned to grow, regardless of instability in this sector. |
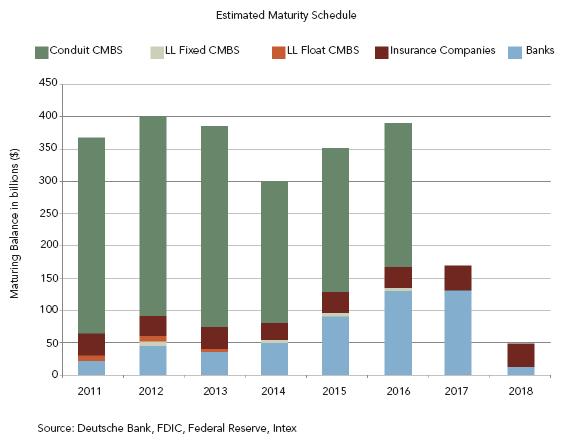
|
26
|
THE REDWOOD REVIEW 4TH QUARTER 2011
|
|
|
|
|
COMMERCIAL REAL ESTATE BUSINESS
|
Quarterly Update
| ► | At December 31, 2011, our commercial mezzanine portfolio totaled $158 million, consisting of 14 loans originated over the past 15 months. On average, these loans have a maturity of over five years, unlevered yield in excess of 10% per annum before including any credit costs, a loan-to-value ratio of 72% at origination, and a debt service coverage ratio at origination of 1.17X based on our underwritten cash flows. |
| ► | The loans in our portfolio include central business district office buildings, stabilized multifamily properties, grocery-anchored retail centers, a regional mall, and two crossed portfolios of hotel properties. Thus far in 2012 (through February 15th), we originated $13 million consisting of two mezzanine loans and one preferred equity investment. The quarterly level of commercial originations may vary; however, we expect to originate between $200 and $300 million in subordinated debt investments in 2012. |
| ► | We intend to obtain what we believe to be a prudent level of financing on this portfolio in 2012. We are in discussions with various counterparties that may provide facilities or assist us in creating an appropriate and efficient financing structure. |
| ► | During the fourth quarter, our portfolio generated interest income of $3.3 million. At December 31, 2011, all of our commercial loans were current and performing within our expectations. For accounting purposes, we began provisioning for loan losses ($0.6 million) in the fourth quarter in accordance with general industry reserving conventions for losses inherent in commercial loan portfolios such as ours. As we develop an extended performance history for our portfolio, or as any loans begin to exhibit specific credit issues, we will re-evaluate our reserves accordingly. |
| ► | Our legacy portfolio of CMBS was valued at $6 million at December 31, 2011 and generated less than $1 million of cash flow during the fourth quarter. |
|
THE REDWOOD REVIEW 4TH QUARTER 2011
|
27
|
 |
|
|
NEW
SEQUOIA RESIDENTIAL MORTGAGE LOAN BUSINESS
|
Summary
We purchase newly originated loans (primarily prime jumbo loans) that meet our collateral criteria from approved originators on a flow or bulk basis. Loans acquired through this process (our “conduit”) are expected to be securitized through new Sequoia securitization entities, which acquire residential mortgage loans through our conduit and issue asset-backed securities (ABS) backed by these loans, or are sold privately as whole loans. Most of the senior or investment-grade rated ABS issued by New Sequoia Entities are sold to third-party investors; Redwood generally acquires the subordinate or non-investment grade securities but has also acquired senior securities and interest-only securities from the New Sequoia Entities.
Quarterly Update
| ► | In the fourth quarter of 2011, we acquired $175 million of loans, as compared to $405 million in the third quarter. At December 31, 2011, residential loans purchased and held on our balance sheet for future securitization or loan sales totaled $395 million, up from $227 million at September 30, 2011. At December 31, 2011, the pipeline of residential mortgage loans we plan to purchase totaled $460 million. |
| ► | At February 15, 2012, loans purchased and held on our balance sheet for future securitization or loan sales totaled $240 million and the pipeline of residential mortgage loans we plan to purchase totaled $461 million. |
| ► | At December 31, 2011, we had 19 active originators and 12 in implementation, up from 10 active originators and 16 in implementation at September 30, 2011. |
| ► | In 2011, we purchased $832 million of loans, completed two securitizations of $671 million of loans, and created $34 million of investments for our own investment portfolio. In 2010, we purchased $257 million of loans, completed one securitization of $238 million, and created $28 million of investments for our investment portfolio. |
| ► | Our three securitizations that we completed in 2010 and 2011 totaled $908 million. As of February 1, 2011, there were no delinquencies in the loans underlying these securitizations and there have not been any credit losses relating to these securitizations. |
| ► | On January 27, 2012, we closed SEMT 2012-1, a $416 million securitization of 446 prime jumbo mortgage loans. The weighted average loan size was $932,126 and, similar to our prior three securitizations, the weighted average loan-to-value ratio and FICO score (each, at origination of the loans) were 63% and 770, respectively. The collateral for this securitization was acquired from eight originators. The triple-A securities were sold to 27 institutional investors and we retained all of subordinate securities and the interest-only security for an investment of $38 million gross or $23 million net of short-term borrowings to finance this investment. |
|
28
|
THE REDWOOD REVIEW 4TH QUARTER 2011
|
|
|
 |
|
RESIDENTIAL REAL ESTATE SECURITIES
|
Summary
Redwood invests in securities that are backed by pools of residential loans. Some of these investments in residential securities consist of senior prime and non-prime securities, and non-senior securities. Residential prime securities are mortgage-backed securities backed by prime residential mortgage loans. Residential non-prime securities are mortgage-backed securities backed by non-prime (Alt-A, Option ARM, and Subprime) residential mortgage loans. Non-senior securities include subordinate and re-REMIC securities.
Senior securities are those interests in a securitization that have the first right to cash flows and are last in line to absorb losses. Subordinate securities are those interests in a securitization that have the last right to cash flows and are first in line to absorb losses. A re-REMIC is a resecuritization of asset-backed securities where the cash flow from and any credit losses absorbed by the underlying asset-backed securities are allocated among the securities issued in the resecuritization transaction in a variety of ways.
The following discussion refers only to the residential securities owned by Redwood, exclusive of the securities owned by Acacia entities, and exclusive of Redwood’s investments in Acacia.
The following discussion includes the securities that we resecuritized during the third quarter of 2011. See footnote (1) below the table on the following page.
In the Financial Tables in the Appendix, information on the residential securities we own and underlying loan characteristics is set forth in Tables 5 through 8B.
Quarterly Update
| ► | Interest income generated by our residential securities was $20 million in the fourth quarter of 2011, resulting in an annualized unlevered yield of 11.9% on the $662 million average amortized cost of these securities. |
| ► | We finance our holdings of our residential securities with short-term debt secured by securities (repo debt), through the resecuritization transaction we completed during the third quarter of 2011 (resecuritization debt), and through equity. During the fourth quarter, average repo debt amounted to $158 million, and the average resecuritization debt amounted to $224 million. |
| ► | At December 31, 2011, the fair value of the residential AFS and trading securities we own totaled $744 million, consisting of $278 million in prime senior securities, $277 million in non-prime senior securities, $119 million in re-REMIC securities, and $70 million in subordinate securities. Each of these categories is further discussed on the following pages. |
| ► | At December 31, 2011, 36% of the residential AFS and trading securities we held were fixed-rate assets, 16% were adjustable-rate assets, 21% were hybrid assets that reset within the next year, 3% were hybrid assets that reset between 12 and 36 months, and 24% were hybrid assets that reset after 36 months. |
|
THE REDWOOD REVIEW 4TH QUARTER 2011
|
29
|
|
|
RESIDENTIAL REAL
ESTATE
SECURITIES
|
| ► | The following table presents information on residential securities at Redwood at December 31, 2011. For GAAP, we account for the large majority of these securities as available-for-sale (AFS) and others as trading securities, and in both cases the securities are reported at their fair value as of the report date. |
| Residential Securities at Redwood | ||||||||||||||||||||
| December 31, 2011 | ||||||||||||||||||||
| ($ in millions) | ||||||||||||||||||||
| Senior | ||||||||||||||||||||
| Prime | Non-prime | Re-REMIC | Subordinate | Total | ||||||||||||||||
| Available-for-sale securities (1) | ||||||||||||||||||||
| Current face | $ | 341 | $ | 350 | $ | 220 | $ | 237 | $ | 1148 | ||||||||||
| Credit reserve | (28 | ) | (16 | ) | (61 | ) | (137 | ) | (242 | ) | ||||||||||
| Net unamortized discount | (58 | ) | (76 | ) | (78 | ) | (24 | ) | (236 | ) | ||||||||||
| Amortized cost | 255 | 258 | 81 | 76 | 670 | |||||||||||||||
| Unrealized gains | 30 | 11 | 39 | 6 | 86 | |||||||||||||||
| Unrealized losses | (7 | ) | (13 | ) | (1 | ) | (12 | ) | (33 | ) | ||||||||||
| Trading securities | - | 21 | - | - | 21 | |||||||||||||||
| Fair value of residential securities | $ | 278 | $ | 277 | $ | 119 | $ | 70 | $ | 744 | ||||||||||
| Fair value of AFS securities as a % of face value (2) | 82 | % | 73 | % | 54 | % | 29 | % | 63 | % | ||||||||||
| Amortized cost of AFS securities as a % of face value (2) | 75 | % | 74 | % | 37 | % | 32 | % | 58 | % | ||||||||||
(1) Included in the available-for-sale securities above are $325 million of senior securities that were resecuritized. Under GAAP accounting, we account for the resecuritization as a financing even though these securities are owned by the resecuritization entity and are legally not ours. We own only the securities and interests that we acquired from the resecuritization entity, which amounted to $105 million at December 31, 2011. As a result, to adjust for the legal and economic interests that resulted from the resecuritization, the total fair value of the residential senior securities would be decreased by $325 million to $230 million, the total fair value of the re-REMIC residential securities would be increased by $105 million to $223 million, and the total fair value of the residential securities would be reduced by $220 million to $524 million.
(2) Does not include trading securities.
| ► | Securities are acquired assuming a range of outcomes based on modeling of expected performance at the individual loan level for both delinquent and current loans. Over time, the performance of these securities may require a change in the amount of credit reserves we designate. |
| ► | In the fourth quarter, credit losses on our residential securities at Redwood totaled $20 million, as compared to credit losses of $19 million in the third quarter. In each quarter, all of the losses came from our subordinate securities. We expect future losses to extinguish a large percentage of the subordinate securities as reflected by the $137 million of credit reserves we have provided for the $237 million face value of those securities. Until the losses occur, we will generally continue to earn interest on the face value of those securities. |
| ► | Additional information on interest income and yields for our securities portfolio is reported in the Financial Tables in the Appendix. |
|
30
|
THE REDWOOD REVIEW 4TH QUARTER 2011
|
|
|
|
|
RESIDENTIAL REAL ESTATE SECURITIES
|
Housing Prices
| ► | Our outlook for housing prices is unchanged from three months ago. Affordability looks better than it has in many years, when considering income and home prices. There is a significant overhang of supply, however, especially when considering “shadow” inventory that is not yet on the market. In addition, tight underwriting of residential mortgage loans will continue to limit buyers’ ability to obtain desired financing. Nationwide, we believe that home prices have an additional risk of 5% to 10% price declines, with actual declines likely to vary by market and product type. We believe we are in the process of forming a bottom, but do not expect housing, in general, to be a significantly appreciating asset class for several years. |
Delinquencies
| ► | Delinquencies were stable in the fourth quarter, but remain at historically elevated levels. According to LoanPerformance data, serious (90+ day) delinquencies rose by 0.23% quarter over quarter to 11.07% for prime loans and fell 0.12% quarter over quarter to 29.82% for Alt-A loans. The delinquencies on loans underlying Redwood’s portfolio are modestly lower than the industry as a whole. |
| ► | Early-stage roll rates (from loans “always current” to 30 days delinquent) improved slightly. Of previously “always current” prime loans, 0.53% missed their first payment in December 2011, down from 0.56% in September 2011, while the same metric for Alt-A was unchanged at 1.12%. These roll rates are high by historical standards but well below 2008-2010 levels, and we do not believe they reflect a pending “double dip.” This trend should eventually cause total delinquencies to fall, but for now the slowdown in new defaults is being balanced by an extension in liquidation timelines. |
Prepayments
| ► | Prepayments increased during the fourth quarter, particularly for borrowers with significant equity. Prime borrowers with loan-to-value (LTV) ratios below 100% prepaid at 20% CPR in December 2011 (up from 19% in September 2011), while Alt-A borrowers with equity paid at 8% CPR, up slightly from the prior period. The increases for prime borrowers were likely due to falling interest rates — according to Freddie Mac, the monthly average rate for new loans fell from 4.11% in September 2011 to 3.96% in December 2011. Borrowers without equity prepaid very slowly regardless of credit quality, with prime and Alt-A loans with LTV ratios above 100% prepaying at only 5% and 1% CPR, respectively, in line with the prior quarter. |
|
THE REDWOOD REVIEW 4TH QUARTER 2011
|
31
|
 |
|
|
LEGACY
INVESTMENTS IN OTHER CONSOLIDATED ENTITIES
|
Summary
What is this?
| Prior to 2010, we sponsored Sequoia and Acacia securitization entities that acquired mortgage loans and securities and created and issued ABS backed by these loans and securities. References to Sequoia’s activities prior to 2010 are referred to as “Legacy Sequoia.” Our New Sequoia program is active and issued ABS in 2010 and 2011, which is discussed in the New Sequoia Residential Mortgage Loan Business module. |
Quarterly Update
| ► | In the fourth quarter of 2011, we reported a combined loss of $3 million from Legacy Sequoia and Acacia entities, as compared to a combined loss of $1 million in the third quarter of 2011. The decrease was due to a combination of a $2 million reduction in net interest income as asset balances have continued to decrease, and a $3 million increase in the loan loss provision at Sequoia due to higher credit severities related to extended foreclosure processing times. These amounts were partially offset by a $2 million positive change in market valuation adjustments. |
| ► | Cash flow generated from our investments in Legacy Sequoia and Acacia entities totaled $5 million in the fourth quarter, as compared to $8 million in the third quarter. The primary differences between the $1 million combined loss and the $5 million in positive cash flow relate to non-cash charges for the loan loss provision at Legacy Sequoia entities, non-cash premium amortization, and principal payments. |
| ► | Cumulative losses for all 52 Legacy Sequoia residential mortgage securitizations sponsored by us (totaling $35 billion at issuance) totaled 0.62% of the original face amount of the securities through December 31, 2011. |
| ► | The consolidation of the assets and liabilities of securitization entities may lead to potentially volatile reported earnings for a variety of reasons, including the amortization of premiums on the loans and liabilities of Sequoia entities, changes in credit loss provisions for loans held by Sequoia entities, fair value adjustments for the assets and liabilities of the Acacia entities, and deconsolidation events. |
|
32
|
THE REDWOOD REVIEW 4TH QUARTER 2011
|

 |
|
|
ACCOUNTING DISCUSSION
|
Mark-to-Market Valuation Process
| ► | Market values reflect an “exit price,” or the amount we believe we would realize if we sold an asset or would pay if we repurchased a liability in an orderly transaction, even though we generally have no intention — nor would we be required — to sell assets or repurchase liabilities. Establishing market values is inherently subjective and requires us to make a number of assumptions, including the future of interest rates, prepayment rates, discount rates, credit loss rates, and the timing of credit losses. The assumptions we apply are specific to each asset or liability. |
| ► | We rely on our internal calculations to compute the fair value of our securities and we request and consider indications of value (marks) from third-party dealers to assist us in our mark-to-market valuation process. For December 31, 2011, we received dealer marks on 78% of our securities and 93% of our ABS issued. In the aggregate, our internal valuations of the securities on which we received dealer marks were 6% lower (i.e., more conservative) than the aggregate dealer marks, and our internal valuations of our ABS issued on which we received dealer marks were 1% higher (i.e., more conservative) than the aggregate dealer marks. |
Determining Other-Than-Temporary Impairments
| ► | The multi-step process for determining whether an investment security has other-than-temporary impairment is presented below. |
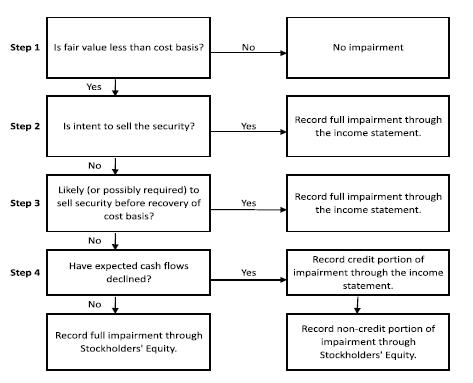
|
34
|
THE REDWOOD REVIEW 4TH QUARTER 2011
|
|
|
 |
|
GLOSSARY
|
ACACIA
Acacia is the brand name for the collateralized debt obligation (CDO) securitizations Redwood sponsored.
ADJUSTABLE-RATE MORTGAGES (ARMs)
Adjustable-rate mortgages are loans that have coupons that adjust at least once per year. We make a distinction between ARMs (loans with a rate adjustment at least annually) and hybrids (loans that have a fixed-rate period of 2 -10 years and then become adjustable-rate).
AGENCY
Agency refers to government-sponsored enterprises (GSEs), including Federal National Mortgage Association (Fannie Mae), Federal Home Loan Mortgage Corporation (Freddie Mac), and Government National Mortgage Association (Ginnie Mae).
ALT-A SECURITIES and ALT-A LOANS
Alt-A securities are residential mortgage-backed securities backed by loans that have higher credit quality than subprime and lower credit quality than prime. Alt-A originally represented loans with alternative documentation, but the definition has shifted over time to include loans with additional risk characteristics and in some cases investor loans. In an Alt-A loan, the borrower’s income may not be verified, and in some cases, may not be disclosed on the loan application. Alt-A loans may also have expanded criteria that allow for higher debt-to-income ratios with higher accompanying loan-to-value ratios than would otherwise be permissible for prime loans.
AMORTIZED COST
Amortized cost is the initial acquisition cost of an available-for-sale (AFS) security, minus principal repayments or principal reductions through credit losses, plus or minus premium or discount amortization. At the point in time an AFS security is deemed other-than-temporarily impaired, the amortized cost is adjusted (by changing the amount of unamortized premium or discount) by the amount of other-than-temporary impairment taken through the income statement.
ASSET-BACKED SECURITIES (ABS)
Asset-backed securities (ABS) are securities backed by financial assets that generate cash flows. Each ABS issued from a securitization entity has a unique priority with respect to receiving principal and interest cash flows and absorbing any credit losses from the assets owned by the entity.
AVAILABLE-FOR-SALE (AFS)
An accounting method for debt and equity securities in which the securities are reported at their fair value on the balance sheet. Positive changes in the fair value are accounted for as increases to stockholders’ equity and do not flow through the income statement. Negative changes in fair value may be recognized through the income statement or balance sheet, as further detailed in the Accounting Discussion module.
B-NOTES
B-Notes are subordinate interests in commercial mortgage debt which are either (i) evidenced by a subordinated promissory note secured by the same mortgage that also secures the senior debt relating to the same property or (ii) junior participation interests in mortgage debt that are subordinate to senior participation interests in the same mortgage debt. B-Notes typically provide the holder with certain rights to approve modifications to related lending agreements and to trigger foreclosure under the mortgage following an event of default. B-Notes also typically provide the holder certain limited rights to cure a borrower default under senior debt secured by the same mortgage in order to keep the senior debt current and avoid foreclosure.
|
THE REDWOOD REVIEW 4TH QUARTER 2011
|
35
|
|
|
|
GLOSSARY
|
BOOK VALUE (GAAP)
Book value is the value of our common equity in accordance with GAAP.
COLLATERALIZED DEBT OBLIGATION (CDO) SECURITIZATIONS
The securitization of a diverse pool of assets.
COMMERCIAL MORTGAGE-BACKED SECURITIES (CMBS)
A type of mortgage-backed security that is secured by one or more loans on commercial properties.
CONSTANT (or CONDITIONAL) PREPAYMENT RATE (CPR)
Constant (or conditional) prepayment rate (CPR) is an industry-standard measure of the speed at which mortgage loans prepay. It approximates the annual percentage rate at which a pool of loans is paying down due to unscheduled principal prepayments.
CORE EQUITY
Core equity is not a measure calculated in accordance with GAAP. GAAP equity includes mark-to-market adjustments for some of our assets and interest rate agreements in “accumulated other comprehensive income (loss).” Core equity excludes accumulated other comprehensive income (loss). Core equity in some ways approximates what our equity value would be if we used historical amortized cost accounting exclusively. A reconciliation of core equity to GAAP appears in the Table 3 in the Financial Tables in this Review.
CREDIT SUPPORT
Credit support is the face amount of securities subordinate (or junior) to the applicable security that protects the security from credit losses and is generally expressed as a percentage of the securitization’s underlying pool balance.
DEBT
Debt is an obligation of Redwood. See Long-term debt and Short-term debt.
ECONOMIC VALUE (MANAGEMENT’S ESTIMATE OF ECONOMIC VALUE)
Economic value closely relates to liquidation value and is calculated using the bid-side marks (or estimated bid-side values) for all of our financial assets, and offered-side marks (or estimated offered-side values) for all of our financial liabilities. We calculate management’s estimate of economic value as a supplemental measure to book value calculated under GAAP. Our economic value estimates on a per-share basis are reconciled to GAAP book values per share in Table 3 in the Financial Tables of this Review.
FASB
Financial Accounting Standards Board.
FHFA
The FHFA refers to the Federal Housing Finance Authority.
GAAP
Generally Accepted Accounting Principles in the United States.
GOVERNMENT SPONSORED ENTERPRISE (GSE)
A government sponsored enterprise is a financial services corporation created by the United States Congress to enhance the flow of credit to targeted sectors of the economy. Among the GSEs charted by Congress are Fannie Mae, Freddie Mac, and Ginnie Mae.
|
36
|
THE REDWOOD REVIEW 4TH QUARTER 2011
|
|
|
|
|
GLOSSARY
|
INTEREST-ONLY SECURITIES (IOs)
Interest-only securities (IOs) are specialized securities created by securitization entities where the projected cash flows generated by the underlying assets exceed the cash flows projected to be paid to the securities that are issued with principal balances. Typically, IOs do not have a principal balance and they will not receive principal payments. Interest payments to IOs usually equal an interest rate formula multiplied by a “notional” principal balance. The notional principal balances for IOs are typically reduced over time as the actual principal balance of the underlying pool of assets pays down, thus reducing the cash flows to the IOs over time. Cash flows on IOs are typically reduced more quickly when asset prepayments increase.
INVESTMENT CAPACITY
The amount of capacity we estimate that we have to invest in new assets. It is equal to our (1) cash on hand, plus (2) cash we estimated we could raise by increasing short-term borrowings to finance all our residential mortgage loans held for securitization, less (3) cash needed to cover short-term operations, working capital, and a liquidity cushion.
JUMBO LOAN
A jumbo loan is a mortgage loan that generally conforms to the underwriting standards of Fannie Mae and Freddie Mac except that the dollar amount of the loan exceeds the maximum limit set by the two GSEs for loans salable to the two companies.
LEVERAGE RATIOS
When determining Redwood’s financial leverage, traditional leverage ratios may be misleading in some respects if consolidated ABS issued from securitization entities are included as part of Redwood’s obligations when calculating this or similar ratios. Because of the requirement to consolidate the independent securitization entities for GAAP accounting purposes, it appears that Redwood is highly leveraged, with total consolidated liabilities significantly greater than equity. The obligations of these securitization entities are not obligations of Redwood.
LONG-TERM DEBT
Long-term debt is debt that is an obligation of Redwood that is not payable within a year and includes junior subordinated notes and trust preferred securities. We generally treat long-term debt as part of our capital base when it is not payable in the near future.
MARK-TO-MARKET (MTM) ACCOUNTING
Mark-to-market accounting uses estimated fair values of assets, liabilities, and hedges. Many assets on our consolidated balance sheet are carried at their fair value rather than amortized cost. Taxable income is generally not affected by market valuation adjustments.
MARKET VALUATION ADJUSTMENTS (MVAs)
Market valuation adjustments (MVAs) are changes in market values for certain assets and liabilities that are reported through our GAAP income statement. They include all changes in market values for assets and liabilities accounted for at fair value, such as trading securities and derivatives. They also include the credit portion of other-than-temporary impairments on securities available-for-sale, as well as impairments of loans held-for-sale and REO properties.
MEZZANINE LOAN
A mezzanine loan is a loan secured by the membership interests, partnership interests, and/or stock in a single purpose entity formed to own a commercial property, for example. If the mezzanine borrower fails to make its payments or otherwise defaults under the mezzanine loan documents, the mezzanine lender may pursue its remedies, including taking control of the single purpose entity that owns the property.
|
THE REDWOOD REVIEW 4TH QUARTER 2011
|
37
|
|
|
|
GLOSSARY
|
MORTGAGE SERVICING RIGHT (MSR)
A mortgage servicing right (MSR) gives the holder the contractual right to service a mortgage loan.
MSRs typically include the right to collect monthly mortgage principal and interest payments, as well as related tax and insurance payments, from borrowers, disburse funds to the mortgage debt holders and remit related insurance and tax payments, collect late payments, and process modifications and foreclosures. MSRs are created when mortgage loans are sold in a transaction in which the seller retains the right to service the loans. The holder of an MSR receives a monthly servicing fee (which generally ranges from 0.25% to 0.375% per annum of the outstanding principal balance of the related mortgage loan), which is deducted from the borrower’s monthly interest payments. For accounting purposes, MSRs are capitalized at the net present value of the servicing fee less the servicing cost. When Redwood holds MSRs relating to residential mortgage loans, it retains a sub-servicer to carry out actual servicing functions, as Redwood does not directly service residential mortgage loans.
NON-GAAP METRICS
Not all companies and analysts calculate non-GAAP metrics in the same manner. As a result, certain metrics as calculated by Redwood may not be comparable to similarly titled metrics reported by other companies. Redwood uses non-GAAP metrics such as management’s estimate of economic value and core equity to provide greater transparency for investors. Our non-GAAP metrics are reconciled to GAAP in the Financial Tables in this Review.
NON-PRIME SECURITIES
Non-prime securities are Alt-A, option ARM, and subprime securities. See definitions of Alt-A, option ARM, and subprime securities.
OPTION ARM LOAN
An option ARM loan is a residential mortgage loan that generally offers a borrower monthly payment options such as: 1) a minimum payment that results in negative amortization; 2) an interest-only payment; 3) a payment that would fully amortize the loan over an original 31-year amortization schedule; and, 4) a payment that would fully amortize the loan over a 15-year amortization schedule. To the extent the borrower has chosen an option that is not fully amortizing the loan (or negatively amortizing the loan), after a period — usually five years or once the negatively amortized loan balance reaches a certain level (generally 15% to 25% higher than the original balance) — the loan payments are recast. This recast provision resets the payment at a level that fully amortizes the loan over its remaining life and the new payment may be materially different than under the borrowers’ previous option.
PREFERRED EQUITY
A preferred equity investment is an investment in preferred equity of a special purpose entity that directly or indirectly owns a commercial property. An investor in preferred equity is typically entitled to a preferred return (relative to a holder of common equity of the same entity) and has the right, if the preferred return is not paid, to take control of the entity (and thereby control the underlying commercial property).
PRIME RESIDENTIAL REAL ESTATE LOANS
Prime loans are residential loans with higher quality credit characteristics, such as borrowers with higher FICO credit scores, lower loan-to-value ratios, lower debt-to-income ratios, greater levels of other assets, and more documentation.
|
38
|
THE REDWOOD REVIEW 4TH QUARTER 2011
|
|
|
|
|
GLOSSARY
|
PRIME SECURITIES
Prime securities are residential mortgage-backed securities backed by prime loans, generally with balances greater than conforming loan limits. Prime securities are typically backed by loans that have relatively high weighted average FICO scores (700 or higher), low weighted average LTVs (75% or less), limited concentrations of investor properties, and low percentages of loans with low FICO scores or high loan-to-value ratios.
PROFITABILITY RATIOS
Many financial institution analysts use asset-based profitability ratios such as interest rate spread and interest rate margin when analyzing financial institutions. These are asset-based measures. Since we consolidate the assets and liabilities of securitization entities for GAAP purposes, our total GAAP assets and liabilities may vary over time, and may not be comparable to assets typically used in profitability calculations for other financial institutions. As a result, we believe equity-based profitability ratios may be more appropriate than asset-based measures for analyzing Redwood’s operations and results. We believe, for example, that net interest income as a percentage of equity is a useful measure of profitability. For operating expenses, we believe useful measures are operating efficiency ratio (operating expenses as a percentage of net interest income) and operating expenses as a percentage of equity. We provide various profitability ratios in Table 4 in the Financial Tables in this Review.
REAL ESTATE INVESTMENT TRUST (REIT)
A real estate investment trust (REIT) is an entity that makes a tax election to be taxed as a REIT, invests in real estate assets, and meets other REIT qualifications, including the distribution as dividends of at least 90% of REIT taxable income. A REIT’s profits are not taxed at the corporate level to the extent that these profits are distributed as dividends to stockholders, providing an operating cost savings. On the other hand, the requirement to pay out as dividends most of the REIT’s taxable profits means it can be harder for a REIT to grow using only internally-generated funds (as opposed to raising new capital).
REAL ESTATE OWNED (REO)
Real estate owned (REO) refers to real property owned by the lender or loan owner that has been acquired through foreclosure.
REIT SUBSIDIARY
A REIT subsidiary is a subsidiary of a REIT that is taxed as a REIT.
REIT TAXABLE INCOME
REIT taxable income is not a measure calculated in accordance with GAAP. REIT taxable income is pre-tax income calculated for tax purposes at Redwood including only its qualifying REIT subsidiaries (i.e., excluding its taxable subsidiaries). REIT taxable income is an important measure as it is the basis of our dividend distribution requirements. We must distribute at least 90% of REIT taxable income as dividends to shareholders over time. As a REIT, we are not subject to corporate income taxes on the REIT taxable income we distribute. We pay income tax on the REIT taxable income we retain, if any (and we are permitted to retain up to 10% of total REIT taxable income). A reconciliation of REIT taxable income to GAAP income appears in Table 2 in the Financial Tables in this Review.
REMIC
A real estate mortgage investment conduit (REMIC) is a special purpose vehicle used to pool real estate mortgages and issue mortgage-backed securities. REMICs are typically exempt from tax at the entity level. REMICs may invest only in qualified mortgages and permitted investments, including single family or multifamily mortgages, commercial mortgages, second mortgages, mortgage participations, and federal agency pass-through securities.
|
THE REDWOOD REVIEW 4TH QUARTER 2011
|
39
|
|
|
|
GLOSSARY
|
RE-REMIC SECURITY
A re-REMIC is a re-securitization of asset-backed securities. The cash flows from and any credit losses absorbed by the underlying assets can be redirected to the resulting re-REMIC securities in a variety of ways.
RESECURITIZATION
A resecuritization is a securitization of two or more mortgage-backed securities into a new mortgage-backed securities into a new mortgage-backed security.
RESIDENTIAL MORTGAGE-BACKED SECURITIES (RMBS)
A type of mortgage-backed security that is backed by a pool of mortgages on residential properties.
RETURN ON EQUITY (ROE) and ADJUSTED RETURN ON EQUITY
ROE is the amount of profit we generate each year per dollar of equity capital and equals GAAP income divided by GAAP equity. Adjusted ROE is not a measure calculated in accordance with GAAP — it is GAAP income divided by core equity.
SENIOR SECURITIES
Generally, senior securities have the least credit risk in a securitization transaction because they are generally the last securities to absorb credit losses. In addition, the senior securities have the highest claim on the principal and interest payments (after the fees to servicers and trustees are paid.) To further reduce credit risk, most if not all, principal collected from the underlying asset pool is used to pay down the senior securities until certain performance tests are satisfied. If certain performance tests are satisfied, principal payments are shared between the senior securities and the subordinate securities, generally on a pro rata basis. At issuance, senior securities are generally triple A-rated.
SEQUOIA
Sequoia is the brand name for securitizations of residential real estate loans Redwood sponsors. Sequoia entities are independent securitization entities that acquire residential mortgage loans and create and issue asset-backed securities (ABS) backed by these loans. Most of the loans that Sequoia entities acquire are prime-quality loans. Most of the senior ABS created by Sequoia are sold to third-party investors. Redwood usually acquires most of the subordinated ABS and occasionally acquires the interest-only securities (IOs).
SHORT-TERM DEBT
Short-term debt is debt that is an obligation of Redwood and payable within a year. We may obtain this debt from a variety of Wall Street firms, banks, and other institutions. In the past, as another form of short-term debt, we have issued collateralized commercial paper. We may issue these or other forms of short-term debt in the future. We may use short-term debt to finance the accumulation of assets prior to sale to a securitization entity and to finance investments in high-quality loans and securities.
SUBORDINATE DEBT INVESTMENTS
Subordinate Debt Investments mean Mezzanine Loans, Preferred Equity, and B-Notes.
|
40
|
THE REDWOOD REVIEW 4TH QUARTER 2011
|
|
|
|
|
GLOSSARY
|
SUBORDINATE SECURITIES (JUNIOR SECURITIES or NON-SENIOR SECURITIES)
Subordinate securities absorb the initial credit losses from a securitization structure, thus protecting the senior securities. Subordinate securities have a lower priority to receive principal and interest payments than the senior securities. Subordinate securities receive little, if any, principal payments until certain performance tests are satisfied. If certain performance tests are satisfied, principal payments are shared between the senior securities and the subordinate securities, generally on a pro rata basis. Subordinate securities generally receive interest payments even if they do not receive principal payments. At issuance, subordinate securities are generally rated double-A or below.
SUBPRIME SECURITIES
Subprime securities are residential mortgage-backed securities backed by loans to borrowers who typically have lower credit scores and/or other credit deficiencies that prevent them from qualifying for prime or Alt-A mortgages and may have experienced credit problems in the past, such as late payments or bankruptcies. To compensate for the greater risks and higher costs to service the loans, subprime borrowers pay higher interest rates, points, and origination fees.
TAXABLE INCOME
Taxable income is not a measure calculated in accordance with GAAP. Taxable income is pre-tax income for Redwood and all its subsidiaries as calculated for tax purposes. Taxable income calculations differ significantly from GAAP income calculations. A reconciliation of taxable income to GAAP income appears in Table 2 in the Financial Tables in this Review.
TAXABLE SUBSIDIARY
A taxable subsidiary is a subsidiary of a REIT that is not taxed as a REIT and thus pays taxes on its income. A taxable subsidiary is not limited to investing in real estate and it can choose to retain all of its after-tax profits.
|
THE REDWOOD REVIEW 4TH QUARTER 2011
|
41
|
|
42
|
|

 |
Table 1: GAAP Earnings ($ in thousands, except per share data)
|
44 |
| Twelve | Twelve | |||||||||||||||||||||||||||||||||||||||||||
| 2011 | 2011 | 2011 | 2011 | 2010 | 2010 | 2010 | 2010 | 2009 | Months | Months | ||||||||||||||||||||||||||||||||||
| Q4 | Q3 | Q2 | Q1 | Q4 | Q3 | Q2 | Q1 | Q4 | 2011 | 2010 | ||||||||||||||||||||||||||||||||||
| Interest income | $ | 48,512 | $ | 45,096 | $ | 44,126 | $ | 44,025 | $ | 44,956 | $ | 49,249 | $ | 47,730 | $ | 50,449 | $ | 57,717 | $ | 181,759 | $ | 192,384 | ||||||||||||||||||||||
| Discount amortization on securities, net | 9,339 | 10,179 | 10,513 | 12,104 | 12,671 | 10,991 | 10,821 | 10,629 | 7,432 | 42,135 | 45,112 | |||||||||||||||||||||||||||||||||
| Other investment interest income | - | - | - | - | - | 2 | 4 | 9 | 12 | - | 15 | |||||||||||||||||||||||||||||||||
| Premium amortization expense on loans | (1,356 | ) | (1,879 | ) | (1,684 | ) | (1,796 | ) | (1,874 | ) | (1,227 | ) | (1,985 | ) | (2,371 | ) | (3,365 | ) | (6,715 | ) | (7,457 | ) | ||||||||||||||||||||||
| Total interest income | 56,495 | 53,396 | 52,955 | 54,333 | 55,753 | 59,015 | 56,570 | 58,716 | 61,796 | 217,179 | 230,054 | |||||||||||||||||||||||||||||||||
| Interest expense on short-term debt | (764 | ) | (78 | ) | (7 | ) | (182 | ) | (43 | ) | (2 | ) | (36 | ) | - | - | (1,031 | ) | (81 | ) | ||||||||||||||||||||||||
| Interest expense on ABS | (24,030 | ) | (19,907 | ) | (19,508 | ) | (17,817 | ) | (17,800 | ) | (19,582 | ) | (17,582 | ) | (16,145 | ) | (17,881 | ) | (81,262 | ) | (71,109 | ) | ||||||||||||||||||||||
| ABS issuance expense amortization | (630 | ) | (545 | ) | (568 | ) | (559 | ) | (370 | ) | (575 | ) | (475 | ) | (634 | ) | (575 | ) | (2,302 | ) | (2,054 | ) | ||||||||||||||||||||||
| ABS interest rate agreement expense | (1,171 | ) | (1,233 | ) | (1,252 | ) | (1,140 | ) | (1,189 | ) | (1,104 | ) | (1,127 | ) | (495 | ) | (1,123 | ) | (4,796 | ) | (3,915 | ) | ||||||||||||||||||||||
| ABS issuance premium amortization income | (136 | ) | (170 | ) | 78 | 96 | 168 | 187 | 196 | 208 | 223 | (132 | ) | 759 | ||||||||||||||||||||||||||||||
| Total ABS expense consolidated from trusts | (25,967 | ) | (21,855 | ) | (21,250 | ) | (19,420 | ) | (19,191 | ) | (21,074 | ) | (18,988 | ) | (17,066 | ) | (19,356 | ) | (88,492 | ) | (76,319 | ) | ||||||||||||||||||||||
| Interest expense on long-term debt | (2,384 | ) | (2,384 | ) | (2,375 | ) | (2,371 | ) | (2,390 | ) | (2,619 | ) | (2,140 | ) | (1,115 | ) | (1,168 | ) | (9,514 | ) | (8,264 | ) | ||||||||||||||||||||||
| Net interest income | 27,380 | 29,079 | 29,323 | 32,360 | 34,129 | 35,320 | 35,406 | 40,535 | 41,272 | 118,142 | 145,390 | |||||||||||||||||||||||||||||||||
| Provision for loan losses | (7,784 | ) | (3,978 | ) | (1,581 | ) | (2,808 | ) | (7,902 | ) | (2,436 | ) | (4,321 | ) | (9,476 | ) | (8,997 | ) | (16,151 | ) | (24,135 | ) | ||||||||||||||||||||||
| Market valuation adjustments, net | (9,682 | ) | (13,448 | ) | (11,147 | ) | (5,740 | ) | 380 | (1,573 | ) | (7,125 | ) | (11,236 | ) | (4,191 | ) | (40,017 | ) | (19,554 | ) | |||||||||||||||||||||||
| Net interest income after provision and market valuation adjustments | 9,914 | 11,653 | 16,595 | 23,812 | 26,607 | 31,311 | 23,960 | 19,823 | 28,084 | 61,974 | 101,701 | |||||||||||||||||||||||||||||||||
| Fixed compensation expense | (3,799 | ) | (3,702 | ) | (3,797 | ) | (4,145 | ) | (3,402 | ) | (3,314 | ) | (3,661 | ) | (4,109 | ) | (3,262 | ) | (15,443 | ) | (14,486 | ) | ||||||||||||||||||||||
| Variable compensation expense | (721 | ) | (863 | ) | (646 | ) | (600 | ) | (2,152 | ) | (2,206 | ) | (1,303 | ) | (1,880 | ) | (566 | ) | (2,830 | ) | (7,541 | ) | ||||||||||||||||||||||
| Equity compensation expense | (2,371 | ) | (1,929 | ) | (2,707 | ) | (2,060 | ) | (1,710 | ) | (1,507 | ) | (2,077 | ) | (6,059 | ) | (1,554 | ) | (9,067 | ) | (11,353 | ) | ||||||||||||||||||||||
| Severance expense | - | - | - | - | - | (48 | ) | (229 | ) | (81 | ) | - | - | (358 | ) | |||||||||||||||||||||||||||||
| Other operating expense | (5,683 | ) | (5,013 | ) | (4,937 | ) | (4,709 | ) | (5,673 | ) | (5,170 | ) | (3,957 | ) | (5,177 | ) | (5,498 | ) | (20,342 | ) | (19,977 | ) | ||||||||||||||||||||||
| Total operating expenses | (12,574 | ) | (11,507 | ) | (12,087 | ) | (11,514 | ) | (12,937 | ) | (12,245 | ) | (11,227 | ) | (17,306 | ) | (10,880 | ) | (47,682 | ) | (53,715 | ) | ||||||||||||||||||||||
| Realized gains on sales, net | - | 313 | 5,433 | 3,956 | 786 | 72 | 16,080 | 44,338 | 19,618 | 9,702 | 61,276 | |||||||||||||||||||||||||||||||||
| Realized gains (losses) on calls, net | 102 | 832 | 401 | (91 | ) | 726 | 1,494 | - | - | - | 1,244 | 2,220 | ||||||||||||||||||||||||||||||||
| Realized gains on sales and calls, net | 102 | 1,145 | 5,834 | 3,865 | 1,512 | 1,566 | 16,080 | 44,338 | 19,618 | 10,946 | 63,496 | |||||||||||||||||||||||||||||||||
| Noncontrolling interest | - | 20 | (888 | ) | 2,015 | (447 | ) | (532 | ) | (186 | ) | 15 | (143 | ) | 1,147 | (1,150 | ) | |||||||||||||||||||||||||||
| (Provision for) benefit from income taxes | - | (14 | ) | (14 | ) | (14 | ) | (26 | ) | (202 | ) | (26 | ) | (26 | ) | 3,613 | (42 | ) | (280 | ) | ||||||||||||||||||||||||
| Net (loss) income | $ | (2,558 | ) | $ | 1,297 | $ | 9,440 | $ | 18,164 | $ | 14,709 | $ | 19,898 | $ | 28,601 | $ | 46,844 | $ | 40,292 | $ | 26,343 | $ | 110,052 | |||||||||||||||||||||
| Diluted average shares | 78,370 | 78,471 | 79,478 | 79,372 | 78,944 | 78,961 | 78,852 | 78,542 | 78,101 | 78,300 | 78,811 | |||||||||||||||||||||||||||||||||
| Net (loss) income per share | $ | (0.03 | ) | $ | 0.01 | $ | 0.11 | $ | 0.22 | $ | 0.18 | $ | 0.25 | $ | 0.35 | $ | 0.58 | $ | 0.51 | $ | 0.31 | $ | 1.36 | |||||||||||||||||||||
| THE REDWOOD REVIEW 4TH QUARTER 2011 |
Table 1: GAAP Earnings
|
| |
Table 2: Taxable and GAAP Income (Loss)1 Differences and Dividends
($ in thousands, except per share data)
|
| Estimated 2011 Q4 (2) | Estimated Twelve Months 2011 | Actual Twelve Months 2010 | ||||||||||||||||||||||||||||||||||
| Taxable | GAAP | Taxable | GAAP | Taxable | GAAP | |||||||||||||||||||||||||||||||
| (Loss) Income | Income | Differences | Income (Loss) | Income | Differences | (Loss) Income | Income | Differences | ||||||||||||||||||||||||||||
| Taxable and GAAP Income (Loss) Differences | ||||||||||||||||||||||||||||||||||||
| Interest income | $ | 31,405 | $ | 56,495 | $ | (25,090 | ) | $ | 128,353 | $ | 217,179 | $ | (88,826 | ) | $ | 136,750 | $ | 230,054 | $ | (93,304 | ) | |||||||||||||||
| Interest expense | (6,558 | ) | (29,115 | ) | 22,557 | (16,759 | ) | (99,037 | ) | 82,278 | (8,545 | ) | (84,664 | ) | 76,119 | |||||||||||||||||||||
| Net interest income | 24,847 | 27,380 | (2,533 | ) | 111,594 | 118,142 | (6,548 | ) | 128,205 | 145,390 | (17,185 | ) | ||||||||||||||||||||||||
| Provision for loan losses | - | (7,784 | ) | 7,784 | - | (16,151 | ) | 16,151 | - | (24,135 | ) | 24,135 | ||||||||||||||||||||||||
| Realized credit losses | (14,888 | ) | - | (14,888 | ) | (57,526 | ) | - | (57,526 | ) | (99,586 | ) | 0 | (99,586 | ) | |||||||||||||||||||||
| Market valuation adjustments, net | - | (9,682 | ) | 9,682 | - | (40,017 | ) | 40,017 | - | (19,554 | ) | 19,554 | ||||||||||||||||||||||||
| Operating expenses | (11,426 | ) | (12,574 | ) | 1,148 | (45,459 | ) | (47,682 | ) | 2,223 | (44,804 | ) | (53,715 | ) | 8,911 | |||||||||||||||||||||
| Realized gains on sales and calls, net | - | 102 | (102 | ) | - | 10,946 | (10,946 | ) | 230 | 63,496 | (63,266 | ) | ||||||||||||||||||||||||
| (Provision for) benefit from income taxes | (15 | ) | - | (15 | ) | (15 | ) | (42 | ) | 27 | (8 | ) | (280 | ) | 272 | |||||||||||||||||||||
| Less: Net (loss) income attributable to noncontrolling interest | - | - | - | - | (1,147 | ) | 1,147 | - | 1,150 | (1,150 | ) | |||||||||||||||||||||||||
| (Loss) Income | $ | (1,482 | ) | $ | (2,558 | ) | $ | 1,076 | $ | 8,594 | $ | 26,343 | $ | (17,749 | ) | $ | (15,963 | ) | $ | 110,052 | $ | (126,015 | ) | |||||||||||||
| REIT taxable income (loss) | $ | 3,064 | $ | 19,269 | $ | 3,383 | ||||||||||||||||||||||||||||||
| Taxable (loss) income at taxable subsidiaries | (4,546 | ) | (10,675 | ) | (19,346 | ) | ||||||||||||||||||||||||||||||
| Taxable (loss) income | $ | (1,482 | ) | $ | 8,594 | $ | (15,963 | ) | ||||||||||||||||||||||||||||
| Shares used for taxable EPS calculation | 78,382 | 78,382 | 78,041 | |||||||||||||||||||||||||||||||||
| REIT taxable income (loss) per share (3) | $ | 0.04 | $ | 0.24 | $ | 0.05 | ||||||||||||||||||||||||||||||
| Taxable (loss) income at taxable subsidiaries per share | $ | (0.06 | ) | $ | (0.13 | ) | $ | (0.25 | ) | |||||||||||||||||||||||||||
| Taxable (loss) income per share (3) | $ | (0.02 | ) | $ | 0.11 | $ | (0.20 | ) | ||||||||||||||||||||||||||||
| Dividends | ||||||||||||||||||||||||||||||||||||
| Dividends declared | $ | 19,585 | $ | 78,382 | $ | 77,942 | ||||||||||||||||||||||||||||||
| Regular dividend per share (4) | $ | 0.25 | $ | 1.00 | $ | 1.00 | ||||||||||||||||||||||||||||||
(2) Reconciliation of GAAP income (loss) to taxable income (loss) for prior quarters is provided in the respective Redwood Reviews for those quarters.
(3) REIT taxable income (loss) per share and taxable income (loss) per share are based on the number of shares outstanding at the end of each quarter. The annual REIT taxable income (loss) per share and taxable income (loss) per share are the sum of the four quarterly per share estimates.
(4) Dividends in 2011 are expected to be characterized as 25% ordinary income, or $19 million, and 75% return of capital, or $59 million. Redwood's 2010 dividends were characterized as 62% ordinary income, or $48 million, and 38% return of capital, or $30 million. The portion of Redwood's dividends characterized as a return of capital are not taxable to a shareholder and reduces a shareholder's basis for shares held at each quarterly distribution date.
| THE REDWOOD REVIEW 4TH QUARTER 2011 |
Table 2: Taxable and GAAP Income (Loss)
Differences and Dividends
|
45 |
| |
Table 3: Book Value and Financial Ratios ($ in millions, except per share data)
|
46 |
| 2011 | 2011 | 2011 | 2011 | 2010 | 2010 | 2010 | 2010 | 2009 | ||||||||||||||||||||||||||||
| Q4 | Q3 | Q2 | Q1 | Q4 | Q3 | Q2 | Q1 | Q4 | ||||||||||||||||||||||||||||
| Short-term debt | $ | 428 | $ | - | $ | 41 | $ | - | $ | 44 | $ | - | $ | - | $ | - | $ | - | ||||||||||||||||||
| Long-term debt | 140 | 140 | 140 | 140 | 140 | 140 | 140 | 140 | 140 | |||||||||||||||||||||||||||
| Redwood debt (1) | $ | 568 | $ | 140 | $ | 181 | $ | 140 | $ | 184 | $ | 140 | $ | 140 | $ | 140 | $ | 140 | ||||||||||||||||||
| GAAP stockholders' equity | $ | 893 | $ | 959 | $ | 1,025 | $ | 1,075 | $ | 1,065 | $ | 1,016 | $ | 991 | $ | 998 | $ | 972 | ||||||||||||||||||
| Redwood debt to equity | 0.6 | x | 0.1 | x | 0.2 | x | 0.1 | x | 0.2 | x | 0.1 | x | 0.1 | x | 0.1 | x | 0.1 | x | ||||||||||||||||||
| Redwood debt to (equity + debt) | 39 | % | 13 | % | 15 | % | 12 | % | 15 | % | 12 | % | 12 | % | 12 | % | 13 | % | ||||||||||||||||||
| Redwood debt | $ | 568 | $ | 140 | $ | 181 | $ | 140 | $ | 184 | $ | 140 | $ | 140 | $ | 140 | $ | 140 | ||||||||||||||||||
| ABS obligations of consolidated securitization entities and resecuritization | 4,139 | 4,293 | 3,839 | 3,957 | 3,943 | 3,832 | 3,961 | 3,837 | 3,943 | |||||||||||||||||||||||||||
| Consolidated GAAP Debt | $ | 4,707 | $ | 4,433 | $ | 4,020 | $ | 4,097 | $ | 4,127 | $ | 3,972 | $ | 4,101 | $ | 3,977 | $ | 4,083 | ||||||||||||||||||
| Consolidated GAAP Debt to equity | 5.3 | x | 4.6 | x | 3.9 | x | 3.8 | x | 3.7 | x | 3.9 | x | 4.0 | x | 4.0 | x | 4.2 | x | ||||||||||||||||||
| Consolidated GAAP Debt to (equity + GAAP debt) | 84 | % | 82 | % | 80 | % | 79 | % | 79 | % | 80 | % | 81 | % | 80 | % | 81 | % | ||||||||||||||||||
| GAAP stockholders' equity | $ | 893 | $ | 959 | $ | 1,025 | $ | 1,075 | $ | 1,065 | $ | 1,016 | $ | 991 | $ | 998 | $ | 972 | ||||||||||||||||||
| Balance sheet mark-to-market adjustments | (13 | ) | 32 | 81 | 122 | 112 | 61 | 38 | 58 | 65 | ||||||||||||||||||||||||||
| Core equity (non-GAAP) | $ | 906 | $ | 927 | $ | 944 | $ | 953 | $ | 953 | $ | 955 | $ | 953 | $ | 940 | $ | 907 | ||||||||||||||||||
| Shares outstanding at period end (in thousands) | 78,556 | 78,495 | 78,555 | 78,139 | 78,125 | 77,984 | 77,908 | 77,751 | 77,737 | |||||||||||||||||||||||||||
| GAAP equity per share | $ | 11.36 | $ | 12.22 | $ | 13.04 | $ | 13.76 | $ | 13.63 | $ | 13.02 | $ | 12.71 | $ | 12.84 | $ | 12.50 | ||||||||||||||||||
| Adjustments: GAAP equity to estimated economic value (2) | ||||||||||||||||||||||||||||||||||||
| Investments in New Sequoia | $ | (0.13 | ) | $ | (0.06 | ) | $ | (0.05 | ) | $ | (0.06 | ) | $ | (0.06 | ) | $ | (0.04 | ) | $ | (0.03 | ) | $ | $ | - | ||||||||||||
| Other Consolidated Entities | 0.20 | 0.12 | 0.04 | - | (0.10 | ) | (0.24 | ) | (0.31 | ) | (0.37 | ) | (0.37 | ) | ||||||||||||||||||||||
| Long-term debt | 1.06 | 1.06 | 0.78 | 0.75 | 0.84 | 0.99 | 1.00 | 0.85 | 0.90 | |||||||||||||||||||||||||||
| ABS issued - Resecuritization | (0.04 | ) | (0.01 | ) | - | - | - | - | - | - | - | |||||||||||||||||||||||||
| Estimate of economic value per share (non-GAAP) | $ | 12.45 | $ | 13.33 | $ | 13.81 | $ | 14.45 | $ | 14.31 | $ | 13.73 | $ | 13.37 | $ | 13.32 | $ | 13.03 | ||||||||||||||||||
(1) Excludes obligations of consolidated securitization entities and the resecuritization we engaged in during the third quarter of 2011.
(2) Differences between GAAP and economic value per share reflect our estimate of the economic value of investments in New Sequoia Entities and Other Consolidated Entities and our long-term debt. See pages 16 and 17 for an explanation of these adjustments. In reviewing the components of book value and economic value, there are a number of important factors and limitations to consider. Book value and economic value are calculated as of particular points in time based on our existing assets and liabilities and do not incorporate other factors that may have a significant impact on that value, most notably the impact of future business activities. As a result, these values do not necessarily represent an estimate of our net realizable value, liquidation value, or our market value as a whole. Amounts we ultimately realize from the disposition of assets or settlement of liabilities may vary significantly from these values. Because temporary changes in market conditions can substantially affect value, we do not believe that short-term fluctuations in the value of our assets and liabilities are necessarily representative of the effectiveness of our investment strategy or the long-term underlying value of our business. When quoted market prices or observable market data are not available to estimate fair value, we rely on unobservable inputs, which are generally more subjective and involve a high degree of management judgment and assumptions. These assumptions may have a significant effect on our estimates of value, and the use of different assumptions as well as changes in market conditions could have a material effect on our results of operations or financial condition.
| THE REDWOOD REVIEW 4TH QUARTER 2011 |
Table 3: Book Value and Financial Ratios
|
| |
Table 4: Yields and Profitability Ratios1 ($ in thousands)
|
| Twelve | Twelve | |||||||||||||||||||||||||||||||||||||||||||
| 2011 | 2011 | 2011 | 2011 | 2010 | 2010 | 2010 | 2010 | 2009 | Months | Months | ||||||||||||||||||||||||||||||||||
| Q4 | Q3 | Q2 | Q1 | Q4 | Q3 | Q2 | Q1 | Q4 | 2011 | 2010 | ||||||||||||||||||||||||||||||||||
| Interest income | $ | 56,495 | $ | 53,396 | $ | 52,955 | $ | 54,333 | $ | 55,753 | $ | 59,015 | $ | 56,570 | $ | 58,716 | $ | 61,796 | $ | 217,179 | $ | 230,054 | ||||||||||||||||||||||
| Average consolidated earning assets | $ | 5,419,721 | $ | 5,143,814 | $ | 5,080,343 | $ | 5,107,979 | $ | 4,980,935 | $ | 5,030,680 | $ | 5,139,945 | $ | 5,070,987 | $ | 5,175,337 | $ | 5,181,515 | $ | 5,055,322 | ||||||||||||||||||||||
| Asset yield | 4.17 | % | 4.15 | % | 4.17 | % | 4.25 | % | 4.48 | % | 4.69 | % | 4.40 | % | 4.63 | % | 4.78 | % | 4.19 | % | 4.55 | % | ||||||||||||||||||||||
| Interest expense | $ | (29,115 | ) | $ | (24,317 | ) | $ | (23,632 | ) | $ | (21,973 | ) | $ | (21,624 | ) | $ | (23,695 | ) | $ | (21,164 | ) | $ | (18,181 | ) | $ | (20,524 | ) | $ | (99,037 | ) | $ | (84,664 | ) | |||||||||||
| Average consolidated interest-bearing liabilities | $ | 4,481,303 | $ | 4,105,088 | $ | 4,025,216 | $ | 3,977,010 | $ | 3,937,895 | $ | 4,016,680 | $ | 4,077,992 | $ | 4,015,655 | $ | 4,096,928 | $ | 4,148,421 | $ | 4,011,855 | ||||||||||||||||||||||
| Cost of funds | 2.60 | % | 2.37 | % | 2.35 | % | 2.21 | % | 2.20 | % | 2.36 | % | 2.08 | % | 1.81 | % | 2.00 | % | 2.39 | % | 2.11 | % | ||||||||||||||||||||||
| Asset yield | 4.17 | % | 4.15 | % | 4.17 | % | 4.25 | % | 4.48 | % | 4.69 | % | 4.40 | % | 4.63 | % | 4.78 | % | 4.19 | % | 4.55 | % | ||||||||||||||||||||||
| Cost of funds | (2.60 | %) | (2.37 | %) | (2.35 | %) | (2.21 | %) | (2.20 | %) | (2.36 | %) | (2.08 | %) | (1.81 | %) | (2.00 | %) | (2.39 | %) | (2.11 | %) | ||||||||||||||||||||||
| Interest rate spread | 1.57 | % | 1.78 | % | 1.82 | % | 2.04 | % | 2.28 | % | 2.33 | % | 2.33 | % | 2.82 | % | 2.77 | % | 1.80 | % | 2.44 | % | ||||||||||||||||||||||
| Net interest income | $ | 27,380 | $ | 29,079 | $ | 29,323 | $ | 32,360 | $ | 34,129 | $ | 35,320 | $ | 35,406 | $ | 40,535 | $ | 41,272 | $ | 118,142 | $ | 145,390 | ||||||||||||||||||||||
| Average consolidated earning assets | $ | 5,419,721 | $ | 5,143,814 | $ | 5,080,343 | $ | 5,107,979 | $ | 4,980,935 | $ | 5,030,680 | $ | 5,139,945 | $ | 5,070,987 | $ | 5,175,337 | $ | 5,181,515 | $ | 5,055,322 | ||||||||||||||||||||||
| Net interest margin | 2.02 | % | 2.26 | % | 2.31 | % | 2.53 | % | 2.74 | % | 2.81 | % | 2.76 | % | 3.20 | % | 3.19 | % | 2.28 | % | 2.88 | % | ||||||||||||||||||||||
| Operating expenses | $ | (12,574 | ) | $ | (11,507 | ) | $ | (12,087 | ) | $ | (11,514 | ) | $ | (12,937 | ) | $ | (12,245 | ) | $ | (11,227 | ) | $ | (17,306 | ) | $ | (10,880 | ) | $ | (47,682 | ) | $ | (53,715 | ) | |||||||||||
| Average total assets | $ | 5,577,206 | $ | 5,303,614 | $ | 5,263,529 | $ | 5,310,376 | $ | 5,141,550 | $ | 5,161,498 | $ | 5,263,730 | $ | 5,219,636 | $ | 5,293,887 | $ | 5,357,065 | $ | 5,196,294 | ||||||||||||||||||||||
| Average total equity | $ | 912,051 | $ | 976,676 | $ | 1,035,063 | $ | 1,092,580 | $ | 1,038,045 | $ | 1,003,372 | $ | 1,005,212 | $ | 985,350 | $ | 945,862 | $ | 1,003,523 | $ | 1,008,127 | ||||||||||||||||||||||
| Operating expenses / net interest income | 45.92 | % | 39.57 | % | 41.22 | % | 35.58 | % | 37.91 | % | 34.67 | % | 31.71 | % | 42.69 | % | 26.36 | % | 40.36 | % | 36.95 | % | ||||||||||||||||||||||
| Operating expenses / average total assets | 0.90 | % | 0.87 | % | 0.92 | % | 0.87 | % | 1.01 | % | 0.95 | % | 0.85 | % | 1.33 | % | 0.82 | % | 0.89 | % | 1.03 | % | ||||||||||||||||||||||
| Operating expenses / average total equity | 5.51 | % | 4.71 | % | 4.67 | % | 4.22 | % | 4.99 | % | 4.88 | % | 4.47 | % | 7.03 | % | 4.60 | % | 4.75 | % | 5.33 | % | ||||||||||||||||||||||
| GAAP net (loss) income | $ | (2,558 | ) | $ | 1,297 | $ | 9,440 | $ | 18,164 | $ | 14,709 | $ | 19,898 | $ | 28,601 | $ | 46,844 | $ | 40,292 | $ | 26,343 | $ | 110,052 | |||||||||||||||||||||
| GAAP net (loss) income / average total assets | (0.18 | %) | 0.10 | % | 0.72 | % | 1.37 | % | 1.14 | % | 1.54 | % | 2.17 | % | 3.59 | % | 3.04 | % | 0.49 | % | 2.12 | % | ||||||||||||||||||||||
| GAAP net (loss) income / average equity (GAAP ROE) | (1.12 | %) | 0.53 | % | 3.65 | % | 6.65 | % | 5.67 | % | 7.93 | % | 11.38 | % | 19.02 | % | 17.04 | % | 2.63 | % | 10.92 | % | ||||||||||||||||||||||
| GAAP net (loss) income / average core equity (adjusted ROE) (2) | (1.13 | %) | 0.56 | % | 4.04 | % | 7.53 | % | 6.14 | % | 8.25 | % | 12.00 | % | 20.09 | % | 17.99 | % | 2.83 | % | 11.56 | % | ||||||||||||||||||||||
| Average core equity (2) | $ | 908,915 | $ | 921,048 | $ | 934,205 | $ | 964,554 | $ | 958,194 | $ | 964,249 | $ | 953,720 | $ | 932,721 | $ | 896,034 | $ | 931,998 | $ | 952,324 | ||||||||||||||||||||||
(1) All percentages in this table are shown on an annualized basis.
(2) Core equity is a non-GAAP metric and is equal to GAAP equity excluding accumulated other comprehensive income (loss).
| THE REDWOOD REVIEW 4TH QUARTER 2011 |
Table 4: Yields and Profitability Ratios
|
47 |
| |
Table
5: Average Balance Sheet ($ in thousands)
|
48 |
| Twelve | Twelve | |||||||||||||||||||||||||||||||||||||||||||
| 2011 | 2011 | 2011 | 2011 | 2010 | 2010 | 2010 | 2010 | 2009 | Months | Months | ||||||||||||||||||||||||||||||||||
| Q4 | Q3 | Q2 | Q1 | Q4 | Q3 | Q2 | Q1 | Q4 | 2011 | 2010 | ||||||||||||||||||||||||||||||||||
| Real estate assets at Redwood | ||||||||||||||||||||||||||||||||||||||||||||
| Commercial loans | $ | 123,367 | $ | 79,445 | $ | 59,545 | $ | 36,434 | $ | 14,095 | $ | 242 | $ | 243 | $ | 244 | $ | 245 | $ | 74,949 | $ | 3,734 | ||||||||||||||||||||||
| Residential loans | 306,869 | 313,763 | 123,914 | 204,847 | 169,691 | 16,463 | 2,299 | 2,313 | 2,314 | 237,837 | 48,064 | |||||||||||||||||||||||||||||||||
| Senior residential securities | ||||||||||||||||||||||||||||||||||||||||||||
| Prime | 248,211 | 244,502 | 246,957 | 255,884 | 262,048 | 270,286 | 278,472 | 283,477 | 280,101 | 248,856 | 273,503 | |||||||||||||||||||||||||||||||||
| Non-prime | 280,066 | 283,043 | 283,784 | 307,253 | 321,655 | 316,089 | 302,461 | 310,948 | 263,022 | 288,447 | 312,827 | |||||||||||||||||||||||||||||||||
| Total senior residential securities | 528,277 | 527,545 | 530,741 | 563,137 | 583,703 | 586,375 | 580,933 | 594,426 | 543,124 | 537,303 | 586,330 | |||||||||||||||||||||||||||||||||
| Residential Re-REMIC securities | 74,560 | 41,598 | 30,447 | 32,648 | 32,917 | 33,250 | 34,385 | 45,852 | 73,938 | 44,919 | 36,556 | |||||||||||||||||||||||||||||||||
| Subordinate residential securities | ||||||||||||||||||||||||||||||||||||||||||||
| Prime | 69,477 | 72,199 | 63,141 | 53,046 | 45,914 | 35,794 | 38,079 | 41,701 | 47,083 | 64,532 | 40,371 | |||||||||||||||||||||||||||||||||
| Non-prime | 11,433 | 10,885 | 11,183 | 12,140 | 11,890 | 9,181 | 7,708 | 4,253 | 1,377 | 11,407 | 8,282 | |||||||||||||||||||||||||||||||||
| Total subordinate residential securities | 80,910 | 83,084 | 74,324 | 65,186 | 57,804 | 44,975 | 45,787 | 45,954 | 48,460 | 75,939 | 48,653 | |||||||||||||||||||||||||||||||||
| Commercial subordinate securities | 4,272 | 4,720 | 5,200 | 6,288 | 6,948 | 7,274 | 7,417 | 7,670 | 8,090 | 5,114 | 7,325 | |||||||||||||||||||||||||||||||||
| CDO | 960 | 1,247 | 1,297 | 1,252 | 973 | 1,103 | 1,207 | 1,222 | 1,962 | 1,188 | 1,126 | |||||||||||||||||||||||||||||||||
| Total real estate assets at Redwood | 1,119,215 | 1,051,402 | 825,468 | 909,792 | 866,131 | 689,682 | 672,270 | 697,681 | 678,133 | 977,249 | 731,788 | |||||||||||||||||||||||||||||||||
| Earning assets at Acacia | 255,801 | 285,985 | 315,039 | 347,786 | 311,949 | 292,468 | 290,060 | 299,843 | 304,436 | 293,677 | 298,597 | |||||||||||||||||||||||||||||||||
| Earning assets at Legacy Sequoia | 3,140,931 | 3,207,500 | 3,287,938 | 3,351,214 | 3,425,633 | 3,505,497 | 3,589,882 | 3,666,884 | 3,767,112 | 3,246,211 | 3,546,199 | |||||||||||||||||||||||||||||||||
| Earning assets at the Fund | - | - | 4,948 | 22,280 | 33,001 | 34,334 | 35,526 | 42,134 | 53,990 | 6,727 | 36,219 | |||||||||||||||||||||||||||||||||
| Total earning assets at Other Consolidated Entities | 3,396,732 | 3,493,485 | 3,607,925 | 3,721,280 | 3,770,583 | 3,832,300 | 3,915,468 | 4,008,861 | 4,125,538 | 3,546,615 | 3,881,015 | |||||||||||||||||||||||||||||||||
| Earning assets at New Sequoia | 697,396 | 392,622 | 396,742 | 225,564 | 162,271 | 204,504 | 161,502 | - | - | 429,277 | 132,712 | |||||||||||||||||||||||||||||||||
| Cash and cash equivalents | 203,242 | 150,677 | 149,350 | 123,317 | 102,099 | 265,071 | 339,212 | 311,816 | 321,838 | 156,849 | 254,004 | |||||||||||||||||||||||||||||||||
| Earning assets | 5,416,585 | 5,088,186 | 4,979,485 | 4,979,953 | 4,901,084 | 4,991,557 | 5,088,452 | 5,018,358 | 5,125,509 | 5,109,990 | 4,999,519 | |||||||||||||||||||||||||||||||||
| Balance sheet mark-to-market adjustments | 3,136 | 55,628 | 100,858 | 128,026 | 79,851 | 39,123 | 51,493 | 52,629 | 49,828 | 71,525 | 55,803 | |||||||||||||||||||||||||||||||||
| Earning assets - reported value | 5,419,721 | 5,143,814 | 5,080,343 | 5,107,979 | 4,980,935 | 5,030,680 | 5,139,945 | 5,070,987 | 5,175,337 | 5,181,515 | 5,055,322 | |||||||||||||||||||||||||||||||||
| Other assets | 157,485 | 159,800 | 183,186 | 202,397 | 160,615 | 130,818 | 123,785 | 148,649 | 118,550 | 175,550 | 140,972 | |||||||||||||||||||||||||||||||||
| Total assets | $ | 5,577,206 | $ | 5,303,614 | $ | 5,263,529 | $ | 5,310,376 | $ | 5,141,550 | $ | 5,161,498 | $ | 5,263,730 | $ | 5,219,636 | $ | 5,293,887 | $ | 5,357,065 | $ | 5,196,294 | ||||||||||||||||||||||
| Short-term debt | $ | 157,992 | $ | 18,116 | $ | 1,797 | $ | 47,976 | $ | 11,265 | $ | - | $ | 7,920 | $ | - | $ | - | $ | 56,667 | $ | 4,814 | ||||||||||||||||||||||
| Legacy Sequoia ABS issued | 3,092,037 | 3,153,659 | 3,229,493 | 3,289,456 | 3,365,929 | 3,439,201 | 3,518,773 | 3,589,269 | 3,666,201 | 3,190,518 | 3,477,574 | |||||||||||||||||||||||||||||||||
| New Sequoia ABS issued | 646,095 | 356,430 | 359,793 | 197,758 | 147,364 | 184,615 | 144,201 | - | - | 391,155 | 119,628 | |||||||||||||||||||||||||||||||||
| Resecuritization ABS issued | 222,652 | 180,769 | - | - | - | - | - | - | - | 101,684 | - | |||||||||||||||||||||||||||||||||
| Acacia ABS issued | 224,273 | 257,872 | 295,902 | 303,601 | 274,630 | 254,244 | 268,715 | 288,241 | 288,041 | 270,160 | 271,373 | |||||||||||||||||||||||||||||||||
| Other liabilities | 183,852 | 221,592 | 200,708 | 232,062 | 151,332 | 126,428 | 164,764 | 200,096 | 231,553 | 202,272 | 160,428 | |||||||||||||||||||||||||||||||||
| Long-term debt | 138,254 | 138,242 | 138,231 | 138,219 | 138,707 | 138,620 | 138,383 | 138,145 | 137,907 | 138,237 | 138,466 | |||||||||||||||||||||||||||||||||
| Total liabilities | 4,665,155 | 4,326,680 | 4,225,924 | 4,209,072 | 4,089,227 | 4,143,108 | 4,242,755 | 4,215,751 | 4,323,702 | 4,350,693 | 4,172,283 | |||||||||||||||||||||||||||||||||
| Noncontrolling interest | - | 258 | 2,542 | 8,724 | 14,278 | 15,018 | 15,763 | 18,535 | 24,322 | 2,849 | 15,884 | |||||||||||||||||||||||||||||||||
| Core equity (1) | 908,915 | 921,048 | 934,205 | 964,554 | 958,194 | 964,249 | 953,720 | 932,721 | 896,034 | 931,998 | 952,324 | |||||||||||||||||||||||||||||||||
| Accumulated other comprehensive income (loss) | 3,136 | 55,628 | 100,858 | 128,026 | 79,851 | 39,123 | 51,493 | 52,629 | 49,829 | 71,525 | 55,803 | |||||||||||||||||||||||||||||||||
| Total equity | 912,051 | 976,676 | 1,035,063 | 1,092,580 | 1,038,045 | 1,003,372 | 1,005,212 | 985,350 | 945,863 | 1,003,523 | 1,008,127 | |||||||||||||||||||||||||||||||||
| Total liabilities and equity | $ | 5,577,206 | $ | 5,303,614 | $ | 5,263,529 | $ | 5,310,376 | $ | 5,141,550 | $ | 5,161,498 | $ | 5,263,730 | $ | 5,219,636 | $ | 5,293,887 | $ | 5,357,065 | $ | 5,196,294 | ||||||||||||||||||||||
(1) Core equity is a non-GAAP metric and is equal to GAAP equity excluding accumulated other comprehensive income (loss).
| THE REDWOOD REVIEW 4TH QUARTER 2011 |
Table 5: Average Balance Sheet
|
| |
Table 6: Balances & Yields by Securities Portfolio at Redwood1 ($ in thousands)
|
| 2011 | 2011 | 2011 | 2011 | 2010 | 2010 | 2011 | 2011 | 2011 | 2011 | 2010 | 2010 | ||||||||||||||||||||||||||||||||||||||||
| Q4 | Q3 | Q2 | Q1 | Q4 | Q3 | Q4 | Q3 | Q2 | Q1 | Q4 | Q3 | ||||||||||||||||||||||||||||||||||||||||
| Residential Prime Senior AFS | Residential Non-Prime Subordinate AFS | ||||||||||||||||||||||||||||||||||||||||||||||||||
| Principal balance | $ | 341,780 | $ | 329,466 | $ | 336,876 | $ | 346,317 | $ | 358,683 | $ | 368,191 | Principal balance | $ | 29,864 | $ | 26,063 | $ | 26,940 | $ | 29,095 | $ | 31,556 | $ | 27,461 | ||||||||||||||||||||||||||
| Unamortized discount | (58,424 | ) | (59,415 | ) | (71,985 | ) | (78,306 | ) | (83,465 | ) | (88,978 | ) | Unamortized discount | (9,495 | ) | (7,783 | ) | (8,196 | ) | (8,466 | ) | (10,123 | ) | (7,279 | ) | ||||||||||||||||||||||||||
| Credit reserve | (27,806 | ) | (28,330 | ) | (18,433 | ) | (16,679 | ) | (15,667 | ) | (12,822 | ) | Credit reserve | (8,477 | ) | (7,639 | ) | (7,913 | ) | (9,469 | ) | (9,229 | ) | (11,323 | ) | ||||||||||||||||||||||||||
| Unrealized gains, net | 22,690 | 35,204 | 39,488 | 54,860 | 56,340 | 49,543 | Unrealized (losses) gains, net | (739 | ) | (180 | ) | 46 | 868 | 984 | 953 | ||||||||||||||||||||||||||||||||||||
| Fair value | $ | 278,240 | $ | 276,925 | $ | 285,946 | $ | 306,192 | $ | 315,891 | $ | 315,934 | Fair value | $ | 11,153 | $ | 10,461 | $ | 10,877 | $ | 12,028 | $ | 13,188 | $ | 9,812 | ||||||||||||||||||||||||||
| Average amortized cost | $ | 248,211 | $ | 244,502 | $ | 246,957 | $ | 255,884 | $ | 262,048 | $ | 270,286 | Average amortized cost | $ | 11,283 | $ | 10,727 | $ | 11,017 | $ | 11,957 | $ | 11,670 | $ | 8,988 | ||||||||||||||||||||||||||
| Interest income | $ | 6,651 | $ | 6,894 | $ | 7,099 | $ | 7,479 | $ | 8,306 | $ | 7,617 | Interest income | $ | 509 | $ | 502 | $ | 531 | $ | 598 | $ | 619 | $ | 545 | ||||||||||||||||||||||||||
| Annualized yield | 10.72 | % | 11.28 | % | 11.50 | % | 11.69 | % | 12.68 | % | 11.27 | % | Annualized yield | 18.04 | % | 18.73 | % | 19.27 | % | 20.01 | % | 21.22 | % | 24.25 | % | ||||||||||||||||||||||||||
| Residential Non-Prime Senior AFS | Commercial Subordinate AFS | ||||||||||||||||||||||||||||||||||||||||||||||||||
| Principal balance | $ | 349,385 | $ | 357,809 | $ | 367,209 | $ | 372,394 | $ | 416,169 | $ | 431,143 | Principal balance | $ | 50,499 | $ | 54,061 | $ | 58,127 | $ | 74,782 | $ | 89,103 | $ | 109,275 | ||||||||||||||||||||||||||
| Unamortized discount | (75,661 | ) | (71,365 | ) | (81,672 | ) | (87,569 | ) | (104,517 | ) | (111,709 | ) | Unamortized discount | (3,554 | ) | (2,551 | ) | (4,361 | ) | (4,784 | ) | (5,591 | ) | (5,610 | ) | ||||||||||||||||||||||||||
| Credit reserve | (16,536 | ) | (24,663 | ) | (19,129 | ) | (17,292 | ) | (15,928 | ) | (14,193 | ) | Credit reserve | (43,012 | ) | (47,197 | ) | (48,987 | ) | (64,717 | ) | (76,979 | ) | (96,657 | ) | ||||||||||||||||||||||||||
| Unrealized (losses) gains, net | (1,464 | ) | 16,380 | 22,310 | 30,225 | 30,641 | 27,588 | Unrealized gains, net | 1,512 | 1,574 | 1,086 | 1,081 | 963 | 904 | |||||||||||||||||||||||||||||||||||||
| Fair value | $ | 255,724 | $ | 278,161 | $ | 288,718 | $ | 297,758 | $ | 326,365 | $ | 332,829 | Fair value | $ | 5,445 | $ | 5,887 | $ | 5,865 | $ | 6,362 | $ | 7,496 | $ | 7,912 | ||||||||||||||||||||||||||
| Average amortized cost | $ | 259,281 | $ | 263,760 | $ | 265,130 | $ | 287,991 | $ | 301,498 | $ | 297,197 | Average amortized cost | $ | 4,272 | $ | 4,720 | $ | 5,199 | $ | 6,288 | $ | 6,948 | $ | 7,274 | ||||||||||||||||||||||||||
| Interest income | $ | 6,436 | $ | 7,199 | $ | 7,418 | $ | 8,338 | $ | 8,415 | $ | 8,583 | Interest income | $ | 377 | $ | 553 | $ | 558 | $ | 492 | $ | 616 | $ | 2,135 | ||||||||||||||||||||||||||
| Annualized yield | 9.93 | % | 10.92 | % | 11.19 | % | 11.58 | % | 11.16 | % | 11.55 | % | Annualized yield | 35.33 | % | 46.87 | % | 42.95 | % | 31.30 | % | 35.46 | % | 117.40 | % | ||||||||||||||||||||||||||
| Residential Re-REMIC AFS | CDO Subordinate AFS | ||||||||||||||||||||||||||||||||||||||||||||||||||
| Principal balance | $ | 220,697 | $ | 194,245 | $ | 131,860 | $ | 131,860 | $ | 139,426 | $ | 139,426 | Principal balance | $ | 10,717 | $ | 10,689 | $ | 11,863 | $ | 11,837 | $ | 14,815 | $ | 14,786 | ||||||||||||||||||||||||||
| Unamortized discount | (78,226 | ) | (68,861 | ) | (52,375 | ) | (54,855 | ) | (62,471 | ) | (65,691 | ) | Unamortized discount | - | (1,082 | ) | (1,083 | ) | (1,082 | ) | (1,082 | ) | (1,082 | ) | |||||||||||||||||||||||||||
| Credit reserve | (60,563 | ) | (58,106 | ) | (49,033 | ) | (46,546 | ) | (44,182 | ) | (40,656 | ) | Credit reserve | (10,717 | ) | (9,607 | ) | (10,780 | ) | (10,755 | ) | (13,733 | ) | (13,704 | ) | ||||||||||||||||||||||||||
| Unrealized gains, net | 37,458 | 45,822 | 47,123 | 55,038 | 52,304 | 41,812 | Unrealized gains, net | 50 | 50 | 100 | - | - | - | ||||||||||||||||||||||||||||||||||||||
| Fair value | $ | 119,366 | $ | 113,100 | $ | 77,575 | $ | 85,497 | $ | 85,077 | $ | 74,891 | Fair value | $ | 50 | $ | 50 | $ | 100 | $ | - | $ | - | $ | - | ||||||||||||||||||||||||||
| Average amortized cost | $ | 74,560 | $ | 41,598 | $ | 30,447 | $ | 32,648 | $ | 32,917 | $ | 33,250 | Average amortized cost | $ | - | $ | - | $ | - | $ | - | $ | - | $ | - | ||||||||||||||||||||||||||
| Interest income | $ | 2,473 | $ | 1,675 | $ | 1,437 | $ | 1,480 | $ | 1,440 | $ | 1,458 | Interest income | $ | - | $ | - | $ | - | $ | 34 | $ | - | $ | 8 | ||||||||||||||||||||||||||
| Annualized yield | 13.27 | % | 16.11 | % | 18.87 | % | 18.13 | % | 17.50 | % | 17.55 | % | Annualized yield | N/A | N/A | N/A | N/A | N/A | N/A | ||||||||||||||||||||||||||||||||
| Residential Prime Subordinate AFS | Fair Value Securities | ||||||||||||||||||||||||||||||||||||||||||||||||||
| Principal balance | $ | 207,226 | $ | 227,562 | $ | 248,331 | $ | 258,615 | $ | 273,042 | $ | 278,171 | |||||||||||||||||||||||||||||||||||||||
| Unamortized discount | (14,027 | ) | (22,097 | ) | (29,434 | ) | (24,016 | ) | (24,308 | ) | (23,488 | ) | |||||||||||||||||||||||||||||||||||||||
| Credit reserve | (128,879 | ) | (134,116 | ) | (146,391 | ) | (179,587 | ) | (199,754 | ) | (217,996 | ) | |||||||||||||||||||||||||||||||||||||||
| Unrealized (losses) gains, net | (5,603 | ) | (1,071 | ) | (963 | ) | 3,858 | 4,866 | (3,663 | ) | |||||||||||||||||||||||||||||||||||||||||
| Fair value | $ | 58,717 | $ | 70,278 | $ | 71,543 | $ | 58,870 | $ | 53,846 | $ | 33,024 | Fair value | $ | 22,041 | $ | 22,199 | $ | 20,451 | $ | 20,701 | $ | 21,354 | $ | 22,826 | ||||||||||||||||||||||||||
| Average amortized cost | $ | 69,148 | $ | 71,873 | $ | 62,786 | $ | 52,642 | $ | 45,550 | $ | 35,443 | Average fair value | $ | 22,223 | $ | 21,014 | $ | 20,472 | $ | 21,101 | $ | 21,713 | $ | 20,539 | ||||||||||||||||||||||||||
| Interest income | $ | 3,709 | $ | 3,618 | $ | 3,582 | $ | 4,110 | $ | 4,170 | $ | 3,328 | Interest income | $ | 1,883 | $ | 2,032 | $ | 2,008 | $ | 2,124 | $ | 2,241 | $ | 2,350 | ||||||||||||||||||||||||||
| Annualized yield | 21.46 | % | 20.14 | % | 22.82 | % | 31.23 | % | 36.61 | % | 37.55 | % | Annualized yield | 33.89 | % | 38.68 | % | 39.24 | % | 40.27 | % | 41.29 | % | 45.76 | % | ||||||||||||||||||||||||||
| THE REDWOOD REVIEW 4TH QUARTER 2011 |
Table 6: Balances & Yields by Securities Portfolio at Redwood
|
49 |
| |
Table 7: Securities and Loans Portfolio Activity at Redwood ($ in thousands)
|
50 |
| 2011 | 2011 | 2011 | 2011 | 2010 | 2010 | 2011 | 2011 | 2011 | 2011 | 2010 | 2010 | ||||||||||||||||||||||||||||||||||||||||
| Q4 | Q3 | Q2 | Q1 | Q4 | Q3 | Q4 | Q3 | Q2 | Q1 | Q4 | Q3 | ||||||||||||||||||||||||||||||||||||||||
| Residential Prime Senior | Commercial Subordinate | ||||||||||||||||||||||||||||||||||||||||||||||||||
| Beginning fair value | $ | 276,925 | $ | 285,946 | $ | 306,192 | $ | 315,891 | $ | 315,934 | $ | 309,702 | Beginning fair value | $ | 5,887 | $ | 5,865 | $ | 6,362 | $ | 7,496 | $ | 7,912 | $ | 7,610 | ||||||||||||||||||||||||||
| Acquisitions | 20,373 | 2,433 | 8,844 | 3,317 | 6,043 | 9,954 | Acquisitions | - | - | - | - | - | - | ||||||||||||||||||||||||||||||||||||||
| Sales | - | - | (8,554 | ) | (2,825 | ) | - | - | Sales | - | - | - | (2,116 | ) | - | - | |||||||||||||||||||||||||||||||||||
| Effect of principal payments | (8,411 | ) | (9,235 | ) | (11,019 | ) | (11,655 | ) | (15,199 | ) | (12,186 | ) | Effect of principal payments | - | - | - | - | - | - | ||||||||||||||||||||||||||||||||
| Change in fair value, net | (10,647 | ) | (2,219 | ) | (9,517 | ) | 1,464 | 9,113 | 8,464 | Change in fair value, net | (442 | ) | 22 | (497 | ) | 982 | (416 | ) | 302 | ||||||||||||||||||||||||||||||||
| Ending fair value | $ | 278,240 | $ | 276,925 | $ | 285,946 | $ | 306,192 | $ | 315,891 | $ | 315,934 | Ending fair value | $ | 5,445 | $ | 5,887 | $ | 5,865 | $ | 6,362 | $ | 7,496 | $ | 7,912 | ||||||||||||||||||||||||||
| Residential Non-Prime Senior | CDO Subordinate | ||||||||||||||||||||||||||||||||||||||||||||||||||
| Beginning fair value | $ | 298,917 | $ | 307,404 | $ | 316,626 | $ | 346,107 | $ | 354,106 | $ | 320,397 | Beginning fair value | $ | 1,010 | $ | 1,403 | $ | 1,296 | $ | 1,038 | $ | 960 | $ | 1,132 | ||||||||||||||||||||||||||
| Acquisitions | 1,299 | 1,202 | 3,154 | - | 635 | 32,777 | Acquisitions | - | - | - | - | - | - | ||||||||||||||||||||||||||||||||||||||
| Sales | - | - | - | (24,486 | ) | - | - | Sales | - | - | - | - | - | - | |||||||||||||||||||||||||||||||||||||
| Effect of principal payments | (7,880 | ) | (8,509 | ) | (7,613 | ) | (9,033 | ) | (12,298 | ) | (9,657 | ) | Effect of principal payments | - | - | - | - | - | - | ||||||||||||||||||||||||||||||||
| Change in fair value, net | (16,004 | ) | (1,180 | ) | (4,763 | ) | 4,038 | 3,664 | 10,589 | Change in fair value, net | - | (393 | ) | 107 | 258 | 78 | (172 | ) | |||||||||||||||||||||||||||||||||
| Ending fair value | $ | 276,332 | $ | 298,917 | $ | 307,404 | $ | 316,626 | $ | 346,107 | $ | 354,106 | Ending fair value | $ | 1,010 | $ | 1,010 | $ | 1,403 | $ | 1,296 | $ | 1,038 | $ | 960 | ||||||||||||||||||||||||||
| Residential Re-REMIC | Residential Real Estate Loans | ||||||||||||||||||||||||||||||||||||||||||||||||||
| Beginning fair value | $ | 113,100 | $ | 77,575 | $ | 85,497 | $ | 85,077 | $ | 74,891 | $ | 69,070 | Beginning carrying value | $ | 228,906 | $ | 205,301 | $ | 54,870 | $ | 254,936 | $ | 63,487 | $ | 2,404 | ||||||||||||||||||||||||||
| Acquisitions | 14,800 | 36,888 | - | - | - | - | Acquisitions | 174,767 | 404,597 | 152,042 | 98,960 | 194,863 | 62,135 | ||||||||||||||||||||||||||||||||||||||
| Sales | - | - | - | (5,230 | ) | - | - | Sales | (235 | ) | - | - | - | - | - | ||||||||||||||||||||||||||||||||||||
| Effect of principal payments | - | - | - | - | - | - | Transfers to Securitization Entities | - | (376,226 | ) | - | (295,103 | ) | - | - | ||||||||||||||||||||||||||||||||||||
| Change in fair value, net | (8,534 | ) | (1,363 | ) | (7,922 | ) | 5,650 | 10,186 | 5,821 | Principal repayments | (8,189 | ) | (5,115 | ) | (1,616 | ) | (3,922 | ) | (3,517 | ) | (601 | ) | |||||||||||||||||||||||||||||
| Ending fair value | $ | 119,366 | $ | 113,100 | $ | 77,575 | $ | 85,497 | $ | 85,077 | $ | 74,891 | Transfers to REO | - | - | - | - | - | (63 | ) | |||||||||||||||||||||||||||||||
| Changes in fair value, net | (12 | ) | 349 | 5 | (1 | ) | 103 | (388 | ) | ||||||||||||||||||||||||||||||||||||||||||
| Residential Prime Subordinate | Ending carrying value | $ | 395,237 | $ | 228,906 | $ | 205,301 | $ | 54,870 | $ | 254,936 | $ | 63,487 | ||||||||||||||||||||||||||||||||||||||
| Beginning fair value | $ | 70,606 | $ | 71,845 | $ | 59,239 | $ | 54,232 | $ | 33,384 | $ | 16,406 | |||||||||||||||||||||||||||||||||||||||
| Acquisitions | - | 3,491 | 21,277 | 9,906 | 15,283 | 7,088 | Commercial Real Estate Loans | ||||||||||||||||||||||||||||||||||||||||||||
| Sales | - | - | - | - | - | - | Beginning carrying value | $ | 98,060 | $ | 71,168 | $ | 42,483 | $ | 30,537 | $ | 242 | $ | 243 | ||||||||||||||||||||||||||||||||
| Effect of principal payments | (2,301 | ) | (1,995 | ) | (1,743 | ) | (2,073 | ) | (692 | ) | 883 | Originations | 60,297 | 26,908 | 28,660 | 11,925 | 30,275 | - | |||||||||||||||||||||||||||||||||
| Change in fair value, net | (9,245 | ) | (2,735 | ) | (6,928 | ) | (2,826 | ) | 6,257 | 9,007 | Principal repayments | (59 | ) | (25 | ) | (2 | ) | (2 | ) | (2 | ) | (2 | ) | ||||||||||||||||||||||||||||
| Ending fair value | $ | 59,060 | $ | 70,606 | $ | 71,845 | $ | 59,239 | $ | 54,232 | $ | 33,384 | Provision for credit losses | (608 | ) | - | - | - | - | - | |||||||||||||||||||||||||||||||
| Discount/fee amortization | 36 | 9 | 27 | 23 | 22 | 1 | |||||||||||||||||||||||||||||||||||||||||||||
| Residential Non-Prime Subordinate | Ending carrying value | $ | 157,726 | $ | 98,060 | $ | 71,168 | $ | 42,483 | $ | 30,537 | $ | 242 | ||||||||||||||||||||||||||||||||||||||
| Beginning fair value | $ | 10,616 | $ | 11,036 | $ | 12,196 | $ | 13,376 | $ | 10,041 | $ | 10,030 | |||||||||||||||||||||||||||||||||||||||
| Acquisitions | 1,582 | - | - | - | 3,820 | - | |||||||||||||||||||||||||||||||||||||||||||||
| Sales | - | - | - | (703 | ) | - | - | ||||||||||||||||||||||||||||||||||||||||||||
| Effect of principal payments | (364 | ) | (287 | ) | (336 | ) | (354 | ) | (542 | ) | (320 | ) | |||||||||||||||||||||||||||||||||||||||
| Change in fair value, net | (551 | ) | (133 | ) | (824 | ) | (123 | ) | 57 | 331 | |||||||||||||||||||||||||||||||||||||||||
| Ending fair value | $ | 11,283 | $ | 10,616 | $ | 11,036 | $ | 12,196 | $ | 13,376 | $ | 10,041 | |||||||||||||||||||||||||||||||||||||||
| THE REDWOOD REVIEW 4TH QUARTER 2011 |
Table 7: Securities and Loans Portfolio Activity at Redwood
|
| |
Table 8A: Residential Prime Securities at Redwood and Underlying Loan Characteristics1 ($ in thousands)
|
| 2011 | 2011 | 2011 | 2011 | 2010 | 2010 | 2010 | 2010 | |||||||||||||||||||||||||
| Q4 | Q3 | Q2 | Q1 | Q4 | Q3 | Q2 | Q1 | |||||||||||||||||||||||||
| Senior AFS | $ | 278,240 | $ | 276,925 | $ | 285,946 | $ | 306,192 | $ | 315,891 | $ | 315,934 | $ | 309,702 | $ | 372,140 | ||||||||||||||||
| Subordinate AFS | 58,717 | 70,278 | 71,543 | 58,870 | 53,846 | 33,024 | 16,024 | 16,250 | ||||||||||||||||||||||||
| Fair value | 343 | 328 | 302 | 369 | 386 | 360 | 382 | 346 | ||||||||||||||||||||||||
| Total Residential Prime Securities | $ | 337,300 | $ | 347,531 | $ | 357,791 | $ | 365,431 | $ | 370,123 | $ | 349,318 | $ | 326,108 | $ | 388,736 | ||||||||||||||||
| Number of loans | 85,702 | 92,071 | 101,149 | 109,221 | 121,173 | 124,536 | 140,951 | 156,375 | ||||||||||||||||||||||||
| Total loan face | $ | 31,848,071 | $ | 34,816,750 | $ | 39,160,316 | $ | 43,242,656 | $ | 49,071,513 | $ | 52,490,472 | $ | 59,814,476 | $ | 71,413,439 | ||||||||||||||||
| Average loan size | $ | 372 | $ | 378 | $ | 387 | $ | 396 | $ | 405 | $ | 421 | $ | 424 | $ | 457 | ||||||||||||||||
| Year 2008 origination | 0 | % | 0 | % | 0 | % | 0 | % | 0 | % | 0 | % | 0 | % | 0 | % | ||||||||||||||||
| Year 2007 origination | 10 | % | 10 | % | 9 | % | 10 | % | 9 | % | 11 | % | 7 | % | 10 | % | ||||||||||||||||
| Year 2006 origination | 1 | % | 1 | % | 1 | % | 11 | % | 11 | % | 11 | % | 14 | % | 12 | % | ||||||||||||||||
| Year 2005 origination | 19 | % | 19 | % | 18 | % | 17 | % | 17 | % | 16 | % | 20 | % | 21 | % | ||||||||||||||||
| Year 2004 origination and earlier | 70 | % | 70 | % | 72 | % | 62 | % | 63 | % | 62 | % | 59 | % | 57 | % | ||||||||||||||||
| Geographic concentration | ||||||||||||||||||||||||||||||||
| Southern CA | 23 | % | 23 | % | 24 | % | 24 | % | 24 | % | 25 | % | 25 | % | 25 | % | ||||||||||||||||
| Northern CA | 21 | % | 21 | % | 21 | % | 22 | % | 22 | % | 22 | % | 22 | % | 22 | % | ||||||||||||||||
| New York | 6 | % | 6 | % | 6 | % | 6 | % | 7 | % | 7 | % | 6 | % | 7 | % | ||||||||||||||||
| Florida | 6 | % | 6 | % | 6 | % | 6 | % | 6 | % | 6 | % | 6 | % | 6 | % | ||||||||||||||||
| Virginia | 4 | % | 4 | % | 4 | % | 4 | % | 4 | % | 4 | % | 4 | % | 4 | % | ||||||||||||||||
| New Jersey | 3 | % | 3 | % | 3 | % | 3 | % | 3 | % | 3 | % | 3 | % | 3 | % | ||||||||||||||||
| Illinois | 3 | % | 3 | % | 3 | % | 3 | % | 3 | % | 3 | % | 3 | % | 3 | % | ||||||||||||||||
| Other states | 34 | % | 34 | % | 33 | % | 32 | % | 31 | % | 30 | % | 31 | % | 30 | % | ||||||||||||||||
| Wtd Avg Original LTV | 68 | % | 68 | % | 68 | % | 68 | % | 68 | % | 68 | % | 68 | % | 68 | % | ||||||||||||||||
| Original LTV: 0 - 50 | 12 | % | 12 | % | 13 | % | 12 | % | 13 | % | 13 | % | 13 | % | 13 | % | ||||||||||||||||
| Original LTV: 50.01 - 60 | 11 | % | 11 | % | 12 | % | 11 | % | 12 | % | 11 | % | 12 | % | 11 | % | ||||||||||||||||
| Original LTV: 60.01 - 70 | 23 | % | 23 | % | 23 | % | 22 | % | 22 | % | 22 | % | 22 | % | 22 | % | ||||||||||||||||
| Original LTV: 70.01 - 80 | 49 | % | 49 | % | 48 | % | 50 | % | 49 | % | 49 | % | 50 | % | 51 | % | ||||||||||||||||
| Original LTV: 80.01 - 90 | 3 | % | 3 | % | 3 | % | 3 | % | 3 | % | 3 | % | 2 | % | 2 | % | ||||||||||||||||
| Original LTV: 90.01 - 100 | 2 | % | 2 | % | 1 | % | 2 | % | 1 | % | 2 | % | 1 | % | 1 | % | ||||||||||||||||
| Unknown | 0 | % | 0 | % | 0 | % | 0 | % | 0 | % | 0 | % | 0 | % | 0 | % | ||||||||||||||||
| Wtd Avg FICO | 735 | 735 | 735 | 736 | 737 | 738 | 739 | 740 | ||||||||||||||||||||||||
| FICO: <= 680 | 11 | % | 11 | % | 11 | % | 10 | % | 10 | % | 8 | % | 9 | % | 8 | % | ||||||||||||||||
| FICO: 681 - 700 | 10 | % | 10 | % | 10 | % | 10 | % | 10 | % | 10 | % | 9 | % | 9 | % | ||||||||||||||||
| FICO: 701 - 720 | 14 | % | 14 | % | 14 | % | 14 | % | 14 | % | 14 | % | 14 | % | 14 | % | ||||||||||||||||
| FICO: 721 - 740 | 15 | % | 15 | % | 15 | % | 14 | % | 14 | % | 15 | % | 15 | % | 14 | % | ||||||||||||||||
| FICO: 741 - 760 | 16 | % | 16 | % | 16 | % | 16 | % | 16 | % | 16 | % | 16 | % | 16 | % | ||||||||||||||||
| FICO: 761 - 780 | 17 | % | 17 | % | 17 | % | 18 | % | 18 | % | 19 | % | 19 | % | 19 | % | ||||||||||||||||
| FICO: 781 - 800 | 12 | % | 12 | % | 12 | % | 13 | % | 13 | % | 13 | % | 13 | % | 14 | % | ||||||||||||||||
| FICO: >= 801 | 3 | % | 3 | % | 3 | % | 3 | % | 3 | % | 3 | % | 3 | % | 4 | % | ||||||||||||||||
| Unknown | 2 | % | 2 | % | 2 | % | 2 | % | 2 | % | 2 | % | 3 | % | 2 | % | ||||||||||||||||
| Conforming balance % (2) | 55 | % | 54 | % | 60 | % | 59 | % | 59 | % | 58 | % | 58 | % | 57 | % | ||||||||||||||||
| > $1 MM % | 8 | % | 8 | % | 8 | % | 8 | % | 9 | % | 9 | % | 9 | % | 9 | % | ||||||||||||||||
| 2nd Home % | 7 | % | 7 | % | 7 | % | 7 | % | 7 | % | 7 | % | 7 | % | 7 | % | ||||||||||||||||
| Investment Home % | 2 | % | 2 | % | 2 | % | 2 | % | 2 | % | 2 | % | 2 | % | 2 | % | ||||||||||||||||
| Purchase | 40 | % | 39 | % | 39 | % | 42 | % | 42 | % | 43 | % | 43 | % | 45 | % | ||||||||||||||||
| Cash Out Refi | 23 | % | 23 | % | 23 | % | 23 | % | 23 | % | 22 | % | 22 | % | 22 | % | ||||||||||||||||
| Rate-Term Refi | 36 | % | 37 | % | 37 | % | 34 | % | 34 | % | 34 | % | 34 | % | 33 | % | ||||||||||||||||
| Other | 1 | % | 1 | % | 1 | % | 1 | % | 1 | % | 1 | % | 1 | % | 0 | % | ||||||||||||||||
| Full Doc | 51 | % | 51 | % | 51 | % | 50 | % | 50 | % | 50 | % | 55 | % | 55 | % | ||||||||||||||||
| No Doc | 6 | % | 6 | % | 6 | % | 5 | % | 6 | % | 5 | % | 5 | % | 5 | % | ||||||||||||||||
| Other Doc (Lim, Red, Stated, etc) | 40 | % | 40 | % | 40 | % | 42 | % | 41 | % | 42 | % | 38 | % | 37 | % | ||||||||||||||||
| Unknown/Not Categorized | 3 | % | 3 | % | 3 | % | 3 | % | 3 | % | 3 | % | 2 | % | 3 | % | ||||||||||||||||
| 2-4 Family | 1 | % | 1 | % | 1 | % | 1 | % | 2 | % | 1 | % | 1 | % | 2 | % | ||||||||||||||||
| Condo | 9 | % | 9 | % | 9 | % | 10 | % | 10 | % | 10 | % | 10 | % | 10 | % | ||||||||||||||||
| Single Family | 89 | % | 89 | % | 89 | % | 88 | % | 87 | % | 88 | % | 87 | % | 87 | % | ||||||||||||||||
| Other | 1 | % | 1 | % | 1 | % | 1 | % | 1 | % | 1 | % | 1 | % | 1 | % | ||||||||||||||||
(1) Only the loan groups providing direct cash flow to securities we own are included.
(2) The definition of a conforming loan has significantly changed over time. For Q3 2011 and subsequent periods, the conforming balance definition that went into effect on October 1, 2011 was used (which had a maximum loan balance of $625,500). For all periods prior to Q3 2011, the conforming balance definition available in June 2011 was used (which had a maximum loan balance of $729,750).
| THE REDWOOD REVIEW 4TH QUARTER 2011 |
Table 8A: Residential Prime Securities at Redwood and
Underlying Loan Characteristics
|
51 |
| |
Table 8B: Residential Non-Prime Securities at Redwood and Underlying Loan Characteristics1
($ in thousands)
|
52 |
| 2011 | 2011 | 2011 | 2011 | 2010 | 2010 | 2010 | 2010 | |||||||||||||||||||||||||
| Q4 | Q3 | Q2 | Q1 | Q4 | Q3 | Q2 | Q1 | |||||||||||||||||||||||||
| Senior AFS | $ | 255,724 | $ | 278,161 | $ | 288,718 | $ | 297,758 | $ | 326,365 | $ | 332,829 | $ | 303,635 | $ | 349,141 | ||||||||||||||||
| Subordinate AFS | 11,153 | 10,461 | 10,877 | 12,028 | 13,188 | 9,812 | 9,842 | 6,353 | ||||||||||||||||||||||||
| Fair value | 20,738 | 20,911 | 18,845 | 19,036 | 19,930 | 21,506 | 16,950 | 18,422 | ||||||||||||||||||||||||
| Total Residential Non-prime Securities | $ | 287,615 | $ | 309,533 | $ | 318,440 | $ | 328,822 | $ | 359,483 | $ | 364,147 | $ | 330,427 | $ | 373,916 | ||||||||||||||||
| Number of loans | 54,717 | 54,538 | 55,830 | 57,542 | 65,949 | 67,713 | 72,621 | 79,448 | ||||||||||||||||||||||||
| Total loan face | $ | 11,730,410 | $ | 11,878,085 | $ | 12,250,760 | $ | 12,723,531 | $ | 14,615,940 | $ | 15,181,465 | $ | 16,931,963 | $ | 19,644,742 | ||||||||||||||||
| Average loan size | $ | 214 | $ | 218 | $ | 219 | $ | 221 | $ | 222 | $ | 224 | $ | 233 | $ | 247 | ||||||||||||||||
| Year 2008 origination | 0 | % | 0 | % | 0 | % | 0 | % | 0 | % | 0 | % | 0 | % | 0 | % | ||||||||||||||||
| Year 2007 origination | 0 | % | 0 | % | 0 | % | 0 | % | 0 | % | 0 | % | 7 | % | 10 | % | ||||||||||||||||
| Year 2006 origination | 14 | % | 14 | % | 15 | % | 15 | % | 18 | % | 18 | % | 18 | % | 9 | % | ||||||||||||||||
| Year 2005 origination | 50 | % | 51 | % | 50 | % | 50 | % | 49 | % | 49 | % | 45 | % | 50 | % | ||||||||||||||||
| Year 2004 origination and earlier | 36 | % | 35 | % | 35 | % | 35 | % | 33 | % | 33 | % | 30 | % | 31 | % | ||||||||||||||||
| Geographic concentration | ||||||||||||||||||||||||||||||||
| Southern CA | 21 | % | 21 | % | 21 | % | 21 | % | 20 | % | 21 | % | 22 | % | 23 | % | ||||||||||||||||
| Northern CA | 15 | % | 15 | % | 15 | % | 14 | % | 14 | % | 14 | % | 14 | % | 17 | % | ||||||||||||||||
| Florida | 9 | % | 9 | % | 9 | % | 9 | % | 9 | % | 9 | % | 9 | % | 8 | % | ||||||||||||||||
| New York | 5 | % | 5 | % | 5 | % | 5 | % | 5 | % | 5 | % | 5 | % | 5 | % | ||||||||||||||||
| Virginia | 3 | % | 3 | % | 3 | % | 3 | % | 4 | % | 4 | % | 4 | % | 3 | % | ||||||||||||||||
| New Jersey | 3 | % | 3 | % | 3 | % | 3 | % | 3 | % | 3 | % | 4 | % | 3 | % | ||||||||||||||||
| Illinois | 3 | % | 3 | % | 3 | % | 3 | % | 3 | % | 3 | % | 3 | % | 3 | % | ||||||||||||||||
| Other states | 41 | % | 41 | % | 41 | % | 42 | % | 42 | % | 41 | % | 40 | % | 38 | % | ||||||||||||||||
| Wtd Avg Original LTV | 73 | % | 73 | % | 73 | % | 73 | % | 73 | % | 73 | % | 73 | % | 73 | % | ||||||||||||||||
| Original LTV: 0 - 50 | 6 | % | 7 | % | 7 | % | 6 | % | 7 | % | 7 | % | 7 | % | 6 | % | ||||||||||||||||
| Original LTV: 50.01 - 60 | 8 | % | 8 | % | 8 | % | 8 | % | 8 | % | 8 | % | 8 | % | 8 | % | ||||||||||||||||
| Original LTV: 60.01 - 70 | 18 | % | 18 | % | 18 | % | 18 | % | 18 | % | 18 | % | 18 | % | 18 | % | ||||||||||||||||
| Original LTV: 70.01 - 80 | 58 | % | 58 | % | 58 | % | 58 | % | 58 | % | 58 | % | 58 | % | 58 | % | ||||||||||||||||
| Original LTV: 80.01 - 90 | 7 | % | 6 | % | 6 | % | 7 | % | 6 | % | 6 | % | 6 | % | 7 | % | ||||||||||||||||
| Original LTV: 90.01 - 100 | 3 | % | 3 | % | 3 | % | 3 | % | 3 | % | 3 | % | 3 | % | 3 | % | ||||||||||||||||
| Unknown | 0 | % | 0 | % | 0 | % | 0 | % | 0 | % | 0 | % | 0 | % | 0 | % | ||||||||||||||||
| Wtd Avg FICO | 710 | 710 | 710 | 711 | 711 | 711 | 711 | 712 | ||||||||||||||||||||||||
| FICO: <= 680 | 27 | % | 27 | % | 27 | % | 27 | % | 28 | % | 27 | % | 27 | % | 26 | % | ||||||||||||||||
| FICO: 681 - 700 | 14 | % | 14 | % | 14 | % | 14 | % | 14 | % | 14 | % | 14 | % | 14 | % | ||||||||||||||||
| FICO: 701 - 720 | 14 | % | 14 | % | 14 | % | 14 | % | 14 | % | 14 | % | 14 | % | 15 | % | ||||||||||||||||
| FICO: 721 - 740 | 12 | % | 12 | % | 12 | % | 12 | % | 12 | % | 12 | % | 12 | % | 13 | % | ||||||||||||||||
| FICO: 741 - 760 | 12 | % | 12 | % | 12 | % | 12 | % | 11 | % | 12 | % | 11 | % | 12 | % | ||||||||||||||||
| FICO: 761 - 780 | 10 | % | 10 | % | 10 | % | 10 | % | 10 | % | 10 | % | 10 | % | 10 | % | ||||||||||||||||
| FICO: 781 - 800 | 7 | % | 7 | % | 7 | % | 7 | % | 7 | % | 7 | % | 7 | % | 7 | % | ||||||||||||||||
| FICO: >= 801 | 2 | % | 2 | % | 2 | % | 2 | % | 2 | % | 2 | % | 2 | % | 2 | % | ||||||||||||||||
| Unknown | 2 | % | 2 | % | 2 | % | 2 | % | 2 | % | 2 | % | 2 | % | 1 | % | ||||||||||||||||
| Conforming balance % (2) | 83 | % | 82 | % | 86 | % | 86 | % | 86 | % | 86 | % | 85 | % | 81 | % | ||||||||||||||||
| > $1 MM % | 3 | % | 3 | % | 3 | % | 3 | % | 3 | % | 3 | % | 4 | % | 6 | % | ||||||||||||||||
| 2nd Home % | 4 | % | 4 | % | 4 | % | 4 | % | 4 | % | 4 | % | 4 | % | 5 | % | ||||||||||||||||
| Investment Home % | 14 | % | 14 | % | 13 | % | 13 | % | 13 | % | 13 | % | 13 | % | 11 | % | ||||||||||||||||
| Purchase | 41 | % | 41 | % | 41 | % | 42 | % | 42 | % | 42 | % | 40 | % | 39 | % | ||||||||||||||||
| Cash Out Refi | 42 | % | 42 | % | 42 | % | 41 | % | 41 | % | 41 | % | 41 | % | 42 | % | ||||||||||||||||
| Rate-Term Refi | 16 | % | 16 | % | 16 | % | 16 | % | 16 | % | 16 | % | 18 | % | 18 | % | ||||||||||||||||
| Other | 1 | % | 1 | % | 1 | % | 1 | % | 1 | % | 1 | % | 1 | % | 1 | % | ||||||||||||||||
| Full Doc | 38 | % | 39 | % | 38 | % | 39 | % | 38 | % | 38 | % | 36 | % | 37 | % | ||||||||||||||||
| No Doc | 5 | % | 4 | % | 4 | % | 4 | % | 3 | % | 3 | % | 3 | % | 3 | % | ||||||||||||||||
| Other Doc (Lim, Red, Stated, etc) | 56 | % | 56 | % | 56 | % | 56 | % | 57 | % | 57 | % | 59 | % | 59 | % | ||||||||||||||||
| Unknown/Not Categorized | 1 | % | 1 | % | 2 | % | 1 | % | 2 | % | 2 | % | 2 | % | 1 | % | ||||||||||||||||
| 2-4 Family | 8 | % | 8 | % | 8 | % | 8 | % | 8 | % | 8 | % | 8 | % | 6 | % | ||||||||||||||||
| Condo | 8 | % | 8 | % | 8 | % | 8 | % | 8 | % | 8 | % | 8 | % | 8 | % | ||||||||||||||||
| Single Family | 84 | % | 84 | % | 84 | % | 84 | % | 84 | % | 84 | % | 84 | % | 86 | % | ||||||||||||||||
| Other | 0 | % | 0 | % | 0 | % | 0 | % | 0 | % | 0 | % | 0 | % | 0 | % | ||||||||||||||||
(1) Only the loan groups providing direct cash flow to securities we own are included.
(2) The definition of a conforming loan has significantly changed over time. For Q3 2011 and subsequent periods, the conforming balance definition that went into effect on October 1, 2011 was used (which had a maximum loan balance of $625,500). For all periods prior to Q3 2011, the conforming balance definition available in June 2011 was used (which had a maximum loan balance of $729,750).
| THE REDWOOD REVIEW 4TH QUARTER 2011 |
Table 8B: Residential Non-Prime Securities at Redwood and
Underlying Loan Characteristics
|
| |
Table 9: Residential Real Estate Loan Characteristics1 ($ in thousands)
|
| 2011 | 2011 | 2011 | 2011 | 2010 | 2010 | 2010 | 2010 | |||||||||||||||||||||||||
| Q4 | Q3 | Q2 | Q1 | Q4 | Q3 | Q2 | Q1 | |||||||||||||||||||||||||
| Residential loans | $ | 4,231,324 | $ | 4,190,773 | $ | 3,892,161 | $ | 3,819,692 | $ | 3,818,659 | $ | 3,754,053 | $ | 3,807,334 | $ | 3,661,063 | ||||||||||||||||
| Number of loans | 12,490 | 12,526 | 12,258 | 12,301 | 12,413 | 12,500 | 12,725 | 12,721 | ||||||||||||||||||||||||
| Average loan size | $ | 339 | $ | 335 | $ | 318 | $ | 311 | $ | 308 | $ | 300 | $ | 299 | $ | 288 | ||||||||||||||||
| Adjustable % | 72 | % | 74 | % | 81 | % | 84 | % | 86 | % | 90 | % | 90 | % | 96 | % | ||||||||||||||||
| Hybrid % | 9 | % | 10 | % | 10 | % | 11 | % | 10 | % | 10 | % | 10 | % | 4 | % | ||||||||||||||||
| Fixed % | 19 | % | 16 | % | 9 | % | 5 | % | 4 | % | 0 | % | 0 | % | 0 | % | ||||||||||||||||
| Amortizing % | 22 | % | 19 | % | 11 | % | 8 | % | 7 | % | 5 | % | 4 | % | 3 | % | ||||||||||||||||
| Interest-only % | 78 | % | 81 | % | 89 | % | 92 | % | 93 | % | 95 | % | 96 | % | 97 | % | ||||||||||||||||
| Florida | 11 | % | 12 | % | 12 | % | 13 | % | 13 | % | 13 | % | 13 | % | 14 | % | ||||||||||||||||
| Southern California | 12 | % | 12 | % | 12 | % | 11 | % | 11 | % | 11 | % | 11 | % | 11 | % | ||||||||||||||||
| Northern California | 14 | % | 14 | % | 12 | % | 11 | % | 11 | % | 10 | % | 9 | % | 8 | % | ||||||||||||||||
| New York | 7 | % | 8 | % | 8 | % | 8 | % | 7 | % | 8 | % | 8 | % | 7 | % | ||||||||||||||||
| Georgia | 4 | % | 5 | % | 5 | % | 5 | % | 5 | % | 5 | % | 5 | % | 5 | % | ||||||||||||||||
| New Jersey | 4 | % | 4 | % | 4 | % | 4 | % | 4 | % | 4 | % | 4 | % | 5 | % | ||||||||||||||||
| Texas | 6 | % | 5 | % | 5 | % | 5 | % | 5 | % | 5 | % | 5 | % | 5 | % | ||||||||||||||||
| Colorado | 3 | % | 3 | % | 3 | % | 4 | % | 4 | % | 4 | % | 4 | % | 4 | % | ||||||||||||||||
| Virginia | 3 | % | 2 | % | 3 | % | 3 | % | 3 | % | 3 | % | 3 | % | 3 | % | ||||||||||||||||
| Arizona | 2 | % | 2 | % | 2 | % | 2 | % | 2 | % | 2 | % | 2 | % | 2 | % | ||||||||||||||||
| Illinois | 3 | % | 2 | % | 2 | % | 2 | % | 2 | % | 2 | % | 3 | % | 2 | % | ||||||||||||||||
| Other states | 31 | % | 31 | % | 32 | % | 32 | % | 33 | % | 33 | % | 33 | % | 34 | % | ||||||||||||||||
| Year 2011 origination | 13 | % | 9 | % | 3 | % | 0 | % | 0 | % | 0 | % | 0 | % | 0 | % | ||||||||||||||||
| Year 2010 origination | 9 | % | 10 | % | 8 | % | 7 | % | 5 | % | 2 | % | 0 | % | 0 | % | ||||||||||||||||
| Year 2009 origination | 3 | % | 4 | % | 4 | % | 5 | % | 5 | % | 5 | % | 6 | % | 0 | % | ||||||||||||||||
| Year 2008 origination | 0 | % | 0 | % | 0 | % | 0 | % | 0 | % | 0 | % | 0 | % | 0 | % | ||||||||||||||||
| Year 2007 origination | 2 | % | 2 | % | 2 | % | 2 | % | 2 | % | 2 | % | 2 | % | 2 | % | ||||||||||||||||
| Year 2006 origination | 4 | % | 4 | % | 5 | % | 5 | % | 5 | % | 5 | % | 5 | % | 6 | % | ||||||||||||||||
| Year 2005 origination | 3 | % | 3 | % | 3 | % | 4 | % | 4 | % | 4 | % | 4 | % | 4 | % | ||||||||||||||||
| Year 2004 origination or earlier | 66 | % | 68 | % | 75 | % | 77 | % | 79 | % | 82 | % | 83 | % | 88 | % | ||||||||||||||||
| Wtd Avg Original LTV | 66 | % | 66 | % | 66 | % | 66 | % | 66 | % | 66 | % | 66 | % | 67 | % | ||||||||||||||||
| Original LTV: 0 - 50 | 19 | % | 20 | % | 19 | % | 19 | % | 19 | % | 19 | % | 19 | % | 18 | % | ||||||||||||||||
| Original LTV: 50 - 60 | 13 | % | 13 | % | 13 | % | 13 | % | 12 | % | 12 | % | 12 | % | 11 | % | ||||||||||||||||
| Original LTV: 60 - 70 | 22 | % | 21 | % | 21 | % | 21 | % | 21 | % | 21 | % | 20 | % | 20 | % | ||||||||||||||||
| Original LTV: 70 - 80 | 40 | % | 40 | % | 40 | % | 40 | % | 41 | % | 41 | % | 42 | % | 43 | % | ||||||||||||||||
| Original LTV: 80 - 90 | 2 | % | 2 | % | 2 | % | 2 | % | 2 | % | 2 | % | 2 | % | 2 | % | ||||||||||||||||
| Original LTV: 90 - 100 | 4 | % | 4 | % | 5 | % | 5 | % | 5 | % | 5 | % | 5 | % | 6 | % | ||||||||||||||||
| Wtd Avg FICO | 740 | 739 | 736 | 735 | 734 | 733 | 733 | 730 | ||||||||||||||||||||||||
| FICO: <= 600 | 0 | % | 1 | % | 1 | % | 1 | % | 1 | % | 1 | % | 1 | % | 1 | % | ||||||||||||||||
| FICO: 601 -620 | 1 | % | 1 | % | 1 | % | 1 | % | 1 | % | 1 | % | 1 | % | 1 | % | ||||||||||||||||
| FICO: 621 - 640 | 1 | % | 2 | % | 2 | % | 2 | % | 2 | % | 2 | % | 2 | % | 2 | % | ||||||||||||||||
| FICO: 641 -660 | 3 | % | 3 | % | 3 | % | 3 | % | 3 | % | 4 | % | 4 | % | 4 | % | ||||||||||||||||
| FICO: 661 - 680 | 6 | % | 6 | % | 7 | % | 7 | % | 7 | % | 7 | % | 7 | % | 8 | % | ||||||||||||||||
| FICO: 681 - 700 | 9 | % | 9 | % | 10 | % | 10 | % | 11 | % | 11 | % | 11 | % | 12 | % | ||||||||||||||||
| FICO: 701 - 720 | 12 | % | 12 | % | 12 | % | 13 | % | 13 | % | 13 | % | 13 | % | 13 | % | ||||||||||||||||
| FICO: 721 - 740 | 12 | % | 12 | % | 13 | % | 13 | % | 13 | % | 13 | % | 13 | % | 13 | % | ||||||||||||||||
| FICO: 741 - 760 | 14 | % | 14 | % | 14 | % | 14 | % | 14 | % | 14 | % | 14 | % | 14 | % | ||||||||||||||||
| FICO: 761 - 780 | 19 | % | 18 | % | 18 | % | 17 | % | 17 | % | 17 | % | 17 | % | 16 | % | ||||||||||||||||
| FICO: 781 - 800 | 18 | % | 17 | % | 15 | % | 15 | % | 14 | % | 13 | % | 13 | % | 12 | % | ||||||||||||||||
| FICO: >= 801 | 5 | % | 5 | % | 4 | % | 4 | % | 4 | % | 4 | % | 4 | % | 4 | % | ||||||||||||||||
| Conforming balance %(2) | 41 | % | 42 | % | 49 | % | 50 | % | 51 | % | 53 | % | 53 | % | 56 | % | ||||||||||||||||
| % balance in loans > $1mm per loan | 22 | % | 22 | % | 20 | % | 20 | % | 20 | % | 18 | % | 18 | % | 16 | % | ||||||||||||||||
| 2nd home % | 11 | % | 11 | % | 11 | % | 11 | % | 12 | % | 12 | % | 12 | % | 12 | % | ||||||||||||||||
| Investment home % | 3 | % | 3 | % | 3 | % | 3 | % | 4 | % | 4 | % | 4 | % | 4 | % | ||||||||||||||||
| Purchase | 33 | % | 33 | % | 32 | % | 31 | % | 31 | % | 31 | % | 31 | % | 31 | % | ||||||||||||||||
| Cash out refinance | 28 | % | 29 | % | 31 | % | 33 | % | 33 | % | 34 | % | 34 | % | 36 | % | ||||||||||||||||
| Rate-term refinance | 38 | % | 37 | % | 36 | % | 35 | % | 35 | % | 34 | % | 34 | % | 31 | % | ||||||||||||||||
| Other | 1 | % | 1 | % | 1 | % | 1 | % | 1 | % | 1 | % | 1 | % | 2 | % | ||||||||||||||||
(1) This table presents characteristics of residential real estate loans held by consolidated Sequoia entities and residential real estate loans held by Redwood and intended to be securitized by future Sequoia entities.
(2) The definition of a conforming loan has significantly changed over time. For Q3 2011 and subsequent periods, the conforming balance definition that went into effect on October 1, 2011 was used (which had a maximum loan balance of $625,500). For all periods prior to Q3 2011, the conforming balance definition available in June 2011 was used (which had a maximum loan balance of $729,750).
| THE REDWOOD REVIEW 4TH QUARTER 2011 |
Table 9: Residential Real Estate Loan Characteristics
|
53 |
| |
Table 10: Commercial Real Estate Loan Characteristics1 ($ in thousands)
|
54 |
| 2011 | 2011 | 2011 | 2011 | 2010 | 2010 | 2010 | 2010 | |||||||||||||||||||||||||
| Q4 | Q3 | Q2 | Q1 | Q4 | Q3 | Q2 | Q1 | |||||||||||||||||||||||||
| Commercial loans | $ | 158,847 | $ | 98,600 | $ | 71,651 | $ | 42,953 | $ | 30,955 | $ | 457 | $ | 459 | $ | 461 | ||||||||||||||||
| Number of loans | 16 | 12 | 9 | 6 | 4 | 1 | 1 | 1 | ||||||||||||||||||||||||
| Average loan size | $ | 9,928 | $ | 8,217 | $ | 7,961 | $ | 7,159 | $ | 7,739 | $ | 457 | $ | 459 | $ | 461 | ||||||||||||||||
| Hybrid % | 91 | % | 100 | % | 100 | % | 100 | % | 100 | % | 100 | % | 100 | % | 100 | % | ||||||||||||||||
| Fixed % | 9 | % | 0 | % | 0 | % | 0 | % | 0 | % | 0 | % | 0 | % | 0 | % | ||||||||||||||||
| Amortizing % | 19 | % | 14 | % | 1 | % | 1 | % | 1 | % | 100 | % | 100 | % | 100 | % | ||||||||||||||||
| Interest-only % | 81 | % | 86 | % | 99 | % | 99 | % | 99 | % | 0 | % | 0 | % | 0 | % | ||||||||||||||||
| Illinois | 21 | % | 12 | % | 17 | % | 28 | % | 39 | % | 0 | % | 0 | % | 0 | % | ||||||||||||||||
| California | 21 | % | 18 | % | 10 | % | 1 | % | 1 | % | 100 | % | 100 | % | 100 | % | ||||||||||||||||
| New York | 16 | % | 19 | % | 26 | % | 43 | % | 60 | % | 0 | % | 0 | % | 0 | % | ||||||||||||||||
| Michigan | 8 | % | 13 | % | 0 | % | 0 | % | 0 | % | 0 | % | 0 | % | 0 | % | ||||||||||||||||
| Massachesetts | 4 | % | 6 | % | 8 | % | 14 | % | 0 | % | 0 | % | 0 | % | 0 | % | ||||||||||||||||
| Florida | 4 | % | 6 | % | 8 | % | 14 | % | 0 | % | 0 | % | 0 | % | 0 | % | ||||||||||||||||
| Kentucky | 3 | % | 4 | % | 6 | % | 0 | % | 0 | % | 0 | % | 0 | % | 0 | % | ||||||||||||||||
| Texas | 2 | % | 4 | % | 0 | % | 0 | % | 0 | % | 0 | % | 0 | % | 0 | % | ||||||||||||||||
| Other | 21 | % | 18 | % | 25 | % | 0 | % | 0 | % | 0 | % | 0 | % | 0 | % | ||||||||||||||||
| Year 2011 origination | 81 | % | 69 | % | 57 | % | 28 | % | 0 | % | 0 | % | 0 | % | 0 | % | ||||||||||||||||
| Year 2010 origination | 19 | % | 31 | % | 43 | % | 71 | % | 99 | % | 0 | % | 0 | % | 0 | % | ||||||||||||||||
| Year 2004 origination | <1 | % | <1 | % | <1 | % | 1 | % | 1 | % | 100 | % | 100 | % | 100 | % | ||||||||||||||||
| Retail | 29 | % | 30 | % | 10 | % | 0 | % | 0 | % | 0 | % | 0 | % | 0 | % | ||||||||||||||||
| Office | 29 | % | 25 | % | 34 | % | 57 | % | 60 | % | 100 | % | 100 | % | 100 | % | ||||||||||||||||
| Hospitality | 20 | % | 18 | % | 25 | % | 0 | % | 0 | % | 0 | % | 0 | % | 0 | % | ||||||||||||||||
| Multi-family | 14 | % | 14 | % | 14 | % | 14 | % | 0 | % | 0 | % | 0 | % | 0 | % | ||||||||||||||||
| Mixed-use | 8 | % | 13 | % | 17 | % | 29 | % | 40 | % | 0 | % | 0 | % | 0 | % | ||||||||||||||||
| THE REDWOOD REVIEW 4TH QUARTER 2011 |
Table 10: Commercial Real Estate Loan Characteristics
|
Redwood Trust Corporate Information
| EXECUTIVE OFFICERS: | DIRECTORS: |
| Martin S. Hughes | George E. Bull, III |
| Chief Executive Officer | Chairman of the Board |
| Brett D. Nicholas | Richard D. Baum |
| President | Former Chief Deputy Insurance |
| Commissioner for the State of California | |
| Scott M. Chisholm | |
| Managing Director | Thomas C. Brown |
| CEO and Principal Shareholder, | |
| John H. Isbrandtsen | Urban Bay Properties, Inc. |
| Managing Director | |
| Mariann Byerwalter | |
| Fred J. Matera | Chairman, JDN Corporate Advisory LLC |
| Chief Investment Officer | |
| Douglas B. Hansen | |
| Diane L. Merdian | Private Investor |
| Chief Financial Officer | |
| Martin S. Hughes | |
| Andrew P. Stone | Chief Executive Officer |
| General Counsel | |
| Greg H. Kubicek | |
| Harold F. Zagunis | President, The Holt Group, Inc. |
| Managing Director | |
| Jeffrey T. Pero | |
| Retired Partner, Latham & Watkins LLP | |
| STOCK LISTING: | |
| The Company’s common stock is traded | Georganne C. Proctor |
| on the New York Stock Exchange under | Former Chief Financial Officer, TIAA-CREF |
| the symbol RWT | |
| Charles J. Toeniskoetter | |
| CORPORATE HEADQUARTERS: | Chairman, Toeniskoetter Development, Inc. |
| One Belvedere Place, Suite 300 | Chairman and CEO, |
| Mill Valley, California 94941 | Toeniskoetter Construction, Inc. |
| Telephone: (415) 389-7373 | |
| NEW YORK OFFICE: | INVESTOR RELATIONS: |
| 1114 Avenue of the Americas | Mike McMahon |
| Suite 3405 | Managing Director |
| New York, New York 10036 | |
| Paula Kwok | |
| TRANSFER AGENT: | Assistant Vice President |
| Computershare Trust Company, N.A. | |
| 2 North LaSalle Street | |
| Chicago, IL 60602 | Investor Relations Hotline: (866) 269-4976 |
| Telephone: (888) 472-1955 | Email: [email protected] |
For more information about Redwood Trust, please visit our website at: www.redwoodtrust.com