
Exhibit 99.2
|
|

| |
|
TABLE OF CONTENTS
|
| Introduction |
4 | |||
| Shareholder Letter |
5 | |||
| Quarterly Overview |
6 | |||
| Financial Insights |
13 | |||
| u Book Value |
13 | |||
| u Balance Sheet |
15 | |||
| u GAAP Income |
19 | |||
| u REIT Taxable Income and Dividends |
23 | |||
| u Cash Flow |
24 | |||
| Commercial Real Estate Business |
26 | |||
| Sequoia Residential Mortgage Loan Business |
28 | |||
| Residential Real Estate Securities |
29 | |||
| Legacy Investments in Other Consolidated Entities |
34 | |||
| Appendix |
||||
| Accounting Discussion |
36 | |||
| Glossary |
37 | |||
| Financial Tables |
45 | |||
| THE REDWOOD REVIEW 1ST QUARTER 2012 | 1 |
|
|
| |
|
CAUTIONARY STATEMENT
|
This Redwood Review contains forward-looking statements within the meaning of the safe harbor provisions of the Private Securities Litigation Reform Act of 1995. Forward-looking statements involve numerous risks and uncertainties. Our actual results may differ from our expectations, estimates, and projections and, consequently, you should not rely on these forward-looking statements as predictions of future events. Forward-looking statements are not historical in nature and can be identified by words such as “anticipate,” “estimate,” “will,” “should,” “expect,” “believe,” “intend,” “seek,” “plan,” and similar expressions or their negative forms, or by references to strategy, plans, or intentions. These forward-looking statements are subject to risks and uncertainties, including, among other things, those described in our Annual Report on Form 10-K for the year ended December 31, 2011 under the caption “Risk Factors.” Other risks, uncertainties, and factors that could cause actual results to differ materially from those projected are described below and may be described from time to time in reports we file with the Securities and Exchange Commission, including reports on Forms 10-K, 10-Q, and 8-K. We undertake no obligation to update or revise forward-looking statements, whether as a result of new information, future events, or otherwise.
Statements regarding the following subjects, among others, are forward-looking by their nature: (i) our statements relating to opportunities to invest in residential securities, our belief that there will continue to be sufficient market liquidity for the types of residential securities investments that we are financing in part with short-term debt, our statement that, as the private mortgage market recovers and private securitization activity increases, we expect our portfolio of residential securities investments will shift back to predominantly unlevered investments in more credit sensitive subordinate securities; and our statements relating to how we might use various types of debt financing to finance residential securities investments in the future; (ii) our statements relating to the activities we engage in that we include in our references to our mortgage banking business, including our statements relating to our future level of investment in mortgage servicing rights and the profitability of such investments, future sales of whole loans (other than through securitization transactions) and the profitability of such sales, and our expectation that our mortgage banking and mortgage conduit related activities will be an ongoing source of income for us in the future; (iii) any statements relating to our competitive position and our ability to compete in the future, including our ability to effectively compete to acquire residential securities and residential mortgage loans and our ability to compete to originate and acquire commercial debt investments; (iv) our statements relating to our future investment strategy and our ability to find investments with attractive risk return profiles, including, without limitation, statements relating to our efforts to acquire residential mortgage loans, make commercial debt investments, and make investments in residential securities in the secondary market; (v) our statement that our goal for 2012 is to invest a total of approximately $400 million of equity capital in third-party residential securities, new Sequoia residential securities, and commercial debt investments; (vi) our statement that we continue to target the purchase of $2 billion of residential mortgage loans in 2012, our statements relating to acquiring the residential mortgage loans included in our pipeline of residential mortgage loans that we have identified for purchase or plan to purchase through our residential conduit program, including the amount of such loans that we planned to purchase or have identified for purchase at March 31, 2012 and April 30, 2012, and our statement that it is our intent to finance our residential mortgage loans held for sale primarily through the use of warehouse lines of credit; (vii) statements relating to future residential loan securitization and sale transactions, the timing of the completion of those future transactions, and the number and size of those transactions we expect to complete in 2012 and future periods, which future transactions may not be completed when planned or at all, and, more generally, statements regarding the likelihood and timing of, and our participation in, future transactions of these types and our ability to finance residential loan acquisitions through the execution of these types of transactions, and the profitability of these transactions; (viii) our statement that we expect to recover an aggregate of $6 million of loan loss reserves that relate to ten Sequoia securitization entities in future periods upon the payoff or deconsolidation of those entities; (ix) our statements relating to the cash flows we expect to receive from our investments; (x) our statements relating to our estimate of our investment capacity (including that we estimate our investment capacity was $183 million at March 31, 2012) and our statement that we believe this level of investment capacity should carry us through the next two quarters; (xi) any statements relating to future market and economic conditions and the future volume of transactions in those markets, including, without limitation, future conditions in the residential and commercial real estate markets and related financing markets (e.g., the CMBS market), and the related potential opportunities for our residential and commercial businesses; (xii) our beliefs about, and our outlook for, the future direction of housing market fundamentals, including, without limitation, home prices, household formation and demand for housing, delinquency rates, foreclosure rates, prepayment rates, inventory of homes for sale, and mortgage interest rates and their potential impact on our business and results of operations and our beliefs that certain fundamentals are showing no sign of a “double dip” in mortgage performance, that certain delinquency trends should eventually cause total mortgage delinquencies to fall, that home prices are reaching levels of strong support (which we believe should shield against significant further downside to housing prices), that, absent a second recession, we do not expect more than 5% in national home price declines (with significant geographic
| 2 | THE REDWOOD REVIEW 1ST QUARTER 2012 |
|
|
| |
|
CAUTIONARY STATEMENT
|
variation), that residential mortgage loan servicers’ pursuit of alternative liquidation strategies in greater number should result in lower losses and a quicker housing recovery, and that our current estimate is that excess housing supply will be substantially reduced by 2014 or 2015; (xiii) our beliefs about the future direction of commercial real estate fundamentals and statements regarding the competitive landscape for, and availability of, financing for commercial real estate and our beliefs about whether trends in these areas are positive for our business (including our statements that we believe that mezzanine lending opportunities will continue to drive our commercial investment activity for the next few quarters); (xiv) our statements relating to the future potential competitive advantages of our commercial origination and investment platform, including that this platform could potentially generate fees and other income by originating and distributing senior mortgage loans to a wide network of investors, and our statement that our plan for our commercial platform includes developing appropriate financing sources; (xv) our statements that we expect a pickup in our commercial investment activity in the second quarter of 2012, that we believe we are still on pace to originate between $200 and $300 million in commercial debt investments in 2012, and that we anticipate increasing our exposure to commercial debt relating to multifamily properties over the course of 2012; (xvi) our statement that we hope to obtain debt financing on our portfolio of commercial debt investments in the second half of 2012 and our statement that we believe any such financing we obtain will represent a prudent level of debt financing for those assets; (xvii) our expectations regarding credit reserves, credit losses, the adequacy of credit support, and impairments and their impact on our investments (including as compared to our original expectations and credit reserve levels) and the timing of losses and impairments, and statements that the amount of credit reserves we designate are adequate or may require changes in the future; (xviii) any statements relating to our expectations regarding future interest income and net interest income, future earnings, future earnings volatility, and future trends in operating expenses and the factors that may affect those trends, including that we expect the level of operating expense in the second quarter of 2012 to be similar to the level of operating expense in the first quarter of 2012; (ixx) our Board of Directors’ intention to pay a regular dividend of $0.25 per share per quarter in 2012; and (xx) our expectations and estimates relating to the characterization for income tax purposes of our dividend distributions and our expectations and estimates relating to tax accounting and our anticipation of additional credit losses for tax purposes in future periods (and, in particular, our statement that, for tax purposes, we expect an additional $130 million of credit losses on residential securities to be realized over an estimated two-to-five year period).
Important factors, among others, that may affect our actual results include: general economic trends, the performance of the housing, commercial real estate, mortgage, credit, and broader financial markets, and their effects on the prices of earning assets and the credit status of borrowers; federal and state legislative and regulatory developments, and the actions of governmental authorities, including those affecting the mortgage industry or our business; our exposure to credit risk and the timing of credit losses within our portfolio; the concentration of the credit risks we are exposed to, including due to the structure of assets we hold and the geographical concentration of real estate underlying assets we own; our exposure to adjustable-rate and negative amortization mortgage loans; the efficacy and expense of our efforts to manage or hedge credit risk, interest rate risk, and other financial and operational risks; changes in credit ratings on assets we own and changes in the rating agencies’ credit rating methodologies; changes in interest rates; changes in mortgage repayment rates; the availability of assets for purchase at attractive prices and our ability to reinvest cash we hold; changes in the values of assets we own; changes in liquidity in the market for real estate securities and loans; our ability to finance the acquisition of real estate-related assets with short-term debt; the ability of counterparties to satisfy their obligations to us; our involvement in securitization transactions, the profitability of those transactions, and the risks we are exposed to in engaging in securitization transactions; exposure to claims and litigation, including litigation arising from our involvement in securitization transactions; whether we have sufficient liquid assets to meet short-term needs; our ability to successfully compete and retain or attract key personnel; our ability to adapt our business model and strategies to changing circumstances; changes in our investment, financing, and hedging strategies and new risks we may be exposed to if we expand our business activities; exposure to environmental liabilities and the effects of global climate change; failure to comply with applicable laws and regulations; our failure to maintain appropriate internal controls over financial reporting and disclosure controls and procedures; the impact on our reputation that could result from our actions or omissions or from those of others; changes in accounting principles and tax rules; our ability to maintain our status as a real estate investment trust (REIT) for tax purposes; limitations imposed on our business due to our REIT status and our status as exempt from registration under the Investment Company Act of 1940; decisions about raising, managing, and distributing capital; and other factors not presently identified.
This Redwood Review may contain statistics and other data that in some cases have been obtained from or compiled from information made available by servicers and other third-party service providers.
| THE REDWOOD REVIEW 1ST QUARTER 2012 | 3 |
|
|
| |
|
INTRODUCTION
|
Note to Readers:
We file annual reports (on Form 10-K) and quarterly reports (on Form 10-Q) with the Securities and Exchange Commission. These filings and our earnings press releases provide information about Redwood and our financial results in accordance with generally accepted accounting principles (GAAP). We urge you to review these documents, which are available through our web site, www.redwoodtrust.com.
This document, called The Redwood Review, is an additional format for providing information about Redwood through a discussion of many GAAP as well as non-GAAP metrics, such as taxable income and economic book value. Supplemental information is also provided in the Financial Tables in this Review to facilitate more detailed understanding and analysis of Redwood. When we use non-GAAP metrics it is because we believe that these figures provide additional insight into Redwood’s business. In each case in which we discuss a non-GAAP metric you will find an explanation of how it has been calculated, why we think the figure is important, and a reconciliation between the GAAP and non-GAAP figures.
References herein to “Redwood,” the “company,” “we,” “us,” and “our” include Redwood Trust, Inc. and its consolidated subsidiaries. References to “at Redwood” exclude all consolidated securitization entities (with the exception of the resecuritization we completed in the third quarter of 2011) in order to present our operations in the way management analyzes them.
Note that because we round numbers in the tables to millions, except per share amounts, some numbers may not foot due to rounding.
We hope you find this Review helpful to your understanding of our business. We thank you for your input and suggestions, which have resulted in our changing the form and content of The Redwood Review over time.
We welcome your continued interest and comments.
|
Selected Financial Highlights
| ||||||||||||
| Quarter:Year | GAAP Income (Loss) per Share |
REIT Taxable Income (Loss) per Share(1) |
Annualized GAAP Return on Equity |
GAAP
Book Value per Share |
Non-GAAP Economic Value per Share (2) |
Dividends per Share | ||||||
| Q110 | $0.58 | $0.13 | 19% | $12.84 | $13.32 | $0.25 | ||||||
| Q210 | $0.35 | $0.04 | 11% | $12.71 | $13.37 | $0.25 | ||||||
| Q310 | $0.25 | ($0.11) | 8% | $13.02 | $13.73 | $0.25 | ||||||
| Q410 | $0.18 | ($0.01) | 6% | $13.63 | $14.31 | $0.25 | ||||||
| Q111 | $0.22 | $0.09 | 8% | $13.76 | $14.45 | $0.25 | ||||||
| Q211 | $0.11 | $0.02 | 4% | $13.04 | $13.81 | $0.25 | ||||||
| Q311 | $0.01 | $0.09 | 1% | $12.22 | $13.33 | $0.25 | ||||||
| Q411 | ($0.03) | $0.04 | (1%) | $11.36 | $12.45 | $0.25 | ||||||
| Q112 | $0.37 | $0.13 | 13% | $12.22 | $13.18 | $0.25 | ||||||
| (1) REIT taxable income (loss) per share for 2011 and 2012 are estimates until we file tax returns for those years. |
| (2) Non-GAAP economic value per share is calculated using estimated bid-side values (which take into account available bid-side marks) for our financial assets and estimated offer-side values (which take into account available offer-side marks) for our financial liabilities and we believe it more accurately reflects liquidation value than does GAAP book value per share. Non-GAAP economic value per share is reconciled to GAAP book value per share in the Financial Insights section and in Table 3 in the Financial Tables in this Review. |
| 4 | THE REDWOOD REVIEW 1ST QUARTER 2012 |
|
|

| |
|
SHAREHOLDER LETTER
|
Dear Fellow Shareholders:
At Redwood, we are actively managing and positioning our residential and commercial businesses for growth. It’s tricky business, as no one knows exactly how the new world of mortgage finance will evolve once the government finally loosens its grip. Our guess is that it will look very different from the pre-crisis days. So, for the past three years, our priority has been to build residential and commercial business foundations that are not only solid bases for growth, but also provide the optionality to adapt as the new normal unfolds.
It has taken a while, but when we stand back and survey the landscape and our competitive position, we like what we see. We now have solid beachhead origination platforms, are under all the right tents, have excellent relationships and a great brand, and have a deep bench with the right skill sets to execute. The next step is to expand our footprint and advance our business model. We have a lot of ideas that we discuss in the ensuing pages.
In characterizing the first quarter, we can’t bring ourselves to say “pleased” as to us it’s become an overused, shallow and trite word. Let’s just say, we’re off to a good start for the year. We still have a lot of wood to chop, but the good news is the Redwood team is unified, fired up and ready.
As always, thank you for your patience and continued support.

|

| |
| Martin S. Hughes | Brett D. Nicholas | |
| CEO | President |
| THE REDWOOD REVIEW 1ST QUARTER 2012 | 5 |
|
|
| |
|
QUARTERLY OVERVIEW
|
First Quarter 2012 Results
Overview
We had a productive first quarter of 2012 on just about every front. For the quarter, we generated attractive economic returns and reported GAAP earnings of $0.37 per share, some of which was driven by our accounting elections that are more fully described in the GAAP earnings section below .We paid a first quarter dividend of $0.25 per share, while REIT taxable income was $0.13 per share. As discussed in the Cash Flow module on page 24 of this Redwood Review, our cash from investments of $74 million in the first quarter of 2012 was in excess of the $50 million of combined interest on debt, dividends, and cash operating expenses we paid during the quarter.
We put $136 million of equity capital to work during the first quarter of 2012 to acquire $311 million of investments (and used $175 million of short-term debt to finance the new investments). Market conditions were generally favorable during the first quarter, allowing us to recover much of the market value declines we saw in our securities portfolio during the fourth quarter of 2011. Operationally, we expanded the scale and capabilities of our residential business .Our commercial business, while continuing to make opportunistic debt investments, is evolving towards the broader-based lending platform we envisioned.
Putting it all together, our GAAP book value increased to $12.22 per share in the first quarter of 2012 from $11.36 per share at the end of the fourth quarter of 2011, as detailed in the following table.
|
Changes in GAAP Book Value Per Share |
| |||||||||||
| ($ in per share)
|
| |||||||||||
| Q1 2012 | Q4 2011 | Variance | ||||||||||
| Beginning book value |
$ | 11.36 | $ | 12.22 | $ | (0.86 | ) | |||||
| Net income (loss) |
0.37 | (0.03 | ) | 0.40 | ||||||||
| Dividends |
(0.25 | ) | (0.25 | ) | - | |||||||
| Unrealized gains (losses) on hedges |
0.18 | (0.03 | ) | 0.21 | ||||||||
| Unrealized gains (losses) on securities |
0.52 | (0.56 | ) | 1.08 | ||||||||
| Other, net |
0.04 | 0.01 | 0.03 | |||||||||
| Ending book value |
$ | 12.22 | $ | 11.36 | $ | 0.86 | ||||||
| 6 | THE REDWOOD REVIEW 1ST QUARTER 2012 |
|
|

| |
|
QUARTERLY OVERVIEW
|
Investment and Portfolio Sales Activity
During the first quarter of 2012, we focused much of our efforts on efficiently deploying excess capital at attractive returns while growing our residential and commercial businesses. Highlights of the quarter included investments in two new Sequoia securitizations, four newly originated commercial debt investments and one commercial debt acquisition, and additional secondary investments in more liquid senior securities that were largely financed through repurchase facilities. The following table summarizes our first quarter of 2012 and fourth quarter of 2011 investment activity.
|
Quarterly Investment Activity |
| |||||||
| ($ in millions)
|
| |||||||
| Q1 2012 | Q4 2011 | |||||||
| New Sequoia RMBS |
$ | 61 | $ | - | ||||
| Third-party RMBS |
223 | 38 | ||||||
| Short-term debt |
(175 | ) | (15 | ) | ||||
| Total residential |
109 | 23 | ||||||
| Commercial |
27 | 60 | ||||||
|
|
||||||||
| Total capital invested |
$ | 136 | $ | 83 | ||||
Our overall investment pace for the first quarter ran a little ahead of our goal for the year of investing approximately $400 million of equity capital in third-party Residential Mortgage-Backed Securities (RMBS), new Sequoia RMBS, and commercial debt investments. In addition to new investment acquisition activity, we sold $53 million of third-party RMBS for GAAP gains of $6 million.
At March 31, 2012, our estimate of our available investment capacity was $183 million. Based on our current expectation for new investment activity, we believe this excess capacity should carry us through the next two quarters. If and when the time comes to raise capital, our approach will be based on what we believe to be in the best interest of shareholders. Our capital raising efforts could include freeing up additional capital internally, the issuance of corporate debt or preferred equity, or the issuance of common equity.
| THE REDWOOD REVIEW 1ST QUARTER 2012 | 7 |
|
|
| |
|
QUARTERLY OVERVIEW
|
Residential Loan Business
We continued to make steady progress growing our residential mortgage loan business in the first quarter of 2012, which was highlighted by the two securitizations of residential mortgage loans that we completed: one in January of $416 million and the other in March of $328 million. Our GAAP gains on these two securitizations totaled $7 million, while our economic gains (which take into account our hedging costs) were closer to $4 million. Contributing to the profitability of the transactions was a combination of tighter credit spreads on the senior securities issued, lower subordination levels, and lower hedging costs.
Our March 2012 securitization included two important features that are reflective of a more mature, fully functioning securitization market. First, six weeks prior to the transaction, we entered into an agreement with the underwriter of the transaction to sell forward the underlying triple-A securities. This reduced our hedging timeframe and costs and enabled us to lock in credit spreads. We are hopeful that we can replicate this type of agreement for future transactions. Second, the underwriter structured the triple-A tranche to create three different time-tranched triple-A securities. We believe this refinement tailors cash flows and yields to meet different senior investor needs, thus improving liquidity for triple-A securities. It is also notable that the average mortgage rate charged to prime borrowers in this transaction was only about 50 basis points higher than the mortgage rate a borrower could obtain on a government-backed conforming balance loan. The pre-crisis historical average was a spread of approximately 25 basis points. While we are not yet back to the historical spread levels, the trend is encouraging, especially considering the fact that we are the only repeat RMBS issuer since the financial crisis.
In anticipation of our next securitization, we held $301 million of residential loans at March 31, 2012, and at April 30, 2012, we held $331 million and had identified another $394 million that we plan to purchase. We currently expect our next securitization to occur late in the second quarter or possibly early in the third quarter. While our conduit business continues to face headwinds from sustained government involvement in mortgage finance and from commercial banks that are flush with liquidity and bidding aggressively for high-quality jumbo loans, we believe we are gaining momentum — adding new sellers each quarter (with 22 active sellers at March 31, 2012), for an anticipated 30 to 40 active sellers by year end. We continue to target completing four to six securitizations and purchase $2 billion of loans in 2012.
Initially, our conduit’s activities were primarily centered on acquiring 15- and 30-year fixed rate loans for sale through private securitization. While we continue to push our securitization efforts, we have broadened our loan products and distribution capabilities to include direct whole loan sales to banks, life insurance companies, or other whole loan buyers. The decision to sell whole loans versus securitizing 100% of the loans that we buy is based on changing market dynamics and continued strong demand for whole loans by commercial banks. Currently, demand is strong for high-quality hybrid adjustable-rate loans, which are a good fit for bank balance sheets. We expect to complete bulk sales of hybrid adjustable-rate loans in the second quarter and generate modest gains. In addition, we are now in the process of renewing our relationships with the GSEs and intend to add conforming loans to our product menu.
| 8 | THE REDWOOD REVIEW 1ST QUARTER 2012 |
|
|
| |
|
QUARTERLY OVERVIEW
|
Residential Loan Business (continued)
At the end of the first quarter of 2012, we owned the servicing rights to $304 million of prime-quality jumbo residential loans that were sourced through our conduit. We earn fees from these servicing rights, but do not service any loans in-house, nor do we currently plan to do so. Instead, we retain a nationally recognized sub-servicer. The recent decline in the market value of servicing rights — from an historic range of roughly 5 to 6 times the annual servicing fee to approximately 2 to 3 times today — has piqued our interest in an investment in servicing rights. In our opinion, major bank servicers have recently backed-off their servicing bid in the face of a deluge of existing servicing issues to work through, a refined focus on limiting servicing retention to their retail customers, and upcoming capital limitations under Basel III. Whether this decline is a secular or temporary phenomenon is an open question. In any event, we are positioned and stand ready to acquire attractively priced jumbo servicing rights, and potentially GSE conforming servicing rights down the road.
Commercial Real Estate Business
Progress in our commercial business continued during the first quarter of 2012 as we originated four additional commercial debt investments totaling $20 million and acquired one for $7 million. This boosted our investment portfolio to 19 investments totaling $178 million at March 31, 2012. These investments have been originated and structured in connection with third parties originating over $1 billion of new commercial mortgages on higher quality, stabilized properties. We recently added key personnel with expertise in the multifamily and capital markets segments of commercial investing, coinciding with our increased activity in those sectors. While the pace of our investment activity slowed from the fourth quarter of 2011, we expect a pickup in activity in the second quarter of 2012 based on opportunities that we have identified through April 2012.
We believe that mezzanine lending opportunities will continue to drive commercial investment activity for the next few quarters. Longer term, we are also focused on growing our franchise value through a commercial origination and investment platform that includes originating senior and mezzanine loans together. We believe that offering a one-stop financing solution for our target borrowers will be a strong competitive advantage of our franchise. It could also potentially generate fees and other income by distributing the senior loans through a wide network that includes CMBS, banks, life insurance companies, and the GSEs. Ultimately, we hope to help fill a growing capital void in the commercial mortgage market while also leveraging our internal skill set, broad sourcing relationships, and willingness to hold long-term commercial investments on our balance sheet. Part of our plan for the commercial business includes developing appropriate financing alternatives with various counterparties that could take the form of repurchase facilities, warehouse lines, and non-recourse securitized financing.
Looking ahead, we plan to continue originating commercial debt investments and exploring financing options for our commercial portfolio to potentially enhance its return. Currently our portfolio generates a gross yield in excess of 10% and is funded entirely with equity capital. We continue to expect to originate between $200 million and $300 million of commercial debt investments in 2012, and as this dynamic business evolves we will continue to seek the best way to maximize value for shareholders.
| THE REDWOOD REVIEW 1ST QUARTER 2012 | 9 |
|
|
| |
|
QUARTERLY OVERVIEW
|
Residential Securities Portfolio
The first quarter of 2012 — at least until late March — could be characterized by the “risk-on” tone observed in the broader equity markets. Mortgage-related investments followed cues from equities and generally increased in price throughout the quarter as credit spreads narrowed, with many senior RMBS meeting or exceeding the performance of corporate and other fixed income securities. Our securities portfolio in particular largely recovered the $0.56 per share decline in market value observed in the fourth quarter of 2011, rallying $0.52 per share in the first quarter of 2012 as pricing improved.
We took advantage of the relative strength of the RMBS market and sold $53 million of somewhat illiquid securities during the first quarter of 2012. Our intention is to actively manage our portfolio and these sales were consistent with our efforts to more efficiently invest our capital as we grow our residential and commercial businesses. In April 2012, the market for RMBS and CMBS remained relatively stable, allowing us to invest another $12 million (net of repo borrowings) of equity capital in third-party RMBS. We remain focused on managing credit-sensitive securities in our portfolio that could be particularly susceptible to adverse performance should the economy begin to slow once again. As always, our decision to sell or hold investments will be primarily focused on prevailing market conditions, any associated credit concerns, and capital allocation decisions.
In the first quarter of 2012, we continued employing what we believe to be prudent amounts of short-term recourse financing against our securities portfolio in order to free up equity capital for additional long-term investments. Some shareholders have questioned whether this represents a new business strategy and a fundamental shift in our more recent approach to favoring term or permanent financing for investments. In short, the answer is that our use of a combination of short-term debt and equity to finance these investments does not represent a new strategy or fundamental shift in our views on liquidity. We have previously used short-term financing on securities and our current use reflects the investment opportunities that are available at the current time. As the private mortgage market recovers and private securitization activity increases, we expect that our investment portfolio will shift back to predominantly unlevered investments in more credit-sensitive subordinate securities. Most of the RMBS we are currently financing are senior securities that are of the type that have been actively sought by banks, REITs, insurance companies, and hedge funds (an important consideration in taking into account the liquidity risk associated with using short-term debt financing). We believe there will continue to be sufficient market liquidity for these types of RMBS investments.
As we utilize short-term debt to capitalize on what we have described in prior quarters as a diminishing opportunity to source seasoned senior RMBS at attractive levels, we continue to set aside additional capital as part of our management of the liquidity risks associated with recourse financing. To the extent this securities portfolio grows to a sufficient size, we would look to obtain term financing for our investments through the use of a non-recourse structured debt facility, such as the resecuritization of senior residential securities we completed in July 2011. At March 31, 2012, our residential securities portfolio totaled $1 billion and was financed with a combination of $304 million of short-term debt, $207 million of non-recourse resecuritization debt, and $489 million of equity capital.
| 10 | THE REDWOOD REVIEW 1ST QUARTER 2012 |
|
|
| |
|
QUARTERLY OVERVIEW
|
GAAP Income Summary
Our first quarter GAAP earnings of $0.37 per share significantly outpaced our fourth quarter of 2011 GAAP loss of $0.03 per share. Our first quarter 2012 results include the effects of GAAP accounting standards that became applicable to us beginning in the first quarter as a result of recent activity in our residential loan business. These accounting changes, which are described in more detail throughout this section, coincided with formatting changes to our presentation of GAAP income for the first quarter of 2012. We believe these changes will more closely reflect the underlying economics of our business as it evolves.
|
GAAP Income |
| |||||||||||
| ($ in millions)
|
| |||||||||||
| Q1 2012 | Q4 2011 | |||||||||||
| New Format |
Previous Format |
|||||||||||
| Interest income |
$ | 59 | $ | 59 | $ | 56 | ||||||
| Interest expense |
(31 | ) | (31 | ) | (29 | ) | ||||||
| Net interest income |
28 | 28 | 27 | |||||||||
| Provision for loan losses |
(0 | ) | (0 | ) | (8 | ) | ||||||
| Other market valuation adjustments, net |
(1 | ) | (4 | ) | (10 | ) | ||||||
| Net interest income after provision and other market valuation adjustments | 27 | 24 | 10 | |||||||||
| Mortgage banking activities, net |
4 | - | - | |||||||||
| Operating expenses |
(15 | ) | (15 | ) | (13 | ) | ||||||
| Realized gains, net |
14 | 22 | 0 | |||||||||
| Provision for income taxes |
(0 | ) | (0 | ) | - | |||||||
| GAAP income (loss) |
$ | 30 | $ | 30 | $ | (3 | ) | |||||
Net interest income after provision and other market valuation adjustments was $17 million higher than the fourth quarter of 2011 as a result of higher net yields on investments after factoring in borrowing costs, fewer impairments on subordinate securities, and a significantly lower loan loss provision related to legacy Sequoia securitizations. The first quarter of 2012 also benefited from approximately $3 million of hedging expenses taken in the fourth quarter of 2011 as negative market valuation adjustments that related to a Sequoia securitization we completed in January 2012.
As part of our first quarter 2012 assessment of loan loss reserves, we observed that delinquencies and defaults appeared to be stabilizing after some seasonal effects in the fourth quarter of 2011, indicating to us that our reserve is currently adequate for expected charge-offs. In addition, we are assessing whether to maintain our interests in certain consolidated Sequoia entities where we have recorded loan loss provisions that meet or exceed our GAAP investment in the entities. This assessment addresses excess GAAP provisions, but is grounded in our normal process of evaluating portfolio positions — i.e., weighing the economics of maintaining our investments in each entity versus selling them. In the first quarter, we sold interests in five legacy Sequoia entities and realized $7 million of gains after determining that we should deconsolidate these entities in accordance with GAAP. The gains were comprised of both recoveries of excess provisions as well as cash raised by selling our interests in the five entities. To the extent that the economics remain favorable, our bias will be to potentially look to deconsolidate additional legacy Sequoia entities that may otherwise require us to record future GAAP provisions in excess of our investments at risk.
| THE REDWOOD REVIEW 1ST QUARTER 2012 | 11 |
|
|
| |
|
QUARTERLY OVERVIEW
|
GAAP Income Summary (continued)
During the first quarter of 2012, we engaged in a number of new activities related to our residential operations that we felt were best captured in a new income statement line item titled “Mortgage Banking Activities, net”. This line item is our attempt to reflect the most significant operating activities of our residential conduit, notably the expenses associated with hedging loans in our pipeline and any associated gain or loss on the completion of our securitizations accounted for as sales for GAAP. We shifted to a sale accounting framework for Sequoia securitizations completed in the first quarter of 2012 and expect to continue to use this framework for most future securitizations. This had the effect of pulling forward any gain or loss associated with acquiring and securitizing loans, as opposed to recognizing those amounts through net interest income over the life of the securitization, which is what GAAP requires for securitizations that are accounted for as financings and consolidated on our books. This change had an immediate impact on our first quarter 2012 results, as we were able to offset substantially all of the hedging expenses we had incurred in the fourth quarter of 2011 relating to our January 2012 securitization, as the increased price of the securitized loans resulted in a higher gain on sale. Unfortunately, we can’t guarantee that future securitizations transactions will occur so soon after hedging expenses are incurred or that they will offset these expenses. Therefore, we will likely continue to experience timing differences — to varying degrees — between the quarterly income and expenses we report relating to our residential conduit.
Also, as a result of completing securitizations accounted for as sales in the first quarter, we recorded mortgage servicing rights assets for the first time and we will also be recording any income, gain, or loss relating to servicing rights in the new Mortgage Banking Activities, net line item. These rights are included with certain loans we have acquired and are recognized as assets to the extent we retain the rights but sell or transfer the associated loans into a securitization accounted for as a sale. Finally, we expect to report income associated with selling whole loans out of our residential conduit in the second quarter of 2012 and for these and any future whole loan sales, we plan to record the related gains or losses through Mortgage Banking Activities, net. We currently expect these conduit related activities to become an ongoing source of income for us in the future.
As a result of this new presentation, “Realized Gains, net” will continue to show amounts for activities such as sales of securities, that are not generated by our ongoing business, but are more episodic or opportunistic in nature. We believe this change will help readers of our financial statements better distinguish between the results generated by our ongoing residential and commercial businesses and other items that may make evaluating the progress of these ongoing businesses difficult.
The “GAAP Income” section of this Redwood Review provides additional details on our earnings for the first quarter.
| 12 | THE REDWOOD REVIEW 1ST QUARTER 2012 |
|
|

| |
|
FINANCIAL INSIGHTS
|
Book Value
| u | The following table shows the components of our GAAP book value at March 31, 2012 and December 31, 2011. |
|
Components of GAAP Book Value(1) |
| |||||||
| ($ in millions, except per share data)
|
| |||||||
| As of | ||||||||
| 3/31/2012 | 12/31/2011 | |||||||
| Cash and cash equivalents |
$ | 150 | $ | 267 | ||||
| Real estate loans at Redwood |
||||||||
| Residential |
303 | 395 | ||||||
| Commercial |
178 | 158 | ||||||
| Total real estate loans at Redwood |
$ | 481 | $ | 553 | ||||
| Real estate securities at Redwood (2) |
||||||||
| Residential |
941 | 744 | ||||||
| Residential - Sequoia |
62 | - | ||||||
| Commercial |
6 | 6 | ||||||
| CDO |
- | 1 | ||||||
| Total real estate securities at Redwood |
$ | 1,009 | $ | 751 | ||||
| Investments in New Sequoia Entities |
47 | 49 | ||||||
| Investments in Other Consolidated Entities |
40 | 42 | ||||||
| Other assets |
81 | 91 | ||||||
| Total assets |
$ | 1,808 | $ | 1,752 | ||||
| Short-term debt |
(441 | ) | (428 | ) | ||||
| Long-term debt |
(140 | ) | (140 | ) | ||||
| Asset-backed securities issued - Resecuritization (2) |
(207 | ) | (220 | ) | ||||
| Other liabilities |
(58 | ) | (72 | ) | ||||
| Stockholders’ equity |
$ | 962 | $ | 893 | ||||
| Book value per share |
$ | 12.22 | $ | 11.36 | ||||
| (1) | This table presents our assets and liabilities as calculated and reported under GAAP and as adjusted to reflect our investments in New Sequoia Entities and Other Consolidated Entities in separate line items, similar to the equity method of accounting, reflecting that, as a legal matter, the underlying assets and liabilities owned by these entities are not ours and we own only the securities and interests that we have acquired from these entities. See page 17 for an explanation of these adjustments. |
| (2) | The assets and liabilities of the resecuritization we engaged in during the third quarter of 2011 are included in Real estate securities at Redwood - Residential and Asset-back securities issued - Resecuritization, respectively, although these assets and liabilities are owned by the resecuritization entity and are legally not ours and we own only the securities and interests that we acquired from the resecuritization entity. At March 31, 2012, the resecuritization accounted for $332 million of real estate securities and $207 million of asset-backed securities issued and our investment in this resecuritization is reflected in the difference between these assets and liabilities. |
| THE REDWOOD REVIEW 1ST QUARTER 2012 | 13 |
|
|
| |
|
FINANCIAL INSIGHTS
|
Book Value (continued)
| u | Our estimate of non-GAAP economic value at March 31, 2012 was $13.18 per share, or $0.96 per share higher than our reported GAAP book value. Approximately $0.93 per share of this difference relates to the estimated economic value of our long-term debt of $67 million ($73 million below its GAAP basis) and $0.10 per share relates to the estimated economic value of our investments in New Sequoia Entities and Other Consolidated Entities of $95 million ($8 million above their estimated GAAP value). These amounts were offset by a $0.07 per share increase related to our estimated economic value of the asset-backed securities issued from the resecuritization we engaged in during the third quarter of 2011 of $212 million ($5 million above their GAAP basis). A further reconciliation of our estimate of non-GAAP economic value to GAAP book value is set forth in Table 3 of the Appendix. |
| 14 | THE REDWOOD REVIEW 1ST QUARTER 2012 |
|
|
| |
|
FINANCIAL INSIGHTS
|
Balance Sheet
| u | The following table shows the components of our balance sheet at March 31, 2012. |
|
Consolidating Balance Sheet |
| |||||||||||||||||||
| March 31, 2012 ($ in millions)
|
| |||||||||||||||||||
| |
At Redwood |
|
|
New Sequoia Entities |
|
|
Other Consolidated Entities |
|
Intercompany | |
Redwood Consolidated |
| ||||||||
| Residential real estate loans |
$ | 303 | $ | 591 | $ | 2,757 | $ | - | $ | 3,651 | ||||||||||
| Commercial real estate loans |
178 | - | 12 | - | 191 | |||||||||||||||
| Real estate securities - Third party |
947 | - | 254 | - | 1,200 | |||||||||||||||
| Real estate securities - Sequoia |
62 | - | - | - | 62 | |||||||||||||||
| Investments in New Sequoia Entities |
47 | - | - | (47 | ) | - | ||||||||||||||
| Investment in Other Consolidated Entities |
40 | - | - | (40 | ) | - | ||||||||||||||
| Cash and cash equivalents |
150 | - | - | - | 150 | |||||||||||||||
| Total earning assets |
1,727 | 591 | 3,023 | (87 | ) | 5,253 | ||||||||||||||
| Other assets
|
|
81
|
|
|
5
|
|
|
32
|
|
|
-
|
|
|
119
|
| |||||
| Total assets |
$ | 1,808 | $ | 596 | $ | 3,055 | $ | (87 | ) | $ | 5,372 | |||||||||
| Short-term debt |
$ | 441 | $ | - | $ | - | $ | - | $ | 441 | ||||||||||
| Other liabilities |
58 | 2 | 66 | - | 126 | |||||||||||||||
| Asset-backed securities issued |
207 | 547 | 2,950 | - | 3,704 | |||||||||||||||
| Long-term debt |
140 | - | - | - | 140 | |||||||||||||||
| Total liabilities |
846 | 549 | 3,015 | - | 4,410 | |||||||||||||||
| Stockholders’ equity
|
|
962
|
|
|
47
|
|
|
40
|
|
|
(87
|
)
|
|
962
|
| |||||
| Total liabilities and equity |
$ | 1,808 | $ | 596 | $ | 3,055 | $ | (87 | ) | $ | 5,372 | |||||||||
| u | We present this table to highlight the impact that Sequoia Entities and our Other Consolidated Entities had on our GAAP balance sheet at March 31, 2012. As shown, Redwood’s $87 million GAAP investment in these consolidated entities increased our consolidated assets by $3.7 billion and liabilities by $3.6 billion. |
| u | We are required under GAAP to consolidate the assets and liabilities of certain Sequoia and Acacia securitizations that are treated as secured borrowing transactions. However, the securitized assets of these entities are not available to Redwood. Similarly, the liabilities of these entities are obligations payable only from the cash flow generated by their securitized assets and are not obligations of Redwood. |
| u | The consolidating balance sheet presents the assets and liabilities of the resecuritization we completed during the third quarter of 2011 at Redwood, although these assets and liabilities are owned by the resecuritization entity and are legally not ours and we own only the securities and interests that we acquired from the resecuritization entity. At March 31, 2012, the resecuritization accounted for $332 million of available-for-sale securities (at fair value) and $207 million of asset-backed securities issued (at historical cost) and our investment in this resecuritization equals the difference between these assets and liabilities. |
| u | The consolidating balance sheet presents the New Sequoia Entities separately from Other Consolidated Entities. Our investment in New Sequoia Entities reflects the three securitizations that we completed over the course of 2010 and 2011 as these were accounted for under GAAP as secured borrowings and were consolidated for GAAP. The two most recent securitizations that were completed in the first quarter of 2012 were accounted for as a sale of assets for GAAP. As a result, these securitizations were not consolidated, are not reflected in New Sequoia Entities, but are reflected on our balance sheet in Real Estate Securities — Sequoia. |
| THE REDWOOD REVIEW 1ST QUARTER 2012 | 15 |
|
|
| |
|
FINANCIAL INSIGHTS
|
Balance Sheet (continued)
Real Estate Loans
| u | At March 31, 2012, we had $303 million of unsecuritized residential real estate loans, as compared to $395 million at December 31, 2011. The decrease reflects $660 million of residential loan acquisitions less $7 million of principal payments and $745 million of securitized sales. In January 2012, we securitized $416 million of loans and in March we securitized $329 million of loans. At April 30, 2012, we had $332 million of loans on our balance sheet. The majority of the residential real estate loans (and others we have identified for future acquisition) are intended to be sold or securitized in future periods. See the Sequoia Residential Mortgage Loan Business module on page 28 for more information. |
| u | At March 31, 2012, we had $178 million of commercial debt investments, as compared to $158 million at December 31, 2011. The increase reflects the origination of four debt investments totaling $20 million and the acquisition of one debt investment for $7 million in the first quarter, less the payoff of one $6 million debt investment. See the Commercial Real Estate Business module beginning on page 26 for more information. |
Real Estate Securities
| u | The following table presents the fair value of real estate securities at Redwood at March 31, 2012. We segment our securities portfolio by vintage (the year(s) the securities were issued), priority of cash flow (senior, re-REMIC, and subordinate), and by the quality of underlying loans (prime and non-prime). |
|
Real Estate Securities at Redwood (1) March 31, 2012 ($ in millions) |
| |||||||||||||||||||||||
| % of Total | ||||||||||||||||||||||||
| <=2004 | 2005 | 2006-2008 | 2012 | Total | Securities | |||||||||||||||||||
| Residential |
||||||||||||||||||||||||
| Prime |
$ | 45 | $ | 183 | $ | 209 | $ | 22 | $ | 459 | 45 | % | ||||||||||||
| Non-prime (2) |
105 | 164 | 6 | - | 275 | 27 | % | |||||||||||||||||
| Total Seniors |
$ | 150 | $ | 347 | $ | 215 | $ | 22 | $ | 734 | 72 | % | ||||||||||||
| Re-REMIC |
||||||||||||||||||||||||
| Prime |
$ | 3 | $ | 56 | $ | 96 | $ | - | $ | 155 | 15 | % | ||||||||||||
| Total Re-REMIC |
$ | 3 | $ | 56 | $ | 96 | $ | - | $ | 155 | 15 | % | ||||||||||||
| Subordinates |
||||||||||||||||||||||||
| Prime |
$ | 57 | $ | 6 | $ | 3 | $ | 40 | $ | 106 | 11 | % | ||||||||||||
| Non-prime (2) |
8 | - | - | - | 8 | 1 | % | |||||||||||||||||
| Total Subordinates |
$ | 65 | $ | 6 | $ | 3 | $ | 40 | $ | 114 | 12 | % | ||||||||||||
| Total Residential |
$ | 218 | $ | 409 | $ | 314 | $ | 62 | $ | 1,003 | 99 | % | ||||||||||||
| Commercial subordinates |
$ | 5 | $ | 1 | $ | - | $ | - | $ | 6 | 1 | % | ||||||||||||
| CDO subordinates
|
$
|
-
|
|
$
|
-
|
|
$
|
-
|
|
$
|
-
|
|
$
|
-
|
|
|
-
|
| ||||||
| Total real estate securities |
$ | 223 | $ | 410 | $ | 314 | $ | 62 | $ | 1,009 | 100 | % | ||||||||||||
(1) Included in the residential securities table above are $332 million of senior securities that are included in a resecuritization that we completed in July 2011. Under GAAP accounting, we account for the resecuritization as a financing even though these securities are owned by the resecuritization entity and are legally not ours. We own only the securities and interests that we acquired from the resecuritization entity, which amounted to $125 million at March 31, 2012. As a result, to adjust at March 31, 2012 for the legal and economic interests that resulted from the resecuritization, Total Residential Senior Securities would be decreased by $332 million to $402 million, Total Re-REMIC Residential Securities would be increased by $125 million to $280 million, and Total Residential Securities would be reduced by $207 million to $796 million.
(2) Non-prime residential securities consist of $281 million of Alt-A senior and subordinate and $2 million of subprime subordinate securities.
| 16 | THE REDWOOD REVIEW 1ST QUARTER 2012 |
|
|

| |
|
FINANCIAL INSIGHTS
|
Balance Sheet (continued)
Real Estate Securities (continued)
| u | The table below details the change in fair value of securities at Redwood during the first quarter of 2012 and the fourth quarter of 2011. |
|
Real Estate Securities at Redwood |
| |||||||
| ($ in millions) | ||||||||
| Three Months Ended | ||||||||
| 3/31/2012 | 12/31/2011 | |||||||
| Beginning fair value |
$ | 751 | $ | 777 | ||||
| Acquisitions |
284 | 38 | ||||||
| Sales |
(53 | ) | - | |||||
| Gain on sale |
6 | - | ||||||
| Effect of principal payments |
(20 | ) | (19 | ) | ||||
| Change in fair value, net |
41 | (45 | ) | |||||
| Ending fair value |
$ | 1,009 | $ | 751 | ||||
| u | Our acquisitions in the first quarter included $194 million of prime senior securities, $19 million of Alt-A senior securities, $26 million of re-REMIC securities, and $45 million of prime subordinate securities. These acquisitions include $61 million of retained securities from SEMT 2012-1 and SEMT 2012-2. The amount of equity capital deployed for these acquisitions was $136 million, net of short-term borrowings. |
Investments in the Securitization Entities
| u | Our investments in New Sequoia Entities and Other Consolidated Entities, as estimated for GAAP, totaled $87 million at March 31, 2012. This amount reflects the estimated book value of our retained investments in these entities based on the difference between the consolidated assets and liabilities of the entities in the aggregate according to their GAAP carrying amounts. Management’s estimate of the non-GAAP economic value of our investments in New Sequoia Entities and Other Consolidated Entities was $95 million. Of this amount, $49 million consisted of IOs at Sequoia entities and $46 million consisted of senior and subordinate securities we retained at Sequoia and Acacia entities. We used the same valuation process that we follow to fair value our other real estate securities as described in the Accounting Discussion in the Appendix. |
Debt
| u | At March 31, 2012, we had short-term mortgage warehouse debt outstanding of $137 million, which was used to finance a portion of our $301 million inventory of residential mortgage loans held for sale. At March 31, 2012, we had two uncommitted mortgage warehouse facilities with a borrowing capacity of $400 million. It is our intent to finance our residential mortgage loans held for sale primarily through the use of warehouse lines. |
| THE REDWOOD REVIEW 1ST QUARTER 2012 | 17 |
|
|
| |
|
FINANCIAL INSIGHTS
|
Balance Sheet (continued)
Debt (continued)
| u | At March 31, 2012, we had short-term recourse debt of $304 million secured by $422 million of our RMBS at market value, resulting in a debt-to-equity leverage ratio for these RMBS of 2.8X (excluding our liquidity capital cushion related to these short-term borrowings). |
| u | At March 31, 2012, we had $207 million outstanding of asset-backed debt issued at a stated interest rate of 1-month LIBOR plus 200 basis points related to our resecuritization of senior securities with a market value of $332 million. Redwood’s investment in the resecuritized assets is the difference between the outstanding balance of the resecuritization and the balance of the asset-backed debt, or $125 million. At March 31, 2012, the face value of the underlying RMBS collateral was $400 million, the credit reserve amounted to $21 million, the discount was $76 million, and there was $30 million of unrealized gains. In addition to the credit reserve, Redwood’s investment has credit support from the securities (owned by third parties) that are subordinate to the senior securities that were resecuritized. |
| u | At March 31, 2012, we had $140 million of long-term debt outstanding due in 2037 with a stated interest rate of three-month LIBOR plus 225 basis points. In 2010, we effectively fixed the interest rate on this long-term debt at a rate of approximately 6.75% (excluding deferred debt issuance costs) through interest rate swaps. |
| u | Although we report our long-term debt in accordance with GAAP based on its $140 million historical cost, we estimate the non-GAAP economic value of this debt at $67 million based on its stated interest rate using the same valuation process used to fair value our other financial assets and liabilities. |
Capital and Cash
| u | At March 31, 2012, our total capital was $1.1 billion, including $962 million of shareholders’ equity and $140 million of long-term debt. We use our capital to invest in earning assets, meet lender capital requirements, and to fund our operations and working capital needs. |
| u | Our cash balance was $150 million at March 31, 2012. We hold cash for two main reasons. First, we hold cash in an amount we believe will be sufficient to comply with covenants, to fund haircuts (or the difference between the amounts advanced by our lenders and the value of the pledged loans and securities) on our warehouse and repo borrowing facilities, to meet potential margin calls, and to cover near-term cash operating expenses. Second, we hold cash in anticipation of having opportunities to invest at attractive yields. |
| u | We estimate that our investment capacity was about $183 million at March 31, 2012. |
| 18 | THE REDWOOD REVIEW 1ST QUARTER 2012 |
|
|
| |
|
FINANCIAL INSIGHTS
|
GAAP Income
| u | The following table provides a summary of our consolidated GAAP income for the first quarter of 2012 and the fourth quarter of 2011. |
|
GAAP Income |
| |||||||
| ($ in millions, except per share data) | ||||||||
| Three Months Ended | ||||||||
| 3/31/2012 | 12/31/2011 | |||||||
| Interest income | $ | 59 | $ | 56 | ||||
| Interest expense | (31 | ) | (29 | ) | ||||
| Net interest income | 28 | 27 | ||||||
| Provision for loan losses | - | (8 | ) | |||||
| Other market valuation adjustments, net | (1 | ) | (10 | ) | ||||
| Net interest income after provision and other market valuation adjustments | 27 | 10 | ||||||
| Mortgage banking activities, net | 4 | - | ||||||
| Operating expenses | (15 | ) | (13 | ) | ||||
| Realized gains, net | 14 | - | ||||||
| GAAP income (loss) | $ | 30 | $ | (3 | ) | |||
| GAAP income (loss) per share | $ | 0.37 | $ | (0.03 | ) | |||
| u | Our consolidated GAAP net income for the first quarter was $30 million, or $0.37 per share, as compared to a loss of $3 million, or $0.03 per share, for the previous quarter. The $33 million increase resulted from a combination of our new mortgage banking activities that include gains from two residential loan securitizations, lower provision expense, and gains associated with the sale of securities and the deconsolidation of certain Sequoia securitization entities. |
| u | Additional information related to GAAP income at Redwood, Sequoia Entities, and Other Consolidated Entities is provided on the following pages. |
| THE REDWOOD REVIEW 1ST QUARTER 2012 | 19 |
|
|
| |
|
FINANCIAL INSIGHTS
|
GAAP Income (continued)
| u | The following tables show the estimated effect that Redwood, New Sequoia Entities, and our Other Consolidated Entities had on GAAP income for the first quarter of 2012 and the fourth quarter of 2011. |
|
Consolidating Income Statement |
| |||||||||||||||||||
| Three Months Ended March 31, 2012 | ||||||||||||||||||||
| ($ in millions)
|
| |||||||||||||||||||
| At Redwood |
New Sequoia Entities |
Other Consolidated Entities |
Intercompany Adjustments |
Redwood Consolidated |
||||||||||||||||
| Interest income | $ | 24 | $ | 7 | $ | 21 | $ | - | $ | 52 | ||||||||||
| Net discount (premium) amortization | 8 | (0 | ) | (1 | ) | - | 7 | |||||||||||||
| Total interest income | 32 | 7 | 20 | - | 59 | |||||||||||||||
| Interest expense | (6 | ) | (6 | ) | (19 | ) | - | (31 | ) | |||||||||||
| Net interest income | 26 | 1 | 1 | - | 28 | |||||||||||||||
| Provision for loan losses | - | - | - | - | - | |||||||||||||||
| Other market valuation adjustments, net | - | - | (0 | ) | - | (1 | ) | |||||||||||||
| Net interest income (loss) after provision and other market valuation adjustments | 26 | 1 | 1 | - | 27 | |||||||||||||||
| Mortgage banking activities, net | 4 | - | - | - | 4 | |||||||||||||||
| Operating expenses | (15 | ) | - | - | - | (15 | ) | |||||||||||||
| Realized gains, net | 6 | - | 7 | - | 14 | |||||||||||||||
| Income from New Sequoia Entities | 1 | - | - | (1 | ) | - | ||||||||||||||
| Income from Other Consolidated Entities | 8 | - | - | (8 | ) | - | ||||||||||||||
| Net income (loss) | $ | 30 | $ | 1 | $ | 8 | $ | (9 | ) | $ | 30 | |||||||||
|
Consolidating Income Statement |
| |||||||||||||||||||
| Three Months Ended December 31, 2011 | ||||||||||||||||||||
| ($ in millions)
|
| |||||||||||||||||||
| At Redwood |
New Sequoia Entities |
Other Consolidated Entities |
Intercompany Adjustments |
Redwood Consolidated |
||||||||||||||||
| Interest income | $ | 20 | $ | 8 | $ | 21 | $ | - | $ | 49 | ||||||||||
| Net discount (premium) amortization | 9 | (0 | ) | (1 | ) | - | 8 | |||||||||||||
| Total interest income | 29 | 8 | 20 | - | 56 | |||||||||||||||
| Interest expense | (5 | ) | (7 | ) | (18 | ) | - | (29 | ) | |||||||||||
| Net interest income | 24 | 1 | 2 | - | 27 | |||||||||||||||
| Provision for loan losses | (1 | ) | (0 | ) | (7 | ) | - | (8 | ) | |||||||||||
| Market valuation adjustments, net | (11 | ) | - | 1 | - | (10 | ) | |||||||||||||
| Net interest income (loss) after provision and market valuation adjustments |
12 | 1 | (4 | ) | - | 10 | ||||||||||||||
| Operating expenses | (13 | ) | - | (0 | ) | - | (13 | ) | ||||||||||||
| Realized gains, net | - | - | 0 | - | 0 | |||||||||||||||
| Income from New Sequoia Entities | 1 | - | - | (1 | ) | - | ||||||||||||||
| Loss from Other Consolidated Entities | (3 | ) | - | - | 3 | - | ||||||||||||||
| Net (loss) income | $ | (3 | ) | $ | 1 | $ | (3 | ) | $ | 2 | $ | (3 | ) | |||||||
| 20 | THE REDWOOD REVIEW 1ST QUARTER 2012 |
|
|
| |
|
FINANCIAL INSIGHTS
|
GAAP Income (continued)
Redwood Parent
| u | Net interest income at Redwood was $26 million for the first quarter of 2012, as compared to $24 million for the fourth quarter of 2011, an increase of $2 million. The increase was primarily the result of higher interest income from commercial debt investments made in the fourth quarter of 2011. |
| u | Total interest income from our securities portfolio was $23 million for the first quarter of 2012, a slight increase compared to $22 million in the fourth quarter of 2011. Declining investment yields were offset by increasing average balances, as acquisitions of $284 million outpaced principal repayments and sales. |
| u | Residential loans at Redwood generated $3 million of interest income during both the first quarter of 2012 and fourth quarter of 2011, as the average balance of loans remained roughly the same. These loans are financed at Redwood prior to being pooled and securitized through our Sequoia program, or sold as whole loans. The amount of interest earned at Redwood is dependent upon prevailing mortgage rates and the pace of our loan purchase and sale activity. |
| u | Commercial debt investments at Redwood generated $5 million of interest income, an increase of $2 million from the previous quarter, as the average balance of investments increased 40% to $169 million. We acquired $27 million of commercial debt investments and one $6 million investment paid off in the first quarter of 2012, as compared to originations of $60 million in the fourth quarter of 2011, bringing the total portfolio to $178 million. |
| u | Interest expense at Redwood increased to $6 million in the first quarter of 2012 from $5 million in the fourth quarter of 2011 primarily as a result increased short-term repurchase and warehouse facility balances. This interest expense was derived from $140 million of long-term debt at an effective cost of 6.87%, $211 million (average balance) of ABS issued debt (related to the resecuritization of certain of our senior residential securities) at a cost of LIBOR plus 2%, as well as interest paid on short-term repurchase and warehouse facilities utilized during the first quarter. The realized portion of deferred security issuance costs is also reflected in interest expense. |
| u | Net negative market valuation adjustments on securities were less than $1 million for the first quarter. Valuation changes of negative $3 million related to derivatives used to manage certain risks associated with the residential loans we own or plan to acquire are excluded from market valuation adjustments and instead included in mortgage banking activities, net, on our consolidation statement of income. |
| u | During the first quarter of 2012, we recognized $6 million of gains from the sale of securities. We did not sell securities in the fourth quarter of 2011. |
| u | Operating expenses at Redwood were $15 million during the first quarter, an increase of $2 million from the previous quarter. This increase was primarily a result of increased variable compensation costs. We expect a similar level of quarterly operating expenses in the second quarter of 2012. |
| THE REDWOOD REVIEW 1ST QUARTER 2012 | 21 |
|
|
| |
|
FINANCIAL INSIGHTS
|
GAAP Income (continued)
New Sequoia Entities
| u | We estimated a contribution to net income of $1 million for both the first quarter of 2012 and fourth quarter of 2011 from our investments in New Sequoia Entities. Information about New Sequoia Entities can be found in the Sequoia Residential Loan Business module on page 28. |
Other Consolidated Entities
| u | We recognized net income of $8 million for the first quarter from our investments in Legacy Sequoia and Acacia securitization entities, as compared to a net loss of $3 million for the previous quarter. This increase in net income is primarily a result of $7 million in gains recognized upon deconsolidation of certain Sequoia securitization entities during the quarter. The remaining assets at Other Consolidated Entities continue to run off with no new reinvestment. |
| u | We did not recognize any provision for loan losses at Legacy Sequoia entities during the first quarter, as compared to $7 million of provision recognized in the previous quarter. This decrease in provision is largely due to our assessment that our current reserve balance of $59 million is sufficient to cover expected losses on loans at Sequoia entities that we continue to consolidate for GAAP financial reporting purposes. |
| u | There are currently 10 Sequoia entities for which we have aggregate loan loss reserves of $6 million in excess of our reported investment for GAAP purposes, an amount we expect to recover in future periods upon the payoff or deconsolidation of those entities. During the first quarter of 2012, we sold variable interests in five Sequoia securitizations issued between 2001 and 2003 and determined upon completion of an accounting analysis that we should derecognize the associated assets and liabilities of these securitizations for financial reporting purposes. We deconsolidated $307 million of real estate loans and other assets and $307 million of ABS issued and other liabilities and realized gains of $7 million that were comprised of both recoveries of excess provisions as well as cash raised by selling our interests in these entities. |
| 22 | THE REDWOOD REVIEW 1ST QUARTER 2012 |
|
|
| |
|
FINANCIAL INSIGHTS
|
REIT Taxable Income and Dividends
Summary
As a REIT, Redwood is required to distribute to shareholders at least 90% of its REIT taxable income (and meet certain other requirements), although Redwood’s Board of Directors can declare dividends in excess of this minimum requirement. REIT taxable income is defined as income as calculated for tax that is earned at Redwood and its qualified REIT subsidiaries. Redwood also earns taxable income at its taxable subsidiaries, which it is not required to distribute. To the extent Redwood retains taxable income that is not distributed to shareholders, it is taxed at corporate tax rates. A reconciliation of GAAP and taxable income is set forth in Table 2 in the Financial Tables in this Review.
Overview
| u | Redwood’s estimate of REIT taxable income for the first quarter of 2012 was $10 million, or $0.13 per share, as compared to estimated REIT taxable income of $3 million, or $0.04 per share, for the fourth quarter of 2011. |
| u | Credit losses from legacy investments decreased in the first quarter but continue to have a significant impact on our REIT taxable income. In the first quarter of 2012, realized credit losses as calculated for tax purposes totaled $10 million, as compared to $15 million in the fourth quarter of 2011, and were charged directly to REIT taxable income since the tax code does not allow for the establishment of credit reserves. |
| u | Our REIT taxable income will likely continue to vary from period to period due to the timing of realized credit losses. Based on the securities we currently own, we expect an additional $130 million of credit losses to be realized over an estimated two-to-five year period for tax purposes. |
| u | Redwood’s total taxable income, defined as the sum of REIT taxable income plus the taxable income at our qualified taxable REIT subsidiaries, was $8 million, or $0.11 per share in the first quarter of 2012, as compared to an estimated taxable loss of $1 million, or $0.02 per share in the fourth quarter of 2011. |
| u | On February 22, 2012 our Board of Directors declared a regular dividend of $0.25 per share for the first quarter, which was paid on March 30, 2012, to shareholders of record on March 15, 2012. |
| u | In November 2011, the Board of Directors announced its intention to pay a regular dividend of $0.25 per share per quarter in 2012. |
| THE REDWOOD REVIEW 1ST QUARTER 2012 | 23 |
|
|
| |
|
FINANCIAL INSIGHTS
|
Cash Flow
| u | The sources and uses of cash in the table below are derived from our GAAP Consolidated Statements of Cash Flow for the first quarter of 2012 and the fourth quarter of 2011, aggregating and netting all items in a manner consistent with the way management analyzes them. This table excludes the gross cash flow generated by our Sequoia and Acacia securitization entities (cash flow that is not available to Redwood), but does include the cash flow distributed to Redwood as a result of our investments in these entities. The beginning and ending cash balances presented in the table below are GAAP amounts. |
|
Redwood |
| |||||||
| Sources and Uses of Cash | ||||||||
| ($ in millions)
|
| |||||||
| Three Months Ended | ||||||||
| 3/31/12 | 12/31/11 | |||||||
| Beginning cash balance | $ | 267 | $ | 133 | ||||
| Business cash flow (1) | ||||||||
| Loans, securities, and investments (2) |
74 | 60 | ||||||
| Operating expenses |
(12 | ) | (10 | ) | ||||
| Resecuritization interest expense |
(14 | ) | (14 | ) | ||||
| Interest expense on other borrowed funds |
(4 | ) | (3 | ) | ||||
| Dividends |
(20 | ) | (39 | ) | ||||
| Net business cash flow | 24 | (6 | ) | |||||
| Investment-related cash flow | ||||||||
| Acquisition of residential loans |
(660 | ) | (175 | ) | ||||
| Origination of commercial loans |
(27 | ) | (60 | ) | ||||
| Acquisition of securities, net (3) |
(166 | ) | (35 | ) | ||||
| Investments in New Sequoia Entities |
(61 | ) | - | |||||
| Total investment-related cash flow |
(914 | ) | (270 | ) | ||||
| Financing and other cash flow | ||||||||
| Proceeds from New Sequoia securitization |
753 | - | ||||||
| Proceeds from repo debt, net |
183 | 121 | ||||||
| (Repayment of) proceeds from warehouse debt, net |
(170 | ) | 307 | |||||
| Margin returned (posted), net |
21 | (15 | ) | |||||
| Derivative pair-off |
(11 | ) | (3 | ) | ||||
| Share repurchase |
- | (4 | ) | |||||
| Changes in working capital |
(3 | ) | 4 | |||||
| Net financing and other cash flow
|
|
773
|
|
|
410
|
| ||
| Ending cash balance | $ | 150 | $ | 267 | ||||
| (1) | Cash flow from securities and investments can be volatile from quarter to quarter depending on the level of invested capital, the timing of credit losses, acquisitions, sales, and changes in prepayments and interest rates. Therefore, (i) cash flow generated by these investments in a given period is not necessarily reflective of the long-term economic return we will earn on these investments; and, (ii) it is difficult to determine what portion of the cash received from an investment is a return “of” principal and what portion is a return “on” principal in a given period. |
| (2) | Sources of cash from residential securities include the cash received from the securities that were included in the resecuritization we engaged in during the third quarter of 2011, and ABS issued - principal and interest reflects payments in respect of ABS issued in that resecuritization. |
| (3) | Total sales of securities in the first quarter of 2012 were $61 million. Securities sales of $6 million made in the first quarter that settled in April are not reflected in the first quarter cash flow. Total acquisitions of securities in the first quarter of 2012 were $223 million. Securities acquisitions of $1 million made in the first quarter that settled in April are not reflected in the first quarter cash flow. There were no unsettled trades at the end of the fourth quarter of 2011. |
| u | Business cash flow totaled $24 million in the first quarter of 2012, as compared to an adjusted $14 million in the prior quarter, after adjusting for the $20 million one-time effect of a change in dividend payment dates instituted in the fourth quarter of 2011. Contributing to the $10 million increase in adjusted cash flow were a $6 million commercial loan prepayment, a $1 million unsecuritized residential loan prepayment, and higher principal and interest payments from residential senior securities. |
| 24 | THE REDWOOD REVIEW 1ST QUARTER 2012 |
|
|
| |
|
FINANCIAL INSIGHTS
|
Cash Flow (continued)
| u | The $74 million of cash flow from our loans, securities, and investments continued to exceed the sum of our cash operating expenses of $12 million, interest expense on borrowed funds of $4 million, resecuritization interest expense of $14 million, and the $20 million required for the current level of recurring quarterly dividends. |
| u | Notable uses of cash in the first quarter included $660 million for the acquisition of residential loans, as compared to $175 million in the fourth quarter. The increase reflects timing differences between when we identify loans we intend to purchase and the dates we acquire those loans, a reflection on our increased efforts to minimize the amount of our capital invested in loan inventory. For example, many of the loans we purchased in the first quarter were loans that could potentially have been purchased earlier, but the actual purchase date was in closer proximity to the time the loans were securitized. |
| u | Our uses of cash for long-term investments totaled $254 million, consisting of $27 million for commercial debt investments, $166 million for the acquisitions of seasoned third-party RMBS (net of sales of $56 million), and $61 million to acquire securities from the securitizations we completed in the first quarter of 2012. |
| u | As shown in the table below, our investment activity substantially increased in the first quarter. Note that this table represents the cash used in the quarter to acquire the assets, which may differ from the amount of acquisitions stated elsewhere in this Review due to timing differences between the acquisition trade date and the settlement date between accounting periods. |
|
Gross Cash Used for Long-term Investments |
| |||||||||||||||||||
| ($ in millions)
|
| |||||||||||||||||||
| Three Months Ended | ||||||||||||||||||||
| 3/31/12 | 12/31/11 | 9/30/11 | 6/30/11 | 3/31/11 | ||||||||||||||||
| Commercial | $ | 27 | $ | 60 | $ | 27 | $ | 29 | $ | 12 | ||||||||||
| RMBS, net |
166 | 35 | 48 | 15 | (27 | ) | ||||||||||||||
| New Sequoia |
61 | - | 19 | - | 15 | |||||||||||||||
| Total cash used for long-term investments | $ | 254 | $ | 95 | $ | 94 | $ | 44 | $ | - | ||||||||||
| u | Notable sources of cash in the first quarter included $753 million from the proceeds from our two securitizations (of which $170 million was used to pay down our mortgage warehouse debt), and $183 million from repurchase facilities used to finance a portion of our third-party RMBS and Sequoia RMBS acquisitions. |
| u | Cash flow from securities and investments can be volatile from quarter to quarter depending on the level of invested capital, the timing of credit losses, acquisitions, sales, and changes in prepayments and interest rates. |
| THE REDWOOD REVIEW 1ST QUARTER 2012 | 25 |

|
| |
|
COMMERCIAL REAL ESTATE BUSINESS
|
Summary
Redwood’s commercial origination platform provides debt solutions for borrowers on higher quality properties. Redwood collaborates with other lending institutions (including major banks, life insurance companies, CMBS issuers, and the GSEs) to originate subordinate debt investments (typically mezzanine loans or other forms of subordinated financing such as preferred equity or B Notes) for its portfolio. Redwood may also originate loans (both senior and subordinate) on stabilized commercial properties, retaining the subordinate investments while likely selling the senior loans at origination. (We refer to our commercial mezzanine loans and debt investments collectively as “debt investments.”) Redwood also owns a small balance of legacy commercial securities that were acquired prior to 2008. This discussion is exclusive of commercial securities and loans owned by Acacia entities.
Market Conditions
| u | Opportunities for us to make commercial debt investments on stabilized properties in the commercial market continue to expand. In 2011, origination volume for new commercial and multifamily mortgage loans was up 55 percent from the prior year, with increases across the major property types. |
| u | Four of the five debt investments we made in the first quarter were on multifamily properties and we anticipate increasing our exposure to this sector throughout this year. As noted in the chart on the next page, multifamily fundamentals are strong and continue to improve. |
| u | At March 31, 2012, our debt investment portfolio totaled $178 million. On average, these debt investments have a maturity of over five years, unlevered yield in excess of 10% per annum before credit costs, a loan-to-value ratio of 72% at origination, and a debt service coverage ratio at origination of 1.17X based on our underwritten cash flows. |
| 26 | THE REDWOOD REVIEW 1ST QUARTER 2012 |
|
|
| |
|
COMMERCIAL REAL ESTATE BUSINESS
|
Market Conditions (continued)
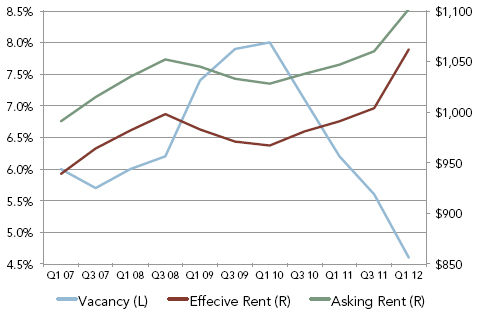
Source: Reis
| u | During the first quarter, our portfolio generated interest income of $5 million. All of our debt investments continue to be current. Since we began originating debt investments in the fourth quarter of 2010, we have begun to see improvement in the underlying cash flows on most of this portfolio, with our estimate of current debt service coverage exceeding 1.20X for the entire portfolio. In addition, we had one investment pay off in February 2012, a year after origination, as the improved metrics on the property allowed the borrower to refinance the property at a lower effective interest rate. |
| u | In April 2012, we originated one $5 million mezzanine loan on a multifamily property. The 20 debt investments in our portfolio are on central business district office buildings, stabilized multifamily properties, grocery-anchored retail centers, a regional mall, and two cross-collateralized portfolios of hotel properties. |
| u | We believe we are still on pace to originate between $200 and $300 million in commercial debt investments in 2012, with a wide range of quarterly volume. |
| u | We continue to discuss financing alternatives with various counterparties and hope to obtain what we believe to be a prudent level of financing on this portfolio in the second half of 2012. |
| u | Our legacy portfolio of CMBS was valued at $6 million at March 31, 2012, and generated less than $1 million of cash flow during the first quarter. |
| THE REDWOOD REVIEW 1ST QUARTER 2012 | 27 |

|
| |
|
SEQUOIA RESIDENTIAL MORTGAGE LOAN BUSINESS
|
Summary
We purchase newly originated loans (mainly prime jumbo loans) that meet our collateral criteria from approved originators on a flow or bulk basis. Loans acquired through this process (our “conduit”) are expected to be securitized through Sequoia securitization entities, which acquire residential mortgage loans through our conduit and issue residential mortgage-backed securities (RMBS) backed by these loans, or are sold privately as whole loans. Most of the senior or investment-grade rated RMBS issued by Sequoia Entities are sold to third-party investors; Redwood generally acquires the subordinate or non-investment grade securities but has also acquired senior securities and interest-only securities from the Sequoia Entities.
Quarterly Update
| u | On January 27, 2012, we closed SEMT 2012-1, a $416 million securitization of 446 prime jumbo mortgage loans. On March 28, 2012, we closed SEMT 2012-2, a $329 million securitization of 366 prime jumbo mortgage loans. Our initial gross investment in both transactions was $61 million and our net investment was $51 million after considering short-term borrowings used to finance the investment. |
| u | At March 31, 2012, we held $102 million (estimated economic value) of RMBS issued from our five Sequoia securitizations that total $1.65 billion. Included in the $102 million are $41 million of investments from the 2010 and 2011 deals we have consolidated and $61 million in securities we retained from the 2012 deals that were accounted for as sales under GAAP. We are currently holding less than we initially retained from our five securitizations, as after we close a transaction we may subsequently sell certain securities that we initially retain, including the IOs. However, we are committed to retaining the securities that are first in line to incur credit losses. |
| u | As of March 31, 2012, there was one 30-day delinquency in the loans underlying these securitizations (which is now current) and there have not been any credit losses relating to these securitizations. |
| u | At March 31, 2012, residential loans purchased and held on our balance sheet for future securitization or loan sales totaled $301 million, and the pipeline of residential loans we have identified for purchase totaled $282 million. |
| u | At April 30, 2012, residential loans purchased and held on our balance sheet for future securitization or loan sales totaled $331 million and the pipeline of residential loans we have identified for purchase totaled $394 million. |
| u | At April 30, 2012, we had 28 active originators and 18 that we are working to implement. |
| 28 | THE REDWOOD REVIEW 1ST QUARTER 2012 |
|
|
| |
| RESIDENTIAL REAL ESTATE SECURITIES |
Summary
Redwood invests in securities that are backed by pools of residential loans. Some of these investments in residential securities consist of senior prime and non-prime securities, and non-senior securities. Residential prime securities are mortgage-backed securities backed by prime residential mortgage loans. Residential non-prime securities are mortgage-backed securities backed by non-prime (Alt-A, Option ARM, and Subprime) residential mortgage loans. Non-senior securities include subordinate and re-REMIC securities.
Senior securities are those interests in a securitization that have the first right to cash flows and are last in line to absorb losses. Subordinate securities are those interests in a securitization that have the last right to cash flows and are first in line to absorb losses. A re-REMIC is a resecuritization of RMBS where the cash flow from and any credit losses absorbed by the underlying RMBS are allocated among the securities issued in the resecuritization transaction in a variety of ways.
The following discussion refers only to the residential securities owned by Redwood, but excludes securities owned by Acacia entities, and exclusive of Redwood’s investments in Acacia.
This discussion includes the securities that we resecuritized during the third quarter of 2011.
In the Financial Tables in the Appendix, information on the residential securities we own and underlying loan characteristics is set forth in Tables 5 through 8B.
Quarterly Update
| u | Interest income generated by our residential securities was $20 million in the first quarter of 2012, resulting in an annualized unlevered yield of 10.7% on the $755 million average amortized cost of these securities. |
| u | We finance our holdings of residential securities with short-term debt secured by securities (repo debt), through the resecuritization transaction we completed during the third quarter of 2011 (resecuritization debt), and with equity capital. During the first quarter, average repo debt amounted to $207 million and the average resecuritization debt amounted to $211 million. |
| u | At March 31, 2012, the fair value of the residential securities we own totaled $1 billion, consisting of $459 million in prime senior securities, $275 million in non-prime senior securities, $155 million in re-REMIC securities, and $114 million in subordinate securities. Each of these categories is further discussed on the following pages. |
| u | At March 31, 2012, 41% of the residential securities we held were fixed-rate assets, 22% were adjustable-rate assets, 24% were hybrid assets that reset within the next year, 2% were hybrid assets that reset between 12 and 36 months, and 11% were hybrid assets that reset after 36 months. |
| THE REDWOOD REVIEW 1ST QUARTER 2012 | 29 |
|
|
| |
| RESIDENTIAL REAL ESTATE SECURITIES |
Quarterly Update (continued)
| u | The following table presents information on residential securities at Redwood at March 31, 2012. For GAAP, we account for the large majority of these securities as available-for-sale (AFS) and others as trading securities, and in both cases the securities are reported at their fair value at the report date. |
|
Residential Securities at Redwood |
| |||||||||||||||||||
| March 31, 2012 | ||||||||||||||||||||
| ($ in millions)
|
| |||||||||||||||||||
| Senior | ||||||||||||||||||||
| Prime | Non-prime | Re-REMIC | Subordinate | Total | ||||||||||||||||
| Available-for-sale securities (1) |
||||||||||||||||||||
| Current face |
$ | 490 | $ | 329 | $ | 253 | $ | 270 | $ | 1,342 | ||||||||||
| Credit reserve |
(31 | ) | (16 | ) | (64 | ) | (125 | ) | (236 | ) | ||||||||||
| Net unamortized discount |
(57 | ) | (68 | ) | (82 | ) | (31 | ) | (238 | ) | ||||||||||
| Amortized cost |
402 | 245 | 107 | 114 | 868 | |||||||||||||||
| Unrealized gains |
38 | 15 | 48 | 7 | 108 | |||||||||||||||
| Unrealized losses |
(3 | ) | (5 | ) | - | (7 | ) | (15 | ) | |||||||||||
| Trading securities
|
|
22
|
|
|
20
|
|
|
-
|
|
|
-
|
|
|
42
|
| |||||
|
Fair value of residential securities |
$ | 459 | $ | 275 | $ | 155 | $ | 114 | $ | 1,003 | ||||||||||
| Fair value of AFS securities as a % of face value (2) |
89% | 78% | 61% | 42% | 72% | |||||||||||||||
| Amortized cost of AFS securities as a % of face value (2) |
82% | 74% | 42% | 42% | 65% | |||||||||||||||
(1) Included in the residential securities table above are $332 million of senior securities that are included in a resecuritization that we completed in July 2011. Under GAAP accounting, we account for the resecuritization as a financing even though these securities are owned by the resecuritization entity and are legally not ours. We own only the securities and interests that we acquired from the resecuritization entity, which amounted to $125 million at March 31, 2012. As a result, to adjust at March 31, 2012 for the legal and economic interests that resulted from the resecuritization, Total Residential Senior Securities would be decreased by $332 million to $402 million, Total Re-REMIC Residential Securities would be increased by $125 million to $280 million, and Total Residential Securities would be reduced by $207 million to $796 million.
(2) Does not include trading securities.
| u | Securities are acquired assuming a range of outcomes based on modeling of expected performance at the individual loan level for both delinquent and current loans. Over time, the performance of these securities may require a change in the amount of credit reserves we designate. |
| u | In the first quarter, credit losses on our residential securities at Redwood totaled $14 million, as compared to credit losses of $20 million in the fourth quarter of 2011. In each quarter, all of the losses came from our subordinate securities. We expect future losses to extinguish a large percentage of the subordinate securities as reflected by the $125 million of credit reserves we have provided for the $27 million face value of those securities. Until the losses occur, we will generally continue to earn interest on the face value of those securities. |
| u | Additional information on interest income and yields for our securities portfolio is reported in the Financial Tables in the Appendix. |
| 30 | THE REDWOOD REVIEW 1ST QUARTER 2012 |
|
|
| |
| RESIDENTIAL REAL ESTATE SECURITIES |
Housing Prices
| u | When the housing bubble burst, we began tracking the key statistics that we believed would indicate how long it would take for the market to recover and how deep the downturn was likely to be. At the time, we said that we expected home prices to fall until historical levels of home affordability were restored, with a bit of likely overcorrection due to technical factors. Now in the early months of 2012, the market average is in overcorrected territory: home prices are up 34% since 1999, but personal income is up by 39%, which means that the average home is more affordable now than prior to the bubble. Limiting the impact of this positive trend in personal income is the prolonged difficulty many prospective home buyers have faced obtaining credit at desirable terms. Still, we think prices are reaching levels of strong support, which should shield against significant further downside to housing prices. Absent a second recession, we do not expect more than 5% in national home price declines, with significant geographic variation. |
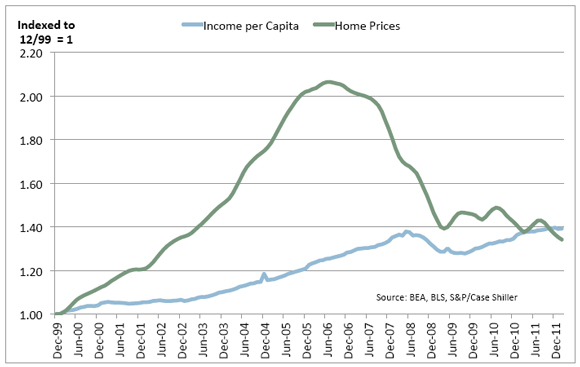
| u | With lack of affordability no longer driving down prices, we believe that demographics will be the key to understanding the future trajectory of home prices. According to the Census Bureau, the U.S. added 13 million housing units between 2002 and 2010, but only 9 million households, creating excess supply of approximately four million units. Until this oversupply is reduced, it will serve to limit any significant appreciation. How it will be reduced will depend on two factors: household formation and new construction. |
| u | Household formation has been dramatically below historical levels due to the recession, averaging only 509,000 per year between 2008 and 2010. But in 2011, there was a significant rebound with 1.1 million of net household formation, and we expect this trend to continue if the economic recovery holds. |
| THE REDWOOD REVIEW 1ST QUARTER 2012 | 31 |
|
|
| |
| RESIDENTIAL REAL ESTATE SECURITIES |
Housing Prices (continued)
| u | The slowdown in new construction should also help reduce the oversupply. Single family construction remains near all-time lows, with only 585,000 units completed in 2011. This is bad news for homebuilders and construction workers, but great news for most everyone else in the housing markets. As shown below, 2011 was the second year since 2003 when new households outnumbered new homes, and if this continues it will help to reduce the excess inventory. On the other hand, a rebound in home construction could push back the recovery of the housing market. |
| u | Based on these factors, our current estimate is that excess housing supply will be substantially reduced by 2014 or 2015. |
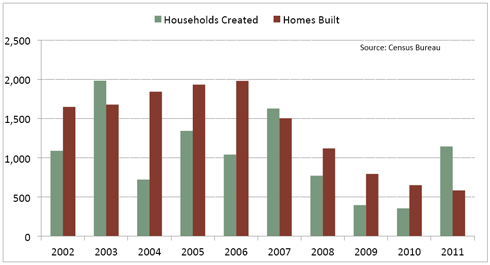
| u | Distressed properties create an additional uncertainty, with more than 3.7 million properties at least 90 days delinquent, according to LoanPerformance. A large portion of these loans will eventually be liquidated, and the owners will become renters. But how this will transpire is unclear. Will delinquent borrowers become renters in their current structure? Will they trade houses with a neighbor or move into a multifamily unit downtown? |
| u | In our view, the single greatest impediment to a quick housing recovery is the inability of servicers, investors, and the government to facilitate these inevitable transitions for delinquent loans. We are seeing some signs of progress in this area: the pilot REO-to-rental program at the FHFA is a step in the right direction, as are the foreclosure settlements and a rush of private equity into the distressed housing market. Servicers are also pursuing alternative liquidation strategies in much greater numbers: 24% of existing home sales in January came from short sales, up from 16% a year earlier, according to LoanPerformance, and this workout strategy should result in both lower losses, and a quicker housing recovery. |
| 32 | THE REDWOOD REVIEW 1ST QUARTER 2012 |
|
|
| |
| RESIDENTIAL REAL ESTATE SECURITIES |
Delinquencies
| u | Delinquencies were stable in the first quarter, but remain at historically elevated levels. According to LoanPerformance data, serious (90+ day) delinquencies rose by 0.02% quarter over quarter to 11.09% for prime loans and fell 0.41% quarter over quarter to 29.41% for Alt-A loans. The loans collateralizing the securities in Redwood’s portfolio have lower delinquency rates than the market as a whole. |
| u | Early-stage roll rates (from loans “always current” to 30 days delinquent) were largely unchanged. Of previously “always current” prime loans, 0.56% missed their first payment in March 2012, up from 0.53% in December 2011, while the same metric for Alt-A fell 0.04% to 1.08%. These roll rates are high by historical standards but well below 2008 - 2010 levels, and are showing no sign of a ‘double dip’ in mortgage performance. This trend should eventually cause total delinquencies to fall, but for now the slowdown in new defaults is being balanced by an extension in liquidation timelines. |
Prepayments
| u | Prepayment speeds fell during the first quarter. Prime borrowers with loan-to-value (LTV) ratios below 100% prepaid at 17% CPR in March 2012 (down from 20% in December 2011), while Alt-A borrowers with equity prepaid at 7% CPR, down slightly from the prior quarter. The slowdowns were likely due to flat interest rates. According to Freddie Mac, the monthly average rate for new loans fell from 3.96% in December 2011 to 3.95% in March 2012, a relatively modest decline compared to prior quarters. Borrowers without equity prepaid very slowly regardless of credit quality, with prime and Alt-A loans with LTV ratios above 100% prepaying at only 5% and 1% CPR, respectively, in line with the prior quarter. |
| THE REDWOOD REVIEW 1ST QUARTER 2012 | 33 |
|
|
| |
| LEGACY INVESTMENTS IN OTHER CONSOLIDATED ENTITIES |
Summary
What is this?
Prior to 2010, we sponsored Sequoia and Acacia securitization entities that acquired mortgage loans and securities and created and issued ABS backed by these loans and securities. References to Sequoia’s activities prior to 2010 are referred to as “Legacy Sequoia.” Our Sequoia program is active and issued RMBS in 2010, 2011, and 2012, which is discussed in the Sequoia Residential Mortgage Loan Business module.
Quarterly Update
| u | In the first quarter of 2012, we reported combined net income of $8 million from Legacy Sequoia and Acacia entities, as compared to a combined net loss of $3 million in the fourth quarter of 2011. This increase in net income is primarily a result of $7 million in gains recognized upon deconsolidation of certain Sequoia securitization entities during the quarter and a lower provision for loan losses. The remaining assets at Other Consolidated Entities continue to run off with no new reinvestment. |
| u | During the first quarter of 2012, we sold variable interests in five Sequoia securitization issued between 2001 and 2003 and determined upon completion of an accounting analysis that we should derecognize the associated assets and liabilities of these securitizations for financial reporting purposes. We deconsolidated $307 million of real estate loans and other assets and $307 million of ABS issued and other liabilities and recognized realized gains of $7 million. |
| u | Cumulative losses for all 52 Legacy Sequoia residential mortgage securitizations sponsored by us (totaling $35 billion at issuance) totaled 0.66% of the original face amount of the securities through March 2012. |
| u | The consolidation of the assets and liabilities of securitization entities may lead to potentially volatile reported earnings for a variety of reasons, including the amortization of premiums on the loans and liabilities of Sequoia entities, changes in credit loss provisions for loans held by Sequoia entities, fair value adjustments for the assets and liabilities of the Acacia entities, and deconsolidation events. |
| 34 | THE REDWOOD REVIEW 1ST QUARTER 2012 |


|
| |
|
ACCOUNTING DISCUSSION
|
Mark-to-Market Valuation Process
| u | Market values reflect an “exit price,” or the amount we believe we would realize if we sold an asset or would pay if we repurchased a liability in an orderly transaction, even though we generally have no intention — nor would we be required — to sell assets or repurchase liabilities. Establishing market values is inherently subjective and requires us to make a number of assumptions, including the future of interest rates, prepayment rates, discount rates, credit loss rates, and the timing of credit losses. The assumptions we apply are specific to each asset or liability. |
| u | We rely on our internal calculations to compute the fair value of our securities and we request and consider indications of value (marks) from third-party dealers to assist us in our mark-to-market valuation process. For March 31, 2012, we received dealer marks on 74% of our securities and 95% of our ABS issued. In the aggregate, our internal valuations of the securities on which we received dealer marks were 5% lower (i.e., more conservative) than the aggregate dealer marks, and our internal valuations of our ABS issued on which we received dealer marks were 4% higher (i.e., more conservative) than the aggregate dealer marks. |
Determining Other-Than-Temporary Impairments
| u | The multi-step process for determining whether an investment security has other-than-temporary impairment is presented below. |
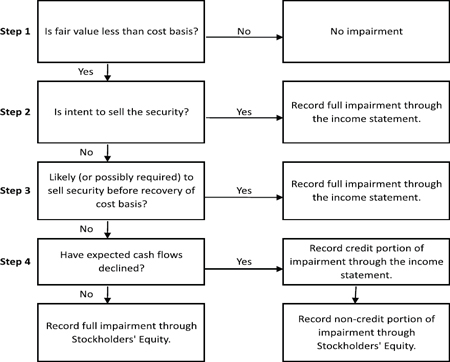
| 36 | THE REDWOOD REVIEW 1ST QUARTER 2012 |
|
|

| |
|
GLOSSARY
|
ACACIA
Acacia is the brand name for the collateralized debt obligation (CDO) securitizations Redwood sponsored.
ADJUSTABLE-RATE MORTGAGES (ARMs)
Adjustable-rate mortgages are loans that have coupons that adjust at least once per year. We make a distinction between ARMs (loans with a rate adjustment at least annually) and hybrids (loans that have a fixed-rate period of 2 -10 years and then become adjustable-rate).
AGENCY
Agency refers to government-sponsored enterprises (GSEs), including Federal National Mortgage Association (Fannie Mae), Federal Home Loan Mortgage Corporation (Freddie Mac), and Government National Mortgage Association (Ginnie Mae).
ALT-A SECURITIES and ALT-A LOANS
Alt-A securities are residential mortgage-backed securities backed by loans that have higher credit quality than subprime and lower credit quality than prime. Alt-A originally represented loans with alternative documentation, but the definition has shifted over time to include loans with additional risk characteristics and in some cases investor loans. In an Alt-A loan, the borrower’s income may not be verified, and in some cases, may not be disclosed on the loan application. Alt-A loans may also have expanded criteria that allow for higher debt-to-income ratios with higher accompanying loan-to-value ratios than would otherwise be permissible for prime loans.
AMORTIZED COST
Amortized cost is the initial acquisition cost of an available-for-sale (AFS) security, minus principal repayments or principal reductions through credit losses, plus or minus premium or discount amortization. At the point in time an AFS security is deemed other-than-temporarily impaired, the amortized cost is adjusted (by changing the amount of unamortized premium or discount) by the amount of other-than-temporary impairment taken through the income statement.
ASET-BACKED SECURITIES (ABS)
Asset-backed securities (ABS) are securities backed by financial assets that generate cash flows. Each ABS issued from a securitization entity has a unique priority with respect to receiving principal and interest cash flows and absorbing any credit losses from the assets owned by the entity.
AVAILABLE -FOR-SALE (AFS)
An accounting method for debt and equity securities in which the securities are reported at their fair value on the balance sheet. Positive changes in the fair value are accounted for as increases to stockholders’ equity and do not flow through the income statement. Negative changes in fair value may be recognized through the income statement or balance sheet, as further detailed in the Accounting Discussion module.
B-NOTES
B-Notes are subordinate interests in commercial mortgage debt which are either (i) evidenced by a subordinated promissory note secured by the same mortgage that also secures the senior debt relating to the same property or (ii) junior participation interests in mortgage debt that are subordinate to senior participation interests in the same mortgage debt. B-Notes typically provide the holder with certain rights to approve modifications to related lending agreements and to trigger foreclosure under the mortgage following an event of default. B-Notes also typically provide the holder certain limited rights to cure a borrower default under senior debt secured by the same mortgage in order to keep the senior debt current and avoid foreclosure.
| THE REDWOOD REVIEW 1ST QUARTER 2012 | 37 |
|
|
| |
|
GLOSSARY
|
BOK VALUE (GAP)
Book value is the value of our common equity in accordance with GAAP.
COLLATERALIZED DEBT OBLIGATION (CDO) SECURITIZATIONS
The securitization of a diverse pool of assets.
COMMERCIAL MORTGAGE-BACKED SECURITIES (CMBS)
A type of mortgage-backed security that is secured by one or more loans on commercial properties.
CONSTANT (or CONDITIONAL) PREPAYMENT RATE (CPR)
Constant (or conditional) prepayment rate (CPR) is an industry-standard measure of the speed at which mortgage loans prepay. It approximates the annual percentage rate at which a pool of loans is paying down due to unscheduled principal prepayments.
CORE EQUITY
Core equity is not a measure calculated in accordance with GAAP. GAAP equity includes mark-to-market adjustments for some of our assets and interest rate agreements in “accumulated other comprehensive income (loss).” Core equity excludes accumulated other comprehensive income (loss). Core equity in some ways approximates what our equity value would be if we used historical amortized cost accounting exclusively. A reconciliation of core equity to GAAP appears in the Table 3 in the Financial Tables in this Review.
CREDIT SUPPORT
Credit support is the face amount of securities subordinate (or junior) to the applicable security that protects the security from credit losses and is generally expressed as a percentage of the securitization’s underlying pool balance.
DEBT
Debt is an obligation of Redwood. See Long-term debt and Short-term debt.
ECONOMIC VALUE (MANAGEMENT’S ESTIMATE OF ECONOMIC VALUE )
Economic value closely relates to liquidation value and is calculated using the bid-side marks (or estimated bid-side values) for all of our financial assets, and offered-side marks (or estimated offered-side values) for all of our financial liabilities. We calculate management’s estimate of economic value as a supplemental measure to book value calculated under GAAP. Our economic value estimates on a per-share basis are reconciled to GAAP book values per share in Table 3 in the Financial Tables of this Review.
FASB
Financial Accounting Standards Board.
FHFA
The FHFA refers to the Federal Housing Finance Authority.
GAP
Generally Accepted Accounting Principles in the United States.
GOVERNMENT SPONSORED ENTERPRISE (GSE)
A government sponsored enterprise is a financial services corporation created by the United States Congress to enhance the flow of credit to targeted sectors of the economy. Among the GSEs charted by Congress are Fannie Mae, Freddie Mac, and Ginnie Mae.
| 38 | THE REDWOOD REVIEW 1ST QUARTER 2012 |
|
|
| |
|
GLOSSARY
|
INTEREST-ONLY SECURITIES (IOs)
Interest-only securities (IOs) are specialized securities created by securitization entities where the projected cash flows generated by the underlying assets exceed the cash flows projected to be paid to the securities that are issued with principal balances. Typically, IOs do not have a principal balance and they will not receive principal payments. Interest payments to IOs usually equal an interest rate formula multiplied by a “notional” principal balance. The notional principal balances for IOs are typically reduced over time as the actual principal balance of the underlying pool of assets pays down, thus reducing the cash flows to the IOs over time. Cash flows on IOs are typically reduced more quickly when asset prepayments increase.
INVESTMENT CAPACITY
The amount of capacity we estimate that we have to invest in new assets. Our estimate of our investment capacity takes into account, among other things, cash on hand, cash we estimate we could raise by prudently increasing short-term borrowings, and cash needed to cover short-term operations, working capital, and a liquidity cushion.
JUMBO LOAN
A jumbo loan is a mortgage loan that generally conforms to the underwriting standards of Fannie Mae and Freddie Mac except that the dollar amount of the loan exceeds the maximum limit set by the two GSEs for loans salable to the two companies.
LEVERAGE RATIOS
When determining Redwood’s financial leverage, traditional leverage ratios may be misleading in some respects if consolidated ABS issued from securitization entities are included as part of Redwood’s obligations when calculating this or similar ratios. Because of the requirement to consolidate the independent securitization entities for GAAP accounting purposes, it appears that Redwood is highly leveraged, with total consolidated liabilities significantly greater than equity. The obligations of these securitization entities are not obligations of Redwood.
LONG-TERM DEBT
Long-term debt is debt that is an obligation of Redwood that is not payable within a year and includes junior subordinated notes and trust preferred securities. We generally treat long-term debt as part of our capital base when it is not payable in the near future.
MARK-TO-MARKET (MTM) ACCOUNTING
Mark-to-market accounting uses estimated fair values of assets, liabilities, and hedges. Many assets on our consolidated balance sheet are carried at their fair value rather than amortized cost. Taxable income is generally not affected by market valuation adjustments.
MARKET VALUATION ADJUSTMENTS (MVAs)
Market valuation adjustments (MVAs) are changes in market values for certain assets and liabilities that are reported through our GAAP income statement. They include all changes in market values for assets and liabilities accounted for at fair value, such as trading securities and derivatives. They also include the credit portion of other-than-temporary impairments on securities available-for-sale, as well as impairments of loans held-for-sale and REO properties.
MEZZANINE LOAN
A mezzanine loan is a loan secured by the membership interests, partnership interests, and/or stock in a single purpose entity formed to own a commercial property, for example. If the mezzanine borrower fails to make its payments or otherwise defaults under the mezzanine loan documents, the mezzanine lender may pursue its remedies, including taking control of the single purpose entity that owns the property.
| THE REDWOOD REVIEW 1ST QUARTER 2012 | 39 |
|
|
| |
|
GLOSSARY
|
MORTGAGE SERVICING RIGHT (MSR)
A mortgage servicing right (MSR) gives the holder the contractual right to service a mortgage loan. MSRs typically include the right to collect monthly mortgage principal and interest payments, as well as related tax and insurance payments, from borrowers, disburse funds to the mortgage debt holders and remit related insurance and tax payments, collect late payments, and process modifications and foreclosures. MSRs are created when mortgage loans are sold in a transaction in which the seller retains the right to service the loans. The holder of an MSR receives a monthly servicing fee (which generally ranges from 0.25% to 0.375% per annum of the outstanding principal balance of the related mortgage loan), which is deducted from the borrower’s monthly interest payments. For accounting purposes, MSRs are capitalized at the net present value of the servicing fee less the servicing cost. When Redwood holds MSRs relating to residential mortgage loans, it retains a sub-servicer to carry out actual servicing functions, as Redwood does not directly service residential mortgage loans.
NON-GAAP METRICS
Not all companies and analysts calculate non-GAAP metrics in the same manner. As a result, certain metrics as calculated by Redwood may not be comparable to similarly titled metrics reported by other companies. Redwood uses non-GAAP metrics such as management’s estimate of economic value and core equity to provide greater transparency for investors. Our non-GAAP metrics are reconciled to GAAP in the Financial Tables in this Review.
NON-PRIME SECURITIES
Non-prime securities are Alt-A, option ARM, and subprime securities. See definitions of Alt-A, option ARM, and subprime securities.
OPTION ARM LOAN
An option ARM loan is a residential mortgage loan that generally offers a borrower monthly payment options such as: 1) a minimum payment that results in negative amortization; 2) an interest-only payment; 3) a payment that would fully amortize the loan over an original 31-year amortization schedule; and, 4) a payment that would fully amortize the loan over a 15-year amortization schedule. To the extent the borrower has chosen an option that is not fully amortizing the loan (or negatively amortizing the loan), after a period — usually five years or once the negatively amortized loan balance reaches a certain level (generally 15% to 25% higher than the original balance) — the loan payments are recast. This recast provision resets the payment at a level that fully amortizes the loan over its remaining life and the new payment may be materially different than under the borrowers’ previous option.
PREFERRED EQUITY
A preferred equity investment is an investment in preferred equity of a special purpose entity that directly or indirectly owns a commercial property. An investor in preferred equity is typically entitled to a preferred return (relative to a holder of common equity of the same entity) and has the right, if the preferred return is not paid, to take control of the entity (and thereby control the underlying commercial property).
PRIME RESIDENTIAL REAL ESTATE LOANS
Prime loans are residential loans with higher quality credit characteristics, such as borrowers with higher FICO credit scores, lower loan-to-value ratios, lower debt-to-income ratios, greater levels of other assets, and more documentation.
| 40 | THE REDWOOD REVIEW 1ST QUARTER 2012 |
|
|
| |
|
GLOSSARY
|
PRIME SECURITIES
Prime securities are residential mortgage-backed securities backed by prime loans, generally with balances greater than conforming loan limits. Prime securities are typically backed by loans that have relatively high weighted average FICO scores (700 or higher), low weighted average LTVs (75% or less), limited concentrations of investor properties, and low percentages of loans with low FICO scores or high loan-to-value ratios.
PROFITABILITY RATIOS
Many financial institution analysts use asset-based profitability ratios such as interest rate spread and interest rate margin when analyzing financial institutions. These are asset-based measures. Since we consolidate the assets and liabilities of securitization entities for GAAP purposes, our total GAAP assets and liabilities may vary over time, and may not be comparable to assets typically used in profitability calculations for other financial institutions. As a result, we believe equity-based profitability ratios may be more appropriate than asset-based measures for analyzing Redwood’s operations and results. We believe, for example, that net interest income as a percentage of equity is a useful measure of profitability. For operating expenses, we believe useful measures are operating efficiency ratio (operating expenses as a percentage of net interest income) and operating expenses as a percentage of equity. We provide various profitability ratios in Table 4 in the Financial Tables in this Review.
REAL ESTATE INVESTMENT TRUST (REIT)
A real estate investment trust (REIT) is an entity that makes a tax election to be taxed as a REIT, invests in real estate assets, and meets other REIT qualifications, including the distribution as dividends of at least 90% of REIT taxable income. A REIT’s profits are not taxed at the corporate level to the extent that these profits are distributed as dividends to stockholders, providing an operating cost savings. On the other hand, the requirement to pay out as dividends most of the REIT’s taxable profits means it can be harder for a REIT to grow using only internally-generated funds (as opposed to raising new capital).
REAL ESTATE OWNED (REO)
Real estate owned (REO) refers to real property owned by the lender or loan owner that has been acquired through foreclosure.
REIT SUBSIDIARY
A REIT subsidiary is a subsidiary of a REIT that is taxed as a REIT.
REIT TAXABLE INCOME
REIT taxable income is not a measure calculated in accordance with GAAP. REIT taxable income is pre-tax income calculated for tax purposes at Redwood including only its qualifying REIT subsidiaries (i.e., excluding its taxable subsidiaries). REIT taxable income is an important measure as it is the basis of our dividend distribution requirements. We must distribute at least 90% of REIT taxable income as dividends to shareholders over time. As a REIT, we are not subject to corporate income taxes on the REIT taxable income we distribute. We pay income tax on the REIT taxable income we retain, if any (and we are permitted to retain up to 10% of total REIT taxable income). A reconciliation of REIT taxable income to GAAP income appears in Table 2 in the Financial Tables in this Review.
REMIC
A real estate mortgage investment conduit (REMIC) is a special purpose vehicle used to pool real estate mortgages and issue mortgage-backed securities. REMICs are typically exempt from tax at the entity level. REMICs may invest only in qualified mortgages and permitted investments, including single family or multifamily mortgages, commercial mortgages, second mortgages, mortgage participations, and federal agency pass-through securities.
| THE REDWOOD REVIEW 1ST QUARTER 2012 | 41 |
|
|
| |
|
GLOSSARY
|
RE-REMIC SECURITY
A re-REMIC is a re-securitization of asset-backed securities. The cash flows from and any credit losses absorbed by the underlying assets can be redirected to the resulting re-REMIC securities in a variety of ways.
RESECURITIZATION
A resecuritization is a securitization of two or more mortgage-backed securities into a new mortgage-backed securities into a new mortgage-backed security.
RESIDENTIAL MORTGAGE-BACKED SECURITIES (RMBS)
A type of mortgage-backed security that is backed by a pool of mortgages on residential properties.
RETURN ON EQUITY (ROE) and ADJUSTED RETURN ON EQUITY
ROE is the amount of profit we generate each year per dollar of equity capital and equals GAAP income divided by GAAP equity. Adjusted ROE is not a measure calculated in accordance with GAAP — it is GAAP income divided by core equity.
SENIOR SECURITIES
Generally, senior securities have the least credit risk in a securitization transaction because they are generally the last securities to absorb credit losses. In addition, the senior securities have the highest claim on the principal and interest payments (after the fees to servicers and trustees are paid.) To further reduce credit risk, most if not all, principal collected from the underlying asset pool is used to pay down the senior securities until certain performance tests are satisfied. If certain performance tests are satisfied, principal payments are shared between the senior securities and the subordinate securities, generally on a pro rata basis. At issuance, senior securities are generally triple A-rated.
SEQUOIA
Sequoia is the brand name for securitizations of residential real estate loans Redwood sponsors. Sequoia entities are independent securitization entities that acquire residential mortgage loans and create and issue asset-backed securities (ABS) backed by these loans. Most of the loans that Sequoia entities acquire are prime-quality loans. Most of the senior ABS created by Sequoia are sold to third-party investors. Redwood usually acquires most of the subordinated ABS and occasionally acquires the interest-only securities (IOs).
SHORT-TERM DEBT
Short-term debt is debt that is an obligation of Redwood and payable within a year. We may obtain this debt from a variety of Wall Street firms, banks, and other institutions. In the past, as another form of short-term debt, we have issued collateralized commercial paper. We may issue these or other forms of short-term debt in the future. We may use short-term debt to finance the accumulation of assets prior to sale to a securitization entity and to finance investments in loans and securities.
SUBORDINATE DEBT INVESTMENTS
Subordinate Debt Investments mean Mezzanine Loans, Preferred Equity, and B-Notes.
| 42 | THE REDWOOD REVIEW 1ST QUARTER 2012 |
|
|

| |
|
GLOSSARY
|
SUBORDINATE SECURITIES (JUNIOR SECURITIES or NON-SENIOR SECURITIES)
Subordinate securities absorb the initial credit losses from a securitization structure, thus protecting the senior securities. Subordinate securities have a lower priority to receive principal and interest payments than the senior securities. Subordinate securities receive little, if any, principal payments until certain performance tests are satisfied. If certain performance tests are satisfied, principal payments are shared between the senior securities and the subordinate securities, generally on a pro rata basis. Subordinate securities generally receive interest payments even if they do not receive principal payments. At issuance, subordinate securities are generally rated double-A or below.
SUBPRIME SECURITIES
Subprime securities are residential mortgage-backed securities backed by loans to borrowers who typically have lower credit scores and/or other credit deficiencies that prevent them from qualifying for prime or Alt-A mortgages and may have experienced credit problems in the past, such as late payments or bankruptcies. To compensate for the greater risks and higher costs to service the loans, subprime borrowers pay higher interest rates, points, and origination fees.
TAXABLE INCOME
Taxable income is not a measure calculated in accordance with GAAP. Taxable income is pre-tax income for Redwood and all its subsidiaries as calculated for tax purposes. Taxable income calculations differ significantly from GAAP income calculations. A reconciliation of taxable income to GAAP income appears in Table 2 in the Financial Tables in this Review.
TAXABLE SUBSIDIARY
A taxable subsidiary is a subsidiary of a REIT that is not taxed as a REIT and thus pays taxes on its income. A taxable subsidiary is not limited to investing in real estate and it can choose to retain all of its after-tax profits.
| THE REDWOOD REVIEW 1ST QUARTER 2012 | 43 |
This Page Intentionally Left Blank
| 44 |


|
Table 1: GAAP Earnings ($ in thousands , except per share data) | 46
| ||
| 2012 Q1 |
2011 Q4 |
2011 Q3 |
2011 Q2 |
2011 Q1 |
2010 Q4 |
2010 Q3 |
2010 Q2 |
2010 Q1 |
Twelve Months 2011 |
Twelve Months 2010 |
||||||||||||||||||||||||||||||||||
| Interest income |
$ | 51,354 | $ | 48,512 | $ | 45,096 | $ | 44,126 | $ | 44,025 | $ | 44,956 | $ | 49,249 | $ | 47,730 | $ | 50,449 | $ | 181,759 | $ | 192,384 | ||||||||||||||||||||||
| Discount amortization on securities, net |
8,258 | 9,339 | 10,179 | 10,513 | 12,104 | 12,671 | 10,991 | 10,821 | 10,629 | 42,135 | 45,112 | |||||||||||||||||||||||||||||||||
| Other investment interest income |
- | - | - | - | - | - | 2 | 4 | 9 | - | 15 | |||||||||||||||||||||||||||||||||
| Premium amortization expense on loans |
(872 | ) | (1,356 | ) | (1,879 | ) | (1,684 | ) | (1,796 | ) | (1,874 | ) | (1,227 | ) | (1,985 | ) | (2,371 | ) | (6,715 | ) | (7,457 | ) | ||||||||||||||||||||||
| Total interest income |
58,740 | 56,495 | 53,396 | 52,955 | 54,333 | 55,753 | 59,015 | 56,570 | 58,716 | 217,179 | 230,054 | |||||||||||||||||||||||||||||||||
| Interest expense on short-term debt |
(1,827 | ) | (764 | ) | (78 | ) | (7 | ) | (182 | ) | (43 | ) | (2 | ) | (36 | ) | - | (1,031 | ) | (81 | ) | |||||||||||||||||||||||
| Interest expense on ABS |
(24,564 | ) | (24,030 | ) | (19,907 | ) | (19,508 | ) | (17,817 | ) | (17,800 | ) | (19,582 | ) | (17,582 | ) | (16,145 | ) | (81,262 | ) | (71,109 | ) | ||||||||||||||||||||||
| ABS issuance expense amortization |
(569 | ) | (630 | ) | (545 | ) | (568 | ) | (559 | ) | (370 | ) | (575 | ) | (475 | ) | (634 | ) | (2,302 | ) | (2,054 | ) | ||||||||||||||||||||||
| ABS interest rate agreement expense |
(1,204 | ) | (1,171 | ) | (1,233 | ) | (1,252 | ) | (1,140 | ) | (1,189 | ) | (1,104 | ) | (1,127 | ) | (495 | ) | (4,796 | ) | (3,915 | ) | ||||||||||||||||||||||
| ABS issuance premium amortization income |
(115 | ) | (136 | ) | (170 | ) | 78 | 96 | 168 | 187 | 196 | 208 | (132 | ) | 759 | |||||||||||||||||||||||||||||
| Total ABS expense consolidated from trusts |
(26,452 | ) | (25,967 | ) | (21,855 | ) | (21,250 | ) | (19,420 | ) | (19,191 | ) | (21,074 | ) | (18,988 | ) | (17,066 | ) | (88,492 | ) | (76,319 | ) | ||||||||||||||||||||||
| Interest expense on long-term debt |
(2,376 | ) | (2,384 | ) | (2,384 | ) | (2,375 | ) | (2,371 | ) | (2,390 | ) | (2,619 | ) | (2,140 | ) | (1,115 | ) | (9,514 | ) | (8,264 | ) | ||||||||||||||||||||||
| Net interest income |
28,085 | 27,380 | 29,079 | 29,323 | 32,360 | 34,129 | 35,320 | 35,406 | 40,535 | 118,142 | 145,390 | |||||||||||||||||||||||||||||||||
| Provision for loan losses |
(274 | ) | (7,784 | ) | (3,978 | ) | (1,581 | ) | (2,808 | ) | (7,902 | ) | (2,436 | ) | (4,321 | ) | (9,476 | ) | (16,151 | ) | (24,135 | ) | ||||||||||||||||||||||
| Other market valuation adjustments, net |
(628 | ) | (9,682 | ) | (13,448 | ) | (11,147 | ) | (5,740 | ) | 380 | (1,573 | ) | (7,125 | ) | (11,236 | ) | (40,017 | ) | (19,554 | ) | |||||||||||||||||||||||
| Net interest income after provision and other market valuation adjustments |
27,183 | 9,914 | 11,653 | 16,595 | 23,812 | 26,607 | 31,311 | 23,960 | 19,823 | 61,974 | 101,701 | |||||||||||||||||||||||||||||||||
| Mortgage banking activities, net |
4,302 | - | - | - | - | - | - | - | - | - | - | |||||||||||||||||||||||||||||||||
| Fixed compensation expense |
(5,035 | ) | (3,799 | ) | (3,702 | ) | (3,797 | ) | (4,145 | ) | (3,402 | ) | (3,314 | ) | (3,661 | ) | (4,109 | ) | (15,443 | ) | (14,486 | ) | ||||||||||||||||||||||
| Variable compensation expense |
(2,594 | ) | (721 | ) | (863 | ) | (646 | ) | (600 | ) | (2,152 | ) | (2,206 | ) | (1,303 | ) | (1,880 | ) | (2,830 | ) | (7,541 | ) | ||||||||||||||||||||||
| Equity compensation expense |
(2,176 | ) | (2,371 | ) | (1,929 | ) | (2,707 | ) | (2,060 | ) | (1,710 | ) | (1,507 | ) | (2,077 | ) | (6,059 | ) | (9,067 | ) | (11,353 | ) | ||||||||||||||||||||||
| Severance expense |
- | - | - | - | - | - | (48 | ) | (229 | ) | (81 | ) | - | (358 | ) | |||||||||||||||||||||||||||||
| Other operating expense |
(4,829 | ) | (5,683 | ) | (5,013 | ) | (4,937 | ) | (4,709 | ) | (5,673 | ) | (5,170 | ) | (3,957 | ) | (5,177 | ) | (20,342 | ) | (19,977 | ) | ||||||||||||||||||||||
| Total operating expenses |
(14,634 | ) | (12,574 | ) | (11,507 | ) | (12,087 | ) | (11,514 | ) | (12,937 | ) | (12,245 | ) | (11,227 | ) | (17,306 | ) | (47,682 | ) | (53,715 | ) | ||||||||||||||||||||||
| Realized gains on sales, net |
13,507 | - | 313 | 5,433 | 3,956 | 786 | 72 | 16,080 | 44,338 | 9,702 | 61,276 | |||||||||||||||||||||||||||||||||
| Realized gains (losses) on calls, net |
113 | 102 | 832 | 401 | (91 | ) | 726 | 1,494 | - | - | 1,244 | 2,220 | ||||||||||||||||||||||||||||||||
| Realized gains, net |
13,620 | 102 | 1,145 | 5,834 | 3,865 | 1,512 | 1,566 | 16,080 | 44,338 | 10,946 | 63,496 | |||||||||||||||||||||||||||||||||
| Noncontrolling interest |
- | - | 20 | (888 | ) | 2,015 | (447 | ) | (532 | ) | (186 | ) | 15 | 1,147 | (1,150 | ) | ||||||||||||||||||||||||||||
| Provision for income taxes |
(8 | ) | - | (14 | ) | (14 | ) | (14 | ) | (26 | ) | (202 | ) | (26 | ) | (26 | ) | (42 | ) | (280 | ) | |||||||||||||||||||||||
| Net income (loss) |
$ | 30,463 | $ | (2,558 | ) | $ | 1,297 | $ | 9,440 | $ | 18,164 | $ | 14,709 | $ | 19,898 | $ | 28,601 | $ | 46,844 | $ | 26,343 | $ | 110,052 | |||||||||||||||||||||
| Diluted average shares |
79,892 | 78,370 | 78,471 | 79,478 | 79,372 | 78,944 | 78,961 | 78,852 | 78,542 | 78,300 | 78,811 | |||||||||||||||||||||||||||||||||
| Net income (loss) per share |
$ | 0.37 | $ | (0.03 | ) | $ | 0.01 | $ | 0.11 | $ | 0.22 | $ | 0.18 | $ | 0.25 | $ | 0.35 | $ | 0.58 | $ | 0.31 | $ | 1.36 | |||||||||||||||||||||
| THE REDWOOD REVIEW 1ST QUARTER 2012
|
Table 1: GAAP Earnings | |||
|
|
Table 2: Taxable and GAAP Income (Loss)1 Differences and Dividends ($ in thousands, except per share data) | |||
| Estimated 2012 Q1 (2) | Estimated Twelve Months 2011 | Actual Twelve Months 2010 | ||||||||||||||||||||||||||||||||||
| Taxable Income |
GAAP Income |
Differences | Taxable Income |
GAAP Income |
Differences | Taxable (Loss) Income |
GAAP Income |
Differences | ||||||||||||||||||||||||||||
| Taxable and GAAP Income (Loss) Differences |
||||||||||||||||||||||||||||||||||||
| Interest income |
$ | 38,027 | $ | 58,740 | $ | (20,713 | ) | $ | 128,353 | $ | 217,179 | $ | (88,826 | ) | $ | 136,750 | $ | 230,054 | $ | (93,304 | ) | |||||||||||||||
| Interest expense |
(6,184 | ) | (30,655 | ) | 24,471 | (16,759 | ) | (99,037 | ) | 82,278 | (8,545 | ) | (84,664 | ) | 76,119 | |||||||||||||||||||||
| Net interest income |
31,844 | 28,085 | 3,759 | 111,594 | 118,142 | (6,548 | ) | 128,205 | 145,390 | (17,185 | ) | |||||||||||||||||||||||||
| Provision for loan losses |
- | (274 | ) | 274 | - | (16,151 | ) | 16,151 | - | (24,135 | ) | 24,135 | ||||||||||||||||||||||||
| Realized credit losses |
(10,437 | ) | - | (10,437 | ) | (57,526 | ) | - | (57,526 | ) | (99,586 | ) | 0 | (99,586 | ) | |||||||||||||||||||||
| Other market valuation adjustments, net |
- | (628 | ) | 628 | - | (40,017 | ) | 40,017 | - | (19,554 | ) | 19,554 | ||||||||||||||||||||||||
| Mortgage banking activities, net |
11 | 4,302 | (4,291 | ) | - | - | - | - | - | - | ||||||||||||||||||||||||||
| Operating expenses |
(13,103 | ) | (14,634 | ) | 1,531 | (45,459 | ) | (47,682 | ) | 2,223 | (44,804 | ) | (53,715 | ) | 8,911 | |||||||||||||||||||||
| Realized gains, net |
- | 13,620 | (13,620 | ) | - | 10,946 | (10,946 | ) | 230 | 63,496 | (63,266 | ) | ||||||||||||||||||||||||
| Provision for income taxes |
(5 | ) | (8 | ) | 3 | (15 | ) | (42 | ) | 27 | (8 | ) | (280 | ) | 272 | |||||||||||||||||||||
| Less: Net (loss) income attributable to noncontrolling interest
|
- | - | - | - | (1,147 | ) | 1,147 | - | 1,150 | (1,150 | ) | |||||||||||||||||||||||||
| Income (Loss) |
$ | 8,310 | $ | 30,463 | $ | (22,153 | ) | $ | 8,594 | $ | 26,343 | $ | (17,749 | ) | $ | (15,963 | ) | $ | 110,052 | $ | (126,015 | ) | ||||||||||||||
| REIT taxable income |
$ | 10,361 | $ | 19,269 | $ | 3,383 | ||||||||||||||||||||||||||||||
| Taxable (loss) income at taxable subsidiaries |
(2,051 | ) | (10,675 | ) | (19,346 | ) | ||||||||||||||||||||||||||||||
| Taxable income (loss) |
$ | 8,310 | $ | 8,594 | $ | (15,963 | ) | |||||||||||||||||||||||||||||
| Shares used for taxable EPS calculation |
78,756 | 78,382 | 78,041 | |||||||||||||||||||||||||||||||||
| REIT taxable income per share (3) |
$ | 0.13 | $ | 0.24 | $ | 0.05 | ||||||||||||||||||||||||||||||
| Taxable (loss) income at taxable subsidiaries per share |
$ | (0.03 | ) | $ | (0.13 | ) | $ | (0.25 | ) | |||||||||||||||||||||||||||
| Taxable income (loss) per share (3) |
$ | 0.11 | $ | 0.11 | $ | (0.20 | ) | |||||||||||||||||||||||||||||
| Dividends |
||||||||||||||||||||||||||||||||||||
| Dividends declared |
$ | 19,636 | $ | 78,382 | $ | 77,942 | ||||||||||||||||||||||||||||||
| Regular dividend per share (4)
|
$ | 0.25 | $ | 1.00 | $ | 1.00 | ||||||||||||||||||||||||||||||
(1) Taxable income (loss) for 2011 and 2012 are estimates until we file our tax returns.
(2) Reconciliation of GAAP income to taxable income (loss) for prior quarters is provided in the respective Redwood Reviews for those quarters.
(3) REIT taxable income (loss) per share and taxable income (loss) per share are based on the number of shares outstanding at the end of each quarter. The annual REIT taxable income (loss) per share and taxable income (loss) per share are the sum of the four quarterly per share estimates.
(4) The characteristics of our 2012 dividend will be determined at the end of 2012. To the extent the REIT has taxable income or net capital gains in 2012, these amounts will be characterized as ordinary income. Dividends in 2011 were characterized as 25% ordinary income, or $19 million, and 75% return of capital, or $59 million. The 2010 dividends were characterized as 62% ordinary income, or $48 million, and 38% return of capital, or $30 million. The portion of Redwood’s dividends characterized as a return of capital are not taxable to a shareholder and reduces a shareholder’s basis for shares held at each quarterly distribution date.
| THE REDWOOD REVIEW 1ST QUARTER 2012
|
Table 2: Taxable and GAAP Income (Loss) Differences and Dividends |
47
| ||
|
|
Table 3: Book Value and Financial Ratios ($ in millions, except per share data) | 48
| ||
| 2012 Q1 |
2011 Q4 |
2011 Q3 |
2011 Q2 |
2011 Q1 |
2010 Q4 |
2010 Q3 |
2010 Q2 |
2010 Q1 |
||||||||||||||||||||||||||||
| Short-term debt |
$ | 441 | $ | 428 | $ | - | $ | 41 | $ | - | $ | 44 | $ | - | $ | - | $ | - | ||||||||||||||||||
| Long-term debt |
140 | 140 | 140 | 140 | 140 | 140 | 140 | 140 | 140 | |||||||||||||||||||||||||||
| Redwood debt (1) |
$ | 581 | $ | 568 | $ | 140 | $ | 181 | $ | 140 | $ | 184 | $ | 140 | $ | 140 | $ | 140 | ||||||||||||||||||
| GAAP stockholders’ equity |
$ | 962 | $ | 893 | $ | 959 | $ | 1,025 | $ | 1,075 | $ | 1,065 | $ | 1,016 | $ | 991 | $ | 998 | ||||||||||||||||||
| Redwood debt to equity |
0.6x | 0.6x | 0.1x | 0.2x | 0.1x | 0.2x | 0.1x | 0.1x | 0.1x | |||||||||||||||||||||||||||
| Redwood debt to (equity + debt) |
38% | 39% | 13% | 15% | 12% | 15% | 12% | 12% | 12% | |||||||||||||||||||||||||||
| Redwood debt |
$ | 581 | $ | 568 | $ | 140 | $ | 181 | $ | 140 | $ | 184 | $ | 140 | $ | 140 | $ | 140 | ||||||||||||||||||
| ABS obligations of consolidated securitization entities and resecuritization |
3,704 | 4,139 | 4,293 | 3,839 | 3,957 | 3,943 | 3,832 | 3,961 | 3,837 | |||||||||||||||||||||||||||
| Consolidated GAAP Debt |
$ | 4,285 | $ | 4,707 | $ | 4,433 | $ | 4,020 | $ | 4,097 | $ | 4,127 | $ | 3,972 | $ | 4,101 | $ | 3,977 | ||||||||||||||||||
| Consolidated GAAP Debt to equity |
4.5x | 5.3x | 4.6x | 3.9x | 3.8x | 3.7x | 3.9x | 4.0x | 4.0x | |||||||||||||||||||||||||||
| Consolidated GAAP Debt to (equity + GAAP debt) |
82% | 84% | 82% | 80% | 79% | 79% | 80% | 81% | 80% | |||||||||||||||||||||||||||
| GAAP stockholders’ equity |
$ | 962 | $ | 893 | $ | 959 | $ | 1,025 | $ | 1,075 | $ | 1,065 | $ | 1,016 | $ | 991 | $ | 998 | ||||||||||||||||||
| Balance sheet mark-to-market adjustments |
12 | (13 | ) | 32 | 81 | 122 | 112 | 61 | 38 | 58 | ||||||||||||||||||||||||||
| Core equity (non-GAAP) |
$ | 950 | $ | 906 | $ | 927 | $ | 944 | $ | 953 | $ | 953 | $ | 955 | $ | 953 | $ | 940 | ||||||||||||||||||
| Shares outstanding at period end (in thousands) |
78,556 | 78,556 | 78,495 | 78,555 | 78,139 | 78,125 | 77,984 | 77,908 | 77,751 | |||||||||||||||||||||||||||
| GAAP equity per share |
$ | 12.22 | $ | 11.36 | $ | 12.22 | $ | 13.04 | $ | 13.76 | $ | 13.63 | $ | 13.02 | $ | 12.71 | $ | 12.84 | ||||||||||||||||||
| Adjustments: GAAP equity to estimated economic value (2) |
||||||||||||||||||||||||||||||||||||
| Investments in New Sequoia |
$ | (0.08 | ) | $ | (0.13 | ) | $ | (0.06 | ) | $ | (0.05 | ) | $ | (0.06 | ) | $ | (0.06 | ) | $ | (0.04 | ) | $ | (0.03 | ) | $ | - | ||||||||||
| Investments in Other Consolidated Entities |
0.18 | 0.20 | 0.12 | 0.04 | - | (0.10 | ) | (0.24 | ) | (0.31 | ) | (0.37 | ) | |||||||||||||||||||||||
| Long-term debt |
0.93 | 1.06 | 1.06 | 0.78 | 0.75 | 0.84 | 0.99 | 1.00 | 0.85 | |||||||||||||||||||||||||||
| ABS issued - Resecuritization |
(0.07 | ) | (0.04 | ) | (0.01 | ) | - | - | - | - | - | - | ||||||||||||||||||||||||
| Estimate of economic value per share (non- GAAP) | $ | 13.18 | $ | 12.45 | $ | 13.33 | $ | 13.81 | $ | 14.45 | $ | 14.31 | $ | 13.73 | $ | 13.37 | $ | 13.32 | ||||||||||||||||||
(1) Excludes obligations of consolidated securitization entities and the resecuritization we engaged in during the third quarter of 2011.
(2) Differences between GAAP and economic value per share reflect our estimate of the economic value of investments in New Sequoia Entities and Other Consolidated Entities and our long-term debt. See page 17 for an explanation of these adjustments. In reviewing the components of book value and economic value, there are a number of important factors and limitations to consider. Book value and economic value are calculated as of particular points in time based on our existing assets and liabilities and do not incorporate other factors that may have a significant impact on that value, most notably the impact of future business activities. As a result, these values do not necessarily represent an estimate of our net realizable value, liquidation value, or our market value as a whole. Amounts we ultimately realize from the disposition of assets or settlement of liabilities may vary significantly from these values. Because temporary changes in market conditions can substantially affect value, we do not believe that short-term fluctuations in the value of our assets and liabilities are necessarily representative of the effectiveness of our investment strategy or the long-term underlying value of our business. When quoted market prices or observable market data are not available to estimate fair value, we rely on unobservable inputs, which are generally more subjective and involve a high degree of management judgment and assumptions. These assumptions may have a significant effect on our estimates of value, and the use of different assumptions as well as changes in market conditions could have a material effect on our results of operations or financial condition.
| THE REDWOOD REVIEW 1ST QUARTER 2012
|
Table 3: Book Value and Financial Ratios | |||
|
|
Table 4: Yields and Profitability Ratios1 ($ in thousands) | |||
| 2012 Q1 |
2011 Q4 |
2011 Q3 |
2011 Q2 |
2011 Q1 |
2010 Q4 |
2010 Q3 |
2010 Q2 |
2010 Q1 |
Twelve 2011 |
Twelve 2010 |
||||||||||||||||||||||||||||||||||
| Interest income |
$ | 58,740 | $ | 56,495 | $ | 53,396 | $ | 52,955 | $ | 54,333 | $ | 55,753 | $ | 59,015 | $ | 56,570 | $ | 58,716 | $ | 217,179 | $ | 230,054 | ||||||||||||||||||||||
| Average consolidated earning assets |
$ | 5,351,918 | $ | 5,419,721 | $ | 5,143,814 | $ | 5,080,343 | $ | 5,107,979 | $ | 4,980,935 | $ | 5,030,680 | $ | 5,139,945 | $ | 5,070,987 | $ | 5,181,515 | $ | 5,055,322 | ||||||||||||||||||||||
| Asset yield |
4.39 | % | 4.17 | % | 4.15 | % | 4.17 | % | 4.25 | % | 4.48 | % | 4.69 | % | 4.40 | % | 4.63 | % | 4.19 | % | 4.55 | % | ||||||||||||||||||||||
| Interest expense |
$ | (30,655 | ) | $ | (29,115 | ) | $ | (24,317 | ) | $ | (23,632 | ) | $ | (21,973 | ) | $ | (21,624 | ) | $ | (23,695 | ) | $ | (21,164 | ) | $ | (18,181 | ) | $ | (99,037 | ) | $ | (84,664 | ) | |||||||||||
| Average consolidated interest-bearing liabilities |
$ | 4,424,247 | $ | 4,481,303 | $ | 4,105,088 | $ | 4,025,216 | $ | 3,977,010 | $ | 3,937,895 | $ | 4,016,680 | $ | 4,077,992 | $ | 4,015,655 | $ | 4,148,421 | $ | 4,011,855 | ||||||||||||||||||||||
| Cost of funds |
2.77 | % | 2.60 | % | 2.37 | % | 2.35 | % | 2.21 | % | 2.20 | % | 2.36 | % | 2.08 | % | 1.81 | % | 2.39 | % | 2.11 | % | ||||||||||||||||||||||
| Asset yield |
4.39 | % | 4.17 | % | 4.15 | % | 4.17 | % | 4.25 | % | 4.48 | % | 4.69 | % | 4.40 | % | 4.63 | % | 4.19 | % | 4.55 | % | ||||||||||||||||||||||
| Cost of funds |
(2.77 | %) | (2.60 | %) | (2.37 | %) | (2.35 | %) | (2.21 | %) | (2.20 | %) | (2.36 | %) | (2.08 | %) | (1.81 | %) | (2.39 | %) | (2.11 | %) | ||||||||||||||||||||||
| Interest rate spread |
1.62 | % | 1.57 | % | 1.78 | % | 1.82 | % | 2.04 | % | 2.28 | % | 2.33 | % | 2.33 | % | 2.82 | % | 1.80 | % | 2.44 | % | ||||||||||||||||||||||
| Net interest income |
$ | 28,085 | $ | 27,380 | $ | 29,079 | $ | 29,323 | $ | 32,360 | $ | 34,129 | $ | 35,320 | $ | 35,406 | $ | 40,535 | $ | 118,142 | $ | 145,390 | ||||||||||||||||||||||
| Average consolidated earning assets |
$ | 5,351,918 | $ | 5,419,721 | $ | 5,143,814 | $ | 5,080,343 | $ | 5,107,979 | $ | 4,980,935 | $ | 5,030,680 | $ | 5,139,945 | $ | 5,070,987 | $ | 5,181,515 | $ | 5,055,322 | ||||||||||||||||||||||
| Net interest margin |
2.10 | % | 2.02 | % | 2.26 | % | 2.31 | % | 2.53 | % | 2.74 | % | 2.81 | % | 2.76 | % | 3.20 | % | 2.28 | % | 2.88 | % | ||||||||||||||||||||||
| Operating expenses |
$ | (14,634 | ) | $ | (12,574 | ) | $ | (11,507 | ) | $ | (12,087 | ) | $ | (11,514 | ) | $ | (12,937 | ) | $ | (12,245 | ) | $ | (11,227 | ) | $ | (17,306 | ) | $ | (47,682 | ) | $ | (53,715 | ) | |||||||||||
| Average total assets |
$ | 5,505,797 | $ | 5,577,206 | $ | 5,303,614 | $ | 5,263,529 | $ | 5,310,376 | $ | 5,141,550 | $ | 5,161,498 | $ | 5,263,730 | $ | 5,219,636 | $ | 5,357,065 | $ | 5,196,294 | ||||||||||||||||||||||
| Average total equity |
$ | 926,138 | $ | 912,051 | $ | 976,676 | $ | 1,035,063 | $ | 1,092,580 | $ | 1,038,045 | $ | 1,003,372 | $ | 1,005,212 | $ | 985,350 | $ | 1,003,523 | $ | 1,008,127 | ||||||||||||||||||||||
| Operating expenses / net interest income |
52.11 | % | 45.92 | % | 39.57 | % | 41.22 | % | 35.58 | % | 37.91 | % | 34.67 | % | 31.71 | % | 42.69 | % | 40.36 | % | 36.95 | % | ||||||||||||||||||||||
| Operating expenses / average total assets |
1.06 | % | 0.90 | % | 0.87 | % | 0.92 | % | 0.87 | % | 1.01 | % | 0.95 | % | 0.85 | % | 1.33 | % | 0.89 | % | 1.03 | % | ||||||||||||||||||||||
| Operating expenses / average total equity |
6.32 | % | 5.51 | % | 4.71 | % | 4.67 | % | 4.22 | % | 4.99 | % | 4.88 | % | 4.47 | % | 7.03 | % | 4.75 | % | 5.33 | % | ||||||||||||||||||||||
| GAAP net income (loss) |
$ | 30,463 | $ | (2,558 | ) | $ | 1,297 | $ | 9,440 | $ | 18,164 | $ | 14,709 | $ | 19,898 | $ | 28,601 | $ | 46,844 | $ | 26,343 | $ | 110,052 | |||||||||||||||||||||
| GAAP net income (loss) / average total assets |
2.21 | % | (0.18 | %) | 0.10 | % | 0.72 | % | 1.37 | % | 1.14 | % | 1.54 | % | 2.17 | % | 3.59 | % | 0.49 | % | 2.12 | % | ||||||||||||||||||||||
| GAAP net income (loss) / average equity (GAAP ROE) |
13.16 | % | (1.12 | %) | 0.53 | % | 3.65 | % | 6.65 | % | 5.67 | % | 7.93 | % | 11.38 | % | 19.02 | % | 2.63 | % | 10.92 | % | ||||||||||||||||||||||
| GAAP net income (loss) / average core equity (adjusted ROE) (2) |
13.33 | % | (1.13 | %) | 0.56 | % | 4.04 | % | 7.53 | % | 6.14 | % | 8.25 | % | 12.00 | % | 20.09 | % | 2.83 | % | 11.56 | % | ||||||||||||||||||||||
| Average core equity (2) |
$ | 914,052 | $ | 908,915 | $ | 921,048 | $ | 934,205 | $ | 964,554 | $ | 958,194 | $ | 964,249 | $ | 953,720 | $ | 932,721 | $ | 931,998 | $ | 952,324 | ||||||||||||||||||||||
(1) All percentages in this table are shown on an annualized basis.
(2) Core equity is a non-GAAP metric and is equal to GAAP equity excluding accumulated other comprehensive income (loss).
| THE REDWOOD REVIEW 1ST QUARTER 2012
|
Table 4: Yields and Profitability Ratios |
49
| ||
|
|
Table 5: Average Balance Sheet ($ in thousands) | 50
| ||
| 2012 Q1 |
2011 Q4 |
2011 Q3 |
2011 Q2 |
2011 Q1 |
2010 Q4 |
2010 Q3 |
2010 Q2 |
2010 Q1 |
Twelve 2011 |
Twelve 2010 |
||||||||||||||||||||||||||||||||||
| Real estate assets at Redwood |
||||||||||||||||||||||||||||||||||||||||||||
| Commercial loans |
$ | 169,432 | $ | 123,367 | $ | 79,445 | $ | 59,545 | $ | 36,434 | $ | 14,095 | $ | 242 | $ | 243 | $ | 244 | $ | 74,949 | $ | 3,734 | ||||||||||||||||||||||
| Residential loans |
319,353 | 306,869 | 313,763 | 123,914 | 204,847 | 169,691 | 16,463 | 2,299 | 2,313 | 237,837 | 48,064 | |||||||||||||||||||||||||||||||||
| Senior residential securities |
||||||||||||||||||||||||||||||||||||||||||||
| Prime |
325,619 | 248,211 | 244,502 | 246,957 | 255,884 | 262,048 | 270,286 | 278,472 | 283,477 | 248,856 | 273,503 | |||||||||||||||||||||||||||||||||
| Non-prime |
280,970 | 280,066 | 283,043 | 283,784 | 307,253 | 321,655 | 316,089 | 302,461 | 310,948 | 288,447 | 312,827 | |||||||||||||||||||||||||||||||||
| Total senior residential securities |
606,589 | 528,277 | 527,545 | 530,741 | 563,137 | 583,703 | 586,375 | 580,933 | 594,426 | 537,303 | 586,330 | |||||||||||||||||||||||||||||||||
| Residential Re-REMIC securities |
87,001 | 74,560 | 41,598 | 30,447 | 32,648 | 32,917 | 33,250 | 34,385 | 45,852 | 44,919 | 36,556 | |||||||||||||||||||||||||||||||||
| Subordinate residential securities |
||||||||||||||||||||||||||||||||||||||||||||
| Prime |
81,253 | 69,477 | 72,199 | 63,141 | 53,046 | 45,914 | 35,794 | 38,079 | 41,701 | 64,532 | 40,371 | |||||||||||||||||||||||||||||||||
| Non-prime |
9,721 | 11,433 | 10,885 | 11,183 | 12,140 | 11,890 | 9,181 | 7,708 | 4,253 | 11,407 | 8,282 | |||||||||||||||||||||||||||||||||
| Total subordinate residential securities | 90,974 | 80,910 | 83,084 | 74,324 | 65,186 | 57,804 | 44,975 | 45,787 | 45,954 | 75,939 | 48,653 | |||||||||||||||||||||||||||||||||
| Commercial subordinate securities |
3,946 | 4,272 | 4,720 | 5,200 | 6,288 | 6,948 | 7,274 | 7,417 | 7,670 | 5,114 | 7,325 | |||||||||||||||||||||||||||||||||
| CDO |
762 | 960 | 1,247 | 1,297 | 1,252 | 973 | 1,103 | 1,207 | 1,222 | 1,188 | 1,126 | |||||||||||||||||||||||||||||||||
| Total real estate assets at Redwood |
1,278,057 | 1,119,215 | 1,051,402 | 825,468 | 909,792 | 866,131 | 689,682 | 672,270 | 697,681 | 977,249 | 731,788 | |||||||||||||||||||||||||||||||||
| Earning assets at Acacia |
252,907 | 255,801 | 285,985 | 315,039 | 347,786 | 311,949 | 292,468 | 290,060 | 299,843 | 293,677 | 298,597 | |||||||||||||||||||||||||||||||||
| Earning assets at Legacy Sequoia |
2,979,098 | 3,140,931 | 3,207,500 | 3,287,938 | 3,351,214 | 3,425,633 | 3,505,497 | 3,589,882 | 3,666,884 | 3,246,211 | 3,546,199 | |||||||||||||||||||||||||||||||||
| Earning assets at the Fund |
- | - | - | 4,948 | 22,280 | 33,001 | 34,334 | 35,526 | 42,134 | 6,727 | 36,219 | |||||||||||||||||||||||||||||||||
| Total earning assets at Other Consolidated Entities |
3,232,005 | 3,396,732 | 3,493,485 | 3,607,925 | 3,721,280 | 3,770,583 | 3,832,300 | 3,915,468 | 4,008,861 | 3,546,615 | 3,881,015 | |||||||||||||||||||||||||||||||||
| Earning assets at New Sequoia |
617,983 | 697,396 | 392,622 | 396,742 | 225,564 | 162,271 | 204,504 | 161,502 | - | 429,277 | 132,712 | |||||||||||||||||||||||||||||||||
| Cash and cash equivalents |
211,786 | 203,242 | 150,677 | 149,350 | 123,317 | 102,099 | 265,071 | 339,212 | 311,816 | 156,849 | 254,004 | |||||||||||||||||||||||||||||||||
| Earning assets |
5,339,831 | 5,416,585 | 5,088,186 | 4,979,485 | 4,979,953 | 4,901,084 | 4,991,557 | 5,088,452 | 5,018,358 | 5,109,990 | 4,999,519 | |||||||||||||||||||||||||||||||||
| Balance sheet mark-to-market adjustments |
12,087 | 3,136 | 55,628 | 100,858 | 128,026 | 79,851 | 39,123 | 51,493 | 52,629 | 71,525 | 55,803 | |||||||||||||||||||||||||||||||||
| Earning assets - reported value |
5,351,918 | 5,419,721 | 5,143,814 | 5,080,343 | 5,107,979 | 4,980,935 | 5,030,680 | 5,139,945 | 5,070,987 | 5,181,515 | 5,055,322 | |||||||||||||||||||||||||||||||||
| Other assets |
153,879 | 157,485 | 159,800 | 183,186 | 202,397 | 160,615 | 130,818 | 123,785 | 148,649 | 175,550 | 140,972 | |||||||||||||||||||||||||||||||||
| Total assets |
$ | 5,505,797 | $ | 5,577,206 | $ | 5,303,614 | $ | 5,263,529 | $ | 5,310,376 | $ | 5,141,550 | $ | 5,161,498 | $ | 5,263,730 | $ | 5,219,636 | $ | 5,357,065 | $ | 5,196,294 | ||||||||||||||||||||||
| Short-term debt |
$ | 362,107 | $ | 157,992 | $ | 18,116 | $ | 1,797 | $ | 47,976 | $ | 11,265 | $ | - | $ | 7,920 | $ | - | $ | 56,667 | $ | 4,814 | ||||||||||||||||||||||
| Legacy Sequoia ABS issued |
2,934,214 | 3,092,037 | 3,153,659 | 3,229,493 | 3,289,456 | 3,365,929 | 3,439,201 | 3,518,773 | 3,589,269 | 3,190,518 | 3,477,574 | |||||||||||||||||||||||||||||||||
| New Sequoia ABS issued |
569,941 | 646,095 | 356,430 | 359,793 | 197,758 | 147,364 | 184,615 | 144,201 | - | 391,155 | 119,628 | |||||||||||||||||||||||||||||||||
| Resecuritization ABS issued |
211,440 | 222,652 | 180,769 | - | - | - | - | - | - | 101,684 | - | |||||||||||||||||||||||||||||||||
| Acacia ABS issued |
208,281 | 224,273 | 257,872 | 295,902 | 303,601 | 274,630 | 254,244 | 268,715 | 288,241 | 270,160 | 271,373 | |||||||||||||||||||||||||||||||||
| Other liabilities |
155,412 | 183,852 | 221,592 | 200,708 | 232,062 | 151,332 | 126,428 | 164,764 | 200,096 | 202,272 | 160,428 | |||||||||||||||||||||||||||||||||
| Long-term debt |
138,264 | 138,254 | 138,242 | 138,231 | 138,219 | 138,707 | 138,620 | 138,383 | 138,145 | 138,237 | 138,466 | |||||||||||||||||||||||||||||||||
| Total liabilities |
4,579,659 | 4,665,155 | 4,326,680 | 4,225,924 | 4,209,072 | 4,089,227 | 4,143,108 | 4,242,755 | 4,215,751 | 4,350,693 | 4,172,283 | |||||||||||||||||||||||||||||||||
| Noncontrolling interest |
- | - | 258 | 2,542 | 8,724 | 14,278 | 15,018 | 15,763 | 18,535 | 2,849 | 15,884 | |||||||||||||||||||||||||||||||||
| Core equity (1) |
914,052 | 908,915 | 921,048 | 934,205 | 964,554 | 958,194 | 964,249 | 953,720 | 932,721 | 931,998 | 952,324 | |||||||||||||||||||||||||||||||||
| Accumulated other comprehensive income (loss) |
12,086 | 3,136 | 55,628 | 100,858 | 128,026 | 79,851 | 39,123 | 51,493 | 52,629 | 71,525 | 55,803 | |||||||||||||||||||||||||||||||||
| Total equity |
926,138 | 912,051 | 976,676 | 1,035,063 | 1,092,580 | 1,038,045 | 1,003,372 | 1,005,212 | 985,350 | 1,003,523 | 1,008,127 | |||||||||||||||||||||||||||||||||
| Total liabilities and equity |
$ | 5,505,797 | $ | 5,577,206 | $ | 5,303,614 | $ | 5,263,529 | $ | 5,310,376 | $ | 5,141,550 | $ | 5,161,498 | $ | 5,263,730 | $ | 5,219,636 | $ | 5,357,065 | $ | 5,196,294 | ||||||||||||||||||||||
(1) Core equity is a non-GAAP metric and is equal to GAAP equity excluding accumulated other comprehensive income (loss).
| THE REDWOOD REVIEW 1ST QUARTER 2012
|
Table 5: Average Balance Sheet | |||
|
|
Table 6: Balances & Yields by Securities Portfolio at Redwood1 ($ in thousands) | |||
|
2012 Q1 |
2011 Q4 |
2011 Q3 |
2011 Q2 |
2011 Q1 |
2010 Q4 |
2012 Q1 |
2011 Q4 |
2011 Q3 |
2011 Q2 |
2011 Q1 |
2010 Q4 |
|||||||||||||||||||||||||||||||||||||||||
| Residential Prime Senior AFS |
|
Residential Non-Prime Subordinate AFS |
|
|||||||||||||||||||||||||||||||||||||||||||||||||
| Principal balance |
$ | 490,141 | $ | 341,780 | $ | 329,466 | $ | 336,876 | $ | 346,317 | $ | 358,683 | Principal balance |
$ | 22,342 | $ | 29,864 | $ | 26,063 | $ | 26,940 | $ | 29,095 | $ | 31,556 | |||||||||||||||||||||||||||
| Unamortized discount |
(57,193 | ) | (58,424 | ) | (59,415 | ) | (71,985 | ) | (78,306 | ) | (83,465 | ) | Unamortized discount |
(7,403 | ) | (9,495 | ) | (7,783 | ) | (8,196 | ) | (8,466 | ) | (10,123 | ) | |||||||||||||||||||||||||||
| Credit reserve |
(31,011 | ) | (27,806 | ) | (28,330 | ) | (18,433 | ) | (16,679 | ) | (15,667 | ) | Credit reserve |
(6,566 | ) | (8,477 | ) | (7,639 | ) | (7,913 | ) | (9,469 | ) | (9,229 | ) | |||||||||||||||||||||||||||
| Unrealized gains, net |
34,846 | 22,690 | 35,204 | 39,488 | 54,860 | 56,340 | Unrealized (losses) gains, net |
(231 | ) | (739 | ) | (180 | ) | 46 | 868 | 984 | ||||||||||||||||||||||||||||||||||||
| Fair value |
$ | 436,783 | $ | 278,240 | $ | 276,925 | $ | 285,946 | $ | 306,192 | $ | 315,891 | Fair value |
$ | 8,142 | $ | 11,153 | $ | 10,461 | $ | 10,877 | $ | 12,028 | $ | 13,188 | |||||||||||||||||||||||||||
| Average amortized cost | $ | 316,505 | $ | 248,211 | $ | 244,502 | $ | 246,957 | $ | 255,884 | $ | 262,048 | Average amortized cost |
$ | 9,599 | $ | 11,283 | $ | 10,727 | $ | 11,017 | $ | 11,957 | $ | 11,670 | |||||||||||||||||||||||||||
| Interest income |
$ | 7,161 | $ | 6,651 | $ | 6,894 | $ | 7,099 | $ | 7,479 | $ | 8,306 | Interest income |
$ | 489 | $ | 509 | $ | 502 | $ | 531 | $ | 598 | $ | 619 | |||||||||||||||||||||||||||
| Annualized yield |
9.05% | 10.72% | 11.28% | 11.50% | 11.69% | 12.68% | Annualized yield |
20.38% | 18.04% | 18.73% | 19.27% | 20.01% | 21.22% | |||||||||||||||||||||||||||||||||||||||
| Residential Non-Prime Senior AFS |
|
Commercial Subordinate AFS |
|
|||||||||||||||||||||||||||||||||||||||||||||||||
| Principal balance |
$ | 329,182 | $ | 349,385 | $ | 357,809 | $ | 367,209 | $ | 372,394 | $ | 416,169 | Principal balance |
$ | 43,226 | $ | 50,499 | $ | 54,061 | $ | 58,127 | $ | 74,782 | $ | 89,103 | |||||||||||||||||||||||||||
| Unamortized discount |
(68,101 | ) | (75,661 | ) | (71,365 | ) | (81,672 | ) | (87,569 | ) | (104,517 | ) | Unamortized discount |
(5,651 | ) | (3,554 | ) | (2,551 | ) | (4,361 | ) | (4,784 | ) | (5,591 | ) | |||||||||||||||||||||||||||
| Credit reserve |
(15,829 | ) | (16,536 | ) | (24,663 | ) | (19,129 | ) | (17,292 | ) | (15,928 | ) | Credit reserve |
(33,668 | ) | (43,012 | ) | (47,197 | ) | (48,987 | ) | (64,717 | ) | (76,979 | ) | |||||||||||||||||||||||||||
| Unrealized (losses) gains, net |
10,027 | (1,464 | ) | 16,380 | 22,310 | 30,225 | 30,641 | Unrealized gains, net |
1,931 | 1,512 | 1,574 | 1,086 | 1,081 | 963 | ||||||||||||||||||||||||||||||||||||||
| Fair value |
$ | 255,279 | $ | 255,724 | $ | 278,161 | $ | 288,718 | $ | 297,758 | $ | 326,365 | Fair value |
$ | 5,838 | $ | 5,445 | $ | 5,887 | $ | 5,865 | $ | 6,362 | $ | 7,496 | |||||||||||||||||||||||||||
| Average amortized cost | $ | 260,546 | $ | 259,281 | $ | 263,760 | $ | 265,130 | $ | 287,991 | $ | 301,498 | Average amortized cost |
$ | 3,946 | $ | 4,272 | $ | 4,720 | $ | 5,199 | $ | 6,288 | $ | 6,948 | |||||||||||||||||||||||||||
| Interest income |
$ | 5,984 | $ | 6,436 | $ | 7,199 | $ | 7,418 | $ | 8,338 | $ | 8,415 | Interest income |
$ | 480 | $ | 377 | $ | 553 | $ | 558 | $ | 492 | $ | 616 | |||||||||||||||||||||||||||
| Annualized yield |
9.19% | 9.93% | 10.92% | 11.19% | 11.58% | 11.16% | Annualized yield |
48.65% | 35.33% | 46.87% | 42.95% | 31.30% | 35.46% | |||||||||||||||||||||||||||||||||||||||
| Residential Re-REMIC AFS |
|
CDO Subordinate AFS |
|
|||||||||||||||||||||||||||||||||||||||||||||||||
| Principal balance |
$ | 252,941 | $ | 220,697 | $ | 194,245 | $ | 131,860 | $ | 131,860 | $ | 139,426 | Principal balance |
$ | 7,244 | $ | 10,717 | $ | 10,689 | $ | 11,863 | $ | 11,837 | $ | 14,815 | |||||||||||||||||||||||||||
| Unamortized discount |
(81,817 | ) | (78,226 | ) | (68,861 | ) | (52,375 | ) | (54,855 | ) | (62,471 | ) | Unamortized discount |
- | - | (1,082 | ) | (1,083 | ) | (1,082 | ) | (1,082 | ) | |||||||||||||||||||||||||||||
| Credit reserve |
(63,702 | ) | (60,563 | ) | (58,106 | ) | (49,033 | ) | (46,546 | ) | (44,182 | ) | Credit reserve |
(7,244 | ) | (10,717 | ) | (9,607 | ) | (10,780 | ) | (10,755 | ) | (13,733 | ) | |||||||||||||||||||||||||||
| Unrealized gains, net |
47,239 | 37,458 | 45,822 | 47,123 | 55,038 | 52,304 | Unrealized gains, net |
50 | 50 | 50 | 100 | - | - | |||||||||||||||||||||||||||||||||||||||
| Fair value |
$ | 154,661 | $ | 119,366 | $ | 113,100 | $ | 77,575 | $ | 85,497 | $ | 85,077 | Fair value |
$ | 50 | $ | 50 | $ | 50 | $ | 100 | $ | - | $ | - | |||||||||||||||||||||||||||
| Average amortized cost | $ | 87,001 | $ | 74,560 | $ | 41,598 | $ | 30,447 | $ | 32,648 | $ | 32,917 | Average amortized cost |
$ | - | $ | - | $ | - | $ | - | $ | - | $ | - | |||||||||||||||||||||||||||
| Interest income |
$ | 2,823 | $ | 2,473 | $ | 1,675 | $ | 1,437 | $ | 1,480 | $ | 1,440 | Interest income |
$ | - | $ | - | $ | - | $ | - | $ | 34 | $ | - | |||||||||||||||||||||||||||
| Annualized yield |
12.98% | 13.27% | 16.11% | 18.87% | 18.13% | 17.50% | Annualized yield |
N/A | N/A | N/A | N/A | N/A | N/A | |||||||||||||||||||||||||||||||||||||||
| Residential Prime Subordinate AFS |
|
Fair Value Securities |
|
|||||||||||||||||||||||||||||||||||||||||||||||||
| Principal balance |
$ | 247,498 | $ | 207,226 | $ | 227,562 | $ | 248,331 | $ | 258,615 | $ | 273,042 | ||||||||||||||||||||||||||||||||||||||||
| Unamortized discount |
(24,019 | ) | (14,027 | ) | (22,097 | ) | (29,434 | ) | (24,016 | ) | (24,308 | ) | ||||||||||||||||||||||||||||||||||||||||
| Credit reserve |
(118,510 | ) | (128,879 | ) | (134,116 | ) | (146,391 | ) | (179,587 | ) | (199,754 | ) | ||||||||||||||||||||||||||||||||||||||||
| Unrealized (losses) gains, net |
819 | (5,603 | ) | (1,071 | ) | (963 | ) | 3,858 | 4,866 | |||||||||||||||||||||||||||||||||||||||||||
| Fair value |
$ | 105,788 | $ | 58,717 | $ | 70,278 | $ | 71,543 | $ | 58,870 | $ | 53,846 | Fair value |
$ | 42,042 | $ | 22,041 | $ | 22,199 | $ | 20,451 | $ | 20,701 | $ | 21,354 | |||||||||||||||||||||||||||
| Average amortized cost | $ | 80,903 | $ | 69,148 | $ | 71,873 | $ | 62,786 | $ | 52,642 | $ | 45,550 | Average fair value |
$ | 30,773 | $ | 22,223 | $ | 21,014 | $ | 20,472 | $ | 21,101 | $ | 21,713 | |||||||||||||||||||||||||||
| Interest income |
$ | 3,709 | $ | 3,709 | $ | 3,618 | $ | 3,582 | $ | 4,110 | $ | 4,170 | Interest income |
$ | 2,534 | $ | 1,883 | $ | 2,032 | $ | 2,008 | $ | 2,124 | $ | 2,241 | |||||||||||||||||||||||||||
| Annualized yield |
18.34% | 21.46% | 20.14% | 22.82% | 31.23% | 36.61% | Annualized yield |
32.94% | 33.89% | 38.68% | 39.24% | 40.27% | 41.29% | |||||||||||||||||||||||||||||||||||||||
(1) Annualized yields for AFS portfolios are based on average amortized cost. Cash flows from many of our subordinate securities can be volatile and in certain cases (e.g., when the fair value of certain securities are close to zero) any interest income earned can result in unusually high reported yields that are not sustainable and not necessarily meaningful.
| THE REDWOOD REVIEW 1ST QUARTER 2012
|
Table 6: Balances & Yields by Securities Portfolio at Redwood |
51
| ||
|
|
Table 7: Securities and Loans Portfolio Activity at Redwood ($ in thousands) | 52
| ||
|
2012 Q1 |
2011 Q4 |
2011 Q3 |
2011 Q2 |
2011 Q1 |
2010 Q4 |
2012 Q1 |
2011 Q4 |
2011 Q3 |
2011 Q2 |
2011 Q1 |
2010 Q4 |
|||||||||||||||||||||||||||||||||||||||||
| Residential Prime Senior |
|
Commercial Subordinate |
|
|||||||||||||||||||||||||||||||||||||||||||||||||
| Beginning fair value |
$ | 278,240 | $ | 276,925 | $ | 285,946 | $ | 306,192 | $ | 315,891 | $ | 315,934 | Beginning fair value |
$ | 5,445 | $ | 5,887 | $ | 5,865 | $ | 6,362 | $ | 7,496 | $ | 7,912 | |||||||||||||||||||||||||||
| Acquisitions |
193,837 | 20,373 | 2,433 | 8,844 | 3,317 | 6,043 | Acquisitions |
- | - | - | - | - | - | |||||||||||||||||||||||||||||||||||||||
| Sales |
(20,954 | ) | - | - | (8,554 | ) | (2,825 | ) | - | Sales |
- | - | - | - | (2,116 | ) | - | |||||||||||||||||||||||||||||||||||
| Effect of principal payments |
(10,550 | ) | (8,411 | ) | (9,235 | ) | (11,019 | ) | (11,655 | ) | (15,199 | ) | Effect of principal payments |
- | - | - | - | - | - | |||||||||||||||||||||||||||||||||
| Change in fair value, net |
18,075 | (10,647 | ) | (2,219 | ) | (9,517 | ) | 1,464 | 9,113 | Change in fair value, net |
393 | (442 | ) | 22 | (497 | ) | 982 | (416 | ) | |||||||||||||||||||||||||||||||||
| Ending fair value |
$ | 458,648 | $ | 278,240 | $ | 276,925 | $ | 285,946 | $ | 306,192 | $ | 315,891 | Ending fair value |
$ | 5,838 | $ | 5,445 | $ | 5,887 | $ | 5,865 | $ | 6,362 | $ | 7,496 | |||||||||||||||||||||||||||
| Residential Non-Prime Senior |
|
CDO Subordinate |
|
|||||||||||||||||||||||||||||||||||||||||||||||||
| Beginning fair value |
$ | 276,332 | $ | 298,917 | $ | 307,404 | $ | 316,626 | $ | 346,107 | $ | 354,106 | Beginning fair value |
$ | 1,010 | $ | 1,010 | $ | 1,403 | $ | 1,296 | $ | 1,038 | $ | 960 | |||||||||||||||||||||||||||
| Acquisitions |
19,521 | 1,299 | 1,202 | 3,154 | - | 635 | Acquisitions |
- | - | - | - | - | - | |||||||||||||||||||||||||||||||||||||||
| Sales |
(25,408 | ) | - | - | - | (24,486 | ) | - | Sales |
(859 | ) | - | - | - | - | - | ||||||||||||||||||||||||||||||||||||
| Effect of principal payments |
(7,164 | ) | (7,880 | ) | (8,509 | ) | (7,613 | ) | (9,033 | ) | (12,298 | ) | Effect of principal payments |
- | - | - | - | - | - | |||||||||||||||||||||||||||||||||
| Change in fair value, net |
11,673 | (16,004 | ) | (1,180 | ) | (4,763 | ) | 4,038 | 3,664 | Change in fair value, net |
(87 | ) | - | (393 | ) | 107 | 258 | 78 | ||||||||||||||||||||||||||||||||||
| Ending fair value |
$ | 274,954 | $ | 276,332 | $ | 298,917 | $ | 307,404 | $ | 316,626 | $ | 346,107 | Ending fair value |
$ | 64 | $ | 1,010 | $ | 1,010 | $ | 1,403 | $ | 1,296 | $ | 1,038 | |||||||||||||||||||||||||||
| Residential Re-REMIC |
|
Residential Loans |
|
|||||||||||||||||||||||||||||||||||||||||||||||||
| Beginning fair value |
$ | 119,366 | $ | 113,100 | $ | 77,575 | $ | 85,497 | $ | 85,077 | $ | 74,891 | Beginning carrying value |
$ | 395,237 | $ | 228,906 | $ | 205,301 | $ | 54,870 | $ | 254,936 | $ | 63,487 | |||||||||||||||||||||||||||
| Acquisitions |
26,135 | 14,800 | 36,888 | - | - | - | Acquisitions |
660,008 | 174,767 | 404,597 | 152,042 | 98,960 | 194,863 | |||||||||||||||||||||||||||||||||||||||
| Sales |
(2,527 | ) | - | - | - | (5,230 | ) | - | Sales |
(745,262 | ) | (235 | ) | - | - | - | - | |||||||||||||||||||||||||||||||||||
| Effect of principal payments |
- | - | - | - | - | - | Transfers to Securitization Entities |
- | - | (376,226 | ) | - | (295,103 | ) | - | |||||||||||||||||||||||||||||||||||||
| Change in fair value, net |
11,687 | (8,534 | ) | (1,363 | ) | (7,922 | ) | 5,650 | 10,186 | Principal repayments |
(6,970 | ) | (8,189 | ) | (5,115 | ) | (1,616 | ) | (3,922 | ) | (3,517 | ) | ||||||||||||||||||||||||||||||
| Ending fair value |
$ | 154,661 | $ | 119,366 | $ | 113,100 | $ | 77,575 | $ | 85,497 | $ | 85,077 | Transfers to REO |
- | - | - | - | - | - | |||||||||||||||||||||||||||||||||
| Changes in fair value, net |
93 | (12 | ) | 349 | 5 | (1 | ) | 103 | ||||||||||||||||||||||||||||||||||||||||||||
| Residential Prime Subordinate |
|
Ending carrying value |
$ | 303,106 | $ | 395,237 | $ | 228,906 | $ | 205,301 | $ | 54,870 | $ | 254,936 | ||||||||||||||||||||||||||||||||||||||
| Beginning fair value |
$ | 59,060 | $ | 70,606 | $ | 71,845 | $ | 59,239 | $ | 54,232 | $ | 33,384 | ||||||||||||||||||||||||||||||||||||||||
| Acquisitions |
44,543 | - | 3,491 | 21,277 | 9,906 | 15,283 | Commercial Loans |
|
||||||||||||||||||||||||||||||||||||||||||||
| Sales |
- | - | - | - | - | - | Beginning carrying value |
$ | 157,726 | $ | 98,060 | $ | 71,168 | $ | 42,483 | $ | 30,537 | $ | 242 | |||||||||||||||||||||||||||||||||
| Effect of principal payments |
(2,386 | ) | (2,301 | ) | (1,995 | ) | (1,743 | ) | (2,073 | ) | (692 | ) | Originations |
26,888 | 60,297 | 26,908 | 28,660 | 11,925 | 30,275 | |||||||||||||||||||||||||||||||||
| Change in fair value, net |
4,972 | (9,245 | ) | (2,735 | ) | (6,928 | ) | (2,826 | ) | 6,257 | Principal repayments |
(6,091 | ) | (59 | ) | (25 | ) | (2 | ) | (2 | ) | (2 | ) | |||||||||||||||||||||||||||||
| Ending fair value |
$ | 106,189 | $ | 59,060 | $ | 70,606 | $ | 71,845 | $ | 59,239 | $ | 54,232 | Provision for loan losses |
(274 | ) | (608 | ) | - | - | - | - | |||||||||||||||||||||||||||||||
| Discount/fee amortization |
166 | 36 | 9 | 27 | 23 | 22 | ||||||||||||||||||||||||||||||||||||||||||||||
| Residential Non-Prime Subordinate |
|
Ending carrying value |
$ | 178,415 | $ | 157,726 | $ | 98,060 | $ | 71,168 | $ | 42,483 | $ | 30,537 | ||||||||||||||||||||||||||||||||||||||
| Beginning fair value |
$ | 11,283 | $ | 10,616 | $ | 11,036 | $ | 12,196 | $ | 13,376 | $ | 10,041 | ||||||||||||||||||||||||||||||||||||||||
| Acquisitions |
- | 1,582 | - | - | - | 3,820 | ||||||||||||||||||||||||||||||||||||||||||||||
| Sales |
(3,149 | ) | - | - | - | (703 | ) | - | ||||||||||||||||||||||||||||||||||||||||||||
| Effect of principal payments |
(229 | ) | (364 | ) | (287 | ) | (336 | ) | (354 | ) | (542 | ) | ||||||||||||||||||||||||||||||||||||||||
| Change in fair value, net |
324 | (551 | ) | (133 | ) | (824 | ) | (123 | ) | 57 | ||||||||||||||||||||||||||||||||||||||||||
| Ending fair value |
$ | 8,229 | $ | 11,283 | $ | 10,616 | $ | 11,036 | $ | 12,196 | $ | 13,376 | ||||||||||||||||||||||||||||||||||||||||
| THE REDWOOD REVIEW 1ST QUARTER 2012
|
Table 7: Securities and Loans Portfolio Activity at Redwood | |||
|
|
Table 8A: Residential Prime Securities at Redwood and Underlying Loan Characteristics(1) ($ in thousands) | |||
| 2012 Q1 |
2011 Q4 |
2011 Q3 |
2011 Q2 |
2011 Q1 |
2010 Q4 |
2010 Q3 |
2010 Q2 |
|||||||||||||||||||||||||
| Senior AFS |
$ | 436,783 | $ | 278,240 | $ | 276,925 | $ | 285,946 | $ | 306,192 | $ | 315,891 | $ | 315,934 | $ | 309,702 | ||||||||||||||||
| Subordinate AFS |
105,788 | 58,717 | 70,278 | 71,543 | 58,870 | 53,846 | 33,024 | 16,024 | ||||||||||||||||||||||||
| Fair value |
22,266 | 343 | 328 | 302 | 369 | 386 | 360 | 382 | ||||||||||||||||||||||||
| Total Residential Prime Securities |
$ | 564,837 | $ | 337,300 | $ | 347,531 | $ | 357,791 | $ | 365,431 | $ | 370,123 | $ | 349,318 | $ | 326,108 | ||||||||||||||||
| Number of loans |
81,085 | 85,702 | 92,071 | 101,149 | 109,221 | 121,173 | 124,536 | 140,951 | ||||||||||||||||||||||||
| Total loan face |
$ | 30,222,071 | $ | 31,848,071 | $ | 34,816,750 | $ | 39,160,316 | $ | 43,242,656 | $ | 49,071,513 | $ | 52,490,472 | $ | 59,814,476 | ||||||||||||||||
| Average loan size |
$ | 373 | $ | 372 | $ | 378 | $ | 387 | $ | 396 | $ | 405 | $ | 421 | $ | 424 | ||||||||||||||||
| Year 2011 origination |
2% | 0% | 0% | 0% | 0% | 0% | 0% | 0% | ||||||||||||||||||||||||
| Year 2010 origination |
0% | 0% | 0% | 0% | 0% | 0% | 0% | 0% | ||||||||||||||||||||||||
| Year 2009 origination |
0% | 0% | 0% | 0% | 0% | 0% | 0% | 0% | ||||||||||||||||||||||||
| Year 2008 origination |
0% | 0% | 0% | 0% | 0% | 0% | 0% | 0% | ||||||||||||||||||||||||
| Year 2007 origination |
11% | 10% | 10% | 9% | 10% | 9% | 11% | 7% | ||||||||||||||||||||||||
| Year 2006 origination |
3% | 1% | 1% | 1% | 11% | 11% | 11% | 14% | ||||||||||||||||||||||||
| Year 2005 origination |
17% | 19% | 19% | 18% | 17% | 17% | 16% | 20% | ||||||||||||||||||||||||
| Year 2004 origination and earlier |
67% | 70% | 70% | 72% | 62% | 63% | 62% | 59% | ||||||||||||||||||||||||
| Geographic concentration |
||||||||||||||||||||||||||||||||
| Southern CA |
23% | 23% | 23% | 24% | 24% | 24% | 25% | 25% | ||||||||||||||||||||||||
| Northern CA |
21% | 21% | 21% | 21% | 22% | 22% | 22% | 22% | ||||||||||||||||||||||||
| New York |
7% | 6% | 6% | 6% | 6% | 7% | 7% | 6% | ||||||||||||||||||||||||
| Florida |
6% | 6% | 6% | 6% | 6% | 6% | 6% | 6% | ||||||||||||||||||||||||
| Virginia |
3% | 4% | 4% | 4% | 4% | 4% | 4% | 4% | ||||||||||||||||||||||||
| New Jersey |
3% | 3% | 3% | 3% | 3% | 3% | 3% | 3% | ||||||||||||||||||||||||
| Illinois |
3% | 3% | 3% | 3% | 3% | 3% | 3% | 3% | ||||||||||||||||||||||||
| Other states |
34% | 34% | 34% | 33% | 32% | 31% | 30% | 31% | ||||||||||||||||||||||||
| Wtd Avg Original LTV |
68% | 68% | 68% | 68% | 68% | 68% | 68% | 68% | ||||||||||||||||||||||||
| Original LTV: 0 - 50 |
12% | 12% | 12% | 13% | 12% | 13% | 13% | 13% | ||||||||||||||||||||||||
| Original LTV: 50.01 - 60 |
11% | 11% | 11% | 12% | 11% | 12% | 11% | 12% | ||||||||||||||||||||||||
| Original LTV: 60.01 - 70 |
23% | 23% | 23% | 23% | 22% | 22% | 22% | 22% | ||||||||||||||||||||||||
| Original LTV: 70.01 - 80 |
50% | 49% | 49% | 48% | 50% | 49% | 49% | 50% | ||||||||||||||||||||||||
| Original LTV: 80.01 - 90 |
3% | 3% | 3% | 3% | 3% | 3% | 3% | 2% | ||||||||||||||||||||||||
| Original LTV: 90.01 - 100 |
1% | 2% | 2% | 1% | 2% | 1% | 2% | 1% | ||||||||||||||||||||||||
| Unknown |
0% | 0% | 0% | 0% | 0% | 0% | 0% | 0% | ||||||||||||||||||||||||
| Wtd Avg FICO |
735 | 735 | 735 | 735 | 736 | 737 | 738 | 739 | ||||||||||||||||||||||||
| FICO: <= 680 |
11% | 11% | 11% | 11% | 10% | 10% | 8% | 9% | ||||||||||||||||||||||||
| FICO: 681 - 700 |
10% | 10% | 10% | 10% | 10% | 10% | 10% | 9% | ||||||||||||||||||||||||
| FICO: 701 - 720 |
14% | 14% | 14% | 14% | 14% | 14% | 14% | 14% | ||||||||||||||||||||||||
| FICO: 721 - 740 |
15% | 15% | 15% | 15% | 14% | 14% | 15% | 15% | ||||||||||||||||||||||||
| FICO: 741 - 760 |
16% | 16% | 16% | 16% | 16% | 16% | 16% | 16% | ||||||||||||||||||||||||
| FICO: 761 - 780 |
17% | 17% | 17% | 17% | 18% | 18% | 19% | 19% | ||||||||||||||||||||||||
| FICO: 781 - 800 |
12% | 12% | 12% | 12% | 13% | 13% | 13% | 13% | ||||||||||||||||||||||||
| FICO: >= 801 |
3% | 3% | 3% | 3% | 3% | 3% | 3% | 3% | ||||||||||||||||||||||||
| Unknown |
2% | 2% | 2% | 2% | 2% | 2% | 2% | 3% | ||||||||||||||||||||||||
| Conforming balance % (2) |
54% | 55% | 54% | 60% | 59% | 59% | 58% | 58% | ||||||||||||||||||||||||
| > $1 MM % |
9% | 8% | 8% | 8% | 8% | 9% | 9% | 9% | ||||||||||||||||||||||||
| 2nd Home % |
7% | 7% | 7% | 7% | 7% | 7% | 7% | 7% | ||||||||||||||||||||||||
| Investment Home % |
2% | 2% | 2% | 2% | 2% | 2% | 2% | 2% | ||||||||||||||||||||||||
| Purchase |
40% | 40% | 39% | 39% | 42% | 42% | 43% | 43% | ||||||||||||||||||||||||
| Cash Out Refi |
23% | 23% | 23% | 23% | 23% | 23% | 22% | 22% | ||||||||||||||||||||||||
| Rate-Term Refi |
36% | 36% | 37% | 37% | 34% | 34% | 34% | 34% | ||||||||||||||||||||||||
| Other |
1% | 1% | 1% | 1% | 1% | 1% | 1% | 1% | ||||||||||||||||||||||||
| Full Doc |
53% | 51% | 51% | 51% | 50% | 50% | 50% | 55% | ||||||||||||||||||||||||
| No Doc |
6% | 6% | 6% | 6% | 5% | 6% | 5% | 5% | ||||||||||||||||||||||||
| Other Doc (Lim, Red, Stated, etc) |
38% | 40% | 40% | 40% | 42% | 41% | 42% | 38% | ||||||||||||||||||||||||
| Unknown/Not Categorized |
3% | 3% | 3% | 3% | 3% | 3% | 3% | 2% | ||||||||||||||||||||||||
| 2-4 Family |
2% | 1% | 1% | 1% | 1% | 2% | 1% | 1% | ||||||||||||||||||||||||
| Condo |
9% | 9% | 9% | 9% | 10% | 10% | 10% | 10% | ||||||||||||||||||||||||
| Single Family |
88% | 89% | 89% | 89% | 88% | 87% | 88% | 87% | ||||||||||||||||||||||||
| Other
|
1% | 1% | 1% | 1% | 1% | 1% | 1% | 1% | ||||||||||||||||||||||||
(1) Only the loan groups providing direct cash flow to securities we own are included.
(2) The definition of a conforming loan has significantly changed over time. For Q3 2011 and subsequent periods, the conforming balance definition that went into effect on October 1, 2011 was used (which had a maximum loan balance of $625,500). For all periods prior to Q3 2011, the conforming balance definition available in June 2011 was used (which had a maximum loan balance of $729,750).
| THE REDWOOD REVIEW 1ST QUARTER 2012
|
Table 8A: Residential Prime Securities at Redwood and Underlying Loan Characteristics |
53
| ||
|
|
Table 8B: Residential Non-Prime Securities at Redwood and Underlying Loan Characteristics(1) ($ in thousands) | 54
| ||
| 2012 Q1 |
2011 Q4 |
2011 Q3 |
2011 Q2 |
2011 Q1 |
2010 Q4 |
2010 Q3 |
2010 Q2 |
|||||||||||||||||||||||||
| Senior AFS |
$ | 255,279 | $ | 255,724 | $ | 278,161 | $ | 288,718 | $ | 297,758 | $ | 326,365 | $ | 332,829 | $ | 303,635 | ||||||||||||||||
| Subordinate AFS |
8,142 | 11,153 | 10,461 | 10,877 | 12,028 | 13,188 | 9,812 | 9,842 | ||||||||||||||||||||||||
| Fair value |
19,762 | 20,738 | 20,911 | 18,845 | 19,036 | 19,930 | 21,506 | 16,950 | ||||||||||||||||||||||||
| Total Residential Non-prime Securities |
$ | 283,183 | $ | 287,615 | $ | 309,533 | $ | 318,440 | $ | 328,822 | $ | 359,483 | $ | 364,147 | $ | 330,427 | ||||||||||||||||
| Number of loans |
35,452 | 54,717 | 54,538 | 55,830 | 57,542 | 65,949 | 67,713 | 72,621 | ||||||||||||||||||||||||
| Total loan face |
$ | 7,241,685 | $ | 11,730,410 | $ | 11,878,085 | $ | 12,250,760 | $ | 12,723,531 | $ | 14,615,940 | $ | 15,181,465 | $ | 16,931,963 | ||||||||||||||||
| Average loan size |
$ | 204 | $ | 214 | $ | 218 | $ | 219 | $ | 221 | $ | 222 | $ | 224 | $ | 233 | ||||||||||||||||
| Year 2008 origination |
0% | 0% | 0% | 0% | 0% | 0% | 0% | 0% | ||||||||||||||||||||||||
| Year 2007 origination |
0% | 0% | 0% | 0% | 0% | 0% | 0% | 7% | ||||||||||||||||||||||||
| Year 2006 origination |
1% | 14% | 14% | 15% | 15% | 18% | 18% | 18% | ||||||||||||||||||||||||
| Year 2005 origination |
54% | 50% | 51% | 50% | 50% | 49% | 49% | 45% | ||||||||||||||||||||||||
| Year 2004 origination and earlier |
45% | 36% | 35% | 35% | 35% | 33% | 33% | 30% | ||||||||||||||||||||||||
| Geographic concentration |
||||||||||||||||||||||||||||||||
| Southern CA |
22% | 21% | 21% | 21% | 21% | 20% | 21% | 22% | ||||||||||||||||||||||||
| Northern CA |
16% | 15% | 15% | 15% | 14% | 14% | 14% | 14% | ||||||||||||||||||||||||
| Florida |
9% | 9% | 9% | 9% | 9% | 9% | 9% | 9% | ||||||||||||||||||||||||
| New York |
5% | 5% | 5% | 5% | 5% | 5% | 5% | 5% | ||||||||||||||||||||||||
| Virginia |
2% | 3% | 3% | 3% | 3% | 4% | 4% | 4% | ||||||||||||||||||||||||
| New Jersey |
3% | 3% | 3% | 3% | 3% | 3% | 3% | 4% | ||||||||||||||||||||||||
| Illinois |
3% | 3% | 3% | 3% | 3% | 3% | 3% | 3% | ||||||||||||||||||||||||
| Other states |
40% | 41% | 41% | 41% | 42% | 42% | 41% | 40% | ||||||||||||||||||||||||
| Wtd Avg Original LTV |
72% | 73% | 73% | 73% | 73% | 73% | 73% | 73% | ||||||||||||||||||||||||
| Original LTV: 0 - 50 |
7% | 6% | 7% | 7% | 6% | 7% | 7% | 7% | ||||||||||||||||||||||||
| Original LTV: 50.01 - 60 |
9% | 8% | 8% | 8% | 8% | 8% | 8% | 8% | ||||||||||||||||||||||||
| Original LTV: 60.01 - 70 |
19% | 18% | 18% | 18% | 18% | 18% | 18% | 18% | ||||||||||||||||||||||||
| Original LTV: 70.01 - 80 |
57% | 58% | 58% | 58% | 58% | 58% | 58% | 58% | ||||||||||||||||||||||||
| Original LTV: 80.01 - 90 |
6% | 7% | 6% | 6% | 7% | 6% | 6% | 6% | ||||||||||||||||||||||||
| Original LTV: 90.01 - 100 |
2% | 3% | 3% | 3% | 3% | 3% | 3% | 3% | ||||||||||||||||||||||||
| Unknown |
0% | 0% | 0% | 0% | 0% | 0% | 0% | 0% | ||||||||||||||||||||||||
| Wtd Avg FICO |
714 | 710 | 710 | 710 | 711 | 711 | 711 | 711 | ||||||||||||||||||||||||
| FICO: <= 680 |
25% | 27% | 27% | 27% | 27% | 28% | 27% | 27% | ||||||||||||||||||||||||
| FICO: 681 - 700 |
14% | 14% | 14% | 14% | 14% | 14% | 14% | 14% | ||||||||||||||||||||||||
| FICO: 701 - 720 |
15% | 14% | 14% | 14% | 14% | 14% | 14% | 14% | ||||||||||||||||||||||||
| FICO: 721 - 740 |
12% | 12% | 12% | 12% | 12% | 12% | 12% | 12% | ||||||||||||||||||||||||
| FICO: 741 - 760 |
12% | 12% | 12% | 12% | 12% | 11% | 12% | 11% | ||||||||||||||||||||||||
| FICO: 761 - 780 |
10% | 10% | 10% | 10% | 10% | 10% | 10% | 10% | ||||||||||||||||||||||||
| FICO: 781 - 800 |
7% | 7% | 7% | 7% | 7% | 7% | 7% | 7% | ||||||||||||||||||||||||
| FICO: >= 801 |
2% | 2% | 2% | 2% | 2% | 2% | 2% | 2% | ||||||||||||||||||||||||
| Unknown |
3% | 2% | 2% | 2% | 2% | 2% | 2% | 2% | ||||||||||||||||||||||||
| Conforming balance % (2) |
86% | 83% | 82% | 86% | 86% | 86% | 86% | 85% | ||||||||||||||||||||||||
| > $1 MM % |
3% | 3% | 3% | 3% | 3% | 3% | 3% | 4% | ||||||||||||||||||||||||
| 2nd Home % |
4% | 4% | 4% | 4% | 4% | 4% | 4% | 4% | ||||||||||||||||||||||||
| Investment Home % |
15% | 14% | 14% | 13% | 13% | 13% | 13% | 13% | ||||||||||||||||||||||||
| Purchase |
41% | 41% | 41% | 41% | 42% | 42% | 42% | 40% | ||||||||||||||||||||||||
| Cash Out Refi |
42% | 42% | 42% | 42% | 41% | 41% | 41% | 41% | ||||||||||||||||||||||||
| Rate-Term Refi |
16% | 16% | 16% | 16% | 16% | 16% | 16% | 18% | ||||||||||||||||||||||||
| Other |
1% | 1% | 1% | 1% | 1% | 1% | 1% | 1% | ||||||||||||||||||||||||
| Full Doc |
38% | 38% | 39% | 38% | 39% | 38% | 38% | 36% | ||||||||||||||||||||||||
| No Doc |
6% | 5% | 4% | 4% | 4% | 3% | 3% | 3% | ||||||||||||||||||||||||
| Other Doc (Lim, Red, Stated, etc) |
54% | 56% | 56% | 56% | 56% | 57% | 57% | 59% | ||||||||||||||||||||||||
| Unknown/Not Categorized |
2% | 1% | 1% | 2% | 1% | 2% | 2% | 2% | ||||||||||||||||||||||||
| 2-4 Family |
8% | 8% | 8% | 8% | 8% | 8% | 8% | 8% | ||||||||||||||||||||||||
| Condo |
8% | 8% | 8% | 8% | 8% | 8% | 8% | 8% | ||||||||||||||||||||||||
| Single Family |
84% | 84% | 84% | 84% | 84% | 84% | 84% | 84% | ||||||||||||||||||||||||
| Other
|
0% | 0% | 0% | 0% | 0% | 0% | 0% | 0% | ||||||||||||||||||||||||
(1) Only the loan groups providing direct cash flow to securities we own are included.
(2) The definition of a conforming loan has significantly changed over time. For Q3 2011 and subsequent periods, the conforming balance definition that went into effect on October 1, 2011 was used (which had a maximum loan balance of $625,500). For all periods prior to Q3 2011, the conforming balance definition available in June 2011 was used (which had a maximum loan balance of $729,750).
| THE REDWOOD REVIEW 1ST QUARTER 2012
|
Table 8B: Residential Non-Prime Securities at Redwood and Underlying Loan Characteristics | |||
|
|
Table 9: Residential Real Estate Loan Characteristics1 ($ in thousands) | |||
| 2012 Q1 |
2011 Q4 |
2011 Q3 |
2011 Q2 |
2011 Q1 |
2010 Q4 |
2010 Q3 |
2010 Q2 |
|||||||||||||||||||||||||
| Residential loans |
$ | 3,682,379 | $ | 4,231,324 | $ | 4,190,773 | $ | 3,892,161 | $ | 3,819,692 | $ | 3,818,659 | $ | 3,754,053 | $ | 3,807,334 | ||||||||||||||||
| Number of loans |
11,079 | 12,490 | 12,526 | 12,258 | 12,301 | 12,413 | 12,500 | 12,725 | ||||||||||||||||||||||||
| Average loan size |
$ | 332 | $ | 339 | $ | 335 | $ | 318 | $ | 311 | $ | 308 | $ | 300 | $ | 299 | ||||||||||||||||
| Adjustable % |
73% | 72% | 74% | 81% | 84% | 86% | 90% | 90% | ||||||||||||||||||||||||
| Hybrid % |
9% | 9% | 10% | 10% | 11% | 10% | 10% | 10% | ||||||||||||||||||||||||
| Fixed % |
18% | 19% | 16% | 9% | 5% | 4% | 0% | 0% | ||||||||||||||||||||||||
| Amortizing % |
21% | 22% | 19% | 11% | 8% | 7% | 5% | 4% | ||||||||||||||||||||||||
| Interest-only % |
79% | 78% | 81% | 89% | 92% | 93% | 95% | 96% | ||||||||||||||||||||||||
| Florida |
11% | 11% | 12% | 12% | 13% | 13% | 13% | 13% | ||||||||||||||||||||||||
| Southern California |
12% | 12% | 12% | 12% | 11% | 11% | 11% | 11% | ||||||||||||||||||||||||
| Northern California |
16% | 14% | 14% | 12% | 11% | 11% | 10% | 9% | ||||||||||||||||||||||||
| New York |
7% | 7% | 8% | 8% | 8% | 7% | 8% | 8% | ||||||||||||||||||||||||
| Georgia |
4% | 4% | 5% | 5% | 5% | 5% | 5% | 5% | ||||||||||||||||||||||||
| New Jersey |
4% | 4% | 4% | 4% | 4% | 4% | 4% | 4% | ||||||||||||||||||||||||
| Texas |
5% | 6% | 5% | 5% | 5% | 5% | 5% | 5% | ||||||||||||||||||||||||
| Colorado |
3% | 3% | 3% | 3% | 4% | 4% | 4% | 4% | ||||||||||||||||||||||||
| Virginia |
3% | 3% | 2% | 3% | 3% | 3% | 3% | 3% | ||||||||||||||||||||||||
| Arizona |
2% | 2% | 2% | 2% | 2% | 2% | 2% | 2% | ||||||||||||||||||||||||
| Illinois |
2% | 3% | 2% | 2% | 2% | 2% | 2% | 3% | ||||||||||||||||||||||||
| Other states |
31% | 31% | 31% | 32% | 32% | 33% | 33% | 33% | ||||||||||||||||||||||||
| Year 2012 origination |
4% | 0% | 0% | 0% | 0% | 0% | 0% | 0% | ||||||||||||||||||||||||
| Year 2011 origination |
9% | 13% | 9% | 3% | 0% | 0% | 0% | 0% | ||||||||||||||||||||||||
| Year 2010 origination |
8% | 9% | 10% | 8% | 7% | 5% | 2% | 0% | ||||||||||||||||||||||||
| Year 2009 origination |
3% | 3% | 4% | 4% | 5% | 5% | 5% | 6% | ||||||||||||||||||||||||
| Year 2008 origination |
0% | 0% | 0% | 0% | 0% | 0% | 0% | 0% | ||||||||||||||||||||||||
| Year 2007 origination |
2% | 2% | 2% | 2% | 2% | 2% | 2% | 2% | ||||||||||||||||||||||||
| Year 2006 origination |
5% | 4% | 4% | 5% | 5% | 5% | 5% | 5% | ||||||||||||||||||||||||
| Year 2005 origination |
3% | 3% | 3% | 3% | 4% | 4% | 4% | 4% | ||||||||||||||||||||||||
| Year 2004 origination or earlier |
66% | 66% | 68% | 75% | 77% | 79% | 82% | 83% | ||||||||||||||||||||||||
| Wtd Avg Original LTV |
66% | 66% | 66% | 66% | 66% | 66% | 66% | 66% | ||||||||||||||||||||||||
| Original LTV: 0 - 50 |
19% | 19% | 20% | 19% | 19% | 19% | 19% | 19% | ||||||||||||||||||||||||
| Original LTV: 50 - 60 |
13% | 13% | 13% | 13% | 13% | 12% | 12% | 12% | ||||||||||||||||||||||||
| Original LTV: 60 - 70 |
22% | 22% | 21% | 21% | 21% | 21% | 21% | 20% | ||||||||||||||||||||||||
| Original LTV: 70 - 80 |
41% | 40% | 40% | 40% | 40% | 41% | 41% | 42% | ||||||||||||||||||||||||
| Original LTV: 80 - 90 |
2% | 2% | 2% | 2% | 2% | 2% | 2% | 2% | ||||||||||||||||||||||||
| Original LTV: 90 - 100 |
4% | 4% | 4% | 5% | 5% | 5% | 5% | 5% | ||||||||||||||||||||||||
| Wtd Avg FICO |
740 | 740 | 739 | 736 | 735 | 734 | 733 | 733 | ||||||||||||||||||||||||
| FICO: < = 600 |
0% | 0% | 1% | 1% | 1% | 1% | 1% | 1% | ||||||||||||||||||||||||
| FICO: 601 - 620 |
1% | 1% | 1% | 1% | 1% | 1% | 1% | 1% | ||||||||||||||||||||||||
| FICO: 621 - 640 |
1% | 1% | 2% | 2% | 2% | 2% | 2% | 2% | ||||||||||||||||||||||||
| FICO: 641 - 660 |
3% | 3% | 3% | 3% | 3% | 3% | 4% | 4% | ||||||||||||||||||||||||
| FICO: 661 - 680 |
6% | 6% | 6% | 7% | 7% | 7% | 7% | 7% | ||||||||||||||||||||||||
| FICO: 681 - 700 |
9% | 9% | 9% | 10% | 10% | 11% | 11% | 11% | ||||||||||||||||||||||||
| FICO: 701 - 720 |
12% | 12% | 12% | 12% | 13% | 13% | 13% | 13% | ||||||||||||||||||||||||
| FICO: 721 - 740 |
12% | 12% | 12% | 13% | 13% | 13% | 13% | 13% | ||||||||||||||||||||||||
| FICO: 741 - 760 |
14% | 14% | 14% | 14% | 14% | 14% | 14% | 14% | ||||||||||||||||||||||||
| FICO: 761 - 780 |
18% | 19% | 18% | 18% | 17% | 17% | 17% | 17% | ||||||||||||||||||||||||
| FICO: 781 - 800 |
17% | 18% | 17% | 15% | 15% | 14% | 13% | 13% | ||||||||||||||||||||||||
| FICO: > = 801 |
6% | 5% | 5% | 4% | 4% | 4% | 4% | 4% | ||||||||||||||||||||||||
| Conforming balance % (2) |
42% | 41% | 42% | 49% | 50% | 51% | 53% | 53% | ||||||||||||||||||||||||
| % balance in loans > $1mm per loan |
22% | 22% | 22% | 20% | 20% | 20% | 18% | 18% | ||||||||||||||||||||||||
| 2nd home % |
10% | 11% | 11% | 11% | 11% | 12% | 12% | 12% | ||||||||||||||||||||||||
| Investment home % |
3% | 3% | 3% | 3% | 3% | 4% | 4% | 4% | ||||||||||||||||||||||||
| Purchase |
33% | 33% | 33% | 32% | 31% | 31% | 31% | 31% | ||||||||||||||||||||||||
| Cash out refinance |
28% | 28% | 29% | 31% | 33% | 33% | 34% | 34% | ||||||||||||||||||||||||
| Rate-term refinance |
38% | 38% | 37% | 36% | 35% | 35% | 34% | 34% | ||||||||||||||||||||||||
| Other
|
1% | 1% | 1% | 1% | 1% | 1% | 1% | 1% | ||||||||||||||||||||||||
(1) This table presents characteristics of residential loans held by consolidated Sequoia entities and residential loans held by Redwood and intended to be securitized by future Sequoia entities or sold to third parties.
(2) The definition of a conforming loan has significantly changed over time. For Q3 2011 and subsequent periods, the conforming balance definition that went into effect on October 1, 2011 was used (which had a maximum loan balance of $625,500). For all periods prior to Q3 2011, the conforming balance definition available in June 2011 was used (which had a maximum loan balance of $729,750).
| THE REDWOOD REVIEW 1ST QUARTER 2012
|
Table 9: Residential Real Estate Loan Characteristics |
55
| ||
|
|
Table 10: Commercial Loan Characteristics1 ($ in thousands) | 56
| ||
| 2012 Q1 |
2011 Q4 |
2011 Q3 |
2011 Q2 |
2011 Q1 |
2010 Q4 |
2010 Q3 |
2010 Q2 | |||||||||||||||||||||||||
| Commercial loans |
$ | 182,803 | $ | 158,847 | $ | 158,846 | $ | 98,600 | $ | 71,651 | $ | 42,953 | $ | 30,955 | $ | 457 | ||||||||||||||||
| Number of loans |
19 | 15 | 16 | 12 | 9 | 6 | 4 | 1 | ||||||||||||||||||||||||
| Average loan size |
$ | 9,621 | $ | 9,928 | $ | 9,928 | $ | 8,217 | $ | 7,961 | $ | 7,159 | $ | 7,739 | $ | 457 | ||||||||||||||||
| Fixed % |
92% | 91% | 91% | 100% | 100% | 100% | 100% | 100% | ||||||||||||||||||||||||
| Hybrid % |
8% | 9% | 9% | 0% | 0% | 0% | 0% | 0% | ||||||||||||||||||||||||
| Amortizing % |
16% | 19% | 19% | 14% | 1% | 1% | 1% | 100% | ||||||||||||||||||||||||
| Interest-only % |
84% | 81% | 81% | 86% | 99% | 99% | 99% | 0% | ||||||||||||||||||||||||
| Illinois |
18% | 21% | 21% | 12% | 17% | 28% | 39% | 0% | ||||||||||||||||||||||||
| California |
20% | 21% | 21% | 18% | 10% | 1% | 1% | 100% | ||||||||||||||||||||||||
| New York |
17% | 16% | 16% | 19% | 26% | 43% | 60% | 0% | ||||||||||||||||||||||||
| Michigan |
7% | 8% | 8% | 13% | 0% | 0% | 0% | 0% | ||||||||||||||||||||||||
| Massachesetts |
0% | 4% | 4% | 6% | 8% | 14% | 0% | 0% | ||||||||||||||||||||||||
| Florida |
13% | 4% | 4% | 6% | 8% | 14% | 0% | 0% | ||||||||||||||||||||||||
| Kentucky |
2% | 3% | 3% | 4% | 6% | 0% | 0% | 0% | ||||||||||||||||||||||||
| Texas |
5% | 2% | 2% | 4% | 0% | 0% | 0% | 0% | ||||||||||||||||||||||||
| Other |
18% | 21% | 21% | 18% | 25% | 0% | 0% | 0% | ||||||||||||||||||||||||
| Year 2012 origination |
15% | 0% | 0% | 0% | 0% | 0% | 0% | 0% | ||||||||||||||||||||||||
| Year 2011 origination |
68% | 81% | 81% | 69% | 57% | 28% | 0% | 0% | ||||||||||||||||||||||||
| Year 2010 origination |
17% | 19% | 19% | 31% | 43% | 71% | 99% | 0% | ||||||||||||||||||||||||
| Year 2004 origination |
<1% | <1% | <1% | <1% | <1% | 1% | 1% | 100% | ||||||||||||||||||||||||
| Retail |
25% | 29% | 29% | 30% | 10% | 0% | 0% | 0% | ||||||||||||||||||||||||
| Office |
25% | 29% | 29% | 25% | 34% | 57% | 60% | 100% | ||||||||||||||||||||||||
| Hospitality |
18% | 20% | 20% | 18% | 25% | 0% | 0% | 0% | ||||||||||||||||||||||||
| Multi-family |
23% | 14% | 14% | 14% | 14% | 14% | 0% | 0% | ||||||||||||||||||||||||
| Mixed-use |
7% | 8% | 8% | 13% | 17% | 29% | 40% | 0% | ||||||||||||||||||||||||
| Other
|
2% | 0% | 0% | 0% | 0% | 0% | 0% | 0% | ||||||||||||||||||||||||
(1) This table presents characteristics of commercial loans held-for-investment by Redwood.
| THE REDWOOD REVIEW 1ST QUARTER 2012
|
Table 10: Commercial Loan Characteristics | |||
REDWOOD TRUST CORPORATE INFORMATION
For more information about Redwood Trust, please visit our website at: www.redwoodtrust .com