
Exhibit 99.2
|
|
||
|
TABLE OF CONTENTS
|
| Introduction |
4 | |||
| Shareholder Letter |
5 | |||
| Quarterly Overview |
7 | |||
| Financial Insights |
14 | |||
| u Balance Sheet |
14 | |||
| u GAAP Income |
17 | |||
| u Taxable Income and Dividends |
22 | |||
| Residential Mortgage Banking Activities |
24 | |||
| Commercial Mortgage Banking Activities |
25 | |||
| Investments in Residential Real Estate Securities |
27 | |||
| Appendix |
31 | |||
| Primer on Triple-A RMBS Spreads |
32 | |||
| Redwood’s Business Strategy |
35 | |||
| Glossary |
38 | |||
| Financial Tables |
45 | |||
| THE REDWOOD REVIEW | 1ST QUARTER 2013 | 1 |
|
| ||
|
CAUTIONARY STATEMENT
|
This Redwood Review contains forward-looking statements within the meaning of the safe harbor provisions of the Private Securities Litigation Reform Act of 1995. Forward-looking statements involve numerous risks and uncertainties. Our actual results may differ from our expectations, estimates, and projections and, consequently, you should not rely on these forward-looking statements as predictions of future events. Forward-looking statements are not historical in nature and can be identified by words such as “anticipate,” “estimate,” “will,” “should,” “expect,” “believe,” “intend,” “seek,” “plan,” and similar expressions or their negative forms, or by references to strategy, plans, or intentions. These forward-looking statements are subject to risks and uncertainties, including, among other things, those described in our most recent Annual Report on Form 10-K under the caption “Risk Factors.” Other risks, uncertainties, and factors that could cause actual results to differ materially from those projected are described below and may be described from time to time in reports we file with the Securities and Exchange Commission, including reports on Forms 10-K, 10-Q, and 8-K. We undertake no obligation to update or revise forward-looking statements, whether as a result of new information, future events, or otherwise.
Statements regarding the following subjects, among others, are forward-looking by their nature: (i) statements we make regarding Redwood’s future business strategy and strategic focus, including our belief that our long-term business strategy is working and our statement about the three big business assumptions that continue to drive our business strategy in 2013 – namely, that the government will eventually reduce its outsized role in the mortgage market, that new bank regulation and legacy portfolio issues will open up an opportunity for independent mortgage companies, and that traditional institutional investors in triple-A securities will return to the market; (ii) statements we make regarding our expectations and outlook for residential loan gain-on-sale margins, including our statement that we now expect that for the remainder of 2013 these residential loan sale margins will average much closer to the high end of our previously stated long-term expected range of 25 to 50 basis points; (iii) statements we make regarding yield premiums and spreads relating to triple-A rated residential mortgage-backed securities (RMBS), including that tighter spreads and lower premiums are better for us and wider spreads are worse for us, the factors that we believe generally affect these spreads and premiums, and the extent to which risks relating to yield premiums and spreads can be mitigated; (iv) statements describing and relating to our goals for 2013, including that we are on track to meet or exceed our operational goals for 2013, that based on our current run rate we are now planning to acquire up to $8 billion of jumbo residential mortgage loans in 2013, and that our goal for 2013 is to originate and sell $1 billion of senior commercial loans; (v) statements relating to acquiring residential mortgage loans in the future that we have identified for purchase or plan to purchase, including the amount of such loans that we identified for purchase during the first quarter of 2013, during April 2013, at March 31, 2013, and at April 30, 2013; (vi) statements relating to our future investment strategy and future investment activity, including, without limitation, that over time we expect that investments created through our Sequoia program or other mortgage banking activities, as well as through the acquisition of newly issued subordinate securities from third-party securitization sponsors, will replace the senior residential securities in our investment portfolio; (vii) statements relating to our estimate of our investment capacity (including that we estimate our current investment capacity to be approximately $300 million) and our statement that we believe this level of investment capacity should be sufficient for our needs well into the year of 2013; (viii) statements relating to our competitive position and our ability to compete in the future; (ix) statements relating to future market and economic conditions and the future volume of transactions in those markets, including, without limitation, future conditions in the residential and commercial real estate markets and related financing markets, and the related potential opportunities for our residential and commercial business activity (including our statement that we believe investors will return to the non-Agency RMBS market if the size of the market represents a compelling opportunity and there is sufficient relative value compared to other fixed income asset classes); (x) statements relating to our expectations regarding future interest income and net interest income, future earnings, future
| 2 | THE REDWOOD REVIEW | 1ST QUARTER 2013 |
|
|
||
|
CAUTIONARY STATEMENT
|
gains, future earnings volatility, and future trends in operating expenses and the factors that may affect those trends; (xi) statements regarding credit reserves, credit losses, the adequacy of credit support, and impairments and their impact on our investments (including as compared to our original expectations and credit reserve levels) and the timing of losses and impairments, and statements that the amount of credit reserves we designate are adequate or may require changes in the future; (xii) statements relating to our expectation that we will start acquiring Agency conforming residential mortgage loans by the end of 2013; (xiii) statements relating to our expectations regarding the size of our future investment in mortgage servicing rights (MSRs) and the attractiveness of MSR valuations and that net servicing fees will increase over time and become an increasingly larger contributor to earnings; (xiv) the statement of our Board of Directors’ intention to pay a regular dividend of $0.28 per share per quarter in 2013 and our statement that we will likely not be required to distribute a special dividend in 2013; and (xv) statements regarding our expectations and estimates relating to the characterization for income tax purposes of our dividend distributions, our expectations and estimates relating to tax accounting, tax liabilities, and GAAP tax provisions, our estimates of REIT taxable income and TRS taxable income, and our anticipation of additional credit losses for tax purposes in future periods (and, in particular, our statement that, for tax purposes, we expect an additional $104 million of credit losses on residential securities we currently own to be realized over an estimated three-to-five year period).
Important factors, among others, that may affect our actual results include: general economic trends, the performance of the housing, commercial real estate, mortgage, credit, and broader financial markets, and their effects on the prices of earning assets and the credit status of borrowers; federal and state legislative and regulatory developments, and the actions of governmental authorities, including those affecting the mortgage industry or our business; our exposure to credit risk and the timing of credit losses within our portfolio; the concentration of the credit risks we are exposed to, including due to the structure of assets we hold and the geographical concentration of real estate underlying assets we own; our exposure to adjustable-rate and negative amortization mortgage loans; the efficacy and expense of our efforts to manage or hedge credit risk, interest rate risk, and other financial and operational risks; changes in credit ratings on assets we own and changes in the rating agencies’ credit rating methodologies; changes in interest rates; changes in mortgage prepayment rates; the availability of assets for purchase at attractive prices and our ability to reinvest cash we hold; changes in the values of assets we own; changes in liquidity in the market for real estate securities and loans; our ability to finance the acquisition of real estate-related assets with short-term debt; the ability of counterparties to satisfy their obligations to us; our involvement in securitization transactions, the timing and profitability of those transactions, and the risks we are exposed to in engaging in securitization transactions; exposure to claims and litigation, including litigation arising from our involvement in securitization transactions; whether we have sufficient liquid assets to meet short-term needs; our ability to successfully compete and retain or attract key personnel; our ability to adapt our business model and strategies to changing circumstances; changes in our investment, financing, and hedging strategies and new risks we may be exposed to if we expand our business activities; exposure to environmental liabilities and the effects of global climate change; failure to comply with applicable laws and regulations; our failure to maintain appropriate internal controls over financial reporting and disclosure controls and procedures; the impact on our reputation that could result from our actions or omissions or from those of others; changes in accounting principles and tax rules; our ability to maintain our status as a REIT for tax purposes; limitations imposed on our business due to our REIT status and our status as exempt from registration under the Investment Company Act of 1940; decisions about raising, managing, and distributing capital; and other factors not presently identified.
This Redwood Review may contain statistics and other data that in some cases have been obtained from or compiled from information made available by servicers and other third-party service providers.
| THE REDWOOD REVIEW | 1ST QUARTER 2013 | 3 |
|
| ||
|
INTRODUCTION
|
Note to Readers:
We file annual reports (on Form 10-K) and quarterly reports (on Form 10-Q) with the Securities and Exchange Commission. These filings and our earnings press releases provide information about Redwood and our financial results in accordance with generally accepted accounting principles (GAAP). We urge you to review these documents, which are available through our website, www.redwoodtrust.com.
This document, called The Redwood Review, is an additional format for providing information about Redwood through a discussion of our GAAP financial results, as well as other metrics, such as taxable income. Supplemental information is also provided in the Financial Tables in this Review to facilitate more detailed understanding and analysis of Redwood. We may also provide non-GAAP financial measures in this Review. When we use non-GAAP financial measures it is because we believe that these figures provide additional insight into Redwood’s business. In each case in which we discuss a non-GAAP financial measure you will find an explanation of how it has been calculated, why we think the figure is important, and a reconciliation between the GAAP and non-GAAP figures.
References herein to “Redwood,” the “company,” “we,” “us,” and “our” include Redwood Trust, Inc. and its consolidated subsidiaries. References to “at Redwood” exclude all consolidated securitization entities (with the exception of the residential resecuritization we completed in the third quarter of 2011 and the commercial securitization we completed in the fourth quarter of 2012) in order to present our operations in the way management analyzes them. Note that because we round numbers in the tables to millions, except per share amounts, some numbers may not foot due to rounding. References to the “first quarter” refer to the quarter ending March 31, 2013, and references to the “fourth quarter” refer to the quarter ending December 31, 2012, unless otherwise specified.
We hope you find this Review helpful to your understanding of our business. We thank you for your input and suggestions, which have resulted in our changing the form and content of The Redwood Review over time.
|
Selected Financial Highlights
| ||||||||||||||
| Quarter: Year | GAAP Income (Loss) per Share |
REIT Taxable Income per Share (1) |
Annualized GAAP Return on Equity |
GAAP
Book Value per Share |
Dividends per Share | |||||||||
| Q111 | $0.22 | $0.09 | 8% | $13.76 | $0.25 | |||||||||
| Q211 | $0.11 | $0.02 | 4% | $13.04 | $0.25 | |||||||||
| Q311 | $0.01 | $0.09 | 1% | $12.22 | $0.25 | |||||||||
| Q411 | ($0.03) | $0.04 | (1%) | $11.36 | $0.25 | |||||||||
| Q112 | $0.37 | $0.13 | 13% | $12.22 | $0.25 | |||||||||
| Q212 | $0.24 | $0.22 | 8% | $12.00 | $0.25 | |||||||||
| Q312 | $0.48 | $0.19 | 16% | $12.88 | $0.25 | |||||||||
| Q412 | $0.50 | $0.23 | 15% | $13.95 | $0.25 | |||||||||
| Q113 | $0.69 | $0.20 | 21% | $14.54 | $0.28 | |||||||||
| (1) REIT taxable income per share for 2012 and 2013 are estimates until we file tax returns for those years. | |||||||||||||||
| 4 | THE REDWOOD REVIEW | 1ST QUARTER 2013 |
|
|
||
|
SHAREHOLDER LETTER
|
Dear Fellow Shareholders:
Our performance during the first quarter of 2013 was positive for the Redwood franchise and for you — our shareholders. Our residential and commercial mortgage banking activities yielded strong results and we are on track to meet or exceed our operational goals for 2013. We feel especially good about the pace and quality of the investments we are making through our residential platform. From a strategic standpoint, we remain encouraged by the overall development of our competitive position and the flexibility we have built into our business.
We know that shareholders are interested in our take on recent press headlines focusing on the issue of widening spreads for residential mortgage-backed securities (RMBS). This issue is part of the larger subject of market prices for RMBS and the margins we earn from completing residential loan securitizations. Because it is a complicated but very important topic, we cover it in detail in a one-time “Primer on Triple-A RMBS Spreads” that can be found on page 32 of this Redwood Review.
We have historically been loath to provide specific guidance on margins, especially given that market volatility is normal for any re-emerging market and the volatility in no way affects our long-term outlook for our business. That said, we have never been ones to bury our collective head in the sand, so we felt it was appropriate to go into greater detail than normal on this subject given the recent volatility we have observed in benchmark rates and triple-A RMBS spreads.
In summary, we expect our residential loan sale margins to decline from the extraordinarily high levels we realized in the fourth quarter of 2012 and much of the first quarter of 2013, due to the recent pullback in prices for triple-A rated RMBS. We now expect that for the remainder of 2013 our residential loan sale margins will average much closer to the high end of our previously stated long-term expected range of 25 to 50 basis points.
We attempt to manage residential loan sale margins through the daily pricing we offer our loan sellers as well as through hedging, but ultimately we cannot control the yields investors will require at any given time for newly issued triple-A RMBS. On the other hand, even though many industry participants associate Redwood with our market-leading role as an issuer of private-label RMBS, our ability to profit from the sale of prime jumbo loans is not limited to securitizations. Our platform also supports the bulk sale of whole loans, and in 2013, we are taking a “best execution” sales approach. This will help us as we ride out the latest wave of market volatility. We also continue to see our loan acquisition volumes rise, thanks to the expansion of our residential loan platform. We had previously stated that our goal was to acquire and securitize $7 billion of jumbo loans in 2013. We acquired $2.6 billion of residential loans in the first quarter and continued to expand our seller base, so based on our current run rate we are now planning to acquire up to $8 billion of jumbo loans in 2013.
To reach our potential, we are focusing significant attention on building out our new Denver operations center, which will eventually house most facets of our residential conduit operations. We are mindful of the challenges represented by strong growth and new business initiatives, and we are spending the appropriate time and energy to properly manage the process. As we expand, we must ensure that our systems, processes, controls, and, above all, people continue to meet the highest standards. It was a similar up-front investment in our infrastructure in 2010 that positioned us for our current success in accumulating loans on a flow basis and creating our own investments. Our Denver expansion is the next step towards unlocking the full potential of our residential conduit platform. To that end, our Denver expansion will position us to begin acquiring “conforming” loans that meet the eligibility criteria of Fannie Mae and Freddie Mac (the “Agencies” or “GSEs”). If we can successfully accumulate and sell conforming loans to
| THE REDWOOD REVIEW | 1ST QUARTER 2013 | 5 |
|
| ||
|
SHAREHOLDER LETTER
|
the GSEs, we not only expect to earn fees but also plan to build a significant investment in mortgage servicing rights (MSRs) at a time when we believe MSR valuations are attractive given the current interest rate environment.
Our commercial team continues to execute on its strategic plan and also contributed to our strong performance in the first quarter of 2013. Our senior loan origination and sales initiative, which began in the second half of last year and accelerated in the first quarter of 2013, has resulted in significant volume for our commercial platform and impressive growth in fee income. Our focus on senior loans is intended to boost our return on capital and complement our investment activity in commercial mezzanine loans.
We still have a lot of work to do in building out our platforms, and we are not resting on a few good quarters of performance, especially given the recent volatility in the RMBS market. But we believe our long-term strategy is working. Our three big business assumptions — that the government will eventually reduce its outsized role in the mortgage market; that new bank regulation and legacy portfolio issues will open up an opportunity for independent mortgage companies; and that traditional institutional investors in triple-A securities will return to the market — continue to drive our business strategy in 2013.
As always, we appreciate your continued support.

|

| |
| Martin S. Hughes | Brett D. Nicholas | |
| CEO | President |
| 6 | THE REDWOOD REVIEW | 1ST QUARTER 2013 |
|
|
||
|
QUARTERLY OVERVIEW
|
First Quarter 2013 Results
Overview
Our business generated strong operating and financial metrics for the first quarter of 2013. Quarterly highlights include the following:
| • | We earned $0.69 per share for the first quarter of 2013, of which $0.28 per share was distributed as dividends to shareholders and $0.41 per share was retained for reinvestment. |
| • | Our GAAP book value at the end of the first quarter was $14.54, up $0.59 from year-end. |
| • | We completed four residential securitizations totaling $2.2 billion, and created $166 million of securities for our investment portfolio. |
| • | Our residential loan gain-on-sale margins remained elevated through most of the quarter, but declined late in the quarter as triple-A spreads widened — a market condition that continued through April of the second quarter. |
| • | We identified $3.1 billion of residential loans for purchase in the first quarter, as compared to $2.2 billion in the prior quarter. (In April 2013, loans identified for purchase totaled $1.1 billion, our second largest ever monthly total.) |
| • | We added 18 residential loan sellers to our platform to increase the total to 80 at March 31, 2013. |
| • | We originated and funded 11 senior commercial loans and originated four other senior commercial loans table-funded by third parties, for a total of $300 million. |
| • | We raised approximately $288 million through a convertible debt offering completed on attractive terms. |
Financial Results
We posted our strongest quarterly earnings in the post-financial crisis period, earning $61 million, or $0.69 per share, for the first quarter of 2013, as compared to $42 million, or $0.50 per share, for the fourth quarter of 2012. This increase is comprised of several components, which are discussed below.
| THE REDWOOD REVIEW | 1ST QUARTER 2013 | 7 |
|
| ||
|
QUARTERLY OVERVIEW
|
Financial Results (continued)
The following table sets forth the components of our first quarter 2013 and fourth quarter 2012 net income, together with a non-GAAP presentation of the components of our fourth quarter 2012 net income. The non-GAAP presentation reflects a reclassification adjustment, which, overall, does not impact reported net income under GAAP, but which we believe is useful for investors because it reflects the impact of our deconsolidation of certain legacy securitization entities in a manner consistent with the way management analyzes fourth quarter results of operations and compares our first quarter 2013 results to our fourth quarter 2012 results.
|
Components of Consolidated Income |
| |||||||||||||||
| ($ in millions)
|
| |||||||||||||||
| Three Months Ended | ||||||||||||||||
| 12/31/12 | 3/31/13 | |||||||||||||||
| As Reported | Reclassification
Adjustment (1) |
(Non-GAAP) As Adjusted |
As Reported | |||||||||||||
| Net interest income |
$ | 20 | $ | 11 | $ | 31 | $ | 35 | ||||||||
| Provision for loan losses |
(3 | ) | - | (3 | ) | (2 | ) | |||||||||
| Other market valuation adjustments, net |
(1 | ) | - | (1 | ) | 2 | ||||||||||
| Mortgage banking activities, net |
24 | - | 24 | 44 | ||||||||||||
| Operating expenses |
(18 | ) | - | (18 | ) | (20 | ) | |||||||||
| Total realized gains, net: (2) |
||||||||||||||||
| Realized gains on sales, net |
5 | - | 5 | 12 | ||||||||||||
| Realized gain on deconsolidation |
15 | (11 | ) | 4 | - | |||||||||||
| Provision for income taxes
|
|
-
|
|
|
-
|
|
|
-
|
|
|
(11
|
)
| ||||
| Net income |
$ | 42 | $ | - | $ | 42 | $ | 61 | ||||||||
(1) The Reclassification Adjustment column shows a reclassification adjustment related to the deconsolidation of certain legacy Acacia and Sequoia entities that impacts items reported under GAAP, but which, overall, does not impact reported net income: Net interest income is increased by $11 million to address the non-recurring decrease to net interest income resulting from accelerated recognition of $11 million of deferred hedging costs relating to Acacia entities upon deconsolidation of these entities; and Realized gain on deconsolidation is decreased by $11 million to reflect that the deconsolidation of these Sequoia and Acacia entities resulted in a non-recurring net increase to earnings of only $4 million.
(2) Total realized gains, net were $20 million as reported under GAAP for the three months ended December 31, 2012.
Net interest income for the first quarter of 2013 was $35 million, an increase of $4 million over the fourth quarter of 2012 (after adjusting for the non-GAAP reclassification adjustment set forth in the table above). This increase reflects a higher level of securities investments as we added $166 million of residential mortgage-backed securities (RMBS) created from our Sequoia securitizations, more residential loans held-for-sale than we had in the fourth quarter, and additional interest payments we received on a commercial loan that prepaid during the first quarter. As reported under GAAP, net interest income for the first quarter increased by $15 million from fourth quarter 2012 net interest income of $20 million.
Our total first quarter revenues from mortgage banking activities were $44 million, of which $37 million was generated from residential activities and $7 million was generated from commercial activities. This compares with total mortgage banking revenues for the fourth quarter of 2012 of $24 million, of which $23 million was generated from residential activities and $1 million was generated from commercial activities.
| 8 | THE REDWOOD REVIEW | 1ST QUARTER 2013 |
|
|
||
|
QUARTERLY OVERVIEW
|
Financial Results (continued)
Our revenues from residential mortgage banking activities increased by $14 million in the first quarter, as compared to the fourth quarter of 2012. This increase resulted from a higher volume of loan acquisitions and a higher volume of loan sales through Sequoia securitizations executed at gain-on-sale margins that remained elevated through much of the first quarter, as triple-A spreads remained tight (and, therefore, generally favorable to our margins) during much of the first quarter. Triple-A spreads began widening (generally unfavorable to our margins) around the middle of the first quarter. A more detailed discussion, as well as our outlook regarding these margins, is set forth in the preceding Shareholder Letter and in the Primer on Triple-A RMBS Spreads in the Appendix.
Our revenues from commercial mortgage banking activities increased by $6 million in the first quarter as compared to the fourth quarter of 2012, due to substantially higher senior commercial loan origination and sales volume. Our senior commercial loan sales, which are generally made to issuers of commercial mortgage-backed securities (CMBS), benefited from trends in CMBS triple-A spreads that were similar to those we observed in the RMBS market.
We sold our remaining $14 million of legacy commercial securities in the first quarter of 2013 for a net gain of $12 million. This gain had no net impact on book value during the first quarter, as we sold these securities at their year-end marks. As a result of these sales, all of the remaining securities in our investment portfolio are residential securities.
Our first quarter 2013 GAAP results included an $11 million tax provision. Although we are structured as a REIT and have favorable tax treatment on income earned from our investment portfolio, we generally conduct our mortgage banking activities in our taxable REIT subsidiaries (“TRS”). During 2012, GAAP income generated in our TRS was fully offset by net operating loss carryforwards and we were not required to record a tax provision. For 2013, we are projecting that our GAAP income generated in our TRS will exceed the remaining net operating losses and, as a result, we recorded a tax provision in the first quarter based on our estimated annual effective tax rate for the TRS. Determining the effective tax rate and the differences between GAAP provision expense and actual taxes owed is a complicated topic and is discussed in more detail, along with other additional details regarding the first quarter, in the Financial Insights — Taxable Income and Dividends section that follows.
| THE REDWOOD REVIEW | 1ST QUARTER 2013 | 9 |
|
| ||
|
QUARTERLY OVERVIEW
|
Financial Results (continued)
GAAP book value at March 31, 2013, was $14.54 per share, an increase of $0.59 per share from December 31, 2012. Our GAAP book value rose largely as a result of our ability to retain $0.41 per share of our first quarter earnings after the payment of a $0.28 per share first quarter dividend. The following table presents a summary of GAAP book value for the first quarter of 2013 and fourth quarter of 2012.
|
Changes in GAAP Book Value Per Share ($ in per share)
|
| |||||||||||
| Q1 2013 | Q4 2012 | Variance | ||||||||||
| Beginning book value |
$ | 13.95 | $ | 12.88 | $ | 1.07 | ||||||
| Net income |
0.69 | 0.50 | 0.19 | |||||||||
| Unrealized (losses) gains on securities (1) |
(0.04 | ) | 0.59 | (0.63 | ) | |||||||
| Unrealized gains on hedges (2) |
0.10 | 0.20 | (0.10 | ) | ||||||||
| Equity issuance, net |
0.05 | 0.01 | 0.04 | |||||||||
| Other, net |
0.07 | 0.02 | 0.05 | |||||||||
| Dividends
|
|
(0.28
|
)
|
|
(0.25
|
)
|
|
(0.03
|
)
| |||
| Ending book value |
$ | 14.54 | $ | 13.95 | $ | 0.59 | ||||||
(1) Unrealized (losses) gains on securities for the three months ended March 31, 2013, included positive $0.11 from valuation increases on residential securities, offset by the reclassification of $0.15 of unrealized gains to net income relating to the disposition of our remaining commercial securities.
(2) Unrealized gains on hedges for the three months ended December 31, 2012, included $0.15 per share attributable to the accelerated recognition of deferred hedging costs relating to Acacia entities and resulting from the deconsolidation of these entities in the fourth quarter of 2012.
Portfolio Acquisition and Sales Activity
We deployed $202 million of capital into new investments in the first quarter, up from $66 million in the fourth quarter of 2012. The following table summarizes our quarterly investment activity during the first quarter of 2013 and fourth quarter of 2012.
|
Quarterly Investment Activity ($ in millions)
|
| |||||||
| Q1 2013 | Q4 2012 | |||||||
| Sequoia RMBS |
$ | 166 | $ | 42 | ||||
| Third-party RMBS |
- | - | ||||||
| Less: Short-term debt |
- | - | ||||||
| Total residential |
166 | 42 | ||||||
| Commercial loans |
36 | 21 | ||||||
| Less: Borrowings |
(12 | ) | - | |||||
| Total commercial |
24 | 21 | ||||||
| MSR Investments
|
|
12
|
|
|
3
|
| ||
|
Equity capital invested |
$ | 202 | $ | 66 | ||||
| 10 | THE REDWOOD REVIEW | 1ST QUARTER 2013 |
|
|
||
|
QUARTERLY OVERVIEW
|
Residential Securities Portfolio
At March 31, 2013, our residential securities portfolio had a market value of $1.2 billion, compared to $1.1 billion at December 31, 2012. The increase resulted from the retention of $166 million of Sequoia securities (from our $2.2 billion of securitization volume), as compared to $42 million of Sequoia securities retained (from our $651 million of securitization volume) in the fourth quarter of 2012. This increase was partially offset by normal portfolio principal repayments. We did not acquire any third-party securities during the first quarter of 2013 or the fourth quarter of 2012. Prices for residential securities were essentially flat to modestly higher in the first quarter, as compared to an increase of 3 to 4 points in the fourth quarter of 2012. Over time, we expect that investments created through our Sequoia program or other mortgage banking activities, as well as through the acquisition of newly issued subordinate securities from third-party securitization sponsors, will replace the senior residential securities in our investment portfolio. Senior securities in our portfolio continue to pay down or be sold, and represented 62% of the portfolio at March 31, 2013, compared to 72% at March 31, 2012.
Residential Mortgage Banking Activities
Our Sequoia securitization platform posted its strongest quarter since we restarted it in mid-2010. We completed four securitizations totaling $2.2 billion in the first quarter, compared to two securitizations totaling $651 million in the fourth quarter of 2012, and six securitizations totaling $2.0 billion for the full year of 2012. In mid-April, we closed our fifth securitization of 2013, a $463 million securitization we refer to as SEMT 2013-5. We also closed a $425 million securitization we refer to as SEMT 2013-6, our sixth securitization in 2013, at the end of April.
The volume of loans we identified for purchase from our sellers increased to $3.1 billion in the first quarter, up from $2.2 billion in the fourth quarter of 2012. Driving the increase was a combination of new sellers and increased volume from existing sellers, most of which are relatively new and tend to increase their loan sales to us as they gain experience with our platform and acquisition procedures. Of the loans identified for purchase in the first quarter, $955 million, or 31% of the loans, were home purchase-related, up from $550 million, or 25%, in the fourth quarter of 2012. During April 2013, home purchase-related loans increased to 43% of the loans we identified for purchase.
At March 31, 2013, we had $832 million of residential loans held for future sale or securitization on our balance sheet, as compared to $563 million at December 31, 2012, and our pipeline of loans identified for purchase totaled $2.2 billion. At April 30, 2013, this pipeline totaled $2.1 billion. Our loan acquisitions in the first quarter of 2013 totaled $2.6 billion, as compared to $789 million in the fourth quarter of 2012.
| THE REDWOOD REVIEW | 1ST QUARTER 2013 | 11 |
|
| ||
|
QUARTERLY OVERVIEW
|
Residential Mortgage Banking Activities (continued)
The table below illustrates the number of sellers and the volume of loans identified for purchase through our flow-based platform over the past five quarters and through March 31, 2013 (and does not include loans identified for purchase in bulk transactions).
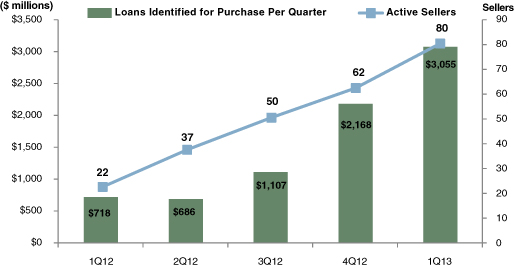
Our sellers are located throughout the U.S. At March 31, 2013, our sellers consisted of 38 regional and community banks (or their subsidiaries) and 42 mortgage companies.
We observed two other issuers execute RMBS transactions in the first quarter of 2013. While competition presents challenges in the long-run, overall, we think additional issuers are good for helping to restore liquidity in the RMBS market.
During the first quarter, we obtained approval to sell conforming-balance loans to Freddie Mac and we are working to obtain similar approval from Fannie Mae. We expect to start acquiring Agency conforming loans by the end of 2013.
At the end of the first quarter of 2013, we owned mortgage servicing rights (MSRs) associated with $2.47 billion of prime-quality jumbo residential loans acquired through our platform, as compared to $1 billion at the end of the fourth quarter of 2012. At March 31, 2013, the capitalized value of these MSRs was $18.1 million, or 73 basis points of the principal amount of the associated mortgage loans. We earn fees from these MSRs, but outsource the actual servicing of these loans to a nationally recognized third party servicer. In the first quarter of 2013, our net servicing fees were $1 million, compared to less than $1 million in the fourth quarter of 2012. We expect our net servicing fees to increase over time and become an increasingly larger contributor to earnings.
| 12 | THE REDWOOD REVIEW | 1ST QUARTER 2013 |
|
|
||
|
QUARTERLY OVERVIEW
|
Commercial Mortgage Banking Activities
Our commercial team made significant progress in the first quarter of 2013. Eleven senior loans were originated and funded on our balance sheet for $153 million, with another four loans for $146 million table-funded (meaning a third party funded and purchased the loan at closing), as compared to two senior loans totaling $24 million that we funded in the fourth quarter of 2012. We sold six senior loans in total in the first quarter of 2013, including the senior loan we had on our balance sheet at the end of 2012. These sales generated mortgage banking income of $7 million. We sold the six remaining loans in April. Our goal for 2013 is to originate and sell $1 billion of senior commercial loans. In the first quarter, one of our mezzanine loans was prepaid, resulting in a $1 million prepayment fee that is reflected in net interest income.
Mezzanine loan originations in the first quarter totaled nine loans for $36 million, as compared to four loans for $21 million in the fourth quarter of 2012. This brought our portfolio of non-securitized mezzanine loans to 13 for $56 million at March 31, 2013. Our securitized mezzanine portfolio totaled $271 million at March 31, 2013, down from $288 million at December 31, 2012 as a result of the above-referenced prepayment of one loan ($12 million) and principal amortization. Redwood’s investment in the securitized portfolio totaled $121 million at the end of the first quarter.
As we have noted previously, we are targeting to allocate up to $300 million of equity capital to fund our commercial investments, although it is possible that this allocation could exceed that amount from time to time in anticipation of asset sales or other transactions.
Capital
With the completion of our convertible debt offering in February 2013, our current investment capacity (defined as the approximate amount of capital we have readily available for long-term investments) is estimated to be about $300 million at March 31, 2013, which should be sufficient for our needs well into the year. If we need relatively small amounts of incremental capital, we could look to sell senior residential securities or use our Direct Stock Purchase Program (“DSPP”) as sources of additional capital. As always, our approach to raising capital will continue to be based on what we believe to be in the best long-term interest of shareholders.
| THE REDWOOD REVIEW | 1ST QUARTER 2013 | 13 |
|
| ||
|
FINANCIAL INSIGHTS
|
Balance Sheet
The following table shows the components of our balance sheet at March 31, 2013.
|
Consolidating Balance Sheet |
| |||||||||||
| March 31, 2013 ($ in millions)
|
| |||||||||||
| At Redwood |
Consolidated Sequoia Entities |
Redwood Consolidated |
||||||||||
| Residential loans |
$ | 832 | $ | 2,133 | $ | 2,965 | ||||||
| Commercial loans |
401 | - | 401 | |||||||||
| Real estate securities - Third party |
946 | - | 946 | |||||||||
| Real estate securities - Sequoia |
284 | - | 284 | |||||||||
|
Cash and cash equivalents |
79 | - | 79 | |||||||||
| Total earning assets |
2,544 | 2,133 | 4,677 | |||||||||
| Other assets
|
|
110
|
|
|
10
|
|
|
121
|
| |||
|
Total assets |
$ | 2,653 | $ | 2,144 | $ | 4,797 | ||||||
| Short-term debt |
$ | 721 | $ | - | $ | 721 | ||||||
| Other liabilities |
78 | 2 | 80 | |||||||||
| Asset-backed securities issued |
309 | 2,056 | 2,365 | |||||||||
| Long-term debt |
444 | - | 444 | |||||||||
| Total liabilities |
1,552 | 2,058 | 3,609 | |||||||||
| Stockholders’ equity
|
|
1,101
|
|
|
86
|
|
|
1,188
|
| |||
| Total liabilities and equity |
$ | 2,653 | $ | 2,144 | $ | 4,797 | ||||||
We present this table to highlight the impact that the consolidated Sequoia entities had on our GAAP balance sheet at March 31, 2013. As shown, Redwood’s $86 million investment in these consolidated entities increased our consolidated assets and liabilities by $2.1 billion.
We are required under GAAP to consolidate the assets and liabilities of certain Sequoia securitizations that are treated as secured borrowing transactions. However, the securitized assets of these entities are not legally ours and we own only the securities and interests that we acquired from these securitization entities. Similarly, the liabilities of these entities are obligations payable only from the cash flow generated by their securitized assets and are not obligations of Redwood.
All of the consolidated Sequoia securitizations were completed before 2012. The six securitizations that we completed during 2012 and the four we completed in the first quarter of 2013 are accounted for as sales of assets under GAAP. As a result, these securitizations are not consolidated and are not reflected in Consolidated Entities. The $284 million of securities we retained (net of sales) from the 10 securitizations we completed during 2012 and the first quarter of 2013 are reflected on our balance sheet in Real Estate Securities — Sequoia.
Included in the “At Redwood” column of the consolidating balance sheet are the assets and liabilities of the residential resecuritization we completed during the third quarter of 2011, although these assets and liabilities are owned by the resecuritization entity and are legally not ours and we own only the securities and interests that we acquired from the resecuritization entity. At March 31, 2013, this resecuritization accounted for $317 million of assets ($316 million of available-for-sale securities at fair value and $1 million of other assets) and $149 million of asset-backed securities issued (at historical cost). Our $168 million investment in this resecuritization, as estimated for GAAP, equals the difference between these assets and liabilities.
| 14 | THE REDWOOD REVIEW | 1ST QUARTER 2013 |
|
|
||
|
FINANCIAL INSIGHTS
|
Balance Sheet (continued)
Also included in the “At Redwood” column are the assets and liabilities of the commercial loan securitization that we completed in the fourth quarter of 2012. These assets and liabilities are owned by the securitization entity and are legally not ours and we own only the securities and interests that we acquired from the securitization entity. At March 31, 2013, this securitization accounted for $277 million of assets ($271 million of commercial real estate loans at historical cost and $6 million of other assets) and $160 million of asset-backed securities issued (at historical cost). Our $117 million investment in this securitization, as estimated for GAAP, equals the difference between these assets and liabilities.
Real Estate Loans
At March 31, 2013, we had $832 million of unsecuritized residential real estate loans, as compared to $563 million at December 31, 2012. The increase reflects $2.6 billion of residential loan acquisitions and $35 million of fair value increases, less $3 million of principal payments, $25 million of whole loan sales, and $2.3 billion of sales into the four Sequoia securitizations we completed in the first quarter. Most of our unsecuritized residential real estate loans are being held for future securitizations. See the Investments in Residential Real Estate Securities section on page 27 for more information.
At March 31, 2013, we had $401 million of commercial loans, including $271 million of securitized mezzanine loans, $56 million of unsecuritized mezzanine loans, and $74 million of unsecuritized senior commercial loans, as compared to $313 million of commercial loans at December 31, 2012. The change reflects the origination of 20 loans totaling $189 million, the sale of six loans for $88 million, $12 million of principal payments, and $1 million of loan loss provisions. See the Commercial Mortgage Banking Activities section that begins on page 25 for more information.
Residential Real Estate Securities
The following table presents the fair value of real estate securities at Redwood at March 31, 2013. We segment our securities portfolio by vintage (the year(s) the securities were issued), priority of cash flow (senior, re-REMIC, and subordinate), and by the quality of underlying loans (prime and non-prime).
|
Real Estate Securities at Redwood (1) March 31, 2013 ($ in millions) |
| |||||||||||||||||||||||
| % of Total | ||||||||||||||||||||||||
| <=2004 | 2005 | 2006-2008 | 2012-2013 (3) | Total | Securities | |||||||||||||||||||
| Residential |
||||||||||||||||||||||||
| Prime |
$ | 21 | $ | 187 | $ | 240 | $ | 55 | $ | 503 | 41 | % | ||||||||||||
| Non-prime (2) |
97 | 159 | 6 | - | 262 | 21 | % | |||||||||||||||||
| Total Seniors |
$ | 118 | $ | 346 | $ | 246 | $ | 55 | $ | 765 | 62 | % | ||||||||||||
| Total Re-REMIC |
$ | - | $ | 67 | $ | 97 | $ | - | $ | 164 | 13 | % | ||||||||||||
| Subordinates |
||||||||||||||||||||||||
| Prime |
$ | 53 | $ | 16 | $ | 2 | $ | 229 | $ | 300 | 24 | % | ||||||||||||
| Non-prime (2) |
2 | - | - | - | 2 | 1 | % | |||||||||||||||||
| Total Subordinates
|
$ | 55 | $ | 16 | $ | 2 | $ | 229 | $ | 302 | 25 | % | ||||||||||||
| Total real estate securities |
$ | 173 | $ | 429 | $ | 345 | $ | 284 | $ | 1,231 | 100 | % | ||||||||||||
(1) Included in the residential securities table above are $316 million of senior securities that are included in a resecuritization that we completed in July 2011. Under GAAP accounting, we account for the resecuritization as a financing even though these securities are owned by the resecuritization entity and are legally not ours. We own only the securities and interests that we acquired from the resecuritization entity, which amounted to $157 million at March 31, 2013. As a result, to adjust at March 31, 2013 for the legal and economic interests that resulted from the resecuritization, Total Residential Senior Securities would be decreased by $316 million to $449 million, Total Re-REMIC Residential Securities would be increased by $157 million to $321 million, and Total Residential Securities would be reduced by $159 million to $1,072 million.
(2) Non-prime residential securities consist of $262 million of Alt-A senior and subordinate securities and $2 million of subprime subordinate securities.
(3) All of the securities from the 2012-2013 vintage are from our Sequoia securitizations.
| THE REDWOOD REVIEW | 1ST QUARTER 2013 | 15 |
|
| ||
|
FINANCIAL INSIGHTS
|
Balance Sheet (continued)
The table below details the change in fair value of securities during the first quarter of 2013 and the fourth quarter of 2012.
|
Real Estate Securities at Redwood |
| |||||||
| ($ in millions)
|
| |||||||
| Three Months Ended | ||||||||
| 3/31/13 | 12/31/12 | |||||||
| Beginning fair value |
$ | 1,108 | $ | 1,069 | ||||
| Acquisitions (1) |
166 | 42 | ||||||
| Sales (1) |
(22 | ) | (20 | ) | ||||
| Gain on sale |
12 | 5 | ||||||
| Effect of principal payments |
(36 | ) | (33 | ) | ||||
| Change in fair value, net |
2 | 46 | ||||||
| Ending fair value |
$ | 1,231 | $ | 1,108 | ||||
(1) Included in the acquisitions and sales totals are investments in and sales of investments in Sequoia Entities.
Investments in Consolidated Entities
Our investments in Consolidated Entities, as estimated for GAAP, totaled $86 million at March 31, 2013. This amount reflects the book value of our retained investments in Sequoia entities and is based on the difference between the consolidated assets and liabilities of the entities in the aggregate according to their GAAP carrying amounts.
Debt
At March 31, 2013, we had short-term mortgage warehouse debt outstanding of $351 million, which was used to finance a portion of our $832 million inventory of residential mortgage loans held for future securitization or sale. At March 31, 2013, we had four uncommitted residential mortgage warehouse facilities with an aggregate borrowing capacity of $1 billion. We also had $17 million outstanding on our $150 million commercial warehouse facility, and we closed an additional $100 million commercial warehouse facility for senior loans after the close of the first quarter.
At March 31, 2013, we had short-term debt incurred through securities repurchase facilities of $370 million, which was secured by $481 million of our residential securities, resulting in a debt-to-equity leverage ratio for these residential securities of 3.3x (excluding the additional risk capital we hold related to these short-term borrowings).
At March 31, 2013, we had $149 million outstanding of non-recourse, asset-backed debt issued at a stated interest rate of one-month LIBOR plus 200 basis points related to our resecuritization of senior residential securities. We also had $160 million outstanding of non-recourse, asset-backed debt issued at a stated interest rate of 5.62% (excluding deferred issuance costs) related to our securitization of commercial loans.
| 16 | THE REDWOOD REVIEW | 1ST QUARTER 2013 |
|
|
||
|
FINANCIAL INSIGHTS
|
Balance Sheet (continued)
Debt (continued)
At March 31, 2013, we had $288 million of convertible senior notes at a stated interest rate of 4.625% (excluding deferred debt issuance costs), which are convertible into 41.1320 shares of common stock per $1,000 principal amount (subject to certain adjustments) on or before their maturity in April 2018.
At March 31, 2013, we had $140 million of other long-term debt outstanding due in 2037 with a stated interest rate of three-month LIBOR plus 225 basis points. In 2010, we effectively fixed the interest rate on this long-term debt at approximately 6.75% (excluding deferred debt issuance costs) through interest rate swaps.
Capital and Cash
Our cash balance was $79 million at March 31, 2013. Our total capital was $1.6 billion, including $1.2 billion of shareholders’ equity, $288 million of convertible notes, and $140 million of other long-term debt. We use our capital to invest in earning assets, meet lender capital requirements, and fund our operations and working capital needs.
GAAP Income
The following table provides a summary of our consolidated GAAP income for the first quarter of 2013 and the fourth quarter of 2012.
|
GAAP Income |
| |||||||
| ($ in millions, except per share data)
|
| |||||||
| Three Months Ended | ||||||||
| 3/31/13 | 12/31/12 | |||||||
| Interest income | $ | 54 | $ | 53 | ||||
| Interest expense | (18 | ) | (33 | ) | ||||
| Net interest income | 35 | 20 | ||||||
| Provision for loan losses | (2 | ) | (3 | ) | ||||
| Other market valuation adjustments, net | 2 | (1 | ) | |||||
| Net interest income after provision and other market valuation adjustments | 35 | 16 | ||||||
| Mortgage banking activities, net | 44 | 24 | ||||||
| Operating expenses | (20 | ) | (18 | ) | ||||
| Realized gains, net | 12 | 20 | ||||||
| Provision for income taxes | (11 | ) | - | |||||
| GAAP income | $ | 61 | $ | 42 | ||||
| GAAP income per share | $ | 0.69 | $ | 0.50 | ||||
Our consolidated GAAP net income for the first quarter was $61 million, or $0.69 per share, as compared to $42 million, or $0.50 per share, for the fourth quarter. The $19 million increase resulted from higher net interest income and mortgage banking income. These increases were partially offset by a decrease in realized gains and the recognition of an $11 million provision for income taxes.
| THE REDWOOD REVIEW | 1ST QUARTER 2013 | 17 |
|
| ||
|
FINANCIAL INSIGHTS
|
GAAP Income (continued)
As detailed in the Quarterly Overview section beginning on page 7, net interest income for the fourth quarter of 2012 was affected by a one-time $11 million interest expense adjustment related to the deconsolidation of certain securitization entities.
The following tables show the estimated effect that Redwood and our consolidated entities had on GAAP income for the first quarter of 2013 and the fourth quarter of 2012.
|
Consolidating Income Statement |
| |||||||||||
| Three Months Ended March 31, 2013 | ||||||||||||
| ($ in millions)
|
| |||||||||||
| At Redwood |
Consolidated Sequoia Entities |
Redwood Consolidated |
||||||||||
| Interest income | $ | 34 | $ | 12 | $ | 45 | ||||||
| Net discount (premium) amortization | 9 | (2 | ) | 8 | ||||||||
| Total interest income | 43 | 10 | 54 | |||||||||
| Interest expense | (11 | ) | (7 | ) | (18 | ) | ||||||
| Net interest income | 32 | 3 | 35 | |||||||||
| Provision for loan losses | (1 | ) | (1 | ) | (2 | ) | ||||||
| Other market valuation adjustments, net | 1 | - | 2 | |||||||||
| Net interest income after provision and other market valuation adjustments | 33 | 2 | 35 | |||||||||
| Mortgage banking activities, net | 44 | - | 44 | |||||||||
| Operating expenses | (20 | ) | - | (20 | ) | |||||||
| Realized gains, net | 12 | - | 12 | |||||||||
| Provision for income taxes | (11 | ) | - | (11 | ) | |||||||
| Net income | $ | 59 | $ | 2 | $ | 61 | ||||||
|
Consolidating Income Statement |
| |||||||||||
| Three Months Ended December 31, 2012 | ||||||||||||
| ($ in millions)
|
| |||||||||||
| At Redwood |
Consolidated Entities |
Redwood Consolidated |
||||||||||
| Interest income | $ | 27 | $ | 19 | $ | 46 | ||||||
| Net discount (premium) amortization | 9 | (2 | ) | 7 | ||||||||
| Total interest income | 36 | 17 | 53 | |||||||||
| Interest expense | (7 | ) | (26 | ) | (33 | ) | ||||||
| Net interest income (expense) | 29 | (8 | ) | 20 | ||||||||
| Provision for loan losses | (2 | ) | (1 | ) | (3 | ) | ||||||
| Other market valuation adjustments, net | (4 | ) | 3 | (1 | ) | |||||||
| Net interest income (loss) after provision and other market valuation adjustments | 23 | (6 | ) | 16 | ||||||||
| Mortgage banking activities, net | 24 | - | 24 | |||||||||
| Operating expenses | (18 | ) | - | (18 | ) | |||||||
| Realized gains, net | 5 | 15 | 20 | |||||||||
| Provision for income taxes | - | - | - | |||||||||
| Net income | $ | 34 | $ | 9 | $ | 42 | ||||||
| 18 | THE REDWOOD REVIEW | 1ST QUARTER 2013 |
|
|
||
|
FINANCIAL INSIGHTS
|
GAAP Income (continued)
Redwood Parent
Total interest income from our securities portfolio and our residential and commercial loans totaled $43 million in the first quarter of 2013, a $7 million increase from the $36 million recognized in the fourth quarter of 2012.
Interest income from our securities portfolio was $26 million for the first quarter of 2013, an increase of $2 million from the fourth quarter of 2012, as the average balance of our securities portfolio increased 5% to $973 million as a result of the acquisition of $166 million of Sequoia securities during the quarter.
Interest income from residential loans held-for-sale was $8 million during the first quarter of 2013, an increase of $4 million from the fourth quarter of 2012, as the average balance of loans held-for-sale on our balance sheet increased 96% to $819 million, reflecting the increased pace of purchase and sale activity. These loans are financed using a combination of short-term debt and equity capital prior to either being securitized through our Sequoia program or sold as whole loans. The amount of interest earned is dependent upon prevailing mortgage rates and the amount of time they are held on our balance sheet ahead of an anticipated sale.
Commercial loans generated $10 million of interest income in the first quarter of 2013, an increase of $2 million from the fourth quarter of 2012. This increase was primarily the result of income recognized from a one-time prepayment fee received on a loan that prepaid during the first quarter of 2013. New mezzanine loan investments totaled $36 million in the first quarter of 2013, increasing the portfolio to $328 million at March 31, 2013. We also originated senior commercial loans totaling $153 million during the first quarter of 2013 and sold $88 million. Including gains relating to table-funded loans, we generated gains of $7 million from the origination and sale of commercial loans.
Interest expense was $11 million in the first quarter of 2013, an increase from $7 million in the fourth quarter of 2012, primarily as a result of the issuance of $172 million of ABS-issued debt related to our securitization of most of our commercial mezzanine loan portfolio during the fourth quarter of 2012, the issuance of $288 million of convertible notes during the first quarter of 2013, and an increase in the amount of short-term debt used to finance residential loan acquisitions.
Other market valuation adjustments on securities, net were positive $1 million in the first quarter of 2013, an increase of $5 million from the fourth quarter of 2012. These valuation increases were primarily the result of higher market valuations on IO securities retained from recent Sequoia securitizations.
| THE REDWOOD REVIEW | 1ST QUARTER 2013 | 19 |
|
| ||
|
FINANCIAL INSIGHTS
|
GAAP Income (continued)
Redwood Parent (continued)
The following table presents the components of mortgage banking activities for the first quarter of 2013 and the fourth quarter of 2012.
|
Mortgage Banking Activities |
| |||||||
| ($ in millions)
|
| |||||||
| Three Months Ended | ||||||||
| 3/31/13 | 12/31/12 | |||||||
| Net gains on residential mortgage loan sales and securitizations | $ | - | $ | 2 | ||||
| Net gains on commercial mortgage loan sales | 7 | 1 | ||||||
| Net valuation gains on residential loans | 35 | 23 | ||||||
| Net valuation gains (losses) from economic hedges | 1 | (2 | ) | |||||
| Net valuation losses from MSRs | - | (1 | ) | |||||
| Income from MSRs, net
|
|
1
|
|
|
-
|
| ||
| Total mortgage banking activities, net | $ | 44 | $ | 24 | ||||
Income from mortgage banking activities was $44 million in the first quarter of 2013, as compared to $24 million in the fourth quarter of 2012. This increase resulted from an increase in residential loan acquisition volume combined with rising values for residential loans we held on our balance sheet at fair value, primarily due to continued strong demand during the first part of the quarter for AAA-rated RMBS backed by these types of loans.
In the third quarter of 2012, we began marking these residential loans held-for-sale to market through our income statement. This accounting change has helped to further align our reported results with the economics underlying our residential mortgage banking activities. Consequently, we expect gains (or losses) on the eventual sale of residential loans during subsequent reporting periods to be smaller, all else equal, as their cost basis at the end of each quarter will already reflect the price at which we believe they could be sold.
Income from mortgage banking activities also included $7 million in gains from the sale of $88 million of senior commercial loans and origination of table-funded loans acquired by various CMBS securitizations, as compared to $1 million of gains on $52 million of sales in the fourth quarter of 2012.
In the first quarter of 2013, we recognized $12 million of gains from the sale of our remaining commercial mortgage-backed securities, as compared to $5 million of gains from the sale of securities recognized in the fourth quarter of 2012.
Operating expenses totaled $20 million in the first quarter of 2013, as compared to $18 million in the fourth quarter of 2012, largely due to higher compensation and legal expenses attributable to our expanding operations.
During the first quarter of 2013, we recognized an $11 million provision for income taxes relating to mortgage banking activities at our taxable REIT subsidiaries. The tax provision largely represents a future tax obligation rather than a corporate level current tax liability to be paid in 2013. See the Taxable Income and Dividends section on page 22 for more detail.
| 20 | THE REDWOOD REVIEW | 1ST QUARTER 2013 |
|
|
||
|
FINANCIAL INSIGHTS
|
GAAP Income (continued)
Consolidated Entities
We recognized net income of $2 million for the first quarter of 2013 from our investments in consolidated securitization entities, as compared to net income of $9 million for the fourth quarter of 2012. This decrease is primarily attributable to the $4 million net, non-recurring increase to earnings recognized upon deconsolidation of certain securitization entities during the fourth quarter of 2012.
The allowance for loan losses at legacy Sequoia entities was $29 million at March 31, 2013 and December 31, 2012. While our overall credit reserving needs continue to remain flat or decline largely due to a decline in the average balances of loans held at consolidated Sequoia securitization entities as well as improvements in housing, we recorded $1 million of provision expense during the first quarter of 2013 to replenish the reserve after recording $1 million of charge-offs during the quarter. These charge-offs relate to existing delinquent loans that have transitioned to short-sale or foreclosure status.
| THE REDWOOD REVIEW | 1ST QUARTER 2013 | 21 |
|
| ||
|
FINANCIAL INSIGHTS
|
Taxable Income and Dividends
Summary
As a REIT, Redwood is required to distribute to shareholders at least 90% of its REIT taxable income. REIT taxable income is defined as taxable income earned at Redwood and its qualified REIT subsidiaries. Redwood also earns taxable income at its taxable REIT subsidiaries (TRS), which it is not required to distribute. To the extent Redwood retains taxable income, it is taxed at corporate tax rates. A reconciliation of GAAP and taxable income is set forth in Table 2 in the Financial Tables in this Review.
Although our REIT status has not resulted in a requirement to distribute dividends in recent years, our Board of Directors has maintained a policy of paying regular quarterly dividends. Most recently, our Board announced its intention to distribute a regular quarterly dividend of $0.28 per share for 2013, an increase from the $0.25 per share regular quarterly dividend we distributed during 2012. On February 20, 2013, the Board of Directors declared a regular dividend of $0.28 per share for the first quarter, which was paid on March 29, 2013, to shareholders of record on March 15, 2013. Our estimated REIT taxable income was $16 million, or $0.20 per share, for the first quarter, as compared to $18 million, or $0.23 per share, for the fourth quarter of 2012.
Under normal circumstances, our REIT dividend requirement would be at least 90% of our REIT taxable income. However, we currently maintain a $70 million REIT net operating loss carryforward (NOL) that affords us the option of retaining REIT taxable income (up to the NOL amount) rather than distributing it as dividends. The NOL will be reduced once REIT taxable income exceeds our dividend distributions, although we do not expect this to occur in 2013. Therefore, we will likely not be required to distribute a special dividend in 2013.
Irrespective of our minimum distribution requirement, federal income tax rules require that the actual dividends we distribute in 2013 be taxed at the shareholder level based on our full year 2013 taxable income and net capital gains before application of any NOL carryforwards. Therefore, we expect a significant percentage of the dividends we distribute in 2013 to be fully taxable to shareholders. Factors that can significantly affect the taxation of our 2013 dividends to shareholders include the timing of realized credit losses on legacy investments and capital gains on sales of securities.
Our estimated first quarter 2013 REIT taxable income included $5 million of realized credit losses on legacy investments that were taken in previous periods for GAAP reporting purposes. We anticipate an additional $104 million of tax credit losses to be realized over an estimated three- to five-year period based on the securities we currently own. This is a decrease from $111 million at December 31, 2012, $138 million at December 31, 2011, and $208 million at December 31, 2010. Even though the impact of realized losses on our current period taxable income is declining, our GAAP earnings – which have provisioned for these losses in prior periods – will likely continue to exceed our REIT taxable income and will be more reflective of our current operating performance.
For the three months ended March 31, 2013, we realized net capital gains of $3 million at the REIT for tax purposes. Net capital gains generated by the REIT for the entire year would increase the portion of our 2013 dividends that is characterized as ordinary income to our shareholders. However, if the REIT were to generate realized net capital losses for 2013, those losses would have no effect on the taxability of our 2013 dividends.
| 22 | THE REDWOOD REVIEW | 1ST QUARTER 2013 |
|
|
||
|
FINANCIAL INSIGHTS
|
Taxable Income and Dividends (continued)
TRS Taxable Income
Redwood’s estimated taxable income at its TRS was $43 million, or $0.52 per share, in the first quarter, as compared to an estimated TRS taxable loss of $6 million, or $0.07 per share, in the fourth quarter of 2012. After applying NOL carryforwards, we expect that our full year 2013 estimated TRS taxable income will be minimal, generating a relatively small amount of taxes due. Our TRS taxable income does not have any effect on our minimum REIT dividend distribution requirement and will not affect the tax characterization of our 2013 dividends.
Separately, we recorded a tax provision of $11 million for GAAP for the first quarter, primarily related to mortgage banking activities at our TRS. GAAP seeks to correlate the tax provision with GAAP earnings and not necessarily with tax that is currently due. In our case, the first quarter tax provision largely represents a future tax obligation as a result of favorable timing differences between when certain income associated with our mortgage banking activities is recognized for GAAP versus when it is recognized for tax purposes. In addition, our TRS have NOL carryovers available to offset most of their taxable income. These factors result in our tax provision for GAAP significantly exceeding the tax we expect to pay for 2013.
We currently do not expect to generate excess inclusion income, but in the event we do, it will be retained at the TRS and will not be passed through to our shareholders.
| THE REDWOOD REVIEW | 1ST QUARTER 2013 | 23 |
|
| ||
|
RESIDENTIAL MORTGAGE BANKING ACTIVITIES
|
Summary
We purchase newly originated residential loans that meet our collateral criteria from third-party originators on a flow or bulk basis. Loans acquired through this process (our “conduit”) are expected to be securitized through Sequoia securitization entities, which acquire residential mortgage loans from our conduit and issue RMBS backed by these loans, or sold as whole loans. Most of the senior or investment-grade rated RMBS issued by Sequoia entities are sold to third-party investors. Redwood generally acquires the subordinate or non-investment grade securities but has also acquired senior securities and interest-only securities from the Sequoia entities.
| u | During the first quarter of 2013, we completed four residential prime jumbo securitizations for a total of $2.2 billion. We also sold an additional $24 million of residential loans to third parties, and recognized market valuation gains of $35 million during the three months ended March 31, 2013. |
| u | As a result of these sales, during the three months ended March 31, 2013, we recorded MSRs of $12 million at a TRS subsidiary of ours. |
| u | During the first quarter of 2013, we acquired $166 million of investments from Sequoia securitizations we sponsored. |
| u | At March 31, 2013, residential loans at Redwood had an outstanding carrying value of $832 million, up from $563 million at December 31, 2012. |
| u | At March 31, 2013, our pipeline of residential loans identified for purchase was $2.2 billion. |
| u | Active sellers increased from 62 at December 31, 2012 to 80 at March 31, 2013. |
| u | At March 31, 2013, the principal balance of the loans underlying our MSRs was $2.5 billion. |
| u | In the first quarter of 2013, we earned a net $680 thousand from MSRs and at March 31, 2013, the fair value of MSRs was $18 million. |
| 24 | THE REDWOOD REVIEW | 1ST QUARTER 2013 |
|
|
||
|
COMMERCIAL MORTGAGE BANKING ACTIVITIES
|
Summary
Our commercial platform provides debt solutions for borrowers on stabilized commercial properties nationwide. Redwood originates senior mortgages, mezzanine loans, and preferred equity investments. We originate and structure commercial mortgages, distribute senior loans via securitization and/or sales, and transfer subordinate debt investments to Redwood to be retained in its portfolio. We also collaborate with major lending institutions (including commercial banks, life insurance companies, CMBS issuers, and the GSEs) to originate subordinate debt investments for Redwood’s portfolio.
| u | During the first quarter of 2013, we recognized $6 million of gains on the sale and origination of six senior held-for-sale commercial loans that we originated. We also recognized $1 million of gains related to three of the four table-funded loans originated by us (meaning a third party funded and purchased the loan at closing). |
| u | At March 31, 2013, there were six senior loans held-for-sale with a carrying value of $74 million. During the first quarter of 2013, we originated and funded 11 senior commercial loans for $153 million, as compared to two senior loans of $24 million in the fourth quarter of 2012. We also originated four table-funded senior loans totaling $146 million and sold six senior loans for $88 million. |
| u | At March 31, 2013, there were 42 commercial mezzanine loans held-for-investment with an outstanding principal balance of $335 million, an allowance for loan losses of $5 million, and a carrying value of $328 million. During the first quarter of 2013, we originated nine mezzanine loans for $36 million, as compared to four loans for $21 million in the fourth quarter of 2012. Our securitized mezzanine portfolio totaled $275 million at March 31, 2013, down from $288 million at December 31, 2012 as the result of a prepayment of a $12 million loan. |
| u | On average, our commercial held-for-investment loans have a maturity of more than six years, an unlevered yield in excess of 10% per annum before credit costs, a loan-to-value ratio of 73% at origination, and a debt service coverage ratio at origination of 1.29x based on our underwritten cash flows. |
| THE REDWOOD REVIEW | 1ST QUARTER 2013 | 25 |
|
| ||
|
COMMERCIAL MORTGAGE BANKING ACTIVITIES
|
Commercial Mortgage Banking Activities (continued)
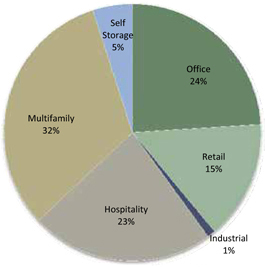
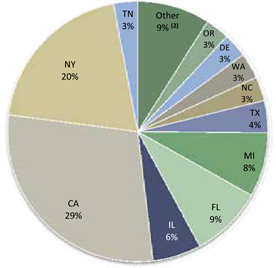
| u | The following table and charts provide information on the commercial mezzanine loan portfolio as of March 31, 2013. |
| Property Type | Number of Loans | Weighted Average DSCR(1) |
Weighted Average LTV(2) |
Average Loan Size ($ millions) | ||||
|
Multifamily
|
18 | 1.24X | 79% | $6.0 | ||||
|
Office
|
8 | 1.35X | 72% | $9.8 | ||||
|
Hospitality
|
7 | 1.38X | 61% | $11.1 | ||||
|
Retail
|
5 | 1.16X | 75% | $10.1 | ||||
|
Self Storage
|
3 | 1.34X | 79% | $6.0 | ||||
|
Industrial
|
1 | 1.67X | 65% | $2.0 | ||||
|
Total(3)
|
42 | 1.29X | 73% | $8.0 |
| (1) | The debt service coverage ratio (DSCR) is defined as the property’s annual net operating income divided by the annual principal and interest payments. A DSCR of less than 1.00x would mean there was insufficient cash flow to make principal and interest payments, while a DSCR of more than 1.00x would mean there was positive cash flow after payment of principal and interest. The weighted average DSCRs in this table are based on the ratios at the time the loans were originated and are not based on subsequent time periods during which there may have been increases or decreases in each property’s operating income. |
| (2) | The loan-to-value calculation is defined as the sum of the senior and all subordinate loan amounts divided by the value of the property. The weighted average LTV ratios in this table are based on the ratios at the time the loans were originated and are not based on subsequent time periods during which there may have been increases or decreases in each property’s value. |
| (3) | Three of these loans are recourse to the borrowers (two self storage, one office). |
| Property Type(1) |
Geography(1) | |
|
| |
| (1) Percentages based on outstanding loan balances. |
(1) Percentages based on outstanding loan balances.
(2) Other includes DC, NJ, KY, PA, SC, MS, MN, MA and GA, each with less than 3%. |
| 26 | THE REDWOOD REVIEW | 1ST QUARTER 2013 |
|
|
||
|
INVESTMENTS IN RESIDENTIAL REAL ESTATE SECURITIES
|
Summary
Redwood invests in securities that are backed by pools of residential loans. These investments in residential real estate securities consist of senior prime and non-prime securities as well as re-REMIC and subordinated securities (see definitions in the Glossary). Currently, the majority of the securities we own were purchased in the secondary securities market and were issued by third parties. However, a growing percentage of the securities we own were created by our Sequoia securitization platform
This discussion includes all securities presented in our consolidated balance sheet, as well as our security investments in Sequoia securitizations issued prior to 2012 that we are currently required to consolidate for financial reporting purposes under GAAP.
Information on the residential securities we own and underlying loan characteristics is set forth in Tables 5 through 8B in the Appendix. Information about the underlying loan characteristics of the consolidated securitizations and loans held for sale is set forth in Table 9 in the Appendix.
| u | Interest income generated by residential securities was $25 million in the first quarter of 2013, resulting in an annualized unlevered yield of 10% on the $973 million of average amortized cost of these securities. |
| u | At March 31, 2013, the fair value of the residential securities we own totaled $1.2 billion, consisting of $503 million in prime senior securities, $262 million in non-prime senior securities, $164 million of re-REMIC securities, and $302 million in subordinate securities. The amortized cost of our available-for-sale securities, which accounts for all but $77 million of securities held as trading securities, was 70% of face value and the fair value was 84% of face value at March 31, 2013. |
| u | We financed our holdings of residential securities with a combination of short-term debt secured by securities, through the residential resecuritization, and with long-term debt and equity capital. During the first quarter of 2013, average short-term debt secured by securities amounted to $378 million and the average asset-backed securities in the residential resecuritization amounted to $153 million. |
| u | At March 31, 2013, the residential securities held at Redwood (as a percentage of current market value) consisted of fixed-rate assets (43%), adjustable-rate assets (22%), hybrid assets that reset within the next year (23%), hybrid assets that reset between 12 and 36 months (9%), and hybrid assets that reset after 36 months (4%). |
| THE REDWOOD REVIEW | 1ST QUARTER 2013 | 27 |
|
| ||
|
INVESTMENTS IN RESIDENTIAL REAL ESTATE SECURITIES
|
| u | The following table presents information on residential securities at March 31, 2013. For GAAP, we account for the large majority of these securities as available-for-sale (AFS) and others as trading securities, and in both cases the securities are reported at their fair value at the report date. |
|
Residential Securities at Redwood |
| |||||||||||||||||||
| March 31, 2013 | ||||||||||||||||||||
| ($ in millions)
|
| |||||||||||||||||||
| Senior | ||||||||||||||||||||
| Prime | Non-prime | Re-REMIC | Subordinate | Total | ||||||||||||||||
| Available-for-sale securities (1) |
||||||||||||||||||||
| Current face |
$ | 460 | $ | 269 | $ | 215 | $ | 436 | $ | 1,381 | ||||||||||
| Credit reserve |
(28 | ) | (18 | ) | (50 | ) | (89 | ) | (186 | ) | ||||||||||
| Net unamortized discount |
(49 | ) | (41 | ) | (65 | ) | (71 | ) | (225 | ) | ||||||||||
| Amortized cost |
383 | 210 | 100 | 276 | 969 | |||||||||||||||
| Unrealized gains |
64 | 30 | 63 | 28 | 186 | |||||||||||||||
| Unrealized losses |
- | - | - | (2 | ) | (2 | ) | |||||||||||||
| Trading securities
|
|
55
|
|
|
22
|
|
|
-
|
|
|
1
|
|
|
77
|
| |||||
| Fair value of residential securities |
$ | 503 | $ | 262 | $ | 163 | $ | 302 | $ | 1,231 | ||||||||||
(1) Included in the residential securities table above are $316 million of senior securities that are included in a resecuritization that we completed in July 2011. Under GAAP accounting, we account for the resecuritization as a financing even though these securities are owned by the resecuritization entity and are legally not ours. We own only the securities and interests that we acquired from the resecuritization entity, which amounted to $157 million at March 31, 2013. As a result, to adjust at March 31, 2013 for the legal and economic interests that resulted from the resecuritization, Total Residential Senior Securities would be decreased by $316 million to $449 million, Total Re-REMIC Residential Securities would be increased by $157 million to $321 million, and Total Residential Securities would be reduced by $159 million to $1.072 billion.
Investments in Consolidated Sequoia Entities
| u | We recognized net income of $2 million in the first quarter of 2013 from our investments in consolidated Sequoia entities, as compared to net income of $9 million in the fourth quarter of 2012 from our investments in legacy Sequoia and Acacia securitization entities. This decrease is primarily attributable to the realized gains recognized upon deconsolidation and sale of certain Sequoia and Acacia securitization entities in the fourth quarter of 2012. |
| u | Serious delinquencies on loans held at consolidated Sequoia entities (90+ days delinquent) increased to $68 million (or 3.19% of outstanding loan balances) at March 31, 2013, from $63 million (or 2.75% of outstanding loan balances) at December 31, 2012. |
| u | Net charge-offs were less than $1 million (or 0.03% of outstanding loan balances) for the three months ended March 31, 2013. |
| 28 | THE REDWOOD REVIEW | 1ST QUARTER 2013 |
This Page Intentionally Left Blank
| 29 |
This Page Intentionally Left Blank
| 30 |

|
| ||
|
PRIMER ON TRIPLE-A RMBS SPREADS
|
Primer on Triple-A RMBS Spreads
Recently, both the press and pundits have commented on the current headwinds facing the market for new issues of residential mortgage-backed securities (RMBS). Additionally, we know that shareholders have questions about what it means for our business. As it is a complicated, multi-faceted topic that affects many aspects of our business, we are including a separate detailed primer here to help to shorten and simplify the discussion of triple-A spread movements elsewhere in this Redwood Review.
To begin the primer, we quote a Wall Street Journal article dated April 25, 2013.
“Redwood Trust, the leading issuer of mortgage securities backed by loans without government guarantees, is paying investors a yield of about 2.59% to sell its sixth issue of the year, a premium of 1.75 percentage points above an interest rate benchmark. Premiums on deals it sold in January were as low as 0.97 percentage points for a yield of less than 2.0%.”
(Note: The Wall Street Journal’s reference to “investors” means triple-A investors in new issue RMBS transactions.)
The statement above is accurate. To explain what it means, let’s first start with some background to make sure we are clear on bond terminology.
What does it mean when yield premiums and spreads “tighten” or “widen”?
Triple-A securities are priced to create a desired yield spread or premium above certain benchmark rates to compensate investors for perceived increased risk. These benchmark rates include the risk-free Treasury rate, agency RMBS rates, or interest rate swaps. Generally speaking, tighter spreads and lower premiums are better for Redwood. Conversely, wider spreads are worse for Redwood, all things being equal.
What are the key factors that generally affect triple-A spreads?
Several factors impact the yield premium investors are willing to pay to acquire non-Agency triple-A securities. We can control some of these variables, but most are market-related. The ultimate determination of the yield required to price and sell a securitization is part art and part science. We have witnessed several widening and tightening cycles over the past three years. In our opinion the five most common factors that generally impact movements in RMBS spreads are:
| 1. | The general prevailing market psychology. Are we in a “risk on” period where there is less market fear and investors are willing to accept lower premiums for perceived risk (i.e., take on more risk), or are we in a “risk off” period where the opposite is true? |
| 2. | Investors’ expectation for the duration of the RMBS (i.e., how long will the bond be outstanding until prepayment). The shorter the timeframe, the lower the yield requirement, as investors will accept prices at the shorter end of the interest rate curve in exchange for a speedy return of capital. Conversely, the longer the expected timeframe, the higher the yield requirement. |
| 3. | The relative value comparison between non-Agency RMBS and other fixed income instruments (i.e., Agency RMBS and CMBS). |
| 32 | THE REDWOOD REVIEW | 1ST QUARTER 2013 |
|
| ||
|
PRIMER ON TRIPLE-A RMBS SPREADS
|
Primer on Triple-A RMBS Spreads (continued)
| 4. | Overall RMBS supply and demand, and the resulting market dynamics between issuers and triple-A investors. |
| 5. | Each investor’s individual opinion about the premium required above benchmark rates to compensate them for taking on the underlying credit risk and potential loss of capital if they make the investment. |
When and why did triple-A spreads widen?
Spreads began to show signs of weakening by mid-February, and then widened sharply in the middle of March, with the trend continuing through April. Our best conjecture as to why it happened is a combination of factors.
First, we did begin to see in February the beginnings of a “risk off” mentality, which impacted a number of markets, including the CMBS market. Initially, weakening in our market seemed consistent with events in these other markets. However, as other markets began to recover, RMBS spreads continued to widen. So there was more going on than simply a new-found overall “risk off” sentiment.
We do believe that bearish sentiment (i.e., rising rates) with respect to interest rates played a key role. As the 10-year Treasury approached 2.0% in mid-February and early March, there was a general market perception that long-term rates were trending higher. Investors feared that, as a consequence, mortgages prepayments would potentially slow and the duration of triple-A RMBS investments would extend. It is our view that such concerns caused investors to require higher overall yields as they began applying their spread premium requirements against benchmarks further out (longer in years) on the interest rate curve.
There were two other important reasons for the RMBS spread widening, according to feedback we received from investors and underwriters: relative value concerns and a supply and demand imbalance. For our offerings to be successful, our Sequoia triple-A securities must offer compelling return possibilities compared to competing investments, including agency RMBS, interest rate swaps, and Treasuries. Yields on our triple-A RMBS had tightened dramatically in the prior 12 months, to the point where certain other investments offered a more compelling return on a relative basis. In addition, new issue Sequoia bonds as well as bonds of several other competing issuers all reached the market at approximately the same time. The market had come too far, too fast, and the supply and demand imbalance initiated a correction.
It seems somewhat circular, but the non-Agency RMBS market needs to grow in size in order to reach a critical mass to re-attract some large anchor triple–A investors who are not currently participating in the space. For some investors, it is currently uneconomic to allocate resources to an asset class with a relatively small amount of issuance relative to other asset classes. We believe these investors will return to the non-Agency RMBS market if the size of the market represents a compelling opportunity and there is sufficient relative value compared to other fixed income asset classes.
We do not believe that Sequoia RMBS spreads have widened due to collateral credit concerns, again based on feedback from investors and underwriters. The Sequoia RMBS we have issued since 2010 have performed well thus far, with governance structures that are generally considered “best in class” and underlying loan quality that continues to be very strong by any historical standard.
| THE REDWOOD REVIEW | 1ST QUARTER 2013 | 33 |
|
| ||
|
PRIMER ON TRIPLE-A RMBS SPREADS
|
Primer on Triple-A RMBS Spreads (continued)
Can you mitigate some of Redwood’s spread risk by hedging, and through daily loan pricing to sellers?
Yes, we can and do mitigate some of the impact of widening spreads by pricing loans daily based on our most recent expectations about our triple-A execution. We do this while trying to remain competitive and weigh the impact of our loan pricing strategy on our expected loan volume. Daily loan pricing is a dynamic process that considers both the competitive loan pricing in the marketplace and our expectations about the price at which we can sell loans through whole loan sales or securitization. This expectation takes into account many inputs including our estimate of future triple-A RMBS spreads, rating agency subordination levels, and deal costs. We have adjusted our loan pricing to reflect current triple-A spread levels to the extent we expect to distribute loans through securitization, and continue to do so on a daily basis.
The prices of the loans we acquire are also subject to daily fluctuations due to general changes in interest rates. We use a variety of instruments to hedge against changes in interest rates. We try to eliminate as much interest rate risk as we can, but we cannot hedge all of it as there is no perfectly correlated hedge for jumbo mortgage loans.
| 34 | THE REDWOOD REVIEW | 1ST QUARTER 2013 |
|
|
||
|
REDWOOD’S BUSINESS STRATEGY
|
Redwood’s Business Strategy
This section of the Redwood Review provides insight into Redwood’s strategic focus and our business model.
Strategic Focus
As the financial world engaged in massive deleveraging at the onset of the financial crisis, we made a strategic decision in late 2009 to invest in and build out our residential and commercial loan platforms. We did this in order to create our own steady sources of attractive investments and fee-generating opportunities.
There is commonality between our residential and commercial business activities. In both cases, we have established ourselves as an intermediary between borrowers and senior investors in the capital markets. This strategy works well with the structure of our balance sheet and the talents and extensive relationships of the professionals who make up our residential and commercial teams.
On the residential side, our focus since mid-2010 has been to acquire prime, jumbo mortgages primarily for sale through private-label securitization, but also at times through bulk sales. While the initial market opportunity appeared small, our confidence was driven by three big business assumptions: that the government would eventually reduce its outsized role in the mortgage market; that new bank regulation, Basel III, and legacy portfolio issues would open up an opportunity for independent mortgage companies; and that traditional private triple-A institutional investors would return to the market to provide attractive financing for prime residential loans through their investment in private-label securities (“PLS”). We are now seeing our business assumptions play out. The Federal Housing Finance Agency (“FHFA”), which regulates and is the conservator of Fannie Mae and Freddie Mac has begun to raise the fees that the Agencies charge to guarantee MBS, allowing the private market to become more competitive with the Agency market. New bank regulations and pending Basel III capital requirements are forcing the major banks to rethink the ways in which they participate in the mortgage origination market and are causing mortgage servicing rights to change hands at attractive prices. Meanwhile, demand for triple-A securities issued through the Sequoia platform has generally been strong since we restarted our securitization activity in 2010.
On the commercial side, we set our sights on an inevitable wave of commercial loan refinancing demand, brought about by the pre-crisis era of high-leverage lending. An immediate need was identified for mezzanine capital that could bridge the gap between commercial borrowers’ funding needs and what traditional senior lenders would provide in a deleveraged world. We also assumed that we would eventually position our platform to become an originator of senior commercial loans, offering value through greater flexibility and certainty of execution for borrowers. We have made progress in both areas, as we have originated more than $300 million of mezzanine loans since late 2010, and have originated more than $300 million of senior commercial loans since mid-2012.
| THE REDWOOD REVIEW | 1ST QUARTER 2013 | 35 |
|
| ||
|
REDWOOD'S BUSINESS STRATEGY
|
Redwood’s Business Model
Our operating model has evolved substantially since the financial crisis began in 2007. This evolution has, in part, been driven by our desire to build a franchise value-producing business model positioned to capitalize on the expected eventual reform of Fannie Mae and Freddie Mac (the “Agencies”) and to be competitive in the post-crisis era of greater regulatory and capital requirements for all mortgage market participants, particularly for the more heavily regulated banks.
Today, Redwood is an internally-managed operating business focused on residential and commercial mortgage banking and mortgage-related investments. While we are structured as a REIT for tax purposes, we operate more like a mortgage banking company than most other publicly-traded mortgage REITs.
Below is an illustration of our three primary revenue sources: our residential and commercial mortgage banking activities, which are generally carried out through taxable REIT subsidiaries, and our tax-advantaged investment portfolio, which is housed at our REIT, as shown in the chart below.
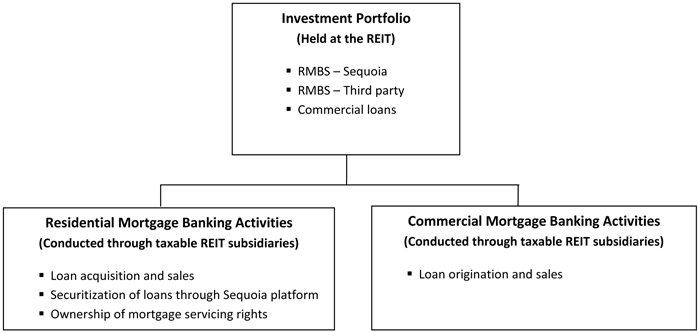
| 36 | THE REDWOOD REVIEW | 1ST QUARTER 2013 |
|
|
||
|
REDWOOD'S BUSINESS STRATEGY
|
Residential Mortgage Banking Activities
We conduct our residential mortgage banking activities through taxable REIT subsidiaries that pay taxes and can generally retain earnings and reinvest the cash flows generated therein. Earnings and cash flow from these activities can also be up-streamed to Redwood Trust, Inc. to be passed through to shareholders, if desired.
Our residential mortgage banking activities primarily consist of operating a jumbo prime mortgage loan conduit, which acquires jumbo residential mortgages from third-party originators and subsequently sells those loans mainly through securitization transactions. In carrying out this aspect of our business, we buy individual closed loans one-by-one (on a “flow” basis) from commercial banks and mortgage companies located throughout the U.S. We periodically augment our flow loan acquisitions with bulk portfolio acquisitions. Although we do not originate or directly service residential loans, we have a complete mortgage banking team with a skill set in underwriting, compliance, quality control, secondary marketing, and warehousing. Our current loan acquisition strategy differs from the pre-credit crisis period when we were more focused on acquiring loans in bulk through a competitive bidding process. (Aside from the lack of any material bulk sale activity of newly originated jumbo mortgage loans, we believe the bulk model has lower barriers to entry.) After accumulating a sufficient aggregate principal amount of loans, we typically securitize them through our Sequoia securitization platform and sell the senior securities to a broker/dealer for redistribution to triple-A investors. The subordinate securities are generally retained and held for investment by Redwood Trust, Inc., our tax-advantaged REIT parent company. Most of the loans acquired are securitized, but we occasionally sell whole loans to banks and other buyers.
Commercial Mortgage Banking Activities
We conduct our commercial mortgage banking activities through taxable REIT subsidiaries that pay taxes but have the ability to retain earnings and cash flow for reinvestment. In summary, we operate as a commercial mortgage lender by originating loans directly to borrowers and through a correspondent network. We may split originated commercial loans into senior and mezzanine tranches. We typically sell the senior tranches into the capital markets (such as to CMBS conduits, banks, and insurance companies) on a “best execution basis,” and retain the mezzanine tranches for our REIT investment portfolio held at Redwood Trust, Inc.
Investment Portfolio
Our investment portfolio is held within our REIT, and includes investments in RMBS issued in Sequoia securitization transactions that result from our residential mortgage banking activities as well as RMBS issued by third parties, residential loans held pending sale in either whole loan form or through securitizations, and commercial loans from our commercial mortgage banking activities. As a REIT, we must distribute a minimum of 90% of pretax earnings from our investment portfolio to shareholders to avoid corporate income tax liability on those earnings.
| THE REDWOOD REVIEW | 1ST QUARTER 2013 | 37 |
|
| ||
|
GLOSSARY
|
ADJUSTABLE-RATE MORTGAGES (ARM)
Adjustable-rate mortgages (“ARMs”) are loans that have coupons that adjust at least once per year. We make a distinction between ARMs (loans with a rate adjustment at least annually) and hybrids (loans that have a fixed-rate period of 2-10 years and then become adjustable-rate).
AGENCY
Agency refers to government-sponsored enterprises (“GSEs”), including Federal National Mortgage Association (“Fannie Mae”), Federal Home Loan Mortgage Corporation (“Freddie Mac”), and Government National Mortgage Association (“Ginnie Mae”).
ALT-A SECURITIES and ALT-A LOANS
Alt-A securities are residential mortgage-backed securities backed by loans that have higher credit quality than subprime and lower credit quality than prime. Alt-A originally represented loans with alternative documentation, but the definition has shifted over time to include loans with additional risk characteristics and in some cases investor loans. In an Alt-A loan, the borrower’s income may not be verified, and in some cases, may not be disclosed on the loan application. Alt-A loans may also have expanded criteria that allow for higher debt-to-income ratios with higher accompanying loan-to-value ratios than would otherwise be permissible for prime loans.
AMORTIZED COST
Amortized cost is the initial acquisition cost of an available-for-sale (“AFS”) security, minus principal repayments or principal reductions through credit losses, plus or minus premium or discount amortization. At the point in time an AFS security is deemed other-than-temporarily impaired, the amortized cost is adjusted (by changing the amount of unamortized premium or discount) by the amount of other-than temporary impairment taken through the income statement.
ASSET-BACKED SECURITIES (ABS)
Asset-backed securities (“ABS”) are securities backed by financial assets that generate cash flows. Each ABS issued from a securitization entity has a unique priority with respect to receiving principal and interest cash flows and absorbing any credit losses from the assets owned by the entity.
AVAILABLE-FOR-SALE (AFS)
An accounting method for debt and equity securities in which the securities are reported at their fair value. Positive changes in the fair value are accounted for as increases to stockholders’ equity and do not flow through the income statement. Negative changes in fair value may be recognized through the income statement or balance sheet.
B-NOTES
B-Notes are subordinate interests in commercial mortgage debt which are either (i) evidenced by a subordinated promissory note secured by the same mortgage that also secures the senior debt relating to the same property or (ii) junior participation interests in mortgage debt that are subordinate to senior participation interests in the same mortgage debt. B-Notes typically provide the holder with certain rights to approve modifications to related lending agreements and to trigger foreclosure under the mortgage following an event of default. B-Notes also typically provide the holder certain limited rights to cure a borrower default under senior debt secured by the same mortgage in order to keep the senior debt current and avoid foreclosure.
| 38 | THE REDWOOD REVIEW | 1ST QUARTER 2013 |
|
|
||
|
GLOSSARY
|
BOOK VALUE (GAAP)
Book value is the value of our common equity in accordance with GAAP.
COLLATERALIZED DEBT OBLIGATION (CDO) SECURITIZATIONS
The securitization of a diverse pool of assets.
COMMERCIAL MORTGAGE-BACKED SECURITIES (CMBS)
A type of mortgage-backed security that is secured by one or more loans on commercial properties.
CONSTANT (or CONDITIONAL) PREPAYMENT RATE (CPR)
Constant (or conditional) prepayment rate (“CPR”) is an industry-standard measure of the speed at which mortgage loans prepay. It approximates the annual percentage rate at which a pool of loans is paying down due to unscheduled principal prepayments.
CORE EQUITY
Core equity is not a measure calculated in accordance with GAAP. GAAP equity includes mark-to-market adjustments for some of our assets and interest rate agreements in “accumulated other comprehensive income (loss).” Core equity excludes accumulated other comprehensive income (loss). Core equity in some ways approximates what our equity value would be if we used historical amortized cost accounting exclusively. A reconciliation of core equity to GAAP appears in the Table 3 in the Financial Tables in this Review.
CREDIT SUPPORT
Credit support is the face amount of securities subordinate (or junior) to the applicable security that protects the security from credit losses and is generally expressed as a percentage of the securitization’s underlying pool balance.
DEBT
Debt is an obligation of Redwood. See Long-term debt and Short-term debt.
FASB
Financial Accounting Standards Board.
FHFA
The FHFA refers to the Federal Housing Finance Authority.
GAAP
Generally Accepted Accounting Principles in the United States.
GOVERNMENT SPONSORED ENTERPRISE (GSE)
A government sponsored enterprise is a financial services corporation created by the United States Congress to enhance the flow of credit to targeted sectors of the economy. Among the GSEs charted by Congress are Fannie Mae, Freddie Mac, and Ginnie Mae.
INTEREST-ONLY SECURITIES (IOs)
Interest-only securities (“IOs”) are specialized securities created by securitization entities where the projected cash flows generated by the underlying assets exceed the cash flows projected to be paid to the securities that are issued with principal balances. Typically, IOs do not have a principal balance and they will not receive principal payments. Interest payments to IOs usually equal an interest rate formula multiplied by a “notional” principal balance. The notional principal balances for IOs are typically reduced over time as the actual principal balance of the underlying pool of assets pays down, thus reducing the cash flows to the IOs over time. Cash flows on IOs are typically reduced more quickly when asset prepayments increase.
| THE REDWOOD REVIEW | 1ST QUARTER 2013 | 39 |
|
| ||
|
GLOSSARY
|
INVESTMENT CAPACITY
The amount of capacity we estimate that we have to invest in new assets. Our estimate of our investment capacity takes into account, among other things, cash on hand, cash we estimate we could raise by prudently increasing short-term borrowings, and cash needed to cover short-term operations, working capital, and a liquidity cushion.
JUMBO LOAN
A jumbo loan is a mortgage loan that generally conforms to the underwriting standards of Fannie Mae and Freddie Mac except that the dollar amount of the loan exceeds the maximum limit set by the two GSEs for loans salable to the two companies.
LEVERAGE RATIOS
When determining Redwood’s financial leverage, traditional leverage ratios may be misleading in some respects if consolidated ABS issued from securitization entities are included as part of Redwood’s obligations when calculating this or similar ratios. Because of the requirement to consolidate the independent securitization entities for GAAP accounting purposes, it appears that Redwood is highly leveraged, with total consolidated liabilities significantly greater than equity. The obligations of these securitization entities are not obligations of Redwood.
LONG-TERM DEBT
Long-term debt is debt that is an obligation of Redwood that is not payable within a year and includes convertible debt, junior subordinated notes and trust preferred securities. We generally treat long-term debt as part of our capital base when it is not payable in the near future.
MARK-TO-MARKET (MTM) ACCOUNTING
Mark-to-market (“MTM”) accounting uses estimated fair values of assets, liabilities, and hedges. Many assets on our consolidated balance sheet are carried at their fair value rather than amortized cost. Taxable income is generally not affected by market valuation adjustments.
MARKET VALUATION ADJUSTMENTS (MVAs)
Market valuation adjustments (“MVAs”) are changes in market values for certain assets and liabilities that are reported through our GAAP income statement. They include all changes in market values for assets and liabilities accounted for at fair value, such as trading securities and derivatives. They also include the credit portion of other-than-temporary impairments on securities available-for-sale, as well as impairments of loans held-for-sale and REO properties.
MEZZANINE LOAN
A mezzanine loan is a loan secured by the membership interests, partnership interests, and/or stock in a single purpose entity formed to own a commercial property, for example. If the mezzanine borrower fails to make its payments or otherwise defaults under the mezzanine loan documents, the mezzanine lender may pursue its remedies, including taking control of the single purpose entity that owns the property.
MORTGAGE SERVICING RIGHT (MSR)
A mortgage servicing right (“MSR”) gives the holder the contractual right to service a mortgage loan. MSRs typically include the right to collect monthly mortgage principal and interest payments, as well as related tax and insurance payments, from borrowers, disburse funds to the mortgage debt holders and remit related insurance and tax payments, collect late payments, and process modifications and foreclosures. MSRs are created when mortgage loans are sold in a transaction in which the seller retains the right to service the loans. The holder of an MSR receives a monthly servicing fee (which generally ranges from 0.25% to 0.375% per annum of the outstanding principal balance of the related mortgage loan), which is deducted from the borrower’s monthly interest payments. For accounting purposes,
| 40 | THE REDWOOD REVIEW | 1ST QUARTER 2013 |
|
|
||
|
GLOSSARY
|
MSRs are capitalized at the net present value of the servicing fee less the servicing cost. When Redwood holds MSRs relating to residential mortgage loans, it retains a sub-servicer to carry out actual servicing functions, as Redwood does not directly service residential mortgage loans.
NON-PRIME SECURITIES
Non-prime securities are Alt-A, option ARM, and subprime securities. See definitions of Alt-A, option ARM, and subprime securities.
OPTION ARM LOAN
An option ARM loan is a residential mortgage loan that generally offers a borrower monthly payment options such as: 1) a minimum payment that results in negative amortization; 2) an interest-only payment; 3) a payment that would fully amortize the loan over an original 31-year amortization schedule; and, 4) a payment that would fully amortize the loan over a 15-year amortization schedule. To the extent the borrower has chosen an option that is not fully amortizing the loan (or negatively amortizing the loan), after a period — usually five years or once the negatively amortized loan balance reaches a certain level (generally 15% to 25% higher than the original balance) — the loan payments are recast. This recast provision resets the payment at a level that fully amortizes the loan over its remaining life and the new payment may be materially different than under the borrowers’ previous option.
PREFERRED EQUITY
A preferred equity investment is an investment in preferred equity of a special purpose entity that directly or indirectly owns a commercial property. An investor in preferred equity is typically entitled to a preferred return (relative to a holder of common equity of the same entity) and has the right, if the preferred return is not paid, to take control of the entity (and thereby control the underlying commercial property).
PRIME RESIDENTIAL REAL ESTATE LOANS
Prime loans are residential loans with higher quality credit characteristics, such as borrowers with higher FICO credit scores, lower loan-to-value ratios, lower debt-to-income ratios, greater levels of other assets, and more documentation.
PRIME SECURITIES
Prime securities are residential mortgage-backed securities backed by prime loans, generally with balances greater than conforming loan limits. Prime securities are typically backed by loans that have relatively high weighted average FICO scores (e.g., 700 or higher at origination), low weighted average LTVs (e.g., 75% or less at origination), limited concentrations of investor properties, and low percentages of loans with low FICO scores or high loan-to-value ratios.
PROFITABILITY RATIOS
Many financial institution analysts use asset-based profitability ratios such as interest rate spread and interest rate margin when analyzing financial institutions. These are asset-based measures. Since we consolidate the assets and liabilities of securitization entities for GAAP purposes, our total GAAP assets and liabilities may vary over time, and may not be comparable to assets typically used in profitability calculations for other financial institutions. As a result, we believe equity-based profitability ratios may be more appropriate than asset-based measures for analyzing Redwood’s operations and results. We believe, for example, that net interest income as a percentage of equity is a useful measure of profitability. For operating expenses, we believe useful measures are operating efficiency ratio (operating expenses as a percentage of net interest income) and operating expenses as a percentage of equity. We provide various profitability ratios in Table 4 in the Financial Tables in this Review.
| THE REDWOOD REVIEW | 1ST QUARTER 2013 | 41 |
|
| ||
|
GLOSSARY
|
REAL ESTATE INVESTMENT TRUST (REIT)
A real estate investment trust (“REIT”) is an entity that makes a tax election to be taxed as a REIT, invests in real estate assets, and meets other REIT qualifications, including the distribution as dividends of at least 90% of its REIT taxable income. A REIT’s profits are not taxed at the corporate level to the extent that these profits are distributed as dividends to stockholders, providing an operating cost savings. On the other hand, the requirement to pay out as dividends most of the REIT’s taxable profits means it can be harder for a REIT to grow using only internally-generated funds (as opposed to raising new capital).
REAL ESTATE OWNED (REO)
Real estate owned (“REO”) refers to real property owned by the lender or loan owner that has been acquired through foreclosure.
REIT SUBSIDIARY
A REIT subsidiary is a subsidiary of a REIT that is taxed as a REIT.
REIT TAXABLE INCOME
REIT taxable income is not a measure calculated in accordance with GAAP. REIT taxable income is pretax income calculated for tax purposes at Redwood including only its qualifying REIT subsidiaries (i.e., excluding its taxable subsidiaries, with certain adjustments). REIT taxable income is an important measure as it is the basis of our dividend distribution requirements. We must annually distribute at least 90% of REIT taxable income as dividends to shareholders. As a REIT, we are not subject to corporate income taxes on the REIT taxable income we distribute. We pay corporate income tax on the REIT taxable income we retain, if any (and we are permitted to retain up to 10% of total REIT taxable income). A reconciliation of REIT taxable income to GAAP income appears in Table 2 in the Financial Tables in this Review.
REMIC
A real estate mortgage investment conduit (“REMIC”) is a special purpose vehicle used to pool real estate mortgages and issue mortgage-backed securities. REMICs are typically exempt from tax at the entity level. REMICs may invest only in qualified mortgages and permitted investments, including single family or multifamily mortgages, commercial mortgages, second mortgages, mortgage participations, and federal agency pass-through securities.
RE-REMIC SECURITY
A re-REMIC is a re-securitization of asset-backed securities. The cash flows from and any credit losses absorbed by the underlying assets can be redirected to the resulting re-REMIC securities in a variety of ways.
RESECURITIZATION
A resecuritization is a securitization of two or more mortgage-backed securities into a new mortgage-backed security.
RESIDENTIAL MORTGAGE-BACKED SECURITIES (RMBS)
A type of mortgage-backed security that is backed by a pool of mortgages on residential properties.
RETURN ON EQUITY (ROE) and ADJUSTED RETURN ON EQUITY
ROE is the amount of profit we generate each year per dollar of equity capital and equals GAAP income divided by GAAP equity. Adjusted ROE is not a measure calculated in accordance with GAAP — it is GAAP income divided by core equity.
| 42 | THE REDWOOD REVIEW | 1ST QUARTER 2013 |
|
|
||
|
GLOSSARY
|
SENIOR SECURITIES
Generally, senior securities have the least credit risk in a securitization transaction because they are generally the last securities to absorb credit losses. In addition, the senior securities have the highest claim on the principal and interest payments (after the fees to servicers and trustees are paid). To further reduce credit risk, most if not all, principal collected from the underlying asset pool is used to pay down the senior securities until certain performance tests are satisfied. If certain performance tests are satisfied, principal payments are shared between the senior securities and the subordinate securities, generally on a pro rata basis. At issuance, senior securities are generally triple A-rated.
SEQUOIA
Sequoia is the brand name for securitizations of residential real estate loans Redwood sponsors. Sequoia entities are independent securitization entities that acquire residential mortgage loans and create and issue asset-backed securities (“ABS”) backed by these loans. Most of the loans that Sequoia entities acquire are prime-quality loans. Most of the senior ABS created by Sequoia are sold to third-party investors. Redwood usually acquires most of the subordinated ABS and occasionally acquires the interest-only securities (“IOs”).
SHORT-TERM DEBT
Short-term debt is debt that is an obligation of Redwood and payable within a year. We may obtain this debt from a variety of Wall Street firms, banks, and other institutions. We may issue these or other forms of short term debt in the future. We may use short-term debt to finance the accumulation of assets prior to sale to a securitization entity and to finance investments in loans and securities.
SUBORDINATE DEBT INVESTMENTS
Subordinate Debt Investments mean Mezzanine Loans, Preferred Equity, and B-Notes.
SUBORDINATE SECURITIES (JUNIOR SECURITIES or NON-SENIOR SECURITIES)
Subordinate securities absorb the initial credit losses from a securitization structure, thus protecting the senior securities. Subordinate securities have a lower priority to receive principal and interest payments than the senior securities. Subordinate securities receive little, if any, principal payments until certain performance tests are satisfied. If certain performance tests are satisfied, principal payments are shared between the senior securities and the subordinate securities, generally on a pro rata basis. Subordinate securities generally receive interest payments even if they do not receive principal payments. At issuance, subordinate securities are generally rated double-A or below.
SUBPRIME SECURITIES
Subprime securities are residential mortgage-backed securities backed by loans to borrowers who typically have lower credit scores and/or other credit deficiencies that prevent them from qualifying for prime or Alt-A mortgages and may have experienced credit problems in the past, such as late payments or bankruptcies. To compensate for the greater risks and higher costs to service the loans, subprime borrowers pay higher interest rates, points, and origination fees.
TAXABLE INCOME
Taxable income is not a measure calculated in accordance with GAAP. Taxable income is pre-tax income for Redwood and all its subsidiaries as calculated for tax purposes. Taxable income calculations differ significantly from GAAP income calculations. A reconciliation of taxable income to GAAP income appears in Table 2 in the Financial Tables in this Review.
TAXABLE SUBSIDIARY
A taxable subsidiary is a subsidiary of a REIT that is not taxed as a REIT and thus pays taxes on its income. A taxable subsidiary is not limited to investing in real estate and it can choose to retain all of its after-tax profits.
| THE REDWOOD REVIEW | 1ST QUARTER 2013 | 43 |
This Page Intentionally Left Blank
| 44 |


|
Table 1: GAAP Earnings ($ in thousands, except per share data) | 46
| ||
| 2013 Q1 |
2012 Q4 |
2012 Q3 |
2012 Q2 |
2012 Q1 |
2011 Q4 |
2011 Q3 |
2011 Q2 |
2011 Q1 |
Twelve 2012 |
Twelve Months 2011 |
||||||||||||||||||||||||||||||||||
| Interest income |
$ | 47,360 | $ | 48,025 | $ | 54,001 | $ | 52,630 | $ | 51,354 | $ | 48,512 | $ | 45,096 | $ | 44,126 | $ | 44,025 | $ | 206,010 | $ | 181,759 | ||||||||||||||||||||||
| Discount amortization on securities, net |
7,672 | 7,103 | 7,317 | 8,318 | 8,258 | 9,339 | 10,179 | 10,513 | 12,104 | 30,996 | 42,135 | |||||||||||||||||||||||||||||||||
| Premium amortization expense on loans |
(1,508 | ) | (1,731 | ) | (1,595 | ) | (1,424 | ) | (872 | ) | (1,356 | ) | (1,879 | ) | (1,684 | ) | (1,796 | ) | (5,622 | ) | (6,715 | ) | ||||||||||||||||||||||
| Total interest income |
53,524 | 53,397 | 59,723 | 59,524 | 58,740 | 56,495 | 53,396 | 52,955 | 54,333 | 231,384 | 217,179 | |||||||||||||||||||||||||||||||||
| Interest expense on short-term debt |
(3,808 | ) | (2,526 | ) | (2,737 | ) | (2,299 | ) | (1,828 | ) | (764 | ) | (78 | ) | (7 | ) | (182 | ) | (9,390 | ) | (1,031 | ) | ||||||||||||||||||||||
| Interest expense on ABS |
(9,398 | ) | (15,106 | ) | (21,379 | ) | (22,350 | ) | (24,565 | ) | (24,030 | ) | (19,907 | ) | (19,509 | ) | (17,822 | ) | (83,400 | ) | (81,268 | ) | ||||||||||||||||||||||
| ABS issuance expense amortization |
(985 | ) | (915 | ) | (552 | ) | (602 | ) | (569 | ) | (630 | ) | (545 | ) | (568 | ) | (559 | ) | (2,638 | ) | (2,302 | ) | ||||||||||||||||||||||
| ABS interest rate agreement expense |
(87 | ) | (11,561 | ) | (1,127 | ) | (1,136 | ) | (1,204 | ) | (1,171 | ) | (1,233 | ) | (1,252 | ) | (1,134 | ) | (15,028 | ) | (4,790 | ) | ||||||||||||||||||||||
| ABS issuance premium amortization (expense) income |
(542 | ) | (412 | ) | (113 | ) | (115 | ) | (115 | ) | (136 | ) | (170 | ) | 78 | 96 | (755 | ) | (132 | ) | ||||||||||||||||||||||||
| Total ABS expense consolidated from trusts (1) |
(11,012 | ) | (27,994 | ) | (23,171 | ) | (24,203 | ) | (26,453 | ) | (25,967 | ) | (21,855 | ) | (21,251 | ) | (19,419 | ) | (101,821 | ) | (88,492 | ) | ||||||||||||||||||||||
| Interest expense on long-term debt |
(3,534 | ) | (2,451 | ) | (2,377 | ) | (2,379 | ) | (2,376 | ) | (2,384 | ) | (2,384 | ) | (2,375 | ) | (2,371 | ) | (9,583 | ) | (9,514 | ) | ||||||||||||||||||||||
| Net interest income |
35,170 | 20,426 | 31,438 | 30,643 | 28,083 | 27,380 | 29,079 | 29,322 | 32,361 | 110,590 | 118,142 | |||||||||||||||||||||||||||||||||
| (Provision for) reversal of provision for loan losses |
(2,039 | ) | (3,394 | ) | (1,319 | ) | 1,340 | (275 | ) | (7,784 | ) | (3,978 | ) | (1,581 | ) | (2,808 | ) | (3,648 | ) | (16,151 | ) | |||||||||||||||||||||||
| Other market valuation adjustments, net |
1,626 | (660 | ) | (3,470 | ) | (5,465 | ) | (568 | ) | (9,682 | ) | (13,448 | ) | (11,147 | ) | (5,740 | ) | (10,163 | ) | (40,017 | ) | |||||||||||||||||||||||
| Net interest income after provision and other market valuation adjustments |
34,757 | 16,372 | 26,649 | 26,518 | 27,240 | 9,914 | 11,653 | 16,594 | 23,813 | 96,779 | 61,974 | |||||||||||||||||||||||||||||||||
| Mortgage banking activities, net |
44,092 | 23,887 | 16,730 | 1,771 | 4,242 | - | - | - | - | 46,630 | - | |||||||||||||||||||||||||||||||||
| Fixed compensation expense |
(5,691 | ) | (4,275 | ) | (4,412 | ) | (4,373 | ) | (5,035 | ) | (3,799 | ) | (3,702 | ) | (3,797 | ) | (4,144 | ) | (18,095 | ) | (15,442 | ) | ||||||||||||||||||||||
| Variable compensation expense |
(4,837 | ) | (5,465 | ) | (5,593 | ) | (3,024 | ) | (2,594 | ) | (721 | ) | (863 | ) | (646 | ) | (601 | ) | (16,676 | ) | (2,831 | ) | ||||||||||||||||||||||
| Equity compensation expense |
(2,487 | ) | (2,499 | ) | (2,151 | ) | (2,958 | ) | (2,176 | ) | (2,371 | ) | (1,929 | ) | (2,707 | ) | (2,060 | ) | (9,784 | ) | (9,067 | ) | ||||||||||||||||||||||
| Other operating expense |
(6,582 | ) | (6,131 | ) | (4,946 | ) | (4,809 | ) | (4,829 | ) | (5,683 | ) | (5,013 | ) | (4,937 | ) | (4,709 | ) | (20,715 | ) | (20,342 | ) | ||||||||||||||||||||||
| Total operating expenses |
(19,597 | ) | (18,370 | ) | (17,102 | ) | (15,164 | ) | (14,634 | ) | (12,574 | ) | (11,507 | ) | (12,087 | ) | (11,514 | ) | (65,270 | ) | (47,682 | ) | ||||||||||||||||||||||
| Realized gains on sales, net (2) |
12,267 | 20,336 | 13,940 | 6,995 | 13,508 | - | 313 | 5,433 | 3,956 | 54,779 | 9,702 | |||||||||||||||||||||||||||||||||
| Realized gains (losses) on calls, net |
- | 29 | - | - | 113 | 102 | 832 | 401 | (91 | ) | 142 | 1,244 | ||||||||||||||||||||||||||||||||
| Realized gains, net |
12,267 | 20,365 | 13,940 | 6,995 | 13,621 | 102 | 1,145 | 5,834 | 3,865 | 54,921 | 10,946 | |||||||||||||||||||||||||||||||||
| Noncontrolling interest |
- | - | - | - | - | - | 20 | (888 | ) | 2,015 | - | 1,147 | ||||||||||||||||||||||||||||||||
| Provision for income taxes |
(10,909 | ) | (176 | ) | (516 | ) | (592 | ) | (7 | ) | - | (14 | ) | (14 | ) | (14 | ) | (1,291 | ) | (42 | ) | |||||||||||||||||||||||
| Net income (loss) |
$ | 60,610 | $ | 42,078 | $ | 39,701 | $ | 19,528 | $ | 30,462 | $ | (2,558 | ) | $ | 1,297 | $ | 9,439 | $ | 18,165 | $ | 131,769 | $ | 26,343 | |||||||||||||||||||||
| Diluted average shares |
87,345 | 82,498 | 80,764 | 78,815 | 79,892 | 78,370 | 78,471 | 79,478 | 79,372 | 80,674 | 78,300 | |||||||||||||||||||||||||||||||||
| Net income (loss) per share |
$ | 0.69 | $ | 0.50 | $ | 0.48 | $ | 0.24 | $ | 0.37 | $ | (0.03 | ) | $ | 0.01 | $ | 0.11 | $ | 0.22 | $ | 1.59 | $ | 0.31 | |||||||||||||||||||||
(1) Interest expense on ABS issued for the fourth quarter of 2012 includes accelerated recognition of $11 million of deferred hedging costs relating to Acacia entities upon deconsolidation of these entities.
(2) Realized gains on sales, net includes $15 million of gains related to the deconsolidation of certain Sequoia and Acacia entities during the fourth quarter of 2012.
| THE REDWOOD REVIEW 1ST QUARTER 2013
|
Table 1: GAAP Earnings | |||
|
|
Table 2: Taxable and GAAP Income1 Differences and Dividends ($ in thousands, except per share data) | |||
| Estimated Q1 2013 | Estimated Twelve Months 2012 (2) | Actual Twelve Months 2011 | ||||||||||||||||||||||||||||||||||
| Taxable Income |
GAAP Income |
Differences | Taxable Income |
GAAP Income |
Differences | Taxable Income |
GAAP Income |
Differences | ||||||||||||||||||||||||||||
| Taxable and GAAP Income Differences |
||||||||||||||||||||||||||||||||||||
| Interest income |
$ | 48,231 | $ | 53,524 | $ | (5,293 | ) | $ | 161,976 | $ | 231,384 | $ | (69,408 | ) | $ | 128,334 | $ | 217,179 | $ | (88,845 | ) | |||||||||||||||
| Interest expense |
(11,093 | ) | (18,354 | ) | 7,261 | (25,168 | ) | (120,794 | ) | 95,626 | (15,804 | ) | (99,037 | ) | 83,233 | |||||||||||||||||||||
| Net interest income |
37,138 | 35,170 | 1,968 | 136,808 | 110,590 | 26,218 | 112,530 | 118,142 | (5,612 | ) | ||||||||||||||||||||||||||
| Provision for loan losses |
- | (2,039 | ) | 2,039 | - | (3,648 | ) | 3,648 | - | (16,151 | ) | 16,151 | ||||||||||||||||||||||||
| Realized credit losses |
(4,669 | ) | - | (4,669 | ) | (25,609 | ) | - | (25,609 | ) | (57,526 | ) | - | (57,526 | ) | |||||||||||||||||||||
| Other market valuation adjustments, net |
- | 1,626 | (1,626 | ) | - | (10,163 | ) | 10,163 | - | (40,017 | ) | 40,017 | ||||||||||||||||||||||||
| Mortgage banking activities, net |
43,581 | 44,092 | (511 | ) | 222 | 46,630 | (46,408 | ) | - | - | - | |||||||||||||||||||||||||
| Operating expenses |
(17,322 | ) | (19,597 | ) | 2,275 | (56,174 | ) | (65,270 | ) | 9,096 | (45,166 | ) | (47,682 | ) | 2,516 | |||||||||||||||||||||
| Realized gains, net |
- | 12,267 | (12,267 | ) | - | 54,921 | (54,921 | ) | - | 10,946 | (10,946 | ) | ||||||||||||||||||||||||
| Provision for income taxes |
(48 | ) | (10,909 | ) | 10,861 | (90 | ) | (1,291 | ) | 1,201 | (16 | ) | (42 | ) | 26 | |||||||||||||||||||||
| Less: Net loss attributable to noncontrolling interest
|
- | - | - | - | - | - | - | (1,147 | ) | 1,147 | ||||||||||||||||||||||||||
|
Income |
$ | 58,680 | $ | 60,610 | $ | (1,930 | ) | $ | 55,157 | $ | 131,769 | $ | (76,612 | ) | $ | 9,822 | $ | 26,343 | $ | (16,521 | ) | |||||||||||||||
| REIT taxable income |
$ | 16,060 | $ | 61,742 | $ | 19,543 | ||||||||||||||||||||||||||||||
| Taxable income (loss) at taxable subsidiaries |
42,620 | (6,585 | ) | (9,721 | ) | |||||||||||||||||||||||||||||||
| Taxable income |
$ | 58,680 | $ | 55,157 | $ | 9,822 | ||||||||||||||||||||||||||||||
| Shares used for taxable EPS calculation |
81,706 | 81,716 | 78,556 | |||||||||||||||||||||||||||||||||
| REIT taxable income per share (3) |
$ | 0.20 | $ | 0.77 | $ | 0.24 | ||||||||||||||||||||||||||||||
| Taxable income (loss) at taxable subsidiaries per share |
$ | 0.52 | $ | (0.08 | ) | $ | (0.12 | ) | ||||||||||||||||||||||||||||
| Taxable income per share (3) |
$ | 0.72 | $ | 0.69 | $ | 0.12 | ||||||||||||||||||||||||||||||
| Dividends |
||||||||||||||||||||||||||||||||||||
| Dividends declared |
$ | 22,875 | $ | 80,134 | $ | 78,382 | ||||||||||||||||||||||||||||||
| Regular dividend per share (4)
|
$ | 0.28 | $ | 1.00 | $ | 1.00 | ||||||||||||||||||||||||||||||
(1) Taxable income for 2012 and 2013 are estimates until we file our tax returns for those years.
(2) Reconciliation of GAAP income to taxable income (loss) for prior quarters is provided in the respective Redwood Reviews for those quarters.
(3) REIT taxable income per share and taxable income (loss) per share are based on the number of shares outstanding at the end of each quarter. The annual REIT taxable income per share and taxable income (loss) per share are the sum of the four quarterly per share estimates.
(4) Dividends in 2012 were characterized as 77% ordinary income, or $62 million, and 23% return of capital, or $18 million. Dividends in 2011 were characterized as 25% ordinary income, or $19 million, and 75% return of capital, or $59 million. Dividends in 2010 were characterized as 62% ordinary income, or $48 million, and 38% return of capital, or $30 million. The portion of Redwood’s dividends characterized as a return of capital is not taxable to a shareholder and reduces a shareholder’s basis for shares held at each quarterly distribution date, but not to below $0.
| THE REDWOOD REVIEW 1ST QUARTER 2013
|
Table 2: Taxable and GAAP Income Differences and Dividends |
47
| ||
|
|
Table 3: Book Value and Financial Ratios ($ in millions, except per share data) | 48
| ||
| 2013 Q1 |
2012 Q4 |
2012 Q3 |
2012 Q2 |
2012 Q1 |
2011 Q4 |
2011 Q3 |
2011 Q2 |
2011 Q1 |
||||||||||||||||||||||||||||
| Short-term debt |
$ | 721 | $ | 552 | $ | 522 | $ | 455 | $ | 441 | $ | 428 | $ | - | $ | 41 | $ | - | ||||||||||||||||||
| Long-term debt |
444 | 140 | 140 | 140 | 140 | 140 | 140 | 140 | 140 | |||||||||||||||||||||||||||
| Redwood debt (1) |
$ | 1,165 | $ | 692 | $ | 662 | $ | 595 | $ | 581 | $ | 568 | $ | 140 | $ | 181 | $ | 140 | ||||||||||||||||||
| ABS obligations of consolidated securitization entities (including the Residential Resecuritization and Commercial Securitization) |
2,365 | 2,530 | 3,429 | 3,564 | 3,704 | 4,139 | 4,293 | 3,839 | 3,957 | |||||||||||||||||||||||||||
| Consolidated GAAP Debt |
$ | 3,529 | $ | 3,222 | $ | 4,091 | $ | 4,159 | $ | 4,285 | $ | 4,707 | $ | 4,433 | $ | 4,020 | $ | 4,097 | ||||||||||||||||||
| GAAP stockholders’ equity |
$ | 1,188 | $ | 1,140 | $ | 1,050 | $ | 951 | $ | 962 | $ | 893 | $ | 959 | $ | 1,025 | $ | 1,075 | ||||||||||||||||||
| Redwood debt to equity |
1.0x | 0.6x | 0.6x | 0.6x | 0.6x | 0.6x | 0.1x | 0.2x | 0.1x | |||||||||||||||||||||||||||
| Redwood debt to (equity + Redwood debt) |
50% | 38% | 39% | 38% | 38% | 39% | 13% | 15% | 12% | |||||||||||||||||||||||||||
| Consolidated GAAP Debt to equity |
3.0x | 2.8x | 3.9x | 4.4x | 4.5x | 5.3x | 4.6x | 3.9x | 3.8x | |||||||||||||||||||||||||||
| Consolidated GAAP Debt to (equity + GAAP debt) |
75% | 74% | 80% | 81% | 82% | 84% | 82% | 80% | 79% | |||||||||||||||||||||||||||
| GAAP stockholders’ equity |
$ | 1,188 | $ | 1,140 | $ | 1,050 | $ | 951 | $ | 962 | $ | 893 | $ | 959 | $ | 1,025 | $ | 1,075 | ||||||||||||||||||
| Balance sheet mark-to-market adjustments |
143 | 138 | 74 | 28 | 42 | (13 | ) | 32 | 81 | 122 | ||||||||||||||||||||||||||
| Core equity (non-GAAP) |
$ | 1,045 | $ | 1,002 | $ | 976 | $ | 923 | $ | 920 | $ | 906 | $ | 927 | $ | 944 | $ | 953 | ||||||||||||||||||
| Shares outstanding at period end (in thousands) |
81,706 | 81,716 | 81,526 | 79,263 | 78,756 | 78,556 | 78,495 | 78,555 | 78,139 | |||||||||||||||||||||||||||
| GAAP equity per share |
$ | 14.54 | $ | 13.95 | $ | 12.88 | $ | 12.00 | $ | 12.22 | $ | 11.36 | $ | 12.22 | $ | 13.04 | $ | 13.76 | ||||||||||||||||||
(1) Excludes obligations of consolidated securitization entities, the residential resecuritization we engaged in during the third quarter of 2011, and the commercial securitization we engaged in during the fourth quarter of 2012.
| THE REDWOOD REVIEW 1ST QUARTER 2013
|
Table 3: Book Value and Financial Ratios | |||
|
|
Table 4: Yields and Profitability Ratios 1 ($ in thousands) | |||
| 2013 Q1 |
2012 Q4 (2) |
2012 Q3 |
2012 Q2 |
2012 Q1 |
2011 Q4 |
2011 Q3 |
2011 Q2 |
2011 Q1 |
Twelve Months 2012 |
Twelve Months 2011 |
||||||||||||||||||||||||||||||||||
| Interest income |
$ | 53,524 | $ | 53,397 | $ | 59,723 | $ | 59,524 | $ | 58,740 | $ | 56,495 | $ | 53,396 | $ | 52,955 | $ | 54,333 | $ | 231,384 | $ | 217,179 | ||||||||||||||||||||||
| Average consolidated earning assets |
$ | 4,558,822 | $ | 4,851,671 | $ | 5,176,791 | $ | 5,144,382 | $ | 5,351,918 | $ | 5,419,721 | $ | 5,143,814 | $ | 5,080,343 | $ | 5,107,979 | $ | 5,130,552 | $ | 5,181,515 | ||||||||||||||||||||||
| Asset yield |
4.70% | 4.40% | 4.61% | 4.63% | 4.39% | 4.17% | 4.15% | 4.17% | 4.25% | 4.51% | 4.19% | |||||||||||||||||||||||||||||||||
| Interest expense |
$ | (18,354 | ) | $ | (32,971 | ) | $ | (28,285 | ) | $ | (28,881 | ) | $ | (30,657 | ) | $ | (29,115 | ) | $ | (24,317 | ) | $ | (23,633 | ) | $ | (21,972 | ) | $ | (120,794 | ) | $ | (99,037 | ) | |||||||||||
| Average consolidated interest-bearing liabilities |
$ | 3,494,668 | $ | 3,727,576 | $ | 4,166,828 | $ | 4,207,316 | $ | 4,423,167 | $ | 4,481,303 | $ | 4,105,088 | $ | 4,025,216 | $ | 3,977,010 | $ | 4,130,216 | $ | 4,148,421 | ||||||||||||||||||||||
| Cost of funds |
2.10% | 3.54% | 2.72% | 2.75% | 2.77% | 2.60% | 2.37% | 2.35% | 2.21% | 2.92% | 2.39% | |||||||||||||||||||||||||||||||||
| Asset yield |
4.70% | 4.40% | 4.61% | 4.63% | 4.39% | 4.17% | 4.15% | 4.17% | 4.25% | 4.51% | 4.19% | |||||||||||||||||||||||||||||||||
| Cost of funds |
(2.10% | ) | (3.54% | ) | (2.72% | ) | (2.75% | ) | (2.77% | ) | (2.60% | ) | (2.37% | ) | (2.35% | ) | (2.21% | ) | (2.92% | ) | (2.39% | ) | ||||||||||||||||||||||
| Interest rate spread |
2.60% | 0.86% | 1.90% | 1.88% | 1.62% | 1.57% | 1.78% | 1.82% | 2.04% | 1.59% | 1.80% | |||||||||||||||||||||||||||||||||
| Net interest income |
$ | 35,170 | $ | 20,426 | $ | 31,438 | $ | 30,643 | $ | 28,083 | $ | 27,380 | $ | 29,079 | $ | 29,322 | $ | 32,361 | $ | 110,590 | $ | 118,142 | ||||||||||||||||||||||
| Average consolidated earning assets |
$ | 4,558,822 | $ | 4,851,671 | $ | 5,176,791 | $ | 5,144,382 | $ | 5,351,918 | $ | 5,419,721 | $ | 5,143,814 | $ | 5,080,343 | $ | 5,107,979 | $ | 5,130,552 | $ | 5,181,515 | ||||||||||||||||||||||
| Net interest margin |
3.09% | 1.68% | 2.43% | 2.38% | 2.10% | 2.02% | 2.26% | 2.31% | 2.53% | 2.16% | 2.28% | |||||||||||||||||||||||||||||||||
| Net interest income |
$ | 35,170 | $ | 20,426 | $ | 31,438 | $ | 30,643 | $ | 28,083 | $ | 27,380 | $ | 29,079 | $ | 29,322 | $ | 32,361 | $ | 110,590 | $ | 118,142 | ||||||||||||||||||||||
| Net interest income / average core equity |
13.80% | 8.26% | 13.34% | 13.30% | 12.29% | 12.05% | 12.63% | 12.55% | 13.42% | 11.74% | 12.68% | |||||||||||||||||||||||||||||||||
| Operating expenses |
$ | (19,597 | ) | $ | (18,370 | ) | $ | (17,102 | ) | $ | (15,164 | ) | $ | (14,634 | ) | $ | (12,574 | ) | $ | (11,507 | ) | $ | (12,087 | ) | $ | (11,514 | ) | $ | (65,270 | ) | $ | (47,682 | ) | |||||||||||
| Average total assets |
$ | 4,823,321 | $ | 5,090,253 | $ | 5,371,679 | $ | 5,307,961 | $ | 5,505,797 | $ | 5,577,206 | $ | 5,303,614 | $ | 5,263,529 | $ | 5,310,376 | $ | 5,318,442 | $ | 5,357,065 | ||||||||||||||||||||||
| Average total equity |
$ | 1,161,546 | $ | 1,088,565 | $ | 987,692 | $ | 945,805 | $ | 926,138 | $ | 912,051 | $ | 976,676 | $ | 1,035,063 | $ | 1,092,580 | $ | 987,329 | $ | 1,003,523 | ||||||||||||||||||||||
| Operating expenses / net interest income |
55.72% | 89.93% | 54.40% | 49.49% | 52.11% | 45.92% | 39.57% | 41.22% | 35.58% | 59.02% | 40.36% | |||||||||||||||||||||||||||||||||
| Operating expenses / average total assets |
1.63% | 1.44% | 1.27% | 1.14% | 1.06% | 0.90% | 0.87% | 0.92% | 0.87% | 1.23% | 0.89% | |||||||||||||||||||||||||||||||||
| Operating expenses / average total equity |
6.75% | 6.75% | 6.93% | 6.41% | 6.32% | 5.51% | 4.71% | 4.67% | 4.22% | 6.61% | 4.75% | |||||||||||||||||||||||||||||||||
| GAAP net income (loss) |
$ | 60,610 | $ | 42,078 | $ | 39,701 | $ | 19,528 | $ | 30,462 | $ | (2,558 | ) | $ | 1,297 | $ | 9,439 | $ | 18,165 | $ | 131,769 | $ | 26,343 | |||||||||||||||||||||
| GAAP net income (loss) / average total assets |
5.03% | 3.31% | 2.96% | 1.47% | 2.21% | (0.18% | ) | 0.10% | 0.72% | 1.37% | 2.48% | 0.49% | ||||||||||||||||||||||||||||||||
| GAAP net income (loss) / average equity (GAAP ROE) |
20.87% | 15.46% | 16.08% | 8.26% | 13.16% | (1.12% | ) | 0.53% | 3.65% | 6.65% | 13.35% | 2.63% | ||||||||||||||||||||||||||||||||
| GAAP net income (loss) / average core equity (adjusted ROE) |
23.79% | 17.03% | 16.84% | 8.48% | 13.33% | (1.13% | ) | 0.56% | 4.04% | 7.53% | 13.99% | 2.83% | ||||||||||||||||||||||||||||||||
| Average core equity (3) |
$ | 1,019,154 | $ | 988,564 | $ | 942,846 | $ | 921,663 | $ | 914,052 | $ | 908,915 | $ | 921,048 | $ | 934,205 | $ | 964,554 | $ | 941,912 | $ | 931,998 | ||||||||||||||||||||||
(1) All percentages in this table are shown on an annualized basis.
(2) Included in the net income for fourth quarter of 2012 is a net $4 million gain related to the deconsolidation of certain Acacia and Sequoia entities. Interest expense for the fourth quarter of 2012 includes accelerated recognition of $11 million of deferred hedging costs relating the Acacia entities upon the deconsolidation of these entities. Realized gains, net, includes $15 million of gains related to the deconsolidation of the certain Acacia and Sequoia entities.
(3) Core equity is a non-GAAP metric and is equal to GAAP equity excluding accumulated other comprehensive income.
| THE REDWOOD REVIEW 1ST QUARTER 2013
|
Table 4: Yields and Profitability Ratios |
49
| ||
|
|
Table 5: Average Balance Sheet ($ in thousands) | 50
| ||
| 2013 Q1 |
2012 Q4 |
2012 Q3 |
2012 Q2 |
2012 Q1 |
2011 Q4 |
2011 Q3 |
2011 Q2 |
2011 Q1 |
Twelve Months 2012 |
Twelve Months 2011 |
||||||||||||||||||||||||||||||||||
| Real estate assets at Redwood |
||||||||||||||||||||||||||||||||||||||||||||
| Commercial loans |
$ | 319,760 | $ | 296,990 | $ | 267,032 | $ | 199,440 | $ | 169,432 | $ | 123,367 | $ | 79,445 | $ | 59,545 | $ | 36,434 | $ | 233,490 | $ | 74,949 | ||||||||||||||||||||||
| Commercial loans - HFS |
49,061 | 6,886 | - | - | - | - | - | - | - | 1,731 | - | |||||||||||||||||||||||||||||||||
| Residential loans |
818,950 | 418,722 | 466,246 | 363,882 | 319,353 | 306,869 | 313,763 | 123,914 | 204,847 | 392,326 | 237,837 | |||||||||||||||||||||||||||||||||
| Senior residential securities |
||||||||||||||||||||||||||||||||||||||||||||
| Prime |
416,774 | 427,149 | 447,994 | 457,549 | 325,619 | 248,211 | 244,502 | 246,957 | 255,884 | 414,703 | 248,856 | |||||||||||||||||||||||||||||||||
| Non-prime |
235,583 | 243,336 | 236,006 | 262,084 | 280,970 | 280,066 | 283,043 | 283,784 | 307,253 | 255,512 | 288,447 | |||||||||||||||||||||||||||||||||
| Total senior residential securities |
652,357 | 670,485 | 684,000 | 719,633 | 606,589 | 528,277 | 527,545 | 530,741 | 563,137 | 670,215 | 537,303 | |||||||||||||||||||||||||||||||||
| Residential Re-REMIC securities |
99,769 | 99,088 | 99,890 | 105,281 | 87,001 | 74,560 | 41,598 | 30,447 | 32,648 | 97,824 | 44,919 | |||||||||||||||||||||||||||||||||
| Subordinate residential securities |
||||||||||||||||||||||||||||||||||||||||||||
| Prime |
218,477 | 153,223 | 118,549 | 104,078 | 81,253 | 69,477 | 72,199 | 63,141 | 53,046 | 114,394 | 64,532 | |||||||||||||||||||||||||||||||||
| Non-prime |
2,064 | 3,783 | 6,669 | 8,325 | 9,721 | 11,433 | 10,885 | 11,183 | 12,140 | 7,114 | 11,407 | |||||||||||||||||||||||||||||||||
| Total subordinate residential securities |
220,541 | 157,006 | 125,218 | 112,403 | 90,974 | 80,910 | 83,084 | 74,324 | 65,186 | 121,508 | 75,939 | |||||||||||||||||||||||||||||||||
| Commercial subordinate securities |
766 | 2,154 | 4,047 | 3,980 | 3,946 | 4,272 | 4,720 | 5,200 | 6,288 | 3,530 | 5,114 | |||||||||||||||||||||||||||||||||
| CDO |
- | 4 | 14 | 14 | 762 | 960 | 1,247 | 1,297 | 1,252 | 198 | 1,188 | |||||||||||||||||||||||||||||||||
| Total real estate assets at Redwood |
2,161,204 | 1,651,335 | 1,646,447 | 1,504,633 | 1,278,057 | 1,119,215 | 1,051,402 | 825,468 | 909,792 | 1,520,822 | 977,249 | |||||||||||||||||||||||||||||||||
| Earning assets at Acacia |
- | 171,650 | 270,891 | 262,959 | 252,907 | 255,801 | 285,985 | 315,039 | 347,786 | 239,502 | 293,677 | |||||||||||||||||||||||||||||||||
| Earning assets at Consolidated Sequoia |
2,177,315 | 2,751,130 | 3,128,076 | 3,258,137 | 3,597,081 | 3,838,327 | 3,600,122 | 3,684,680 | 3,576,778 | 3,182,273 | 3,675,488 | |||||||||||||||||||||||||||||||||
| Earning assets at the Fund (1) |
- | - | - | - | - | - | - | 4,948 | 22,280 | - | 6,727 | |||||||||||||||||||||||||||||||||
| Total earning assets at Other Consolidated Entities |
2,177,315 | 2,922,780 | 3,398,967 | 3,521,096 | 3,849,988 | 4,094,128 | 3,886,107 | 4,004,667 | 3,946,844 | 3,421,775 | 3,975,892 | |||||||||||||||||||||||||||||||||
| Cash and cash equivalents |
77,911 | 177,555 | 86,531 | 94,511 | 211,786 | 203,242 | 150,677 | 149,350 | 123,317 | 142,538 | 156,849 | |||||||||||||||||||||||||||||||||
| Earning assets |
4,416,430 | 4,751,670 | 5,131,945 | 5,120,240 | 5,339,831 | 5,416,585 | 5,088,186 | 4,979,485 | 4,979,953 | 5,085,135 | 5,109,990 | |||||||||||||||||||||||||||||||||
| Balance sheet mark-to-market adjustments |
142,392 | 100,001 | 44,846 | 24,142 | 12,087 | 3,136 | 55,628 | 100,858 | 128,026 | 45,417 | 71,525 | |||||||||||||||||||||||||||||||||
| Earning assets - reported value |
4,558,822 | 4,851,671 | 5,176,791 | 5,144,382 | 5,351,918 | 5,419,721 | 5,143,814 | 5,080,343 | 5,107,979 | 5,130,552 | 5,181,515 | |||||||||||||||||||||||||||||||||
| Other assets |
264,499 | 238,582 | 194,888 | 163,579 | 153,879 | 157,485 | 159,800 | 183,186 | 202,397 | 187,890 | 175,550 | |||||||||||||||||||||||||||||||||
| Total assets |
$ | 4,823,321 | $ | 5,090,253 | $ | 5,371,679 | $ | 5,307,961 | $ | 5,505,797 | $ | 5,577,206 | $ | 5,303,614 | $ | 5,263,529 | $ | 5,310,376 | $ | 5,318,442 | $ | 5,357,065 | ||||||||||||||||||||||
| Short-term debt |
$ | 854,238 | $ | 539,579 | $ | 570,775 | $ | 474,053 | $ | 362,107 | $ | 157,992 | $ | 18,116 | $ | 1,797 | $ | 47,976 | $ | 487,003 | $ | 56,667 | ||||||||||||||||||||||
| Secured borrowings |
5,734 | 3,052 | - | - | - | - | - | - | - | 767 | - | |||||||||||||||||||||||||||||||||
| Consolidated Sequoia ABS issued |
2,099,041 | 2,661,564 | 3,039,273 | 3,166,476 | 3,504,155 | 3,738,132 | 3,510,089 | 3,589,286 | 3,487,214 | 3,091,542 | 3,581,673 | |||||||||||||||||||||||||||||||||
| Resecuritization ABS issued - Residential |
153,487 | 168,634 | 182,702 | 196,837 | 210,360 | 222,652 | 180,769 | - | - | 189,557 | 101,684 | |||||||||||||||||||||||||||||||||
| Securitization ABS issued - Commercial |
163,409 | 61,830 | - | - | - | - | - | - | - | 15,542 | - | |||||||||||||||||||||||||||||||||
| Acacia ABS issued |
- | 154,617 | 235,789 | 231,673 | 208,281 | 224,273 | 257,872 | 295,902 | 303,601 | 207,522 | 270,160 | |||||||||||||||||||||||||||||||||
| Other liabilities |
167,107 | 274,112 | 217,159 | 154,840 | 156,492 | 183,852 | 221,592 | 200,708 | 232,062 | 200,897 | 202,272 | |||||||||||||||||||||||||||||||||
| Convertible Debt |
80,447 | - | - | - | - | - | - | - | - | - | - | |||||||||||||||||||||||||||||||||
| Long-term debt |
138,312 | 138,300 | 138,289 | 138,277 | 138,264 | 138,254 | 138,242 | 138,231 | 138,219 | 138,283 | 138,237 | |||||||||||||||||||||||||||||||||
| Total liabilities |
3,661,775 | 4,001,688 | 4,383,987 | 4,362,156 | 4,579,659 | 4,665,155 | 4,326,680 | 4,225,924 | 4,209,072 | 4,331,113 | 4,350,693 | |||||||||||||||||||||||||||||||||
| Noncontrolling interest |
- | - | - | - | - | - | 258 | 2,542 | 8,724 | - | 2,849 | |||||||||||||||||||||||||||||||||
| Core equity (2) |
1,019,154 | 988,564 | 942,846 | 921,663 | 914,052 | 908,915 | 921,048 | 934,205 | 964,554 | 941,912 | 931,998 | |||||||||||||||||||||||||||||||||
| Accumulated other comprehensive income |
142,392 | 100,001 | 44,846 | 24,142 | 12,086 | 3,136 | 55,628 | 100,858 | 128,026 | 45,417 | 71,525 | |||||||||||||||||||||||||||||||||
| Total equity
|
1,161,546 | 1,088,565 | 987,692 | 945,805 | 926,138 | 912,051 | 976,676 | 1,035,063 | 1,092,580 | 987,329 | 1,003,523 | |||||||||||||||||||||||||||||||||
| Total liabilities and equity |
$ | 4,823,321 | $ | 5,090,253 | $ | 5,371,679 | $ | 5,307,961 | $ | 5,505,797 | $ | 5,577,206 | $ | 5,303,614 | $ | 5,263,529 | $ | 5,310,376 | $ | 5,318,442 | $ | 5,357,065 | ||||||||||||||||||||||
(1) Refers to the Redwood Opportunity Fund, which liquidated in the the third quarter of 2011.
(2) Core equity is a non-GAAP metric and is equal to GAAP equity excluding accumulated other comprehensive income.
| THE REDWOOD REVIEW 1ST QUARTER 2013
|
Table 5: Average Balance Sheet | |||
|
|
Table 6: Balances & Yields by Securities Portfolio at Redwood1 ($ in thousands) | |||
|
2013 Q1 |
2012 Q4 |
2012 Q3 |
2012 Q2 |
2012 Q1 |
2011 Q4 |
2013 Q1 |
2012 Q4 |
2012 Q3 |
2012 Q2 |
2012 Q1 |
2011 Q4 |
|||||||||||||||||||||||||||||||||||||||||
| Residential Prime Senior |
|
Residential Non-Prime Subordinate |
|
|||||||||||||||||||||||||||||||||||||||||||||||||
| Principal balance |
$ | 460,273 | $ | 485,033 | $ | 517,737 | $ | 540,032 | $ | 490,141 | $ | 341,780 | Principal balance |
$ | 19,869 | $ | 20,194 | $ | 30,221 | $ | 33,194 | $ | 34,432 | $ | 41,978 | |||||||||||||||||||||||||||
| Unamortized discount |
(48,893 | ) | (53,601 | ) | (59,832 | ) | (52,686 | ) | (57,193 | ) | (58,424 | ) | Unamortized discount |
(11,993 | ) | (15,666 | ) | (19,309 | ) | (19,650 | ) | (19,406 | ) | (21,479 | ) | |||||||||||||||||||||||||||
| Credit reserve |
(28,326 | ) | (26,100 | ) | (22,657 | ) | (34,990 | ) | (31,011 | ) | (27,806 | ) | Credit reserve |
(5,829 | ) | (2,433 | ) | (4,582 | ) | (5,299 | ) | (6,566 | ) | (8,477 | ) | |||||||||||||||||||||||||||
| Unrealized gains, net |
64,260 | 61,191 | 55,161 | 38,446 | 34,846 | 22,690 | Unrealized (losses) gains, net |
394 | 226 | 225 | (275 | ) | (231 | ) | (739 | ) | ||||||||||||||||||||||||||||||||||||
| Interest-only securities |
55,289 | 10,409 | 6,301 | 16,301 | 21,865 | - | ||||||||||||||||||||||||||||||||||||||||||||||
| Fair value |
$ | 502,603 | $ | 476,932 | $ | 496,710 | $ | 507,103 | $ | 458,648 | $ | 278,240 | Fair value |
$ | 2,441 | $ | 2,321 | $ | 6,555 | $ | 7,970 | $ | 8,229 | $ | 11,283 | |||||||||||||||||||||||||||
| Average amortized cost |
$ | 416,775 | $ | 427,149 | $ | 447,994 | $ | 457,550 | $ | 325,619 | $ | 248,211 | Average amortized cost |
$ | 2,064 | $ | 3,783 | $ | 6,669 | $ | 8,325 | $ | 9,722 | $ | 11,432 | |||||||||||||||||||||||||||
| Interest income |
$ | 9,723 | $ | 9,113 | $ | 9,620 | $ | 10,180 | $ | 7,897 | $ | 6,651 | Interest income |
$ | 155 | $ | 266 | $ | 446 | $ | 426 | $ | 500 | $ | 519 | |||||||||||||||||||||||||||
| Annualized yield |
9.33% | 8.53% | 8.59% | 8.90% | 9.70% | 10.72% | Annualized yield |
30.04% | 28.13% | 26.75% | 20.47% | 20.57% | 18.16% | |||||||||||||||||||||||||||||||||||||||
| Residential Non-Prime Senior |
|
Commercial Subordinate |
|
|||||||||||||||||||||||||||||||||||||||||||||||||
| Principal balance |
$ | 268,926 | $ | 278,229 | $ | 287,877 | $ | 312,897 | $ | 329,181 | $ | 349,385 | Principal balance |
$ | - | $ | 29,331 | $ | 40,342 | $ | 42,602 | $ | 43,226 | $ | 50,499 | |||||||||||||||||||||||||||
| Unamortized discount |
(40,541 | ) | (42,842 | ) | (46,330 | ) | (60,341 | ) | (68,101 | ) | (75,661 | ) | Unamortized discount |
- | (3,362 | ) | (3,509 | ) | (5,532 | ) | (5,651 | ) | (3,554 | ) | ||||||||||||||||||||||||||||
| Credit reserve |
(18,079 | ) | (18,104 | ) | (17,046 | ) | (18,891 | ) | (15,829 | ) | (16,536 | ) | Credit reserve |
- | (23,916 | ) | (33,206 | ) | (33,013 | ) | (33,668 | ) | (43,012 | ) | ||||||||||||||||||||||||||||
| Unrealized (losses) gains, net |
30,118 | 27,983 | 15,370 | 8,342 | 10,027 | (1,464 | ) | Unrealized gains, net |
- | 12,016 | 3,992 | 1,704 | 1,931 | 1,512 | ||||||||||||||||||||||||||||||||||||||
| Interest-only securities |
21,582 | 22,134 | 22,941 | 22,963 | 19,676 | 20,608 | ||||||||||||||||||||||||||||||||||||||||||||||
| Fair value |
$ | 262,006 | $ | 267,400 | $ | 262,812 | $ | 264,970 | $ | 274,954 | $ | 276,332 | Fair value |
$ | - | $ | 14,069 | $ | 7,619 | $ | 5,761 | $ | 5,838 | $ | 5,445 | |||||||||||||||||||||||||||
| Average amortized cost |
$ | 235,583 | $ | 243,336 | $ | 236,006 | $ | 262,084 | $ | 280,970 | $ | 280,066 | Average amortized cost |
$ | 766 | $ | 2,154 | $ | 4,047 | $ | 3,980 | $ | 3,946 | $ | 4,272 | |||||||||||||||||||||||||||
| Interest income |
$ | 6,011 | $ | 6,248 | $ | 6,286 | $ | 7,264 | $ | 7,693 | $ | 8,224 | Interest income |
$ | 625 | $ | 230 | $ | 643 | $ | 605 | $ | 480 | $ | 377 | |||||||||||||||||||||||||||
| Annualized yield |
10.21% | 10.27% | 10.65% | 11.09% | 10.95% | 11.75% | Annualized yield |
326.37% | 42.71% | 63.55% | 60.80% | 48.65% | 35.33% | |||||||||||||||||||||||||||||||||||||||
| Residential Re-REMIC |
|
CDO Subordinate |
|
|||||||||||||||||||||||||||||||||||||||||||||||||
| Principal balance |
$ | 215,235 | $ | 215,863 | $ | 216,159 | $ | 236,470 | $ | 252,941 | $ | 220,697 | Principal balance |
$ | - | $ | - | $ | 10,778 | $ | 10,750 | $ | 10,719 | $ | 31,378 | |||||||||||||||||||||||||||
| Unamortized discount |
(64,547 | ) | (69,310 | ) | (61,123 | ) | (73,438 | ) | (81,817 | ) | (78,226 | ) | Unamortized discount |
- | - | (3,461 | ) | (3,461 | ) | (3,461 | ) | (19,701 | ) | |||||||||||||||||||||||||||||
| Credit reserve |
(50,406 | ) | (47,235 | ) | (56,158 | ) | (58,618 | ) | (63,702 | ) | (60,563 | ) | Credit reserve |
- | - | (7,303 | ) | (7,275 | ) | (7,244 | ) | (10,717 | ) | |||||||||||||||||||||||||||||
| Unrealized gains, net |
63,155 | 63,717 | 51,095 | 43,023 | 47,239 | 37,458 | Unrealized gains, net |
- | - | 50 | 50 | 50 | 50 | |||||||||||||||||||||||||||||||||||||||
| Fair value |
$ | 163,437 | $ | 163,035 | $ | 149,973 | $ | 147,437 | $ | 154,661 | $ | 119,366 | Fair value |
$ | - | $ | - | $ | 64 | $ | 64 | $ | 64 | $ | 1,010 | |||||||||||||||||||||||||||
| Average amortized cost |
$ | 99,769 | $ | 99,088 | $ | 99,890 | $ | 105,281 | $ | 87,001 | $ | 74,560 | Average amortized cost |
$ | - | $ | 4 | $ | 14 | $ | 14 | $ | 762 | $ | 959 | |||||||||||||||||||||||||||
| Interest income |
$ | 3,758 | $ | 3,385 | $ | 3,282 | $ | 3,184 | $ | 2,823 | $ | 2,473 | Interest income |
$ | - | $ | - | $ | 4 | $ | 4 | $ | 34 | $ | 42 | |||||||||||||||||||||||||||
| Annualized yield |
15.07% | 13.66% | 13.14% | 12.10% | 12.98% | 13.27% | Annualized yield |
N/A | N/A | 114.29% | 114.29% | 17.85% | 17.52% | |||||||||||||||||||||||||||||||||||||||
| Residential Prime Subordinate |
|
|||||||||||||||||||||||||||||||||||||||||||||||||||
| Principal balance |
$ | 428,588 | $ | 290,276 | $ | 259,124 | $ | 252,372 | $ | 247,667 | $ | 207,444 | ||||||||||||||||||||||||||||||||||||||||
| Unamortized discount |
(71,412 | ) | (33,930 | ) | (27,407 | ) | (30,757 | ) | (24,149 | ) | (14,217 | ) | ||||||||||||||||||||||||||||||||||||||||
| Credit reserve |
(83,148 | ) | (93,160 | ) | (99,209 | ) | (103,628 | ) | (118,510 | ) | (128,879 | ) | ||||||||||||||||||||||||||||||||||||||||
| Unrealized (losses) gains, net |
25,676 | 21,447 | 12,688 | 5,103 | 819 | (5,603 | ) | |||||||||||||||||||||||||||||||||||||||||||||
| Interest-only securities |
337 | 363 | 346 | 382 | 362 | 315 | ||||||||||||||||||||||||||||||||||||||||||||||
| Fair value |
$ | 300,041 | $ | 184,996 | $ | 145,542 | $ | 123,472 | $ | 106,189 | $ | 59,060 | ||||||||||||||||||||||||||||||||||||||||
| Average amortized cost |
$ | 218,477 | $ | 153,224 | $ | 118,549 | $ | 104,078 | $ | 81,253 | $ | 69,477 | ||||||||||||||||||||||||||||||||||||||||
| Interest income |
$ | 5,446 | $ | 4,562 | $ | 4,443 | $ | 4,158 | $ | 3,753 | $ | 3,752 | ||||||||||||||||||||||||||||||||||||||||
| Annualized yield |
9.97% | 11.91% | 14.99% | 15.98% | 18.48% | 21.60% | ||||||||||||||||||||||||||||||||||||||||||||||
(1) Annualized yields for AFS portfolios are based on average amortized cost. Cash flows from many of our subordinate securities can be volatile and in certain cases (e.g., when the fair value of certain securities are close to zero) any interest income earned can result in unusually high reported yields that are not sustainable and not necessarily meaningful.
| THE REDWOOD REVIEW 1ST QUARTER 2013
|
Table 6: Balances & Yields by Securities Portfolio at Redwood |
51
| ||
|
|
Table 7: Securities and Loans Portfolio Activity at Redwood ($ in thousands) | 52
| ||
|
2013 Q1 |
2012 Q4 |
2012 Q3 |
2012 Q2 |
2012 Q1 |
2011 Q4 |
2011 Q3 |
2013 Q1 |
2012 Q4 |
2012 Q3 |
2012 Q2 |
2012 Q1 |
2011 Q4 |
2011 Q3 |
|||||||||||||||||||||||||||||||||||||||||||||||
| Residential Prime Senior |
|
Commercial Subordinate |
| |||||||||||||||||||||||||||||||||||||||||||||||||||||||||
| Beginning fair value |
$ | 476,932 | $ | 496,710 | $ | 507,103 | $ | 458,648 | $ | 278,240 | $ | 276,925 | $ | 285,946 | Beginning fair value |
$ | 14,069 | $ | 7,619 | $ | 5,761 | $ | 5,838 | $ | 5,445 | $ | 5,887 | $ | 5,865 | |||||||||||||||||||||||||||||||
| Acquisitions |
51,208 | 6,708 | 16,913 | 94,702 | 193,837 | 20,373 | 2,433 | Acquisitions |
- | - | - | - | - | - | - | |||||||||||||||||||||||||||||||||||||||||||||
| Sales |
(8,257 | ) | (9,285 | ) | (18,160 | ) | (24,775 | ) | (20,954 | ) | - | - | Sales |
(2,031 | ) | (1,484 | ) | - | - | - | - | - | ||||||||||||||||||||||||||||||||||||||
| Effect of principal payments |
(23,840 | ) | (22,102 | ) | (21,983 | ) | (20,623 | ) | (10,550 | ) | (8,411 | ) | (9,235 | ) | Effect of principal payments |
- | - | - | - | - | - | - | ||||||||||||||||||||||||||||||||||||||
| Change in fair value, net |
6,560 | 4,901 | 12,837 | (849 | ) | 18,075 | (10,647 | ) | (2,219 | ) | Change in fair value, net (1) |
(12,038 | ) | 7,934 | 1,858 | (77 | ) | 393 | (442 | ) | 22 | |||||||||||||||||||||||||||||||||||||||
| Ending fair value |
$ | 502,603 | $ | 476,932 | $ | 496,710 | $ | 507,103 | $ | 458,648 | $ | 278,240 | $ | 276,925 | Ending fair value |
$ | - | $ | 14,069 | $ | 7,619 | $ | 5,761 | $ | 5,838 | $ | 5,445 | $ | 5,887 | |||||||||||||||||||||||||||||||
| Residential Non-Prime Senior |
|
CDO Subordinate |
| |||||||||||||||||||||||||||||||||||||||||||||||||||||||||
| Beginning fair value |
$ | 267,400 | $ | 262,812 | $ | 264,970 | $ | 274,954 | $ | 276,332 | $ | 298,917 | $ | 307,404 | Beginning fair value |
$ | - | $ | 64 | $ | 64 | $ | 64 | $ | 1,010 | $ | 1,010 | $ | 1,403 | |||||||||||||||||||||||||||||||
| Acquisitions |
- | (188 | ) | 20,850 | 13,783 | 19,521 | 1,299 | 1,202 | Acquisitions |
- | - | - | - | - | - | - | ||||||||||||||||||||||||||||||||||||||||||||
| Sales |
- | - | (23,004 | ) | (14,018 | ) | (25,408 | ) | - | - | Sales |
- | (259 | ) | - | - | (859 | ) | - | - | ||||||||||||||||||||||||||||||||||||||||
| Effect of principal payments |
(8,110 | ) | (7,797 | ) | (7,505 | ) | (8,607 | ) | (7,164 | ) | (7,880 | ) | (8,509 | ) | Effect of principal payments |
- | - | - | - | - | - | - | ||||||||||||||||||||||||||||||||||||||
| Change in fair value, net |
2,716 | 12,573 | 7,501 | (1,142 | ) | 11,673 | (16,004 | ) | (1,180 | ) | Change in fair value, net |
- | 195 | - | - | (87 | ) | - | (393 | ) | ||||||||||||||||||||||||||||||||||||||||
| Ending fair value |
$ | 262,006 | $ | 267,400 | $ | 262,812 | $ | 264,970 | $ | 274,954 | $ | 276,332 | $ | 298,917 | Ending fair value |
$ | - | $ | - | $ | 64 | $ | 64 | $ | 64 | $ | 1,010 | $ | 1,010 | |||||||||||||||||||||||||||||||
| Residential Re-REMIC |
|
Residential Loans |
| |||||||||||||||||||||||||||||||||||||||||||||||||||||||||
| Beginning fair value |
$ | 163,035 | $ | 149,973 | $ | 147,437 | $ | 154,661 | $ | 119,366 | $ | 113,100 | $ | 77,575 | Beginning carrying value |
$ | 562,658 | $ | 417,982 | $ | 256,077 | $ | 303,106 | $ | 395,237 | $ | 228,906 | $ | 205,301 | |||||||||||||||||||||||||||||||
| Acquisitions |
- | - | - | - | 26,135 | 14,800 | 36,888 | Acquisitions |
2,586,899 | 789,416 | 524,043 | 338,898 | 660,008 | 174,767 | 404,597 | |||||||||||||||||||||||||||||||||||||||||||||
| Sales |
- | - | (5,376 | ) | (2,983 | ) | (2,527 | ) | - | - | Sales |
(2,349,089 | ) | (665,078 | ) | (372,362 | ) | (381,808 | ) | (745,262 | ) | (235 | ) | - | ||||||||||||||||||||||||||||||||||||
| Effect of principal payments |
- | - | - | - | - | - | - | Transfers to Securitization Entities |
- | - | - | - | - | - | (376,226 | ) | ||||||||||||||||||||||||||||||||||||||||||||
| Change in fair value, net |
402 | 13,062 | 7,912 | (4,241 | ) | 11,687 | (8,534 | ) | (1,363 | ) | Principal repayments |
(3,286 | ) | (2,483 | ) | (4,842 | ) | (4,524 | ) | (6,970 | ) | (8,189 | ) | (5,115 | ) | |||||||||||||||||||||||||||||||||||
| Ending fair value |
$ | 163,437 | $ | 163,035 | $ | 149,973 | $ | 147,437 | $ | 154,661 | $ | 119,366 | $ | 113,100 | Transfers to REO |
- | - | - | - | - | - | - | ||||||||||||||||||||||||||||||||||||||
| Changes in fair value, net |
34,771 | 22,821 | 15,066 | 405 | 93 | (12 | ) | 349 | ||||||||||||||||||||||||||||||||||||||||||||||||||||
| Residential Prime Subordinate |
|
Ending carrying value |
$ | 831,953 | $ | 562,658 | $ | 417,982 | $ | 256,077 | $ | 303,106 | $ | 395,237 | $ | 228,906 | ||||||||||||||||||||||||||||||||||||||||||||
| Beginning fair value |
$ | 184,996 | $ | 145,542 | $ | 123,472 | $ | 106,189 | $ | 59,060 | $ | 70,606 | $ | 71,845 | ||||||||||||||||||||||||||||||||||||||||||||||
| Acquisitions |
114,728 | 35,097 | 18,576 | 17,267 | 44,543 | - | 3,491 | Commercial Loans |
| |||||||||||||||||||||||||||||||||||||||||||||||||||
| Sales |
- | - | - | - | - | - | - | Beginning carrying value |
$ | 313,010 | $ | 286,070 | $ | 246,783 | $ | 178,415 | $ | 157,726 | $ | 98,060 | $ | 71,168 | ||||||||||||||||||||||||||||||||||||||
| Effect of principal payments |
(4,002 | ) | (3,394 | ) | (3,072 | ) | (3,211 | ) | (2,386 | ) | (2,301 | ) | (1,995 | ) | Originations |
189,407 | 44,182 | 40,154 | 68,620 | 26,888 | 60,297 | 26,908 | ||||||||||||||||||||||||||||||||||||||
| Change in fair value, net |
4,319 | 7,751 | 6,566 | 3,227 | 4,972 | (9,245 | ) | (2,735 | ) | Sales |
(88,212 | ) | (15,000 | ) | - | - | - | - | - | |||||||||||||||||||||||||||||||||||||||||
| Ending fair value |
$ | 300,041 | $ | 184,996 | $ | 145,542 | $ | 123,472 | $ | 106,189 | $ | 59,060 | $ | 70,606 | Principal repayments |
(12,272 | ) | (95 | ) | (491 | ) | (87 | ) | (6,091 | ) | (59 | ) | (25 | ) | |||||||||||||||||||||||||||||||
| Provision for loan losses |
(685 | ) | (2,320 | ) | (506 | ) | (376 | ) | (274 | ) | (608 | ) | - | |||||||||||||||||||||||||||||||||||||||||||||||
| Residential Non-Prime Subordinate |
|
Discount/fee amortization |
190 | 173 | 130 | 211 | 166 | 36 | 9 | |||||||||||||||||||||||||||||||||||||||||||||||||||
| Beginning fair value |
$ | 2,321 | $ | 6,555 | $ | 7,970 | $ | 8,229 | $ | 11,283 | $ | 10,616 | $ | 11,036 | Ending carrying value |
$ | 401,438 | $ | 313,010 | $ | 286,070 | $ | 246,783 | $ | 178,415 | $ | 157,726 | $ | 98,060 | |||||||||||||||||||||||||||||||
| Acquisitions |
- | - | - | - | - | 1,582 | - | |||||||||||||||||||||||||||||||||||||||||||||||||||||
| Sales |
- | (4,193 | ) | (1,868 | ) | - | (3,149 | ) | - | - | ||||||||||||||||||||||||||||||||||||||||||||||||||
| Effect of principal payments |
(66 | ) | (75 | ) | (143 | ) | (260 | ) | (229 | ) | (364 | ) | (287 | ) | ||||||||||||||||||||||||||||||||||||||||||||||
| Change in fair value, net |
186 | 34 | 596 | 1 | 324 | (551 | ) | (133 | ) | |||||||||||||||||||||||||||||||||||||||||||||||||||
| Ending fair value |
$ | 2,441 | $ | 2,321 | $ | 6,555 | $ | 7,970 | $ | 8,229 | $ | 11,283 | $ | 10,616 | ||||||||||||||||||||||||||||||||||||||||||||||
(1) The change in fair value, net reflects the liquidation of our remaining commercial securities, resulting in an ending fair value of zero for this portfolio.
| THE REDWOOD REVIEW 1ST QUARTER 2013
|
Table 7: Securities and Loans Portfolio Activity at Redwood | |||
|
|
Table 8A: Residential Prime Securities at Redwood and Underlying Loan Characteristics1 ($ in thousands) | |||
| 2013 Q1 |
2012 Q4 |
2012 Q3 |
2012 Q2 |
2012 Q1 |
2011 Q4 |
2011 Q3 |
2011 Q2 |
|||||||||||||||||||||||||
| Senior AFS |
$ | 447,314 | $ | 466,523 | $ | 490,409 | $ | 490,802 | $ | 436,783 | $ | 278,240 | $ | 276,925 | $ | 285,946 | ||||||||||||||||
| Subordinate AFS |
299,600 | 184,528 | 145,096 | 123,005 | 105,788 | 58,717 | 70,278 | 71,543 | ||||||||||||||||||||||||
| Fair value |
55,730 | 10,877 | 6,747 | 16,768 | 22,266 | 343 | 328 | 302 | ||||||||||||||||||||||||
| Total Residential Prime Securities |
$ | 802,644 | $ | 661,928 | $ | 642,252 | $ | 630,575 | $ | 564,837 | $ | 337,300 | $ | 347,531 | $ | 357,791 | ||||||||||||||||
| Number of loans |
55,302 | 60,441 | 60,584 | 63,986 | 81,085 | 85,702 | 92,071 | 101,149 | ||||||||||||||||||||||||
| Total loan face |
$ | 26,555,772 | $ | 26,856,580 | $ | 26,183,495 | $ | 27,988,787 | $ | 30,222,071 | $ | 31,848,071 | $ | 34,816,750 | $ | 39,160,316 | ||||||||||||||||
| Average loan size |
$ | 480 | $ | 444 | $ | 432 | $ | 437 | $ | 373 | $ | 372 | $ | 378 | $ | 387 | ||||||||||||||||
| Year 2012 origination |
11% | 4% | 1% | 1% | 0% | 0% | 0% | 0% | ||||||||||||||||||||||||
| Year 2011 origination |
2% | 2% | 2% | 2% | 2% | 0% | 0% | 0% | ||||||||||||||||||||||||
| Year 2010 origination |
0% | 0% | 0% | 0% | 0% | 0% | 0% | 0% | ||||||||||||||||||||||||
| Year 2009 origination |
0% | 0% | 0% | 0% | 0% | 0% | 0% | 0% | ||||||||||||||||||||||||
| Year 2008 origination |
0% | 0% | 0% | 0% | 0% | 0% | 0% | 0% | ||||||||||||||||||||||||
| Year 2007 origination |
17% | 18% | 12% | 12% | 11% | 10% | 10% | 9% | ||||||||||||||||||||||||
| Year 2006 origination |
4% | 4% | 3% | 3% | 3% | 1% | 1% | 1% | ||||||||||||||||||||||||
| Year 2005 origination |
18% | 18% | 17% | 17% | 17% | 19% | 19% | 18% | ||||||||||||||||||||||||
| Year 2004 origination and earlier |
48% | 54% | 65% | 65% | 67% | 70% | 70% | 72% | ||||||||||||||||||||||||
| Geographic concentration |
||||||||||||||||||||||||||||||||
| Southern CA |
22% | 23% | 23% | 23% | 23% | 23% | 23% | 24% | ||||||||||||||||||||||||
| Northern CA |
22% | 21% | 21% | 21% | 21% | 21% | 21% | 21% | ||||||||||||||||||||||||
| New York |
7% | 7% | 7% | 7% | 7% | 6% | 6% | 6% | ||||||||||||||||||||||||
| Florida |
5% | 6% | 6% | 6% | 6% | 6% | 6% | 6% | ||||||||||||||||||||||||
| Virginia |
3% | 3% | 3% | 3% | 3% | 4% | 4% | 4% | ||||||||||||||||||||||||
| New Jersey |
3% | 3% | 3% | 3% | 3% | 3% | 3% | 3% | ||||||||||||||||||||||||
| Illinois |
3% | 3% | 3% | 3% | 3% | 3% | 3% | 3% | ||||||||||||||||||||||||
| Other states |
35% | 34% | 34% | 34% | 34% | 34% | 34% | 33% | ||||||||||||||||||||||||
| Wtd Avg Original LTV |
69% | 69% | 69% | 69% | 68% | 68% | 68% | 68% | ||||||||||||||||||||||||
| Original LTV: 0 - 50 |
10% | 10% | 11% | 11% | 12% | 12% | 12% | 13% | ||||||||||||||||||||||||
| Original LTV: 50.01 - 60 |
11% | 11% | 11% | 11% | 11% | 11% | 11% | 12% | ||||||||||||||||||||||||
| Original LTV: 60.01 - 70 |
23% | 22% | 23% | 23% | 23% | 23% | 23% | 23% | ||||||||||||||||||||||||
| Original LTV: 70.01 - 80 |
53% | 53% | 51% | 51% | 50% | 49% | 49% | 48% | ||||||||||||||||||||||||
| Original LTV: 80.01 - 90 |
2% | 3% | 3% | 3% | 3% | 3% | 3% | 3% | ||||||||||||||||||||||||
| Original LTV: 90.01 - 100 |
1% | 1% | 1% | 1% | 1% | 2% | 2% | 1% | ||||||||||||||||||||||||
| Unknown |
0% | 0% | 0% | 0% | 0% | 0% | 0% | 0% | ||||||||||||||||||||||||
| Wtd Avg Original FICO |
732 | 729 | 735 | 735 | 735 | 735 | 735 | 735 | ||||||||||||||||||||||||
| Original FICO: <= 680 |
10% | 11% | 11% | 11% | 11% | 11% | 11% | 11% | ||||||||||||||||||||||||
| Original FICO: 681 - 700 |
10% | 10% | 11% | 11% | 10% | 10% | 10% | 10% | ||||||||||||||||||||||||
| Original FICO: 701 - 720 |
13% | 14% | 14% | 14% | 14% | 14% | 14% | 14% | ||||||||||||||||||||||||
| Original FICO: 721 - 740 |
14% | 15% | 15% | 15% | 15% | 15% | 15% | 15% | ||||||||||||||||||||||||
| Original FICO: 741 - 760 |
15% | 16% | 16% | 16% | 16% | 16% | 16% | 16% | ||||||||||||||||||||||||
| Original FICO: 761 - 780 |
18% | 17% | 17% | 17% | 17% | 17% | 17% | 17% | ||||||||||||||||||||||||
| Original FICO: 781 - 800 |
15% | 13% | 12% | 12% | 12% | 12% | 12% | 12% | ||||||||||||||||||||||||
| Original FICO: >= 801 |
4% | 3% | 3% | 3% | 3% | 3% | 3% | 3% | ||||||||||||||||||||||||
| Original Unknown |
1% | 1% | 1% | 1% | 2% | 2% | 2% | 2% | ||||||||||||||||||||||||
| Conforming balance % (2) |
47% | 50% | 53% | 52% | 54% | 55% | 54% | 60% | ||||||||||||||||||||||||
| > $ 1 MM % |
11% | 10% | 9% | 9% | 9% | 8% | 8% | 8% | ||||||||||||||||||||||||
| 2nd Home % |
7% | 7% | 7% | 7% | 7% | 7% | 7% | 7% | ||||||||||||||||||||||||
| Investment Home % |
2% | 2% | 2% | 2% | 2% | 2% | 2% | 2% | ||||||||||||||||||||||||
| Purchase |
42% | 43% | 41% | 41% | 40% | 40% | 39% | 39% | ||||||||||||||||||||||||
| Cash Out Refi |
22% | 23% | 23% | 23% | 23% | 23% | 23% | 23% | ||||||||||||||||||||||||
| Rate-Term Refi |
36% | 34% | 36% | 36% | 36% | 36% | 37% | 37% | ||||||||||||||||||||||||
| Other |
0% | 0% | 0% | 0% | 1% | 1% | 1% | 1% | ||||||||||||||||||||||||
| Full Doc |
59% | 56% | 55% | 55% | 53% | 51% | 51% | 51% | ||||||||||||||||||||||||
| No Doc |
5% | 5% | 4% | 4% | 6% | 6% | 6% | 6% | ||||||||||||||||||||||||
| Other Doc (Lim, Red, Stated, etc) |
34% | 37% | 38% | 38% | 38% | 40% | 40% | 40% | ||||||||||||||||||||||||
| Unknown/Not Categorized |
2% | 2% | 3% | 3% | 3% | 3% | 3% | 3% | ||||||||||||||||||||||||
| Single Family |
88% | 88% | 88% | 88% | 88% | 89% | 89% | 89% | ||||||||||||||||||||||||
| Condo |
9% | 9% | 9% | 9% | 9% | 9% | 9% | 9% | ||||||||||||||||||||||||
| 2-4 Family |
2% | 2% | 2% | 2% | 2% | 1% | 1% | 1% | ||||||||||||||||||||||||
| Other
|
1% | 1% | 1% | 1% | 1% | 1% | 1% | 1% | ||||||||||||||||||||||||
(1) Only the loan groups providing direct cash flow to securities we own are included.
(2) The definition of a conforming loan has significantly changed over time. For Q3 2011 and subsequent periods, the conforming balance definition that went into effect on October 1, 2011 was used (which had a maximum loan balance of $625,500). For all periods prior to Q3 2011, the conforming balance definition available in June 2011 was used (which had a maximum loan balance of $729,750).
| THE REDWOOD REVIEW 1ST QUARTER 2013
|
Table 8A: Residential Prime Securities at Redwood and Underlying Loan Characteristics |
53
| ||
|
|
Table 8B: Residential Non-Prime Securities at Redwood and Underlying Loan Characteristics1 ($ in thousands) | 54 | ||
|
2013 Q1 |
2012 Q4 |
2012 Q3 |
2012 Q2 |
2012 Q1 |
2011 Q4 |
2011 Q3 |
2011 Q2 |
|||||||||||||||||||||||||
| Senior AFS |
$ | 240,424 | $ | 245,266 | $ | 239,871 | $ | 242,007 | $ | 255,279 | $ | 255,724 | $ | 278,161 | $ | 288,718 | ||||||||||||||||
| Subordinate AFS |
2,284 | 2,160 | 6,404 | 7,867 | 8,142 | 11,153 | 10,461 | 10,877 | ||||||||||||||||||||||||
| Fair value |
21,739 | 22,295 | 23,092 | 23,066 | 19,762 | 20,738 | 20,911 | 18,845 | ||||||||||||||||||||||||
| Total Residential Non-prime Securities |
$ | 264,447 | $ | 269,721 | $ | 269,367 | $ | 272,940 | $ | 283,183 | $ | 287,615 | $ | 309,533 | $ | 318,440 | ||||||||||||||||
| Number of loans |
25,510 | 26,514 | 33,775 | 34,815 | 35,452 | 54,717 | 54,538 | 55,830 | ||||||||||||||||||||||||
| Total loan face |
$ | 4,860,972 | $ | 5,112,513 | $ | 6,760,747 | $ | 7,019,443 | $ | 7,241,685 | $ | 11,730,410 | $ | 11,878,085 | $ | 12,250,760 | ||||||||||||||||
| Average loan size |
$ | 191 | $ | 193 | $ | 200 | $ | 202 | $ | 204 | $ | 214 | $ | 218 | $ | 219 | ||||||||||||||||
| Year 2008 origination |
0% | 0% | 0% | 0% | 0% | 0% | 0% | 0% | ||||||||||||||||||||||||
| Year 2007 origination |
0% | 0% | 0% | 0% | 0% | 0% | 0% | 0% | ||||||||||||||||||||||||
| Year 2006 origination |
2% | 1% | 1% | 1% | 1% | 14% | 14% | 15% | ||||||||||||||||||||||||
| Year 2005 origination |
61% | 61% | 54% | 54% | 54% | 50% | 51% | 50% | ||||||||||||||||||||||||
| Year 2004 origination and earlier |
37% | 38% | 45% | 45% | 45% | 36% | 35% | 35% | ||||||||||||||||||||||||
| Geographic concentration |
||||||||||||||||||||||||||||||||
| Southern CA |
23% | 23% | 22% | 22% | 22% | 21% | 21% | 21% | ||||||||||||||||||||||||
| Northern CA |
15% | 15% | 16% | 16% | 16% | 15% | 15% | 15% | ||||||||||||||||||||||||
| Florida |
7% | 7% | 8% | 8% | 9% | 9% | 9% | 9% | ||||||||||||||||||||||||
| New York |
5% | 5% | 6% | 6% | 5% | 5% | 5% | 5% | ||||||||||||||||||||||||
| Virginia |
2% | 2% | 2% | 2% | 2% | 3% | 3% | 3% | ||||||||||||||||||||||||
| New Jersey |
3% | 3% | 3% | 3% | 3% | 3% | 3% | 3% | ||||||||||||||||||||||||
| Illinois |
3% | 3% | 3% | 3% | 3% | 3% | 3% | 3% | ||||||||||||||||||||||||
| Other states |
42% | 42% | 40% | 40% | 40% | 41% | 41% | 41% | ||||||||||||||||||||||||
| Wtd Avg Original LTV |
72% | 72% | 73% | 72% | 72% | 73% | 73% | 73% | ||||||||||||||||||||||||
| Original LTV: 0 - 50 |
7% | 7% | 7% | 7% | 7% | 6% | 7% | 7% | ||||||||||||||||||||||||
| Original LTV: 50.01 - 60 |
9% | 9% | 9% | 9% | 9% | 8% | 8% | 8% | ||||||||||||||||||||||||
| Original LTV: 60.01 - 70 |
19% | 19% | 19% | 19% | 19% | 18% | 18% | 18% | ||||||||||||||||||||||||
| Original LTV: 70.01 - 80 |
57% | 57% | 57% | 57% | 57% | 58% | 58% | 58% | ||||||||||||||||||||||||
| Original LTV: 80.01 - 90 |
6% | 6% | 6% | 6% | 6% | 7% | 6% | 6% | ||||||||||||||||||||||||
| Original LTV: 90.01 - 100 |
2% | 2% | 2% | 2% | 2% | 3% | 3% | 3% | ||||||||||||||||||||||||
| Unknown |
0% | 0% | 0% | 0% | 0% | 0% | 0% | 0% | ||||||||||||||||||||||||
| Wtd Avg Original FICO |
692 | 693 | 713 | 713 | 714 | 710 | 710 | 710 | ||||||||||||||||||||||||
| Original FICO: < = 680 |
24% | 24% | 25% | 25% | 25% | 27% | 27% | 27% | ||||||||||||||||||||||||
| Original FICO: 681 - 700 |
14% | 13% | 14% | 14% | 14% | 14% | 14% | 14% | ||||||||||||||||||||||||
| Original FICO: 701 - 720 |
15% | 15% | 15% | 15% | 15% | 14% | 14% | 14% | ||||||||||||||||||||||||
| Original FICO: 721 - 740 |
13% | 13% | 12% | 12% | 12% | 12% | 12% | 12% | ||||||||||||||||||||||||
| Original FICO: 741 - 760 |
12% | 12% | 12% | 12% | 12% | 12% | 12% | 12% | ||||||||||||||||||||||||
| Original FICO: 761 - 780 |
10% | 11% | 10% | 10% | 10% | 10% | 10% | 10% | ||||||||||||||||||||||||
| Original FICO: 781 - 800 |
7% | 7% | 7% | 7% | 7% | 7% | 7% | 7% | ||||||||||||||||||||||||
| Original FICO: > = 801 |
2% | 2% | 2% | 2% | 2% | 2% | 2% | 2% | ||||||||||||||||||||||||
| Original Unknown |
3% | 3% | 3% | 3% | 3% | 2% | 2% | 2% | ||||||||||||||||||||||||
| Conforming balance % (2) |
90% | 89% | 86% | 86% | 86% | 83% | 82% | 86% | ||||||||||||||||||||||||
| > $1 MM % |
2% | 2% | 2% | 2% | 3% | 3% | 3% | 3% | ||||||||||||||||||||||||
| 2nd Home % |
3% | 3% | 4% | 4% | 4% | 4% | 4% | 4% | ||||||||||||||||||||||||
| Investment Home % |
16% | 16% | 15% | 15% | 15% | 14% | 14% | 13% | ||||||||||||||||||||||||
| Purchase |
40% | 40% | 41% | 42% | 41% | 41% | 41% | 41% | ||||||||||||||||||||||||
| Cash Out Refi |
44% | 44% | 43% | 42% | 42% | 42% | 42% | 42% | ||||||||||||||||||||||||
| Rate-Term Refi |
15% | 15% | 15% | 15% | 16% | 16% | 16% | 16% | ||||||||||||||||||||||||
| Other |
1% | 1% | 1% | 1% | 1% | 1% | 1% | 1% | ||||||||||||||||||||||||
| Full Doc |
39% | 39% | 39% | 39% | 38% | 38% | 39% | 38% | ||||||||||||||||||||||||
| No Doc |
6% | 6% | 6% | 6% | 6% | 5% | 4% | 4% | ||||||||||||||||||||||||
| Other Doc (Lim, Red, Stated, etc) |
54% | 53% | 53% | 53% | 54% | 56% | 56% | 56% | ||||||||||||||||||||||||
| Unknown/Not Categorized |
1% | 2% | 2% | 2% | 2% | 1% | 1% | 2% | ||||||||||||||||||||||||
| Single Family |
84% | 84% | 84% | 84% | 84% | 84% | 84% | 84% | ||||||||||||||||||||||||
| 2-4 Family |
9% | 9% | 8% | 8% | 8% | 8% | 8% | 8% | ||||||||||||||||||||||||
| Condo |
7% | 7% | 8% | 8% | 8% | 8% | 8% | 8% | ||||||||||||||||||||||||
| Other
|
0% | 0% | 0% | 0% | 0% | 0% | 0% | 0% | ||||||||||||||||||||||||
(1) Only the loan groups providing direct cash flow to securities we own are included.
(2) The definition of a conforming loan has significantly changed over time. For Q3 2011 and subsequent periods, the conforming balance definition that went into effect on October 1, 2011 was used (which had a maximum loan balance of $625,500). For all periods prior to Q3 2011, the conforming balance definition available in June 2011 was used (which had a maximum loan balance of $729,750).
| THE REDWOOD REVIEW 1ST QUARTER 2013
|
Table 8B: Residential Non-Prime Securities at Redwood and Underlying Loan Characteristics | |||
|
|
Table 9: Residential Real Estate Loan Characteristics1 ($ in thousands) | |||
| 2013 Q1 |
2012 Q4 |
2012 Q3 |
2012 Q2 |
2012 Q1 |
2011 Q4 |
2011 Q3 |
2011 Q2 |
|||||||||||||||||||||||||
| Residential loans principal balance |
$ | 2,959,037 | $ | 2,820,885 | $ | 3,502,775 | $ | 3,493,755 | $ | 3,682,379 | $ | 4,231,324 | $ | 4,190,773 | $ | 3,892,161 | ||||||||||||||||
| Number of loans |
8,253 | 8,223 | 10,697 | 10,773 | 11,079 | 12,490 | 12,526 | 12,258 | ||||||||||||||||||||||||
| Average loan balance |
$ | 359 | $ | 343 | $ | 327 | $ | 324 | $ | 332 | $ | 339 | $ | 335 | $ | 318 | ||||||||||||||||
| Adjustable % |
62% | 66% | 73% | 75% | 73% | 72% | 74% | 81% | ||||||||||||||||||||||||
| Hybrid % |
3% | 5% | 6% | 8% | 9% | 9% | 10% | 10% | ||||||||||||||||||||||||
| Fixed % |
35% | 29% | 21% | 18% | 18% | 19% | 16% | 9% | ||||||||||||||||||||||||
| Amortizing % |
38% | 32% | 23% | 20% | 21% | 22% | 19% | 11% | ||||||||||||||||||||||||
| Interest-only % |
62% | 68% | 77% | 80% | 79% | 78% | 81% | 89% | ||||||||||||||||||||||||
| Northern California |
14% | 14% | 15% | 15% | 16% | 14% | 14% | 12% | ||||||||||||||||||||||||
| Florida |
9% | 10% | 11% | 12% | 11% | 11% | 12% | 12% | ||||||||||||||||||||||||
| Southern California |
14% | 12% | 11% | 11% | 12% | 12% | 12% | 12% | ||||||||||||||||||||||||
| New York |
7% | 8% | 7% | 7% | 7% | 7% | 8% | 8% | ||||||||||||||||||||||||
| Texas |
5% | 5% | 6% | 5% | 5% | 6% | 5% | 5% | ||||||||||||||||||||||||
| Georgia |
4% | 4% | 5% | 4% | 4% | 4% | 5% | 5% | ||||||||||||||||||||||||
| New Jersey |
3% | 3% | 4% | 4% | 4% | 4% | 4% | 4% | ||||||||||||||||||||||||
| Colorado |
3% | 4% | 4% | 3% | 3% | 3% | 3% | 3% | ||||||||||||||||||||||||
| Virginia |
3% | 3% | 3% | 3% | 3% | 3% | 2% | 3% | ||||||||||||||||||||||||
| Arizona |
2% | 2% | 2% | 2% | 2% | 2% | 2% | 2% | ||||||||||||||||||||||||
| Illinois |
3% | 3% | 2% | 2% | 2% | 3% | 2% | 2% | ||||||||||||||||||||||||
| Other states |
33% | 33% | 30% | 30% | 31% | 31% | 31% | 32% | ||||||||||||||||||||||||
| Year 2013 origination |
27% | 0% | 0% | 0% | 0% | 0% | 0% | 0% | ||||||||||||||||||||||||
| Year 2012 origination |
1% | 19% | 11% | 6% | 4% | 0% | 0% | 0% | ||||||||||||||||||||||||
| Year 2011 origination |
3% | 4% | 4% | 5% | 9% | 13% | 9% | 3% | ||||||||||||||||||||||||
| Year 2010 origination |
5% | 7% | 7% | 8% | 8% | 9% | 10% | 8% | ||||||||||||||||||||||||
| Year 2009 origination |
2% | 2% | 2% | 3% | 3% | 3% | 4% | 4% | ||||||||||||||||||||||||
| Year 2008 origination |
0% | 0% | 0% | 0% | 0% | 0% | 0% | 0% | ||||||||||||||||||||||||
| Year 2007 origination |
0% | < 1% | 2% | 2% | 2% | 2% | 2% | 2% | ||||||||||||||||||||||||
| Year 2006 origination |
5% | 6% | 5% | 5% | 5% | 4% | 4% | 5% | ||||||||||||||||||||||||
| Year 2005 origination |
2% | 3% | 4% | 4% | 3% | 3% | 3% | 3% | ||||||||||||||||||||||||
| Year 2004 origination or earlier |
55% | 59% | 65% | 68% | 66% | 66% | 68% | 75% | ||||||||||||||||||||||||
| Wtd Avg Original LTV |
65% | 65% | 66% | 66% | 66% | 66% | 66% | 66% | ||||||||||||||||||||||||
| Original LTV: 0 - 50 |
19% | 20% | 18% | 19% | 19% | 19% | 20% | 19% | ||||||||||||||||||||||||
| Original LTV: 50.01 - 60 |
15% | 14% | 12% | 13% | 13% | 13% | 13% | 13% | ||||||||||||||||||||||||
| Original LTV: 60.01 - 70 |
23% | 22% | 22% | 22% | 22% | 22% | 21% | 21% | ||||||||||||||||||||||||
| Original LTV: 70.01 - 80 |
38% | 38% | 42% | 41% | 41% | 40% | 40% | 40% | ||||||||||||||||||||||||
| Original LTV: 80.01 - 90 |
2% | 2% | 2% | 2% | 2% | 2% | 2% | 2% | ||||||||||||||||||||||||
| Original LTV: 90.01 - 100 |
3% | 4% | 4% | 4% | 4% | 4% | 4% | 5% | ||||||||||||||||||||||||
| Wtd Avg FICO |
746 | 744 | 740 | 739 | 740 | 740 | 739 | 736 | ||||||||||||||||||||||||
| FICO: < = 600 |
0% | < 1% | < 1% | < 1% | < 1% | < 1% | 1% | 1% | ||||||||||||||||||||||||
| FICO: 601 - 620 |
1% | < 1% | < 1% | 1% | 1% | 1% | 1% | 1% | ||||||||||||||||||||||||
| FICO: 621 - 640 |
1% | 1% | 1% | 1% | 1% | 1% | 2% | 2% | ||||||||||||||||||||||||
| FICO: 641 - 660 |
3% | 3% | 3% | 3% | 3% | 3% | 3% | 3% | ||||||||||||||||||||||||
| FICO: 661 - 680 |
5% | 5% | 6% | 6% | 6% | 6% | 6% | 7% | ||||||||||||||||||||||||
| FICO: 681 - 700 |
7% | 8% | 9% | 10% | 9% | 9% | 9% | 10% | ||||||||||||||||||||||||
| FICO: 701 - 720 |
10% | 10% | 12% | 12% | 12% | 12% | 12% | 12% | ||||||||||||||||||||||||
| FICO: 721 - 740 |
12% | 12% | 12% | 13% | 12% | 12% | 12% | 13% | ||||||||||||||||||||||||
| FICO: 741 - 760 |
14% | 14% | 14% | 14% | 14% | 14% | 14% | 14% | ||||||||||||||||||||||||
| FICO: 761 - 780 |
21% | 19% | 18% | 18% | 18% | 19% | 18% | 18% | ||||||||||||||||||||||||
| FICO: 781 - 800 |
20% | 20% | 18% | 17% | 17% | 18% | 17% | 15% | ||||||||||||||||||||||||
| FICO: > = 801 |
6% | 6% | 5% | 5% | 6% | 5% | 5% | 4% | ||||||||||||||||||||||||
| Conforming balance % (2) |
35% | 37% | 42% | 43% | 42% | 41% | 42% | 49% | ||||||||||||||||||||||||
| % balance in loans > $1mm per loan |
19% | 20% | 19% | 20% | 22% | 22% | 22% | 20% | ||||||||||||||||||||||||
| 2nd home % |
9% | 10% | 10% | 11% | 10% | 11% | 11% | 11% | ||||||||||||||||||||||||
| Investment home % |
3% | 3% | 3% | 3% | 3% | 3% | 3% | 3% | ||||||||||||||||||||||||
| Purchase |
28% | 30% | 34% | 33% | 33% | 33% | 33% | 32% | ||||||||||||||||||||||||
| Cash out refinance |
25% | 26% | 28% | 28% | 28% | 28% | 29% | 31% | ||||||||||||||||||||||||
| Rate-term refinance |
45% | 42% | 37% | 37% | 38% | 38% | 37% | 36% | ||||||||||||||||||||||||
| Other
|
2% | 2% | 1% | 1% | 1% | 1% | 1% | 1% | ||||||||||||||||||||||||
(1) This table presents characteristics of residential loans held by consolidated Sequoia entities and residential loans held by Redwood and intended to be securitized by future Sequoia entities or sold to third parties.
(2) The definition of a conforming loan has significantly changed over time. For Q3 2011 and subsequent periods, the conforming balance definition that went into effect on October 1, 2011 was used (which had a maximum loan balance of $625,500). For all periods prior to Q3 2011, the conforming balance definition available in June 2011 was used (which had a maximum loan balance of $729,750).
| THE REDWOOD REVIEW 1ST QUARTER 2013
|
Table 9: Residential Real Estate Loan Characteristics |
55
| ||
|
|
Table 10: Commercial Loan Characteristics1 ($ in thousands) | 56
| ||
| 2013 Q1 |
2012 Q4 |
2012 Q3 |
2012 Q2 |
2012 Q1 |
2011 Q4 |
2011 Q3 |
2011 Q2 |
|||||||||||||||||||||||||
| Commercial loans principal balance |
$ | 409,248 | $ | 320,901 | $ | 291,595 | $ | 251,686 | $ | 182,803 | $ | 158,847 | $ | 158,846 | $ | 98,600 | ||||||||||||||||
| Number of loans |
48 | 36 | 31 | 27 | 19 | 15 | 16 | 12 | ||||||||||||||||||||||||
| Average loan balance |
$ | 8,526 | $ | 8,914 | $ | 9,406 | $ | 9,322 | $ | 9,621 | $ | 9,928 | $ | 9,928 | $ | 8,217 | ||||||||||||||||
| Fixed % |
88% | 88% | 87% | 94% | 92% | 91% | 91% | 100% | ||||||||||||||||||||||||
| Hybrid % |
12% | 12% | 13% | 6% | 8% | 9% | 9% | 0% | ||||||||||||||||||||||||
| Amortizing % |
32% | 12% | 10% | 16% | 16% | 19% | 19% | 14% | ||||||||||||||||||||||||
| Interest-only % |
68% | 88% | 90% | 84% | 84% | 81% | 81% | 86% | ||||||||||||||||||||||||
| California |
24% | 20% | 22% | 18% | 20% | 21% | 21% | 18% | ||||||||||||||||||||||||
| New York |
16% | 21% | 24% | 25% | 17% | 16% | 16% | 19% | ||||||||||||||||||||||||
| Tennessee |
11% | 3% | 4% | 4% | 0% | 0% | 0% | 0% | ||||||||||||||||||||||||
| Florida |
7% | 13% | 11% | 12% | 13% | 4% | 4% | 6% | ||||||||||||||||||||||||
| Michigan |
7% | 6% | 6% | 7% | 7% | 8% | 8% | 13% | ||||||||||||||||||||||||
| Texas |
6% | 5% | 5% | 6% | 5% | 2% | 2% | 4% | ||||||||||||||||||||||||
| Alabama |
6% | 3% | 3% | 4% | 0% | 0% | 0% | 0% | ||||||||||||||||||||||||
| Illinois |
5% | 10% | 11% | 13% | 18% | 21% | 21% | 12% | ||||||||||||||||||||||||
| Washington |
0% | 3% | 3% | 0% | 0% | 0% | 0% | 0% | ||||||||||||||||||||||||
| Other states |
18% | 16% | 11% | 11% | 20% | 28% | 28% | 28% | ||||||||||||||||||||||||
| Year 2013 origination |
27% | 0% | 0% | 0% | 0% | 0% | 0% | 0% | ||||||||||||||||||||||||
| Year 2012 origination |
39% | 53% | 48% | 38% | 15% | 0% | 0% | 0% | ||||||||||||||||||||||||
| Year 2011 origination |
30% | 38% | 42% | 50% | 68% | 81% | 81% | 69% | ||||||||||||||||||||||||
| Year 2010 origination |
4% | 10% | 10% | 12% | 17% | 19% | 19% | 31% | ||||||||||||||||||||||||
| Year 2004 origination |
0% | < 1% | < 1% | < 1% | < 1% | < 1% | < 1% | < 1% | ||||||||||||||||||||||||
| Office |
19% | 28% | 30% | 32% | 37% | 37% | 38% | |||||||||||||||||||||||||
| Multi-family |
41% | 28% | 28% | 22% | 23% | 14% | 14% | 14% | ||||||||||||||||||||||||
| Hospitality |
19% | 20% | 20% | 21% | 18% | 20% | 20% | 18% | ||||||||||||||||||||||||
| Retail |
12% | 18% | 16% | 18% | 25% | 29% | 29% | 30% | ||||||||||||||||||||||||
| Self-storage |
8% | 6% | 6% | 7% | 2% | 0% | 0% | 0% | ||||||||||||||||||||||||
|
Industrial
|
1% | 0% | 0% | 0% | 0% | 0% | 0% | 0% | ||||||||||||||||||||||||
(1) This table presents characteristics of commercial loans held-for-investment by Redwood and commercial loans held by Redwood intended to be sold to third parties.
| THE REDWOOD REVIEW 1ST QUARTER 2013
|
Table 10: Commercial Loan Characteristics | |||
REDWOOD TRUST CORPORATE INFORMATION
For more information about Redwood Trust, please visit our website at: www.redwoodtrust.com
| THE REDWOOD REVIEW | 1ST QUARTER 2013 | 57 |