
Exhibit 99.2
|
|
||
|
TABLE OF CONTENTS
|
| Introduction |
4 | |||
| Shareholder Letter |
5 | |||
| Quarterly Overview |
8 | |||
| Financial Insights |
15 | |||
| u Balance Sheet |
15 | |||
| u GAAP Income |
22 | |||
| u Taxable Income and Dividends |
26 | |||
| Business Segments |
28 | |||
| u Residential Mortgage Banking |
29 | |||
| u Residential Investments |
30 | |||
| u Commercial Mortgage Banking and Investments |
32 | |||
| Appendix |
35 | |||
| Redwood’s Business Strategy |
36 | |||
| Glossary |
39 | |||
| Financial Tables |
47 | |||
| THE REDWOOD REVIEW | 4TH QUARTER 2013 | 1 |
|
| ||
|
CAUTIONARY STATEMENT
|
This Redwood Review contains forward-looking statements within the meaning of the safe harbor provisions of the Private Securities Litigation Reform Act of 1995. Forward-looking statements involve numerous risks and uncertainties. Our actual results may differ from our expectations, estimates, and projections and, consequently, you should not rely on these forward-looking statements as predictions of future events. Forward-looking statements are not historical in nature and can be identified by words such as “anticipate,” “estimate,” “will,” “should,” “expect,” “believe,” “intend,” “seek,” “plan,” and similar expressions or their negative forms, or by references to strategy, plans, goals, or intentions. These forward-looking statements are subject to risks and uncertainties, including, among other things, those described in our most recent Annual Report on Form 10-K under the caption “Risk Factors.” Other risks, uncertainties, and factors that could cause actual results to differ materially from those projected are described below and may be described from time to time in reports we file with the Securities and Exchange Commission, including reports on Forms 10-K, 10-Q, and 8-K. We undertake no obligation to update or revise forward-looking statements, whether as a result of new information, future events, or otherwise.
Statements regarding the following subjects, among others, are forward-looking by their nature: (i) statements we make regarding Redwood’s future business strategy and strategic focus, including statements relating to our confidence in our overall market position, strategy and long-term prospects, and our belief in the long-term efficiency of private label securitization as a form of mortgage financing; (ii) statements we make regarding the outlook for our residential business, investing in prime mortgage credit risk and our positioning to pursue investments in conforming credit through potential risk-sharing arrangements (recourse and other types) with the GSEs; (iii) our belief that triple-A investors will return to the private label securitization market for prime quality loans when improved securitization structures and issuer best practices become more widely adopted by participants, and our expectation that subordination levels will decline over time, reflecting the performance of the underlying collateral, and that this will improve the economics for the issuers such as Redwood; (iv) statements we make regarding GSE reform legislation, including that the private sector will become the provider of first-loss credit risk, ahead of a government guarantee, and the opportunity this presents for private credit risk investors with loan acquisition platforms, such as us; (v) our expectations regarding our loan sale distribution via whole loan sales and securitizations, our expectation to complete a securitization late in the first quarter or early in the second quarter of 2014 and our outlook for residential loan sale profit margins, including our statement that we believe we can generate attractive loan sale profit margins within our long-term target range of 25 to 50 basis points; (vi) statements relating to acquiring residential mortgage loans in the future that we have identified for purchase, including the amount of such loans that we identified for purchase at December 31, 2013; (vii) statements relating to our expectation to increase the number of sellers we acquire loans from; (viii) statements relating to the volume of jumbo and conforming residential mortgage loans expected to be available for purchase during 2014, including that we expect the decline in our jumbo loan acquisition volume from 2013 to be less than the decline projected for the industry as a whole, and our goal to ramp up to a run rate of $1 billion per month of conforming loan acquisitions by the end of 2014; (ix) our outlook and expectations relating to our commercial real estate platform, including statements regarding our expectations regarding improvement in underlying commercial real estate fundamentals and potential refinancing opportunities for lenders with established commercial loan origination platforms such as Redwood, our plans to expand our commercial platform in 2014 by adding originators, (x) our expectations regarding the volume of senior and mezzanine commercial loans that we will originate in 2014, and our expectation that the amount of capital we had previously allocated to fund commercial mortgage banking and investment activities should remain adequate for us to continue growing this platform, and statements relating to the possibility of raising
| 2 | THE REDWOOD REVIEW | 4TH QUARTER 2013 |
|
|
||
|
CAUTIONARY STATEMENT
|
dedicated capital for our commercial platform; (xi) statements relating to our estimate of our investment capacity (including that we estimate our investment capacity at December 31, 2013 to be approximately $130 million) and our statement that we believe this level of investment capacity and liquidity should be sufficient to fund our business and investment objectives for most or all of 2014; and (xii) statements regarding our expectations and estimates relating to the characterization for income tax purposes of our dividend distributions, our expectations and estimates relating to tax accounting, tax liabilities and tax savings, and GAAP tax provisions, our estimates of REIT taxable income and TRS taxable income, and our anticipation of additional credit losses for tax purposes in future periods (and, in particular, our statement that, for tax purposes, we expect an additional $59 million of tax credit losses on residential securities we currently own to be realized over an estimated three- to five-year period).
Important factors, among others, that may affect our actual results include: general economic trends, the performance of the housing, commercial real estate, mortgage, credit, and broader financial markets, and their effects on the prices of earning assets and the credit status of borrowers; federal and state legislative and regulatory developments, and the actions of governmental authorities, including those affecting the mortgage industry or our business; developments related to the fixed income and mortgage finance markets and the Federal Reserve’s statements regarding its future open market activity and monetary policy; our exposure to credit risk and the timing of credit losses within our portfolio; the concentration of the credit risks we are exposed to, including due to the structure of assets we hold and the geographical concentration of real estate underlying assets we own; our exposure to adjustable-rate mortgage loans; the efficacy and expense of our efforts to manage or hedge credit risk, interest rate risk, and other financial and operational risks; changes in credit ratings on assets we own and changes in the rating agencies’ credit rating methodologies; changes in interest rates; changes in mortgage prepayment rates; the availability of assets for purchase at attractive prices and our ability to reinvest cash we hold; changes in the values of assets we own; changes in liquidity in the market for real estate securities and loans; our ability to finance the acquisition of real estate-related assets with short-term debt; the ability of counterparties to satisfy their obligations to us; our involvement in securitization transactions, the profitability of those transactions, and the risks we are exposed to in engaging in securitization transactions; exposure to claims and litigation, including litigation arising from our involvement in securitization transactions; whether we have sufficient liquid assets to meet short-term needs; our ability to successfully compete and retain or attract key personnel; our ability to adapt our business model and strategies to changing circumstances; changes in our investment, financing, and hedging strategies and new risks we may be exposed to if we expand our business activities; exposure to environmental liabilities; our failure to comply with applicable laws and regulations; our failure to maintain appropriate internal controls over financial reporting and disclosure controls and procedures; the impact on our reputation that could result from our actions or omissions or from those of others; changes in accounting principles and tax rules; our ability to maintain our status as a REIT for tax purposes; limitations imposed on our business due to our REIT status and our status as exempt from registration under the Investment Company Act of 1940; decisions about raising, managing, and distributing capital; and other factors not presently identified.
This Redwood Review may contain statistics and other data that in some cases have been obtained from or compiled from information made available by servicers and other third-party service providers.
| THE REDWOOD REVIEW | 4TH QUARTER 2013 | 3 |
|
| ||
|
INTRODUCTION
|
Note to Readers:
We file annual reports (on Form 10-K) and quarterly reports (on Form 10-Q) with the Securities and Exchange Commission. These filings and our earnings press releases provide information about Redwood and our financial results in accordance with generally accepted accounting principles (GAAP). We urge you to review these documents, which are available through our website, www.redwoodtrust.com.
This document, called The Redwood Review, is an additional format for providing information about Redwood through a discussion of our GAAP financial results, as well as other metrics, such as taxable income. Supplemental information is also provided in the Financial Tables in this Review to facilitate more detailed understanding and analysis of Redwood. We may also provide non-GAAP financial measures in this Review. When we use non-GAAP financial measures it is because we believe that these figures provide additional insight into Redwood’s business. In each case in which we discuss a non-GAAP financial measure you will find an explanation of how it has been calculated, why we think the figure is important, and a reconciliation between the GAAP and non-GAAP figures.
References herein to “Redwood,” the “company,” “we,” “us,” and “our” include Redwood Trust, Inc. and its consolidated subsidiaries. References to “at Redwood” exclude all consolidated securitization entities (with the exception of the residential resecuritization we completed in the third quarter of 2011 and the commercial securitization we completed in the fourth quarter of 2012) in order to present our operations in the way management analyzes them. Note that because we round numbers in the tables to millions, except per share amounts, some numbers may not foot due to rounding. References to the “fourth quarter” refer to the quarter ending December 31, 2013, and references to the “third quarter” refer to the quarter ending September 30, 2013, unless otherwise specified.
We hope you find this Review helpful to your understanding of our business. We thank you for your input and suggestions, which have resulted in our changing the form and content of The Redwood Review over time.
|
Selected Financial Highlights
| ||||||||||
| Quarter: Year | GAAP Income (Loss) per Share |
REIT Taxable Income |
Annualized GAAP Return on Equity |
GAAP Book Value per Share |
Dividends per Share | |||||
| Q411 | ($0.03) | $0.04 | (1%) | $11.36 | $0.25 | |||||
| Q112 | $0.37 | $0.13 | 13% | $12.22 | $0.25 | |||||
| Q212 | $0.24 | $0.22 | 8% | $12.00 | $0.25 | |||||
| Q312 | $0.48 | $0.19 | 16% | $12.88 | $0.25 | |||||
| Q412 | $0.50 | $0.21 | 15% | $13.95 | $0.25 | |||||
| Q113 | $0.69 | $0.20 | 21% | $14.54 | $0.28 | |||||
| Q213 | $0.71 | $0.25 | 22% | $14.69 | $0.28 | |||||
| Q313 | $0.25 | $0.24 | 7% | $14.65 | $0.28 | |||||
| Q413 | $0.29 | $0.24 | 8% | $15.10 | $0.28 | |||||
| (1) REIT taxable income per share for 2013 are estimates until we file tax returns. | ||||||||||||
| 4 | THE REDWOOD REVIEW | 4TH QUARTER 2013 |
|
|
||
|
SHAREHOLDER LETTER
|
Dear Fellow Shareholders:
We had a very productive year at Redwood in 2013 and finished in a strong position. On the financial side, our book value per share, earnings per share, and dividends were all up considerably on a year-over-year basis, contributing to a 21.4% total return for shareholders for 2013. The Quarterly Overview section that follows this letter provides a good summary of our financial results. On the operational side, we continued to build our residential and commercial businesses. We entered the conforming mortgage sector in the fourth quarter of 2013, executed on our strategy to invest in mortgage servicing rights, and established a new residential mortgage processing center in Denver. All in all, it was a good year for Redwood and its shareholders.
Our vision and business strategy for Redwood are driven by the market opportunities we see over the next several years, not over the next several quarters. That long-term perspective gives us confidence that both our residential and commercial businesses, while still in the early stages of expansion, are well- positioned for opportunistic growth as the residential and commercial mortgage markets evolve.
Over the past four years, we have built residential and commercial loan acquisition platforms for one simple reason – to create a proprietary source of attractive investments and fee-generating opportunities. Trying to source investments solely through a bid-in-competition process is an increasingly unproductive exercise for us in this liquidity-flooded world, as available risk-adjusted investment yields keep grinding lower and lower. Our loan acquisition platforms provide us with strong competitive advantages, including the ability to leverage our seller relationships, infrastructure, and distribution capabilities.
The barriers to building an effective assembly line for creating investments are high. There is simply no fast or easy way to replicate the platforms we have been building over the past four years. Our efforts have required significant elbow grease, capital, and expense. Looking back on the progress we have made, the investments have been well worth it.
We will weave some 2014 insights into this letter, but we also want to share our views about the longer-term direction of the residential and commercial mortgage markets, the market opportunity for Redwood, and how we believe we are positioned to grow and succeed.
Residential
On the residential side, our foremost objectives are to invest in well-underwritten, prime mortgage credit risk and servicing, and to generate fees from loan sales. Until recently, we have been focused primarily on the jumbo segment of the market. Having recently obtained approval as a Fannie Mae and Freddie Mac seller/servicer, however, we now have the ability to acquire and distribute conforming loans to these government-sponsored enterprises (GSEs), thus significantly expanding our market opportunities. According to Inside Mortgage Finance, for the first nine months of 2013, the non-conforming or jumbo market represented 14% of total mortgage originations, while the conforming market represented 64% (FHA/VA loans make up the balance).
The outlook for investing in newly originated prime mortgage credit risk looks promising. While we continue to create and retain credit securities through our Sequoia securitization program, our entry into the much larger conforming market positions us to pursue investments in conforming credit through potential risk-sharing arrangements (recourse and other types) with the GSEs.
| THE REDWOOD REVIEW | 4TH QUARTER 2013 | 5 |
|
| ||
|
SHAREHOLDER LETTER
|
The private label market for residential securitization clearly experienced turmoil during 2013, as triple-A spreads widened from early in the second quarter through the end of the year.1 However, we believe that over the long term, private-label residential mortgage securitization will return to being an efficient form of mortgage financing. It will play a substantial role in the mortgage market, sitting alongside government-supported financing and bank portfolio lending. Why? Because we believe that triple-A investors will return to the private label securitization market for prime quality loans when improved securitization structures and issuer best practices become more widely adopted by participants, helping to restore confidence among investors. Ultimately, investing in securitized products is one of the most efficient ways for institutional investors to make a residential mortgage investment. We also expect that subordination levels will decline over time, reflecting the performance of the underlying collateral, and that this will improve the economics for the issuers such as Redwood.
Presently, we are seeing market fundamentals settle down, while triple-A pricing is beginning to show signs of improvement. However, based on the significant volatility of triple-A pricing over the past two years, it is difficult to project the near-term direction of the market with confidence. Redwood completed one private-label residential securitization during the fourth quarter of 2013, and we expect to complete another late in the first quarter or early in the second quarter of 2014. While we continue to prefer a securitization execution because of our ability to create attractive investments for our portfolio, given the current state of the securitization market, we expect whole-loan sales to make up the largest portion of Redwood’s distribution of the loans we accumulate. Between these two primary distribution outlets, we still believe that we can generate attractive loan sale profit margins within our long-term target range of 25 to 50 basis points. (Our loan sale margins substantially exceeded this target range in 2013.)
In 2013, we acquired $6.9 billion of jumbo mortgage loans, a large increase from 2012 when we acquired $2.3 billion, but short of our upwardly revised goal of $8 billion. For 2014, we expect to increase the number of sellers we acquire loans from. While we expect that our 2014 jumbo acquisition volume will be lower than in 2013, we expect our decline to be less than the 32% decline projected for the industry as a whole.2 For our residential conforming loan acquisitions, our goal is to ramp up to a run rate of $1 billion per month by the end of 2014. We do not expect that ramp to be linear, however, given our internal processes for expanding product offerings to our sellers as well as the declining projections we have observed in industry-wide origination as a result of interest-rate volatility.
Meanwhile, in Washington, we believe the long process of GSE reform will eventually conclude with the creation of an entity or multiple entities that function much as the GSEs do today. We believe the new entities will provide some type of conforming mortgage financing to mainstream U.S. borrowers, but with one big exception: the private sector will be center stage as the provider of first-loss credit risk, ahead of a government guarantee. This would represent a very large market opportunity for private credit risk investors, especially those with loan acquisition platforms such as Redwood. The foundation for this new structure is already being laid while the GSEs are in conservatorship, through structured risk-sharing and contractual recourse arrangements.
1 For a more detailed analysis of this development, please refer to our Letter to Shareholders in the Redwood Review for the second quarter of 2013, in which we discussed in detail what we believe were the underlying reasons for this spread widening.
2 The 32% projected decline in 2014 projected industry origination volume is the average of projections by Fannie Mae, Freddie Mac and the Mortgage Bankers Association.
| 6 | THE REDWOOD REVIEW | 4TH QUARTER 2013 |
|
|
||
|
SHAREHOLDER LETTER
|
Commercial
Our commercial team had a very successful year in 2013, originating $805 million of senior commercial loans. Although we fell short of our goal of $1 billion of senior commercial originations, our loan sale profit margins significantly exceeded our expectations, as did the overall profitability of the business.
In the near term, if the economy continues to grind forward with low-to-moderate growth in 2014, underlying commercial real estate fundamentals should continue to moderately improve as well. Various industry forecasts call for CMBS issuance to increase in 2014 for the fifth consecutive year to a range of $90 to $100 billion, as compared to approximately $85 billion in 2013. With close to $250 billion worth of commercial real estate loans set to mature annually over the next four years, we expect to see substantial refinancing opportunities for those with established commercial origination platforms such as Redwood.
We plan to expand our commercial platform in 2014 by adding experienced originators, paving the way for us to exceed our $1 billion annual commercial senior loan origination goal we had set for 2013, while also boosting our mezzanine loan origination activity. At this point, we project that the capital we had previously allocated to our commercial mortgage banking and investment activities should remain adequate for us to continue growing this platform.
The long-term outlook continues to look attractive for our commercial business. With the exception of the multifamily segment, the commercial market operates largely without the government competition that dominates the residential market. Participants are able to build business models based on market dynamics, rather than competing with government entities and regulatory and political priorities.
In Closing
We see 2014 shaping up to be another good year for our commercial business, while the near-term outlook for Redwood’s residential business is likely to be more challenging for us as well as all other residential market participants. These challenges have our full attention, but as Henry Ford said, “When everything seems to be going against you, remember that an airplane takes off against the wind, not with it.”
We are confident that our focus on the long-term direction of the residential and commercial mortgage markets, coupled with the strategic actions we are taking, positions Redwood to be a leading investor and provider of private risk capital to the mortgage market for many years to come.
As always, we appreciate your continued support.

|

| |
| Martin S. Hughes | Brett D. Nicholas | |
| CEO | President |
| THE REDWOOD REVIEW | 4TH QUARTER 2013 | 7 |
|
| ||
|
QUARTERLY OVERVIEW
|
Fourth Quarter 2013 Results
Overview
Redwood generated solid financial results in the fourth quarter of 2013 to cap a productive year of operations. The commercial group had its strongest quarter to date and the residential group – which produced satisfactory results despite lower acquisition activity – expanded into the conforming residential mortgage market. Also of note, our investment portfolio continued to generate attractive returns as our credit-sensitive securities and MSRs increased in value during the quarter.
Here is a summary of Redwood’s fourth quarter 2013 results:
| u | We earned $0.29 per share for the fourth quarter of 2013, which included a charge of $0.15 per share (pre-tax) for legal reserves related to previously disclosed litigation regarding certain legacy Sequoia securitizations. Our fourth quarter results contributed to full-year 2013 GAAP earnings of $1.94 per share, and an annual return on average equity of 14.43%. |
| u | At December 31, 2013, our GAAP book value per share was $15.10, as compared to $14.65 per share at September 30, 2013, and $13.95 per share at December 31, 2012. The fourth quarter increase in book value per share was primarily driven by valuation increases on our investment portfolio. |
| u | We completed one residential securitization totaling $325 million in the fourth quarter of 2013, and created a total of $24 million of investments for our portfolio. Additionally, we completed 16 whole loan sales totaling $648 million in the fourth quarter. |
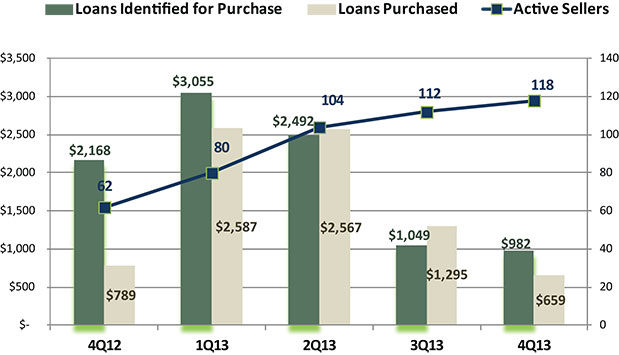
| u | We acquired $659 million of residential loans in the fourth quarter of 2013. At December 31, 2013, we had identified an additional $589 million of residential loans for purchase. |
| u | We originated $242 million of senior commercial loans and $3 million of mezzanine loans in the fourth quarter of 2013. We also sold $186 million of senior commercial loans in the fourth quarter. |
| u | Our residential investment portfolio increased by 23%, or $365 million, to $1.57 billion in the fourth quarter primarily due to $346 million of third-party security acquisitions. These acquisitions were funded with $50 million of capital and $296 million of short-term debt. |
| u | We declared and distributed a $0.28 per share dividend to shareholders for the fourth quarter of 2013 and distributed $1.12 per share of dividends to shareholders for all of 2013. |
| 8 | THE REDWOOD REVIEW | 4TH QUARTER 2013 |
|
|
||
|
QUARTERLY OVERVIEW
|
Financial Results
In the fourth quarter of 2013, Redwood earned $0.29 per share, an increase from $0.25 per share in the third quarter of 2013. Both of these quarters include significant items. The fourth quarter included charges of $0.15 per share for litigation reserves and the third quarter included negative valuation adjustments of $0.17 per share due to the reversal of certain timing differences related to our residential loan pipeline and related hedges.
The following table sets forth the components of GAAP income for the fourth and third quarters of 2013.
|
GAAP Income |
| |||||||
| ($ in millions, except per share data)
|
| |||||||
| Three Months Ended | ||||||||
| 12/31/2013 | 9/30/2013 | |||||||
| Interest income | $ | 57 | $ | 58 | ||||
| Interest expense | (20 | ) | (22 | ) | ||||
| Net interest income | 38 | 36 | ||||||
| Provision for loan losses | (4 | ) | (2 | ) | ||||
| Net interest income after provision | 34 | 34 | ||||||
| Noninterest income | ||||||||
| Mortgage banking activities, net |
17 | (9 | ) | |||||
| MSR income, net |
6 | 3 | ||||||
| Other market valuation adjustments, net |
- | - | ||||||
| Realized gains, net |
2 | 10 | ||||||
| Total noninterest income |
25 | 4 | ||||||
| Operating expenses | (19 | ) | (22 | ) | ||||
| Other expense | (12 | ) | - | |||||
| (Provision for) benefit from income taxes | (2 | ) | 5 | |||||
| GAAP income | $ | 25 | $ | 22 | ||||
| GAAP income per share | $ | 0.29 | $ | 0.25 | ||||
Net interest income for the fourth quarter of 2013 was $38 million, an increase of $2 million from the third quarter. The increase primarily reflects lower utilization of short-term debt as we funded a significant portion of our residential mortgage loan acquisitions with cash in the fourth quarter.
Provision for loan losses at legacy Sequoia entities was $3 million for the fourth quarter of 2013, as compared to $1 million in the third quarter. The increase in provision largely reflects efforts by servicers to resolve delinquent loans still held at legacy Sequoia entities. Our provision for loan losses for commercial mezzanine loans was $1 million for the fourth quarter.
| THE REDWOOD REVIEW | 4TH QUARTER 2013 | 9 |
|
| ||
|
QUARTERLY OVERVIEW
|
Financial Results (continued)
MSR income increased to $6 million in the fourth quarter of 2013 from $3 million in the third quarter, primarily resulting from positive market valuation adjustments related to the overall market’s expectation of slower prepayment rates in the near future.
Income from mortgage banking activities, net, was $17 million for the fourth quarter of 2013, as compared to a loss of $9 million in the third quarter, which included $15 million of negative market valuation adjustments, as discussed above.
Contributing to fourth quarter mortgage banking income was $5 million of gains from $980 million of residential loan sales and valuation increases, $6 million of gains from $186 million of commercial loan sales and valuation increases, and $6 million of gains from valuation increases on Sequoia Interest-Only (IO) securities and other related derivatives.
In the fourth quarter of 2013, we recognized $2 million of net gains from the sale of $3 million of available-for-sale (AFS) securities, as compared to gains of $10 million from the sale of $168 million of AFS securities in the third quarter. In the fourth quarter of 2013, we sold $13 million of Sequoia IO securities, as compared to $14 million in the third quarter.
Operating expenses were $19 million in the fourth quarter of 2013, as compared to $22 million in the third quarter. The decline primarily resulted from a lower accrual for variable compensation expense. As noted above, in the fourth quarter, we established a $12 million reserve related to previously disclosed litigation regarding certain legacy Sequoia securitizations, which is reflected in other expense on our income statement, and, therefore, impacts variable compensation.
Fourth quarter 2013 income tax expense was $2 million, as compared to a $5 million benefit from income taxes in the third quarter. The $2 million expense was related to taxable income earned during the fourth quarter at our taxable subsidiaries that are primary engaged in mortgage banking activities. The $5 million benefit taken in the third quarter reflected the release of a valuation allowance against a deferred tax asset that we now expect to utilize. See the Taxable Income and Dividends section of this Review for additional information on our tax results.
The following table presents a summary of GAAP book value for the fourth and third quarters of 2013.
|
Changes in GAAP Book Value Per Share |
| |||||||||||
| ($ in per share)
|
| |||||||||||
| Q4 2013 | Q3 2013 | Variance | ||||||||||
| Beginning book value |
$ | 14.65 | $ | 14.69 | $ | (0.04 | ) | |||||
| Net income |
0.29 | 0.25 | 0.04 | |||||||||
| Changes in unrealized gains/losses, net |
0.33 | (0.09 | ) | 0.42 | ||||||||
| Unrealized gains on hedges, net |
0.09 | 0.05 | 0.04 | |||||||||
| Other, net |
0.02 | 0.03 | (0.01 | ) | ||||||||
| Dividends |
(0.28 | ) | (0.28 | ) | - | |||||||
|
Ending book value |
$ | 15.10 | $ | 14.65 | $ | 0.45 | ||||||
| 10 | THE REDWOOD REVIEW | 4TH QUARTER 2013 |
|
|
||
|
QUARTERLY OVERVIEW
|
Financial Results (continued)
Capital Invested
We deployed $76 million of capital into new investments in the fourth quarter of 2013, as compared to $146 million in the third quarter, including acquisitions of $368 million of securities, $3 million of commercial mezzanine loans, and $2 million of MSRs, as shown in the following table.
|
Quarterly Activity |
| |||||||
| ($ in millions)
|
| |||||||
| Q4 2013 | Q3 2013 | |||||||
| Sequoia RMBS |
$ | 22 | $ | 80 | ||||
| Third-party RMBS |
346 | 143 | ||||||
| Less: Short-term debt |
(296 | ) | (101 | ) | ||||
| MSR investments |
2 | 17 | ||||||
| Total residential |
74 | 139 | ||||||
| Commercial mezzanine loans |
3 | 9 | ||||||
| Less: Borrowings |
(1 | ) | (2 | ) | ||||
| Total commercial
|
|
2
|
|
|
7
|
| ||
|
Capital invested |
$ | 76 | $ | 146 | ||||
Residential Investments
At December 31, 2013, our residential securities portfolio had a market value of $1.57 billion, up from $1.21 billion at September 30, 2013. This increase included $368 million in acquisitions and $34 million in positive valuation adjustments, less $1 million in sales (net) and $34 million in principal paydowns and other items.
Our securities acquisitions in the fourth quarter of 2013 included $319 million of seasoned senior securities, as well as $22 million of retained subordinate securities from our fourth quarter 2013 Sequoia securitization. An additional $27 million were subordinate securities recently issued by third-party RMBS sponsors. The subordinate securities included AA, A, BBB, BB and non-rated securities.
Following the end of the fourth quarter of 2013 through February 15, 2014, we acquired $22 million of securities and deployed $3 million of capital, net of financing.
At December 31, 2013, the market value of our MSRs was $65 million, or 1.12% of the $5.8 billion principal amount of the loans serviced.
| THE REDWOOD REVIEW | 4TH QUARTER 2013 | 11 |
|
| ||
|
QUARTERLY OVERVIEW
|
Financial Results (continued)
Residential Mortgage Banking Activities
Industry mortgage volumes remained under pressure during the fourth quarter of 2013, as mortgage rates rose in response to the Federal Reserve’s long anticipated plan to begin “tapering” its purchases of Treasury and mortgage-backed securities. In addition, large banks continued to price higher quality 30-year jumbo loans originated through their retail loan channels below the price for conforming loans. This pricing anomaly in part reflects a combination of the increased guarantee fees that Fannie Mae and Freddie Mac require for conforming loans, as well as the desire of some large banks with excess liquidity to invest in higher yielding and presumably safer jumbo mortgages. Despite this anomaly, however, our loan pricing remained very competitive with banks’ correspondent lending channels and we continued to identify loans for purchase in the fourth quarter of 2013 at a similar pace to the third quarter of 2013.
| 12 | THE REDWOOD REVIEW | 4TH QUARTER 2013 |
|
|
||
|
QUARTERLY OVERVIEW
|
Financial Results (continued)
We identified $982 million of residential jumbo loans for purchase during the fourth quarter of 2013, of which 55% were purchase-related mortgages, up from 54% in the third quarter of 2013. From the start of the first quarter of 2014 through February 15, 2014, we identified an additional $529 million of jumbo loans for purchase.
The net number of residential loan originators selling to our platform increased by six in the fourth quarter of 2013, bringing the total number of active sellers to 118 at December 31, 2013. These sellers consisted of 55 regional banks (or their subsidiaries) and 63 mortgage companies, located throughout the U.S.
Residential private label securitization activity was relatively slow in the fourth quarter of 2013. There were three securitizations completed by market participants totaling $0.8 billion in the fourth quarter (including our $325 million Sequoia securitization), down from nine securitizations totaling $3.9 billion in the third quarter of 2013. The decline in securitization activity reflects lower origination volumes, strong demand for whole loans sold in bulk, and relatively weak securitization execution due to the widening of triple-A credit spreads. Thus far in 2014, triple-A credit spreads have narrowed and we currently expect to complete a securitization late in the first quarter or early in the second quarter of 2014 subject to market and other conditions. While we continue to expect a significant portion of our loan inventory to be distributed through bulk whole-loan sales, we value our leadership position in the securitization market and remain committed to expanding this important area of our franchise as market conditions improve.
Commercial Mortgage Banking Activities and Investments
Our commercial group finished the year strong, originating $805 million of senior commercial loans in 2013, including those table-funded by third parties, as compared to $61 million in 2012. This included 23 senior commercial loans totaling $242 million originated in the fourth quarter of 2013, as compared to 12 loans totaling $113 million in the third quarter. We sold $186 million of senior commercial loans in the fourth quarter of 2013, as compared to $238 million in the third quarter of 2013.
Commercial mezzanine loan originations totaled two loans for $3 million in the fourth quarter of 2013, as compared to two loans for $9 million in the third quarter of 2013. For the full year in 2013, commercial mezzanine loan origination totaled $65 million, as compared to $157 million in 2012. At December 31, 2013, our portfolio of non-securitized mezzanine loans consisted of 23 loans for $86 million. Our securitized mezzanine portfolio totaled $258 million at December 31, 2013, and Redwood’s investment in this securitized portfolio amounted to $108 million.
| THE REDWOOD REVIEW | 4TH QUARTER 2013 | 13 |
|
| ||
|
QUARTERLY OVERVIEW
|
Financial Results (continued)
Cash, Debt, and Capital
At December 31, 2013, we held $173 million in cash, and our current investment capacity (defined as the approximate amount of capital we have readily available for long-term investments) was approximately $130 million. Total capital of $1.67 billion at December 31, 2013, included $1.25 billion of equity capital and $427 million of long-term debt.
We ended the fourth quarter of 2013 with short-term warehouse debt of $185 million, which was used to finance residential loans, and had additional uncommitted borrowing capacity of $1.2 billion under existing warehouse lines of credit to finance additional residential and commercial loans. At December 31, 2013, short-term debt used to finance residential securities was $678 million, as compared to $371 million at September 30, 2013.
We currently expect that our available capital and liquidity is sufficient to fund our business and investment objectives for most or all of 2014, in part because we believe we can source capital internally by selling or financing existing investments if needed to fund higher yielding investment opportunities. To the extent our expectation changes and we need external capital to fund our investment and business activities, we would consider the issuance of debt or equity securities under the shelf registration statement currently on file with the SEC, or the issuance of similar or other types of securities in public or private offerings, including the possibility of raising dedicated capital for the commercial platform.
| 14 | THE REDWOOD REVIEW | 4TH QUARTER 2013 |
|
|
|
FINANCIAL INSIGHTS
|
Balance Sheet
The following table shows the components of our balance sheet at December 31, 2013.
|
Consolidating Balance Sheet (1) |
| |||||||||||
| December 31, 2013 ($ in millions)
|
| |||||||||||
| At Redwood (2) |
Consolidated Sequoia Entities (3) |
Redwood Consolidated |
||||||||||
| Residential loans |
$ | 404 | $ | 1,762 | $ | 2,166 | ||||||
| Commercial loans |
432 | - | 432 | |||||||||
| Real estate securities - Third party |
1,167 | - | 1,167 | |||||||||
| Real estate securities - Sequoia (4) |
516 | - | 516 | |||||||||
| Mortgage servicing rights |
65 | - | 65 | |||||||||
| Cash and cash equivalents |
173 | - | 173 | |||||||||
| Total earning assets |
2,758 | 1,762 | 4,520 | |||||||||
| Other assets
|
|
81
|
|
|
8
|
|
|
89
|
| |||
| Total assets |
$ | 2,838 | $ | 1,770 | $ | 4,609 | ||||||
| Short-term debt |
||||||||||||
| Mortgage loan warehouse debt |
$ | 185 | $ | - | $ | 185 | ||||||
| Security repurchase facilities |
678 | - | 678 | |||||||||
| Other liabilities |
79 | 1 | 81 | |||||||||
| Asset-backed securities issued |
249 | 1,694 | 1,943 | |||||||||
| Long-term debt |
476 | - | 476 | |||||||||
| Total liabilities |
1,667 | 1,696 | 3,363 | |||||||||
|
Stockholders’ equity
|
|
1,171
|
|
|
75
|
|
|
1,246
|
| |||
| Total liabilities and equity |
$ | 2,838 | $ | 1,770 | $ | 4,609 | ||||||
(1) We are required under GAAP to consolidate the assets and liabilities of certain securitization entities we have sponsored for financial reporting purposes. However, the securitized assets of these entities are not legally ours and we own only the securities and interests that we acquired from these securitization entities. Similarly, the liabilities of these entities are obligations payable only from the cash flow generated by their securitized assets and are not obligations of Redwood.
(2) Included in the “At Redwood” column are the assets and liabilities of the Residential Resecuritization and Commercial Securitization transactions we completed in 2011 and 2012, respectively. These transactions are treated as secured borrowings under GAAP. At December 31, 2013, the Residential Resecuritization accounted for $264 million of assets ($263 million of available-for-sale securities at fair value and $1 million of other assets) and $95 million of asset-backed securities issued (at amortized cost). Our $169 million investment in this resecuritization, as estimated for GAAP, equals the difference between these assets and liabilities. At December 31, 2013, the Commercial Securitization accounted for $270 million of assets ($258 million of commercial real estate loans at historical cost and $12 million of other assets) and $154 million of asset-backed securities issued (at amortized cost). Our $116 million investment in this securitization, as estimated for GAAP, equals the difference between these assets and liabilities.
(3) Consolidated Sequoia Entities includes certain Sequoia securitizations completed prior to 2012 that we are required to consolidate under GAAP. Our estimated GAAP investment in these entities was $75 million at December 31, 2013, representing the difference between the aggregate assets and liabilities of these entities.
(4) Sequoia securitizations completed between January 2012 and December 2013 are treated as sales for GAAP, and the $516 million of securities we have retained from these transactions are reflected in the “At Redwood” column above as part of “Real Estate Securities — Sequoia.”
| THE REDWOOD REVIEW | 4TH QUARTER 2013 | 15 |
|
| ||
|
FINANCIAL INSIGHTS
|
Balance Sheet (continued)
The table below details residential loan activity at Redwood during the fourth and third quarters of 2013.
|
Residential Loans at Redwood |
| |||||||
| ($ in millions)
|
| |||||||
| Three Months Ended | ||||||||
| 12/31/2013 | 9/30/2013 | |||||||
| Beginning fair value |
$ | 728 | $ | 1,221 | ||||
| Acquisitions |
659 | 1,295 | ||||||
| Sales |
(980 | ) | (1,772 | ) | ||||
| Principal payments |
(10 | ) | (4 | ) | ||||
| Change in fair value, net
|
|
7
|
|
|
(12
|
)
| ||
| Ending fair value |
$ | 404 | $ | 728 | ||||
At December 31, 2013, we owned $404 million of prime residential loans, of which $280 million were 30-year fixed-rate loans, $29 million were 15-year and 20-year fixed-rate loans, and $95 million were hybrid loans. Our pipeline of loans identified for purchase was $589 million, including $546 million of non-conforming loans and $43 million of conforming loans, at December 31, 2013. See the Residential Mortgage Banking section on page 29 for additional information.
Commercial Loans
At December 31, 2013, we owned $432 million of commercial loans, as compared to $380 million of commercial loans at September 30, 2013. The following tables detail commercial loan activity during the fourth and third quarters of 2013.
|
Commercial Loans |
| |||||||||||||||
| Three Months Ended December 31, 2013 | ||||||||||||||||
| ($ in millions) | ||||||||||||||||
| Senior |
Unsecuritized Mezzanine |
Securitized Mezzanine |
Total | |||||||||||||
| Beginning carrying value |
$ | 27 | $ | 83 | $ | 269 | $ | 380 | ||||||||
| Originations |
242 | 3 | - | 245 | ||||||||||||
| Sales |
(186 | ) | - | - | (186 | ) | ||||||||||
| Principal payments/amortization |
- | - | (11 | ) | (11 | ) | ||||||||||
| Change in fair value, net |
6 | - | - | 6 | ||||||||||||
| Change in allowance for loan losses |
- | - | (1 | ) | (1 | ) | ||||||||||
|
Ending carrying value |
$ | 89 | $ | 86 | $ | 258 | $ | 432 | ||||||||
|
Commercial Loans |
| |||||||||||||||
| Three Months Ended September 30, 2013 | ||||||||||||||||
| ($ in millions) | ||||||||||||||||
| Senior |
Unsecuritized Mezzanine |
Securitized Mezzanine |
Total | |||||||||||||
| Beginning carrying value |
$ | 150 | $ | 75 | $ | 270 | $ | 495 | ||||||||
| Originations |
113 | 9 | - | 122 | ||||||||||||
| Sales |
(238 | ) | - | - | (238 | ) | ||||||||||
| Principal payments/amortization |
- | - | (1 | ) | (1 | ) | ||||||||||
| Change in fair value, net |
3 | - | - | 3 | ||||||||||||
| Change in allowance for loan losses |
- | - | - | - | ||||||||||||
|
Ending carrying value |
$ | 27 | $ | 83 | $ | 269 | $ | 380 | ||||||||
| 16 | THE REDWOOD REVIEW | 4TH QUARTER 2013 |
|
|
||
|
FINANCIAL INSIGHTS
|
Balance Sheet (continued)
During the fourth quarter of 2013, we originated two mezzanine loans and 23 senior loans and sold 20 senior loans. Additionally, two commercial mezzanine loans prepaid in full during the fourth quarter. See the Commercial Mortgage Banking and Investments section on page 32 for additional information.
Residential Real Estate Securities
The following table presents the fair value of real estate securities at December 31, 2013. We categorize our Sequoia and third-party securities by portfolio vintage (the year(s) the securities were issued), priority of cash flow (senior, re-REMIC, and subordinate) and underwriting characteristics of the underlying loans (prime and non-prime).
|
Real Estate Securities(1) December 31, 2013 ($ in millions) |
| |||||||||||||||||||||||
| Sequoia Securities 2012-2013 |
Third-party Securities |
Total Securities |
% of Total Securities |
|||||||||||||||||||||
| <=2005 | 2006-2008 | 2012-2013 | ||||||||||||||||||||||
| Seniors |
||||||||||||||||||||||||
| Prime |
$ | 113 | $ | 447 | $ | 213 | $ | - | $ | 773 | 46 | % | ||||||||||||
| Non-prime (2) |
- | 197 | 5 | - | 202 | 12 | % | |||||||||||||||||
| Total seniors |
113 | 644 | 218 | - | 975 | 58 | % | |||||||||||||||||
| Prime re-REMIC |
- | 74 | 103 | - | 177 | 10 | % | |||||||||||||||||
| Prime Subordinates |
||||||||||||||||||||||||
| Mezzanine (3) |
335 | - | - | 50 | 385 | 23 | % | |||||||||||||||||
| Non-investment grade (4) |
68 | 60 | 2 | 16 | 146 | 9 | % | |||||||||||||||||
| Prime subordinates
|
|
403
|
|
|
60
|
|
|
2
|
|
|
66
|
|
|
531
|
|
|
32
|
%
| ||||||
| Total real estate securities |
$ | 516 | $ | 778 | $ | 323 | $ | 66 | $ | 1,683 | 100 | % | ||||||||||||
(1) Included in the real estate securities table above are $263 million of senior securities that are included in the Residential Resecuritization that we completed in July 2011. Under GAAP accounting, we account for the resecuritization as a financing even though these securities are owned by the resecuritization entity and are legally not ours. We own only the securities and interests that we acquired from the resecuritization entity, which amounted to $152 million at December 31, 2013. As a result, to adjust at December 31, 2013 for the legal and economic interests that resulted from the resecuritization, Total Senior Securities would be decreased by $263 million to $712 million, Prime Re-REMIC Securities would be increased by $152 million to $329 million, and Total Real Estate Securities would be reduced by $111 million to $1.57 billion.
(2) Non-prime residential securities consist of $202 million of Alt-A senior securities.
(3) Prime mezzanine includes securities rated AA, A, and BBB—.
(4) Prime non-investment grade includes securities that have below investment grade ratings and un-rated securities.
| THE REDWOOD REVIEW | 4TH QUARTER 2013 | 17 |
|
| ||
|
FINANCIAL INSIGHTS
|
Balance Sheet (continued)
Residential Real Estate Securities (continued)
The table below details the change in fair value of real estate securities during the fourth quarter of 2013.
|
Real Estate Securities |
| |||||||
| ($ in millions)
|
| |||||||
| Three Months Ended | ||||||||
| 12/31/2013 | 9/30/2013 | |||||||
| Beginning fair value |
$ | 1,325 | $ | 1,314 | ||||
| Acquisitions |
||||||||
| Sequoia securities |
22 | 80 | ||||||
| Third-party securities |
346 | 143 | ||||||
| Sales |
||||||||
| Sequoia securities |
(13 | ) | (14 | ) | ||||
| Third-party securities |
(3 | ) | (168 | ) | ||||
| Gain on sale |
2 | 10 | ||||||
| Effect of principal payments |
(37 | ) | (38 | ) | ||||
| Change in fair value, net |
40 | (3 | ) | |||||
| Ending fair value |
$ | 1,683 | $ | 1,325 | ||||
During the fourth quarter of 2013, securities acquisitions included $22 million of Sequoia securities, $319 million of third-party senior securities, and $27 million of third-party mezzanine and non-investment grade securities. Sales in the fourth quarter included $13 million of Sequoia IOs and $3 million of third-party subordinate securities.
Mortgage Servicing Rights
At December 31, 2013, we owned MSRs associated with $5.8 billion of residential loans primarily acquired through our conduit operations. We earn fees from these MSRs, but outsource the actual servicing of the associated loans to a licensed third-party servicer. The table below details the change in fair value of Redwood’s MSRs during the fourth quarter of 2013.
|
MSRs |
| |||||||
| ($ in millions)
|
| |||||||
| Three Months Ended | ||||||||
| 12/31/2013 | 9/30/2013 | |||||||
| Beginning fair value |
$ | 60 | $ | 43 | ||||
| Additions |
2 | 17 | ||||||
| Change in fair value, net |
3 | - | ||||||
| Ending fair value |
$ | 65 | $ | 60 | ||||
During the fourth quarter of 2013, we added $2 million of MSRs associated with $264 million of residential loans acquired through our conduit operations. The GAAP carrying value, which is the estimated fair value, of our MSRs at December 31, 2013 is equal to 1.12% of the principal balance of the associated residential loans.
| 18 | THE REDWOOD REVIEW | 4TH QUARTER 2013 |
|
|
|
FINANCIAL INSIGHTS
|
Balance Sheet (continued)
Derivatives
The following table presents the fair value and notional value of derivative financial instruments held at December 31, 2013 and September 30, 2013, which are a component of other assets and accrued expenses and other liabilities on our consolidated balance sheets.
|
Derivatives |
| |||||||||||||||
| ($ in millions)
|
| |||||||||||||||
| 12/31/2013 | 9/30/2013 | |||||||||||||||
| Fair Value | Notional | Fair Value | Notional | |||||||||||||
| Risk management derivatives, net | ||||||||||||||||
| Residential |
$ | 6 | $ | 1,216 | $ | (3 | ) | $ | 1,233 | |||||||
| Commercial |
1 | 70 | (1 | ) | 26 | |||||||||||
| Cash flow hedges on long-term debt | (17 | ) | 140 | (24 | ) | 140 | ||||||||||
| Total derivative financial instruments, net | $ | (10 | ) | $ | 1,426 | $ | (27 | ) | $ | 1,399 | ||||||
We use derivative financial instruments in part to mitigate the interest rate risk associated with some of our residential and commercial loan activity. Net changes in the fair value of risk management derivatives are reflected in our income statement in mortgage banking activities, net. The timing of when we enter into and exit these derivatives, and the corresponding levels of benchmark interest rates, has a significant effect on the amount of valuation income or loss recognized. During the fourth quarter of 2013, the aggregate fair value of risk management derivatives, including those agreements that we exited during the quarter, increased by less than $1 million.
Rising benchmark interest rates also resulted in a $7 million reduction to our derivative liability related to cash flow hedges on our long-term debt. Changes in the fair value of our cash flow hedges were recorded in shareholders’ equity through accumulated other comprehensive income.
Investments in Consolidated Sequoia Entities
Investments in Consolidated Sequoia Entities, as estimated for GAAP, totaled $75 million at December 31, 2013. This amount reflects the book value of retained investments in Consolidated Sequoia Entities and is based on the difference between the consolidated assets and liabilities of the entities in the aggregate according to their GAAP carrying amounts.
| THE REDWOOD REVIEW | 4TH QUARTER 2013 | 19 |
|
| ||
|
FINANCIAL INSIGHTS
|
Balance Sheet (continued)
Short-Term Debt
At December 31, 2013, we had short-term mortgage warehouse debt outstanding of $185 million, which was used to finance a portion of the $404 million inventory of residential mortgage loans held for sale.
At December 31, 2013, we had five uncommitted residential mortgage warehouse facilities with an aggregate borrowing capacity of $1.4 billion, and one uncommitted commercial mortgage warehouse facility for senior loans with a borrowing capacity of $100 million.
At December 31, 2013, we had short-term debt incurred through securities repurchase facilities of $678 million, which was secured by $839 million of residential securities, resulting in a debt-to-equity leverage ratio for these residential securities of 4.2x (excluding the additional risk capital we hold related to these short-term borrowings).
The table below details the activity of short-term debt during the fourth and third quarters of 2013.
|
Short-Term Debt by Collateral Type |
| |||||||||||||||||||||||
| ($ in millions)
|
| |||||||||||||||||||||||
| Residential Loans | Residential Securities | Senior Commerical Loans | ||||||||||||||||||||||
| Q4 2013 | Q3 2013 | Q4 2013 | Q3 2013 | Q4 2013 | Q3 2013 | |||||||||||||||||||
| Beginning balance |
$ | 462 | $ | 1,083 | $ | 371 | $ | 363 | $ | 5 | $ | - | ||||||||||||
| Borrowings |
423 | 980 | 389 | 716 | 104 | 60 | ||||||||||||||||||
| Repayments |
(700 | ) | (1,602 | ) | (82 | ) | (708 | ) | (109 | ) | (55 | ) | ||||||||||||
| Ending balance |
$ | 185 | $ | 462 | $ | 678 | $ | 371 | $ | - | $ | 5 | ||||||||||||
Long-Term Debt and ABS Issued
At December 31, 2013, we had $288 million of convertible senior notes outstanding at a stated interest rate of 4.625% (excluding deferred issuance costs), that are convertible into 41.1320 shares of common stock per $1,000 principal amount (equivalent to a conversion price of $24.31 per common share and subject to certain adjustments) on or before their maturity in April 2018.
At December 31, 2013, we had $140 million of other long-term debt outstanding due in 2037 with a stated interest rate of three-month LIBOR plus 225 basis points. In 2010, we effectively fixed the interest rate on this long-term debt at approximately 6.75% (excluding deferred issuance costs) through interest rate swaps.
At December 31, 2013, we had $49 million of borrowings outstanding under a $150 million commercial warehouse facility for mezzanine loans. Due to the 24-month term of this facility, it is classified as long-term debt on our consolidated balance sheet.
At December 31, 2013, we had $95 million outstanding of non-recourse, asset-backed debt issued at a stated interest rate of one-month LIBOR plus 200 basis points related to our Residential Resecuritization. We also had $154 million outstanding of non-recourse, asset-backed debt issued at a stated interest rate of 5.62% (excluding deferred issuance costs) related to our Commercial Securitization.
| 20 | THE REDWOOD REVIEW | 4TH QUARTER 2013 |
|
|
|
FINANCIAL INSIGHTS
|
Balance Sheet (continued)
Capital and Cash
At December 31, 2013, our total capital was $1.7 billion, including $1.2 billion of shareholders’ equity, and $427 million of long-term debt. We use capital to invest in earning assets, meet lender capital requirements, and fund our operations and working capital needs. Our cash balance was $173 million at December 31, 2013.
| THE REDWOOD REVIEW | 4TH QUARTER 2013 | 21 |
|
| ||
|
FINANCIAL INSIGHTS
|
GAAP Income
Our consolidated GAAP net income for the fourth quarter of 2013 was $25 million, or $0.29 per share, as compared to $22 million, or $0.25 per share, for the third quarter of 2013. The following tables present the results at Redwood and Consolidated Sequoia Entities and their estimated effect on GAAP income for the fourth and third quarters of 2013.
|
Consolidating Income Statement |
| |||||||||||
| Three Months Ended December 31, 2013 | ||||||||||||
| ($ in millions, except per share data)
|
| |||||||||||
| At Redwood |
Consolidated Sequoia Entities |
Redwood Consolidated |
||||||||||
| Interest income | $ | 41 | $ | 8 | $ | 48 | ||||||
| Net discount (premium) amortization | 10 | (1 | ) | 9 | ||||||||
| Total interest income | 51 | 7 | 57 | |||||||||
| Interest expense | (14 | ) | (6 | ) | (20 | ) | ||||||
| Net interest income | 37 | 1 | 38 | |||||||||
| Provision for loan losses | (1 | ) | (3 | ) | (4 | ) | ||||||
| Net interest income (loss) after provision | 36 | (2 | ) | 34 | ||||||||
| Noninterest income | ||||||||||||
| Mortgage banking activities, net |
17 | - | 17 | |||||||||
| MSR income, net |
6 | - | 6 | |||||||||
| Other market valuation adjustments, net |
1 | (0 | ) | 0 | ||||||||
| Realized gains, net |
2 | - | 2 | |||||||||
| Total noninterest income |
25 | (0 | ) | 25 | ||||||||
| Operating expenses | (19 | ) | - | (19 | ) | |||||||
| Other expense, net | (12 | ) | - | (12 | ) | |||||||
| Provision for income taxes | (2 | ) | - | (2 | ) | |||||||
| Net income (loss) | $ | 27 | $ | (2 | ) | $ | 25 | |||||
| Net income per share | $ | 0.29 | ||||||||||
|
Consolidating Income Statement |
| |||||||||||
| Three Months Ended September 30, 2013 | ||||||||||||
| ($ in millions, except per share data)
|
| |||||||||||
| At Redwood |
Consolidated Sequoia Entities |
Redwood Consolidated |
||||||||||
| Interest income | $ | 41 | $ | 10 | $ | 51 | ||||||
| Net discount (premium) amortization | 9 | (2 | ) | 7 | ||||||||
| Total interest income | 50 | 8 | 58 | |||||||||
| Interest expense | (16 | ) | (6 | ) | (22 | ) | ||||||
| Net interest income | 34 | 2 | 36 | |||||||||
| Provision for loan losses | (1 | ) | (1 | ) | (2 | ) | ||||||
| Net interest income after provision | 33 | 1 | 34 | |||||||||
| Noninterest income | ||||||||||||
| Mortgage banking activities, net |
(9 | ) | - | (9 | ) | |||||||
| MSR income, net |
3 | - | 3 | |||||||||
| Other market valuation adjustments, net |
1 | - | - | |||||||||
| Realized gains, net |
10 | - | 10 | |||||||||
| Total noninterest income |
5 | - | 4 | |||||||||
| Operating expenses |
(22 | ) | - | (22 | ) | |||||||
| Other expense, net | - | - | - | |||||||||
| Benefit from income taxes |
5 | - | 5 | |||||||||
| Net income | $ | 21 | $ | 1 | $ | 22 | ||||||
| Net income per share | $ | 0.25 | ||||||||||
| 22 | THE REDWOOD REVIEW | 4TH QUARTER 2013 |
|
|
|
FINANCIAL INSIGHTS
|
Net Interest Income at Redwood
Net total interest income at Redwood was $37 million in the fourth quarter of 2013, an increase of $3 million from the third quarter of 2013.
| u | Interest income from our securities portfolio was $31 million for the fourth quarter of 2013, an increase of $1 million from the third quarter of 2013, as the average balance of our securities portfolio increased 16% to $1.4 billion, primarily from the acquisition of $373 million of Sequoia and third-party securities during the fourth quarter. |
| u | Interest income from residential loans held-for-sale was $7 million during the fourth quarter of 2013, a decrease of $2 million from the third quarter of 2013, as the average balance of residential loans held-for-sale on our balance sheet decreased 36% to $554 million, reflecting lower acquisition volume during the fourth quarter. The amount of interest earned from these loans is dependent upon prevailing mortgage rates and the amount of time they are held on our balance sheet prior to sale. |
| u | Commercial loans generated $13 million of interest income in the fourth quarter of 2013, an increase of $2 million from the third quarter of 2013, primarily resulting from $2 million of yield maintenance received upon prepayment of two mezzanine loans in the fourth quarter. |
| u | Interest expense was $14 million in the fourth quarter of 2013, a decrease of $2 million from the third quarter of 2013, primarily resulting from a decrease in the average balance of short-term debt used to finance residential and commercial loan acquisitions during the fourth quarter. |
Non-Interest Income at Redwood
Non-interest income at Redwood was $25 million in the fourth quarter of 2013, an increase of $20 million from the third quarter of 2013. We generate non-interest income from mortgage banking activities (primarily valuation adjustments), as well as net MSR income, other net market valuation adjustments, and net realized gains.
| THE REDWOOD REVIEW | 4TH QUARTER 2013 | 23 |
|
| ||
|
FINANCIAL INSIGHTS
|
u Mortgage Banking Activities
The following table presents the components of mortgage banking activities for the fourth and third quarters of 2013.
|
Mortgage Banking Activities |
| |||||||
| ($ in millions)
|
| |||||||
| Three Months Ended | ||||||||
| 12/31/2013 | 9/30/2013 | |||||||
| Net market valuation adjustments on: | ||||||||
| Residential loans |
$ | 5 | $ | (11 | ) | |||
| Commercial loans |
6 | 3 | ||||||
| Sequoia IO securities |
6 | (2 | ) | |||||
| Risk management derivatives
|
|
-
|
|
|
1
|
| ||
| Total mortgage banking activities, net | $ | 17 | $ | (9 | ) | |||
Income from mortgage banking activities, net, was $17 million for the fourth quarter of 2013, as compared to negative $9 million for the third quarter of 2013, primarily reflecting positive market valuation adjustments on residential and commercial loans, and Sequoia IOs. As discussed in the Redwood Review for the third quarter of 2013, negative market valuation adjustments on residential loans recorded in the third quarter of 2013 were primarily related to a timing difference associated with our residential pipeline. This timing difference resulted in $15 million of negative valuation adjustments associated with loans we had identified but not yet purchased at June 30, 2013, with subsequent purchases and the recording of associated valuation changes occurring in the third quarter of 2013. Offsetting hedging gains as of June 30, 2013, that were associated with our June 30, 2013, pipeline were recorded in the second quarter of 2013.
Income from mortgage banking activities in the fourth quarter of 2013 also included $6 million in positive market valuation gains on senior commercial loans, as compared to $3 million in the third quarter of 2013, primarily as a result of a $129 million increase in senior loan origination activity in the fourth quarter.
| 24 | THE REDWOOD REVIEW | 4TH QUARTER 2013 |
|
|
|
FINANCIAL INSIGHTS
|
u MSR Income, Net
Income from MSRs was $6 million for the fourth quarter of 2013, as we recognized $3 million of net cash servicing income and $3 million of positive market valuation adjustments. This compares to $3 million of net cash servicing income and less than $1 million of positive market valuation adjustments during the third quarter of 2013.
u Other Market Valuation Adjustments at Redwood
Other market valuation adjustments, net, were less than $0.5 million for both the fourth and third quarters of 2013.
u Realized Gains, Net
In the fourth quarter of 2013 we recognized $2 million of gains from the sale of $3 million of residential securities.
Operating Expenses
Operating expenses were $19 million for the fourth quarter of 2013, as compared to $22 million for the third quarter of 2013, primarily due to a decrease in variable compensation expense and professional services fees.
Provision for Income Taxes
During the fourth quarter of 2013, we recognized a $2 million provision for income taxes primarily related to mortgage banking activities. See the Taxable Income and Dividends section for further information.
Earnings at Consolidated Sequoia Entities
We recognized a net loss of $2 million for the fourth quarter of 2013 related to our investments in Consolidated Sequoia Entities, as compared to net income of $1 million for the third quarter of 2013. This decrease is primarily attributable to a $2 million increase in the provision for loan losses.
The allowance for loan losses at Consolidated Sequoia Entities was $25 million at December 31, 2013, an increase of $2 million from September 30, 2013. During the fourth quarter we observed an increase in the number of loans transitioning into foreclosure reflecting efforts by servicers to resolve delinquent loans held at legacy Sequoia entities. Net charge-offs were $1 million during both the fourth and third quarters of 2013. These charge-offs relate to existing delinquent loans that have transitioned to short sales or were foreclosed upon during the fourth quarter of 2013.
Serious delinquencies on loans held at Consolidated Sequoia Entities (90+ days delinquent) were $79 million (or 4.45% of outstanding loan balances) at December 31, 2013, compared to $69 million (or 3.70% of outstanding loan balances) at September 30, 2013.
| THE REDWOOD REVIEW | 4TH QUARTER 2013 | 25 |
|
| ||
|
FINANCIAL INSIGHTS
|
Taxable Income and Dividends
Summary
As a REIT, Redwood is required to distribute to shareholders at least 90% of its REIT taxable income. REIT taxable income is defined as taxable income earned at Redwood and its qualified REIT subsidiaries. To the extent Redwood retains taxable income at the REIT, it is taxed at corporate tax rates. Redwood also earns taxable income at its taxable REIT subsidiaries (TRS), which it is not required to distribute.
Dividend Policy Overview
Our Board of Directors has maintained a policy of paying regular quarterly dividends, although we have not been required to distribute dividends in recent years under the provisions of the Internal Revenue Code applicable to REITs. On November 25, 2013, the Board of Directors declared a regular dividend of $0.28 per share for the fourth quarter of 2013, which was paid on December 27, 2013, to shareholders of record on December 13, 2013. Also in November 2013, the Board of Directors announced its intention to pay a regular dividend of $0.28 per share per quarter in 2014.
Dividend Distribution Requirement
Our estimated REIT taxable income was $20 million, or $0.24 per share, for the fourth quarter of 2013 and $20 million, or $0.24 per share, for the third quarter of 2013. Under normal circumstances, our minimum REIT dividend requirement would be 90% of our annual REIT taxable income. However, we currently maintain a $70 million REIT net operating loss carryforward (NOL) that affords us the option of retaining REIT taxable income up to the NOL amount, tax free, rather than distributing it as dividends. Federal income tax rules require the dividends paid deduction to be applied to reduce taxable income before the applicability of NOLs is considered. Our estimated REIT taxable income did not exceed our dividend distributions in 2013; therefore, our $70 million NOL will likely carry forward into 2014.
Income Tax Characterization of Dividend for Shareholders
Irrespective of our minimum distribution requirement, federal income tax rules require that the actual dividends we distribute in 2013 be taxed at the shareholder level based on our full year 2013 taxable income plus net capital gains before application of any loss carryforwards. Based on this requirement, we expect 89% of the dividends we distributed in 2013 to be taxable as ordinary income to shareholders and 11% to be a return of capital, which is generally non-taxable. None of Redwood’s 2013 dividend distributions are expected to be characterized as long-term capital gains for federal income tax purposes. Factors that significantly affected the taxation of our 2013 dividends to shareholders include but are not limited to: (i) the timing of realized credit losses on legacy investments and (ii) capital gains on sales of securities.
(i) Our estimated REIT taxable income for the year ended December 31, 2013 included $13 million of realized credit losses on legacy investments that were taken in previous periods for GAAP reporting purposes. We anticipate an additional $59 million of tax
| 26 | THE REDWOOD REVIEW | 4TH QUARTER 2013 |
|
|
|
FINANCIAL INSIGHTS
|
Income Tax Characterization of Dividend for Shareholders (continued)
credit losses to be realized over an estimated three- to five-year period based on the securities we currently own. This is a decrease from $111 million at December 31, 2012 and $138 million at December 31, 2011. Even though the impact of realized losses on our current period taxable income is declining, our GAAP earnings, which have provisioned for these losses in prior periods, will likely continue to exceed our REIT taxable income and will be more reflective of our current operating performance.
(ii) For the year ended December 31, 2013, we realized net capital gains of $6 million at the REIT level for tax purposes. Net capital gains generated by the REIT for the entire year increased the portion of our 2013 dividends that are characterized as ordinary income to our shareholders. However, if the REIT had realized net capital losses for 2013, those losses would have had no effect on the taxability of our 2013 dividends. None of our 2013 dividend distributions are expected to be characterized as long-term capital gains based on applicable federal income tax rules.
GAAP Provision for Income Tax at Taxable REIT Subsidiaries
To the extent we expect to pay tax at the corporate level (generally as a result of activity at our taxable REIT subsidiaries) we are required to record a tax provision for GAAP reporting purposes. We recorded a $2 million tax provision for the fourth quarter of 2013, as compared to a $5 million tax benefit for the third quarter of 2013. The increase was primarily due to a reduction of our valuation allowance that reduced the third quarter tax provision below the normalized amount. Our total tax provision of $11 million for 2013 is not intended to reflect the actual amount of tax we expect to pay for the year as it includes a $7 million net deferred tax liability that we expect to pay in future years related to our 2013 GAAP earnings. For tax, we are able to defer income to later years due to favorable timing differences that relate primarily to income from our mortgage banking activities. We are also able to offset current taxable income with NOL and capital loss carryovers maintained at our taxable REIT subsidiaries. A reconciliation of GAAP and taxable income is set forth in Table 2 of the Financial Tables of this Redwood Review.
We do not expect to generate excess inclusion income in 2013, but in the event we do, it is our intention to retain it and not pass it through to our shareholders.
| THE REDWOOD REVIEW | 4TH QUARTER 2013 | 27 |
|
| ||
|
BUSINESS SEGMENTS
|
Summary
We adopted segment accounting in the fourth quarter of 2013. We believe this will provide shareholders with greater insight and clarity regarding the activities and financial results of our different business areas and how they contribute to Redwood’s overall business and consolidated financial results. The three segments we have designated are residential mortgage banking, residential investments, and commercial mortgage banking and investments, which align with how we assess the performance of, and make resource allocations and operating decisions relating to, these three business areas.
As an introduction to this new format, the table below presents our consolidated financial results and selected assets for the full year 2013 by presenting the direct contribution of each segment separately. The tables also include a reconciling column labeled “Corporate/Other” that includes the impact of our legacy Consolidated Sequoia Entities, certain long-term debt, corporate operations not directly attributable to our operating segments, and other items. In future periods we intend to provide quarterly segment results in the Redwood Review. Following the table below are descriptions of each segment along with a summary of activity in each segment. Additional detail on our segments and their results will be provided in our Annual Report on Form 10-K.
|
Segment Results |
||||||||||||||||||||
| Year Ended December 31, 2013 | ||||||||||||||||||||
| ($ in millions)
|
| |||||||||||||||||||
|
Residential Mortgage Banking |
Residential Investments |
Commercial Mortgage Banking and Investments |
Corporate/ Other |
Total | ||||||||||||||||
| Interest income |
$ | 53 | $ | 96 | $ | 43 | $ | 34 | $ | 226 | ||||||||||
| Interest expense |
(10 | ) | (10 | ) | (13 | ) | (48 | ) | (81 | ) | ||||||||||
| Net interest income (loss) |
42 | 86 | 31 | (14 | ) | 145 | ||||||||||||||
| Provision for loan losses |
- | - | (3 | ) | (1 | ) | (5 | ) | ||||||||||||
| Net interest income (loss) after provision |
42 | 86 | 27 | (16 | ) | 140 | ||||||||||||||
| Noninterest income |
||||||||||||||||||||
| Mortgage banking activities, net |
78 | - | 23 | - | 101 | |||||||||||||||
| MSR income, net |
- | 20 | - | - | 20 | |||||||||||||||
| Other market valuation adjustments, net |
- | (5 | ) | - | (1 | ) | (6 | ) | ||||||||||||
| Realized gains, net |
- | 25 | - | - | 25 | |||||||||||||||
| Total noninterest income |
78 | 40 | 23 | - | 141 | |||||||||||||||
| Operating expenses |
(21 | ) | (4 | ) | (10 | ) | (50 | ) | (85 | ) | ||||||||||
| Other expense |
- | - | - | (12 | ) | (12 | ) | |||||||||||||
| (Provision for) benefit from income taxes
|
|
(6
|
)
|
|
(3
|
)
|
|
(4
|
)
|
|
2
|
|
|
(11
|
)
| |||||
| Segment contribution |
$ | 93 | $ | 119 | $ | 37 | $ | (76 | ) | |||||||||||
| Net income |
$ | 173 | ||||||||||||||||||
| Additional Information: |
||||||||||||||||||||
| Residential loans - unsecuritized |
$ | 404 | $ | - | $ | - | $ | - | $ | 404 | ||||||||||
| Residential loans - securitized |
- | - | - | 1,762 | 1,762 | |||||||||||||||
| Commercial loans |
- | - | 432 | - | 432 | |||||||||||||||
| Real estate securities |
111 | 1,572 | - | - | 1,683 | |||||||||||||||
| Mortgage servicing rights |
- | 65 | - | - | 65 | |||||||||||||||
| 28 | THE REDWOOD REVIEW | 4TH QUARTER 2013 |
|
|
|
BUSINESS SEGMENTS
|
Residential Mortgage Banking
Summary
The Residential Mortgage Banking segment primarily consists of a mortgage loan conduit that acquires residential loans from third-party originators for subsequent sale through securitizations that we sponsor or as whole loans. The jumbo loans we acquire are typically sold through private-label securitization through our Sequoia securitization program or to institutions that acquire pools of whole loans. We typically retain subordinate and other securities created through Sequoia securitization transactions for investment in our residential investment portfolio. The conforming loans we acquire are generally sold to the Agencies. Our residential loan acquisitions are usually made on a flow basis as they are originated by banks or mortgage companies, but we also make bulk acquisitions as well. We do not directly originate or service residential loans.
This segment’s main source of revenue is mortgage banking income, which includes valuation increases (or gains) on the sale or securitization of loans and the creation of MSRs. Additionally, this segment may generate interest on loans held for a future sale or securitization, and income from IO securities and derivatives used to manage risks associated with mortgage banking activities. Funding expenses, direct operating expenses, and tax expenses associated with these activities are also included.
| u | During the fourth quarter of 2013, we identified $1.0 billion of loans for purchase and we acquired $659 million of loans, compared to the third quarter of 2013, when we identified $1.0 billion of loans for purchase and we acquired $1.3 billion of loans. |
| u | During the fourth quarter of 2013, we completed one prime jumbo securitization totaling $325 million and 16 whole loan sale transactions totaling $648 million, compared to the third quarter of 2013 when we completed three prime jumbo securitizations totaling $1.2 billion and 17 whole loan sale transactions totaling $600 million. |
| u | During the fourth quarter of 2013, industry-wide private-label jumbo RMBS issuance totaled $0.8 billion, compared to $3.9 billion in the third quarter of 2013. For all of 2013, industry-wide private-label jumbo RMBS issuance was $13.1 billion, compared to $3.5 billion in 2012. |
| u | Redwood has sponsored, through its Sequoia platform, $7.5 billion, or 46%, of the $16.5 billion of total private-label RMBS issuance since the start of 2012. |
| u | At December 31, 2013, the fair value of our residential loans held for sale was $404 million, down from $728 million at September 30, 2013. At December 31, 2013, our pipeline of residential loans identified for purchase was $546 million of non-conforming loans and $43 million of conforming loans. |
| u | Active sellers increased to a total of 118 at December 31, 2013, from 112 at September 30, 2013. |
| u | During the fourth quarter of 2013, we did not acquire any IO securities from the Sequoia securitization we sponsored, as compared to $9 million of IO securities we acquired from Sequoia securitizations in the third quarter of 2013. At December 31, 2013, retained IOs acquired from Sequoia securitizations totaled $111 million. |
| THE REDWOOD REVIEW | 4TH QUARTER 2013 | 29 |
|
| ||
|
BUSINESS SEGMENTS
|
Residential Investments
Summary
The Residential Investments segment includes a portfolio of investments in residential mortgage-backed securities (RMBS) retained from our Sequoia securitizations, as well as RMBS issued by third parties. This segment also includes MSRs associated with residential loans securitized through the Sequoia program and MSRs purchased from third parties.
This segment’s main source of revenue is net interest income from portfolio securities and income from MSRs. Additionally, this segment may realize gains upon the sale of securities and market valuation changes on MSRs. Funding expenses, direct operating expenses, and tax expenses associated with these activities are also included.
| u | At December 31, 2013, the fair value of the residential securities in the residential investments segment totaled $1.6 billion, consisting of $662 million in prime senior securities, $202 million in non-prime senior securities, $176 million in re-REMIC securities, $385 million in mezzanine securities, and $146 million in non-investment grade securities. The amortized cost of our available-for-sale securities, which account for all but $14 million of securities held as trading securities, was 77% of face value and the fair value was 86% of face value at December 31, 2013. |
| u | We financed our holdings of residential securities through a combination of short-term debt secured by securities, a Residential Resecuritization, long-term debt and equity capital. During the fourth quarter of 2013, average short-term debt secured by securities was $525 million and the average asset-backed securities outstanding in the Residential Resecuritization was $100 million. |
| u | During the fourth quarter of 2013, we acquired $22 million of subordinate investments from Sequoia securitizations we sponsored, as compared to $72 million of senior and subordinate investments acquired from Sequoia securitizations in the third quarter of 2013. At December 31, 2013, retained investments acquired from Sequoia securitizations totaled $405 million. |
| u | At December 31, 2013, residential securities we own (as a percentage of current market value) consisted of fixed-rate assets (39%), adjustable-rate assets (19%), hybrid assets that reset within the next year (27%), and hybrid assets that reset between 12 and 36 months (15%). |
| u | Information on the residential securities we own and the underlying loan characteristics is set forth in Tables 5 through 8B in the Appendix. Information about the underlying loan characteristics of consolidated Sequoia securitizations and loans held for sale is set forth in Table 9 in the Appendix. |
| 30 | THE REDWOOD REVIEW | 4TH QUARTER 2013 |
|
|
|
BUSINESS SEGMENTS
|
Residential Investments (continued)
The following table presents information on residential securities in our residential investments segment at December 31, 2013. For GAAP, we account for the large majority of these securities as available-for-sale (AFS) and others as trading securities, and in both cases the securities are reported at their fair value at the report date.
|
Residential Securities |
| |||||||||||||||||||
| December 31, 2013 | ||||||||||||||||||||
| ($ in millions)
|
| |||||||||||||||||||
| Senior | ||||||||||||||||||||
| Prime | Non-prime | Re-REMIC | Subordinate | Total | ||||||||||||||||
| Available-for-sale securities | ||||||||||||||||||||
| Current face |
$ | 670 | $ | 219 | $ | 214 | $ | 706 | $ | 1,809 | ||||||||||
| Credit reserve |
(10 | ) | (14 | ) | (30 | ) | (62 | ) | (117 | ) | ||||||||||
| Net unamortized discount |
(44 | ) | (37 | ) | (80 | ) | (137 | ) | (298 | ) | ||||||||||
| Amortized cost |
616 | 168 | 103 | 507 | 1,394 | |||||||||||||||
| Unrealized gains |
48 | 26 | 73 | 41 | 188 | |||||||||||||||
| Unrealized losses |
(1 | ) | (0 | ) | - | (22 | ) | (23 | ) | |||||||||||
| Trading securities
|
|
-
|
|
|
9
|
|
|
-
|
|
|
5
|
|
|
14
|
| |||||
| Fair value of residential securities | $ | 662 | $ | 202 | $ | 176 | $ | 531 | $ | 1,572 | ||||||||||
Investments in MSRs
| u | In the fourth quarter of 2013, Redwood’s investment in MSRs increased to $65 million, as we added $2 million of MSRs associated with $322 million of residential loans, which increased the portfolio of loans associated with Redwood’s investment in MSRs to $5.8 billion. The GAAP carrying value of these MSRs is equal to 1.12% of the principal balance of the associated residential loans. |
| THE REDWOOD REVIEW | 4TH QUARTER 2013 | 31 |
|
| ||
|
BUSINESS SEGMENTS
|
Commercial Mortgage Banking and Investments
Summary
The Commercial Mortgage Banking and Investments segment consists primarily of a mortgage loan conduit that originates senior commercial loans for subsequent sale to third-party CMBS sponsors or other investors. This segment also provides other forms of commercial real estate financing directly to borrowers that may include mezzanine loans, subordinate mortgage loans, and other forms of financing, such as preferred equity interests in special purpose entities that own commercial real estate. We typically hold the mezzanine and other subordinate loans we originate in our commercial portfolio.
This segment’s main sources of revenue are mortgage banking income, which includes valuation increases (or gains) on the sale of senior commercial loans, and net interest income from mezzanine or subordinate loans held in our investment portfolio. Funding expenses, direct operating expenses, and tax expenses associated with these activities are also included.
| u | Income from commercial mortgage banking activities was $7 million in the fourth quarter of 2013, as compared to $3 million in the third quarter of 2013. |
| u | During the fourth quarter of 2013, we originated and funded 23 senior commercial loans for $242 million, and sold 20 senior loans totaling $187 million. This compares to the third quarter of 2013 when we originated and funded 12 senior loans of $113 million, and sold 18 senior loans totaling $238 million. |
| u | For all of 2013, we originated a total of $805 million of senior commercial loans. |
| u | At December 31, 2013, we had seven senior commercial loans held for sale with a carrying value of $89 million. |
| u | During the fourth quarter of 2013, we originated two commercial mezzanine loans for $3 million, as compared to two mezzanine loans for $9 million in the third quarter of 2013. At December 31, 2013, our unsecuritized and securitized portfolio of commercial mezzanine loans held for investment were $86 million and $264 million, respectively. |
| u | At December 31, 2013, commercial mezzanine loans held for investment had an outstanding principal balance of $353 million, unamortized discount of $3 million, an allowance for loan losses of $7 million, and a carrying value of $343 million. |
| u | On average, our commercial held-for-investment mezzanine loans have a maturity of more than five years, an unlevered yield in excess of 10% per annum before credit costs, a loan-to-value ratio of 73% at origination, and a debt service coverage ratio at origination of 1.31x based on underwritten cash flows at origination. |
| u | During the fourth quarter of 2013, two of our commercial mezzanine loans prepaid in full. In connection with these loan prepayments, we received $2 million of yield maintenance fees. |
| u | During the fourth quarter of 2013, we transferred two loans, with a combined carrying value of $42 million, from pass to watch status. Both of the loans are current on all payments and we continue to believe we will receive all amounts due according to the contractual terms of the loans. However, in our judgment, certain conditions warrant specific attention going forward. Improvements in these conditions would result in the assets being upgraded back to pass status and deterioration could warrant further downgrades and potential evaluation for impairment. |
| 32 | THE REDWOOD REVIEW | 4TH QUARTER 2013 |
|
|
|
BUSINESS SEGMENTS
|
The following table and charts provide information on our commercial mezzanine loan portfolio as of December 31, 2013.
|
Commercial Mezzanine Loans at Redwood | ||||||||
| December 31, 2013
| ||||||||
| Property Type | Number of Loans | Original Weighted Average DSCR (1) |
Original Weighted Average |
Average Loan Size ($ millions) | ||||
|
Multifamily
|
23 | 1.27x | 79% | $5 | ||||
|
Hospitality
|
9 | 1.38x | 62% | 9 | ||||
|
Office
|
7 | 1.37x | 72% | 10 | ||||
|
Retail
|
6 | 1.16x | 76% | 9 | ||||
|
Self Storage
|
3 | 1.39x | 75% | 6 | ||||
|
Industrial
|
2 | 1.37x | 70% | 2 | ||||
|
Total portfolio
|
50 | 1.31x | 73% | $7 | ||||
| (1) | The debt service coverage ratio (DSCR) is defined as the property’s annual net operating income divided by the annual principal and interest payments. The weighted average DSCRs in this table are based on the ratios at the time the loans were originated and are not based on subsequent time periods during which there may have been increases or decreases in each property’s operating income. |
| (2) | The loan-to-value (LTV) calculation is defined as the sum of the senior and all subordinate loan amounts divided by the value of the property at the time the loan was originated. |
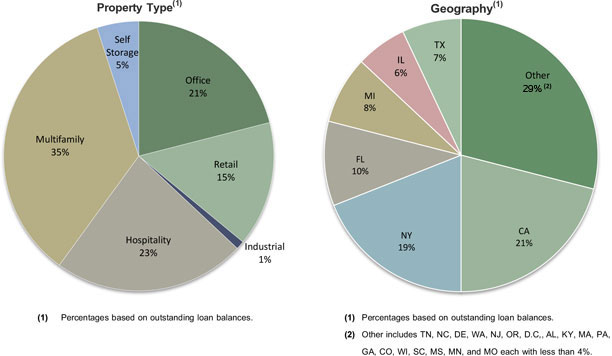
| THE REDWOOD REVIEW | 4TH QUARTER 2013 | 33 |
This Page Intentionally Left Blank
| 34 |

| 35 |
|
| ||
|
REDWOOD’S BUSINESS STRATEGY
|
Redwood’s Business Strategy
As the financial world engaged in significant deleveraging at the onset of the financial crisis, and later become deluged with liquidity, we made a strategic decision in late 2009 to invest in and build out our residential and commercial loan platforms. We did this in order to create our own steady sources of attractive investments and fee-generating opportunities as we assumed that large bank originators with excess liquidity would be more likely to retain their originations for their own investment portfolios than sell them into the secondary market to aggregators such as Redwood.
There is commonality between our residential and commercial business activities. In both cases, we have established ourselves as an intermediary between borrowers and senior investors in the capital markets. This strategy works well with the structure of our balance sheet and the talents and extensive relationships of the professionals who make up our residential and commercial teams.
On the residential side, our focus since mid-2010 has been to acquire prime, jumbo mortgages for sale through private-label securitization, and bulk-sales. While the initial market opportunity appeared small, our confidence was driven by three primary business assumptions: 1) the government would eventually reduce its outsized role in the mortgage market; 2) new bank regulation, Basel III, and legacy portfolio issues would open up an opportunity for independent mortgage companies; and 3) traditional private triple-A institutional investors would return to the market to provide attractive financing for prime residential loans through their investment in private-label securities (“PLS”). We are now seeing our business assumptions play out, although Federal Reserve monetary policy, the pace of mortgage reform legislation and regulatory directives, competitive factors, and market conditions will affect the extent to which these will positively impact our business over the near-term.
On the commercial side, we set our sights on an inevitable wave of commercial loan refinancing demand expected to result from the pre-crisis era of high-leverage lending. An immediate need was identified for mezzanine capital that could bridge the gap between commercial borrowers’ funding needs and what traditional senior lenders would provide in a deleveraged world. We also assumed that we would eventually position our platform to become an originator of senior commercial loans, offering value through greater flexibility and certainty of execution for borrowers. We have made progress in both areas, as we have originated more than $350 million of mezzanine loans since late 2010, and have originated more than $850 million of senior commercial loans since mid-2012.
Redwood’s Business Model
Our business model has evolved substantially since the financial crisis began in 2007. This evolution has, in part, been driven by our desire to build a franchise value-producing business model positioned to capitalize on the expected eventual reform of Fannie Mae and Freddie Mac and to be competitive in the post-crisis era of greater regulatory and capital requirements for all mortgage market participants, particularly for the more heavily regulated banks.
Today, Redwood is an internally-managed specialty finance company focused on residential and commercial mortgage banking and mortgage-related investments. While we remain structured as a REIT for tax purposes, we compliment our tax-advantaged investments with mortgage-banking activities conducted through taxable REIT subsidiaries that pay taxes and, if desired, can generally retain earnings and reinvest the cash flows generated therein. Our current loan acquisition strategy differs from the pre-credit crisis period when we were focused on acquiring loans in bulk through a competitive bidding process.
| 36 | THE REDWOOD REVIEW | 4TH QUARTER 2013 |
This Page Intentionally Left Blank
| 37 |
This Page Intentionally Left Blank
| 38 |
|
|
|
GLOSSARY
|
ADJUSTABLE-RATE MORTGAGES (ARM)
Adjustable-rate mortgages (“ARMs”) are loans that have coupons that adjust at least once per year. We make a distinction between ARMs (loans with a rate adjustment at least annually) and hybrids (loans that have a fixed-rate period of 2-10 years and then become adjustable-rate).
AGENCY
Agency refers to government-sponsored enterprises (“GSEs”), including Federal National Mortgage Association (“Fannie Mae”), Federal Home Loan Mortgage Corporation (“Freddie Mac”), and Government National Mortgage Association (“Ginnie Mae”).
ALT-A SECURITIES and ALT-A LOANS
Alt-A securities are residential mortgage-backed securities backed by loans that have higher credit quality than subprime and lower credit quality than prime. Alt-A originally represented loans with alternative documentation, but the definition has shifted over time to include loans with additional risk characteristics and in some cases investor loans. In an Alt-A loan, the borrower’s income may not be verified, and in some cases, may not be disclosed on the loan application. Alt-A loans may also have expanded criteria that allow for higher debt-to-income ratios with higher accompanying loan-to-value ratios than would otherwise be permissible for prime loans.
AMORTIZED COST
Amortized cost is the initial acquisition cost of an available-for-sale (“AFS”) security, minus principal repayments or principal reductions through credit losses, plus or minus premium or discount amortization. At the point in time an AFS security is deemed other-than-temporarily impaired, the amortized cost is adjusted (by changing the amount of unamortized premium or discount) by the amount of other-than temporary impairment taken through the income statement.
ASSET-BACKED SECURITIES (ABS)
Asset-backed securities (“ABS”) are securities backed by financial assets that generate cash flows. Each ABS issued from a securitization entity has a unique priority with respect to receiving principal and interest cash flows and absorbing any credit losses from the assets owned by the entity.
AVAILABLE-FOR-SALE (AFS)
An accounting method for debt and equity securities in which the securities are reported at their fair value. Positive changes in the fair value are accounted for as increases to stockholders’ equity and do not flow through the income statement. Negative changes in fair value may be recognized through the income statement or balance sheet.
B-NOTES
B-Notes are subordinate interests in commercial mortgage debt which are either (i) evidenced by a subordinated promissory note secured by the same mortgage that also secures the senior debt relating to the same property or (ii) junior participation interests in mortgage debt that are subordinate to senior participation interests in the same mortgage debt. B-Notes typically provide the holder with certain rights to approve modifications to related lending agreements and to trigger foreclosure under the mortgage following an event of default. B-Notes also typically provide the holder certain limited rights to cure a borrower default under senior debt secured by the same mortgage in order to keep the senior debt current and avoid foreclosure.
| THE REDWOOD REVIEW | 4TH QUARTER 2013 | 39 |
|
| ||
|
GLOSSARY
|
BOOK VALUE (GAAP)
Book value is the value of our common equity in accordance with GAAP.
COLLATERALIZED DEBT OBLIGATION (CDO) SECURITIZATIONS
The securitization of a diverse pool of assets.
COMMERCIAL MORTGAGE-BACKED SECURITIES (CMBS)
A type of mortgage-backed security that is secured by one or more loans on commercial properties.
CONFORMING LOAN
A conforming loan is a mortgage loan that conforms to the underwriting standards of Fannie Mae and Freddie Mac, including the maximum loan limit, which is currently $417,000 except in defined high-cost areas of the country, where the limit is higher. Changes to this maximum loan limit are announced annually by the Federal Housing Finance Agency, which is the regulator and conservator of both Fannie Mae and Freddie Mac.
CONSTANT (or CONDITIONAL) PREPAYMENT RATE (CPR)
Constant (or conditional) prepayment rate (“CPR”) is an industry-standard measure of the speed at which mortgage loans prepay. It approximates the annual percentage rate at which a pool of loans is paying down due to unscheduled principal prepayments.
CORE EQUITY
Core equity is not a measure calculated in accordance with GAAP. GAAP equity includes mark-to-market adjustments for some of our assets and interest rate agreements in “accumulated other comprehensive income (loss).” Core equity excludes accumulated other comprehensive income (loss). Core equity in some ways approximates what our equity value would be if we used historical amortized cost accounting exclusively.
CREDIT SUPPORT
Credit support is the face amount of securities subordinate (or junior) to the applicable security that protects the security from credit losses and is generally expressed as a percentage of the securitization’s underlying pool balance.
DEBT
Debt is an obligation of Redwood. See Long-term debt and Short-term debt.
FALLOUT
The percentage of loans that an originator plans or commits to sell to a buyer that ultimately do not close and are not delivered to the buyer.
FASB
Financial Accounting Standards Board.
FHFA
The FHFA refers to the Federal Housing Finance Authority.
FORWARD SALE COMMITMENT
A contract pertaining to the future sale of a loan at a specified price and within a specified time period. Mortgage bankers often use forward sale commitments to hedge interest rate risk between the date they agree to buy and the date in which the loan is sold, which is often between 30 and 60 days. This commitment qualifies as a derivative in accordance with GAAP. Any change in the value of this forward sale commitment is recorded as a market valuation adjustment in mortgage banking activities, net.
| 40 | THE REDWOOD REVIEW | 4TH QUARTER 2013 |
|
|
|
GLOSSARY
|
GAAP
Generally Accepted Accounting Principles in the United States.
GOVERNMENT SPONSORED ENTERPRISE (GSE)
A government sponsored enterprise is a financial services corporation created by the United States Congress to enhance the flow of credit to targeted sectors of the economy. Among the GSEs chartered by Congress are Fannie Mae, Freddie Mac, and Ginnie Mae.
INTEREST-ONLY SECURITIES (IOs)
Interest-only securities (“IOs”) are specialized securities created by securitization entities where the projected cash flows generated by the underlying assets exceed the cash flows projected to be paid to the securities that are issued with principal balances. Typically, IOs do not have a principal balance and they will not receive principal payments. Interest payments to IOs usually equal an interest rate formula multiplied by a “notional” principal balance. The notional principal balances for IOs are typically reduced over time as the actual principal balance of the underlying pool of assets pays down, thus reducing the cash flows to the IOs over time. Cash flows on IOs are typically reduced more quickly when asset prepayments increase.
INVESTMENT CAPACITY
The amount of capacity we estimate that we have to invest in new assets. Our estimate of our investment capacity takes into account, among other things, cash on hand, cash we estimate we could raise by prudently increasing short-term borrowings, and cash needed to cover short-term operations, working capital, and a liquidity cushion.
JUMBO LOAN
A jumbo loan is a mortgage loan that generally conforms to the underwriting standards of Fannie Mae and Freddie Mac except that the dollar amount of the loan exceeds the maximum limit set by the two GSEs for loans salable to the two companies.
LEVERAGE RATIOS
When determining Redwood’s financial leverage, traditional leverage ratios may be misleading in some respects if consolidated ABS issued from securitization entities are included as part of Redwood’s obligations when calculating this or similar ratios. Because of the requirement to consolidate the independent securitization entities for GAAP accounting purposes, it appears that Redwood is highly leveraged, with total consolidated liabilities significantly greater than equity. The obligations of these securitization entities are not obligations of Redwood.
LOAN PURCHASE COMMITMENT
A commitment to purchase a residential mortgage loan from a mortgage loan originator at a specified price and within a specified time period. A “best efforts” loan purchase commitment becomes effective once the originator has closed the loan with the borrower. A “mandatory” loan purchase commitment becomes effective once the commitment is entered into among the buyer and the originator, regardless if the originator has closed the loan. Mortgage buyers such as Redwood often issue 30 to 60 day loan purchase commitments to loan originators so that they can in turn offer a similar commitments to their borrowers. To hedge interest rate risk during the commitment period, buyers will often enter in to a forward sale commitment or hedge the risk using derivatives. (See forward sale commitment definition.) A loan purchase commitment for a conforming loan qualifies as a derivative in accordance with GAAP. Any change in the value of a loan purchase commitment is recorded as a market valuation adjustment in mortgage banking activities, net. Our loan purchase commitment for a non-conforming loan does not qualify as a derivative in accordance with GAAP and is not recorded as an asset or liability.
| THE REDWOOD REVIEW | 4TH QUARTER 2013 | 41 |
|
| ||
|
GLOSSARY
|
LONG-TERM DEBT
Long-term debt is debt that is an obligation of Redwood that is not payable within a year and includes convertible debt, junior subordinated notes and trust preferred securities. We generally treat long-term debt as part of our capital base when it is not payable in the near future.
MARK-TO-MARKET (MTM) ACCOUNTING
Mark-to-market (“MTM”) accounting uses estimated fair values of assets, liabilities, and hedges. Many assets on our consolidated balance sheet are carried at their fair value rather than amortized cost. Taxable income is generally not affected by market valuation adjustments.
MARKET VALUATION ADJUSTMENTS (MVAs)
Market valuation adjustments (“MVAs”) are changes in market values for certain assets and liabilities that are reported through our GAAP income statement. They include all changes in market values for assets and liabilities accounted for at fair value, such as trading securities and derivatives. They also include the credit portion of other-than-temporary impairments on securities available-for-sale, as well as impairments of loans held-for-sale and REO properties.
MEZZANINE LOAN
A mezzanine loan is a loan secured by the membership interests, partnership interests, and/or stock in a single purpose entity formed to own a commercial property, for example. If the mezzanine borrower fails to make its payments or otherwise defaults under the mezzanine loan documents, the mezzanine lender may pursue its remedies, including taking control of the single purpose entity that owns the property.
MORTGAGE SERVICING RIGHT (MSR)
A mortgage servicing right (“MSR”) gives the holder the contractual right to service a mortgage loan. MSRs typically include the right to collect monthly mortgage principal and interest payments, as well as related tax and insurance payments, from borrowers, disburse funds to the mortgage debt holders and remit related insurance and tax payments, collect late payments, and process modifications and foreclosures. MSRs are created when mortgage loans are sold in a transaction in which the seller retains the right to service the loans. The holder of an MSR receives a monthly servicing fee (which generally ranges from 0.25% to 0.375% per annum of the outstanding principal balance of the related mortgage loan), which is deducted from the borrower’s monthly interest payments. For accounting purposes, MSRs are capitalized at the net present value of the servicing fee less the servicing cost. When Redwood holds MSRs relating to residential mortgage loans, it retains a sub-servicer to carry out actual servicing functions, as Redwood does not directly service residential mortgage loans.
NON-PRIME SECURITIES
Non-prime securities are Alt-A, option ARM, and subprime securities. See definitions of Alt-A, option ARM, and subprime securities.
OPTION ARM LOAN
An option ARM loan is a residential mortgage loan that generally offers a borrower monthly payment options such as: 1) a minimum payment that results in negative amortization; 2) an interest-only payment; 3) a payment that would fully amortize the loan over an original 31-year amortization schedule; and, 4) a payment that would fully amortize the loan over a 15-year amortization schedule. To the extent the borrower has chosen an option that is not fully amortizing the loan (or negatively amortizing the loan), after a period — usually five years or once the negatively amortized loan balance reaches a certain level (generally 15% to 25% higher than the original balance) — the loan payments are recast. This recast provision resets the payment at a level that fully amortizes the loan over its remaining life and the new payment may be materially different than under the borrowers’ previous option.
| 42 | THE REDWOOD REVIEW | 4TH QUARTER 2013 |
|
|
|
GLOSSARY
|
PREFERRED EQUITY
A preferred equity investment is an investment in preferred equity of a special purpose entity that directly or indirectly owns a commercial property. An investor in preferred equity is typically entitled to a preferred return (relative to a holder of common equity of the same entity) and has the right, if the preferred return is not paid, to take control of the entity (and thereby control the underlying commercial property).
PRIME RESIDENTIAL REAL ESTATE LOANS
Prime loans are residential loans with higher quality credit characteristics, such as borrowers with higher FICO credit scores, lower loan-to-value ratios, lower debt-to-income ratios, greater levels of other assets, and more documentation.
PRIME SECURITIES
Prime securities are residential mortgage-backed securities backed by prime loans, generally with balances greater than conforming loan limits. Prime securities are typically backed by loans that have relatively high weighted average FICO scores (e.g., 700 or higher at origination), low weighted average LTVs (e.g., 75% or less at origination), limited concentrations of investor properties, and low percentages of loans with low FICO scores or high loan-to-value ratios.
PRINCIPAL-ONLY SECURITIES (POs)
Principal-only securities (“POs”) are specialized securities created by securitization entities where the holder is only entitled to receive regular cash flows that are derived from incoming principal repayments on an underlying mortgage loan pool. This security is created by splitting a mortgage-backed security into its interest and principal payments. The principal payments create a string of cash ?ows which are sold at a discount to investors. These investors will receive the principal portions of the monthly mortgage payments from the underlying pool of loans. The yield on a PO strip depends on the prepayment speed of the underlying loan. The faster the principal is repaid, the higher the yield an investor will receive.
PROFITABILITY RATIOS
Many financial institution analysts use asset-based profitability ratios such as interest rate spread and interest rate margin when analyzing financial institutions. These are asset-based measures. Since we consolidate the assets and liabilities of securitization entities for GAAP purposes, our total GAAP assets and liabilities may vary over time, and may not be comparable to assets typically used in profitability calculations for other financial institutions. As a result, we believe equity-based profitability ratios may be more appropriate than asset-based measures for analyzing Redwood’s operations and results. We believe, for example, that net interest income as a percentage of equity is a useful measure of profitability. For operating expenses, we believe useful measures are operating efficiency ratio (operating expenses as a percentage of net interest income) and operating expenses as a percentage of equity. We provide various profitability ratios in Table 4 in the Financial Tables in this Review.
REAL ESTATE INVESTMENT TRUST (REIT)
A real estate investment trust (“REIT”) is an entity that makes a tax election to be taxed as a REIT, invests in real estate assets, and meets other REIT qualifications, including the distribution as dividends of at least 90% of its REIT taxable income. A REIT’s profits are not taxed at the corporate level to the extent that these profits are distributed as dividends to stockholders, providing an operating cost savings. On the other hand, the requirement to pay out as dividends most of the REIT’s taxable profits means it can be harder for a REIT to grow using only internally-generated funds (as opposed to raising new capital).
| THE REDWOOD REVIEW | 4TH QUARTER 2013 | 43 |
|
| ||
|
GLOSSARY
|
REAL ESTATE OWNED (REO)
Real estate owned (“REO”) refers to real property owned by the lender or loan owner that has been acquired through foreclosure.
REIT SUBSIDIARY
A REIT subsidiary is a subsidiary of a REIT that is taxed as a REIT.
REIT TAXABLE INCOME
REIT taxable income is not a measure calculated in accordance with GAAP. REIT taxable income is pretax income calculated for tax purposes at Redwood including only its qualifying REIT subsidiaries (i.e., excluding its taxable subsidiaries, with certain adjustments). REIT taxable income is an important measure as it is the basis of our dividend distribution requirements. We must annually distribute at least 90% of REIT taxable income as dividends to shareholders. As a REIT, we are not subject to corporate income taxes on the REIT taxable income we distribute. We pay corporate income tax on the REIT taxable income we retain, if any (and we are permitted to retain up to 10% of total REIT taxable income). A reconciliation of REIT taxable income to GAAP income appears in Table 2 in the Financial Tables in this Review.
REMIC
A real estate mortgage investment conduit (“REMIC”) is a special purpose vehicle used to pool real estate mortgages and issue mortgage-backed securities. REMICs are typically exempt from tax at the entity level. REMICs may invest only in qualified mortgages and permitted investments, including single family or multifamily mortgages, commercial mortgages, second mortgages, mortgage participations, and federal agency pass-through securities.
RE-REMIC SECURITY
A re-REMIC is a re-securitization of asset-backed securities. The cash flows from and any credit losses absorbed by the underlying assets can be redirected to the resulting re-REMIC securities in a variety of ways.
RESECURITIZATION
A resecuritization is a securitization of two or more mortgage-backed securities into a new mortgage-backed security.
RESIDENTIAL MORTGAGE-BACKED SECURITIES (RMBS)
A type of mortgage-backed security that is backed by a pool of mortgages on residential properties.
RETURN ON EQUITY (ROE) and ADJUSTED RETURN ON EQUITY
ROE is the amount of profit we generate each year per dollar of equity capital and equals GAAP income divided by GAAP equity. Adjusted ROE is not a measure calculated in accordance with GAAP — it is GAAP income divided by core equity.
SENIOR SECURITIES
Generally, senior securities have the least credit risk in a securitization transaction because they are generally the last securities to absorb credit losses. In addition, the senior securities have the highest claim on the principal and interest payments (after the fees to servicers and trustees are paid). To further reduce credit risk, most if not all, principal collected from the underlying asset pool is used to pay down the senior securities until certain performance tests are satisfied. If certain performance tests are satisfied, principal payments are shared between the senior securities and the subordinate securities, generally on a pro rata basis. At issuance, senior securities are generally triple A-rated.
| 44 | THE REDWOOD REVIEW | 4TH QUARTER 2013 |
|
|
|
GLOSSARY
|
SEQUOIA
Sequoia is the brand name for securitizations of residential real estate loans Redwood sponsors. Sequoia entities are independent securitization entities that acquire residential mortgage loans and create and issue asset-backed securities (“ABS”) backed by these loans. Most of the loans that Sequoia entities acquire are prime-quality loans. Most of the senior ABS created by Sequoia are sold to third-party investors. Redwood usually acquires most of the subordinated ABS and occasionally acquires the interest-only securities (“IOs”).
SHORT-TERM DEBT
Short-term debt is debt that is an obligation of Redwood and payable within a year. We may obtain this debt from a variety of Wall Street firms, banks, and other institutions. We may issue these or other forms of short term debt in the future. We may use short-term debt to finance the accumulation of assets prior to sale to a securitization entity and to finance investments in loans and securities.
SUBORDINATE DEBT INVESTMENTS
Subordinate Debt Investments mean Mezzanine Loans, Preferred Equity, and B-Notes.
SUBORDINATE SECURITIES (JUNIOR SECURITIES or NON-SENIOR SECURITIES)
Subordinate securities absorb the initial credit losses from a securitization structure, thus protecting the senior securities. Subordinate securities have a lower priority to receive principal and interest payments than the senior securities. Subordinate securities receive little, if any, principal payments until certain performance tests are satisfied. If certain performance tests are satisfied, principal payments are shared between the senior securities and the subordinate securities, generally on a pro rata basis. Subordinate securities generally receive interest payments even if they do not receive principal payments. At issuance, subordinate securities are generally rated double-A or below.
SUBPRIME SECURITIES
Subprime securities are residential mortgage-backed securities backed by loans to borrowers who typically have lower credit scores and/or other credit deficiencies that prevent them from qualifying for prime or Alt-A mortgages and may have experienced credit problems in the past, such as late payments or bankruptcies. To compensate for the greater risks and higher costs to service the loans, subprime borrowers pay higher interest rates, points, and origination fees.
TAXABLE INCOME
Taxable income is not a measure calculated in accordance with GAAP. Taxable income is pre-tax income for Redwood and all its subsidiaries as calculated for tax purposes. Taxable income calculations differ significantly from GAAP income calculations. A reconciliation of taxable income to GAAP income appears in Table 2 in the Financial Tables in this Review.
TAXABLE SUBSIDIARY
A taxable subsidiary is a subsidiary of a REIT that is not taxed as a REIT and thus pays taxes on its income. A taxable subsidiary is not limited to investing in real estate and it can choose to retain all of its after-tax profits.
TO BE ANNOUNCED (TBA)
A term used to describe a forward Agency mortgage-backed securities trade. Pass-through securities issued by Freddie Mac, Fannie Mae and Ginnie Mae trade in the TBA market. The term TBA is derived from the fact that the actual mortgage-backed security that will be delivered to fulfill a TBA trade is not designated at the time the trade is made. The securities are “to be announced” 48 hours prior to the established trade settlement date.
| THE REDWOOD REVIEW | 4TH QUARTER 2013 | 45 |
This Page Intentionally Left Blank
| 46 |

| 47 |

|
Table 1: GAAP Earnings (in thousands, except per share data) | 48
| ||
| 2013 Q4 |
2013 Q3 |
2013 Q2 |
2013 Q1 |
2012 Q4 |
2012 Q3 |
2012 Q2 |
2012 Q1 |
2011 Q4 |
Twelve Months 2013 |
Twelve Months 2012 |
||||||||||||||||||||||||||||||||||
| Interest income |
$ | 48,331 | $ | 50,139 | $ | 51,195 | $ | 47,361 | $ | 48,025 | $ | 54,001 | $ | 52,629 | $ | 51,355 | $ | 48,512 | $ | 197,026 | $ | 206,010 | ||||||||||||||||||||||
| Discount amortization on securities, net |
10,311 | 8,785 | 8,153 | 7,672 | 7,103 | 7,317 | 8,318 | 8,258 | 9,339 | 34,921 | 30,996 | |||||||||||||||||||||||||||||||||
| Premium amortization expense on loans |
(1,150 | ) | (1,504 | ) | (1,629 | ) | (1,508 | ) | (1,731 | ) | (1,595 | ) | (1,424 | ) | (872 | ) | (1,356 | ) | (5,791 | ) | (5,622 | ) | ||||||||||||||||||||||
| Total interest income |
57,492 | 57,420 | 57,719 | 53,525 | 53,397 | 59,723 | 59,523 | 58,741 | 56,495 | 226,156 | 231,384 | |||||||||||||||||||||||||||||||||
| Interest expense on short-term debt |
(3,715 | ) | (5,227 | ) | (4,686 | ) | (3,808 | ) | (2,526 | ) | (2,737 | ) | (2,299 | ) | (1,828 | ) | (764 | ) | (17,436 | ) | (9,390 | ) | ||||||||||||||||||||||
| Interest expense on ABS |
(7,697 | ) | (8,182 | ) | (8,725 | ) | (9,345 | ) | (15,051 | ) | (21,370 | ) | (22,337 | ) | (24,553 | ) | (24,030 | ) | (33,949 | ) | (83,311 | ) | ||||||||||||||||||||||
| ABS issuance expense amortization |
(737 | ) | (811 | ) | (882 | ) | (985 | ) | (915 | ) | (552 | ) | (602 | ) | (569 | ) | (630 | ) | (3,415 | ) | (2,638 | ) | ||||||||||||||||||||||
| ABS interest rate agreement expense |
(62 | ) | (62 | ) | (68 | ) | (87 | ) | (11,561 | ) | (1,127 | ) | (1,136 | ) | (1,204 | ) | (1,171 | ) | (279 | ) | (15,028 | ) | ||||||||||||||||||||||
| ABS issuance premium amortization expense |
(407 | ) | (548 | ) | (576 | ) | (542 | ) | (412 | ) | (113 | ) | (115 | ) | (115 | ) | (136 | ) | (2,073 | ) | (755 | ) | ||||||||||||||||||||||
| Total ABS expense consolidated from trusts (1) |
(8,903 | ) | (9,603 | ) | (10,251 | ) | (10,959 | ) | (27,939 | ) | (23,162 | ) | (24,190 | ) | (26,441 | ) | (25,967 | ) | (39,716 | ) | (101,732 | ) | ||||||||||||||||||||||
| Interest expense on long-term debt |
(6,910 | ) | (6,894 | ) | (6,480 | ) | (3,535 | ) | (2,451 | ) | (2,377 | ) | (2,379 | ) | (2,376 | ) | (2,384 | ) | (23,819 | ) | (9,583 | ) | ||||||||||||||||||||||
| Total interest expense |
(19,528 | ) | (21,724 | ) | (21,417 | ) | (18,302 | ) | (32,916 | ) | (28,276 | ) | (28,868 | ) | (30,645 | ) | (29,115 | ) | (80,971 | ) | (120,705 | ) | ||||||||||||||||||||||
| Net interest income |
37,964 | 35,696 | 36,302 | 35,223 | 20,481 | 31,447 | 30,655 | 28,096 | 27,380 | 145,185 | 110,679 | |||||||||||||||||||||||||||||||||
| (Provision for) reversal of provision for loan losses |
(4,243 | ) | (1,728 | ) | 3,272 | (2,038 | ) | (3,394 | ) | (1,319 | ) | 1,340 | (275 | ) | (7,784 | ) | (4,737 | ) | (3,648 | ) | ||||||||||||||||||||||||
| Net interest income after provision |
33,721 | 33,968 | 39,574 | 33,185 | 17,087 | 30,128 | 31,995 | 27,821 | 19,596 | 140,448 | 107,031 | |||||||||||||||||||||||||||||||||
| Noninterest income |
||||||||||||||||||||||||||||||||||||||||||||
| Mortgage banking activities, net |
16,749 | (9,057 | ) | 47,984 | 45,000 | 21,765 | 12,775 | (3,173 | ) | 4,953 | - | 100,676 | 36,319 | |||||||||||||||||||||||||||||||
| MSR income (loss), net |
5,628 | 3,113 | 10,547 | 1,021 | (479 | ) | (472 | ) | (434 | ) | (7 | ) | - | 20,309 | (1,391 | ) | ||||||||||||||||||||||||||||
| Other market valuation adjustments, net |
390 | 462 | (6,258 | ) | (303 | ) | 1,941 | 957 | (86 | ) | (1,273 | ) | (9,682 | ) | (5,709 | ) | 1,539 | |||||||||||||||||||||||||||
| Realized gains on sales, net (2) |
1,935 | 10,469 | 223 | 12,266 | 20,336 | 13,940 | 6,995 | 13,508 | - | 24,893 | 54,779 | |||||||||||||||||||||||||||||||||
| Realized gains on calls, net |
33 | - | 333 | - | 29 | - | - | 113 | 102 | 366 | 142 | |||||||||||||||||||||||||||||||||
| Realized gains, net |
1,968 | 10,469 | 556 | 12,266 | 20,365 | 13,940 | 6,995 | 13,621 | 102 | 25,259 | 54,921 | |||||||||||||||||||||||||||||||||
| Total noninterest income (loss) |
24,735 | 4,987 | 52,829 | 57,984 | 43,592 | 27,200 | 3,302 | 17,294 | (9,580 | ) | 140,535 | 91,388 | ||||||||||||||||||||||||||||||||
| Fixed compensation expense |
(5,750 | ) | (5,808 | ) | (6,067 | ) | (5,623 | ) | (4,275 | ) | (4,412 | ) | (4,373 | ) | (4,835 | ) | (3,799 | ) | (23,248 | ) | (17,895 | ) | ||||||||||||||||||||||
| Variable compensation expense |
(3,908 | ) | (5,636 | ) | (3,974 | ) | (4,850 | ) | (5,475 | ) | (5,602 | ) | (3,037 | ) | (2,606 | ) | (721 | ) | (18,367 | ) | (16,720 | ) | ||||||||||||||||||||||
| Equity compensation expense |
(2,196 | ) | (1,997 | ) | (3,396 | ) | (2,487 | ) | (2,499 | ) | (2,151 | ) | (2,958 | ) | (2,176 | ) | (2,371 | ) | (10,076 | ) | (9,784 | ) | ||||||||||||||||||||||
| Severance expense |
- | (445 | ) | (3,366 | ) | (68 | ) | - | - | - | (200 | ) | - | (3,879 | ) | (200 | ) | |||||||||||||||||||||||||||
| Other operating expense |
(7,633 | ) | (8,075 | ) | (6,888 | ) | (6,623 | ) | (6,176 | ) | (4,946 | ) | (4,810 | ) | (4,828 | ) | (5,683 | ) | (29,219 | ) | (20,760 | ) | ||||||||||||||||||||||
| Total operating expenses |
(19,487 | ) | (21,961 | ) | (23,690 | ) | (19,651 | ) | (18,425 | ) | (17,111 | ) | (15,178 | ) | (14,645 | ) | (12,574 | ) | (84,789 | ) | (65,359 | ) | ||||||||||||||||||||||
| Other expense |
(12,000 | ) | - | - | - | - | - | - | - | - | (12,000 | ) | - | |||||||||||||||||||||||||||||||
| (Provision for) benefit from income taxes |
(1,835 | ) | 4,935 | (3,140 | ) | (10,908 | ) | (176 | ) | (516 | ) | (592 | ) | (7 | ) | - | (10,948 | ) | (1,291 | ) | ||||||||||||||||||||||||
| Net income (loss) |
$ | 25,134 | $ | 21,929 | $ | 65,573 | $ | 60,610 | $ | 42,078 | $ | 39,701 | $ | 19,527 | $ | 30,463 | $ | (2,558 | ) | $ | 173,246 | $ | 131,769 | |||||||||||||||||||||
| Diluted average shares |
84,395 | 84,422 | 96,172 | 87,345 | 82,498 | 80,764 | 78,815 | 79,892 | 78,370 | 93,695 | 80,674 | |||||||||||||||||||||||||||||||||
| Net income (loss) per share |
$ | 0.29 | $ | 0.25 | $ | 0.71 | $ | 0.69 | $ | 0.50 | $ | 0.48 | $ | 0.24 | $ | 0.37 | $ | (0.03 | ) | $ | 1.94 | $ | 1.59 | |||||||||||||||||||||
(1) Interest expense on ABS issued for the fourth quarter of 2012 includes accelerated recognition of $11 million of deferred hedging costs relating to Acacia entities upon deconsolidation of these entities.
(2) Realized gains on sales, net includes $15 million of gains related to the deconsolidation of certain Sequoia and Acacia entities during the fourth quarter of 2012.
| THE REDWOOD REVIEW 4TH QUARTER 2013
|
Table 1: GAAP Earnings | |||
|
|
Table 2: Taxable and GAAP Income(1) Differences and Dividends (in thousands, except per share data) | |||
| Estimated Twelve Months 2013 (2) | Actual Twelve Months 2012 | Actual Twelve Months 2011 | ||||||||||||||||||||||||||||||||||
| Taxable Income |
GAAP Income |
Differences | Taxable Income |
GAAP Income |
Differences | Taxable Income |
GAAP Income |
Differences | ||||||||||||||||||||||||||||
| Taxable and GAAP Income Differences |
||||||||||||||||||||||||||||||||||||
| Interest income |
$ | 208,627 | $ | 226,156 | $ | (17,529 | ) | $ | 160,737 | $ | 231,384 | $ | (70,647 | ) | $ | 128,334 | $ | 217,179 | $ | (88,845 | ) | |||||||||||||||
| Interest expense |
(55,470 | ) | (80,971 | ) | 25,501 | (26,187 | ) | (120,705 | ) | 94,518 | (15,804 | ) | (99,037 | ) | 83,233 | |||||||||||||||||||||
| Net interest income |
153,157 | 145,185 | 7,972 | 134,550 | 110,679 | 23,871 | 112,530 | 118,142 | (5,612 | ) | ||||||||||||||||||||||||||
| Provision for loan losses |
- | (4,737 | ) | 4,737 | - | (3,648 | ) | 3,648 | - | (16,151 | ) | 16,151 | ||||||||||||||||||||||||
| Realized credit losses |
(13,068 | ) | - | (13,068 | ) | (25,609 | ) | - | (25,609 | ) | (57,526 | ) | - | (57,526 | ) | |||||||||||||||||||||
| Other market valuation adjustments, net |
- | (5,709 | ) | 5,709 | - | 1,539 | (1,539 | ) | - | (40,017 | ) | 40,017 | ||||||||||||||||||||||||
| Mortgage banking activities, net |
17,708 | 100,676 | (82,968 | ) | (401 | ) | 36,319 | (36,720 | ) | - | - | - | ||||||||||||||||||||||||
| MSR income, net |
8,218 | 20,309 | (12,091 | ) | 623 | (1,391 | ) | 2,014 | - | - | - | |||||||||||||||||||||||||
| Operating expenses |
(72,406 | ) | (84,789 | ) | 12,383 | (56,156 | ) | (65,359 | ) | 9,203 | (45,166 | ) | (47,741 | ) | 2,575 | |||||||||||||||||||||
| Other expense |
- | (12,000 | ) | 12,000 | - | - | - | - | - | - | ||||||||||||||||||||||||||
| Realized gains, net |
- | 25,259 | (25,259 | ) | - | 54,921 | (54,921 | ) | - | 10,946 | (10,946 | ) | ||||||||||||||||||||||||
| Provision for income taxes |
(291 | ) | (10,948 | ) | 10,657 | (93 | ) | (1,291 | ) | 1,198 | (16 | ) | (42 | ) | 26 | |||||||||||||||||||||
| Less: Net loss attributable to noncontrolling interest
|
- | - | - | - | - | - | - | (1,147 | ) | 1,147 | ||||||||||||||||||||||||||
| Income |
$ | 93,318 | $ | 173,246 | $ | (79,928 | ) | $ | 52,914 | $ | 131,769 | $ | (78,855 | ) | $ | 9,822 | $ | 26,284 | $ | (16,462 | ) | |||||||||||||||
| REIT taxable income |
$ | 76,169 | $ | 60,542 | $ | 19,543 | ||||||||||||||||||||||||||||||
| Taxable income (loss) at taxable subsidiaries |
17,149 | (7,627 | ) | (9,721 | ) | |||||||||||||||||||||||||||||||
| Taxable income |
$ | 93,318 | $ | 52,915 | $ | 9,822 | ||||||||||||||||||||||||||||||
| Shares used for taxable EPS calculation |
82,505 | 81,716 | 78,556 | |||||||||||||||||||||||||||||||||
| REIT taxable income per share (3) |
$ | 0.93 | $ | 0.75 | $ | 0.24 | ||||||||||||||||||||||||||||||
| Taxable income (loss) per share at taxable subsidiaries |
$ | 0.21 | $ | (0.09 | ) | $ | (0.12 | ) | ||||||||||||||||||||||||||||
| Taxable income per share (3) |
$ | 1.14 | $ | 0.66 | $ | 0.12 | ||||||||||||||||||||||||||||||
| Dividends |
||||||||||||||||||||||||||||||||||||
| Dividends declared |
$ | 92,005 | $ | 80,134 | $ | 78,382 | ||||||||||||||||||||||||||||||
| Dividends per share (4)
|
$ | 1.12 | $ | 1.00 | $ | 1.00 | ||||||||||||||||||||||||||||||
(1) Taxable income for 2013 is an estimate until we file our tax returns.
(2) Reconciliation of GAAP income to taxable income (loss) for prior quarters is provided in the respective Redwood Reviews for those quarters.
(3) REIT taxable income per share and taxable income (loss) per share are based on the number of shares outstanding at the end of each quarter. The annual REIT taxable income per share and taxable income (loss) per share are the sum of the four quarterly per share estimates.
(4) Dividends in 2013 are expected to be characterized as 89% ordinary income, or $82 million, and 11% return of capital, or $10 million. Dividends in 2012 were characterized as 77% ordinary income, or $62 million, and 23% return of capital, or $18 million. Dividends in 2011 were characterized as 25% ordinary income, or $19 million, and 75% return of capital, or $59 million. The portion of Redwood’s dividends characterized as a return of capital is not taxable to a shareholder and reduces a shareholder’s basis for shares held at each quarterly distribution date, but not to below $0.
| THE REDWOOD REVIEW 4TH QUARTER 2013
|
Table 2: Taxable and GAAP Income Differences and Dividends |
49
| ||
|
|
Table 3: Book Value and Financial Ratios ($ in millions, except per share data) | 50
| ||
| 2013 Q4 |
2013 Q3 |
2013 Q2 |
2013 Q1 |
2012 Q4 |
2012 Q3 |
2012 Q2 |
2012 Q1 |
2011 Q4 |
||||||||||||||||||||||||||||
| Short-term debt |
$ | 863 | $ | 838 | $ | 1,446 | $ | 721 | $ | 552 | $ | 522 | $ | 455 | $ | 441 | $ | 428 | ||||||||||||||||||
| Long-term debt |
477 | 472 | 444 | 444 | 140 | 140 | 140 | 140 | 140 | |||||||||||||||||||||||||||
| Total debt at Redwood |
$ | 1,340 | $ | 1,310 | $ | 1,890 | $ | 1,165 | $ | 692 | $ | 662 | $ | 595 | $ | 581 | $ | 568 | ||||||||||||||||||
| ABS issued at consolidated entities |
||||||||||||||||||||||||||||||||||||
| Residential Resecuritization ABS issued |
95 | 112 | 134 | 149 | 165 | 179 | 193 | 207 | 220 | |||||||||||||||||||||||||||
| Commercial Securitization ABS issued |
154 | 159 | 160 | 160 | 172 | - | - | - | - | |||||||||||||||||||||||||||
| Legacy Sequoia entities ABS issued |
1,694 | 1,791 | 1,921 | 2,056 | 2,193 | 2,995 | 3,126 | 3,260 | 3,710 | |||||||||||||||||||||||||||
| Legacy Acacia entities ABS issued |
- | - | - | - | - | 255 | 244 | 237 | 209 | |||||||||||||||||||||||||||
| Total ABS issued |
1,943 | 2,062 | 2,214 | 2,365 | 2,530 | 3,429 | 3,564 | 3,704 | 4,139 | |||||||||||||||||||||||||||
| Consolidated GAAP Debt |
$ | 3,283 | $ | 3,372 | $ | 4,104 | $ | 3,529 | $ | 3,222 | $ | 4,091 | $ | 4,159 | $ | 4,285 | $ | 4,707 | ||||||||||||||||||
| Stockholders’ equity |
$ | 1,245 | $ | 1,207 | $ | 1,209 | $ | 1,188 | $ | 1,140 | $ | 1,050 | $ | 951 | $ | 962 | $ | 893 | ||||||||||||||||||
| Debt at Redwood to stockholders’ equity |
1.1x | 1.1x | 1.6x | 1.0x | 0.6x | 0.6x | 0.6x | 0.6x | 0.6x | |||||||||||||||||||||||||||
| Consolidated GAAP debt to stockholders’ equity |
2.6x | 2.8x | 3.4x | 3.0x | 2.8x | 3.9x | 4.4x | 4.5x | 5.3x | |||||||||||||||||||||||||||
| Shares outstanding at period end (in thousands) |
82,505 | 82,389 | 82,332 | 81,706 | 81,716 | 81,526 | 79,263 | 78,756 | 78,556 | |||||||||||||||||||||||||||
| Book value per share |
$ | 15.10 | $ | 14.65 | $ | 14.69 | $ | 14.54 | $ | 13.95 | $ | 12.88 | $ | 12.00 | $ | 12.22 | $ | 11.36 | ||||||||||||||||||
| THE REDWOOD REVIEW 4TH QUARTER 2013
|
Table 3: Book Value and Financial Ratios | |||
|
|
Table 4: Yields and Profitability Ratios(1) ($ in thousands) | |||
| 2013 Q4 |
2013 Q3 |
2013 Q2 |
2013 Q1 |
2012 Q4 (2) |
2012 Q3 |
2012 Q2 |
2012 Q1 |
2011 Q4 |
Twelve Months 2013 |
Twelve Months 2012 |
||||||||||||||||||||||||||||||||||
| Interest income |
$ | 57,492 | $ | 57,420 | $ | 57,719 | $ | 53,525 | $ | 53,397 | $ | 59,723 | $ | 59,523 | $ | 58,741 | $ | 56,495 | $ | 226,156 | $ | 231,384 | ||||||||||||||||||||||
| Average consolidated earning assets |
$ | 4,482,980 | $ | 4,808,815 | $ | 4,858,695 | $ | 4,569,121 | $ | 4,856,538 | $ | 5,178,913 | $ | 5,146,111 | $ | 5,351,918 | $ | 5,419,721 | $ | 4,680,020 | $ | 5,132,946 | ||||||||||||||||||||||
| Asset yield |
5.13% | 4.78% | 4.75% | 4.69% | 4.40% | 4.61% | 4.63% | 4.39% | 4.17% | 4.83% | 4.51% | |||||||||||||||||||||||||||||||||
| Interest expense |
$ | (19,528 | ) | $ | (21,724 | ) | $ | (21,417 | ) | $ | (18,302 | ) | $ | (32,916 | ) | $ | (28,276 | ) | $ | (28,868 | ) | $ | (30,645 | ) | $ | (29,115 | ) | $ | (80,971 | ) | $ | (120,705 | ) | |||||||||||
| Average consolidated interest-bearing liabilities |
$ | 3,333,438 | $ | 3,710,613 | $ | 3,747,078 | $ | 3,494,668 | $ | 3,727,576 | $ | 4,166,828 | $ | 4,207,316 | $ | 4,423,167 | $ | 4,481,303 | $ | 3,571,389 | $ | 4,130,216 | ||||||||||||||||||||||
| Cost of funds |
2.34% | 2.34% | 2.29% | 2.09% | 3.53% | 2.71% | 2.74% | 2.77% | 2.60% | 2.27% | 2.92% | |||||||||||||||||||||||||||||||||
| Asset yield |
5.13% | 4.78% | 4.75% | 4.69% | 4.40% | 4.61% | 4.63% | 4.39% | 4.17% | 4.83% | 4.51% | |||||||||||||||||||||||||||||||||
| Cost of funds |
(2.34% | ) | (2.34% | ) | (2.29% | ) | (2.09% | ) | (3.53% | ) | (2.71% | ) | (2.74% | ) | (2.77% | ) | (2.60% | ) | (2.27% | ) | (2.92% | ) | ||||||||||||||||||||||
| Interest rate spread |
2.79% | 2.43% | 2.47% | 2.59% | 0.87% | 1.90% | 1.88% | 1.62% | 1.57% | 2.57% | 1.59% | |||||||||||||||||||||||||||||||||
| Net interest income |
$ | 37,964 | $ | 35,696 | $ | 36,302 | $ | 35,223 | $ | 20,481 | $ | 31,447 | $ | 30,655 | $ | 28,096 | $ | 27,380 | $ | 145,185 | $ | 110,679 | ||||||||||||||||||||||
| Average consolidated earning assets |
$ | 4,482,980 | $ | 4,808,815 | $ | 4,858,695 | $ | 4,569,121 | $ | 4,856,538 | $ | 5,178,913 | $ | 5,146,111 | $ | 5,351,918 | $ | 5,419,721 | $ | 4,680,020 | $ | 5,132,946 | ||||||||||||||||||||||
| Net interest margin |
3.39% | 2.97% | 2.99% | 3.08% | 1.69% | 2.43% | 2.38% | 2.10% | 2.02% | 3.10% | 2.16% | |||||||||||||||||||||||||||||||||
| Operating expenses |
$ | (19,487 | ) | $ | (21,961 | ) | $ | (23,690 | ) | $ | (19,651 | ) | $ | (18,425 | ) | $ | (17,111 | ) | $ | (15,178 | ) | $ | (14,645 | ) | $ | (12,574 | ) | $ | (84,789 | ) | $ | (65,359 | ) | |||||||||||
| Average total assets |
$ | 4,681,988 | $ | 5,010,779 | $ | 5,103,812 | $ | 4,823,321 | $ | 5,090,253 | $ | 5,371,679 | $ | 5,307,961 | $ | 5,505,797 | $ | 5,577,206 | $ | 4,904,878 | $ | 5,318,442 | ||||||||||||||||||||||
| Average total equity |
$ | 1,217,273 | $ | 1,217,418 | $ | 1,204,807 | $ | 1,161,546 | $ | 1,088,565 | $ | 987,692 | $ | 945,805 | $ | 926,138 | $ | 912,051 | $ | 1,200,461 | $ | 987,329 | ||||||||||||||||||||||
| Operating expenses / net interest income |
51.33% | 61.52% | 65.26% | 55.79% | 89.96% | 54.41% | 49.51% | 52.12% | 45.92% | 58.40% | 59.05% | |||||||||||||||||||||||||||||||||
| Operating expenses / average total assets |
1.66% | 1.75% | 1.86% | 1.63% | 1.45% | 1.27% | 1.14% | 1.06% | 0.90% | 1.73% | 1.23% | |||||||||||||||||||||||||||||||||
| Operating expenses / average total equity |
6.40% | 7.22% | 7.87% | 6.77% | 6.77% | 6.93% | 6.42% | 6.33% | 5.51% | 7.06% | 6.62% | |||||||||||||||||||||||||||||||||
| GAAP net income (loss) |
$ | 25,134 | $ | 21,929 | $ | 65,573 | $ | 60,610 | $ | 42,078 | $ | 39,701 | $ | 19,527 | $ | 30,463 | $ | (2,558 | ) | $ | 173,246 | $ | 131,769 | |||||||||||||||||||||
| GAAP net income (loss) / average total assets |
2.15% | 1.75% | 5.14% | 5.03% | 3.31% | 2.96% | 1.47% | 2.21% | (0.18% | ) | 3.53% | 2.48% | ||||||||||||||||||||||||||||||||
| GAAP net income (loss) / average equity (GAAP ROE) |
8.26% | 7.21% | 21.77% | 20.87% | 15.46% | 16.08% | 8.26% | 13.16% | (1.12% | ) | 14.43% | 13.35% | ||||||||||||||||||||||||||||||||
(1) All percentages in this table are shown on an annualized basis.
| THE REDWOOD REVIEW 4TH QUARTER 2013
|
Table 4: Yields and Profitability Ratios |
51
| ||
|
|
Table 5: Average Balance Sheet ($ in thousands) | 52
| ||
| 2013 Q4 |
2013 Q3 |
2013 Q2 |
2013 Q1 |
2012 Q4 |
2012 Q3 |
2012 Q2 |
2012 Q1 |
2011 Q4 |
Twelve Months 2013 |
Twelve Months 2012 |
||||||||||||||||||||||||||||||||||
| Real estate assets at Redwood |
|
|||||||||||||||||||||||||||||||||||||||||||
| Residential loans - Held-for-sale |
$ | 554,467 | $ | 860,923 | $ | 1,060,347 | $ | 818,950 | $ | 418,722 | $ | 466,246 | $ | 363,882 | $ | 319,353 | $ | 306,869 | $ | 823,049 | $ | 392,326 | ||||||||||||||||||||||
| Commercial loans - Held-for-investment |
346,333 | 347,633 | 332,113 | 319,760 | 296,990 | 267,032 | 199,440 | 169,432 | 123,367 | 336,563 | 233,490 | |||||||||||||||||||||||||||||||||
| Commercial loans - Held-for-sale |
- | - | 11,351 | 49,061 | 6,886 | - | - | - | - | 14,927 | 1,731 | |||||||||||||||||||||||||||||||||
| Commercial loans - Fair value |
73,204 | 67,999 | 39,015 | - | - | - | - | - | - | 45,318 | - | |||||||||||||||||||||||||||||||||
| Senior residential securities |
||||||||||||||||||||||||||||||||||||||||||||
| Prime |
586,675 | 440,616 | 453,230 | 416,774 | 427,149 | 447,994 | 457,549 | 325,619 | 248,211 | 474,697 | 414,703 | |||||||||||||||||||||||||||||||||
| Non-prime |
178,994 | 187,724 | 227,295 | 235,583 | 243,336 | 236,006 | 262,084 | 280,970 | 280,066 | 207,190 | 255,512 | |||||||||||||||||||||||||||||||||
| Total senior residential securities |
765,669 | 628,340 | 680,525 | 652,357 | 670,485 | 684,000 | 719,633 | 606,589 | 528,277 | 681,887 | 670,215 | |||||||||||||||||||||||||||||||||
| Residential Re-REMIC securities |
102,836 | 101,808 | 100,824 | 99,769 | 99,088 | 99,890 | 105,281 | 87,001 | 74,560 | 101,319 | 97,824 | |||||||||||||||||||||||||||||||||
| Subordinate residential securities |
||||||||||||||||||||||||||||||||||||||||||||
| Prime |
492,708 | 440,235 | 320,490 | 218,477 | 153,223 | 118,549 | 104,078 | 81,253 | 69,477 | 368,927 | 114,394 | |||||||||||||||||||||||||||||||||
| Non-prime |
- | 1,286 | 2,051 | 2,064 | 3,783 | 6,669 | 8,325 | 9,721 | 11,433 | 1,344 | 7,114 | |||||||||||||||||||||||||||||||||
| Total subordinate residential securities |
492,708 | 441,521 | 322,541 | 220,541 | 157,006 | 125,218 | 112,403 | 90,974 | 80,910 | 370,271 | 121,508 | |||||||||||||||||||||||||||||||||
| Commercial subordinate securities |
- | - | - | 766 | 2,154 | 4,047 | 3,980 | 3,946 | 4,272 | 189 | 3,530 | |||||||||||||||||||||||||||||||||
| CDO |
- | - | - | - | 4 | 14 | 14 | 762 | 960 | - | 198 | |||||||||||||||||||||||||||||||||
| Mortgage servicing rights |
60,822 | 55,622 | 31,318 | 10,299 | 4,867 | 2,122 | 1,729 | 859 | - | 39,698 | 2,394 | |||||||||||||||||||||||||||||||||
| Total real estate assets at Redwood |
2,396,039 | 2,503,846 | 2,578,034 | 2,171,503 | 1,656,202 | 1,648,569 | 1,506,362 | 1,278,916 | 1,119,215 | 2,413,221 | 1,523,216 | |||||||||||||||||||||||||||||||||
| Earning assets at Acacia |
- | - | - | - | 171,650 | 270,891 | 262,959 | 252,907 | 255,801 | - | 239,502 | |||||||||||||||||||||||||||||||||
| Earning assets at Consolidated Sequoia |
1,793,535 | 1,910,814 | 2,043,820 | 2,177,315 | 2,751,130 | 3,128,076 | 3,258,137 | 3,597,081 | 3,838,327 | 1,980,127 | 3,182,273 | |||||||||||||||||||||||||||||||||
| Total earning assets at Legacy Consolidated Entities |
1,793,535 | 1,910,814 | 2,043,820 | 2,177,315 | 2,922,780 | 3,398,967 | 3,521,096 | 3,849,988 | 4,094,128 | 1,980,127 | 3,421,775 | |||||||||||||||||||||||||||||||||
| Cash and cash equivalents |
167,453 | 274,657 | 96,998 | 77,911 | 177,555 | 86,531 | 94,511 | 211,786 | 203,242 | 154,829 | 142,538 | |||||||||||||||||||||||||||||||||
| Earning assets |
4,357,027 | 4,689,317 | 4,718,852 | 4,426,729 | 4,756,537 | 5,134,067 | 5,121,969 | 5,340,690 | 5,416,585 | 4,548,177 | 5,087,529 | |||||||||||||||||||||||||||||||||
| Balance sheet mark-to-market adjustments |
125,953 | 119,498 | 139,843 | 142,392 | 100,001 | 44,846 | 24,142 | 12,087 | 3,136 | 131,843 | 45,417 | |||||||||||||||||||||||||||||||||
| Earning assets - reported value |
4,482,980 | 4,808,815 | 4,858,695 | 4,569,121 | 4,856,538 | 5,178,913 | 5,146,111 | 5,351,918 | 5,419,721 | 4,680,020 | 5,132,946 | |||||||||||||||||||||||||||||||||
| Other assets |
199,008 | 201,964 | 245,117 | 254,200 | 233,715 | 192,766 | 161,850 | 153,020 | 157,485 | 224,858 | 185,496 | |||||||||||||||||||||||||||||||||
| Total assets |
$ | 4,681,988 | $ | 5,010,779 | $ | 5,103,812 | $ | 4,823,321 | $ | 5,090,253 | $ | 5,371,679 | $ | 5,307,961 | $ | 5,505,797 | $ | 5,577,206 | $ | 4,904,878 | $ | 5,318,442 | ||||||||||||||||||||||
| Short-term debt |
$ | 893,481 | $ | 1,150,917 | $ | 1,053,610 | $ | 854,238 | $ | 539,579 | $ | 570,775 | $ | 474,053 | $ | 362,107 | $ | 157,992 | $ | 988,616 | $ | 487,003 | ||||||||||||||||||||||
| Residential Resecuritization ABS issued |
99,940 | 118,338 | 138,817 | 153,487 | 168,634 | 182,702 | 196,837 | 210,360 | 222,652 | 127,473 | 189,557 | |||||||||||||||||||||||||||||||||
| Commercial Securitization ABS issued |
150,716 | 155,661 | 155,812 | 163,409 | 61,830 | - | - | - | - | 156,362 | 15,542 | |||||||||||||||||||||||||||||||||
| Consolidated Sequoia ABS issued |
1,722,583 | 1,835,401 | 1,965,149 | 2,099,041 | 2,661,564 | 3,039,273 | 3,166,476 | 3,504,155 | 3,738,132 | 1,904,320 | 3,091,542 | |||||||||||||||||||||||||||||||||
| Acacia ABS issued |
- | - | - | - | 154,617 | 235,789 | 231,673 | 208,281 | 224,273 | - | 207,522 | |||||||||||||||||||||||||||||||||
| Other liabilities |
131,277 | 82,748 | 151,927 | 167,107 | 274,112 | 217,159 | 154,840 | 156,492 | 183,852 | 133,028 | 200,897 | |||||||||||||||||||||||||||||||||
| Other long-term debt |
466,718 | 450,296 | 433,690 | 224,493 | 141,352 | 138,289 | 138,277 | 138,264 | 138,254 | 394,618 | 139,050 | |||||||||||||||||||||||||||||||||
| Total liabilities |
3,464,715 | 3,793,361 | 3,899,005 | 3,661,775 | 4,001,688 | 4,383,987 | 4,362,156 | 4,579,659 | 4,665,155 | 3,704,417 | 4,331,113 | |||||||||||||||||||||||||||||||||
| Total equity
|
1,217,273 | 1,217,418 | 1,204,807 | 1,161,546 | 1,088,565 | 987,692 | 945,805 | 926,138 | 912,051 | 1,200,461 | 987,329 | |||||||||||||||||||||||||||||||||
| Total liabilities and equity |
$ | 4,681,988 | $ | 5,010,779 | $ | 5,103,812 | $ | 4,823,321 | $ | 5,090,253 | $ | 5,371,679 | $ | 5,307,961 | $ | 5,505,797 | $ | 5,577,206 | $ | 4,904,878 | $ | 5,318,442 | ||||||||||||||||||||||
| THE REDWOOD REVIEW 4TH QUARTER 2013
|
Table 5: Average Balance Sheet | |||
|
|
Table 6: Balances & Yields by Securities Portfolio at Redwood(1) ($ in thousands) | |||
|
2013 Q4 |
2013 Q3 |
2013 Q2 |
2013 Q1 |
2012 Q4 |
2012 Q3 |
2013 Q4 |
2013 Q3 |
2013 Q2 |
2013 Q1 |
2012 Q4 |
2012 Q3 |
|||||||||||||||||||||||||||||||||||||||||
| Residential Prime Senior |
|
Residential Non-Prime Subordinate |
|
|||||||||||||||||||||||||||||||||||||||||||||||||
| Principal balance |
$ | 670,051 | $ | 379,598 | $ | 435,536 | $ | 460,273 | $ | 485,033 | $ | 517,737 | Principal balance |
$ | 12,021 | $ | 12,054 | $ | 19,294 | $ | 19,869 | $ | 20,194 | $ | 30,221 | |||||||||||||||||||||||||||
| Unamortized discount |
(44,133 | ) | (47,000 | ) | (42,520 | ) | (48,893 | ) | (53,601 | ) | (59,832 | ) | Unamortized discount |
(11,207 | ) | (11,240 | ) | (11,982 | ) | (11,993 | ) | (15,666 | ) | (19,309 | ) | |||||||||||||||||||||||||||
| Credit reserve |
(10,144 | ) | (12,964 | ) | (32,068 | ) | (28,326 | ) | (26,100 | ) | (22,657 | ) | Credit reserve |
(814 | ) | (814 | ) | (5,270 | ) | (5,829 | ) | (2,433 | ) | (4,582 | ) | |||||||||||||||||||||||||||
| Unrealized gains, net |
46,532 | 44,188 | 49,211 | 64,260 | 61,191 | 55,161 | Unrealized (losses) gains, net |
143 | 133 | 149 | 394 | 226 | 225 | |||||||||||||||||||||||||||||||||||||||
| Interest-only securities |
110,505 | 117,443 | 123,591 | 55,289 | 10,409 | 6,301 | ||||||||||||||||||||||||||||||||||||||||||||||
| Fair value |
$ | 772,811 | $ | 481,265 | $ | 533,750 | $ | 502,603 | $ | 476,932 | $ | 496,710 | Fair value |
$ | 143 | $ | 133 | $ | 2,191 | $ | 2,441 | $ | 2,321 | $ | 6,555 | |||||||||||||||||||||||||||
| Average amortized cost |
$ | 586,675 | $ | 440,616 | $ | 453,230 | $ | 416,775 | $ | 427,149 | $ | 447,994 | Average amortized cost |
$ | - | $ | 1,286 | $ | 2,051 | $ | 2,064 | $ | 3,783 | $ | 6,669 | |||||||||||||||||||||||||||
| Interest income |
$ | 13,230 | $ | 12,639 | $ | 12,341 | $ | 9,723 | $ | 9,113 | $ | 9,620 | Interest income |
$ | 40 | $ | 124 | $ | 165 | $ | 155 | $ | 266 | $ | 446 | |||||||||||||||||||||||||||
| Annualized yield |
9.02% | 11.47% | 10.89% | 9.33% | 8.53% | 8.59% | Annualized yield |
N/A | 38.57% | 32.18% | 30.04% | 28.13% | 26.75% | |||||||||||||||||||||||||||||||||||||||
| Residential Non-Prime Senior |
|
Commercial Subordinate |
|
|||||||||||||||||||||||||||||||||||||||||||||||||
| Principal balance |
$ | 218,603 | $ | 225,649 | $ | 259,524 | $ | 268,926 | $ | 278,229 | $ | 287,877 | Principal balance |
$ | - | $ | - | $ | - | $ | - | $ | 29,331 | $ | 40,342 | |||||||||||||||||||||||||||
| Unamortized discount |
(36,882 | ) | (40,243 | ) | (39,030 | ) | (40,541 | ) | (42,842 | ) | (46,330 | ) | Unamortized discount |
- | - | - | - | (3,362 | ) | (3,509 | ) | |||||||||||||||||||||||||||||||
| Credit reserve |
(13,840 | ) | (12,813 | ) | (18,078 | ) | (18,079 | ) | (18,104 | ) | (17,046 | ) | Credit reserve |
- | - | - | - | (23,916 | ) | (33,206 | ) | |||||||||||||||||||||||||||||||
| Unrealized gains, net |
25,505 | 22,561 | 22,271 | 30,118 | 27,983 | 15,370 | Unrealized gains, net |
- | - | - | - | 12,016 | 3,992 | |||||||||||||||||||||||||||||||||||||||
| Interest-only securities |
9,070 | 8,864 | 17,525 | 21,582 | 22,134 | 22,941 | ||||||||||||||||||||||||||||||||||||||||||||||
| Fair value |
$ | 202,456 | $ | 204,018 | $ | 242,212 | $ | 262,006 | $ | 267,400 | $ | 262,812 | Fair value |
$ | - | $ | - | $ | - | $ | - | $ | 14,069 | $ | 7,619 | |||||||||||||||||||||||||||
| Average amortized cost |
$ | 178,994 | $ | 187,724 | $ | 227,296 | $ | 235,583 | $ | 243,336 | $ | 236,006 | Average amortized cost |
$ | - | $ | - | $ | - | $ | 766 | $ | 2,154 | $ | 4,047 | |||||||||||||||||||||||||||
| Interest income |
$ | 4,589 | $ | 4,789 | $ | 5,825 | $ | 6,011 | $ | 6,248 | $ | 6,286 | Interest income |
$ | - | $ | - | $ | - | $ | 625 | $ | 230 | $ | 643 | |||||||||||||||||||||||||||
| Annualized yield |
10.26% | 10.20% | 10.25% | 10.21% | 10.27% | 10.65% | Annualized yield |
N/A | N/A | N/A | 326.37% | 42.71% | 63.55% | |||||||||||||||||||||||||||||||||||||||
| Residential Re-REMIC |
|
CDO Subordinate |
|
|||||||||||||||||||||||||||||||||||||||||||||||||
| Principal balance |
$ | 214,046 | $ | 214,660 | $ | 215,169 | $ | 215,235 | $ | 215,863 | $ | 216,159 | Principal balance |
$ | - | $ | - | $ | - | $ | - | $ | - | $ | 10,778 | |||||||||||||||||||||||||||
| Unamortized discount |
(80,188 | ) | (78,789 | ) | (69,590 | ) | (64,547 | ) | (69,310 | ) | (61,123 | ) | Unamortized discount |
- | - | - | - | - | (3,461 | ) | ||||||||||||||||||||||||||||||||
| Credit reserve |
(30,429 | ) | (33,621 | ) | (44,195 | ) | (50,406 | ) | (47,235 | ) | (56,158 | ) | Credit reserve |
- | - | - | - | - | (7,303 | ) | ||||||||||||||||||||||||||||||||
| Unrealized gains, net |
72,947 | 54,096 | 52,783 | 63,155 | 63,717 | 51,095 | Unrealized gains, net |
- | - | - | - | - | 50 | |||||||||||||||||||||||||||||||||||||||
| Fair value |
$ | 176,376 | $ | 156,346 | $ | 154,167 | $ | 163,437 | $ | 163,035 | $ | 149,973 | Fair value |
$ | - | $ | - | $ | - | $ | - | $ | - | $ | 64 | |||||||||||||||||||||||||||
| Average amortized cost |
$ | 102,836 | $ | 101,808 | $ | 100,824 | $ | 99,769 | $ | 99,088 | $ | 99,890 | Average amortized cost |
$ | - | $ | - | $ | - | $ | - | $ | 4 | $ | 14 | |||||||||||||||||||||||||||
| Interest income |
$ | 3,883 | $ | 3,574 | $ | 3,835 | $ | 3,758 | $ | 3,385 | $ | 3,282 | Interest income |
$ | - | $ | - | $ | - | $ | - | $ | - | $ | 4 | |||||||||||||||||||||||||||
| Annualized yield |
15.10% | 14.04% | 15.21% | 15.07% | 13.66% | 13.14% | Annualized yield |
N/A | N/A | N/A | N/A | N/A | 114.29% | |||||||||||||||||||||||||||||||||||||||
| Residential Prime Subordinate |
|
|||||||||||||||||||||||||||||||||||||||||||||||||||
| Principal balance |
$ | 709,629 | $ | 664,597 | $ | 536,235 | $ | 428,588 | $ | 290,276 | $ | 259,124 | ||||||||||||||||||||||||||||||||||||||||
| Unamortized discount |
(136,643 | ) | (122,631 | ) | (84,645 | ) | (71,412 | ) | (33,930 | ) | (27,407 | ) | ||||||||||||||||||||||||||||||||||||||||
| Credit reserve |
(61,643 | ) | (76,080 | ) | (90,799 | ) | (83,148 | ) | (93,160 | ) | (99,209 | ) | ||||||||||||||||||||||||||||||||||||||||
| Unrealized gains, net |
19,526 | 16,778 | 20,936 | 25,676 | 21,447 | 12,688 | ||||||||||||||||||||||||||||||||||||||||||||||
| Interest-only securities |
206 | 252 | 258 | 337 | 363 | 346 | ||||||||||||||||||||||||||||||||||||||||||||||
| Fair value |
$ | 531,075 | $ | 482,916 | $ | 381,985 | $ | 300,041 | $ | 184,996 | $ | 145,542 | ||||||||||||||||||||||||||||||||||||||||
| Average amortized cost |
$ | 492,708 | $ | 440,235 | $ | 320,490 | $ | 218,477 | $ | 153,224 | $ | 118,549 | ||||||||||||||||||||||||||||||||||||||||
| Interest income |
$ | 9,345 | $ | 8,523 | $ | 6,948 | $ | 5,446 | $ | 4,562 | $ | 4,443 | ||||||||||||||||||||||||||||||||||||||||
| Annualized yield |
7.59% | 7.74% | 8.67% | 9.97% | 11.91% | 14.99% | ||||||||||||||||||||||||||||||||||||||||||||||
(1) Annualized yields for AFS portfolios are based on average amortized cost. Cash flows from many of our subordinate securities can be volatile and in certain cases (e.g., when the fair value of certain securities are close to zero) any interest income earned can result in unusually high reported yields that are not sustainable and not necessarily meaningful.
| THE REDWOOD REVIEW 4TH QUARTER 2013
|
Table 6: Balances & Yields by Securities Portfolio at Redwood |
53
| ||
|
|
Table 7: Securities and Loans Portfolio Activity at Redwood ($ in thousands) | 54
| ||
|
2013 Q4 |
2013 Q3 |
2013 Q2 |
2013 Q1 |
2012 Q4 |
2012 Q3 |
2013 Q4 |
2013 Q3 |
2013 Q2 |
2013 Q1 |
2012 Q4 |
2012 Q3 |
|||||||||||||||||||||||||||||||||||||||||
| Residential Prime Senior |
|
Commercial Subordinate |
|
|||||||||||||||||||||||||||||||||||||||||||||||||
| Beginning fair value |
$ | 481,265 | $ | 533,750 | $ | 502,603 | $ | 476,932 | $ | 496,710 | $ | 507,103 | Beginning fair value |
$ | - | $ | - | $ | - | $ | 14,069 | $ | 7,619 | $ | 5,761 | |||||||||||||||||||||||||||
| Acquisitions |
318,983 | 112,644 | 40,642 | 51,208 | 6,708 | 16,913 | Acquisitions |
- | - | - | - | - | - | |||||||||||||||||||||||||||||||||||||||
| Sales |
(13,036 | ) | (137,807 | ) | (8,677 | ) | (8,257 | ) | (9,285 | ) | (18,160 | ) | Sales |
- | - | - | (2,031 | ) | (1,484 | ) | - | |||||||||||||||||||||||||||||||
| Effect of principal payments |
(26,055 | ) | (24,159 | ) | (24,019 | ) | (23,840 | ) | (22,102 | ) | (21,983 | ) | Effect of principal payments |
- | - | - | - | - | - | |||||||||||||||||||||||||||||||||
| Change in fair value, net |
11,654 | (3,163 | ) | 23,201 | 6,560 | 4,901 | 12,837 | Change in fair value, net (1) |
- | - | - | (12,038 | ) | 7,934 | 1,858 | |||||||||||||||||||||||||||||||||||||
| Ending fair value |
$ | 772,811 | $ | 481,265 | $ | 533,750 | $ | 502,603 | $ | 476,932 | $ | 496,710 | Ending fair value |
$ | - | $ | - | $ | - | $ | - | $ | 14,069 | $ | 7,619 | |||||||||||||||||||||||||||
| Residential Non-Prime Senior |
|
CDO Subordinate |
|
|||||||||||||||||||||||||||||||||||||||||||||||||
| Beginning fair value |
$ | 204,018 | $ | 242,212 | $ | 262,006 | $ | 267,400 | $ | 262,812 | $ | 264,970 | Beginning fair value |
$ | - | $ | - | $ | - | $ | - | $ | 64 | $ | 64 | |||||||||||||||||||||||||||
| Acquisitions |
- | - | - | - | (188 | ) | 20,850 | Acquisitions |
- | - | - | - | - | - | ||||||||||||||||||||||||||||||||||||||
| Sales |
- | (31,725 | ) | - | - | - | (23,004 | ) | Sales |
- | - | - | - | (259 | ) | - | ||||||||||||||||||||||||||||||||||||
| Effect of principal payments |
(6,145 | ) | (7,969 | ) | (8,397 | ) | (8,110 | ) | (7,797 | ) | (7,505 | ) | Effect of principal payments |
- | - | - | - | - | - | |||||||||||||||||||||||||||||||||
| Change in fair value, net |
4,583 | 1,500 | (11,397 | ) | 2,716 | 12,573 | 7,501 | Change in fair value, net |
- | - | - | - | 195 | - | ||||||||||||||||||||||||||||||||||||||
| Ending fair value |
$ | 202,456 | $ | 204,018 | $ | 242,212 | $ | 262,006 | $ | 267,400 | $ | 262,812 | Ending fair value |
$ | - | $ | - | $ | - | $ | - | $ | - | $ | 64 | |||||||||||||||||||||||||||
| Residential Re-REMIC |
|
Residential Loans |
|
|||||||||||||||||||||||||||||||||||||||||||||||||
| Beginning fair value |
$ | 156,346 | $ | 154,167 | $ | 163,437 | $ | 163,035 | $ | 149,973 | $ | 147,437 | Beginning carrying value |
$ | 727,879 | $ | 1,221,098 | $ | 831,953 | $ | 562,658 | $ | 417,982 | $ | 256,077 | |||||||||||||||||||||||||||
| Acquisitions |
- | - | - | - | - | - | Acquisitions |
658,806 | 1,294,372 | 2,567,426 | 2,586,899 | 789,416 | 524,043 | |||||||||||||||||||||||||||||||||||||||
| Sales |
- | - | - | - | - | (5,376 | ) | Sales |
(979,661 | ) | (1,771,726 | ) | (2,135,166 | ) | (2,349,089 | ) | (665,078 | ) | (372,362 | ) | ||||||||||||||||||||||||||||||||
| Effect of principal payments |
- | - | - | - | - | - | Principal repayments |
(9,511 | ) | (4,190 | ) | (1,768 | ) | (3,286 | ) | (2,483 | ) | (4,842 | ) | |||||||||||||||||||||||||||||||||
| Change in fair value, net |
20,030 | 2,179 | (9,270 | ) | 402 | 13,062 | 7,912 | Changes in fair value, net |
6,754 | (11,675 | ) | (41,347 | ) | 34,771 | 22,821 | 15,066 | ||||||||||||||||||||||||||||||||||||
| Ending fair value |
$ | 176,376 | $ | 156,346 | $ | 154,167 | $ | 163,437 | $ | 163,035 | $ | 149,973 | Ending carrying value |
$ | 404,267 | $ | 727,879 | $ | 1,221,098 | $ | 831,953 | $ | 562,658 | $ | 417,982 | |||||||||||||||||||||||||||
| Residential Prime Subordinate |
|
Commercial Loans |
|
|||||||||||||||||||||||||||||||||||||||||||||||||
| Beginning fair value |
$ | 482,916 | $ | 381,985 | $ | 300,041 | $ | 184,996 | $ | 145,542 | $ | 123,472 | Beginning carrying value |
$ | 379,853 | $ | 494,823 | $ | 401,438 | $ | 313,010 | $ | 286,070 | $ | 246,783 | |||||||||||||||||||||||||||
| Acquisitions |
49,437 | 110,213 | 92,368 | 114,728 | 35,097 | 18,576 | Originations |
245,045 | 121,523 | 168,365 | 189,407 | 44,182 | 40,154 | |||||||||||||||||||||||||||||||||||||||
| Sales |
(1,095 | ) | - | - | - | - | - | Sales |
(186,443 | ) | (238,102 | ) | (73,780 | ) | (88,212 | ) | (15,000 | ) | - | |||||||||||||||||||||||||||||||||
| Effect of principal payments |
(4,409 | ) | (5,481 | ) | (4,549 | ) | (4,002 | ) | (3,394 | ) | (3,072 | ) | Principal repayments |
(11,200 | ) | (848 | ) | (100 | ) | (12,272 | ) | (95 | ) | (491 | ) | |||||||||||||||||||||||||||
| Change in fair value, net |
4,226 | (3,801 | ) | (5,875 | ) | 4,319 | 7,751 | 6,566 | Provision for loan losses |
(869 | ) | (844 | ) | (891 | ) | (685 | ) | (2,320 | ) | (506 | ) | |||||||||||||||||||||||||||||||
| Ending fair value |
$ | 531,075 | $ | 482,916 | $ | 381,985 | $ | 300,041 | $ | 184,996 | $ | 145,542 | Discount/fee amortization |
201 | 138 | 136 | 190 | 173 | 130 | |||||||||||||||||||||||||||||||||
| Changes in fair value, net |
5,868 | 3,163 | (345 | ) | - | - | - | |||||||||||||||||||||||||||||||||||||||||||||
| Residential Non-Prime Subordinate |
|
Ending carrying value |
$ | 432,455 | $ | 379,853 | $ | 494,823 | $ | 401,438 | $ | 313,010 | $ | 286,070 | ||||||||||||||||||||||||||||||||||||||
| Beginning fair value |
$ | 133 | $ | 2,191 | $ | 2,441 | $ | 2,321 | $ | 6,555 | $ | 7,970 | ||||||||||||||||||||||||||||||||||||||||
| Acquisitions |
- | - | - | - | - | - | ||||||||||||||||||||||||||||||||||||||||||||||
| Sales |
- | (2,185 | ) | - | - | (4,193 | ) | (1,868 | ) | |||||||||||||||||||||||||||||||||||||||||||
| Effect of principal payments |
(5 | ) | (16 | ) | (14 | ) | (66 | ) | (75 | ) | (143 | ) | ||||||||||||||||||||||||||||||||||||||||
| Change in fair value, net |
15 | 143 | (236 | ) | 186 | 34 | 596 | |||||||||||||||||||||||||||||||||||||||||||||
| Ending fair value |
$ | 143 | $ | 133 | $ | 2,191 | $ | 2,441 | $ | 2,321 | $ | 6,555 | ||||||||||||||||||||||||||||||||||||||||
(1) During the first quarter of 2013, the change in fair value, net reflects the liquidation of our remaining commercial securities, resulting in an ending fair value of zero for this portfolio.
| THE REDWOOD REVIEW 4TH QUARTER 2013
|
Table 7: Securities and Loans Portfolio Activity at Redwood | |||
|
|
Table 8A: Residential Prime Securities at Redwood and Underlying Loan Characteristics(1) ($ in thousands) | |||
| 2013 Q4 |
2013 Q3 |
2013 Q2 |
2013 Q1 |
2012 Q4 |
2012 Q3 |
2012 Q2 |
2012 Q1 |
|||||||||||||||||||||||||
| Senior AFS |
$ | 662,307 | $ | 363,822 | $ | 410,159 | $ | 447,314 | $ | 466,523 | $ | 490,409 | $ | 490,802 | $ | 436,783 | ||||||||||||||||
| Subordinate AFS |
526,095 | 478,369 | 381,631 | 299,600 | 184,528 | 145,096 | 123,005 | 105,788 | ||||||||||||||||||||||||
| Fair value |
115,485 | 121,990 | 123,945 | 55,730 | 10,877 | 6,747 | 16,768 | 22,266 | ||||||||||||||||||||||||
| Total Residential Prime Securities |
$ | 1,303,887 | $ | 964,181 | $ | 915,735 | $ | 802,644 | $ | 661,928 | $ | 642,252 | $ | 630,575 | $ | 564,837 | ||||||||||||||||
| Number of loans |
56,529 | 53,426 | 56,088 | 56,047 | 60,883 | 60,584 | 63,986 | 81,085 | ||||||||||||||||||||||||
| Total loan face |
$ | 27,818,960 | $ | 25,617,759 | $ | 26,269,089 | $ | 26,754,040 | $ | 26,968,619 | $ | 26,183,495 | $ | 27,988,787 | $ | 30,222,071 | ||||||||||||||||
| Average loan size |
$ | 492 | $ | 479 | $ | 468 | $ | 477 | $ | 443 | $ | 432 | $ | 437 | $ | 373 | ||||||||||||||||
| Vintage |
||||||||||||||||||||||||||||||||
| Year 2013 origination |
20% | 16% | 9% | 2% | 0% | 0% | 0% | 0% | ||||||||||||||||||||||||
| Year 2012 origination |
10% | 11% | 10% | 11% | 4% | 1% | 1% | 0% | ||||||||||||||||||||||||
| Year 2011 origination |
1% | 2% | 2% | 2% | 2% | 2% | 2% | 2% | ||||||||||||||||||||||||
| Year 2010 origination |
0% | 0% | 0% | 0% | 0% | 0% | 0% | 0% | ||||||||||||||||||||||||
| Year 2009 origination |
0% | 0% | 0% | 0% | 0% | 0% | 0% | 0% | ||||||||||||||||||||||||
| Year 2008 origination |
0% | 0% | 0% | 0% | 0% | 0% | 0% | 0% | ||||||||||||||||||||||||
| Year 2007 origination |
17% | 14% | 15% | 16% | 18% | 12% | 12% | 11% | ||||||||||||||||||||||||
| Year 2006 origination |
3% | 2% | 3% | 4% | 4% | 3% | 3% | 3% | ||||||||||||||||||||||||
| Year 2005 origination |
14% | 15% | 17% | 17% | 18% | 17% | 17% | 17% | ||||||||||||||||||||||||
| Year 2004 origination and earlier |
35% | 40% | 44% | 48% | 54% | 65% | 65% | 67% | ||||||||||||||||||||||||
| Geographic concentration |
||||||||||||||||||||||||||||||||
| Southern CA |
22% | 22% | 22% | 22% | 23% | 23% | 23% | 23% | ||||||||||||||||||||||||
| Northern CA |
22% | 23% | 21% | 21% | 21% | 21% | 21% | 21% | ||||||||||||||||||||||||
| New York |
6% | 6% | 6% | 7% | 7% | 7% | 7% | 7% | ||||||||||||||||||||||||
| Florida |
5% | 5% | 5% | 6% | 6% | 6% | 6% | 6% | ||||||||||||||||||||||||
| Virginia |
4% | 3% | 4% | 3% | 3% | 3% | 3% | 3% | ||||||||||||||||||||||||
| New Jersey |
3% | 3% | 3% | 3% | 3% | 3% | 3% | 3% | ||||||||||||||||||||||||
| Illinois |
3% | 3% | 3% | 3% | 3% | 3% | 3% | 3% | ||||||||||||||||||||||||
| Other states |
35% | 35% | 36% | 35% | 34% | 34% | 34% | 34% | ||||||||||||||||||||||||
| Wtd Avg Original LTV |
69% | 69% | 69% | 69% | 69% | 69% | 69% | 68% | ||||||||||||||||||||||||
| Original LTV: 0 - 50 |
10% | 11% | 10% | 11% | 10% | 11% | 11% | 12% | ||||||||||||||||||||||||
| Original LTV: 50.01 - 60 |
12% | 12% | 12% | 11% | 11% | 11% | 11% | 11% | ||||||||||||||||||||||||
| Original LTV: 60.01 - 70 |
22% | 23% | 23% | 22% | 22% | 23% | 23% | 23% | ||||||||||||||||||||||||
| Original LTV: 70.01 - 80 |
53% | 51% | 52% | 53% | 53% | 51% | 51% | 50% | ||||||||||||||||||||||||
| Original LTV: 80.01 - 90 |
2% | 2% | 2% | 2% | 3% | 3% | 3% | 3% | ||||||||||||||||||||||||
| Original LTV: 90.01 - 100 |
1% | 1% | 1% | 1% | 1% | 1% | 1% | 1% | ||||||||||||||||||||||||
| Wtd Avg Original FICO |
743 | 735 | 737 | 732 | 729 | 735 | 735 | 735 | ||||||||||||||||||||||||
| Original FICO: <= 680 |
9% | 9% | 10% | 10% | 11% | 11% | 11% | 11% | ||||||||||||||||||||||||
| Original FICO: 681 - 700 |
8% | 8% | 9% | 10% | 10% | 11% | 11% | 10% | ||||||||||||||||||||||||
| Original FICO: 701 - 720 |
11% | 12% | 12% | 13% | 14% | 14% | 14% | 14% | ||||||||||||||||||||||||
| Original FICO: 721 - 740 |
14% | 14% | 14% | 14% | 15% | 15% | 15% | 15% | ||||||||||||||||||||||||
| Original FICO: 741 - 760 |
15% | 15% | 15% | 15% | 16% | 16% | 16% | 16% | ||||||||||||||||||||||||
| Original FICO: 761 - 780 |
19% | 19% | 18% | 18% | 17% | 17% | 17% | 17% | ||||||||||||||||||||||||
| Original FICO: 781 - 800 |
18% | 17% | 16% | 15% | 13% | 12% | 12% | 12% | ||||||||||||||||||||||||
| Original FICO: >= 801 |
5% | 5% | 5% | 4% | 3% | 3% | 3% | 3% | ||||||||||||||||||||||||
| Original Unknown |
1% | 1% | 1% | 1% | 1% | 1% | 1% | 2% | ||||||||||||||||||||||||
| Conforming balance % (2) |
39% | 41% | 44% | 47% | 50% | 53% | 52% | 54% | ||||||||||||||||||||||||
| > $1 MM % |
12% | 12% | 11% | 11% | 10% | 9% | 9% | 9% | ||||||||||||||||||||||||
| 2nd Home % |
6% | 6% | 7% | 7% | 7% | 7% | 7% | 7% | ||||||||||||||||||||||||
| Investment Property % |
2% | 2% | 2% | 2% | 2% | 2% | 2% | 2% | ||||||||||||||||||||||||
| Purchase |
42% | 40% | 41% | 42% | 43% | 41% | 41% | 40% | ||||||||||||||||||||||||
| Cash Out Refinance |
20% | 21% | 22% | 22% | 23% | 23% | 23% | 23% | ||||||||||||||||||||||||
| Rate-Term Refinance |
38% | 39% | 37% | 36% | 34% | 36% | 36% | 36% | ||||||||||||||||||||||||
| Other |
0% | 0% | 0% | 0% | 0% | 0% | 0% | 1% | ||||||||||||||||||||||||
| Full Documentation |
67% | 65% | 63% | 60% | 56% | 55% | 55% | 53% | ||||||||||||||||||||||||
| No Documentation |
4% | 4% | 4% | 4% | 5% | 4% | 4% | 6% | ||||||||||||||||||||||||
| Other Doc (Lim, Red, Stated, etc) |
28% | 30% | 32% | 34% | 37% | 38% | 38% | 38% | ||||||||||||||||||||||||
| Unknown/Not Categorized |
1% | 1% | 1% | 2% | 2% | 3% | 3% | 3% | ||||||||||||||||||||||||
| Single Family |
89% | 89% | 89% | 88% | 88% | 88% | 88% | 88% | ||||||||||||||||||||||||
| Condominium |
8% | 8% | 8% | 9% | 9% | 9% | 9% | 9% | ||||||||||||||||||||||||
| 2-4 Family |
2% | 2% | 2% | 2% | 2% | 2% | 2% | 2% | ||||||||||||||||||||||||
| Other
|
1% | 1% | 1% | 1% | 1% | 1% | 1% | 1% | ||||||||||||||||||||||||
(1) Only the loan groups providing direct cash flow to securities we own are included.
(2) The definition of a conforming loan has significantly changed over time. For Q3 2011 and subsequent periods, the conforming balance definition that went into effect on October 1, 2011 was used (which had a maximum loan balance of $625,500). For all periods prior to Q3 2011, the conforming balance definition available in June 2011 was used (which had a maximum loan balance of $729,750).
| THE REDWOOD REVIEW 4TH QUARTER 2013
|
Table 8A: Residential Prime Securities at Redwood and Underlying Loan Characteristics |
55
| ||
|
|
Table 8B: Residential Non-Prime Securities at Redwood and Underlying Loan Characteristics(1) ($ in thousands) | 56
| ||
| 2013 Q4 |
2013 Q3 |
2013 Q2 |
2013 Q1 |
2012 Q4 |
2012 Q3 |
2012 Q2 |
2012 Q1 |
|||||||||||||||||||||||||
| Senior AFS |
$ | 193,386 | $ | 195,154 | $ | 224,687 | $ | 240,424 | $ | 245,266 | $ | 239,871 | $ | 242,007 | $ | 255,279 | ||||||||||||||||
| Subordinate AFS |
143 | 133 | 2,046 | 2,284 | 2,160 | 6,404 | 7,867 | 8,142 | ||||||||||||||||||||||||
| Fair value |
9,070 | 8,864 | 17,670 | 21,739 | 22,295 | 23,092 | 23,066 | 19,762 | ||||||||||||||||||||||||
| Total Residential Non-prime Securities |
$ | 202,599 | $ | 204,151 | $ | 244,403 | $ | 264,447 | $ | 269,721 | $ | 269,367 | $ | 272,940 | $ | 283,183 | ||||||||||||||||
| Number of loans |
25,641 | 23,206 | 29,986 | 31,362 | 32,542 | 33,775 | 34,815 | 35,452 | ||||||||||||||||||||||||
| Total loan face |
$ | 5,077,820 | $ | 4,481,710 | $ | 6,149,038 | $ | 6,520,375 | $ | 6,837,832 | $ | 6,760,747 | $ | 7,019,443 | $ | 7,241,685 | ||||||||||||||||
| Average loan size |
$ | 198 | $ | 193 | $ | 205 | $ | 208 | $ | 210 | $ | 200 | $ | 202 | $ | 204 | ||||||||||||||||
| Vintage |
||||||||||||||||||||||||||||||||
| Year 2006 origination |
23% | 13% | 20% | 20% | 20% | 1% | 1% | 1% | ||||||||||||||||||||||||
| Year 2005 origination |
53% | 59% | 50% | 50% | 49% | 54% | 54% | 54% | ||||||||||||||||||||||||
| Year 2004 origination and earlier |
24% | 28% | 30% | 30% | 31% | 45% | 45% | 45% | ||||||||||||||||||||||||
| Geographic concentration |
||||||||||||||||||||||||||||||||
| Southern CA |
22% | 23% | 23% | 23% | 23% | 22% | 22% | 22% | ||||||||||||||||||||||||
| Northern CA |
14% | 14% | 15% | 15% | 15% | 16% | 16% | 16% | ||||||||||||||||||||||||
| Florida |
9% | 8% | 8% | 8% | 8% | 8% | 8% | 9% | ||||||||||||||||||||||||
| New York |
5% | 5% | 5% | 5% | 5% | 6% | 6% | 5% | ||||||||||||||||||||||||
| Virginia |
3% | 2% | 3% | 3% | 3% | 2% | 2% | 2% | ||||||||||||||||||||||||
| New Jersey |
3% | 3% | 3% | 3% | 3% | 3% | 3% | 3% | ||||||||||||||||||||||||
| Illinois |
3% | 3% | 3% | 3% | 3% | 3% | 3% | 3% | ||||||||||||||||||||||||
| Other states |
41% | 42% | 40% | 40% | 40% | 40% | 40% | 40% | ||||||||||||||||||||||||
| Wtd Avg Original LTV |
73% | 73% | 73% | 73% | 73% | 73% | 72% | 72% | ||||||||||||||||||||||||
| Original LTV: 0 - 50 |
6% | 6% | 6% | 6% | 6% | 7% | 7% | 7% | ||||||||||||||||||||||||
| Original LTV: 50.01 - 60 |
8% | 9% | 8% | 8% | 8% | 9% | 9% | 9% | ||||||||||||||||||||||||
| Original LTV: 60.01 - 70 |
19% | 19% | 19% | 19% | 19% | 19% | 19% | 19% | ||||||||||||||||||||||||
| Original LTV: 70.01 - 80 |
57% | 58% | 57% | 57% | 57% | 57% | 57% | 57% | ||||||||||||||||||||||||
| Original LTV: 80.01 - 90 |
7% | 6% | 7% | 7% | 7% | 6% | 6% | 6% | ||||||||||||||||||||||||
| Original LTV: 90.01 - 100 |
3% | 2% | 3% | 3% | 3% | 2% | 2% | 2% | ||||||||||||||||||||||||
| Wtd Avg Original FICO |
690 | 692 | 691 | 692 | 693 | 713 | 713 | 714 | ||||||||||||||||||||||||
| Original FICO: <= 680 |
27% | 25% | 28% | 28% | 28% | 25% | 25% | 25% | ||||||||||||||||||||||||
| Original FICO: 681 - 700 |
14% | 14% | 13% | 13% | 13% | 14% | 14% | 14% | ||||||||||||||||||||||||
| Original FICO: 701 - 720 |
15% | 16% | 14% | 14% | 15% | 15% | 15% | 15% | ||||||||||||||||||||||||
| Original FICO: 721 - 740 |
12% | 13% | 12% | 12% | 12% | 12% | 12% | 12% | ||||||||||||||||||||||||
| Original FICO: 741 - 760 |
12% | 12% | 12% | 12% | 11% | 12% | 12% | 12% | ||||||||||||||||||||||||
| Original FICO: 761 - 780 |
9% | 10% | 10% | 10% | 10% | 10% | 10% | 10% | ||||||||||||||||||||||||
| Original FICO: 781 - 800 |
6% | 7% | 7% | 7% | 7% | 7% | 7% | 7% | ||||||||||||||||||||||||
| Original FICO: >= 801 |
2% | 2% | 2% | 2% | 2% | 2% | 2% | 2% | ||||||||||||||||||||||||
| Original Unknown |
3% | 1% | 2% | 2% | 2% | 3% | 3% | 3% | ||||||||||||||||||||||||
| Conforming balance % (2) |
86% | 88% | 85% | 84% | 84% | 86% | 86% | 86% | ||||||||||||||||||||||||
| > $1 MM % |
3% | 2% | 3% | 3% | 3% | 2% | 2% | 3% | ||||||||||||||||||||||||
| 2nd Home % |
3% | 3% | 3% | 3% | 3% | 4% | 4% | 4% | ||||||||||||||||||||||||
| Investment Property % |
16% | 16% | 15% | 15% | 14% | 15% | 15% | 15% | ||||||||||||||||||||||||
| Purchase |
39% | 41% | 39% | 39% | 40% | 41% | 42% | 41% | ||||||||||||||||||||||||
| Cash Out Refinance |
45% | 43% | 45% | 45% | 44% | 43% | 42% | 42% | ||||||||||||||||||||||||
| Rate-Term Refinance |
15% | 15% | 15% | 15% | 15% | 15% | 15% | 16% | ||||||||||||||||||||||||
| Other |
1% | 1% | 1% | 1% | 1% | 1% | 1% | 1% | ||||||||||||||||||||||||
| Full Documentation |
38% | 39% | 37% | 37% | 36% | 39% | 39% | 38% | ||||||||||||||||||||||||
| No Documentation |
6% | 7% | 5% | 5% | 5% | 6% | 6% | 6% | ||||||||||||||||||||||||
| Other Doc (Lim, Red, Stated, etc) |
55% | 53% | 57% | 57% | 57% | 53% | 53% | 54% | ||||||||||||||||||||||||
| Unknown/Not Categorized |
1% | 1% | 1% | 1% | 2% | 2% | 2% | 2% | ||||||||||||||||||||||||
| Single Family |
83% | 83% | 83% | 84% | 84% | 84% | 84% | 84% | ||||||||||||||||||||||||
| 2-4 Family |
9% | 9% | 9% | 8% | 8% | 8% | 8% | 8% | ||||||||||||||||||||||||
|
Condominium
|
8% | 8% | 8% | 8% | 8% | 8% | 8% | 8% | ||||||||||||||||||||||||
(1) Only the loan groups providing direct cash flow to securities we own are included.
(2) The definition of a conforming loan has significantly changed over time. For Q3 2011 and subsequent periods, the conforming balance definition that went into effect on October 1, 2011 was used (which had a maximum loan balance of $625,500). For all periods prior to Q3 2011, the conforming balance definition available in June 2011 was used (which had a maximum loan balance of $729,750).
| THE REDWOOD REVIEW 4TH QUARTER 2013
|
Table 8B: Residential Non-Prime Securities at Redwood and Underlying Loan Characteristics | |||
|
|
Table 9: Residential Loan Characteristics(1) ($ in thousands) | |||
| 2013 Q4 |
2013 Q3 |
2013 Q2 |
2013 Q1 |
2012 Q4 |
2012 Q3 |
2012 Q2 |
2012 Q1 |
|||||||||||||||||||||||||
| Residential loans principal balance |
$ | 2,171,676 | $ | 2,597,822 | $ | 3,266,104 | $ | 2,959,037 | $ | 2,820,884 | $ | 3,502,775 | $ | 3,493,755 | $ | 3,682,379 | ||||||||||||||||
| Number of loans |
6,753 | 7,446 | 8,540 | 8,253 | 8,223 | 10,697 | 10,773 | 11,079 | ||||||||||||||||||||||||
| Average loan balance |
$ | 322 | $ | 349 | $ | 382 | $ | 359 | $ | 343 | $ | 327 | $ | 324 | $ | 332 | ||||||||||||||||
| Adjustable % |
72% | 63% | 53% | 62% | 66% | 73% | 75% | 73% | ||||||||||||||||||||||||
| Hybrid % |
7% | 10% | 4% | 3% | 5% | 6% | 8% | 9% | ||||||||||||||||||||||||
| Fixed % |
21% | 27% | 43% | 35% | 29% | 21% | 18% | 18% | ||||||||||||||||||||||||
| Amortizing % |
27% | 36% | 46% | 38% | 32% | 23% | 20% | 21% | ||||||||||||||||||||||||
| Interest-only % |
73% | 64% | 54% | 62% | 68% | 77% | 80% | 79% | ||||||||||||||||||||||||
| Geographic concentration |
||||||||||||||||||||||||||||||||
| Northern California |
12% | 13% | 13% | 14% | 14% | 15% | 15% | 16% | ||||||||||||||||||||||||
| Southern California |
12% | 11% | 15% | 14% | 12% | 11% | 11% | 12% | ||||||||||||||||||||||||
| Florida |
11% | 10% | 9% | 9% | 10% | 11% | 12% | 11% | ||||||||||||||||||||||||
| New York |
8% | 8% | 7% | 7% | 8% | 7% | 7% | 7% | ||||||||||||||||||||||||
| Texas |
5% | 6% | 6% | 5% | 5% | 6% | 5% | 5% | ||||||||||||||||||||||||
| Georgia |
4% | 4% | 4% | 4% | 4% | 5% | 4% | 4% | ||||||||||||||||||||||||
| New Jersey |
3% | 3% | 3% | 3% | 3% | 4% | 4% | 4% | ||||||||||||||||||||||||
| Colorado |
4% | 4% | 3% | 3% | 4% | 4% | 3% | 3% | ||||||||||||||||||||||||
| Virginia |
3% | 4% | 4% | 3% | 3% | 3% | 3% | 3% | ||||||||||||||||||||||||
| Arizona |
2% | 2% | 2% | 2% | 2% | 2% | 2% | 2% | ||||||||||||||||||||||||
| Illinois |
3% | 3% | 3% | 3% | 3% | 2% | 2% | 2% | ||||||||||||||||||||||||
| Other states |
33% | 32% | 31% | 33% | 33% | 30% | 30% | 31% | ||||||||||||||||||||||||
| Vintage |
||||||||||||||||||||||||||||||||
| Year 2013 origination |
18% | 28% | 38% | 27% | 0% | 0% | 0% | 0% | ||||||||||||||||||||||||
| Year 2012 origination |
1% | 0% | 1% | 1% | 19% | 11% | 6% | 4% | ||||||||||||||||||||||||
| Year 2011 origination |
3% | 3% | 2% | 3% | 4% | 4% | 5% | 9% | ||||||||||||||||||||||||
| Year 2010 origination |
4% | 4% | 4% | 5% | 7% | 7% | 8% | 8% | ||||||||||||||||||||||||
| Year 2009 origination |
1% | 1% | 1% | 2% | 2% | 2% | 3% | 3% | ||||||||||||||||||||||||
| Year 2008 origination |
0% | 0% | 0% | 0% | 0% | 0% | 0% | 0% | ||||||||||||||||||||||||
| Year 2007 origination |
0% | 0% | 0% | 0% | <1% | 2% | 2% | 2% | ||||||||||||||||||||||||
| Year 2006 origination |
7% | 6% | 5% | 5% | 6% | 5% | 5% | 5% | ||||||||||||||||||||||||
| Year 2005 origination |
3% | 3% | 2% | 2% | 3% | 4% | 4% | 3% | ||||||||||||||||||||||||
| Year 2004 origination or earlier |
63% | 55% | 47% | 55% | 59% | 65% | 68% | 66% | ||||||||||||||||||||||||
| Wtd Avg Original LTV |
67% | 66% | 66% | 65% | 65% | 66% | 66% | 66% | ||||||||||||||||||||||||
| Original LTV: 0 - 50 |
18% | 19% | 18% | 19% | 20% | 18% | 19% | 19% | ||||||||||||||||||||||||
| Original LTV: 50.01 - 60 |
12% | 13% | 13% | 15% | 14% | 12% | 13% | 13% | ||||||||||||||||||||||||
| Original LTV: 60.01 - 70 |
21% | 22% | 22% | 23% | 22% | 22% | 22% | 22% | ||||||||||||||||||||||||
| Original LTV: 70.01 - 80 |
43% | 41% | 43% | 38% | 38% | 42% | 41% | 41% | ||||||||||||||||||||||||
| Original LTV: 80.01 - 90 |
2% | 2% | 1% | 2% | 2% | 2% | 2% | 2% | ||||||||||||||||||||||||
| Original LTV: 90.01 - 100 |
4% | 3% | 3% | 3% | 4% | 4% | 4% | 4% | ||||||||||||||||||||||||
| Wtd Avg FICO |
739 | 743 | 749 | 746 | 744 | 740 | 739 | 740 | ||||||||||||||||||||||||
| FICO: <= 680 |
12% | 10% | 9% | 10% | 11% | 12% | 11% | 12% | ||||||||||||||||||||||||
| FICO: 681 - 700 |
9% | 7% | 6% | 7% | 8% | 9% | 10% | 9% | ||||||||||||||||||||||||
| FICO: 701 - 720 |
12% | 11% | 9% | 10% | 10% | 12% | 12% | 12% | ||||||||||||||||||||||||
| FICO: 721 - 740 |
12% | 13% | 12% | 12% | 12% | 12% | 13% | 12% | ||||||||||||||||||||||||
| FICO: 741 - 760 |
14% | 14% | 14% | 14% | 14% | 14% | 14% | 14% | ||||||||||||||||||||||||
| FICO: 761 - 780 |
20% | 20% | 22% | 21% | 19% | 18% | 18% | 18% | ||||||||||||||||||||||||
| FICO: 781 - 800 |
16% | 19% | 21% | 20% | 20% | 18% | 17% | 17% | ||||||||||||||||||||||||
| FICO: >= 801 |
5% | 6% | 7% | 6% | 6% | 5% | 5% | 6% | ||||||||||||||||||||||||
| Conforming balance % (2) |
54% | 42% | 31% | 35% | 37% | 42% | 43% | 42% | ||||||||||||||||||||||||
| % balance in loans > $1mm per loan |
19% | 20% | 18% | 19% | 20% | 19% | 20% | 22% | ||||||||||||||||||||||||
| 2nd home % |
11% | 11% | 9% | 9% | 10% | 10% | 11% | 10% | ||||||||||||||||||||||||
| Investment property % |
3% | 3% | 2% | 3% | 3% | 3% | 3% | 3% | ||||||||||||||||||||||||
| Purchase |
36% | 36% | 36% | 28% | 30% | 34% | 33% | 33% | ||||||||||||||||||||||||
| Cash out refinance |
27% | 26% | 22% | 25% | 26% | 28% | 28% | 28% | ||||||||||||||||||||||||
| Rate-term refinance |
35% | 37% | 41% | 45% | 42% | 37% | 37% | 38% | ||||||||||||||||||||||||
| Other
|
2% | 1% | 1% | 2% | 2% | 1% | 1% | 1% | ||||||||||||||||||||||||
(1) This table presents characteristics of residential loans held by consolidated Sequoia entities and residential loans held by Redwood and intended to be securitized by future Sequoia entities or sold to third parties.
(2) The definition of a conforming loan has significantly changed over time. For Q3 2011 and subsequent periods, the conforming balance definition that went into effect on October 1, 2011 was used (which had a maximum loan balance of $625,500). For all periods prior to Q3 2011, the conforming balance definition available in June 2011 was used (which had a maximum loan balance of $729,750).
| THE REDWOOD REVIEW 4TH QUARTER 2013
|
Table 9: Residential Real Estate Loan Characteristics |
57
| ||
|
|
Table 10: Commercial Loan Characteristics(1) ($ in thousands) | 58
| ||
| 2013 Q4 |
2013 Q3 |
2013 Q2 |
2013 Q1 |
2012 Q4 |
2012 Q3 |
2012 Q2 |
2012 Q1 |
|||||||||||||||||||||||||
| Commercial loans principal balance |
$ | 353,331 | $ | 361,759 | $ | 353,898 | $ | 335,448 | $ | 312,400 | $ | 291,595 | $ | 251,686 | $ | 182,803 | ||||||||||||||||
| Number of loans |
50 | 50 | 48 | 42 | 35 | 31 | 27 | 19 | ||||||||||||||||||||||||
| Average loan balance |
$ | 7,067 | $ | 7,235 | $ | 7,373 | $ | 7,987 | $ | 8,926 | $ | 9,406 | $ | 9,322 | $ | 9,621 | ||||||||||||||||
| Fixed % |
86% | 86% | 86% | 85% | 87% | 87% | 94% | 92% | ||||||||||||||||||||||||
| Hybrid % |
14% | 14% | 14% | 15% | 13% | 13% | 6% | 8% | ||||||||||||||||||||||||
| Amortizing % |
22% | 21% | 21% | 17% | 12% | 10% | 16% | 16% | ||||||||||||||||||||||||
| Interest-only % |
78% | 79% | 79% | 83% | 88% | 90% | 84% | 84% | ||||||||||||||||||||||||
| Geographic concentration |
||||||||||||||||||||||||||||||||
| California |
21% | 21% | 28% | 29% | 20% | 22% | 18% | 20% | ||||||||||||||||||||||||
| New York |
19% | 19% | 21% | 20% | 22% | 24% | 25% | 17% | ||||||||||||||||||||||||
| Florida |
10% | 12% | 9% | 9% | 10% | 11% | 12% | 13% | ||||||||||||||||||||||||
| South Carolina |
<1% | 1% | 8% | 8% | 6% | 1% | 1% | 0% | ||||||||||||||||||||||||
| Arizona |
0% | 1% | 6% | 6% | 11% | 0% | 0% | 0% | ||||||||||||||||||||||||
| Michigan |
8% | 7% | 4% | 4% | 5% | 6% | 7% | 7% | ||||||||||||||||||||||||
| Georgia |
<1% | 1% | 3% | 3% | 3% | <1% | <1% | 0% | ||||||||||||||||||||||||
| Illinois |
6% | 6% | 3% | 3% | 4% | 11% | 13% | 18% | ||||||||||||||||||||||||
| Texas |
7% | 6% | 2% | 2% | 0% | 5% | 6% | 5% | ||||||||||||||||||||||||
| Tennessee |
4% | 4% | <1% | 0% | <1% | 4% | 4% | 0% | ||||||||||||||||||||||||
| Washington |
3% | 3% | 2% | 1% | <1% | 3% | 0% | 0% | ||||||||||||||||||||||||
| North Carolina |
3% | 3% | <1% | 0% | 0% | 4% | 4% | 0% | ||||||||||||||||||||||||
| Alabama |
2% | 2% | <1% | 0% | 0% | 3% | 4% | 0% | ||||||||||||||||||||||||
| Delaware |
3% | 3% | 3% | 3% | 3% | 3% | 4% | 0% | ||||||||||||||||||||||||
| New Jersey |
3% | 1% | 0% | 0% | 2% | 2% | 2% | 0% | ||||||||||||||||||||||||
| Other states |
10% | 10% | 8% | 12% | 13% | 1% | 0% | 20% | ||||||||||||||||||||||||
| Vintage |
||||||||||||||||||||||||||||||||
| Year 2013 origination |
19% | 17% | 15% | 11% | 0% | 0% | 0% | 0% | ||||||||||||||||||||||||
| Year 2012 origination |
44% | 44% | 46% | 48% | 51% | 48% | 38% | 15% | ||||||||||||||||||||||||
| Year 2011 origination |
34% | 34% | 34% | 35% | 39% | 42% | 50% | 68% | ||||||||||||||||||||||||
| Year 2010 origination |
4% | 5% | 5% | 6% | 10% | 10% | 12% | 17% | ||||||||||||||||||||||||
| Year 2004 origination |
0% | 0% | 0% | 0% | <1% | <1% | <1% | <1% | ||||||||||||||||||||||||
| Office |
21% | 22% | 22% | 24% | 29% | 30% | 32% | 32% | ||||||||||||||||||||||||
| Multi-family |
36% | 33% | 33% | 32% | 29% | 28% | 22% | 23% | ||||||||||||||||||||||||
| Hospitality |
24% | 23% | 24% | 23% | 21% | 20% | 21% | 18% | ||||||||||||||||||||||||
| Retail |
15% | 14% | 14% | 15% | 15% | 16% | 18% | 25% | ||||||||||||||||||||||||
| Self-storage |
5% | 7% | 7% | 5% | 6% | 6% | 7% | 2% | ||||||||||||||||||||||||
|
Industrial
|
1% | 1% | <1% | <1% | 0% | 0% | 0% | 0% | ||||||||||||||||||||||||
(1) This table presents characteristics of commercial loans held-for-investment by Redwood.
| THE REDWOOD REVIEW 4TH QUARTER 2013
|
Table 10: Commercial Loan Characteristics | |||
REDWOOD TRUST CORPORATE INFORMATION
For more information about Redwood Trust, please visit our website at: www.redwoodtrust.com
59